Embed Size (px)
Citation preview
HAL Id: hal-02155077https://hal.archives-ouvertes.fr/hal-02155077
Preprint submitted on 13 Jun 2019
HAL is a multi-disciplinary open accessarchive for the deposit and dissemination of sci-entific research documents, whether they are pub-lished or not. The documents may come fromteaching and research institutions in France orabroad, or from public or private research centers.
L’archive ouverte pluridisciplinaire HAL, estdestinée au dépôt et à la diffusion de documentsscientifiques de niveau recherche, publiés ou non,émanant des établissements d’enseignement et derecherche français ou étrangers, des laboratoirespublics ou privés.
Is fintech good for bank performance? The case ofmobile money in the East African Community
Serge Ky, Clovis Rugemintwari, Alain Sauviat
To cite this version:Serge Ky, Clovis Rugemintwari, Alain Sauviat. Is fintech good for bank performance? The case ofmobile money in the East African Community. 2019. �hal-02155077�
1
Is fintech good for bank performance? The case of mobile money in the East African
Community
Serge Ky a, b, , Clovis Rugemintwari b, and Alain Sauviat b
a Université de Ouahigouya, Laboratoire d’Analyse et de Politique Économiques, Burkina Faso b Université de Limoges, Laboratoire d’Analyse et de Prospective Économiques, France
This version: 5 June 2019.
Abstract
Mobile money, a technology-driven innovation in financial services, has profoundly penetrated the
financial landscape in Sub-Saharan Africa, including banks. Yet, besides anecdotal evidence, little
is known about whether mobile money adoption enhances or worsens bank performance.
Combining hand-collected data with balance sheet data from Bankscope for a panel of 170 financial
institutions over the period 2009-2015, we find a strong positive and significant relationship
between the time elapsed since banks’ adoption of mobile money and their performance
considering an array of proxies of bank profitability, efficiency and stability. In further
investigations, we show how bank specialization and size alter such an association. Our results are
robust to using instrumental variables, controlling for bank and macro level confounding factors,
bank fixed effects and considering alternative measures of bank performance and mobile money
adoption. Furthermore, we show that enhanced income diversification and broadened access to
deposits are possible channels through which banks involved in mobile money improve their
performance. Overall, our findings highlight the bright side of cooperation between banks and
mobile network operators in the provision of mobile money. (JEL Classification G02, G21, G23)
Keywords: Fintech, Mobile money, Innovation, Bank performance, East African Community
An earlier version of the paper was presented at the LAPE Bank Seminars. We are grateful to Ruth Tacneng, Céline
Meslier, Isabelle Distinguin, Laetitia Lepetit and other participants for their constructive comments and suggestions.
The usual disclaimer applies. Corresponding author. Tel: + 33 5 55 14 92 08. E-mail address: [email protected]
2
1. Introduction
In most developing countries, formal financial institutions have been failing large swaths
of society and nowhere is this truer than in Sub-Saharan Africa where only about a third has access
to formal financial services according to the latest estimates from the World Bank (World Bank
Group, 2018). At the same time, however, technology-driven innovation in financial services─
henceforth fintech1─ is increasingly reshaping the African financial and banking landscape as
never before (Sy et al., 2019). There is a large consensus that fintech is benefiting financially
excluded people and underserved consumers around the globe and that this trend may continue
over the next decade in all key financial respects such as savings, credits and investments (Jagtiani
and John, 2018; IMF, 2018).
Although “Africa” and “innovation” are rarely associated, the leading position worldwide
of the African continent in mobile money is starting to challenge this long-held perception. Sub-
Saharan Africa played a pivotal role in mobile money emergence and development as shown in
Van Der Boor et al. (2014). The authors challenge the widely-held view that the “North” is the
unique source of new technology. They offer the first quantitative empirical study of the sources
of innovation in mobile financial services and show that user-innovators in this field come from
less-developed countries with a long-standing unfilled need of inexpensive banking services for
the poor. Over the last decade, mobile money has grown rapidly following the tremendous
penetration of mobile phones; for instance, the number of users has risen from 38% in 2009 to 72%
in 2017 in Sub-Saharan Africa (The World Bank, 2019). This unprecedented usage of mobile
phones creates an opportunity for the massive population who own a mobile phone but no bank
account to be connected to the financial system2. Consistent with the very notion that at the core of
fintech is the use of technology to provide new and improved financial services (Thakor, 2019),
mobile money technology allows users to access financial services such as money transfers,
payments, savings, insurance and digital credit. These financial operations are conducted through
1 It is worth noting that throughout the paper, the terminology fintech is used alternatively for financial technology
(mobile money in our case) or its provider when we refer to bank-fintech cooperation. The Financial Stability Board
adopted a rather broad definition due to the rapidity and fluidity of fintech developments by pointing to
“technologically-enabled financial innovation that could result in new business models, applications, processes, or
products with an associated material effect on financial markets and institutions and the provision of financial services”
(FSB, 2017, p.7). 2 Cook and McKay (2017) contend that a large portion of mobile money users in Kenya is made up of those who had
been unbanked. Furthermore, following the launch of M-Pesa, Safaricom’s mobile money service, financial inclusion
increased from 27 percent in 2006 to over 75 percent in 2016.
3
mobile networks where cash-in cash-out services are provided by small business outlets better
known as agents. The mobile money account can therefore be accessed without having an account
at a financial institution but mobile money users who already possess a bank account have the
possibility to connect both accounts.
While there are challenges for financial institutions to compete with fintech firms, there are
also opportunities for collaborations. Indeed, banks are increasingly forging partnerships with
Mobile Network Operators (MNO hereafter) and taking part into this disruptive innovation of
mobile money. Advancements in new technologies allow financial institutions to serve businesses
and consumers without costly brick and mortar investments. A recent but growing literature is
starting to look at cooperation between banks and fintech firms and its potential effect on credit
access (Drasch et al., 2018; Jagtiani and Lemieux, 2018). However, it is worth noting that
measuring innovation in the financial sector is more challenging because of the lack of data which
hampers assessing its impacts (Beck et al., 2016). Moreover, to the best of our knowledge, the
existent works explore the case of developed countries and are most of the time U.S.-centric, owing
to the fact that financial innovations often originate in the U.S., and that studies of such innovations
usually rely on U.S. data (Frame et al., 2018; Frame and White, 2004).
Our paper aims to bridge this gap. It investigates how banks’ involvement in mobile money
innovation affects their performance in the five partner states (Burundi, Kenya, Rwanda, Tanzania
and Uganda) of the East African Community (EAC). Two main reasons guide us to choose this
region as our case study. First, although Sub-Saharan Africa taken as a whole continues to position
itself as the global epicentre of mobile money, there is a wide degree of cross-country difference
and the EAC is clearly at the forefront of mobile money innovation, adoption and usage as shown
in Figure A1 in the Appendix (Minischetti and Scharwatt, 2016). The speed and scale of mobile
money adoption in the EAC3 has been unprecedented and its impacts considerable (Jack and Suri,
2016, 2014; Mas and Ng’weno, 2010a; Mbiti and Weil, 2016). Hence, the dominant position of the
banking sector in the financial system and the widespread adoption of mobile money motivate us
to focus on the EAC in assessing the impact of mobile money adoption on bank performance.
3 The most well-known and successful example of mobile money innovation is M-Pesa launched in 2007 in Kenya.
Lashitew et al. (2019) provide an excellent in-depth background on its emergence, development and diffusion.
4
Second, cross-border interoperability in mobile money is widespread in the region probably driven
by the deep integration4 that facilitates remittances, trade and social exchange (BFA, 2017).
This study extends the existent literature on the risks and opportunities associated with
bank-fintech cooperation and makes several contributions. First, most empirical studies tackling
mobile money adoption focus mainly on its impact on various socio-economic aspects (e.g.:
Bharadwaj et al., 2019; Jack and Suri, 2014; Munyegera and Matsumoto, 2016). To our knowledge,
this paper is the first to conduct analysis of banks’ mobile money adoption by examining how
forging partnerships with MNOs affects bank performance. Specifically, we test whether the
implication of banks in the mobile money scheme affects their profitability, efficiency and stability
using a wide range of proxies traditionally considered in the banking literature. Second, our paper
also adds to the literature investigating the impacts of financial technology on bank performance.
Following Fuentelsaz et al. (2009) and Scott et al. (2017), we compare the performance of adopters
and non-adopters. In addition, we take into account the time elapsed from the moment of adoption.
Furthermore, Scott et al. (2017) point out the lack of evidence on the effects of innovation on
smaller financial institutions. Hence, we test whether bank size and specialization alter the
relationship between bank involvement in mobile money and bank performance. Finally, we
complement the literature that explores the determinants of bank profitability, efficiency and
stability in the East African Community.
The rest of the paper is organized as follows. Section 2 presents the related literature and
our research questions, and in section 3 we provide the methodology, including our model
specification, variables and data. We report and discuss the results in section 4, assess their
robustness in section 5 and discuss the potential mechanisms in section 6. In section 7 we conclude.
2. Related literature and research questions
Bank-fintech cooperation may entail several benefits. For banks, such a partnership may
yield sizable advantages in terms of development of new customer segments, products, and
services. It may also result in expanding into new markets, developing new capabilities, and
accessing new technologies that generate new revenue streams and improve efficiencies. This is
4 In fact, EAC is the most integrated region in Africa according to the Africa Regional Integration Index (Koami et al.,
2016). It has already in place a customs union, a common market and aims at building a political federation with a
single currency.
5
important because banks are often associated with a lack of innovation either because of their stable
market position or because they are subject to complex and heavy government regulations
(Anagnostopoulos, 2018). In return, fintechs may mainly benefit from bank reputation but also
from new sources of finance and infrastructures (Drasch et al., 2018; The Economist Unit
Intelligence, 2015). Digital innovations, such as mobile money, that promote financial inclusion
gives a new impetus to the banking sector to improve its relationship with customers and increase
performance. As such, digitization provides opportunities for banks to enhance their customer-
interactions, improve their decision-making, and implement new business models in a more cost-
effective and innovative way (BCBS, 2018; Hirt and Willmott, 2014). In addition, fintechs are
thought to be quicker and more agile than traditional banks. Hence, they are supposed to enable
banks to engage in further cost-cutting strategies since bank services remain expensive5 (Drasch et
al., 2018; Philippon, 2018). While these benefits are general in nature and apply across the globe,
they are expected to be greater in the less developed part of the world where access to formal
finance is still a challenge (Jagtiani and John, 2018).
As regards to the case of EAC, although mobile network operators are the most active
actors, banks play a crucial role in mobile money provision. Specifically, to launch mobile money
services, mobile network operators have to build partnership with banks or other financial
institutions with a banking license (Aron, 2017; UNCTAD, 2012). In this case, banks play the role
of custodians for mobile money users by holding a “trust” account or “escrow” account deposits
that match the full extent of electronic money in the name of mobile network operators (Aron,
2017; Greenacre and Buckley, 2014). Banks can use these additional funds to increase their lending
and this is not different from the way banks use ordinary deposits. Thus, bank involvement in the
mobile money scheme includes simply holding a trust/escrow account (passive), building
partnership to launch mobile money services (active), or both. To exploit other potential benefits
associated with mobile money, some banks for instance build partnership with MNOs to increase
the number of bank ATM users for cash out functions. These interest and fee-generating activities
constitute new sources of income that may potentially enhance bank profitability. In addition,
several MNOs have recognisable brands that have been developed through extensive marketing
and service provision; therefore, banks can leverage mobile money platforms to reach more people
5 Philippon (2018) estimates that the unit cost of banking intermediation in the US remained at about 2% over more
than a century. Therefore, enhancing cost-efficiency may partly explain the emergence of fintechs.
6
in traditionally underserved areas at much lower cost. Furthermore, MNOs in EAC developed
extensive agent networks to sell airtime and other products while bank presence is often limited to
urban or highly populated areas (UNCTAD, 2012). MNOs’ extensive network may hence enhance
bank efficiency.
In terms of bank stability, the literature purports that financial technology can potentially
strengthen financial stability by fostering financial inclusion, increasing diversification and
transparency6 as well as allowing better risk assessment (Sy et al., 2019). According to Ahamed
and Mallick (2019), financial inclusion improves finacial stability by accessing cheap retail
deposits from a large clientele base, reducing financing constraints of SMEs and mitigating the
post-lending moral hazard. They also find that higher bank branch outreach and a financial system
with higher access to bank accounts per capita are likely to increase bank stability. Nevertheless,
allowing non-financial institutions (MNOs) to provide financial services may increase risk shifting
from telecom sector to the banking system7. In this context, we assume that the effects of bank
involvement in mobile money scheme on their performance may depend on the net outcome of
these potential benefits and drawbacks.
In addition to comparing adopters to non-adopters to investigate the effect of mobile money
adoption on bank profitability, efficiency or stability, we also take into account the time elapsed
since adoption as emphasized by (Fuentelsaz et al., 2009). In fact, the initial adoption of mobile
money may only indicate the point in time after which a bank is experimenting with it, but not the
current moment in which mobile money is growing and its impacts on bank performance start to
materialise. As such, research on financial technology adoption shows that an innovation evolves
dynamically within the firm, following a diffusion process that starts with the adoption of the
technology and requires time to be completed (Fuentelsaz et al., 2003). Thus, some delay in the
achievement of the predicted performance gains should be expected because benefits stemming
from a new technology are rarely fully achieved at the moment of adoption. Therefore, we
hypothesize that longer8 bank-MNO partnership translates to better bank performance.
6 Less face-to-face contact with bank officials reduces corruption and promotes efficient resource allocation. 7 Kirilenko and Lo (2013) sums up such potential vulnerabilities as follows: “whatever can go wrong will go wrong
faster and bigger when computers are involved”. 8 Note that mobile money is a relatively recent innovation of about a decade. Our sample period only covers 7 years;
it runs from 2009 (such that for each country we have at least a financial institution in partnership with an MNO) to
2015.
7
The literature also highlights other factors that equally matter when investigating the
potential impact of financial technology adoption on firm performance, such as features of the
technology, competition and differences in the characteristics of involved firms (Karshenas and
Stoneman, 1993). For the purpose of our study and based on the structure and availability of our
data, we take into consideration bank specialization and bank size (Scott et al., 2017). The failure
of M-Kesho (launched in March 2010) vs. the spectacular success of its successor M-Shwari
(launched in November 2012) is one of many anecdotal evidences that illustrate how decisive the
sizes of the bank and MNOs involved in a partnership might be. In fact, M-Kesho and M-Shwari
are digital credit products similar in every aspect except that Safaricom partnered with the largest
bank in Kenya (Equity bank) to launch the former while for the later, the partner, CBA bank, was
a small largely-unknown bank to the average Kenyan prior the partnership. A frequently cited
reason behind the failure of M-Kesho mobile money service is that Equity bank and Safaricom
perceived each other as main competitors and failed to define the partnership in a way that satisfied
both companies. This phenomenon where a partnership between similarly sized organizations
proved difficult, while a partnership between small and large entities succeeded is not rare and has
propelled some to ask whether cooperation between equals in this area was even desirable (Cook
and McKay, 2017; Flaming et al., 2013).
To sum it up, the foregoing discussion lead to the following research questions that our
paper aims to address:
i. Does Bank-MNO partnership in mobile money provision affect bank profitability,
efficiency and stability? We distinguish partnership as a point in time from the number of
years of partnership since inception.
ii. Do these effects, if any, depend on the size and/or the specialization of the banks?
3. Data, methodology and variables
3.1.Data sources
We collect data on a sample of financial institutions in the EAC for the period 2009 to 2015
from a number of sources. The data on financial institutions’ balance sheets, income statement are
from the Bureau Van Djik (BvD) Bankscope database. We first collect the data of all financial
institutions available in the database irrespective of whether they are listed or not and then we
8
eliminate financial institutions with consolidated financial statement unless the unconsolidated data
have no information. We also remove financial institutions with missing data for all the variables.
Therefore, we obtain an unbalanced panel dataset comprising a final sample of 170 financial
institutions operating in the five countries of the EAC, among which 153 are bank institutions split
as follows: 8 are in Burundi, 66 in Kenya, 9 in Rwanda, 39 in Tanzania and 31 in Uganda. Data
regarding financial institutions’ involvement in mobile money are not readily available. We hence
hand collected them by screening their websites and exploiting the GSMA tracker to identify
financial institutions included in our sample that are involved in mobile money scheme.
Afterwards, we track for each the number of years of its partnership with an MNO in the provision
of mobile money (see Table A.6B in Appendix). Additional data on macroeconomic factors that
may influence the financial institutions’ performance are collected from the Global Financial
development and World Development Indicators database of the World Bank. Finally, we collect
data on the number of registered mobile money users and the value of mobile money transactions
from the Financial Access Survey database of the International Monetary Fund.
3.2.Model specification
To address our research questions, we conduct estimations using the panel data fixed
effects regression approach with two types of specifications. The first specification (equation 1)
estimates the effects of mobile money on bank performance, while the second specification
(equation 2) includes interaction terms to take into account bank size (small versus large).
𝑌𝑖𝑡 = 𝛼1𝑀𝑀𝑖𝑡 + 𝛼2𝑋𝑖𝑡 + 𝜂𝑖 + 𝑇𝑡 + 𝜀𝑖𝑡 (1)
𝑌𝑖𝑡 = 𝛽1𝑀𝑀𝑖𝑡 + 𝛽2𝑆𝑀𝐴𝐿𝐿𝑖𝑡 + 𝛽3𝑀𝑀𝑖𝑡 × 𝑆𝑀𝐴𝐿𝐿𝑖𝑡 + 𝛽4𝑋𝑖𝑡 + 𝜂𝑖 + 𝑇𝑡 + 𝜔𝑖𝑡 (2)
In our equations (1 and 2), 𝑌𝑖𝑡 represents the performance of bank i at year t. 𝑀𝑀𝑖𝑡 is our
independent variable of interest and stands alternatively for the status of bank i's implication in the
mobile money system at time t and the time elapsed since its mobile money adoption. 𝑋𝑖𝑐𝑡 denotes
the vector of control variables including bank-specific and macroeconomic variables. 𝜂𝑖 is our set
of bank fixed effects, and we include time dummies, 𝑇𝑡 , to control for macroeconomic shocks. In
equation (2), 𝑆𝑀𝐴𝐿𝐿𝑖𝑡 is a dummy variable indicating bank size. It is equal to one if the bank is
9
small and zero, otherwise. The coefficient 𝜷𝟏 measures the effect of mobile money adoption for
large banks while (𝜷𝟐 + 𝜷𝟑) represents the total effect of mobile money for small banks.
In the robustness section, we tackle the concern that our main variable of interest, MM, may
possibly be endogenous. The issue of simultaneity bias may arise from the fact that well performing
banks may be more likely to build partnerships with mobile network operators to get involved in
mobile money innovation. However, banks that perform poorly may equally view partnerships with
an MNO as a way to improve their performance. This potential endogeneity issue cannot be
completely dealt with in this case because devising good instruments is a daunting task as
emphasized by Scott et al. (2017). Nevertheless, we check the robustness of our results. We follow
previous literature (Demirgüç-Kunt and Huizinga, 2010; Fuentelsaz et al., 2012, 2009; Liang et al.,
2013) and re-estimate our equations (1) and (2) by using the lagged value of MM, MMi,t-1. In
addition, we also use two country-level indicators of mobile money adoption as alternatives.
3.3.Dependent variables: measures of bank performance
Bank profitability, efficiency and stability are the most commonly considered dimensions
in the empirical banking literature to measure bank performance9 (Ahamed and Mallick, 2019;
Beccalli, 2007; Berger et al., 2010; Meslier et al., 2014; Saghi-Zedek, 2016; Scott et al., 2017). To
evaluate bank profitability, we use two main variables (supplemented with two alternative variables
in the robustness checks, see section 5): the return on assets (ROA) and the return on equity (ROE).
ROA captures how effectively a bank utilizes its assets to generate income and is defined as net
income divided by total assets while ROE, which is equal to net income divided by total equity,
measures how well the bank manages resources invested by its shareholders. As regards to bank
efficiency, we use the ratio COST/INCOME. Two alternative proxies are considered in the
robustness check, namely the ratios of Non-interest expenses to average asset (NIEAA) and Non-
operating items and taxes to average assets (NOITAA). Finally, bank stability is measured by the
z-score that we calculate as follows:
𝑍 − 𝑆𝐶𝑂𝑅𝐸𝑖𝑡 =𝑅𝑂𝐴𝑖𝑡 + 𝐸𝑄𝐴𝑖𝑡𝜎(𝑅𝑂𝐴𝑖𝑡)
9 We focus on accounting-based measures of performance because they are easy to compute, suitable when analyzing
banks operating in developing countries and preferred when evaluating the impact of information systems investments
on the banking sector’s financial performance (Bitar et al., 2018; Fuentelsaz et al., 2012).
10
Where 𝐸𝑄𝐴𝑖𝑡 is equity to assets ratio, and 𝜎(𝑅𝑂𝐴𝑖𝑡) is the standard deviation of return on
assets. This score can be interpreted as the number of standard deviations below the mean by which
return would have to drop before all equity in the bank gets depleted. The higher the ratios are, the
better is bank performance for all our proxies except those related to bank efficiency, where lower
values indicate higher efficiency.
3.4.Explanatory variables: bank involvement in mobile money
The main variable of interest in this study is bank involvement in mobile money, which
may be passive (i.e. simply holds MNO’s deposits in a trust account), active (mobile money
services’ provision in partnership with an MNO), or both. As indicated earlier, the involvement is
assessed both as the bank’s status of involvement at a point in time and as the number of years of
Bank-MNO partnership since inception. For the former, we construct a dummy variable, which is
equal to one if the bank has an existing partnership with a mobile network operator at time t, and
zero, otherwise. For the latter, the time elapsed since a bank-MNO partnership came into existence
is a categorical variable that takes the values from zero to nine whereby zero indicates that the bank
has never been involved in mobile money and nine corresponds to nine years of bank involvement
in mobile money. This measure allows us to capture the potential benefits that banks may
accumulate over time through their partnership with the mobile network operator in launching
mobile money and/or providing mobile money financial services.
11
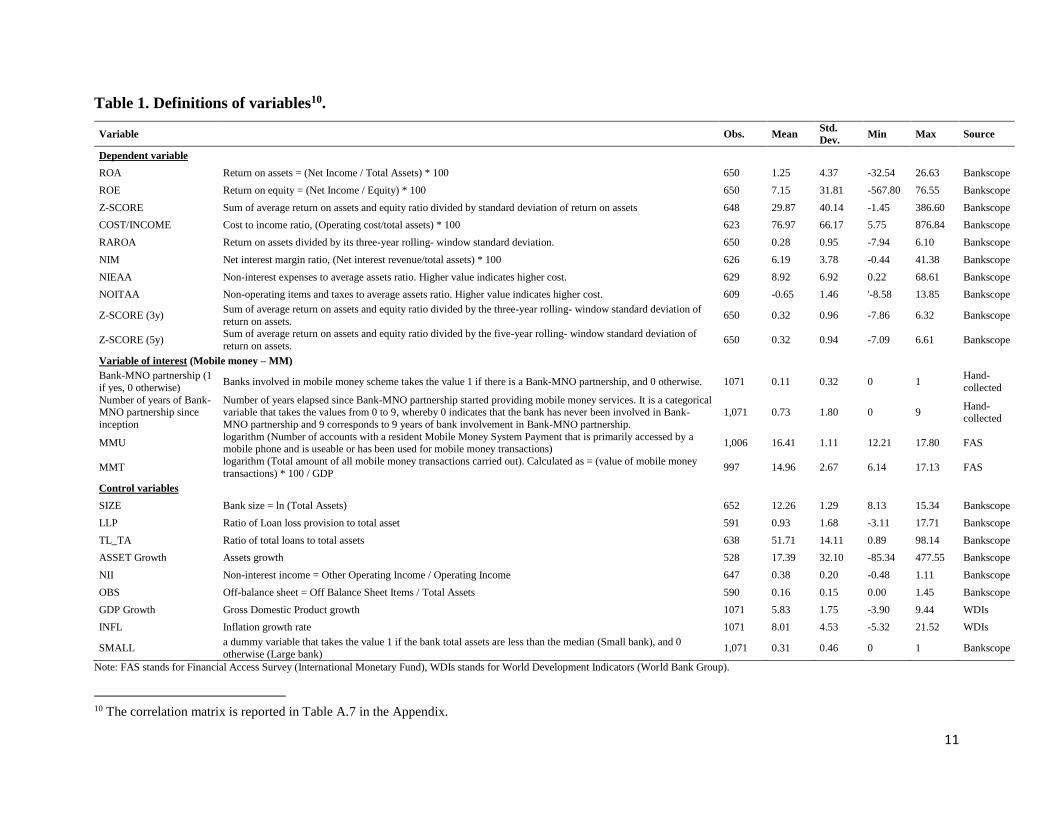
Table 1. Definitions of variables10.
Variable Obs. Mean Std.
Dev. Min Max Source
Dependent variable
ROA Return on assets = (Net Income / Total Assets) * 100 650 1.25 4.37 -32.54 26.63 Bankscope
ROE Return on equity = (Net Income / Equity) * 100 650 7.15 31.81 -567.80 76.55 Bankscope
Z-SCORE Sum of average return on assets and equity ratio divided by standard deviation of return on assets 648 29.87 40.14 -1.45 386.60 Bankscope
COST/INCOME Cost to income ratio, (Operating cost/total assets) * 100 623 76.97 66.17 5.75 876.84 Bankscope
RAROA Return on assets divided by its three-year rolling- window standard deviation. 650 0.28 0.95 -7.94 6.10 Bankscope
NIM Net interest margin ratio, (Net interest revenue/total assets) * 100 626 6.19 3.78 -0.44 41.38 Bankscope
NIEAA Non-interest expenses to average assets ratio. Higher value indicates higher cost. 629 8.92 6.92 0.22 68.61 Bankscope
NOITAA Non-operating items and taxes to average assets ratio. Higher value indicates higher cost. 609 -0.65 1.46 '-8.58 13.85 Bankscope
Z-SCORE (3y) Sum of average return on assets and equity ratio divided by the three-year rolling- window standard deviation of
return on assets. 650 0.32 0.96 -7.86 6.32 Bankscope
Z-SCORE (5y) Sum of average return on assets and equity ratio divided by the five-year rolling- window standard deviation of
return on assets. 650 0.32 0.94 -7.09 6.61 Bankscope
Variable of interest (Mobile money – MM)
Bank-MNO partnership (1
if yes, 0 otherwise) Banks involved in mobile money scheme takes the value 1 if there is a Bank-MNO partnership, and 0 otherwise. 1071 0.11 0.32 0 1
Hand-
collected
Number of years of Bank-MNO partnership since
inception
Number of years elapsed since Bank-MNO partnership started providing mobile money services. It is a categorical variable that takes the values from 0 to 9, whereby 0 indicates that the bank has never been involved in Bank-
MNO partnership and 9 corresponds to 9 years of bank involvement in Bank-MNO partnership.
1,071 0.73 1.80 0 9 Hand-
collected
MMU logarithm (Number of accounts with a resident Mobile Money System Payment that is primarily accessed by a mobile phone and is useable or has been used for mobile money transactions)
1,006 16.41 1.11 12.21 17.80 FAS
MMT logarithm (Total amount of all mobile money transactions carried out). Calculated as = (value of mobile money
transactions) * 100 / GDP 997 14.96 2.67 6.14 17.13 FAS
Control variables
SIZE Bank size = ln (Total Assets) 652 12.26 1.29 8.13 15.34 Bankscope
LLP Ratio of Loan loss provision to total asset 591 0.93 1.68 -3.11 17.71 Bankscope
TL_TA Ratio of total loans to total assets 638 51.71 14.11 0.89 98.14 Bankscope
ASSET Growth Assets growth 528 17.39 32.10 -85.34 477.55 Bankscope
NII Non-interest income = Other Operating Income / Operating Income 647 0.38 0.20 -0.48 1.11 Bankscope
OBS Off-balance sheet = Off Balance Sheet Items / Total Assets 590 0.16 0.15 0.00 1.45 Bankscope
GDP Growth Gross Domestic Product growth 1071 5.83 1.75 -3.90 9.44 WDIs
INFL Inflation growth rate 1071 8.01 4.53 -5.32 21.52 WDIs
SMALL a dummy variable that takes the value 1 if the bank total assets are less than the median (Small bank), and 0
otherwise (Large bank) 1,071 0.31 0.46 0 1 Bankscope
Note: FAS stands for Financial Access Survey (International Monetary Fund), WDIs stands for World Development Indicators (World Bank Group).
10 The correlation matrix is reported in Table A.7 in the Appendix.
12
3.5. Control variables: bank and country level variables
Based on the existing literature (Berger et al., 2010; Köster and Pelster, 2017; Meslier et
al., 2014; Mostak Ahamed, 2017; Shaban and James, 2014), we use a number of banks’
characteristics and macroeconomic factors that may affect bank performance. We use the logarithm
of total assets (SIZE) to control for size-induced performance differences in banks. We use the
ratio of loan loss provision to total asset (LLP) to control for loan quality of individual bank. The
LLP ratio can affect banks’ performance as banks can use loan provisions to smooth their earnings.
We control for a bank’s asset composition by using the ratio of total loans to total assets (TL_TA).
We include annual growth rate of total assets (ASSET Growth) to take into account how business
growth can affect bank performance while the effect of diversification is controlled by using the
share of non-interest income to total operation income (NII). Finally, we take into account the effect
on bank performance that may stem from the off-balance sheet activities (OBS). Macroeconomic
characteristics are controlled for by using gross domestic product growth (GDP Growth) and
inflation rates (INFL).
4. Empirical results
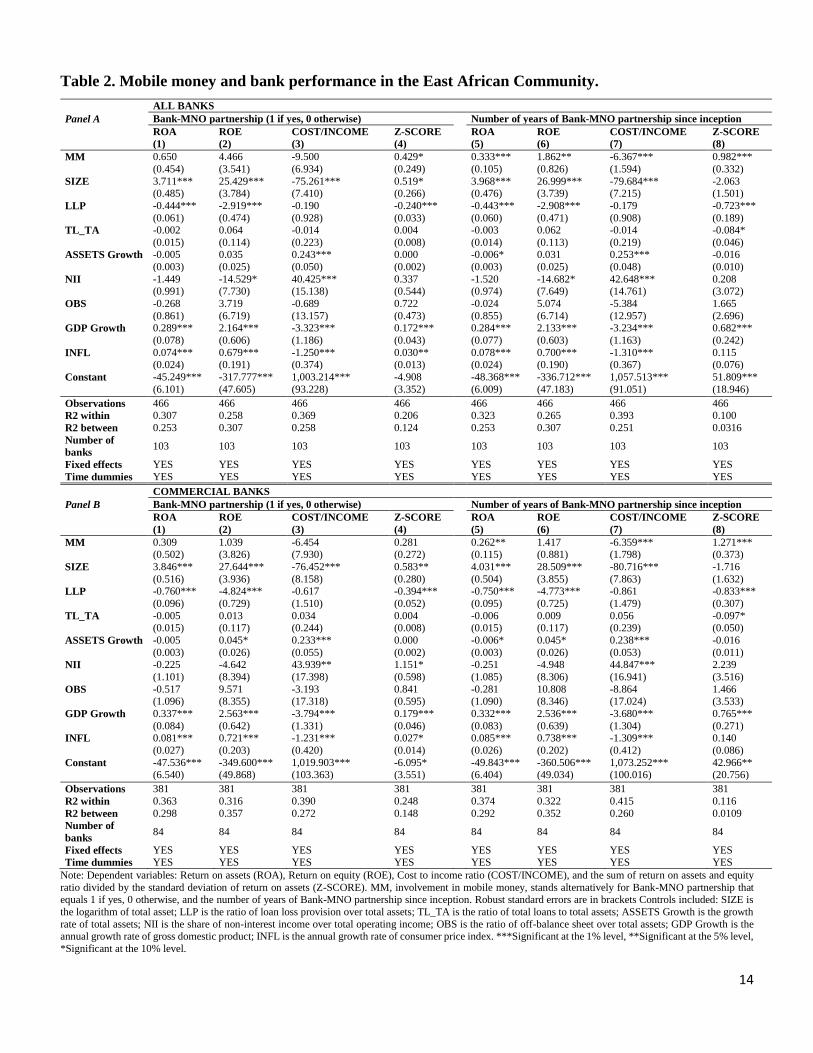
Table 2, Panel A, reports our regression results of the effect of mobile money adoption on
bank performance using our first specification (equation (1)) and considering the whole sample of
banks. The results, which indicate a solid positive link between banks’ involvement in the mobile
money scheme and their performance, provide the first empirical evidence of the bright side of
mobile money adoption at the bank level. However, our findings also reveal that what really matters
is not the involvement per se but rather the time elapsed since the partnership came into existence.
Precisely, we find that the coefficients associated with the variable involvement of banks in mobile
money, MM, are not significant (columns (1) - (3)) or significant at only 10% (column (4) when
proxied by the dummy variable whereas they are strongly significant in the case of the categorical
variable (columns (5) - (8)). These findings are consistent with those of Fuentelsaz et al. (2003)
which show that there is a delay before the achievement of the expected performance gains
stemming from the adoption of automated teller machines (ATM) in the case of Spanish savings
banks. Similarly, they are in line with those of Scott et al. (2017) who emphasize that the effects
of SWIFT adoption on bank profitability are much stronger in the long-run. Our results also echo
empirical findings in the banking literature highlighting the positive effects of financial inclusion
13
and/or bank diversification on performance (Ahamed and Mallick, 2019; Han and Melecky, 2014).
In our case, the involvement in mobile money scheme may enable banks to cater to new segments
of customers and thus diversify further their income streams by engaging in activities less
correlated with their core ones. In a similar vein, banks’ partnership with mobile network operators
may plausibly result in new cost-effective and innovative ways such as allowing customers to
perform their banking transactions without visiting banks’ agencies.
14
Table 2. Mobile money and bank performance in the East African Community.
Panel A
ALL BANKS
Bank-MNO partnership (1 if yes, 0 otherwise) Number of years of Bank-MNO partnership since inception
ROA ROE COST/INCOME Z-SCORE ROA ROE COST/INCOME Z-SCORE
(1) (2) (3) (4) (5) (6) (7) (8)
MM 0.650 4.466 -9.500 0.429* 0.333*** 1.862** -6.367*** 0.982*** (0.454) (3.541) (6.934) (0.249) (0.105) (0.826) (1.594) (0.332)
SIZE 3.711*** 25.429*** -75.261*** 0.519* 3.968*** 26.999*** -79.684*** -2.063 (0.485) (3.784) (7.410) (0.266) (0.476) (3.739) (7.215) (1.501)
LLP -0.444*** -2.919*** -0.190 -0.240*** -0.443*** -2.908*** -0.179 -0.723*** (0.061) (0.474) (0.928) (0.033) (0.060) (0.471) (0.908) (0.189)
TL_TA -0.002 0.064 -0.014 0.004 -0.003 0.062 -0.014 -0.084* (0.015) (0.114) (0.223) (0.008) (0.014) (0.113) (0.219) (0.046)
ASSETS Growth -0.005 0.035 0.243*** 0.000 -0.006* 0.031 0.253*** -0.016 (0.003) (0.025) (0.050) (0.002) (0.003) (0.025) (0.048) (0.010)
NII -1.449 -14.529* 40.425*** 0.337 -1.520 -14.682* 42.648*** 0.208 (0.991) (7.730) (15.138) (0.544) (0.974) (7.649) (14.761) (3.072)
OBS -0.268 3.719 -0.689 0.722 -0.024 5.074 -5.384 1.665 (0.861) (6.719) (13.157) (0.473) (0.855) (6.714) (12.957) (2.696)
GDP Growth 0.289*** 2.164*** -3.323*** 0.172*** 0.284*** 2.133*** -3.234*** 0.682*** (0.078) (0.606) (1.186) (0.043) (0.077) (0.603) (1.163) (0.242)
INFL 0.074*** 0.679*** -1.250*** 0.030** 0.078*** 0.700*** -1.310*** 0.115 (0.024) (0.191) (0.374) (0.013) (0.024) (0.190) (0.367) (0.076)
Constant -45.249*** -317.777*** 1,003.214*** -4.908 -48.368*** -336.712*** 1,057.513*** 51.809*** (6.101) (47.605) (93.228) (3.352) (6.009) (47.183) (91.051) (18.946)
Observations 466 466 466 466 466 466 466 466
R2 within 0.307 0.258 0.369 0.206 0.323 0.265 0.393 0.100
R2 between 0.253 0.307 0.258 0.124 0.253 0.307 0.251 0.0316
Number of
banks 103 103 103 103 103 103 103 103
Fixed effects YES YES YES YES YES YES YES YES
Time dummies YES YES YES YES YES YES YES YES
Panel B
COMMERCIAL BANKS
Bank-MNO partnership (1 if yes, 0 otherwise) Number of years of Bank-MNO partnership since inception
ROA ROE COST/INCOME Z-SCORE ROA ROE COST/INCOME Z-SCORE
(1) (2) (3) (4) (5) (6) (7) (8)
MM 0.309 1.039 -6.454 0.281 0.262** 1.417 -6.359*** 1.271*** (0.502) (3.826) (7.930) (0.272) (0.115) (0.881) (1.798) (0.373)
SIZE 3.846*** 27.644*** -76.452*** 0.583** 4.031*** 28.509*** -80.716*** -1.716 (0.516) (3.936) (8.158) (0.280) (0.504) (3.855) (7.863) (1.632)
LLP -0.760*** -4.824*** -0.617 -0.394*** -0.750*** -4.773*** -0.861 -0.833*** (0.096) (0.729) (1.510) (0.052) (0.095) (0.725) (1.479) (0.307)
TL_TA -0.005 0.013 0.034 0.004 -0.006 0.009 0.056 -0.097* (0.015) (0.117) (0.244) (0.008) (0.015) (0.117) (0.239) (0.050)
ASSETS Growth -0.005 0.045* 0.233*** 0.000 -0.006* 0.045* 0.238*** -0.016 (0.003) (0.026) (0.055) (0.002) (0.003) (0.026) (0.053) (0.011)
NII -0.225 -4.642 43.939** 1.151* -0.251 -4.948 44.847*** 2.239 (1.101) (8.394) (17.398) (0.598) (1.085) (8.306) (16.941) (3.516)
OBS -0.517 9.571 -3.193 0.841 -0.281 10.808 -8.864 1.466 (1.096) (8.355) (17.318) (0.595) (1.090) (8.346) (17.024) (3.533)
GDP Growth 0.337*** 2.563*** -3.794*** 0.179*** 0.332*** 2.536*** -3.680*** 0.765*** (0.084) (0.642) (1.331) (0.046) (0.083) (0.639) (1.304) (0.271)
INFL 0.081*** 0.721*** -1.231*** 0.027* 0.085*** 0.738*** -1.309*** 0.140 (0.027) (0.203) (0.420) (0.014) (0.026) (0.202) (0.412) (0.086)
Constant -47.536*** -349.600*** 1,019.903*** -6.095* -49.843*** -360.506*** 1,073.252*** 42.966** (6.540) (49.868) (103.363) (3.551) (6.404) (49.034) (100.016) (20.756)
Observations 381 381 381 381 381 381 381 381
R2 within 0.363 0.316 0.390 0.248 0.374 0.322 0.415 0.116
R2 between 0.298 0.357 0.272 0.148 0.292 0.352 0.260 0.0109
Number of
banks 84 84 84 84 84 84 84 84
Fixed effects YES YES YES YES YES YES YES YES
Time dummies YES YES YES YES YES YES YES YES
Note: Dependent variables: Return on assets (ROA), Return on equity (ROE), Cost to income ratio (COST/INCOME), and the sum of return on assets and equity
ratio divided by the standard deviation of return on assets (Z-SCORE). MM, involvement in mobile money, stands alternatively for Bank-MNO partnership that equals 1 if yes, 0 otherwise, and the number of years of Bank-MNO partnership since inception. Robust standard errors are in brackets Controls included: SIZE is
the logarithm of total asset; LLP is the ratio of loan loss provision over total assets; TL_TA is the ratio of total loans to total assets; ASSETS Growth is the growth
rate of total assets; NII is the share of non-interest income over total operating income; OBS is the ratio of off-balance sheet over total assets; GDP Growth is the annual growth rate of gross domestic product; INFL is the annual growth rate of consumer price index. ***Significant at the 1% level, **Significant at the 5% level,
*Significant at the 10% level.
15
As regards our control variables, the results are consistent with existing literature. The
bank-level control variables SIZE and LLP indicate that an increase in bank size leads to an
improvement in profitability, efficiency and stability while loan loss provision is negatively linked
to bank performance. Turning to our country-level controls, both are highly significant and, as
might be expected, a higher GDP growth rate is associated with a better bank performance. We
also find that the inflation rate and bank performance are positively related.
To take bank specialization into consideration, we restrict our sample to commercial banks
to check whether and how our earlier findings might be altered. This is important because the
banking sector in EAC is dominated by commercial banks that play a critical role in the
transmission mechanism of the monetary policy. Panel B of Table 2 discloses the results. Overall,
the estimates show similar results but the positive association between bank involvement in mobile
money scheme and bank profitability is less pronounced in this case. More precisely, we notice a
drop in significance in column 5 when bank profitability is proxied by ROA and a loss of
significance in column 6 when the ROE is considered. A plausible explanation for these results on
commercial banks is provided by (Fuentelsaz et al., 2009). They argue that a new technology may
have a stronger impact on firms’ efficiency compared to profitability because as the technology is
diffused to other firms, the adoption of the technology may simply lead to an increased competition
resulting in negligible variations in profitability.
Finally, we check whether bank size (SMALL) affects the positive relationship uncovered
between mobile money adoption and bank performance. Therefore, we split our sample into small
and large banks based on the median of total assets of the banking sector per country. The
computation of this median is constrained by the availability of data for each bank in each country.
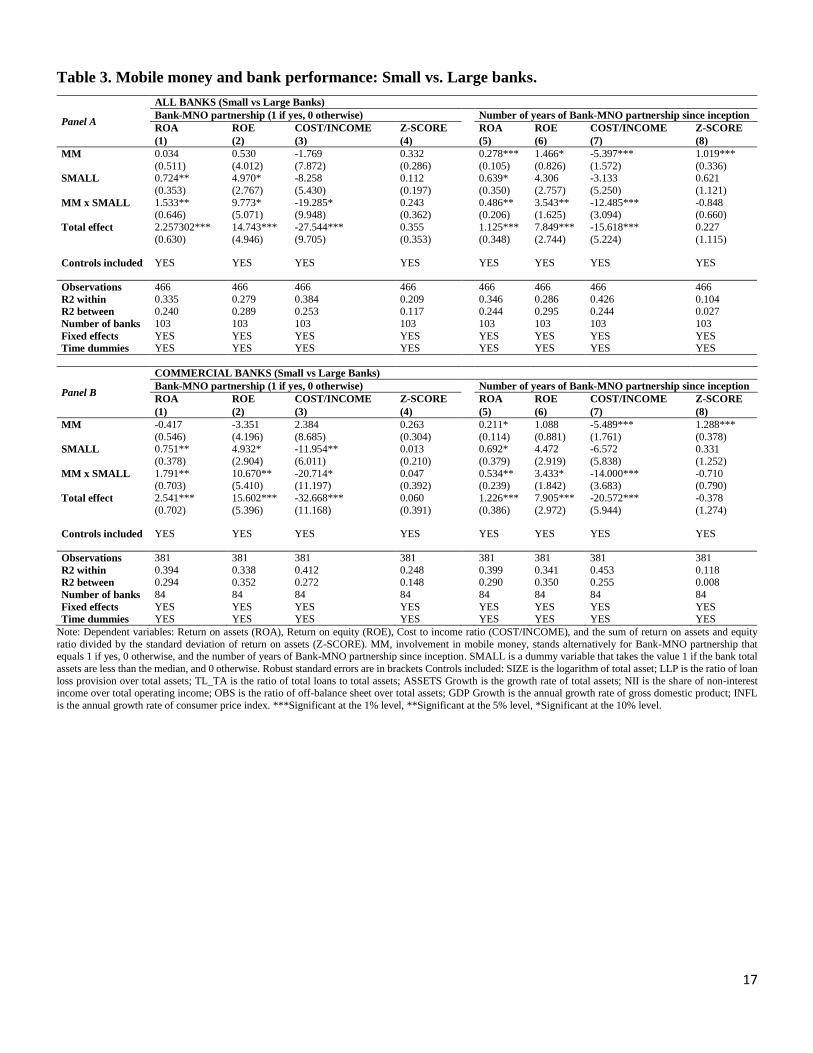
Two main conclusions emerge from the results reported in Panels A and B of Table 3. Considering
large banks, we find that the results perfectly mimic those shown in Table 2: the longer the
partnership is with an MNO, the better bank performance is. Regarding small banks, the results
show that being involved in mobile money is strongly associated with both their profitability and
efficiency irrespective of their degree of involvement in a partnership with an MNO. Precisely, the
coefficients of both the dummy variable (columns (1)-(3) and the categorical variable (columns
(5)-(7)) are significant at 1% level. These results are consistent with those of Dos Santos and Peffers
(1995) and Scott et al. (2017) which show that the effect of technological innovation on profitability
is higher on small firms than on larger firms because the former can adapt faster to it compared to
16
larger ones that may be sluggish to respond due to their stable market position and legacy systems
which require substantial changes. We do not find, however, any significant link between bank
stability (Z-score) and mobile money adoption for small banks. These results may suggest that
compared to large banks, the relative risks from financial technology adoption can be considerably
higher for smaller banks due to their limited resources and lack of knowledge about technology
management (Scott et al., 2017).
17
Table 3. Mobile money and bank performance: Small vs. Large banks.
Panel A
ALL BANKS (Small vs Large Banks)
Bank-MNO partnership (1 if yes, 0 otherwise) Number of years of Bank-MNO partnership since inception
ROA ROE COST/INCOME Z-SCORE ROA ROE COST/INCOME Z-SCORE
(1) (2) (3) (4) (5) (6) (7) (8)
MM 0.034 0.530 -1.769 0.332 0.278*** 1.466* -5.397*** 1.019*** (0.511) (4.012) (7.872) (0.286) (0.105) (0.826) (1.572) (0.336)
SMALL 0.724** 4.970* -8.258 0.112 0.639* 4.306 -3.133 0.621 (0.353) (2.767) (5.430) (0.197) (0.350) (2.757) (5.250) (1.121)
MM x SMALL 1.533** 9.773* -19.285* 0.243 0.486** 3.543** -12.485*** -0.848 (0.646) (5.071) (9.948) (0.362) (0.206) (1.625) (3.094) (0.660)
Total effect 2.257302*** 14.743*** -27.544*** 0.355 1.125*** 7.849*** -15.618*** 0.227 (0.630) (4.946) (9.705) (0.353) (0.348) (2.744) (5.224) (1.115)
Controls included YES YES YES YES YES YES YES YES
Observations 466 466 466 466 466 466 466 466
R2 within 0.335 0.279 0.384 0.209 0.346 0.286 0.426 0.104
R2 between 0.240 0.289 0.253 0.117 0.244 0.295 0.244 0.027
Number of banks 103 103 103 103 103 103 103 103
Fixed effects YES YES YES YES YES YES YES YES
Time dummies YES YES YES YES YES YES YES YES
Panel B
COMMERCIAL BANKS (Small vs Large Banks)
Bank-MNO partnership (1 if yes, 0 otherwise) Number of years of Bank-MNO partnership since inception
ROA ROE COST/INCOME Z-SCORE ROA ROE COST/INCOME Z-SCORE
(1) (2) (3) (4) (5) (6) (7) (8)
MM -0.417 -3.351 2.384 0.263 0.211* 1.088 -5.489*** 1.288*** (0.546) (4.196) (8.685) (0.304) (0.114) (0.881) (1.761) (0.378)
SMALL 0.751** 4.932* -11.954** 0.013 0.692* 4.472 -6.572 0.331 (0.378) (2.904) (6.011) (0.210) (0.379) (2.919) (5.838) (1.252)
MM x SMALL 1.791** 10.670** -20.714* 0.047 0.534** 3.433* -14.000*** -0.710 (0.703) (5.410) (11.197) (0.392) (0.239) (1.842) (3.683) (0.790)
Total effect 2.541*** 15.602*** -32.668*** 0.060 1.226*** 7.905*** -20.572*** -0.378 (0.702) (5.396) (11.168) (0.391) (0.386) (2.972) (5.944) (1.274)
Controls included YES YES YES YES YES YES YES YES
Observations 381 381 381 381 381 381 381 381
R2 within 0.394 0.338 0.412 0.248 0.399 0.341 0.453 0.118
R2 between 0.294 0.352 0.272 0.148 0.290 0.350 0.255 0.008
Number of banks 84 84 84 84 84 84 84 84
Fixed effects YES YES YES YES YES YES YES YES
Time dummies YES YES YES YES YES YES YES YES
Note: Dependent variables: Return on assets (ROA), Return on equity (ROE), Cost to income ratio (COST/INCOME), and the sum of return on assets and equity
ratio divided by the standard deviation of return on assets (Z-SCORE). MM, involvement in mobile money, stands alternatively for Bank-MNO partnership that equals 1 if yes, 0 otherwise, and the number of years of Bank-MNO partnership since inception. SMALL is a dummy variable that takes the value 1 if the bank total
assets are less than the median, and 0 otherwise. Robust standard errors are in brackets Controls included: SIZE is the logarithm of total asset; LLP is the ratio of loan
loss provision over total assets; TL_TA is the ratio of total loans to total assets; ASSETS Growth is the growth rate of total assets; NII is the share of non-interest income over total operating income; OBS is the ratio of off-balance sheet over total assets; GDP Growth is the annual growth rate of gross domestic product; INFL
is the annual growth rate of consumer price index. ***Significant at the 1% level, **Significant at the 5% level, *Significant at the 10% level.
18
5. Robustness checks
In this section, we consider several sensitivity tests to check the strength of our findings.
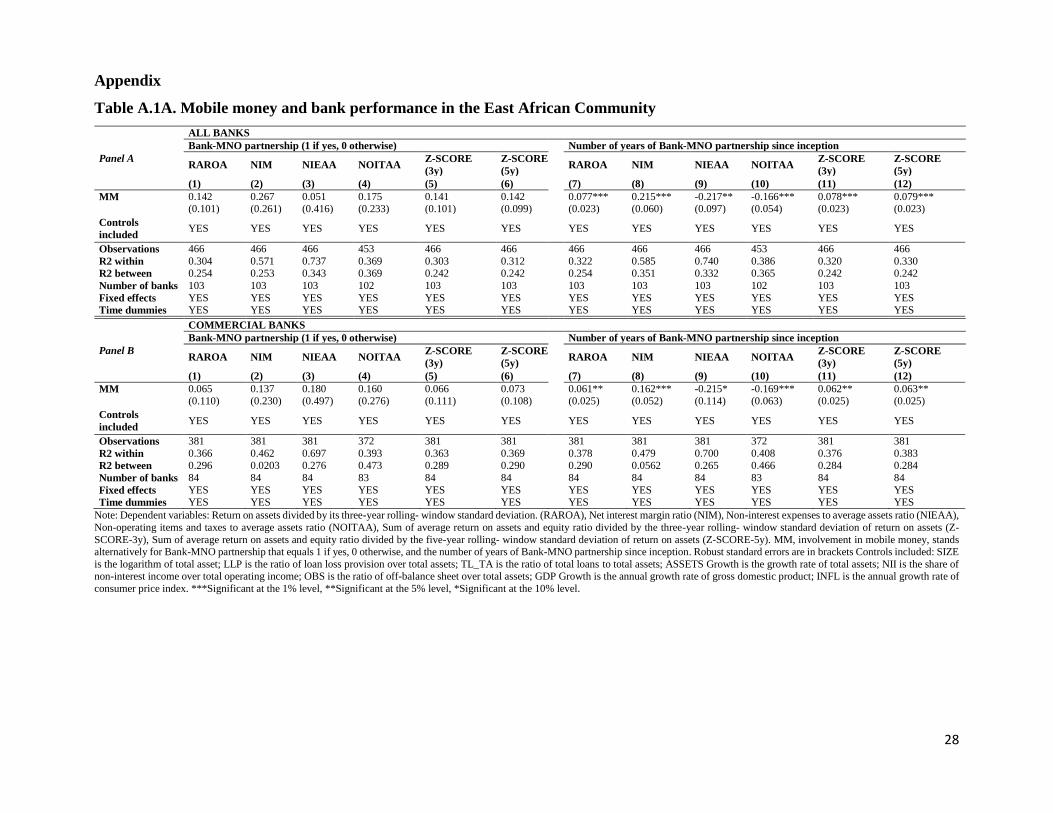
First, we consider alternative measures of bank performance as dependent variables. For
profitability, we consider return on assets divided by its three-year rolling-window standard
deviation (RAROA) and net interest margin ratio (NIM). As regards to efficiency, we use non-
interest expenses to average assets ratio (NIEAA) and non-operating items and taxes to average
assets ratio (NOITAA). Finally, our measure of bank stability, z-score, is modified using three-
year and five-year rolling- window standard deviations (respectively Z-SCORE (3y) and Z-SCORE
(5y)) (Beccalli, 2007; Bitar et al., 2018; Saghi-Zedek, 2016). Tables A.1A and A.1B report the
results for our all our six alternative dependent variables. We find results consistent with our main
findings indicating that the coefficients associated with bank involvement in mobile money proxied
by the categorical variables are significant, except a slight drop in significance for our efficiency
variables (Table A.1B). Our findings obtained taking into account bank size and bank
specialization are confirmed as well. Specifically, consistent with our main findings, we notice that
for small banks the length of involvement in mobile money does not matter: irrespective of the
length, being involved in mobile money is associated with an improvement in bank performance.
The only difference is that bank stability (proxied by Z-SCORE (3y) and Z-SCORE (5y)) are now
positively and significantly affected. Second, we perform an instrumental variable analysis by
following Demirgüç-Kunt and Huizinga (2010) and Liang et al. (2013). Thus, we re-estimate our
equations (1 and 2) where the lagged bank involvement in mobile money MMi,t-1, replaces the
current year values MMi,t. The results in Table A.2 show that all our earlier conclusions are
unaltered. Moreover, we also consider country-level measures of mobile money adoption as
alternatives to our main variable of interest suspected to be endogenous. In fact, effective benefit
stemming from banks’ involvement in mobile money provision requires individual access and
usage of mobile money services. Hence, we use the number of mobile money accounts (MMU)
and the value of mobile money transactions (MMT). The concern of potential reverse causality
might no longer be the case as we consider the effect of country-level variables on bank-level
measures of bank performance. The results show that both the number of accounts and the value
of transactions of mobile money are, as might be expected, positively and negatively related to
bank profitability and efficiency respectively (Table A.3A). These findings hold for large banks
and commercial banks but not for small banks (Table A.3B). Third, we extend our analysis to all
19
financial institutions operating in the EAC (Table A.4). Overall, we find results consistent with our
previous findings. The only notable difference is that the coefficients associated with bank
involvement measured as a dummy variable are now positive and significantly associated with
bank profitability and stability. Given that microfinance institutions are comparatively smaller, this
result amplifies our earlier findings on small banks showing that bank involvement in mobile
money positively affects its performance irrespective of the time elapsed since mobile money
adoption.
6. Why banks’ involvement in mobile money may improve their performance?
Discussion of potential mechanisms
In this section, we discuss potential mechanisms to figure out different channels through
which banks’ involvement in mobile money may improve their performance. Traditionally, banks
provide cash-in/cash-out services via ATMs and bank branches. However, these solutions are too
expensive to set up and operate in markets that have low-income or low-density populations.
Therefore, we exploit the idea that bank-MNO partnership in mobile money provision may enable
banks to leverage mobile money agent networks to reach those areas with limited population size
or economic activity. Clearly, we investigate whether the improvement in bank performance found
in our study is the result of enhanced income diversification and broadened access to financial
services stemming from the cooperation between banks and mobile network operators in mobile
money provision. Accordingly, the positive relationship shown between banks’ involvement in
mobile money and their performance is expected to be more pronounced for banks with low retail
deposit funding or low income diversification. As a measure of deposit funding indicator, we use
the short-term deposit funding. We compute two dummy variables, the first, HIGH deposit funding,
indicates banks that have business model focusing more on deposit funding from customers with a
deposit funding indicator that is higher than the sample mean. The second, LOW deposit funding
share, reports banks that focus less on customer deposits funding and equals to one minus HIGH
deposit funding. Consistent with Ahamed and Mallick (2019), we use our specification of equation
(2) and include two interaction terms MM x HIGH and MM x LOW, where for MM we use both
the dummy and categorical variables of bank involvement in Bank-MNO partnership (equation 3).
Note that in equation (3) the interaction terms replace our variable MM. The intuition is to capture
both effects of bank involvement in mobile money (the two measures) on their performance in
20
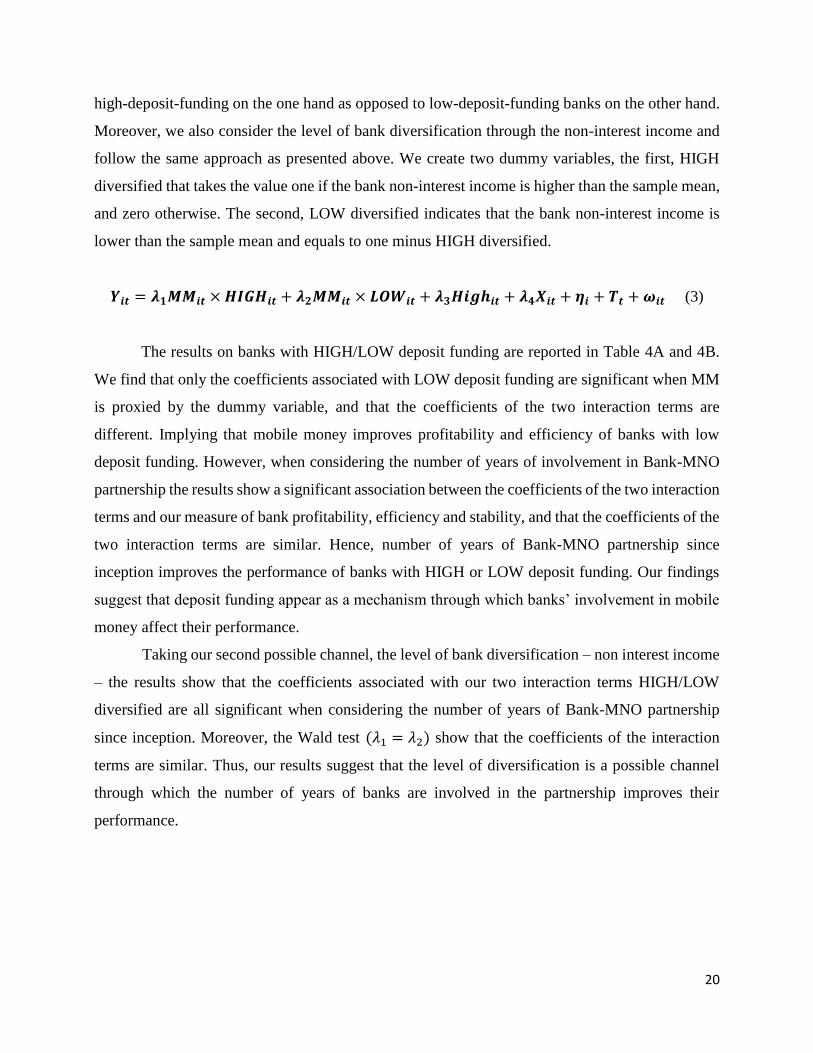
high-deposit-funding on the one hand as opposed to low-deposit-funding banks on the other hand.
Moreover, we also consider the level of bank diversification through the non-interest income and
follow the same approach as presented above. We create two dummy variables, the first, HIGH
diversified that takes the value one if the bank non-interest income is higher than the sample mean,
and zero otherwise. The second, LOW diversified indicates that the bank non-interest income is
lower than the sample mean and equals to one minus HIGH diversified.
𝒀𝒊𝒕 = 𝝀𝟏𝑴𝑴𝒊𝒕 ×𝑯𝑰𝑮𝑯𝒊𝒕 + 𝝀𝟐𝑴𝑴𝒊𝒕 × 𝑳𝑶𝑾𝒊𝒕 + 𝝀𝟑𝑯𝒊𝒈𝒉𝒊𝒕 + 𝝀𝟒𝑿𝒊𝒕 + 𝜼𝒊 + 𝑻𝒕 +𝝎𝒊𝒕 (3)
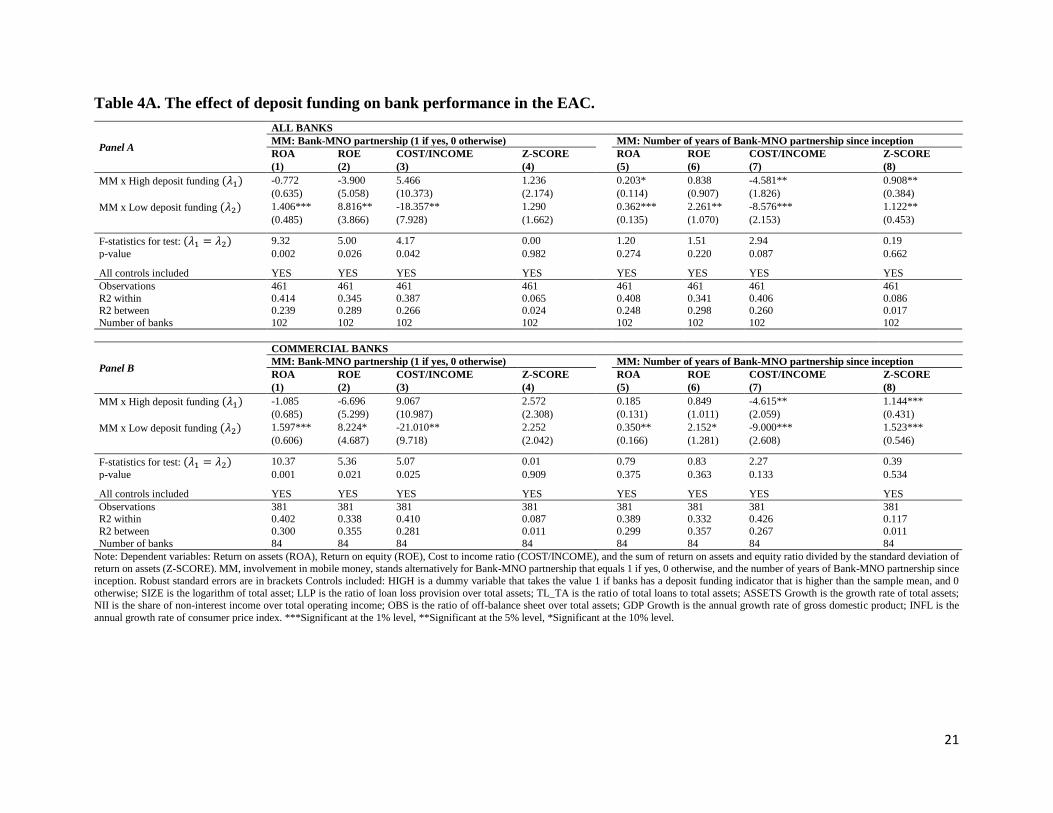
The results on banks with HIGH/LOW deposit funding are reported in Table 4A and 4B.
We find that only the coefficients associated with LOW deposit funding are significant when MM
is proxied by the dummy variable, and that the coefficients of the two interaction terms are
different. Implying that mobile money improves profitability and efficiency of banks with low
deposit funding. However, when considering the number of years of involvement in Bank-MNO
partnership the results show a significant association between the coefficients of the two interaction
terms and our measure of bank profitability, efficiency and stability, and that the coefficients of the
two interaction terms are similar. Hence, number of years of Bank-MNO partnership since
inception improves the performance of banks with HIGH or LOW deposit funding. Our findings
suggest that deposit funding appear as a mechanism through which banks’ involvement in mobile
money affect their performance.
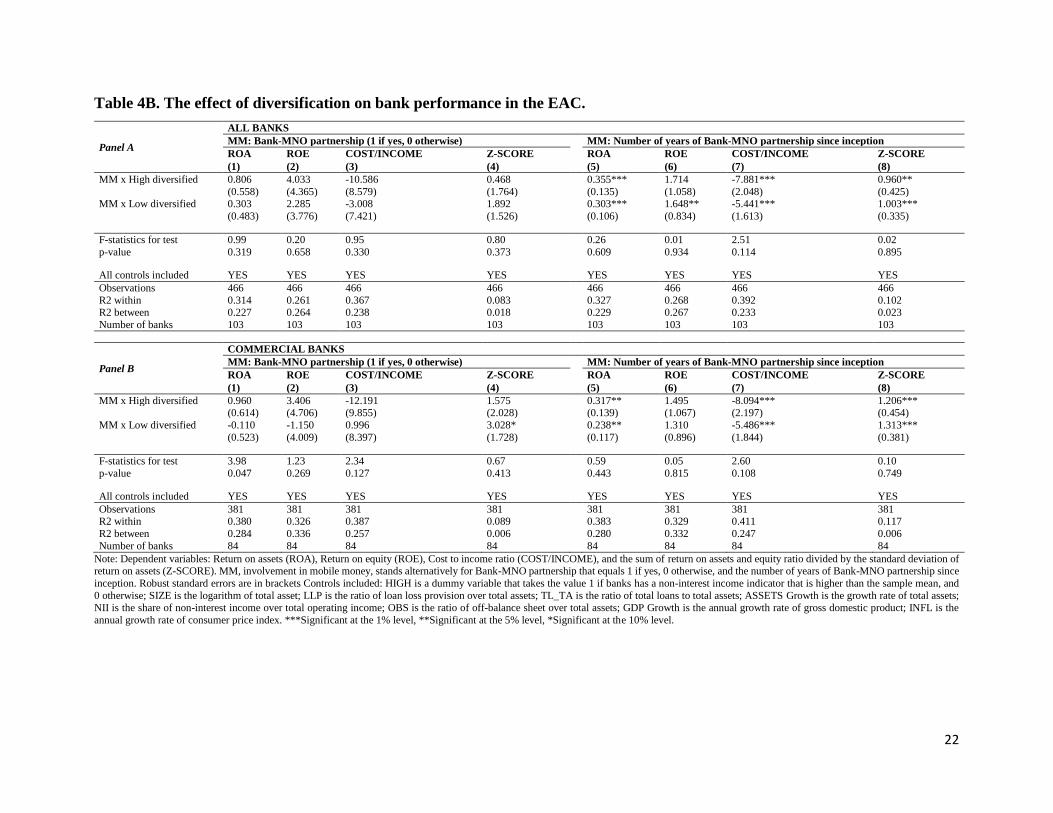
Taking our second possible channel, the level of bank diversification – non interest income
– the results show that the coefficients associated with our two interaction terms HIGH/LOW
diversified are all significant when considering the number of years of Bank-MNO partnership
since inception. Moreover, the Wald test (𝜆1 = 𝜆2) show that the coefficients of the interaction
terms are similar. Thus, our results suggest that the level of diversification is a possible channel
through which the number of years of banks are involved in the partnership improves their
performance.
21
Table 4A. The effect of deposit funding on bank performance in the EAC.
Panel A
ALL BANKS
MM: Bank-MNO partnership (1 if yes, 0 otherwise) MM: Number of years of Bank-MNO partnership since inception
ROA ROE COST/INCOME Z-SCORE ROA ROE COST/INCOME Z-SCORE
(1) (2) (3) (4) (5) (6) (7) (8)
MM x High deposit funding (𝜆1) -0.772 -3.900 5.466 1.236 0.203* 0.838 -4.581** 0.908** (0.635) (5.058) (10.373) (2.174) (0.114) (0.907) (1.826) (0.384)
MM x Low deposit funding (𝜆2) 1.406*** 8.816** -18.357** 1.290 0.362*** 2.261** -8.576*** 1.122** (0.485) (3.866) (7.928) (1.662) (0.135) (1.070) (2.153) (0.453)
F-statistics for test: (𝜆1 = 𝜆2) 9.32 5.00 4.17 0.00 1.20 1.51 2.94 0.19
p-value 0.002 0.026 0.042 0.982 0.274 0.220 0.087 0.662
All controls included YES YES YES YES YES YES YES YES
Observations 461 461 461 461 461 461 461 461
R2 within 0.414 0.345 0.387 0.065 0.408 0.341 0.406 0.086 R2 between 0.239 0.289 0.266 0.024 0.248 0.298 0.260 0.017
Number of banks 102 102 102 102 102 102 102 102
Panel B
COMMERCIAL BANKS
MM: Bank-MNO partnership (1 if yes, 0 otherwise) MM: Number of years of Bank-MNO partnership since inception
ROA ROE COST/INCOME Z-SCORE ROA ROE COST/INCOME Z-SCORE
(1) (2) (3) (4) (5) (6) (7) (8)
MM x High deposit funding (𝜆1) -1.085 -6.696 9.067 2.572 0.185 0.849 -4.615** 1.144*** (0.685) (5.299) (10.987) (2.308) (0.131) (1.011) (2.059) (0.431)
MM x Low deposit funding (𝜆2) 1.597*** 8.224* -21.010** 2.252 0.350** 2.152* -9.000*** 1.523*** (0.606) (4.687) (9.718) (2.042) (0.166) (1.281) (2.608) (0.546)
F-statistics for test: (𝜆1 = 𝜆2) 10.37 5.36 5.07 0.01 0.79 0.83 2.27 0.39
p-value 0.001 0.021 0.025 0.909 0.375 0.363 0.133 0.534
All controls included YES YES YES YES YES YES YES YES
Observations 381 381 381 381 381 381 381 381 R2 within 0.402 0.338 0.410 0.087 0.389 0.332 0.426 0.117
R2 between 0.300 0.355 0.281 0.011 0.299 0.357 0.267 0.011
Number of banks 84 84 84 84 84 84 84 84
Note: Dependent variables: Return on assets (ROA), Return on equity (ROE), Cost to income ratio (COST/INCOME), and the sum of return on assets and equity ratio divided by the standard deviation of return on assets (Z-SCORE). MM, involvement in mobile money, stands alternatively for Bank-MNO partnership that equals 1 if yes, 0 otherwise, and the number of years of Bank-MNO partnership since
inception. Robust standard errors are in brackets Controls included: HIGH is a dummy variable that takes the value 1 if banks has a deposit funding indicator that is higher than the sample mean, and 0
otherwise; SIZE is the logarithm of total asset; LLP is the ratio of loan loss provision over total assets; TL_TA is the ratio of total loans to total assets; ASSETS Growth is the growth rate of total assets; NII is the share of non-interest income over total operating income; OBS is the ratio of off-balance sheet over total assets; GDP Growth is the annual growth rate of gross domestic product; INFL is the
annual growth rate of consumer price index. ***Significant at the 1% level, **Significant at the 5% level, *Significant at the 10% level.
22
Table 4B. The effect of diversification on bank performance in the EAC.
Panel A
ALL BANKS
MM: Bank-MNO partnership (1 if yes, 0 otherwise) MM: Number of years of Bank-MNO partnership since inception
ROA ROE COST/INCOME Z-SCORE ROA ROE COST/INCOME Z-SCORE
(1) (2) (3) (4) (5) (6) (7) (8)
MM x High diversified 0.806 4.033 -10.586 0.468 0.355*** 1.714 -7.881*** 0.960** (0.558) (4.365) (8.579) (1.764) (0.135) (1.058) (2.048) (0.425) MM x Low diversified 0.303 2.285 -3.008 1.892 0.303*** 1.648** -5.441*** 1.003*** (0.483) (3.776) (7.421) (1.526) (0.106) (0.834) (1.613) (0.335)
F-statistics for test 0.99 0.20 0.95 0.80 0.26 0.01 2.51 0.02
p-value 0.319 0.658 0.330 0.373 0.609 0.934 0.114 0.895
All controls included YES YES YES YES YES YES YES YES
Observations 466 466 466 466 466 466 466 466
R2 within 0.314 0.261 0.367 0.083 0.327 0.268 0.392 0.102 R2 between 0.227 0.264 0.238 0.018 0.229 0.267 0.233 0.023
Number of banks 103 103 103 103 103 103 103 103
Panel B
COMMERCIAL BANKS
MM: Bank-MNO partnership (1 if yes, 0 otherwise) MM: Number of years of Bank-MNO partnership since inception
ROA ROE COST/INCOME Z-SCORE ROA ROE COST/INCOME Z-SCORE
(1) (2) (3) (4) (5) (6) (7) (8)
MM x High diversified 0.960 3.406 -12.191 1.575 0.317** 1.495 -8.094*** 1.206*** (0.614) (4.706) (9.855) (2.028) (0.139) (1.067) (2.197) (0.454)
MM x Low diversified -0.110 -1.150 0.996 3.028* 0.238** 1.310 -5.486*** 1.313*** (0.523) (4.009) (8.397) (1.728) (0.117) (0.896) (1.844) (0.381)
F-statistics for test 3.98 1.23 2.34 0.67 0.59 0.05 2.60 0.10
p-value 0.047 0.269 0.127 0.413 0.443 0.815 0.108 0.749
All controls included YES YES YES YES YES YES YES YES
Observations 381 381 381 381 381 381 381 381 R2 within 0.380 0.326 0.387 0.089 0.383 0.329 0.411 0.117
R2 between 0.284 0.336 0.257 0.006 0.280 0.332 0.247 0.006
Number of banks 84 84 84 84 84 84 84 84
Note: Dependent variables: Return on assets (ROA), Return on equity (ROE), Cost to income ratio (COST/INCOME), and the sum of return on assets and equity ratio divided by the standard deviation of return on assets (Z-SCORE). MM, involvement in mobile money, stands alternatively for Bank-MNO partnership that equals 1 if yes, 0 otherwise, and the number of years of Bank-MNO partnership since
inception. Robust standard errors are in brackets Controls included: HIGH is a dummy variable that takes the value 1 if banks has a non-interest income indicator that is higher than the sample mean, and
0 otherwise; SIZE is the logarithm of total asset; LLP is the ratio of loan loss provision over total assets; TL_TA is the ratio of total loans to total assets; ASSETS Growth is the growth rate of total assets;
NII is the share of non-interest income over total operating income; OBS is the ratio of off-balance sheet over total assets; GDP Growth is the annual growth rate of gross domestic product; INFL is the
annual growth rate of consumer price index. ***Significant at the 1% level, **Significant at the 5% level, *Significant at the 10% level.
23
1. Conclusion
In this study, our main objective is to analyse the possible effect of mobile money adoption
by banks on their performance using a sample of 170 financial institutions from the five partner
states of the East African Community (EAC), a worldwide leading region in mobile money
adoption and usage. This financial technology virtually accessible to anyone with a mobile phone
holds the promise to “leapfrog” the provision of banking services in developing countries thanks
to the comparatively high penetration of mobile phones in contrast to the low density of banking
infrastructure. It allows banks to leverage innovative and less costly business models to serve
unbanked or underbanked people by overcoming existing market inefficiencies and reducing the
prohibitive cost of maintaining physical bank branches in rural locations. There is a paucity of
literature examining the impact of mobile money on firms and, to the best of our knowledge, there
is no empirical evidence about whether mobile money hinders or promotes bank performance. Our
paper aims at filling this gap by using a hand collected data sample obtained by screening financial
institutions’ websites and GSMA tracker to identify those that are involved in mobile money
schemes. We supplement our data with bank specific data from Bankscope, macroeconomic data
from World Development Indicators, and the number of mobile money users and the value of
mobile money transactions from the Financial Access Survey (IMF).
Our main findings indicate that the number of years of Bank-MNO partnership since
inception is strongly related to bank performance (profitability, efficiency or stability) while there
are no significant effects when the bank’s status of involvement at a point in time is considered.
Restricting our sample to commercial banks yields similar results although there is a drop-in
significance when looking at bank profitability. Moreover, we split our sample into small and large
banks and find that results on large banks perfectly mimic those on the banking sector. For small
banks, the results show that being involved in mobile money is strongly associated with both their
profitability and efficiency irrespective of their degree of involvement in a partnership with an
MNO, but no significant association with stability. In further investigations, we check the
consistency of our results using six alternative measures of our dependent variables, considering
one-year lagged variable and country-level measures of mobile money adoption as alternatives of
our independent variable of interest (MM). We also extend our analysis to all financial institutions
operating in the EAC. Overall, we find that our main conclusions are unaltered. Exploring channels
24
through which mobile money affects bank performance, our findings suggest that improved access
to retail deposits and income diversification are possible candidates.
Our study has important policy implications and contributes to the debate of the capacity
of mobile money system to galvanize the banking sector by enhancing stability and promoting
financial inclusion. The findings provide novel insights concerning the convenience of mobile
money development for the banking sector. More specifically, our results contribute to the debate
about the benefit of mobile money innovation on bank performance. Nevertheless, while our paper
points to efficiency, profitability and stability gains that accrue to mobile money adopters (the
bright side), it is critical to bear in mind potential vulnerabilities (dark side) that could result in
intensified competition once this innovation matures. For instance, issues of late repayment and
default or debt cycling and over-indebtedness have started to emerge following the rapid expansion
of digital loans. Moreover, evidence from the developed world shows how new technologies often
bring new risks. The case of securitization that went from being a well-acclaimed financial
innovation to becoming one of the root causes of the Global Financial Crisis of 2008 is a vivid
illustration. Given the perennial concern that regulation always lags behind innovation, it is of high
importance that future research considers such potential risks.
25
References
Ahamed, M.M., Mallick, S.K., 2019. Is financial inclusion good for bank stability? International
evidence. J. Econ. Behav. Organ. 157, 403–427. https://doi.org/10.1016/j.jebo.2017.07.027
Anagnostopoulos, I., 2018. Fintech and regtech: Impact on regulators and banks. J. Econ. Bus.
100, 7–25. https://doi.org/10.1016/j.jeconbus.2018.07.003
Aron, J., 2017. ‘ Leapfrogging ’: a Survey of the Nature and Economic Implications of Mobile
Money. CSAE Work. Pap. WPS/2017-02.
Basel Committee on Banking Supervision, 2018. Sound Practices: Implications of fintech
developments for banks and bank supervisors. Bank Int. Settlements.
Beccalli, E., 2007. Does IT investment improve bank performance? Evidence from Europe. J.
Bank. Financ. 31, 2205–2230.
Beck, T., Chen, T., Lin, C., Song, F.M., 2016. Financial innovation: The bright and the dark
sides. J. Bank. Financ. 72, 28–51. https://doi.org/10.1016/j.jbankfin.2016.06.012
Berger, A.N., Hasan, I., Zhou, M., 2010. The effects of focus versus diversification on bank
performance: Evidence from Chinese banks. J. Bank. Financ. 34, 1417–1435.
https://doi.org/10.1016/j.jbankfin.2010.01.010
BFA, 2017. East Africa Mobile Money Cross-Border Payments : Market demand Side. Consult.
Gr. to Assist Poor 1–92.
Bharadwaj, P., Jack, W., Suri, T., 2019. Fintech and Household Resilience to Shocks: Evidence
from Digital Loans in Kenya. Cambridge, MA. https://doi.org/10.3386/w25604
Bitar, M., Pukthuanthong, K., Walker, T., 2018. The effect of capital ratios on the risk ,
efficiency and profitability of banks : Evidence from OECD countries. J. Int. Financ. Mark.
Institutions Money 53, 227–262. https://doi.org/10.1016/j.intfin.2017.12.002
Cook, W., McKay, C., 2017. Banking in the M-PESA Age: Lessons from Kenya. Work. Pap.
Washington, D.C. CGAP.
Demirgüç-Kunt, A., Huizinga, H., 2010. Bank activity and funding strategies: The impact on risk
and returns. J. financ. econ. 98, 626–650. https://doi.org/10.1016/j.jfineco.2010.06.004
Dos Santos, B.L., Peffers, K., 1995. No TitleRewards to Investors in Innovative Information
Technology Applications: First Movers and Early Followers in ATMs. Organ. Sci. 6, 241–
259.
Drasch, B.J., Schweizer, A., Urbach, N., 2018. Integrating the ‘Troublemakers’: A taxonomy for
cooperation between banks and fintechs. J. Econ. Bus. 100, 26–42.
https://doi.org/10.1016/j.jeconbus.2018.04.002
Flaming, M., Mitha, A., Hanouch, M., Zetterli, P., Bull, G., 2013. Partnerships in Mobile
Financial Services : Factors for Success. Int. Financ. Corp. World Bank Gr.
Frame, W.S., Wall, L., White, L.J., 2018. Technological Change and Financial Innovation in
Banking: Some Implications for Fintech. Fed. Reserv. Bank Atlanta, Work. Pap. No. 2018-
11. https://doi.org/10.29338/wp2018-11
Frame, W.S., White, L.J., 2004. Empirical studies of financial innovation: lots of talk, little
action?, Journal of Economic Literature. https://doi.org/10.1111/j.1467-
629X.1984.tb00054.x
Fuentelsaz, L., Gómez, J., Palomas, S., 2012. Production technologies and financial
performance : The effect of uneven diffusion among competitors. Res. Policy 41, 401–413.
https://doi.org/10.1016/j.respol.2011.09.006
Fuentelsaz, L., Gómez, J., Palomas, S., 2009. The effects of new technologies on productivity:
An intrafirm diffusion-based assessment. Res. Policy 38, 1172–1180.
26
https://doi.org/10.1016/j.respol.2009.04.003
Fuentelsaz, L., Gomez, J., Polo, Y., 2003. Intrafirm diffusion of new technologies : an empirical
application 32, 533–551.
Greenacre, J., Buckley, R.P., 2014. Using Trusts to Protect Mobile Money Customers. Singapore
J. Leg. Stud. 59–78.
Han, R., Melecky, M., 2014. Financial Inclusion for Financial Stability: Access to Bank Deposits
and the Growth of Deposits in the Global Financial Crisis. Policy Res. Work. Pap. 6577,
World Bank. https://doi.org/10.1596/1813-9450-6577
Hirt, M., Willmott, P., 2014. Strategic principles for competing in the digital age. McKinsey Q.
1–13.
International Monetary Fund, 2018. The Bali Fintech Agenda, IMF Policy Paper, Washington,
DC.
Jack, W., Suri, T., 2016. The long-run poverty and gender impacts of mobile money. Science (80-
. ). 1288–1292. https://doi.org/10.1126/science.aah5309
Jack, W., Suri, T., 2014. Risk sharing and transactions costs: Evidence from Kenya’s mobile
money revolution. Am. Econ. Rev. 104, 183–223. https://doi.org/10.1257/aer.104.1.183
Jagtiani, J., John, K., 2018. Fintech: The Impact on Consumers and Regulatory Responses. J.
Econ. Bus. 100, 1–6. https://doi.org/10.1016/j.jeconbus.2018.11.002
Jagtiani, J., Lemieux, C., 2018. Do fintech lenders penetrate areas that are underserved by
traditional banks? J. Econ. Bus. 100, 43–54. https://doi.org/10.1016/j.jeconbus.2018.03.001
Karshenas, M., Stoneman, P.L., 1993. Rank, Stock, Order, and Epidemic Effects in the Diffusion
of New Process Technologies: An Empirical Model. RAND J. Econ. 24, 503–528.
https://doi.org/10.2307/2555742
Kirilenko, A.A., Lo, A.W., 2013. Moore’s Law vs. Murphy’s Law: Algorithmic Trading and Its
Discontents. J. Econ. Perspect. 27, 51–72. https://doi.org/10.2139/ssrn.2235963
Koami, K.A., Afrika, J.-G., Akanni-Honvo, A., Tomen, H.N., Abimbola, O., Davis, W., 2016.
Africa Regional Integration Index: Report 2016. African Union Comm. African Dev. Bank,
Econ. Comm. Africa 1–52.
Köster, H., Pelster, M., 2017. Financial penalties and bank performance. J. Bank. Financ. 79, 57–
73. https://doi.org/10.1016/j.jbankfin.2017.02.009
Lashitew, A.A., Tulder, R. van, Liasse, Y., 2019. Mobile phones for financial inclusion: What
explains the diffusion of mobile money innovations? Res. Policy 48, 1201–1215.
Lepetit, L., Rugemintwari, C., Strobel, F., 2015. Monetary, Financial and Fiscal Stability in the
East African Community: Ready for a Monetary Union? World Econ. 38, 1179–1204.
https://doi.org/10.1111/twec.12243
Liang, H.Y., Ching, Y.P., Chan, K.C., 2013. Enhancing bank performance through branches or
representative offices? Evidence from European banks. Int. Bus. Rev. 22, 495–508.
https://doi.org/10.1016/j.ibusrev.2012.07.003
Mas, I., Ng’weno, A., 2010. Three keys to M-PESA’s success: Branding, channel management
and pricing. J. Payments Strateg. Syst. 4.
Mbiti, I., David Weil, 2016. Mobile Banking: the Impact of M-Pesa in Kenya. African Successes,
Vol. III Mod. Dev. Edwards, Johnson, Weil. https://doi.org/10.1007/s13398-014-0173-7.2
Meslier, C., Tacneng, R., Tarazi, A., 2014. Is bank income diversification beneficial? Evidence
from an emerging economy. J. Int. Financ. Mark. Institutions Money 31, 97–126.
https://doi.org/10.1016/j.intfin.2014.03.007
Minischetti, E., Scharwatt, C., 2016. Global adoption of mobile money in 2015: A look at the
data [WWW Document]. GSMA, Mob. Dev. URL
27
https://www.gsma.com/mobilefordevelopment/programme/mobile-money/global-adoption-
mobile-money-2015-look-data/
Mostak Ahamed, M., 2017. Asset quality, non-interest income, and bank profitability: Evidence
from Indian banks. Econ. Model. 63, 1–14. https://doi.org/10.1016/j.econmod.2017.01.016
Munyegera, G.K., Matsumoto, T., 2016. Mobile Money, Remittances, and Household Welfare:
Panel Evidence from Rural Uganda. World Dev. 79, 127–137.
https://doi.org/10.1016/j.worlddev.2015.11.006
Philippon, T., 2018. The FinTech Opportunity. Work. Pap. https://doi.org/10.3386/w22476
Saghi-Zedek, N., 2016. Product diversification and bank performance: Does ownership structure
matter? J. Bank. Financ. 71, 154–167.
Sanya, S., Gaertner, M., 2012. Assessing Bank Competition within the East African Community.
IMF Work. Pap. 12, 1. https://doi.org/10.5089/9781463933173.001
Scott, S. V., Reenen, J. Van, Zachariadis, M., 2017. The long-term effect of digital innovation on
bank performance: An empirical study of SWIFT adoption in financial services. Res. Policy
46, 984–1004. https://doi.org/10.1016/j.respol.2017.03.010
Shaban, M., James, G.A., 2014. The effects of ownership change on bank performance and risk
exposure: Evidence from indonesia. J. Bank. Financ. 0, 1–15.
https://doi.org/10.1016/j.jbankfin.2017.02.002
Stijns, J.-P., Revoltella, D., 2016. Banking in sub-Saharan Africa Recent Trends and Digital
Financial Inclusion, European Investment Bank.
Sy, A.N.R., Maino, R., Massara, A., Perez-Saiz, H., Sharma, P., 2019. FinTech in Sub-Saharan
African Countries: A Game Changer? IMF, Dep. Pap. No. 19/04.
Thakor, A. V., 2019. Fintech and Banking. Available at SSRN: https//ssrn.com/abstract=3332550
or http//dx.doi.org/10.2139/ssrn.3332550.
The Economist Unit Intelligence, 2015. The disruption of banking.
The Financial Stability Board, 2017. Financial Stability Implications from Fintech: Supervisory
and Regulatory Issues that Merit Authorities’ Attention.
The World Bank, 2019. World Development Indicators, Washington, DC.
United Nations Conference on Trade and Development, 2012. Mobile Money for Business
Development in East African Community. United Nations Publ.
Van Der Boor, P., Oliveira, P., Veloso, F., 2014. Users as innovators in developing countries:
The global sources of innovation and diffusion in mobile banking services. Res. Policy 43,
1594–1607. https://doi.org/10.1016/j.respol.2014.05.003
World Bank Group, 2018. The Little Data Book on Financial Inclusion.
https://doi.org/10.1596/978-1-4648-0552-3
28
Appendix
Table A.1A. Mobile money and bank performance in the East African Community
Panel A
ALL BANKS
Bank-MNO partnership (1 if yes, 0 otherwise) Number of years of Bank-MNO partnership since inception
RAROA NIM NIEAA NOITAA Z-SCORE
(3y)
Z-SCORE
(5y) RAROA NIM NIEAA NOITAA
Z-SCORE
(3y)
Z-SCORE
(5y)
(1) (2) (3) (4) (5) (6) (7) (8) (9) (10) (11) (12)
MM 0.142 0.267 0.051 0.175 0.141 0.142 0.077*** 0.215*** -0.217** -0.166*** 0.078*** 0.079*** (0.101) (0.261) (0.416) (0.233) (0.101) (0.099) (0.023) (0.060) (0.097) (0.054) (0.023) (0.023) Controls
included YES YES YES YES YES YES YES YES YES YES YES YES
Observations 466 466 466 453 466 466 466 466 466 453 466 466
R2 within 0.304 0.571 0.737 0.369 0.303 0.312 0.322 0.585 0.740 0.386 0.320 0.330
R2 between 0.254 0.253 0.343 0.369 0.242 0.242 0.254 0.351 0.332 0.365 0.242 0.242
Number of banks 103 103 103 102 103 103 103 103 103 102 103 103
Fixed effects YES YES YES YES YES YES YES YES YES YES YES YES
Time dummies YES YES YES YES YES YES YES YES YES YES YES YES
Panel B
COMMERCIAL BANKS
Bank-MNO partnership (1 if yes, 0 otherwise) Number of years of Bank-MNO partnership since inception
RAROA NIM NIEAA NOITAA Z-SCORE
(3y)
Z-SCORE
(5y) RAROA NIM NIEAA NOITAA
Z-SCORE
(3y)
Z-SCORE
(5y)
(1) (2) (3) (4) (5) (6) (7) (8) (9) (10) (11) (12)
MM 0.065 0.137 0.180 0.160 0.066 0.073 0.061** 0.162*** -0.215* -0.169*** 0.062** 0.063** (0.110) (0.230) (0.497) (0.276) (0.111) (0.108) (0.025) (0.052) (0.114) (0.063) (0.025) (0.025) Controls
included YES YES YES YES YES YES YES YES YES YES YES YES
Observations 381 381 381 372 381 381 381 381 381 372 381 381
R2 within 0.366 0.462 0.697 0.393 0.363 0.369 0.378 0.479 0.700 0.408 0.376 0.383
R2 between 0.296 0.0203 0.276 0.473 0.289 0.290 0.290 0.0562 0.265 0.466 0.284 0.284
Number of banks 84 84 84 83 84 84 84 84 84 83 84 84
Fixed effects YES YES YES YES YES YES YES YES YES YES YES YES
Time dummies YES YES YES YES YES YES YES YES YES YES YES YES
Note: Dependent variables: Return on assets divided by its three-year rolling- window standard deviation. (RAROA), Net interest margin ratio (NIM), Non-interest expenses to average assets ratio (NIEAA),
Non-operating items and taxes to average assets ratio (NOITAA), Sum of average return on assets and equity ratio divided by the three-year rolling- window standard deviation of return on assets (Z-
SCORE-3y), Sum of average return on assets and equity ratio divided by the five-year rolling- window standard deviation of return on assets (Z-SCORE-5y). MM, involvement in mobile money, stands alternatively for Bank-MNO partnership that equals 1 if yes, 0 otherwise, and the number of years of Bank-MNO partnership since inception. Robust standard errors are in brackets Controls included: SIZE
is the logarithm of total asset; LLP is the ratio of loan loss provision over total assets; TL_TA is the ratio of total loans to total assets; ASSETS Growth is the growth rate of total assets; NII is the share of non-interest income over total operating income; OBS is the ratio of off-balance sheet over total assets; GDP Growth is the annual growth rate of gross domestic product; INFL is the annual growth rate of
consumer price index. ***Significant at the 1% level, **Significant at the 5% level, *Significant at the 10% level.
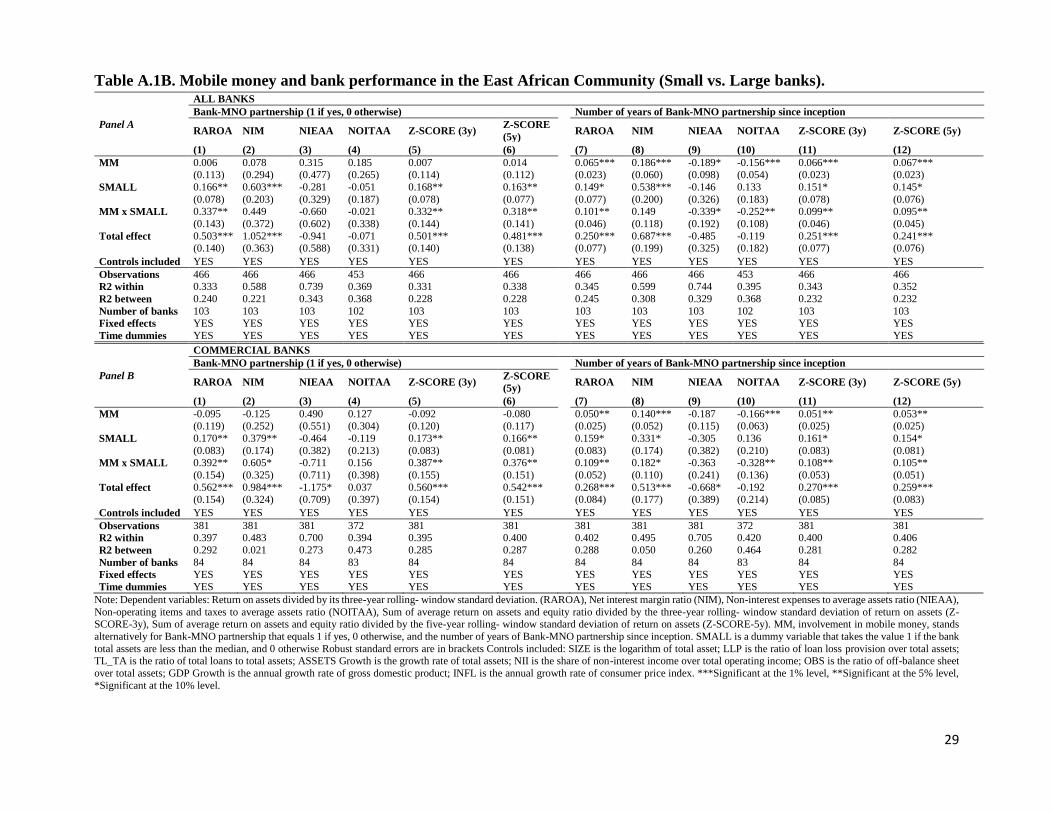
29
Table A.1B. Mobile money and bank performance in the East African Community (Small vs. Large banks).
Panel A
ALL BANKS
Bank-MNO partnership (1 if yes, 0 otherwise) Number of years of Bank-MNO partnership since inception
RAROA NIM NIEAA NOITAA Z-SCORE (3y) Z-SCORE
(5y) RAROA NIM NIEAA NOITAA Z-SCORE (3y) Z-SCORE (5y)
(1) (2) (3) (4) (5) (6) (7) (8) (9) (10) (11) (12)
MM 0.006 0.078 0.315 0.185 0.007 0.014 0.065*** 0.186*** -0.189* -0.156*** 0.066*** 0.067*** (0.113) (0.294) (0.477) (0.265) (0.114) (0.112) (0.023) (0.060) (0.098) (0.054) (0.023) (0.023)
SMALL 0.166** 0.603*** -0.281 -0.051 0.168** 0.163** 0.149* 0.538*** -0.146 0.133 0.151* 0.145* (0.078) (0.203) (0.329) (0.187) (0.078) (0.077) (0.077) (0.200) (0.326) (0.183) (0.078) (0.076)
MM x SMALL 0.337** 0.449 -0.660 -0.021 0.332** 0.318** 0.101** 0.149 -0.339* -0.252** 0.099** 0.095** (0.143) (0.372) (0.602) (0.338) (0.144) (0.141) (0.046) (0.118) (0.192) (0.108) (0.046) (0.045)
Total effect 0.503*** 1.052*** -0.941 -0.071 0.501*** 0.481*** 0.250*** 0.687*** -0.485 -0.119 0.251*** 0.241*** (0.140) (0.363) (0.588) (0.331) (0.140) (0.138) (0.077) (0.199) (0.325) (0.182) (0.077) (0.076)
Controls included YES YES YES YES YES YES YES YES YES YES YES YES
Observations 466 466 466 453 466 466 466 466 466 453 466 466
R2 within 0.333 0.588 0.739 0.369 0.331 0.338 0.345 0.599 0.744 0.395 0.343 0.352
R2 between 0.240 0.221 0.343 0.368 0.228 0.228 0.245 0.308 0.329 0.368 0.232 0.232
Number of banks 103 103 103 102 103 103 103 103 103 102 103 103
Fixed effects YES YES YES YES YES YES YES YES YES YES YES YES
Time dummies YES YES YES YES YES YES YES YES YES YES YES YES
Panel B
COMMERCIAL BANKS
Bank-MNO partnership (1 if yes, 0 otherwise) Number of years of Bank-MNO partnership since inception
RAROA NIM NIEAA NOITAA Z-SCORE (3y) Z-SCORE
(5y) RAROA NIM NIEAA NOITAA Z-SCORE (3y) Z-SCORE (5y)
(1) (2) (3) (4) (5) (6) (7) (8) (9) (10) (11) (12)
MM -0.095 -0.125 0.490 0.127 -0.092 -0.080 0.050** 0.140*** -0.187 -0.166*** 0.051** 0.053** (0.119) (0.252) (0.551) (0.304) (0.120) (0.117) (0.025) (0.052) (0.115) (0.063) (0.025) (0.025)
SMALL 0.170** 0.379** -0.464 -0.119 0.173** 0.166** 0.159* 0.331* -0.305 0.136 0.161* 0.154* (0.083) (0.174) (0.382) (0.213) (0.083) (0.081) (0.083) (0.174) (0.382) (0.210) (0.083) (0.081)
MM x SMALL 0.392** 0.605* -0.711 0.156 0.387** 0.376** 0.109** 0.182* -0.363 -0.328** 0.108** 0.105** (0.154) (0.325) (0.711) (0.398) (0.155) (0.151) (0.052) (0.110) (0.241) (0.136) (0.053) (0.051)
Total effect 0.562*** 0.984*** -1.175* 0.037 0.560*** 0.542*** 0.268*** 0.513*** -0.668* -0.192 0.270*** 0.259*** (0.154) (0.324) (0.709) (0.397) (0.154) (0.151) (0.084) (0.177) (0.389) (0.214) (0.085) (0.083)
Controls included YES YES YES YES YES YES YES YES YES YES YES YES
Observations 381 381 381 372 381 381 381 381 381 372 381 381
R2 within 0.397 0.483 0.700 0.394 0.395 0.400 0.402 0.495 0.705 0.420 0.400 0.406
R2 between 0.292 0.021 0.273 0.473 0.285 0.287 0.288 0.050 0.260 0.464 0.281 0.282
Number of banks 84 84 84 83 84 84 84 84 84 83 84 84
Fixed effects YES YES YES YES YES YES YES YES YES YES YES YES
Time dummies YES YES YES YES YES YES YES YES YES YES YES YES
Note: Dependent variables: Return on assets divided by its three-year rolling- window standard deviation. (RAROA), Net interest margin ratio (NIM), Non-interest expenses to average assets ratio (NIEAA),
Non-operating items and taxes to average assets ratio (NOITAA), Sum of average return on assets and equity ratio divided by the three-year rolling- window standard deviation of return on assets (Z-SCORE-3y), Sum of average return on assets and equity ratio divided by the five-year rolling- window standard deviation of return on assets (Z-SCORE-5y). MM, involvement in mobile money, stands
alternatively for Bank-MNO partnership that equals 1 if yes, 0 otherwise, and the number of years of Bank-MNO partnership since inception. SMALL is a dummy variable that takes the value 1 if the bank
total assets are less than the median, and 0 otherwise Robust standard errors are in brackets Controls included: SIZE is the logarithm of total asset; LLP is the ratio of loan loss provision over total assets; TL_TA is the ratio of total loans to total assets; ASSETS Growth is the growth rate of total assets; NII is the share of non-interest income over total operating income; OBS is the ratio of off-balance sheet
over total assets; GDP Growth is the annual growth rate of gross domestic product; INFL is the annual growth rate of consumer price index. ***Significant at the 1% level, **Significant at the 5% level,
*Significant at the 10% level.
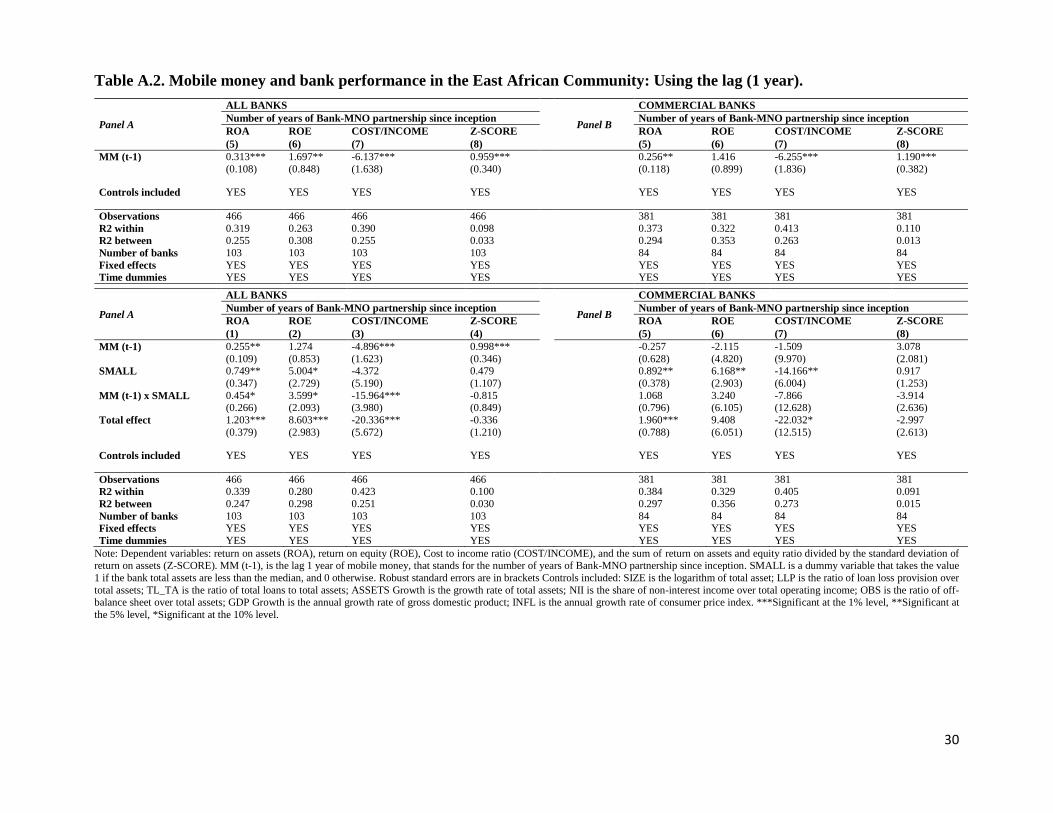
30
Table A.2. Mobile money and bank performance in the East African Community: Using the lag (1 year).
Panel A
ALL BANKS
Panel B
COMMERCIAL BANKS
Number of years of Bank-MNO partnership since inception Number of years of Bank-MNO partnership since inception
ROA ROE COST/INCOME Z-SCORE ROA ROE COST/INCOME Z-SCORE
(5) (6) (7) (8) (5) (6) (7) (8)
MM (t-1) 0.313*** 1.697** -6.137*** 0.959*** 0.256** 1.416 -6.255*** 1.190*** (0.108) (0.848) (1.638) (0.340) (0.118) (0.899) (1.836) (0.382)
Controls included YES YES YES YES YES YES YES YES
Observations 466 466 466 466 381 381 381 381
R2 within 0.319 0.263 0.390 0.098 0.373 0.322 0.413 0.110
R2 between 0.255 0.308 0.255 0.033 0.294 0.353 0.263 0.013
Number of banks 103 103 103 103 84 84 84 84
Fixed effects YES YES YES YES YES YES YES YES
Time dummies YES YES YES YES YES YES YES YES
Panel A
ALL BANKS
Panel B
COMMERCIAL BANKS
Number of years of Bank-MNO partnership since inception Number of years of Bank-MNO partnership since inception
ROA ROE COST/INCOME Z-SCORE ROA ROE COST/INCOME Z-SCORE
(1) (2) (3) (4) (5) (6) (7) (8)
MM (t-1) 0.255** 1.274 -4.896*** 0.998*** -0.257 -2.115 -1.509 3.078 (0.109) (0.853) (1.623) (0.346) (0.628) (4.820) (9.970) (2.081)
SMALL 0.749** 5.004* -4.372 0.479 0.892** 6.168** -14.166** 0.917 (0.347) (2.729) (5.190) (1.107) (0.378) (2.903) (6.004) (1.253)
MM (t-1) x SMALL 0.454* 3.599* -15.964*** -0.815 1.068 3.240 -7.866 -3.914 (0.266) (2.093) (3.980) (0.849) (0.796) (6.105) (12.628) (2.636)
Total effect 1.203*** 8.603*** -20.336*** -0.336 1.960*** 9.408 -22.032* -2.997 (0.379) (2.983) (5.672) (1.210) (0.788) (6.051) (12.515) (2.613)
Controls included YES YES YES YES YES YES YES YES
Observations 466 466 466 466 381 381 381 381
R2 within 0.339 0.280 0.423 0.100 0.384 0.329 0.405 0.091
R2 between 0.247 0.298 0.251 0.030 0.297 0.356 0.273 0.015
Number of banks 103 103 103 103 84 84 84 84
Fixed effects YES YES YES YES YES YES YES YES
Time dummies YES YES YES YES YES YES YES YES
Note: Dependent variables: return on assets (ROA), return on equity (ROE), Cost to income ratio (COST/INCOME), and the sum of return on assets and equity ratio divided by the standard deviation of return on assets (Z-SCORE). MM (t-1), is the lag 1 year of mobile money, that stands for the number of years of Bank-MNO partnership since inception. SMALL is a dummy variable that takes the value
1 if the bank total assets are less than the median, and 0 otherwise. Robust standard errors are in brackets Controls included: SIZE is the logarithm of total asset; LLP is the ratio of loan loss provision over
total assets; TL_TA is the ratio of total loans to total assets; ASSETS Growth is the growth rate of total assets; NII is the share of non-interest income over total operating income; OBS is the ratio of off-balance sheet over total assets; GDP Growth is the annual growth rate of gross domestic product; INFL is the annual growth rate of consumer price index. ***Significant at the 1% level, **Significant at
the 5% level, *Significant at the 10% level.
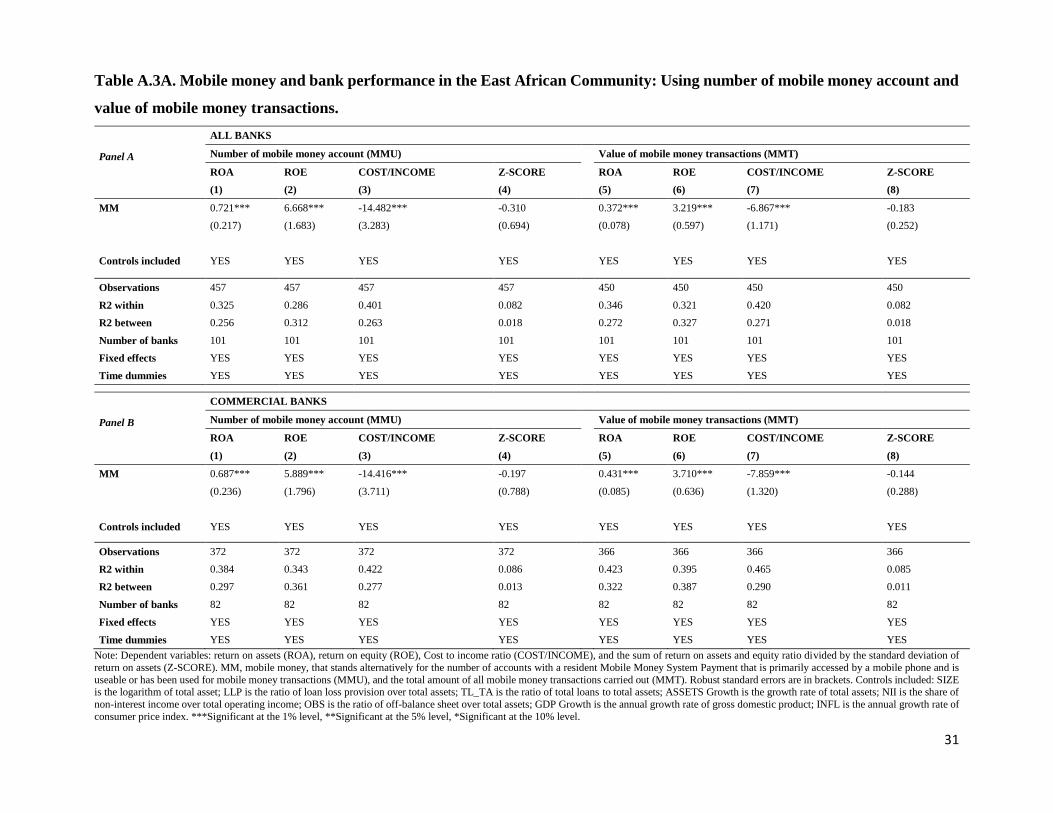
31
Table A.3A. Mobile money and bank performance in the East African Community: Using number of mobile money account and
value of mobile money transactions.
Panel A
ALL BANKS
Number of mobile money account (MMU) Value of mobile money transactions (MMT)
ROA ROE COST/INCOME Z-SCORE ROA ROE COST/INCOME Z-SCORE
(1) (2) (3) (4) (5) (6) (7) (8)
MM 0.721*** 6.668*** -14.482*** -0.310 0.372*** 3.219*** -6.867*** -0.183
(0.217) (1.683) (3.283) (0.694) (0.078) (0.597) (1.171) (0.252)
Controls included YES YES YES YES YES YES YES YES
Observations 457 457 457 457 450 450 450 450
R2 within 0.325 0.286 0.401 0.082 0.346 0.321 0.420 0.082
R2 between 0.256 0.312 0.263 0.018 0.272 0.327 0.271 0.018
Number of banks 101 101 101 101 101 101 101 101
Fixed effects YES YES YES YES YES YES YES YES
Time dummies YES YES YES YES YES YES YES YES
Panel B
COMMERCIAL BANKS
Number of mobile money account (MMU) Value of mobile money transactions (MMT)
ROA ROE COST/INCOME Z-SCORE ROA ROE COST/INCOME Z-SCORE
(1) (2) (3) (4) (5) (6) (7) (8)
MM 0.687*** 5.889*** -14.416*** -0.197 0.431*** 3.710*** -7.859*** -0.144
(0.236) (1.796) (3.711) (0.788) (0.085) (0.636) (1.320) (0.288)
Controls included YES YES YES YES YES YES YES YES
Observations 372 372 372 372 366 366 366 366
R2 within 0.384 0.343 0.422 0.086 0.423 0.395 0.465 0.085
R2 between 0.297 0.361 0.277 0.013 0.322 0.387 0.290 0.011
Number of banks 82 82 82 82 82 82 82 82
Fixed effects YES YES YES YES YES YES YES YES
Time dummies YES YES YES YES YES YES YES YES
Note: Dependent variables: return on assets (ROA), return on equity (ROE), Cost to income ratio (COST/INCOME), and the sum of return on assets and equity ratio divided by the standard deviation of
return on assets (Z-SCORE). MM, mobile money, that stands alternatively for the number of accounts with a resident Mobile Money System Payment that is primarily accessed by a mobile phone and is
useable or has been used for mobile money transactions (MMU), and the total amount of all mobile money transactions carried out (MMT). Robust standard errors are in brackets. Controls included: SIZE is the logarithm of total asset; LLP is the ratio of loan loss provision over total assets; TL_TA is the ratio of total loans to total assets; ASSETS Growth is the growth rate of total assets; NII is the share of
non-interest income over total operating income; OBS is the ratio of off-balance sheet over total assets; GDP Growth is the annual growth rate of gross domestic product; INFL is the annual growth rate of
consumer price index. ***Significant at the 1% level, **Significant at the 5% level, *Significant at the 10% level.
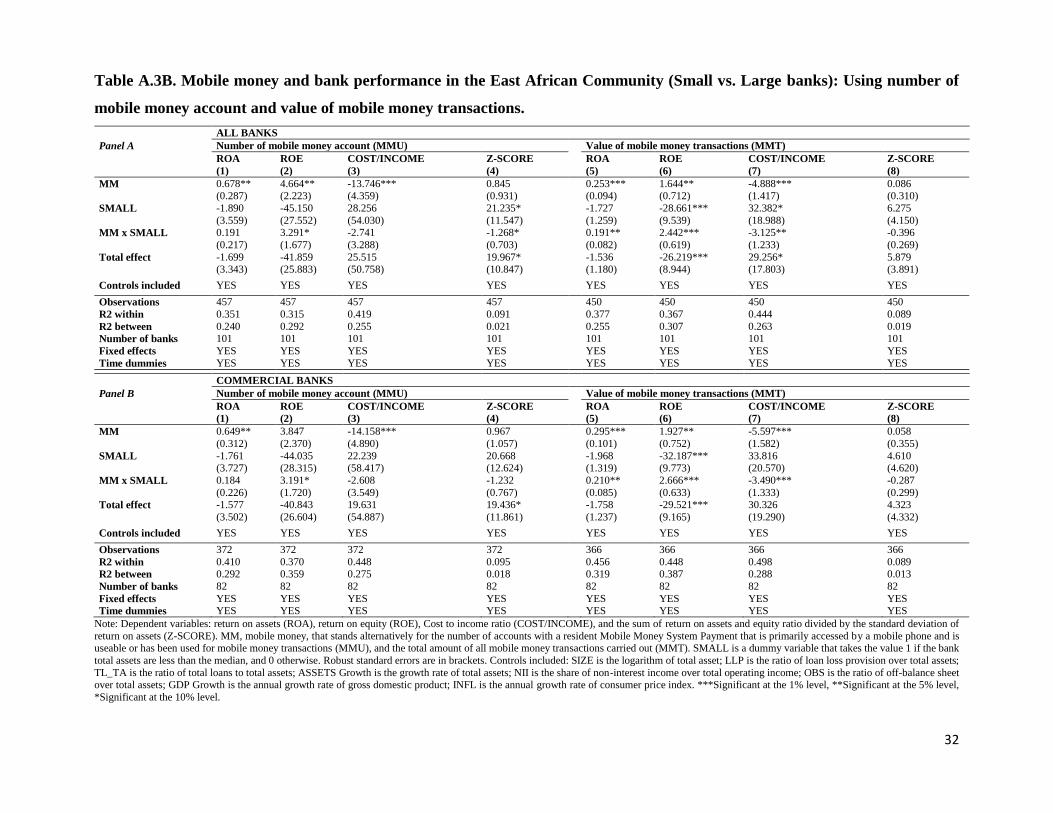
32
Table A.3B. Mobile money and bank performance in the East African Community (Small vs. Large banks): Using number of
mobile money account and value of mobile money transactions.
Panel A
ALL BANKS
Number of mobile money account (MMU) Value of mobile money transactions (MMT)
ROA ROE COST/INCOME Z-SCORE ROA ROE COST/INCOME Z-SCORE
(1) (2) (3) (4) (5) (6) (7) (8)
MM 0.678** 4.664** -13.746*** 0.845 0.253*** 1.644** -4.888*** 0.086 (0.287) (2.223) (4.359) (0.931) (0.094) (0.712) (1.417) (0.310)
SMALL -1.890 -45.150 28.256 21.235* -1.727 -28.661*** 32.382* 6.275 (3.559) (27.552) (54.030) (11.547) (1.259) (9.539) (18.988) (4.150)
MM x SMALL 0.191 3.291* -2.741 -1.268* 0.191** 2.442*** -3.125** -0.396 (0.217) (1.677) (3.288) (0.703) (0.082) (0.619) (1.233) (0.269)
Total effect -1.699 -41.859 25.515 19.967* -1.536 -26.219*** 29.256* 5.879 (3.343) (25.883) (50.758) (10.847) (1.180) (8.944) (17.803) (3.891) Controls included YES YES YES YES YES YES YES YES
Observations 457 457 457 457 450 450 450 450
R2 within 0.351 0.315 0.419 0.091 0.377 0.367 0.444 0.089
R2 between 0.240 0.292 0.255 0.021 0.255 0.307 0.263 0.019
Number of banks 101 101 101 101 101 101 101 101
Fixed effects YES YES YES YES YES YES YES YES
Time dummies YES YES YES YES YES YES YES YES
Panel B
COMMERCIAL BANKS
Number of mobile money account (MMU) Value of mobile money transactions (MMT)
ROA ROE COST/INCOME Z-SCORE ROA ROE COST/INCOME Z-SCORE
(1) (2) (3) (4) (5) (6) (7) (8)
MM 0.649** 3.847 -14.158*** 0.967 0.295*** 1.927** -5.597*** 0.058 (0.312) (2.370) (4.890) (1.057) (0.101) (0.752) (1.582) (0.355)
SMALL -1.761 -44.035 22.239 20.668 -1.968 -32.187*** 33.816 4.610 (3.727) (28.315) (58.417) (12.624) (1.319) (9.773) (20.570) (4.620)
MM x SMALL 0.184 3.191* -2.608 -1.232 0.210** 2.666*** -3.490*** -0.287 (0.226) (1.720) (3.549) (0.767) (0.085) (0.633) (1.333) (0.299)
Total effect -1.577 -40.843 19.631 19.436* -1.758 -29.521*** 30.326 4.323 (3.502) (26.604) (54.887) (11.861) (1.237) (9.165) (19.290) (4.332) Controls included YES YES YES YES YES YES YES YES
Observations 372 372 372 372 366 366 366 366
R2 within 0.410 0.370 0.448 0.095 0.456 0.448 0.498 0.089
R2 between 0.292 0.359 0.275 0.018 0.319 0.387 0.288 0.013
Number of banks 82 82 82 82 82 82 82 82
Fixed effects YES YES YES YES YES YES YES YES
Time dummies YES YES YES YES YES YES YES YES
Note: Dependent variables: return on assets (ROA), return on equity (ROE), Cost to income ratio (COST/INCOME), and the sum of return on assets and equity ratio divided by the standard deviation of
return on assets (Z-SCORE). MM, mobile money, that stands alternatively for the number of accounts with a resident Mobile Money System Payment that is primarily accessed by a mobile phone and is useable or has been used for mobile money transactions (MMU), and the total amount of all mobile money transactions carried out (MMT). SMALL is a dummy variable that takes the value 1 if the bank
total assets are less than the median, and 0 otherwise. Robust standard errors are in brackets. Controls included: SIZE is the logarithm of total asset; LLP is the ratio of loan loss provision over total assets;
TL_TA is the ratio of total loans to total assets; ASSETS Growth is the growth rate of total assets; NII is the share of non-interest income over total operating income; OBS is the ratio of off-balance sheet over total assets; GDP Growth is the annual growth rate of gross domestic product; INFL is the annual growth rate of consumer price index. ***Significant at the 1% level, **Significant at the 5% level,
*Significant at the 10% level.
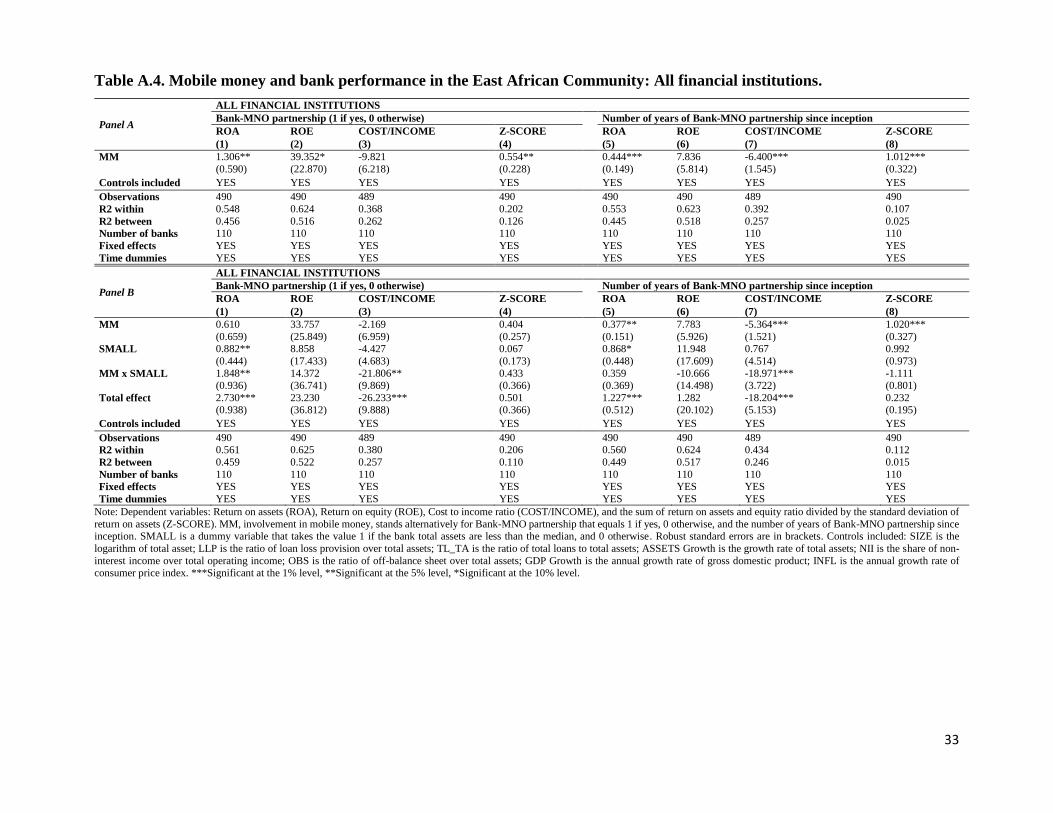
33
Table A.4. Mobile money and bank performance in the East African Community: All financial institutions.
Panel A
ALL FINANCIAL INSTITUTIONS
Bank-MNO partnership (1 if yes, 0 otherwise) Number of years of Bank-MNO partnership since inception
ROA ROE COST/INCOME Z-SCORE ROA ROE COST/INCOME Z-SCORE
(1) (2) (3) (4) (5) (6) (7) (8)
MM 1.306** 39.352* -9.821 0.554** 0.444*** 7.836 -6.400*** 1.012*** (0.590) (22.870) (6.218) (0.228) (0.149) (5.814) (1.545) (0.322) Controls included YES YES YES YES YES YES YES YES Observations 490 490 489 490 490 490 489 490
R2 within 0.548 0.624 0.368 0.202 0.553 0.623 0.392 0.107
R2 between 0.456 0.516 0.262 0.126 0.445 0.518 0.257 0.025
Number of banks 110 110 110 110 110 110 110 110
Fixed effects YES YES YES YES YES YES YES YES
Time dummies YES YES YES YES YES YES YES YES
Panel B
ALL FINANCIAL INSTITUTIONS
Bank-MNO partnership (1 if yes, 0 otherwise) Number of years of Bank-MNO partnership since inception
ROA ROE COST/INCOME Z-SCORE ROA ROE COST/INCOME Z-SCORE
(1) (2) (3) (4) (5) (6) (7) (8)
MM 0.610 33.757 -2.169 0.404 0.377** 7.783 -5.364*** 1.020*** (0.659) (25.849) (6.959) (0.257) (0.151) (5.926) (1.521) (0.327)
SMALL 0.882** 8.858 -4.427 0.067 0.868* 11.948 0.767 0.992 (0.444) (17.433) (4.683) (0.173) (0.448) (17.609) (4.514) (0.973)
MM x SMALL 1.848** 14.372 -21.806** 0.433 0.359 -10.666 -18.971*** -1.111 (0.936) (36.741) (9.869) (0.366) (0.369) (14.498) (3.722) (0.801)
Total effect 2.730*** 23.230 -26.233*** 0.501 1.227*** 1.282 -18.204*** 0.232 (0.938) (36.812) (9.888) (0.366) (0.512) (20.102) (5.153) (0.195) Controls included YES YES YES YES YES YES YES YES Observations 490 490 489 490 490 490 489 490
R2 within 0.561 0.625 0.380 0.206 0.560 0.624 0.434 0.112
R2 between 0.459 0.522 0.257 0.110 0.449 0.517 0.246 0.015
Number of banks 110 110 110 110 110 110 110 110
Fixed effects YES YES YES YES YES YES YES YES
Time dummies YES YES YES YES YES YES YES YES
Note: Dependent variables: Return on assets (ROA), Return on equity (ROE), Cost to income ratio (COST/INCOME), and the sum of return on assets and equity ratio divided by the standard deviation of
return on assets (Z-SCORE). MM, involvement in mobile money, stands alternatively for Bank-MNO partnership that equals 1 if yes, 0 otherwise, and the number of years of Bank-MNO partnership since inception. SMALL is a dummy variable that takes the value 1 if the bank total assets are less than the median, and 0 otherwise. Robust standard errors are in brackets. Controls included: SIZE is the
logarithm of total asset; LLP is the ratio of loan loss provision over total assets; TL_TA is the ratio of total loans to total assets; ASSETS Growth is the growth rate of total assets; NII is the share of non-
interest income over total operating income; OBS is the ratio of off-balance sheet over total assets; GDP Growth is the annual growth rate of gross domestic product; INFL is the annual growth rate of consumer price index. ***Significant at the 1% level, **Significant at the 5% level, *Significant at the 10% level.
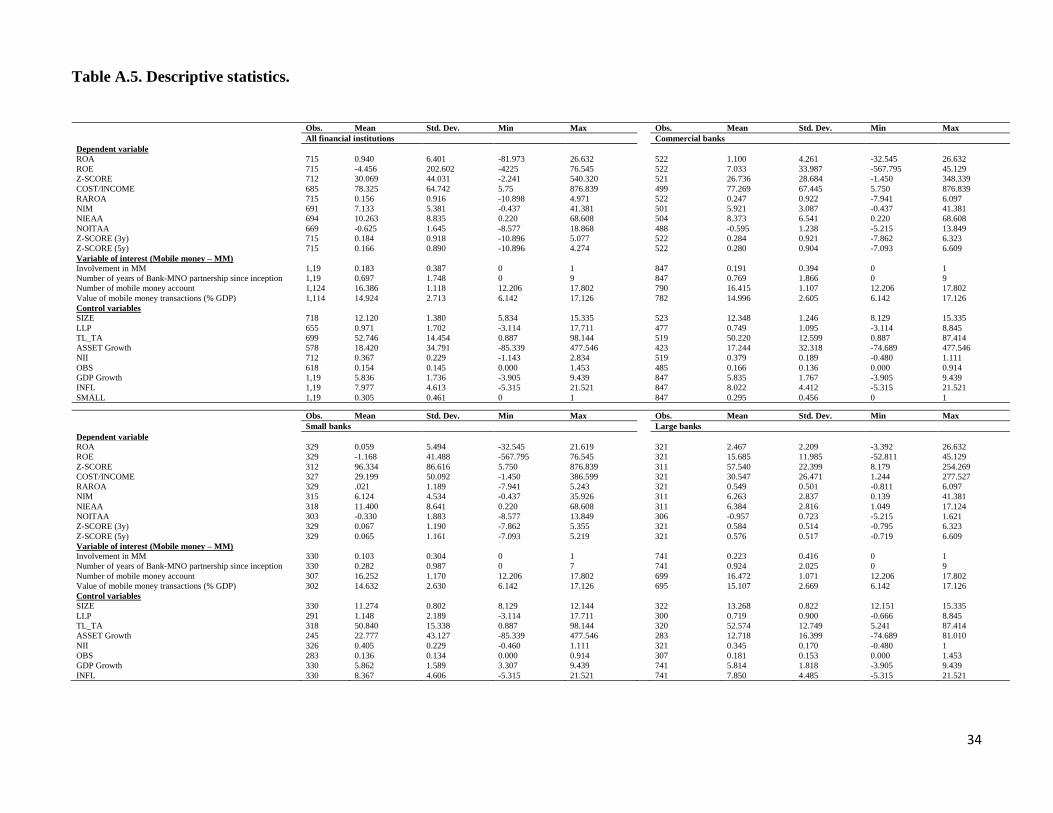
34
Table A.5. Descriptive statistics.
Obs. Mean Std. Dev. Min Max Obs. Mean Std. Dev. Min Max All financial institutions Commercial banks
Dependent variable
ROA 715 0.940 6.401 -81.973 26.632 522 1.100 4.261 -32.545 26.632
ROE 715 -4.456 202.602 -4225 76.545 522 7.033 33.987 -567.795 45.129
Z-SCORE 712 30.069 44.031 -2.241 540.320 521 26.736 28.684 -1.450 348.339
COST/INCOME 685 78.325 64.742 5.75 876.839 499 77.269 67.445 5.750 876.839
RAROA 715 0.156 0.916 -10.898 4.971 522 0.247 0.922 -7.941 6.097
NIM 691 7.133 5.381 -0.437 41.381 501 5.921 3.087 -0.437 41.381
NIEAA 694 10.263 8.835 0.220 68.608 504 8.373 6.541 0.220 68.608
NOITAA 669 -0.625 1.645 -8.577 18.868 488 -0.595 1.238 -5.215 13.849
Z-SCORE (3y) 715 0.184 0.918 -10.896 5.077 522 0.284 0.921 -7.862 6.323
Z-SCORE (5y) 715 0.166 0.890 -10.896 4.274 522 0.280 0.904 -7.093 6.609
Variable of interest (Mobile money – MM)
Involvement in MM 1,19 0.183 0.387 0 1 847 0.191 0.394 0 1
Number of years of Bank-MNO partnership since inception 1,19 0.697 1.748 0 9 847 0.769 1.866 0 9
Number of mobile money account 1,124 16.386 1.118 12.206 17.802 790 16.415 1.107 12.206 17.802
Value of mobile money transactions (% GDP) 1,114 14.924 2.713 6.142 17.126 782 14.996 2.605 6.142 17.126
Control variables
SIZE 718 12.120 1.380 5.834 15.335 523 12.348 1.246 8.129 15.335
LLP 655 0.971 1.702 -3.114 17.711 477 0.749 1.095 -3.114 8.845
TL_TA 699 52.746 14.454 0.887 98.144 519 50.220 12.599 0.887 87.414
ASSET Growth 578 18.420 34.791 -85.339 477.546 423 17.244 32.318 -74.689 477.546
NII 712 0.367 0.229 -1.143 2.834 519 0.379 0.189 -0.480 1.111
OBS 618 0.154 0.145 0.000 1.453 485 0.166 0.136 0.000 0.914
GDP Growth 1,19 5.836 1.736 -3.905 9.439 847 5.835 1.767 -3.905 9.439
INFL 1,19 7.977 4.613 -5.315 21.521 847 8.022 4.412 -5.315 21.521
SMALL 1,19 0.305 0.461 0 1 847 0.295 0.456 0 1
Obs. Mean Std. Dev. Min Max Obs. Mean Std. Dev. Min Max Small banks Large banks
Dependent variable
ROA 329 0.059 5.494 -32.545 21.619 321 2.467 2.209 -3.392 26.632
ROE 329 -1.168 41.488 -567.795 76.545 321 15.685 11.985 -52.811 45.129
Z-SCORE 312 96.334 86.616 5.750 876.839 311 57.540 22.399 8.179 254.269
COST/INCOME 327 29.199 50.092 -1.450 386.599 321 30.547 26.471 1.244 277.527
RAROA 329 .021 1.189 -7.941 5.243 321 0.549 0.501 -0.811 6.097
NIM 315 6.124 4.534 -0.437 35.926 311 6.263 2.837 0.139 41.381
NIEAA 318 11.400 8.641 0.220 68.608 311 6.384 2.816 1.049 17.124
NOITAA 303 -0.330 1.883 -8.577 13.849 306 -0.957 0.723 -5.215 1.621
Z-SCORE (3y) 329 0.067 1.190 -7.862 5.355 321 0.584 0.514 -0.795 6.323
Z-SCORE (5y) 329 0.065 1.161 -7.093 5.219 321 0.576 0.517 -0.719 6.609
Variable of interest (Mobile money – MM)
Involvement in MM 330 0.103 0.304 0 1 741 0.223 0.416 0 1
Number of years of Bank-MNO partnership since inception 330 0.282 0.987 0 7 741 0.924 2.025 0 9
Number of mobile money account 307 16.252 1.170 12.206 17.802 699 16.472 1.071 12.206 17.802
Value of mobile money transactions (% GDP) 302 14.632 2.630 6.142 17.126 695 15.107 2.669 6.142 17.126
Control variables
SIZE 330 11.274 0.802 8.129 12.144 322 13.268 0.822 12.151 15.335
LLP 291 1.148 2.189 -3.114 17.711 300 0.719 0.900 -0.666 8.845
TL_TA 318 50.840 15.338 0.887 98.144 320 52.574 12.749 5.241 87.414
ASSET Growth 245 22.777 43.127 -85.339 477.546 283 12.718 16.399 -74.689 81.010
NII 326 0.405 0.229 -0.460 1.111 321 0.345 0.170 -0.480 1
OBS 283 0.136 0.134 0.000 0.914 307 0.181 0.153 0.000 1.453
GDP Growth 330 5.862 1.589 3.307 9.439 741 5.814 1.818 -3.905 9.439
INFL 330 8.367 4.606 -5.315 21.521 741 7.850 4.485 -5.315 21.521
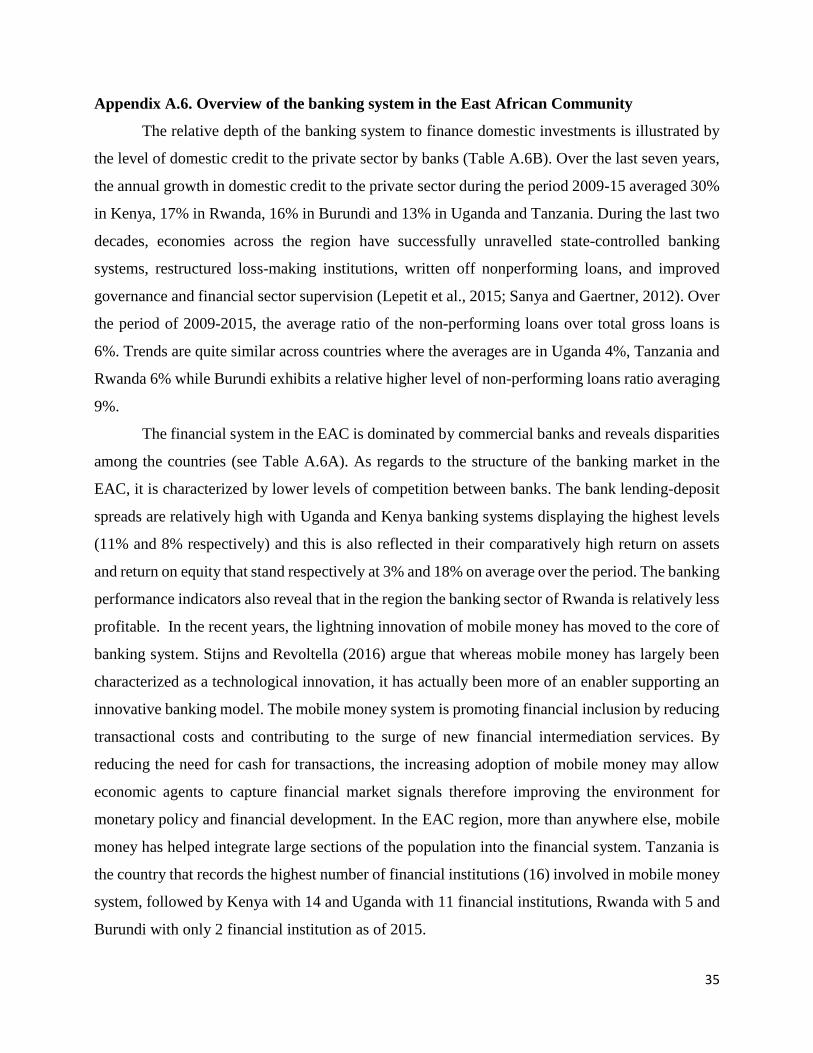
35
Appendix A.6. Overview of the banking system in the East African Community
The relative depth of the banking system to finance domestic investments is illustrated by
the level of domestic credit to the private sector by banks (Table A.6B). Over the last seven years,
the annual growth in domestic credit to the private sector during the period 2009-15 averaged 30%
in Kenya, 17% in Rwanda, 16% in Burundi and 13% in Uganda and Tanzania. During the last two
decades, economies across the region have successfully unravelled state-controlled banking
systems, restructured loss-making institutions, written off nonperforming loans, and improved
governance and financial sector supervision (Lepetit et al., 2015; Sanya and Gaertner, 2012). Over
the period of 2009-2015, the average ratio of the non-performing loans over total gross loans is
6%. Trends are quite similar across countries where the averages are in Uganda 4%, Tanzania and
Rwanda 6% while Burundi exhibits a relative higher level of non-performing loans ratio averaging
9%.
The financial system in the EAC is dominated by commercial banks and reveals disparities
among the countries (see Table A.6A). As regards to the structure of the banking market in the
EAC, it is characterized by lower levels of competition between banks. The bank lending-deposit
spreads are relatively high with Uganda and Kenya banking systems displaying the highest levels
(11% and 8% respectively) and this is also reflected in their comparatively high return on assets
and return on equity that stand respectively at 3% and 18% on average over the period. The banking
performance indicators also reveal that in the region the banking sector of Rwanda is relatively less
profitable. In the recent years, the lightning innovation of mobile money has moved to the core of
banking system. Stijns and Revoltella (2016) argue that whereas mobile money has largely been
characterized as a technological innovation, it has actually been more of an enabler supporting an
innovative banking model. The mobile money system is promoting financial inclusion by reducing
transactional costs and contributing to the surge of new financial intermediation services. By
reducing the need for cash for transactions, the increasing adoption of mobile money may allow
economic agents to capture financial market signals therefore improving the environment for
monetary policy and financial development. In the EAC region, more than anywhere else, mobile
money has helped integrate large sections of the population into the financial system. Tanzania is
the country that records the highest number of financial institutions (16) involved in mobile money
system, followed by Kenya with 14 and Uganda with 11 financial institutions, Rwanda with 5 and
Burundi with only 2 financial institution as of 2015.
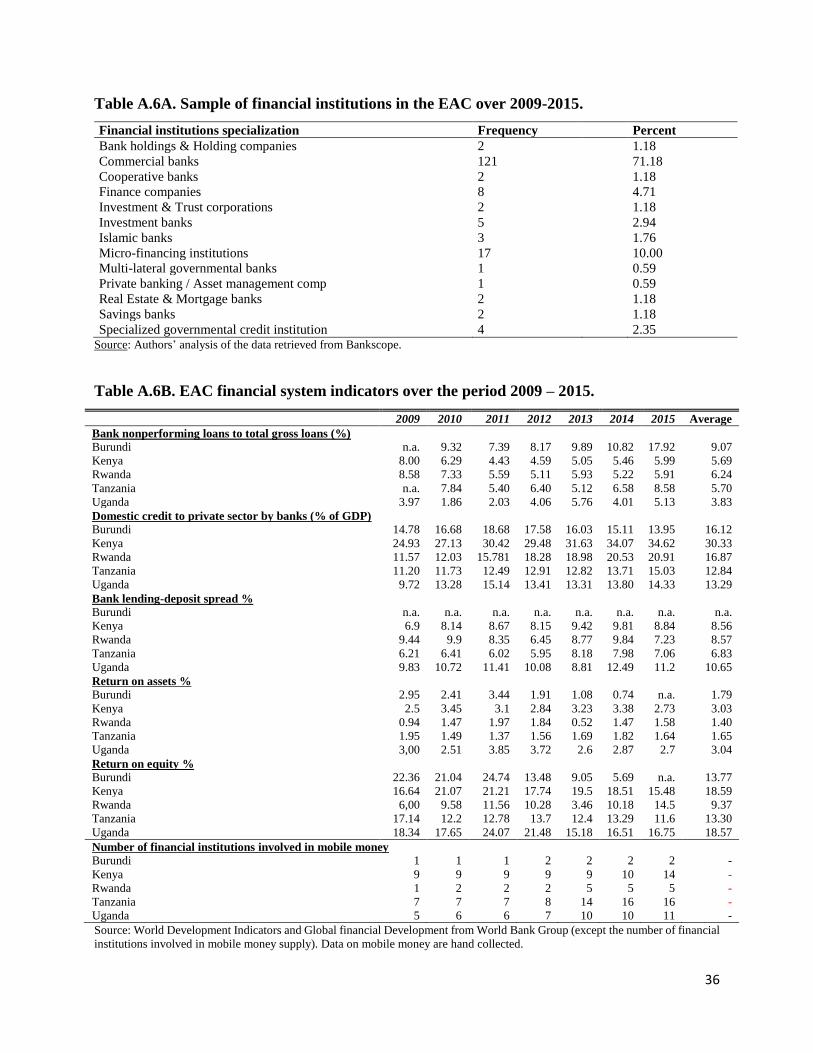
36
Table A.6A. Sample of financial institutions in the EAC over 2009-2015.
Financial institutions specialization Frequency Percent
Bank holdings & Holding companies 2
1.18
Commercial banks 121
71.18
Cooperative banks 2
1.18
Finance companies 8
4.71
Investment & Trust corporations 2
1.18
Investment banks 5
2.94
Islamic banks 3
1.76
Micro-financing institutions 17 10.00
Multi-lateral governmental banks 1
0.59
Private banking / Asset management comp 1
0.59
Real Estate & Mortgage banks 2
1.18
Savings banks 2
1.18
Specialized governmental credit institution 4 2.35 Source: Authors’ analysis of the data retrieved from Bankscope.
Table A.6B. EAC financial system indicators over the period 2009 – 2015.
2009 2010 2011 2012 2013 2014 2015 Average
Bank nonperforming loans to total gross loans (%)
Burundi n.a. 9.32 7.39 8.17 9.89 10.82 17.92 9.07
Kenya 8.00 6.29 4.43 4.59 5.05 5.46 5.99 5.69
Rwanda 8.58 7.33 5.59 5.11 5.93 5.22 5.91 6.24
Tanzania n.a. 7.84 5.40 6.40 5.12 6.58 8.58 5.70
Uganda 3.97 1.86 2.03 4.06 5.76 4.01 5.13 3.83
Domestic credit to private sector by banks (% of GDP)
Burundi 14.78 16.68 18.68 17.58 16.03 15.11 13.95 16.12
Kenya 24.93 27.13 30.42 29.48 31.63 34.07 34.62 30.33
Rwanda 11.57 12.03 15.781 18.28 18.98 20.53 20.91 16.87
Tanzania 11.20 11.73 12.49 12.91 12.82 13.71 15.03 12.84
Uganda 9.72 13.28 15.14 13.41 13.31 13.80 14.33 13.29
Bank lending-deposit spread %
Burundi n.a. n.a. n.a. n.a. n.a. n.a. n.a. n.a.
Kenya 6.9 8.14 8.67 8.15 9.42 9.81 8.84 8.56
Rwanda 9.44 9.9 8.35 6.45 8.77 9.84 7.23 8.57
Tanzania 6.21 6.41 6.02 5.95 8.18 7.98 7.06 6.83
Uganda 9.83 10.72 11.41 10.08 8.81 12.49 11.2 10.65
Return on assets %
Burundi 2.95 2.41 3.44 1.91 1.08 0.74 n.a. 1.79
Kenya 2.5 3.45 3.1 2.84 3.23 3.38 2.73 3.03
Rwanda 0.94 1.47 1.97 1.84 0.52 1.47 1.58 1.40
Tanzania 1.95 1.49 1.37 1.56 1.69 1.82 1.64 1.65
Uganda 3,00 2.51 3.85 3.72 2.6 2.87 2.7 3.04
Return on equity %
Burundi 22.36 21.04 24.74 13.48 9.05 5.69 n.a. 13.77
Kenya 16.64 21.07 21.21 17.74 19.5 18.51 15.48 18.59
Rwanda 6,00 9.58 11.56 10.28 3.46 10.18 14.5 9.37
Tanzania 17.14 12.2 12.78 13.7 12.4 13.29 11.6 13.30
Uganda 18.34 17.65 24.07 21.48 15.18 16.51 16.75 18.57
Number of financial institutions involved in mobile money Burundi 1 1 1 2 2 2 2 -
Kenya 9 9 9 9 9 10 14 -
Rwanda 1 2 2 2 5 5 5 -
Tanzania 7 7 7 8 14 16 16 -
Uganda 5 6 6 7 10 10 11 -
Source: World Development Indicators and Global financial Development from World Bank Group (except the number of financial
institutions involved in mobile money supply). Data on mobile money are hand collected.
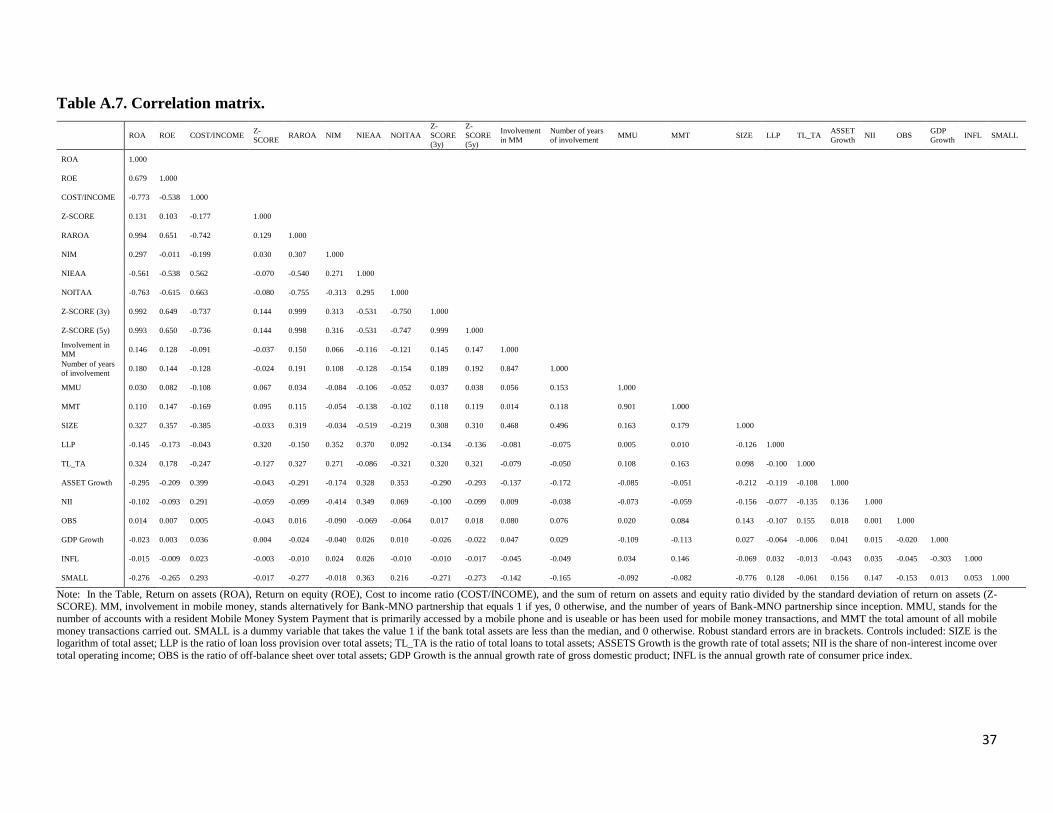
37
Table A.7. Correlation matrix.
ROA ROE COST/INCOME Z-
SCORE RAROA NIM NIEAA NOITAA
Z-
SCORE
(3y)
Z-
SCORE
(5y)
Involvement
in MM
Number of years
of involvement MMU MMT SIZE LLP TL_TA
ASSET
Growth NII OBS
GDP
Growth INFL SMALL
ROA 1.000
ROE 0.679 1.000
COST/INCOME -0.773 -0.538 1.000
Z-SCORE 0.131 0.103 -0.177 1.000
RAROA 0.994 0.651 -0.742 0.129 1.000
NIM 0.297 -0.011 -0.199 0.030 0.307 1.000
NIEAA -0.561 -0.538 0.562 -0.070 -0.540 0.271 1.000
NOITAA -0.763 -0.615 0.663 -0.080 -0.755 -0.313 0.295 1.000
Z-SCORE (3y) 0.992 0.649 -0.737 0.144 0.999 0.313 -0.531 -0.750 1.000
Z-SCORE (5y) 0.993 0.650 -0.736 0.144 0.998 0.316 -0.531 -0.747 0.999 1.000
Involvement in
MM 0.146 0.128 -0.091 -0.037 0.150 0.066 -0.116 -0.121 0.145 0.147 1.000
Number of years
of involvement 0.180 0.144 -0.128 -0.024 0.191 0.108 -0.128 -0.154 0.189 0.192 0.847 1.000
MMU 0.030 0.082 -0.108 0.067 0.034 -0.084 -0.106 -0.052 0.037 0.038 0.056 0.153 1.000
MMT 0.110 0.147 -0.169 0.095 0.115 -0.054 -0.138 -0.102 0.118 0.119 0.014 0.118 0.901 1.000
SIZE 0.327 0.357 -0.385 -0.033 0.319 -0.034 -0.519 -0.219 0.308 0.310 0.468 0.496 0.163 0.179 1.000
LLP -0.145 -0.173 -0.043 0.320 -0.150 0.352 0.370 0.092 -0.134 -0.136 -0.081 -0.075 0.005 0.010 -0.126 1.000
TL_TA 0.324 0.178 -0.247 -0.127 0.327 0.271 -0.086 -0.321 0.320 0.321 -0.079 -0.050 0.108 0.163 0.098 -0.100 1.000
ASSET Growth -0.295 -0.209 0.399 -0.043 -0.291 -0.174 0.328 0.353 -0.290 -0.293 -0.137 -0.172 -0.085 -0.051 -0.212 -0.119 -0.108 1.000
NII -0.102 -0.093 0.291 -0.059 -0.099 -0.414 0.349 0.069 -0.100 -0.099 0.009 -0.038 -0.073 -0.059 -0.156 -0.077 -0.135 0.136 1.000
OBS 0.014 0.007 0.005 -0.043 0.016 -0.090 -0.069 -0.064 0.017 0.018 0.080 0.076 0.020 0.084 0.143 -0.107 0.155 0.018 0.001 1.000
GDP Growth -0.023 0.003 0.036 0.004 -0.024 -0.040 0.026 0.010 -0.026 -0.022 0.047 0.029 -0.109 -0.113 0.027 -0.064 -0.006 0.041 0.015 -0.020 1.000
INFL -0.015 -0.009 0.023 -0.003 -0.010 0.024 0.026 -0.010 -0.010 -0.017 -0.045 -0.049 0.034 0.146 -0.069 0.032 -0.013 -0.043 0.035 -0.045 -0.303 1.000
SMALL -0.276 -0.265 0.293 -0.017 -0.277 -0.018 0.363 0.216 -0.271 -0.273 -0.142 -0.165 -0.092 -0.082 -0.776 0.128 -0.061 0.156 0.147 -0.153 0.013 0.053 1.000
Note: In the Table, Return on assets (ROA), Return on equity (ROE), Cost to income ratio (COST/INCOME), and the sum of return on assets and equity ratio divided by the standard deviation of return on assets (Z-SCORE). MM, involvement in mobile money, stands alternatively for Bank-MNO partnership that equals 1 if yes, 0 otherwise, and the number of years of Bank-MNO partnership since inception. MMU, stands for the
number of accounts with a resident Mobile Money System Payment that is primarily accessed by a mobile phone and is useable or has been used for mobile money transactions, and MMT the total amount of all mobile
money transactions carried out. SMALL is a dummy variable that takes the value 1 if the bank total assets are less than the median, and 0 otherwise. Robust standard errors are in brackets. Controls included: SIZE is the logarithm of total asset; LLP is the ratio of loan loss provision over total assets; TL_TA is the ratio of total loans to total assets; ASSETS Growth is the growth rate of total assets; NII is the share of non-interest income over
total operating income; OBS is the ratio of off-balance sheet over total assets; GDP Growth is the annual growth rate of gross domestic product; INFL is the annual growth rate of consumer price index.
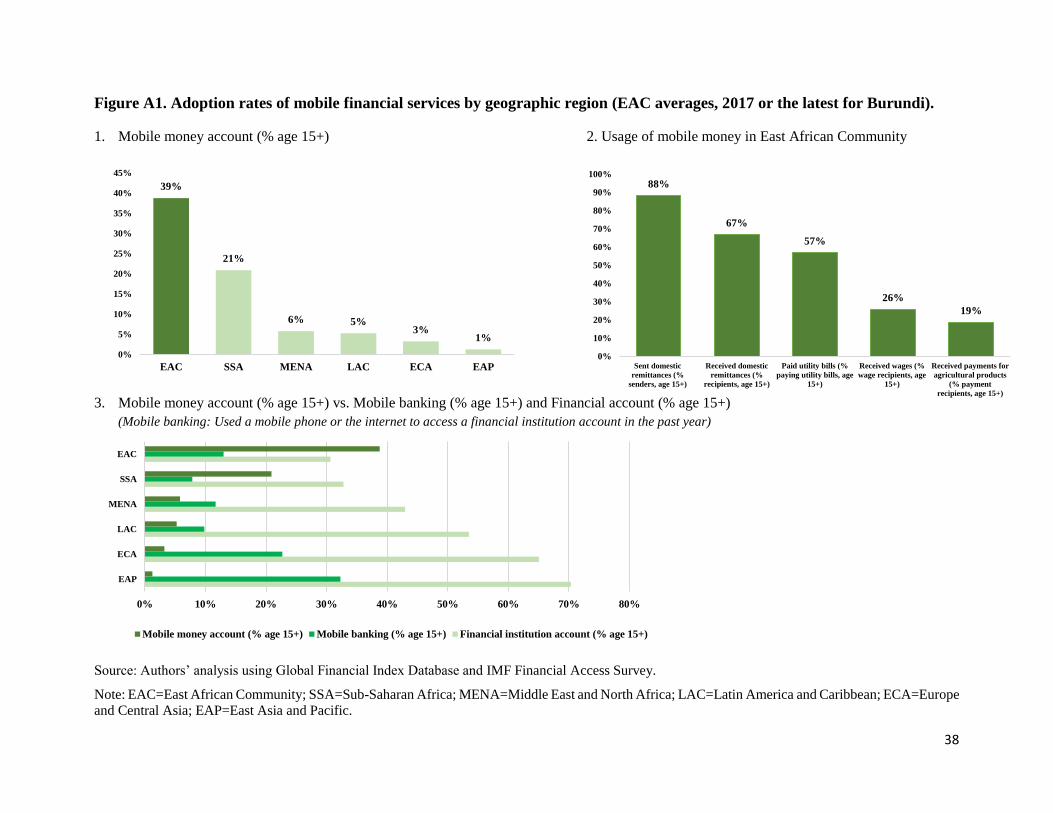
38
39%
21%
6% 5%3%
1%
0%
5%
10%
15%
20%
25%
30%
35%
40%
45%
EAC SSA MENA LAC ECA EAP
0% 10% 20% 30% 40% 50% 60% 70% 80%
EAP
ECA
LAC
MENA
SSA
EAC
Mobile money account (% age 15+) Mobile banking (% age 15+) Financial institution account (% age 15+)
88%
67%
57%
26%
19%
0%
10%
20%
30%
40%
50%
60%
70%
80%
90%
100%
Sent domestic
remittances (%
senders, age 15+)
Received domestic
remittances (%
recipients, age 15+)
Paid utility bills (%
paying utility bills, age
15+)
Received wages (%
wage recipients, age
15+)
Received payments for
agricultural products
(% payment
recipients, age 15+)
Figure A1. Adoption rates of mobile financial services by geographic region (EAC averages, 2017 or the latest for Burundi).
1. Mobile money account (% age 15+) 2. Usage of mobile money in East African Community
3. Mobile money account (% age 15+) vs. Mobile banking (% age 15+) and Financial account (% age 15+)
(Mobile banking: Used a mobile phone or the internet to access a financial institution account in the past year)
Source: Authors’ analysis using Global Financial Index Database and IMF Financial Access Survey.
Note: EAC=East African Community; SSA=Sub-Saharan Africa; MENA=Middle East and North Africa; LAC=Latin America and Caribbean; ECA=Europe
and Central Asia; EAP=East Asia and Pacific.