Embed Size (px)
Citation preview

1
Is Growing Oranges in Florida a Good Investment?
Carlos J. O. Trejo-Pech Assistant Professor, Agricultural and Resource Economics Department, University of Tennessee
at Knoxville, TN. And
Adjunct Professor, Universidad Panamericana. Escuela de Ciencias Económicas y Empresariales. Zapopan, Jalisco, México.
Thomas H. Spreen Professor Emeritus, Food and Resource Economics Department, University of Florida,
Gainesville, FL. [email protected]
Marisa L. Zansler Director, Economic and Marketing Research, Florida Department of Citrus, Gainesville, FL.
Invited paper prepared for presentation at the 2017 Agricultural & Applied Economics Association Annual Meeting, Chicago, IL. July 30-August 1st, 2017.
Copyright 2017 by Carlos J.O. Trejo-Pech, Thomas H. Spreen, and Marisa L. Zansler. All rights reserved. Readers may make verbatim copies of this document for non-commercial purposes by any means, provided that this copyright notice appears on all such copies.

2
Is Growing Oranges in Florida a Good Investment?
Abstract
We provide a financial model to evaluate an orange grove investment in Florida, the producing
region supplying around 90% of U.S. domestic production of orange juice. A representative
orange grower planting early-mid varieties for the processed market is featured in the case. The
study assumes that an existing grove has been disease-infested to a degree that there is little, if
any economic value in maintaining it. The grower is left with the choice to replant the grove or to
convert the land to other uses. The replanting baseline model yields a 9.5% Modified Internal
Rate of Return (MIRR) and the Monte Carlo simulation shows that MIRR is equal or higher than
the 7.5% hurdle rate around 79% times the model is simulated. The risk of managing an orange
grove is higher than a decade ago mainly due to the presence of huanglongbing (HLB), a disease
that reduces yields and degrades fruit quality, causing variability in productivity and operating
costs. Opportunities include new guidelines for packaged foods labels, becoming effective in 2018,
which may increase the demand of orange juice. In addition, growers may benefit from planting
incentive programs implemented by both the government and major citrus processors and from
policy changes such as the possibility of changes in depreciation of new investment for income tax
purposes. Readers of this case study are expected to challenge the assumptions of the financial
model and consider additional elements of risk and opportunities on their assessment of the
potential orange grove investment.
Keywords: Agribusiness finance, Capital budgeting, Investment valuation, Simulation, Orange,
Citrus greening.

3
Is Growing Oranges in Florida a Good Investment?
By 2017, after several years of declining supply of oranges and high prices, replanting a grove
with significant or total devastation by diseases could represent an opportunity for growers in
Florida to meet the demand for processed oranges. The State of Florida supplies around 90% of
U.S. domestic production of orange juice. The risk of managing an orange grove, however, is
higher than a decade ago mainly due to the presence of huanglongbing (HLB, also known as citrus
greening), a disease that reduces yields and degrades fruit quality. This case study provides a
capital budgeting model to evaluate a potential orange grove investment.
Due mainly to HLB, orange production in the State of Florida has decreased every year
since the 2011-12 crop season. Total orange production in the 2015-16 season,1 at 81.7 million
90-pound boxes, was approximately one-third of production relative to the 2003-04 season, prior
to HLB. Research efforts to mitigate the negative effects of HLB are underway on several fronts,
but the disease is still a real threat for this industry.2 Furthermore, according to the Commercial
Citrus Tree Inventory by the USDA’s National Agricultural Statistics Service (NASS), new
plantings have been less than tree removals over the past ten seasons, leading to a slow decline in
the bearing tree inventory. The economic impact of HLB was estimated to be $4.393 billion over
the period 2012-13 to 2015-16, causing the loss of at least 7,945 jobs (Court et al. 2017). Similarly,
Farnsworth et al. (2014) estimated the impact of HLB slightly over $1 billion during the 2012-13
season. The challenge for both public and private entities has been, in recent years, to develop
programs that incentivize new tree planting despite the production risks posed by HLB. Efforts to
better understand the financials behind a grove investment, such as this study, may help decision
makers in this industry.

4
We next describe a typical orange grove investment and present results for a baseline
model. This is followed by a description of risks and opportunities. HLB constitutes the main
source of risk, causing variability in productivity and operating costs. Opportunities include new
guidelines for packaged foods labels, becoming effective in 2018, which may increase the demand
of 100% orange juice by providing the consumer with more information on the nutritional content
of 100% juices. In addition, growers may benefit from planting incentive programs implemented
by both the government and major citrus processors and from policy changes such as the possibility
of changes in depreciation of new investment for income tax purposes. Recent improvements in
citriculture practices may also benefit orange producers. A concluding remarks section ends this
study. Readers of the case are expected to challenge the assumptions of the model and consider
additional elements of risk and opportunities on their assessment of the potential orange grove
investment.
Assumptions for a grove investment model
This study assumes that a grove is HLB-infested to a degree that there is little, if any economic
value in maintaining it. The grower is left with the choice to replant the grove or to convert the
land to other uses. Replanting implies: a) invest capital to reestablish the grove (establishment),
b) maintain the young trees until they become productive at about three to four years old (early
caretaking), c) perform cultural activities to keep the grove productive (caretaking and reset), d)
harvest and transport the fruit to the processing facility (harvest and haul), and e) sell the fruit
(selling). Citriculture practices and cost structures presented in this case do not apply to every
grower or situation, but are representative of a typical, medium-size grove. Practices and costs are
based on research experiments or surveys to growers and suppliers conducted by personnel from
the University of Florida’s Institute of Food and Agricultural Sciences (UF-IFAS), an institution

5
covering extension and research efforts on the citrus industry. The case focuses on a grower
planting early-mid varieties for the processed market in Southwest Florida.3
Establishment and early caretaking
Reestablishing a grove begins with the removal of existing trees and cleanup of the area.4 Land
preparation follows tree removal. The acquisition and installation of an irrigation system is also
part of the initial investment. Planting cost involves both the cost per tree and number of trees to
plant and the cost of planting,5 staking and watering the young trees. Table 1 provides investment
per acre at “Year 0”, replanting time, assuming a planting density of 225 trees per acre. Planting
density is a relevant decision for a grove investment as will be discussed later in this study. Most
existing groves in Florida are planted at 145-150 trees per acre while some new plantings are at
220-225 trees. Densities equal or higher than 300 trees qualify as Advanced Production System
(APS). APS is an experiment started in 2009 by a research team at UF-IFAS envisioned to help
the industry to survive HLB and remain competitive by testing innovative horticulture practices.
APS not only involves higher densities, is a technology that included a switch away from micro
sprinkler to computer controlled drip irrigation which also includes fertigation through the
irrigation system. This is an important feature of APS which promotes early maturation of the
young trees, meaning more fruit early in tree life thus reducing the payback period of an
investment. A detailed explanation of APS is provided in the “horticultural practices and planting
density” section.
Early caretaking activities, including weed control, foliar spray, fertilizer application,
sprouting, and irrigation, are conducted during the first 3 years while trees are young and
unproductive (table 1). Supervision, overhead, and disease related effort costs are part of
maintaining a grove. An example of disease-related efforts is the Citrus Health Management Areas
6
(CHMA) program, which coordinates neighboring citrus growers to work together to combat the
Asian citrus psyllid, the vector that spreads HLB. While some early caretaking activities may
occur immediately after planting, it is assumed that all costs accrue by the end of the year, as is
standard in capital budgeting. At the end of 2016, under Internal Revenue Service (IRS) rules total
establishment and early caretaking costs are depreciated using a 10-year straight-line depreciation
schedule, with the first depreciation expense reported in the income statement only when the grove
becomes productive, generally in the fourth year after planting.
Caretaking
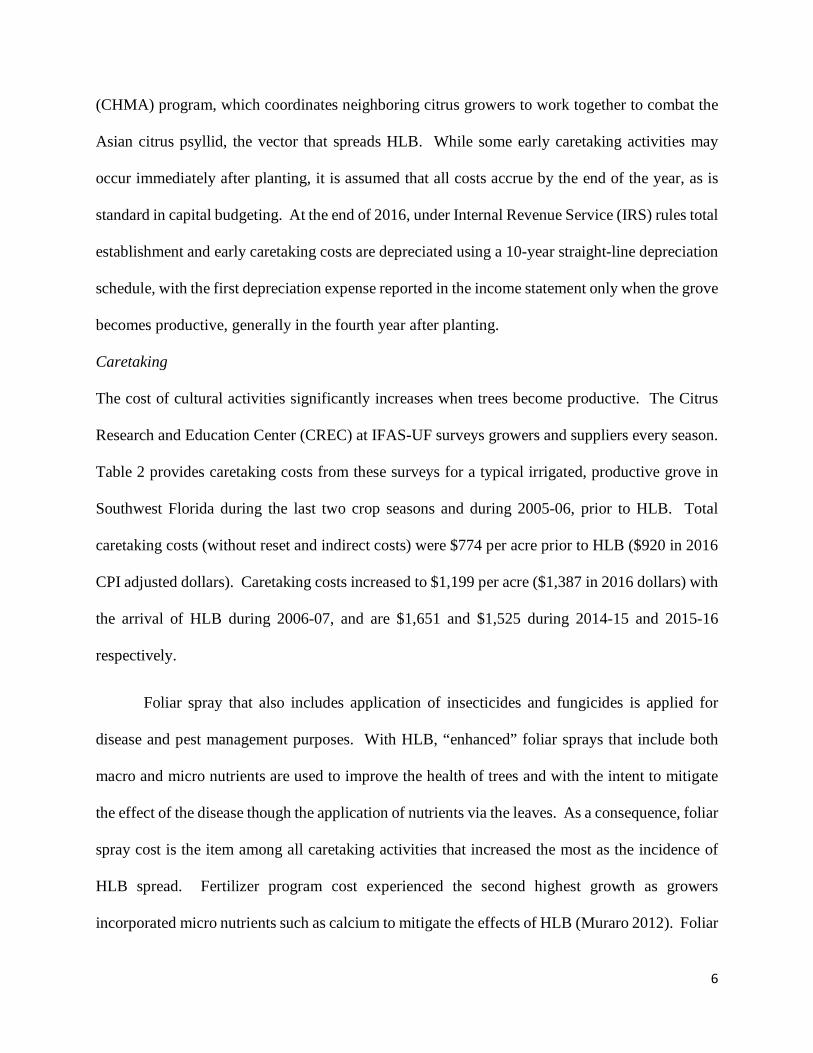
The cost of cultural activities significantly increases when trees become productive. The Citrus
Research and Education Center (CREC) at IFAS-UF surveys growers and suppliers every season.
Table 2 provides caretaking costs from these surveys for a typical irrigated, productive grove in
Southwest Florida during the last two crop seasons and during 2005-06, prior to HLB. Total
caretaking costs (without reset and indirect costs) were $774 per acre prior to HLB ($920 in 2016
CPI adjusted dollars). Caretaking costs increased to $1,199 per acre ($1,387 in 2016 dollars) with
the arrival of HLB during 2006-07, and are $1,651 and $1,525 during 2014-15 and 2015-16
respectively.
Foliar spray that also includes application of insecticides and fungicides is applied for
disease and pest management purposes. With HLB, “enhanced” foliar sprays that include both
macro and micro nutrients are used to improve the health of trees and with the intent to mitigate
the effect of the disease though the application of nutrients via the leaves. As a consequence, foliar
spray cost is the item among all caretaking activities that increased the most as the incidence of
HLB spread. Fertilizer program cost experienced the second highest growth as growers
incorporated micro nutrients such as calcium to mitigate the effects of HLB (Muraro 2012). Foliar

7
spray and fertilizer together represented around 70% of caretaking costs in the two most recent
seasons. Furthermore, these costs vary significantly among growers, as groves may face HLB
severity differently. Singerman (2015) reports the volatility of those costs across respondents:
standard deviation for foliar spray is $199 and $333 for fertilizer program. Other costs, in table 2,
have remained similar over the years.
Reset
Once the replant decision is made, the grower may replace diseased, damaged or unproductive
trees in the reestablished grove to keep the level of trees at the original planting density; practice
known as reset. Resetting is more critical during epidemic diseases because it contributes to
suppression of the vector of the disease by partially cleaning the grove on a continuous basis. The
trade-off is the cost of this activity, the time lag between planting time and production, and the
higher susceptibility of young trees to HLB. Currently, the common practice in Southwest Florida
is to reset. A study prior to HLB demonstrates that resetting was more profitable for a grove
diseased by the citrus tristeza virus (Muraro, Roka, and Stansly 1999) compared to other
alternatives such as doing nothing and continue cultivating for several years before deciding to
replant the entire grove. Table 2 provides resetting costs. During 2015-16, resetting costs $42.90
per tree. Tree removal, site preparation, and planting (including trees) cost $17.50 while
supplemental caretaking for years 1 through 3, the unproductive life, cost $25.40, or $8.46
($25.40/3) per tree / year. Growers reset, on average, 9 trees per acre, which implies a tree loss
rate in the range of 4% to 6% for planting densities from 150 to 225 plants per acre. Morris,
Muraro, and Castle (2011) state that loss rates can be kept low by employing the standard HLB
management protocol from the start at replanting time rather than later when infection rates could

8
get out of control. They estimate 5% loss rate for a replanted grove, 2% due to HLB and 3% due
to other causes.
Harvesting and Hauling
Early-mid varieties of oranges in Florida are typically harvested between late November and
February. Oranges are mostly hand-picked, with only a small portion of total acreage harvested
mechanically. Picked fruits are placed in field bins and then loaded into trailers. Fruits in trailers
are then transported to the processing plant. Table 3 provides harvesting and hauling costs for
selected seasons. During 2015-16, average harvesting cost increased 23% relative to the previous
season, from $1.990 to $2.440 per box. Singerman, Burani-Arouca, and Futch (2016) suggest this
jump is partially due to a more severe HLB attack, which causes trees to produce smaller fruits,
reducing harvesting efficiency. (Labor cost has also increased as growers rely on foreign workers,
and harvesting under HLB has become more arduous.) The correlation between tree productivity
and harvesting cost is negative. The eventual mitigation of the effects of HLB and consequently
increase of productivity may reduce harvesting costs. Mechanical harvesting would likely also
decrease costs. However, mechanical harvesting is less likely in the mid-term while HLB prevails
in the region (Moseley, House, and Roka 2012). Table 3 also provides hauling costs according to
the distance between the grove and the processing plant.
Prices and Yields
Prices and yields constitute a major source of uncertainty for the grower. Oranges are intentionally
produced either for juice processing or for fresh consumption (generally, costs are higher to
produce for the fresh market). According to the Florida Department of Citrus (FDOC),
approximately 96% of Florida orange production is currently utilized for juice processing. Some
growers enter into fixed-price contracts with processors, but many orange producers in Florida

9
participate in a pool, meaning that they receive the average price of the pool of producers. Table
4 provides weekly prices paid to pooled growers during the 2014-15 and 2015-16 seasons in dollars
per pound solids for early-mid varieties in Florida.
Yields are determined by climate, management practices, and to a great extent by the
degree of HLB infestation in a grove. HLB degrades the fruit reducing both quantity and quality,
expressed in number of boxes per tree and total pounds solids per box (juice yield) respectively.
Staff from the Florida Department of Agriculture and Consumer Services (FDACS) measure the
juice content of per fruit delivered to processors. Average yields are made public by the State on
a weekly basis through the harvesting season. Table 4 provides pooled grower averages of pounds
solids per box during the two most recent seasons.
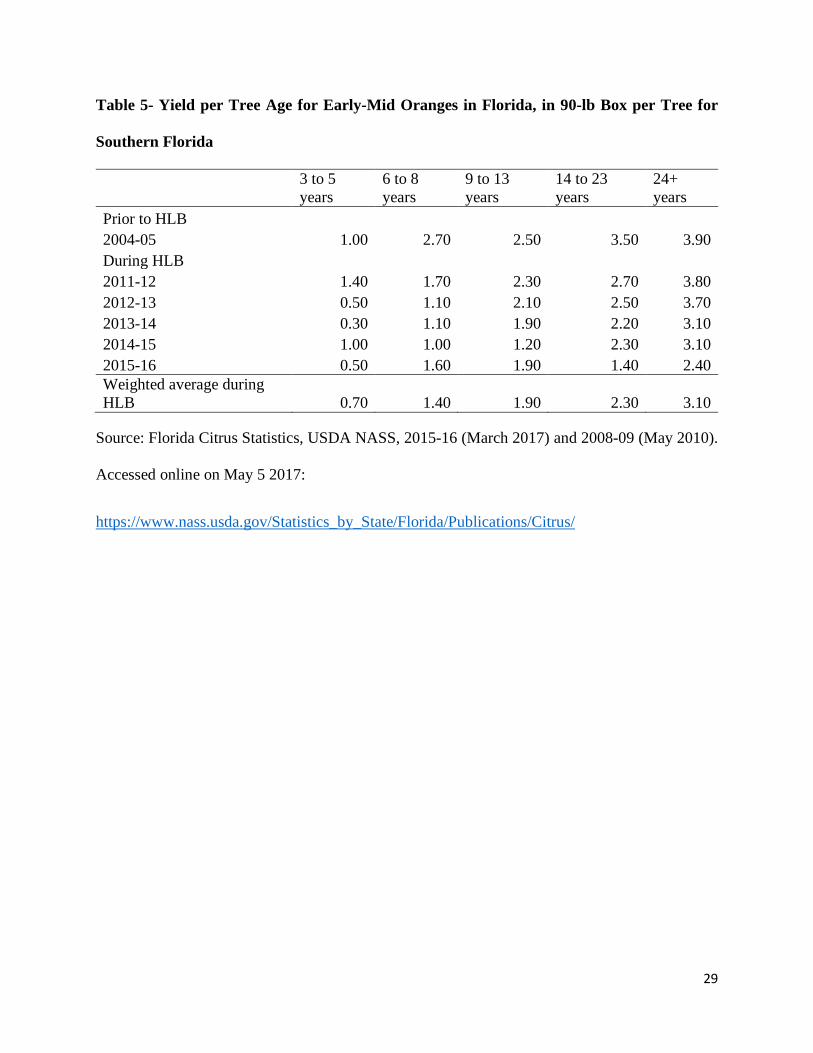
Yields also depend upon the age of trees. Table 5 provides production per tree estimation
by the Florida Agricultural Statistics Service, USDA-FASS, during the last two seasons. Fruit and
juice yield estimates are based on surveys conducted by this agency between August and harvest
and using the number of bearing trees in the Commercial Citrus Inventory. Since estimates are
according to field surveys, yields in table 5 are presumably tilted towards groves managed under
conventional horticulture practices and infected by HLB. Singerman and Useche (2016) surveyed
growers covering around 30% of total citrus acreage in Florida, and found that 57% reported that
at least one tree in every single acre of their groves was HLB-infected and fruit yields have been
reduced about 40% due to the effects of HLB.
Baseline model results
We put together assumptions from the previous section in a capital budgeting model. Table 6
gives projected free cash flows (FCFs) for the grove investment in dollars per acre.6 Initial
investment is from table 1. Irrigation cost in table 1 is estimated in $1,093 per acre for a new

10
grove. When reestablishing the grove, a grower can reuse part of the irrigation infrastructure, but
the pipes and emitters would have been destroyed and would need replacement, this is estimated
to cost $400 per acre as in Spreen and Zansler (2016). Revenues depend upon volume (number of
productive trees; number of boxes per tree, table 5; and the mean of weekly juice yields, table 4)
and price (mean of weekly prices, table 4). The number of productive trees for any given year
depends on the mortality rate. This baseline model assumes a flat 5% tree loss rate, as discussed
previously for a grove following standard HLB management protocol. This assumes that every
year 5% of the total trees die and are replaced by resetting. Considering a 225 planting density,
after the end of the first year around 11 trees are replaced (figures rounded), leaving 214 one year
old trees and 11 recently planted. By the fourth year, when the grove becomes productive, only
183 are 4 years old (183.3, in table 6), with small groups of three-, two-, one-year old and recent
planted trees. Since the mortality rate and density planting are kept constant over time, beginning
year 4 we have the same number of productive trees every single year. Operating (caretaking,
resetting, harvesting and hauling) and indirect costs are the average of the two most recent seasons.
We assume an average of 50 miles as the distance from the grove to the processor.
Resetting increases costs and potentially reduces total volume as some infested trees that
might continue producing are replaced with unproductive young trees. Resetting is advisable
though since it increases the life expectancy of the grove. For valuation purposes, resetting gives
a “perpetual” life to a citrus grove (Singerman, Burani-Arouca, Futch 2016; Morris, Muraro, and
Castle 2011). When valuing a project on perpetuity it is customary to project free cash flows over
a foreseeable horizon (up to year T), and then estimate a terminal value that reflects the present
value of all FCFs occurring thereafter (PVT). A common and convenient approach to estimate the
terminal value is to use the constant growth model, which assumes that the FCFs grow at a constant
11
growth rate, g, beyond T, known as the steady-stage period. Terminal value (in present value
terms, PVT) is estimated by applying the equation: PVT = FCFT+1 / (CC-g), where CC is the
opportunity cost of capital (this equation is the reduced form of an infinite series of FCFs growing
at g, and discounted at CC; refer to Schill 2013).
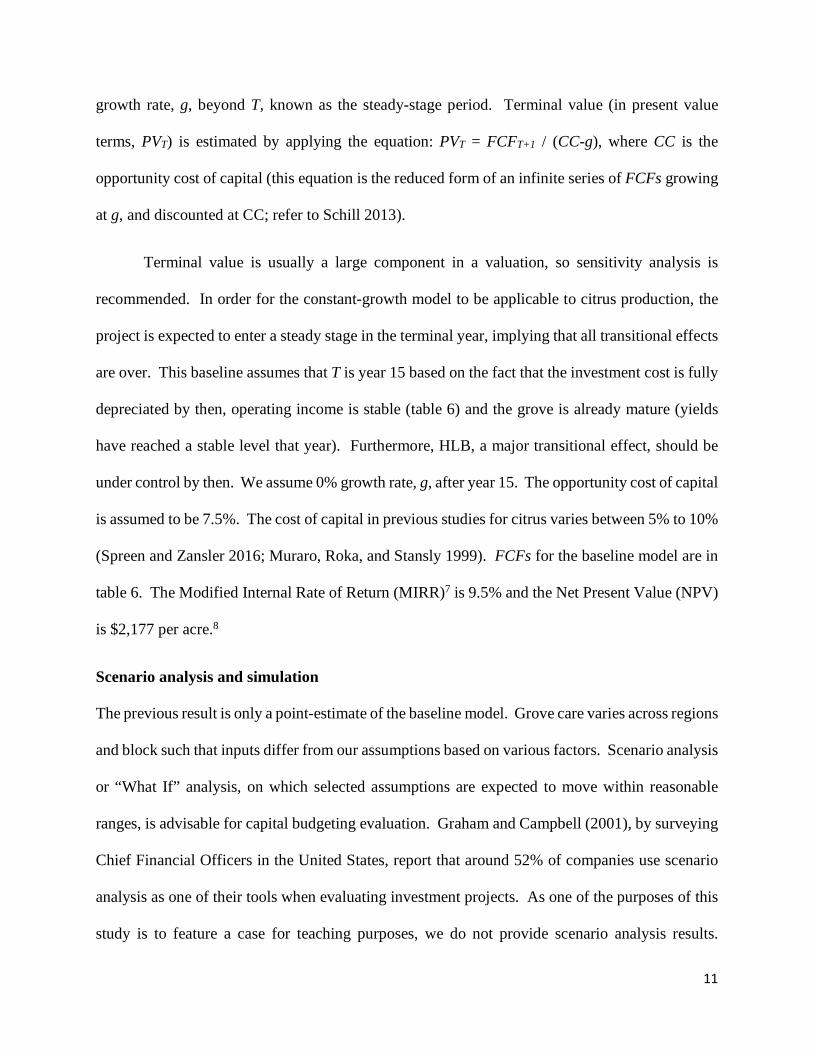
Terminal value is usually a large component in a valuation, so sensitivity analysis is
recommended. In order for the constant-growth model to be applicable to citrus production, the
project is expected to enter a steady stage in the terminal year, implying that all transitional effects
are over. This baseline assumes that T is year 15 based on the fact that the investment cost is fully
depreciated by then, operating income is stable (table 6) and the grove is already mature (yields
have reached a stable level that year). Furthermore, HLB, a major transitional effect, should be
under control by then. We assume 0% growth rate, g, after year 15. The opportunity cost of capital
is assumed to be 7.5%. The cost of capital in previous studies for citrus varies between 5% to 10%
(Spreen and Zansler 2016; Muraro, Roka, and Stansly 1999). FCFs for the baseline model are in
table 6. The Modified Internal Rate of Return (MIRR)7 is 9.5% and the Net Present Value (NPV)
is $2,177 per acre.8
Scenario analysis and simulation
The previous result is only a point-estimate of the baseline model. Grove care varies across regions
and block such that inputs differ from our assumptions based on various factors. Scenario analysis
or “What If” analysis, on which selected assumptions are expected to move within reasonable
ranges, is advisable for capital budgeting evaluation. Graham and Campbell (2001), by surveying
Chief Financial Officers in the United States, report that around 52% of companies use scenario
analysis as one of their tools when evaluating investment projects. As one of the purposes of this
study is to feature a case for teaching purposes, we do not provide scenario analysis results.

12
Students are expected to perform this analysis by incorporating different elements of risks and
opportunities in the sector (description below). The baseline model result could be considered as
a “most likely” scenario, on which the level of HLB severity continues as it is, in the near future.
Scenarios on which HLB improves and worsens could be considered. Scenario analysis results
could be contrasted and complemented with simulation results.
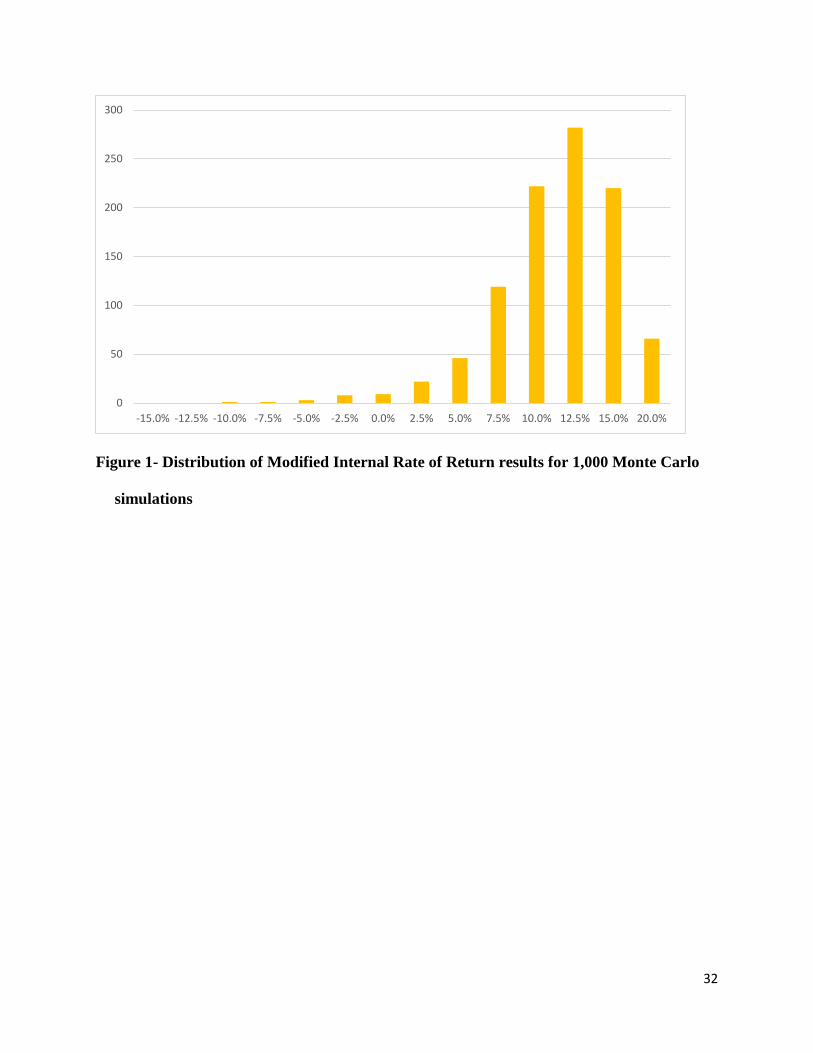
Simulation can be performed to incorporate simultaneous changes in assumptions that,
presumably, follow a determined statistical distribution. Figure 1 provides an example of Monte
Carlo simulation with the assumptions described next. Students are expected to challenge and
discuss these assumptions. Juice quality (e.g., pounds solids per box) and prices are assumed to
follow a normal distribution with a mean and standard deviation according to data of the two most
recent seasons. Similarly, spray and fertilizer costs, which together account for 70% of caretaking
costs, follow a normal distribution. Tree loss rate is assumed to vary uniformly between 2% and
6%. Harvesting cost vary uniformly with minimum and maximum values during the last two
seasons, in table 3. Finally, expedited depreciation (more below) has 50% chance to be approved
for use in citrus. Figure 1 shows the distribution of MIRRs when 1,000 simulations are run. MIRR
is equal or higher than the hurdle rate of 7.5%, around 79% times the model is simulated.
Risk and opportunities
The quantitative analysis could be complemented by incorporating elements of risks and
opportunities in citrus, featured in this section.
HLB
In Florida, HLB is caused by the bacterium Candidatus Liberibacter asiaticus, transmitted by
Diaphorina citri, an insect known as the Asiatic citrus psyllid (the vector, hereafter).9 Vectors
retain the pathogen for life following 15 to 30 minutes access feeding on a diseased plant, and

13
transmit it to other plants after feeding for as little as 15 minutes (low likelihood of transmission)
or for one hour or more (Mead and Fasulo 2014). The bacterium causes root dysfunction, and
infected oranges generally present an irregular pattern of leaf chlorosis and scattered spots of
green. Effects of HLB on productivity include fruit drop, fruit deformation, poor juice quality,
and general tree decline (Tansey et al. 2017; Mead and Fasulo 2014). Detected in Florida in 2005,
HLB has been referred to as the most destructive disease of citrus known (Gottwald et al. 2012).
Over the course of more than a decade, growers have tried different strategies to contain
HLB and gained some experience on dealing with the disease. To reduce HLB spread, early
strategies included aggressive scouting for the disease and removal of HLB symptomatic trees.
This practice, however, is costly when a large number of trees are infected (Tansey et al. 2017)
and nearly all growers do not remove HLB-symptomatic trees (Singerman and Burani-Arouca
2012). Aggressive control of the vector and area-wide insecticide spray management programs
can be cost effective even when HLB incidence is high (Tansey et al. 2017). Although control of
the vector is a short-term solution while a cure is found (Grafton-Cardwell, Stelinski and Stansly
2013), it is likely the most important strategy growers have to delay and reduce the effects of HLB
(Tansey et al. 2017). Citrus Health Management Areas (CHMAs), started in 2010 and coordinated
by UF-IFAS Extension and FDACS, is a program to fight the vector over a wide geographical
area. In addition, foliar nutrition spray programs10 may reduce trees stress caused by the infection
and help tree productivity by allowing foliage to acquire nutrients that are otherwise limited by the
root dysfunction caused by the bacterium (Tansey et al. 2017). Both foliar nutrition sprays and
vector control are currently common practices in Florida helping growers to contain HLB, but have
significantly increased production costs, as shown in table 2.11 Some studies have casted doubt,
however, on whether costs of these practices individually implemented offset the benefits (Tansey

14
et al. 2017; Gottwald et al. 2012), and propose more integrated practices (Gottwald et al. 2012)
such as foliar sprays, area-wide vector management plus removal of HLB symptomatic trees.
Horticultural practices and planting density
In 2009, a research team at UF-IFAS began APS, an experiment envisioned to help the industry to
survive HLB and remain competitive until a long-term solution is available (Schumann, Syvertsen,
and Morgan 2009).12 A block of trees cultivated under standard growing practices (e.g., granular
fertilizer and micro sprinkler irrigation) was compared to blocks with non-standard practices
including drip fertigation, open hydroponics, alternative rootstocks, and high plant densities.
Schumann et al. (2012) reported the progress of the research when 3-year-old trees were harvested.
The integration of non-standard practices, APS, produced early high fruit yields. That is, the
normalized production level of the 3-year-old trees is equivalent to what would not have been
achieved until year 5 under conventional practices. High planting density was the most significant
contributor to higher early yields in the experiment.13 Blocks planted at 363 trees per acre
contributed a 57% of normalized gains (measured as soluble solids pounds per acre) compared to
a 22% contribution of drip fertigation - open hydroponics, and 21% of rootstock. Planting density
affects investment profitability. By choosing a low density, a grower foregoes potential revenue.
Planting too many trees, on the other hand, increases costs and may diminish yield per tree since
neighboring plants would compete for nutrients and sunlight utilization by the crop canopy. In
practice, growers decide the planting density according to their groves’ particular conditions and
the planting density within ranges considered best practices.
Plants in this experiment were attacked by HLB. The incidence of HLB was statistically
higher and more severe on plants cultivated under conventional practices than under APS. While
“[APS] failed to avoid infestation… or to adequately offset the symptoms of HLB once trees

15
became infected” (Gruber et al. 2015, p. 10), APS components optimize early yields and partially
mitigate HLB. “HLB-affected trees will remain smaller, with lower yields per tree – conditions
which are better dealt with and compensated for with high planting densities and APS than with
traditional low densities and conventional citriculture.” (Schumann et al. 2012, p. 8).
Possibly due to APS, orange growers in Florida are adopting high density. Prior to HLB,
orange trees were planted at densities around 150-175 trees per acre. Currently, the density of new
plantings by small and medium growers is estimated around 225 trees per acre. Large growers
could afford to plant at higher planting densities and APS, which increases establishment and
production costs. Best practices on planting density vary over time, and depend upon the
prevailing citriculture technology. During the 1950s, for instance, orange groves in Florida were
planted at about 70 trees per acre. As freezes in the 1980s devastated many of those groves, new
plantings moved further south with tree densities reaching 145 trees per acre with the aid of better
technology allowing for higher density (Goldberg and Hogan 2004). Given the perennial nature
of citrus cultivars, densities significantly vary during structural industry changes that require new
plantings, such as natural disasters or epidemic diseases.
Citrus replanting incentive programs
Governmental agencies have programs implemented to help citrus growers to reduce the risk of a
new or renovated grove investment. Singerman (2016) summarizes these programs. We next
highlight the features of the programs that relate to the grove investment model. Private entities
have also implemented programs to incentivize citrus replanting.
Announced in 2014, the Tree Assistance Program (TAP), by the USDA Farm Service
Agency (FSA), reimburses growers for replanting trees lost to the effects of HLB. The TAP
provides cost-sharing financial assistance after the grove accumulates tree mortality in excess of

16
18% over a period up to six years. In particular, the program covers 65% of cost per tree and
planting cost and 50% of site preparation, subject to eligibility provisions and with capped support.
Based on to characteristics of the TAP, Spreen and Zansler (2016) note that this program is only
available to small- to medium-sized growers because of income limits imposed by the government.
The goal of the TAP is to reach a large number of growers in Florida, as its target is to have 6
million new trees planted by 2018. In general, the TAP is a support program limiting resetting
costs in case of severe HLB attacks.
The Citrus Grove Renovation / Re-establishment Support Program (CGRR) is a relatively
new program available to Florida growers, announced in August 2016. CGRR is a program
implemented by the FDACS. This support is limited to growers planting an entire grove and
targets investments in irrigation and nutrient management systems. As discussed previously, one
of the strategies currently used by against HLB precisely involves these investments. CGRR
would cover 100% of the cost of engineering and design and 75% of investments that qualify for
improvement of irrigation and nutrient management systems. Similar to the TAP, the CGRR is
subject to eligibility provisions and pre-established capped amounts. While table 1 provides the
investments required to establish a traditional grove, the CGRR program gives room for
technology improvement, particularly for technology targeted to contain the negative effects of
HLB.
The Abandoned Grove Abatement Initiative (AGAI) is another support program by the
FDACS. AGAI supports growers for the removal and destruction of abandoned groves due to
HLB, to reduce the spread of the pathogen. Thus, a grower planting a new grove in Florida, eligible
for AGAI, would avoid this cost and focus on the establishment costs instead (table 1). In any
case, removal costs are considered sunk costs for capital budgeting purposes, as they need to be

17
incurred regardless of the decision to re-plant the grove with citrus or use it for other purposes.
An additional benefit of the AGAI for landowners is the fact that it provides tax benefits related to
land values if the farmer decides to replant citrus.
Private entities have also programs to incentivize replanting of orange groves, however
these programs are not available to a typical grower in Florida, but rather to growers with ties to
those firms. Minute Maid, the subsidiary of the Coca-Cola company, has a program consisting on
a long-term contract offered to growers (refer to Spreen and Zansler 2016). Florida’s Natural
announced in 2014 major commitments to incentivize citrus plantings in Florida and renewed the
program in 2017 (refer to Trejo-Pech, Spreen, and House 2017).
Expedited depreciation
A bill on tax reduction, expected to benefit Florida citrus growers was introduced in the United
States Senate in September 2016. If passed, the Emergency Citrus Disease Response Act of 2016,
would allow citrus growers to apply expedited or accelerated depreciation for income tax purposes.
That is, instead of accumulating grove establishment costs and early caretaking costs during the
non-bearing portion of grove life (as discussed in the “establishment and early caretaking”
section), costs would be “expensed” or reported in the income statement the year incurred.
Reporting expenses earlier rather than later in the investment horizon alleviates growers’ cash flow
needs particularly during the non-productive grove period. The overall value of a grove improves
due to the time value of money. According to the model in this study, the value of grove would
increase about $600 USD per acre by using expedited depreciation instead of normal depreciation,
as currently allowed by the IRS.
Consumption

18
Consumption of orange juice per capita in the U.S. has decreased from 4.9 gallons in the 2005-06
season to 2.6 gallons in 2015-16 (FDOC, 2016). During the last decade, however, orange supply
has decreased faster than consumption, causing an increase in imports (figure 2). During recent
years, there has been public concern on the connection between consumption of fruit drinks with
added sugars and high levels of calories and increased risk for health. (The juice industry,
according to Euromonitor’s classification, is comprised of (100%) juices, nectars (with 25% to
99% juice content), and juice drinks (containing up to 24% juice).) Despite its high sugar content,
fruit beverages are an important source of vitamins and minerals and represent a cost-effective and
convenient way to meet consumers’ daily fruit intake recommendations (Leschewski,
Weatherspoon, and Kuhns 2016). This has allowed beverage companies to successfully launch
juices fortified with vitamins and minerals, and campaigns that emphasize the naturally occurring
nutrients in juices. A recent study by Tetra Pak, finds potential for the growth of the beverage
industry, particularly for 100% juices (Crawford 2016). According to the study (1) 67%
consumers rate “all natural” as the most interesting juice attribute; (2) vegetable blends is a
growing category, attracting customers probably because they have lower natural sugar and offer
different nutrients; and (3) 60% of consumers look for juices with proven medical benefits, the so
called functional products.
A potential opportunity for the increase of orange juice consumption is the forthcoming
change on food and beverage labels. In May 2016 the Food and Drug Administration (FDA)
released the new design of the nutrition facts label on packaged foods, which will become effective
in the summer of 2018. According to the FDA, new labeling will reflect new scientific
information, including the link between diet and diseases such as obesity and heart disease.
Among the changes that may impact orange juices, are the following: (1) Contents of vitamin D

19
and potassium will be declared in the label, replacing vitamin A and C, which may continue to be
labeled but will not be mandatory. (2) A new line, indicating the amount of “added sugar” will be
required in new labeling. (3) Declaration of total calories will be required in larger font.
The new label design might stimulate orange juice consumption. The high level of
potassium naturally inherent in oranges could be emphasized by marketers. Orange juice has the
second highest level of this nutrient across commercially available juices, only following prune
juice (Leschewski, Weatherspoon, and Kuhns 2016). Given the mandatory requirement to include
potassium content in labels, the U.S. population is more likely lacking potassium compared to
other nutrients. The fact that 100% orange juice has no added sugar is another element to
emphasize. Signifying that there is 0% added sugar on the label for 100% orange juice would
likely appeal to consumers by allowing them to differentiate between natural sugar and added
sugars. According to Euromonitor (2016), 100% orange juice represented around 50% of the total
100% juice volume consumed in the U.S., including all flavors, in every year from 2010 to 2015
(Trejo-Pech, Spreen, and House 2017).
Size of grove
The baseline model in this study is presented on a one acre basis. While it would be difficult to
define small, medium, and large orange growers, for this study a small grower is one with up to
200 acres cultivated, a medium-sized grower has 200 to 500 acres, and a large grower has more
than 500 acres. Grower size may capture scale effects of fixed costs and bargaining power on
selected inputs. We mention a few instances where grower size affects profitability. Caretaking
costs may be lower for a large grower, as orange farmers typically receive discounts for bulk
purchases (Singerman 2015), and small growers may have higher caretaking costs. Financial costs

20
could also be affected. The opportunity cost of capital for a large grower might be lower relative
to a small grower as access barriers to capital and interest rates could be lower.
Concluding remarks
This study presents a capital budgeting model to evaluate a potential orange grove investment.
The study features a representative grower in Southwest Florida with his grove infested by HLB
to a degree that makes no economic sense to keep maintaining it. The grower has the choice to
replant the grove or to convert the land to other uses. Support for citrus growers, by both
governmental and private entities, and growers’ experience on orange may induce farmers to keep
growing oranges. We provide results of a baseline model, along with Monte Carlo simulation.
Student using this case study are expected to challenge the baseline assumptions and replicate the
model with alternative scenarios. Ultimately, they should discuss whether it is optimal to continue
growing oranges in Florida, considering both financial metrics, and risks and opportunities.
Regarding the next-best alternative to replanting oranges, the grower may choose to consider
alternative crops to plant. Some alternative crops, emerging due to HLB mainly, include but are
not limited to peaches, olives, and blueberries. An analysis of alternative crops is not covered in
this study. The CREC has recently published a profitability study on blueberries (Singerman et al.
2016). Compared to oranges, planting blueberries require a significantly higher investment of
above $35,000 per acre for the first year. According to that study, which presents alternative price
and yield scenarios, blueberry gives positive NPVs at moderate yield and high prices, using 10%
as cost of capital. At the same time, blueberry prices have varied year over year, and the
infrastructure is still in the developmental phase. Finally, the representative orange grower
featured in this study, may decide to rent or sell its land, this option is out of the scope of this
study.

21
References
Court, C., A.W. Hodges, M. Rahamani, and T. H. Spreen. 2017. “Economic Impacts of the Florida
Citrus Industry in 2015-16.” Economic Impact Analysis Program, Food & Resource Economics
Department. University of Florida, May.
Crawford, E. 2016. “Three Trends Driving Sales of 100% Juice Even as Sugar Debate Rages.”
Food navigator-usa.com, September 19, 2016. Accessed online:
http://www.foodnavigator-usa.com/content/view/print/1308943
Euromonitor. 2016. “Juices in the U.S.” Passport Euromonitor International March 2016:1-10.
Farnsworth, D., K. Grogan, A.van Bruggen, and C. Moss. 2014. The potential economic cost and
response to greening in Florida citrus. Choices 29(3):1-6.
Goldberg, R., and H. Hogan. 2004. “Can Florida Orange Growers Survive Globalization?”
Harvard Business School Publishing Case 9-904-415:1-25.
Gottwald, T. R., J. H. Graham, M.S. Irey, T.G. McCollum, and B.W. Wood. 2012.
“Inconsequential Effect of Nutritional Treatments on Huanglongbing Control, Fruit Quality,
Bacterial Titer and Disease Progress.” Crop Protection 36(2012):73-82.
Grafton-Cardwell, E., L. Stelinski, and P. Stansly. 2013. “Biology and Management of Asian
Citrus Psyllid, Vector of the Huanglongbing Pathogens.” The Annual Review of Entomology
58:413-32.
Graham, J., and H. Campbell. 2001. “The Theory and Practice of Corporate Finance: Evidence
from the Field.” Journal of Financial Economics 60:187-243.
Gruber, B., B. Boman, A. Schumann, K. Hostler, and L. Waldo. 2015. “Methods for Profitable
Citrus Production.” Citrus Industry October 2015:10-12.

22
Johnson, I. 2017. “UCR awarded $5.1 Million Grant to Combat Citrus Killer Huanglongbing.”
The Highlander, March 6, 2017. Accessed online on March 14, 2017:
https://highlandernews.org/28195/ucr-awarded-5-1-million-grant-combat-citrus-killer-
huanglongbing/
Kierulff, H. 2008. “MIRR: A Better Measure.” Business Horizons 51(2008):321-329.
Leschewski, A., D. Weatherspoon, and A. Kuhns, 2016. “A Segmented Hedonic Analysis of the
Nutritional Composition of Fruit Beverages.” International Food and Agribusiness
Management Review 10(3):119-140.
McCollum, G., and E. Baldwin. 2016. “Huanglongbing: Devastating Disease of Citrus.” In J.
Janick, ed. Horticultural Reviews Volume 44. Hoboken, NJ: John Wiley & Sons, Inc.
Mead, F., and T. R. Fasulo. 2014. Asiatic Citrus Psyllid, Diaphorina Citri Kuwayama (Homoptera:
Psyllidae). Florida Department of Agriculture and Consumer Services, Division of Plant
Industry. Entomology Bulletin Number 80, EENY-33, December 2014.
Morris, A., R. Muraro, and W. Castle. 2011. “Optimal Grove Replanting to Mitigate Endemic
HLB.” Citrus Industry April 2011:12-16.
Moseley, K., L. House, and F. Roka. 2012. “Adoption of Mechanical Harvesting for Sweet Orange
Trees in Florida: Addressing Grower Concerns on Long-Term Impacts.” International Food
and Agribusiness Management Review 15(2):83-98.
Muraro, R. 2012. “Summary of 2011-2012 Citrus Budget for the Southwest Florida Production
Region.” Citrus Research and Education Center, Lake Alfred, IFAS. University of Florida.
Accessed online on April, 3, 2017: http://www.crec.ifas.ufl.edu/Extension/Economics.
Muraro, R., F. Roka, and P. Stansly. 1999. “Reset vs. Replant: The Case of High Annual Tree
Loss.” Proc. Fla. State Hort. Soc. 112:43-46.

23
Schill, M. 2013. “Business Valuation: Standard Approaches and Applications.” Darden Business
Publishing, University of Virginia UV6586:1-17.
Schumann, A., K. Hostler, L. Waldo, and K. Mann. 2012. “Advanced Production Systems for
Florida Citrus: Research Update, Huanglongbing Impacts and Production Forecasts.” Citrus
Industry August 2012:6-12.
Schumann, A., J. Syvertsen, and K. Morgan. 2009. “Implemented Advanced Citrus Production
Systems in Florida- Early Results.” Proc. Fla. State Hort. Soc. 122:108-113.
Singerman, A. 2015. “Cost of Production for Processed Oranges in Southwest Florida, 2014/15.”
Food and Resource Economics Department, UF/IFAS Extension. FE986, University of Florida,
December.
Singerman, A. 2016. “Summary of Three Incentive Programs Available to Florida Citrus
Growers.” Citrus Research and Education Center, IFAS Citrus Extension. University of
Florida. Accessed online on May 9, 2017:
http://www.crec.ifas.ufl.edu/extension/economics/articles.shtml
Singerman, A., and M. Burani-Arouca. 2012. “Evolution of Citrus Disease Management Programs
and Their Economic Implications: The Case of Florida’s Citrus Industry.” Food and Resource
Economics Department, IFAS Extension. FE915, University of Florida, October.
Singerman, A., M. Burani-Arouca, and S. Futch. 2016. “2015/16 Harvesting Charges for Florida
Citrus: Picking, Roadsiding and Hauling.” Citrus Research and Education Center, Lake Alfred,
IFAS. University of Florida, July.
Singerman, A., M. Burani-Arouca, J. Williamson, and G. England. 2016. “Establishment and
Production Cost for Southern Highbush Blueberry Orchards in Florida: Enterprise Budget and

24
Profitability Analysis.” Food and Resource Economics Department, IFAS Extension. FE1002,
University of Florida, November.
Singerman, A., and P. Useche. 2016. “Impact of Citrus Greening on Citrus Operations in Florida.”
Food and Resource Economics Department, IFAS Extension. FE983, University of Florida,
February.
Spreen, T., and M. Zansler. 2016. “Economic Analysis of Incentives to Plant Citrus Trees in
Florida.” HortTechnology May 26(6):720-726.
Tansey, J. A., P. Vanaclocha, C. Monzo, M. Jones, and P. A. Stansly. 2017. “Costs and Benefits
of Insecticide and Foliar Nutrient Applications to Huanglongbing-Infected Citrus Trees.” Pest
Management Science 73:904-916.
Trejo-Pech, C.J., T. H. Spreen, and, L. House. 2017. “Florida’s Natural® and The Supply of
Florida Oranges.” Working Paper, Agricultural and Resource Economics Department,
University of Tennessee, Knoxville, and Food and Resource Economics Department,
University of Florida.
Zansler, M. 2016. “Florida Citrus Outlook 2016-17 Season.” Economic & Market Research
Department, Florida Department of Citrus Working Paper 2016-1, October 2016. Accessed
online on May 23: http://www.floridacitrus.org/grower/resources/economic-research/

25
Table 1- Establishment and Early Caretaking Costs for a Conventional Grove in Southwest
Florida
Year 0 Y1 Y2 Y3 Y4 Tree removal and land preparation 933.3 Irrigation investments 1,093.3 Tree cost 1,912.5 Staking, planting and watering 371.3 Weed control 85.3 93.9 102.4 110.9 Sprays 200.5 215.5 181.3 196.3 Fertilizer 161.1 177.1 193.1 209.1 Sprouting 27.7 27.7 0.0 0.0 Irrigation 104.5 115.2 125.9 136.5 Disease related 24.5 27.7 29.9 32.0 Indirect costs 42.7 45.9 45.9 49.1 Establishment costs 4,310.3 646.4 702.9 678.4 733.8
Notes: Per acre estimations by Morris, Muraro, and Castle (2011), adjusted by authors as follows.
a) Figures were adjusted by the CPI as of the end of 2016 USD values, b) Tree cost is expressed
in terms of 225 trees per acre, and c) cost per tree is $8.5 as in Spreen and Zansler (2016).
Sprays include insecticides, fungicides, and foliar nutrients. Indirect costs include supervision,
overhead, and miscellaneous. Morris, Muraro, and Castle (2011) estimated $260 per acre in
permits and fees. We removed this cost from the table since it represents sunk cost for replanting
decisions, as permits already exist.

26
Table 2- Cost of Production for Processed Oranges Grown in Southwest Florida, Selected
Seasons
Item / Season 2005-06 2014-15 2015-16 Weed control 197.2 248.2 210.1 Spray Program1 143.9 666.0 611.6 Fertilizer 207.9 487.0 454.2 Pruning 28.7 31.5 49.8 Irrigation2 166.7 198.1 180.9 Other HLB related3 20.6 18.0 Citrus Canker4 29.4 Total w/o resets 773.9 1,651.3 1,524.6 Resets Trees per acre 4.0 9.0 9.0 Cost per tree 34.2 38.5 42.9 Tree removal, site preparation and planting (trees included) 20.1 19.1 17.5 Supplemental caretaking (year 1 to 3) 14.2 19.5 25.4 Resets per acre 137.0 346.8 385.7 Indirect costs5 109.0 92.1 160.0 Total per acre 1,019.9 2,090.2 2,070.2
Source: Adapted by authors from the Southwest Florida Orange Budget Costs by the Citrus
Research and Education Center, IFAS-UF. Accessed online on April, 2, 2017:
http://www.crec.ifas.ufl.edu/extension/economics/.
Notes: 1Includes insecticides, fungicides, and enhanced foliar nutrients. 2Depreciation charges,
originally included in the budget reports up to the 2011-12 season, are excluded by authors.
3Includes tree removal and site cleanup preparation, field inspections for HLB, and Citrus Health
Management Areas (CHMA) program cost. 4Mandatory citrus Canker decontamination cost.
5Includes management costs and taxes/regulatory costs. Interests, originally included in the budget
reports, are excluded by authors.

27
Table 3- Harvesting and Hauling Costs for Processed Oranges in Southwest Florida, Early-
Mid Varieties
Item / Season 2005-06 2014-15 2015-16 Harvesting ($ per box): Weigh. Avg. 1.945 1.990 2.440 Minimum 1.550 1.680 1.880 Maximum 2.750 2.350 3.420 Hauling ($ per box according to mileage in left column): 1 to 30 0.428 0.370 0.440 31 to 50 0.498 0.470 0.530 51 to 80 0.632 0.599 0.610 81 to 100 0.735 0.776 0.700 100 + 0.840 0.960 0.640
Source: Citrus Research and Education Center, IFAS-UF, adapted by authors. Accessed online on
May, 4, 2017: http://www.crec.ifas.ufl.edu/extension/economics/harvesting_charges.shtml

28
Table 4- Weekly Yields and Prices for Early-Mid Oranges for Processing in Florida, Selected
Seasons
Week PS/box $/PS Week PS/box $/PS 12.13.14 5.401669 1.895000 12.12.15 5.282889 12.20.14 5.476924 1.960000 12.19.15 5.394349 2.134000 12.27.14 5.590675 1.927000 12.26.15 5.477772 2.083000 01.03.15 5.680583 1.941000 01.02.16 5.552435 2.056000 01.10.15 5.827209 1.980000 01.09.16 5.646660 2.093000 01.17.15 5.867688 1.972000 01.16.16 5.702282 2.144000 01.24.15 5.951620 1.934000 01.23.16 5.807152 2.144000 01.31.15 6.042775 1.920000 01.30.16 5.786693 2.149000 02.07.15 6.045265 1.921000 02.06.16 5.857623 2.158000 02.14.15 6.137405 1.918000 02.13.16 6.006673 2.171000 02.21.15 6.237169 1.900000 02.20.16 6.027005 2.240000 Mean 5.734738 2.012386 St. Dev. 0.293539 0.138036
Source: Yields from the Florida Department of Citrus (FDOC)’s Annual Processor’s Report, 2014-
15 and 2015-16 seasons.
Notes: Yields are expressed in pounds solids per box, and prices in dollars per pound solid (yields
for tangerines and eliminations included). Post-estimate weekly prices, USD per pound solid, are
final spot and contracted prices established for current fruit season only, reported by the FDOC.
Prices from the beginning of the season, particularly when the total level of production is very low,
are significantly lower than regular prices during the rest of the season. Thus, data when production
level did not reach 1 million 90-lb boxes per week are excluded from table 4.
29
Table 5- Yield per Tree Age for Early-Mid Oranges in Florida, in 90-lb Box per Tree for
Southern Florida
3 to 5 years
6 to 8 years
9 to 13 years
14 to 23 years
24+ years
Prior to HLB 2004-05 1.00 2.70 2.50 3.50 3.90 During HLB 2011-12 1.40 1.70 2.30 2.70 3.80 2012-13 0.50 1.10 2.10 2.50 3.70 2013-14 0.30 1.10 1.90 2.20 3.10 2014-15 1.00 1.00 1.20 2.30 3.10 2015-16 0.50 1.60 1.90 1.40 2.40 Weighted average during HLB 0.70 1.40 1.90 2.30 3.10
Source: Florida Citrus Statistics, USDA NASS, 2015-16 (March 2017) and 2008-09 (May 2010).
Accessed online on May 5 2017:
https://www.nass.usda.gov/Statistics_by_State/Florida/Publications/Citrus/

30
Table 6- Projected Free Cash Flows for the Baseline Orange Grove
Year 0 1 2 3 4 5 6 7 Establishment + EC ($ grove) 3617.0 646.4 702.9 678.4 Revenues ($ grove) 1480.5 1480.5 2960.9 2960.9 Productive trees (trees per acre) 183.3 183.3 183.3 183.3 Volume (pound solids per acre) 735.7 735.7 1471.4 1471.4 Oper. Costs & Exp. ($ grove) 0.0 351.8 355.0 355.0 2935.8 2935.8 3284.1 3284.1 Caretaking w/o resets ($ grove) 0.0 0.0 0.0 1588.0 1588.0 1588.0 1588.0 Spray program ($ per acre) 638.8 638.8 638.8 638.8 Fertilizer program ($ per acre) 470.6 470.6 470.6 470.6 Other caretaking ($ per acre) 478.6 478.6 478.6 478.6 Reset ($ grove) 309.1 309.1 309.1 309.1 309.1 309.1 309.1 Tree removal ($ per acre) 219.5 219.5 219.5 219.5 219.5 219.5 219.5 Supp. caretaking ($ per acre) 89.6 89.6 89.6 89.6 89.6 89.6 89.6 Harvesting & Haul ($ grove) 348.3 348.3 696.6 696.6 Harvesting ($ per acre) 284.2 284.2 568.3 568.3 Hauling ($ per acre) 64.1 64.1 128.3 128.3 Indirect costs ($ grove) 42.7 45.9 45.9 126.0 126.0 126.0 126.0 Indirect costs ($ per acre) 42.7 45.9 45.9 126.0 126.0 126.0 126.0 Depreciation ($ grove) 0.0 0.0 0.0 564.5 564.5 564.5 564.5 Operating Income 0.0 (351.8) (355.0) (355.0) (1455.3) (1455.3) (323.2) (323.2) Income taxes 0.0 (105.5) (106.5) (106.5) (436.6) (436.6) (97.0) (97.0) NOPAT 0.0 (246.2) (248.5) (248.5) (1018.7) (1018.7) (226.2) (226.2) Free Cash Flow (3617.0) (892.6) (951.4) (926.8) (454.3) (454.3) 338.2 338.2 Terminal Value FCF + Terminal Value (3617.0) (892.6) (951.4) (926.8) (454.3) (454.3) 338.2 338.2
Notes: Tree removal also includes site preparation and planting costs (including cost of trees).
NOPAT is Net Operating Profit After Taxes.

31
Table 6- Continued
Year 8 9 10 11 12 13 14 15 Establishment + EC ($ grove) Revenues ($ grove) 2960.9 4018.4 4018.4 4018.4 4018.4 4018.4 4864.4 4864.4 Productive trees (trees per acre) 183.3 183.3 183.3 183.3 183.3 183.3 183.3 183.3 Volume (pound solids per acre) 1471.4 1996.8 1996.8 1996.8 1996.8 1996.8 2417.2 2417.2 Oper. Costs & Exp. ($ grove) 3284.1 3532.9 3532.9 3532.9 3532.9 3532.9 3167.5 3167.5 Caretaking w/o resets ($ grove) 1588.0 1588.0 1588.0 1588.0 1588.0 1588.0 1588.0 1588.0 Spray program ($ per acre) 638.8 638.8 638.8 638.8 638.8 638.8 638.8 638.8 Fertilizer program ($ per acre) 470.6 470.6 470.6 470.6 470.6 470.6 470.6 470.6 Other caretaking ($ per acre) 478.6 478.6 478.6 478.6 478.6 478.6 478.6 478.6 Reset ($ grove) 309.1 309.1 309.1 309.1 309.1 309.1 309.1 309.1 Tree removal ($ per acre) 219.5 219.5 219.5 219.5 219.5 219.5 219.5 219.5 Supp. caretaking ($ per acre) 89.6 89.6 89.6 89.6 89.6 89.6 89.6 89.6 Harvesting & Haul ($ grove) 696.6 945.4 945.4 945.4 945.4 945.4 1144.4 1144.4 Harvesting ($ per acre) 568.3 771.3 771.3 771.3 771.3 771.3 933.6 933.6 Hauling ($ per acre) 128.3 174.1 174.1 174.1 174.1 174.1 210.8 210.8 Indirect costs ($ grove) 126.0 126.0 126.0 126.0 126.0 126.0 126.0 126.0 Indirect costs ($ per acre) 126.0 126.0 126.0 126.0 126.0 126.0 126.0 126.0 Depreciation ($ grove) 564.5 564.5 564.5 564.5 564.5 564.5 Operating Income (323.2) 485.5 485.5 485.5 485.5 485.5 1697.0 1697.0 Income taxes (97.0) 145.7 145.7 145.7 145.7 145.7 509.1 509.1 NOPAT (226.2) 339.9 339.9 339.9 339.9 339.9 1187.9 1187.9 Free Cash Flow 338.2 904.3 904.3 904.3 904.3 904.3 1187.9 1187.9 Terminal Value 15838.2 FCF + Terminal Value 338.2 904.3 904.3 904.3 904.3 904.3 1187.9 17026.1
32
Figure 1- Distribution of Modified Internal Rate of Return results for 1,000 Monte Carlo
simulations
0
50
100
150
200
250
300
-15.0% -12.5% -10.0% -7.5% -5.0% -2.5% 0.0% 2.5% 5.0% 7.5% 10.0% 12.5% 15.0% 20.0%

33
Figure 2- U.S. Orange juice production, imports, exports and presumed consumption
Source: Prepared by using data in Zansler (2016).
020
040
060
080
010
0012
0014
00
Mill
ion
SSE
gal
lons
ora
nge
juic
e
2002-03 2003-04 2004-05 2005-06 2006-07 2007-08 2008-09 2009-10 2010-11 2011-12 2012-13 2013-14 2014-15 2015-16Crop seasons
Production ImportsExports Consumption

34
Footnotes
1. The Florida citrus harvest and marketing seasons extends from November 1 to October 31
of the following year.
2. The USDA’s National Institute of Food and Agriculture, for instance, awarded about $14
million grants in 2017 to four research institutions to fight HLB (Johnson 2017).
3. Early-mid varieties of oranges in Florida include Hamlin, Pineapple, and Mid-Sweet. They
are typically harvested between late November and February. Valencias, also known as
late orange, is harvested between March and June. Early-mid and late varieties have
different production costs, prices and yields. In Florida, during the last two seasons,
approximately 47% of total orange production was from early-mid varieties.
4. When reestablishing an entire grove, revenues from commercially productive trees, if any,
are foregone. Foregone revenues (and foregone costs) are not considered in this model for
project evaluation purposes since it is assumed that the decision to reestablish an entire
grove is made by the grower when the grove generates negative Net Present Value.
5. Although in the case of replanting an existing plot, part of the irrigation system is already
in place.
6. Investment in working capital is assumed to be zero, implying that investment in current
assets (inventories and account receivables) equal investment in current liabilities
(excluding short-term loans).
7. The MIRR provides a more conservative rate of return than the conventional Internal Rate
of Return (IRR) since it uses a more realistic reinvestment rate (e.g., the opportunity cost
of capital in this instance). In general, the MIRR provides a more accurate metric than the
IRR (Kierulff 2008). The MIRR is also less prone to errors when simulation analysis is

35
performed, as in this study. When simulating results many times, there is a possibility that
in some cases cash flows change signs more than one time over the investment horizon
producing an incorrect IRR or simply producing errors in the spreadsheet.
8. The expected inflation rate of the baseline model is assumed 0%. Using 1% inflation
changes MIRR from 9.5% to 10.4%.
9. Other species of the bacterium are Candidatus L. africanus, the cause of HLB in Africa and
Candidatus L. Americanus, affecting some regions in Brazil (Mead and Fasulo 2014).
10. Including both macro nutrients (Nitrogen, Phosphorus, and Potassium salts) and micro
nutrients (Magnesium Boron, and Zinc salts).
11. Other control strategies under evaluation include thermal and antimicrobial treatments, not
widely used yet due to practicality of implementation or regulatory hurdles (McCollum
and Baldwin 2016).
12. The overall APS’s aim was stated as: “…enhance citrus production and reduce abiotic
stress and disease pressure by optimizing daily water and nutrient levels for trees growing
on sandy soils. This system also promotes rapid canopy development by incorporating high
planting densities” (Schumann, Syvertsen, and Morgan 2009, p. 108).
13. Planting density is defined as the number of trees per acre.