Embed Size (px)
Citation preview
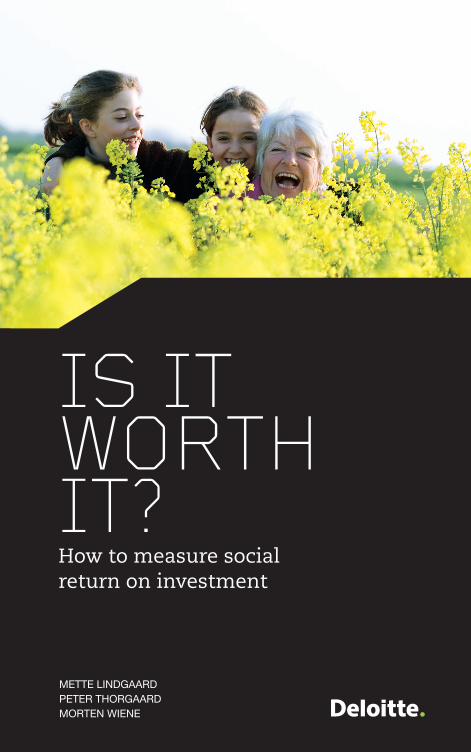
Is It worth It? How to measure social return on investment
METTE LINDGAARD PETER THORGAARD MORTEN WIENE

Is It worth It?

Is It worth It?
How to measure social return on investment
Mette Lindgaard, Peter Thorgaard and Morten Wiene

Is It worth It?
How to measure social return on investment
By Mette Lindgaard, Peter Thorgaard and Morten Wiene
© 2015 Gyldendal A/S
Cover and typesetting: Stuntfire, Søren Roed Schack
Printing: Livonia Print
Editor, Deloitte: Ulrik Jørgensen
ISBN: 978-87-02-15249-4
1st edition, 1st run
Printed in Latvia
This book may only be photocopied at institutions that have entered into an
agreement with Copy-Dan, and only on the terms stated in any such agree-
ment.
Gyldendal Business
Klareboderne 3
DK-1001 Copenhagen K
Tel. no.: (+45) 33 75 55 55
www.GyldendalBusiness.dk
CoNtENts
PrEFACE -> 9
INTRODUCTION -> 11
There are some good stories, but ... 12
Focusing on social return on investment
makes good sense 14
Recipe for an analysis of social return on investment 15
01
soCIAL rEtUrN oN INVEstMENt – A GUIDE For thE soCIAL wELFArE ArEA-> 19
The SROI analysis in a historical perspective 20
More than an economic analysis 24
SROI in the real world 27
Knowing what works 28
Focus on prevention 30
A planning and evaluation tool 32
Get stakeholders on board 33
Social return on investment – one step at a time 34
Read more 37
02
oPtING IN AND oUt -> 39
The art of setting limits 40
Motivated conceptions of why an intervention works 47
Check list for the programme theory 50
Check list for delineation and programme theory 53
Read more 53
03
CAN rEtUrNs ACtUALLY BE MEAsUrED? -> 55
Quantitative and qualitative indicators 57
Development of indicators 59
Tips for setting up indicators 63
Check list for indicators 72
Read more 72
04
DAtA, DAtA, DAtA -> 75
No analysis without data 77
Qualitative data 78
Quantitative data 81
Involve stakeholders in data collection 87
Advantages of involving stakeholders 90
Check list for collection of data 91
Read more 91
05
oUtCoME EVALUAtIoN -> 93
Dare it and do it 96
The experimental approach 97
Before and after measurements 102
Process-based approach 103
Combine the approaches 105
SROI ratio: should/should not? 109
Check list for outcome evaluation 115
Read more 116
06
rEtUrN oN INVEstMENt IN hArD CAsh -> 119
Method 1: social return on investment
illustrated by scenarios 121
Scenarios 122
Method 2: the classical SROI ratio 131
Check list for return on investment 140
Read more 141
07
tArGEtED CoMMUNICAtIoN -> 143
Professional presentation to front-line employees 145
Informative presentation for decision makers 151
Check list for dissemination of results 158
Read more 158
EPILoGUE: soCIAL rEtUrN oN INVEstMENt AND
thE wELFArE oF thE FUtUrE -> 159
Drawbacks of SROI analyses 161
Documentation creates value at several levels 163
Read more 164

PrEFACE ⁄ 9
PrEFACE
Social interventions are social investments, we wrote at Lo-
cal Government Denmark (LGDK) in 2013, when we pub-
lished a discussion paper concerning the social policy of
the future, under the title "Invest Before it Happens". Our
position has not changed. Social interventions must be
viewed as social investments that in a preventive and reha-
bilitation perspective shall achieve the greatest possible ef-
fect. We must not just do something – we must do what
works, and what works best. As a society, we must quite
simply spend the money to give the greatest possible re-
turn on investment.
So you might ask why we do not do just that. There are
several answers to this question.
Firstly, we need to eliminate financial and professional
silo thinking if we are to target our social interventions and
use our resources more sensibly. Social interventions are
not only items on the budget, but also social investments,
even if the benefits are often reaped in another area than
where the investment was financed.
Secondly, we need to increase our knowledge of what
works, how it works, why it works, and for whom. In other
words, we need to gather knowledge of the individual in-
terventions, so that we can document that they also create
the expected value and, not least, prioritise the resources
accordingly.
This book provides a qualified proposal for how we can
achieve better prioritisation of social interventions. It not
only describes why it is important to work with social re-
turn on investment in the municipalities, but also provides
inspiration for how you can actually start doing this.
Here, you can find numerous ideas, methods and tools
to work with social return on investment, as well as a prac-
tical guide to performing a return on investment analysis
from start to conclusion.
The tools can inspire your team, your department and
the various administrations to target and allocate social in-
terventions in a better way than we do today. We must dare
to take a critical look at the social interventions, discard the
poorer ones, spend more resources on the good ones, and
keep asking ourselves: Can we use the resources better?
Jan Olsen
Chief Economist, Local Government Denmark (LGDK)
INtroDUCtIoN ⁄ 11
INtroDUCtIoN
It is well-known, and often repeated, that the welfare state
faces enormous challenges: the costs of welfare benefits
are increasing steadily, fewer hands have to provide wel-
fare to more people, and the public sector is caught in the
crossfire between limited means and increased demand.
The issue is complex, but the point is simple: more welfare
has to be provided to more people, for less money. For this
to succeed, as a society we need to increase the value of
public welfare benefits, and be able to justify the opt-ins
and opt-outs that we are obliged to make.
Take a look at the man on the street – we can call him
Christian. Christian is one of almost six million Danes.
Aged 24, he is unemployed. He grew up in a provincial town,
in a vulnerable family. His father drank, and his mother
found it hard to cope with the everyday chores. As a teen-
ager, Christian also faced substance abuse problems that
almost cost him his life. He started training as a carpenter,
but dropped out after the first practical training placement.
Now, he subsists on social security benefit and moonlight-
ing here and there. He can feed himself, but he is not par-
ticularly happy.
Christian never sat still long enough in school to learn
words like "crossfire" and "investment perspective". None-
theless, he personifies these particular concepts: crossfire,
because there are more and more people in need of help,
and thereby fewer and fewer means to help him in particu-
12 ⁄Is It worth It?
lar. Investment perspective, because we as a society should
get something out of him, just as he should get something
from us: education, a job, a home and quality of life. If we
are to help Christian, and others like him, to achieve a bet-
ter life, we need to take some measures that actually work.
We cannot afford to close our eyes, and we cannot afford to
fumble in the dark, either.
thErE ArE soME GooD storIEs, BUt ...
In Denmark there are many good stories from successful
social interventions, but we would still contend that the so-
cial welfare area is affected by a distinct lack of knowledge
of what actually does work. Documented knowledge of
what is of greatest value to whom, and why, is quite simply
in short supply. This is not to say that an employee may not
have a good understanding of which interventions work,
but this knowledge is rarely shared so that others can ben-
efit from the positive experience.
We thus generally lack an overview of who receives
which social interventions, their outcome, and at what
price, just as we lack shared concepts to describe and doc-
ument both the interventions and their outcome. This lack
of knowledge constitutes a barrier to managing and prior-
itising the interventions, and blocks the path to effective
use of resources in terms of individual interventions, cross-
disciplinary interventions, and the many target groups
who, today and in the future, will receive assistance.
Besides these challenges, we are also perhaps some-
times afraid to open certain doors, because we are well
aware that we will not like what we find behind them. We
hear a lot about ineffective job creation schemes, remedial
teaching without any significant results, insufficient inte-
gration, or the fact that very few of the children who are
INtroDUCtIoN ⁄ 13
placed in care gain higher educational qualifications. The
examples are legionary.
In recent years, several analyses from such bodies as the
Danish National Board of Social Services have questioned
the return on investment from social interventions, and
have thereby cast doubt on the growth in expenditure for a
number of cost-intensive items. Meanwhile, several mu-
nicipalities have shown that it is actually possible to prior-
itise how funds are used in the social welfare area, so as to
promote effective interventions: help for self-help in the el-
derly care area, greater inclusion in lower secondary school
and fewer children taken into care in residential institu-
tions – to name just a few.
Yet besides these success stories there are also many
failures. A whole deck of interventions is dealt, but the
cards are rarely shuffled together again in order to discard
the less effective interventions.
At Deloitte, we have worked for and with the Danish
municipalities for several years. We have seen how funds
for social welfare interventions are often distributed thinly,
rather than being invested so as to focus on the interven-
tions that really have an effect. As a result, far too many in-
terventions merely address the symptoms, and many peo-
ple's lives are not improved, even after several interven-
tions and worthwhile attempts. A large proportion of these
people never escape from public welfare benefits, making
them extremely expensive for society – to put it bluntly.
This means that practicians and decision makers are
forced to ask themselves: What is it most worthwhile to in-
itiate, from a socioeconomic viewpoint? What creates
value? What creates less value? And what does not create
any value at all? The responses are not obvious, since they
require an insight into both economic outcomes and social
welfare outcomes.
14 ⁄Is It worth It?
Comparing the outcomes of the interventions – or com-
paring the interventions with status quo – is usually an
equation with many unknowns and many assumptions.
Nonetheless, this comparison has to be made in a society
like ours with extremely high social welfare expenditure. If
we do not dare to calculate the outcomes, we will have no
knowledge of the value of the interventions. Without this
knowledge, we cannot make qualified choices, or invest in
the right types of prevention. We quite simply have no
chance of directing funds towards the interventions that
create the most value.
FoCUsING oN soCIAL rEtUrN oN INVEstMENt MAkEs
GooD sENsE
From our experience in the social welfare area we know
that far too many interventions are initiated with a short-
term perspective. These interventions often serve as emer-
gency fire-fighting measures, rather than as a long-term
solution to citizens' problems. At best, they do more good
than harm. At worst, they make the national headlines.
With this book, we would like to inspire professionals
and decision makers to focus more on social return on in-
vestment and to reflect on how resources in the social wel-
fare area should be used. We believe that analysing social
return on investment will become more prevalent, since
we, as a society, need to spend the money where this gives
most value. In this book, we present some practice-based
tools that can be used at the strategic level, as well as in the
day-to-day work with citizens.
We have written this book in order to show how it makes
good sense to think in terms of the return on investment in
conjunction with interventions in the social welfare area.
We also wish to show how the tools to assess the return on
INtroDUCtIoN ⁄ 15
investment are available and relevant to use in the individ-
ual municipalities, as well as in conjunction with cross-
municipal interventions. A complete analysis of a given in-
tervention that includes all outcomes and economic calcu-
lations may be a major undertaking, but can also be tack-
led on a smaller scale. Often, relatively simple tools can
make it possible to document the return on investment,
whether this be in terms of planning interventions that
have not yet been initiated, or evaluating interventions
that have not yet yielded the expected value.
Priorities need to be set in the social welfare area,
whether we like it or not. Irrespective of how we approach
this, funds that are channelled into one intervention will
not be available elsewhere. All other things being equal, ex-
plicit prioritisation based on social return on investment
from the interventions is preferable to implicit prioritisa-
tion based on habits, gut-feelings or testing the wind.
Greater use of social return on investment analyses will
mean that less effective interventions can be discontinued,
in favour of interventions that yield higher social returns
on investment. When an analysis concludes, for example,
that coordinated interventions for vulnerable families have
significant positive outcomes from both economic and wel-
fare perspectives, this is a strong argument to use the same
model to review and prioritise other interventions.
ReCIpe fOR aN aNalysIs Of sOCIal ReTURN ON INvesTmeNT
In this book we explain – step by step – how to perform a
social return on investment analysis. We use examples
from real life to underpin the theory, and conclude each
chapter with a check list and references to relevant litera-
ture.
16 ⁄Is It worth It?
The book is inspired by theoretical contributions from the
literature on social return on investment, as well as practi-
cal experience. It is not targeted at specific professional
groups, but is intended to serve as a source of inspiration to
anyone engaged with the social welfare area. Tools are thus
available, whether you work with the strategic, economic
or practical aspects of the social welfare area, and whether
you have already performed several social return on invest-
ment analyses, or are to do this for the first time.
The book is based on the SROI method of measuring so-
cial return on investment, which was developed in the USA.
SROI stands for Social Return on Investment as a calculation
of social return on a given investment.
> In the first chapter of the book we describe what SROI
analyses are, and how they can be used. We discuss, for
instance, why social interventions should be evaluated,
and why the SROI method is a useful evaluation tool.
> In the following chapters we present the actual analysis
framework: from delineating the analysis, setting up in-
dicators and collecting data, to outcome evaluation, cal-
culation of economic welfare value and disseminating
the analysis' results.
> In the final chapter we discuss how the results can be
used in practice, and how decision makers, practicians
and, not least, the citizens who receive social benefits,
can make use of increased evidence.
We would like to thank Rebild Municipality, the Greenlan-
dic family centres, Bybi, the International Fund for Ireland
(which is behind the GRIT programme), the Danish Agency
for Labour Market and Recruitment, and everyone else who

has contributed. Special thanks go to Malte Dahl for his in-
valuable help during the writing process.
Enjoy your reading!
Mette Lindgaard, Peter Thorgaard and Morten Wiene
Copenhagen, January 2015

18 ⁄Is It worth It?
soCIAL rEtUrN oN INVEstMENt – A GUIDE For thE soCIAL wELFArE ArEA ⁄ 19
01soCIAL rEtUrN oN INVEstMENt – A GUIDE For thE soCIAL wEL-FArE ArEA
Jane is 21, single mother to a daughter aged three, has a lot
of debt and no educational qualifications beyond lower sec-
ondary school. Since she left school, she has had various
unskilled jobs of shorter or longer duration. She is cur-
rently receiving social security benefit, which is by no
means enough to help her resolve her current financial
problems.
According to the Danish Act on Active Employment
Measures, Jane must be offered a course of compulsory ed-
ucation. She finds out that she would like to train as a so-
cial and healthcare assistant and, with the Job Centre's
help, gains a place at Social and Healthcare College. In the
first weeks everything is fine. Jane drops her daughter off at
nursery school every morning and also buys a season ticket
for the bus, so that she does not have to cycle in the rain
and snow. But after a month the classes start to bore her.
After two months she drops out because the course does
20 ⁄Is It worth It?
not match her expectations, and she finds it hard to con-
centrate because she is worried about her financial situa-
tion. The college's education counsellor tries to persuade
her to stay, but in vain. Jane says that she has given up on
education, and would rather get a job when the right op-
portunity arises. The next day, she is back at Citizen Ser-
vices to apply for social security benefit. Once again, she
has gone back to Start.
Could Jane's life be different, if different interventions
had been taken for her? If the municipality had paid for a
course in planning and managing her private finances, in-
stead of passive support? If she had been offered a practi-
cal training position at a nursing home, for example, to in-
crease her chances of getting a permanent job? If the mu-
nicipality had offered her active assistance when she left
school at 16 without any idea of what she wanted to do, and
without the support she needed to get on in life?
We must assume that the answer is yes – since we do
know that it is possible to make positive changes to the
course of your life with the help of positive intervention. If
we calculate the total costs of the alternative interventions
listed above and compare them with the value they can be
expected to create, we can see that the municipality would
have saved up to DKK 200,000 per year if Jane had gained
educational qualifications, a job and stable finances, and
had thereby been able to achieve a secure life for herself
and her daughter.
thE sroI ANALYsIs IN A hIstorICAL PErsPECtIVE
Jane's story shows that even a simple analysis of social re-
turn on investment can help to illustrate both the welfare
and economic outcomes of a given intervention. The knowl-
edge gained via the analysis can also contribute to answer-
soCIAL rEtUrN oN INVEstMENt – A GUIDE For thE soCIAL wELFArE ArEA ⁄ 21
ing key questions: is the least expensive intervention also
the least expensive in the long term? Is early intervention
better than late? Which interventions work? Which do not
work? How much should be invested in people like Jane,
seen from a welfare-economic perspective?
Considering Jane's life and reflecting on how we can
help her, it thus makes good sense to think in terms of so-
cial return on investment, and also to question whether
specific interventions work or not. It is therefore surprising
that the concept of SROI is actually relatively new.
Ideas about measuring social interventions have natu-
rally existed for decades, but an actual method did not ap-
pear until the late 1990s, when the Roberts Enterprise De-
velopment Fund (REDF) and Harvard Business School to-
gether examined the welfare-economic outcomes of em-
ployment interventions in San Francisco – and quantified
them in economic terms.1 Since then, the method has been
further developed and refined by practicians and theoreti-
cians alike, and especially by American and British re-
searchers, who have made significant academic contribu-
tions.2
In Denmark too, there has been increased focus in re-
cent years on elucidating the results of social welfare inter-
ventions. Even though the SROI analysis is a relative new-
comer, both public and non-profit organisations have long
been working on similar analyses to show how their inter-
ventions and projects can make a difference. These analy-
ses have made a significant contribution to focusing the
authorities' attention on whether society gets enough for
its money. In particular, they have served as a tool for front-
1 Jed Emerson, Jay Wachowicz and Suzi Chun: "Social Return on Invest-ment: Exploring Aspects of Value Creation in the Nonprofit Sector". REDF (2000).
2 Jayne Jönsson: "Social Return on Investment: Rooms for improvement and research" (2013).
22 ⁄Is It worth It?
line employees, who have suddenly been able to document
the value of their work – giving them far more influence in
any discussion of priorities.
Even though the SROI method has gained some ground,
there is still no universal method of assessing social return
on investment. It must also be said that analyses of social
return on investment vary considerably in terms of scope,
content, method and degree of detail. If we already have a
lot of knowledge about an intervention area, it will be eas-
ier to map social return on investment, all other things be-
ing equal. On the other hand, if we have limited knowledge
of, for instance, costs, target group and the potential out-
comes of the intervention, an analysis will naturally be
more difficult. The level of detail is also related to the pur-
pose of the investigation and the resources available, and
whether the timing perspective is shorter or longer.
Good results in GreenlandMette Lindgaard relates: As a Deloitte consultant and
partner I have been to Greenland numerous times,
first to analyse foster families and residential insti-
tutions, and later to support the country's family
centres in their interventions for some of the most
vulnerable children and their families. In the family
area, Greenland is very different to Denmark. Close
to 10 per cent of Greenlandic children are taken into
care, either with foster families or in institutions,
while in Denmark the number can be counted per
thousand. Their stories are often heart-rending, es-
pecially among the most vulnerable families, who
often struggle with substance and alcohol abuse, un-
employment and mental health issues. As always,
the children suffer the most.
soCIAL rEtUrN oN INVEstMENt – A GUIDE For thE soCIAL wELFArE ArEA ⁄ 23
The fact that so many children are taken into care
is not just a sad reminder of the social problems that
Greenland faces, but also an administrative chal-
lenge, since there are quite simply not enough foster
families and institution places. Many of the children
I have spoken to have been taken into care in four to
five different places, giving them very poor prospects
of combating the negative intergenerational legacy.
The Government of Greenland has, therefore, had
the longstanding aim of improving its preventive in-
terventions for these families – and of measuring
whether the preventive interventions have any ef-
fect. The aim was – and still is – to keep the families
together and to improve the children's welfare. It is
also vital to share experience and that politicians,
managers and case officers all gain a better under-
standing of what actually works.
In cooperation with the centres' staff we therefore
developed a simple method of screening the vulner-
able children: we measured their health, their ab-
sence from school, their development and leisure in-
terests, and their family circumstances – in order to
identify their point of departure and take the right
action.
Based on this continuous screening, the family
centres have taken a major step towards being able
to offer the right interventions to vulnerable chil-
dren and adolescents. They can only be assured of a
better future when we begin to follow up on the var-
ious measurement parameters, collect and evaluate
data and, not least, learn from each other.
I would call the development in Greenland a quan-
tum leap – even though the method has not yet been
fully implemented. It is a quantum leap because, as
part of the daily work, the family centres' employees
24 ⁄Is It worth It?
have begun to use the professional systematic ap-
proach that is needed to be able to follow up on and
measure the outcomes of the various interventions.
This systematic approach is especially vital for the
preventive interventions that may not pay their way
from the first day, but will be worthwhile in the
longer term. The family centres are, quite simply,
thinking and working in a whole new way – for the
benefit of the many vulnerable Greenlandic children.
We also have numerous good examples of how these
preventive interventions do pay off. The most pow-
erful argument is probably that the method has
made it possible to help 15-20 families for the price
of a single place in a residential institution.
MorE thAN AN ECoNoMIC ANALYsIs
There can be strong variation in analyses of social return
on investment, but they all share in common that they usu-
ally depend on a cross-disciplinary methodology that also
borrows from various social science disciplines. The SROI
method – as it was developed at Harvard Business School –
is, for example, inspired by an economic approach that cal-
culates outcomes in quantitative terms. This means setting
hard numbers for what can be achieved with an interven-
tion. In particular, there are clear parallels between SROI
and a classical cost-benefit analysis, which sets up a num-
ber of project-related and operational costs against a series
of personal and societal benefits. By compiling all benefits
and deducting the total costs, an SROI analysis can assess
the overall intervention compared to other alternatives. If
various time horizons are also set, it is possible to reveal
whether the intervention is also profitable in the long term.
soCIAL rEtUrN oN INVEstMENt – A GUIDE For thE soCIAL wELFArE ArEA ⁄ 25
These economic scenarios are a key aspect of an overall as-
sessment of social return on investment and, among other
things, make it possible to assess how the costs change
over time, and when the costs of the investment will be re-
couped – which in the investment world is called break-
even.
So is the SROI method just an economic calculation?
Definitely not. The economic calculations in an SROI anal-
ysis can never stand alone, but must always be combined
with softer welfare outcomes. For the young and vulnera-
ble, these welfare outcomes might be improved health, bet-
ter family relations, a wider network, greater self-determi-
nation and participation in the labour market, and well-be-
ing and security.
To put it bluntly, the overall objective of an SROI analy-
sis is to measure social return on investment by document-
ing and evaluating the effects of social changes. This con-
cerns the economic effects that directly impact budgets
(when a client is, for instance, assisted with transitioning
from passive welfare benefits to a job), as well as the welfare
outcomes such as increased quality of life and greater moti-
vation. Even though the welfare outcomes cannot be im-
mediately identified in economic terms, they often mani-
fest themselves as economic benefits in the longer term. In
this context, the return on investment is a well-known meas-
ure of how much we get for each krone invested. Adding so-
cial to this equation emphasises the focus on creating value
for society and its citizens. This also underlines how SROI
is different to and far more than an economic analysis
since it also includes such dimensions as welfare and so-
cial returns, as the Figure shows.
26 ⁄Is It worth It?
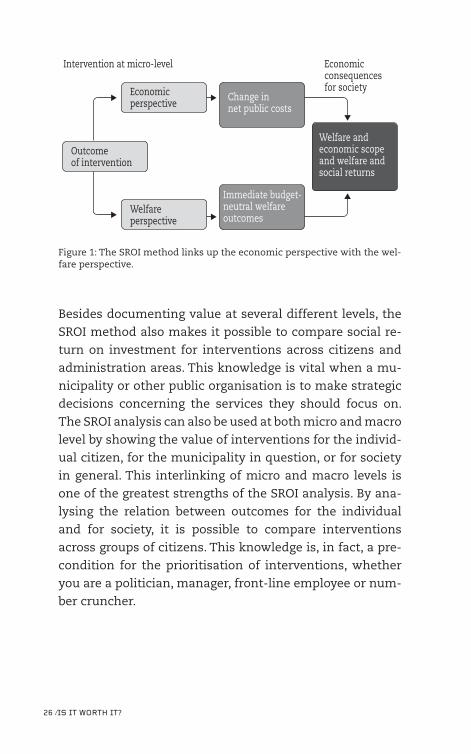
Economic consequences for society
Intervention at micro-level
Economic perspective
Change in net public costs
Immediate budget-neutral welfare outcomes
Welfare perspective
Outcome of intervention
Welfare and economic scope and welfare and social returns
Figure 1: The SROI method links up the economic perspective with the wel-fare perspective.
Besides documenting value at several different levels, the
SROI method also makes it possible to compare social re-
turn on investment for interventions across citizens and
administration areas. This knowledge is vital when a mu-
nicipality or other public organisation is to make strategic
decisions concerning the services they should focus on.
The SROI analysis can also be used at both micro and macro
level by showing the value of interventions for the individ-
ual citizen, for the municipality in question, or for society
in general. This interlinking of micro and macro levels is
one of the greatest strengths of the SROI analysis. By ana-
lysing the relation between outcomes for the individual
and for society, it is possible to compare interventions
across groups of citizens. This knowledge is, in fact, a pre-
condition for the prioritisation of interventions, whether
you are a politician, manager, front-line employee or num-
ber cruncher.
soCIAL rEtUrN oN INVEstMENt – A GUIDE For thE soCIAL wELFArE ArEA ⁄ 27
sroI IN thE rEAL worLD
According to the SROI theory, the economic perspective
and the welfare perspective are closely related. This is also
the case in the real world.
A good example of this interrelation is Rebild Munici-
pality's Project New Start, which was established to ensure a
more holistic intervention for the vulnerable families in the
municipality who, up until then, had been in contact with
the municipality's administrative departments, but often
without any measurable effect. The families were charac-
terised by complex social problems and a large proportion
of the parents had mental health issues, had been out of
work for a long time, and were subject to several different
social interventions. The children typically inherited the
parents' problems and thus achieved significantly less at
school than their classmates from less challenged back-
grounds. Many of the children also suffered from low self-
esteem and mental health problems, and were generally
left to fend for themselves.
Instead of addressing various symptoms, the families
subject to Project New Start were offered a cohesive, priori-
tised and solid intervention, across the municipality's pro-
fessional areas. This included efforts to create trusting re-
lationships between case officers and the families, so that
together they could work towards realistic solutions to the
families' problems. The project contributed to improving
the welfare of the individual families, with focus on sup-
porting the children's schooling and the parents' participa-
tion in the labour market or the education system.
Project New Start has been a success for the vulnerable
families in Rebild since the interventions have led to not
only a number of positive welfare outcomes for the individ-
ual families, but also beneficial economic effects, even in
the short term. The parents have received help to tackle
28 ⁄Is It worth It?
their problems, increasing their motivation to take control
of their own lives. These improvements have had an ex-
tremely positive impact for many of the children: they have
stronger ties to their schools, more activities outside school,
and greater self-esteem. In addition, getting more parents
into work or education has led to economic gains in the
form of reduced transfer incomes. In the longer term, the
economic savings may prove to be considerably greater, es-
pecially if the deadlock of social inheritance is broken, so
that the vulnerable children do not grow up into vulnerable
adults.
kNowING whAt works
The learning from Project New Start and many similar pro-
jects is that the way forward in the social welfare area is to
know more about what actually works. One might ask: "Do
we really know so little about the effect of social welfare in-
terventions?" We must have learned something in Den-
mark, after so may decades with a well-consolidated social
services system.
We do know something, of course, as we can see that
many of the unemployed do find work, that substance
abusers are helped, and that many vulnerable children and
adolescents grow up into adults who live good lives.
Yet we still lack vital knowledge, since if we add more
nuances to the question it becomes harder to give precise
answers. Do the long-term unemployed find work due to
specific interventions? Would alternative interventions
help a larger proportion of substance abusers than is the
case today? Which interventions are the actual reason that
the young people manage to live good adult lives?
By assessing an intervention's results – while taking ac-
count of other factors that might affect the intervention's
soCIAL rEtUrN oN INVEstMENt – A GUIDE For thE soCIAL wELFArE ArEA ⁄ 29
recipients – outcome evaluations can help to underpin the
assumption that interventions do actually work.
When an outcome of a specific intervention has been
repeatedly identified, we say that there is evidence of its ef-
fect. The evidence concept is used in many professional
disciplines, and there are varying perceptions of what evi-
dence actually is. When used in conjunction with social in-
terventions, the concept expresses how decisions concern-
ing users' welfare are carefully and critically based on ap-
plying the current best evidence in the area. "Current best
evidence" does not necessarily mean that there is evidence
that a given intervention has a specific effect, but that, at
the time in question, it is the best-qualified response to a
given problem.
The evidence philosophy is an underlying factor in anal-
yses of social return on investment. It is vital that interven-
tions are based on the current best evidence, but it is also
important that new knowledge is accumulated through
careful evaluation of social return on investment from the
various interventions.
As described, Rebild Municipality has achieved major
benefits from coordinating their social and employment in-
terventions for vulnerable families. The interventions have
also emphasised that the greatest problem for vulnerable
children and adolescents is very likely to be their parents.
When the parents' lives improve, this also affects the chil-
dren. The experience from Rebild is now being dissemi-
nated in other municipalities, with inspiration from, for ex-
ample, the holistic approach based on one coordinating
case officer. However, disseminating this practice requires
an ability to assess social return on investment and give
the assurance that the interventions are effective, so that
the planning, evaluation and collection of knowledge are
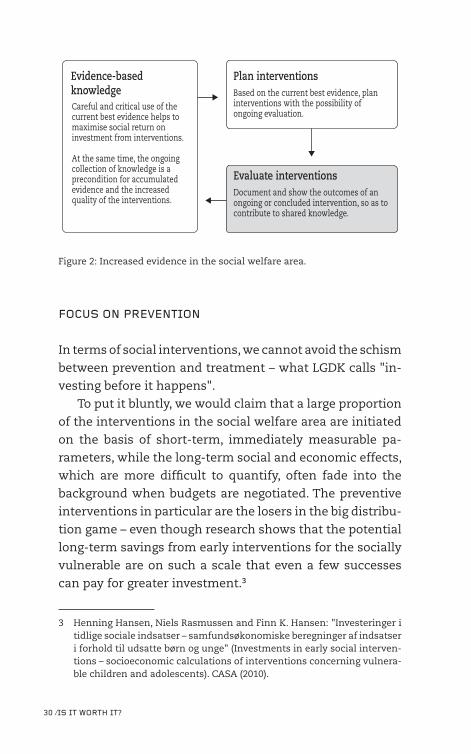
part of a continuous cycle, as illustrated here:
30 ⁄Is It worth It?
Evidence-based knowledge
Plan interventions
Careful and critical use of the current best evidence helps to maximise social return on investment from interventions.
At the same time, the ongoing collection of knowledge is a precondition for accumulated evidence and the increased quality of the interventions.
Based on the current best evidence, plan interventions with the possibility of ongoing evaluation.
Evaluate interventionsDocument and show the outcomes of an ongoing or concluded intervention, so as to contribute to shared knowledge.
Figure 2: Increased evidence in the social welfare area.
FoCUs oN PrEVENtIoN
In terms of social interventions, we cannot avoid the schism
between prevention and treatment – what LGDK calls "in-
vesting before it happens".
To put it bluntly, we would claim that a large proportion
of the interventions in the social welfare area are initiated
on the basis of short-term, immediately measurable pa-
rameters, while the long-term social and economic effects,
which are more difficult to quantify, often fade into the
background when budgets are negotiated. The preventive
interventions in particular are the losers in the big distribu-
tion game – even though research shows that the potential
long-term savings from early interventions for the socially
vulnerable are on such a scale that even a few successes
can pay for greater investment.3
3 Henning Hansen, Niels Rasmussen and Finn K. Hansen: "Investeringer i tidlige sociale indsatser – samfundsøkonomiske beregninger af indsatser i forhold til udsatte børn og unge" (Investments in early social interven-tions – socioeconomic calculations of interventions concerning vulnera-ble children and adolescents). CASA (2010).
soCIAL rEtUrN oN INVEstMENt – A GUIDE For thE soCIAL wELFArE ArEA ⁄ 31
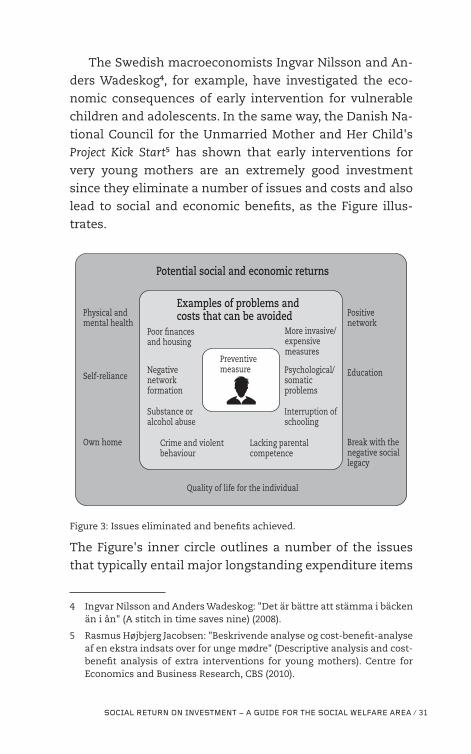
The Swedish macroeconomists Ingvar Nilsson and An-
ders Wadeskog4, for example, have investigated the eco-
nomic consequences of early intervention for vulnerable
children and adolescents. In the same way, the Danish Na-
tional Council for the Unmarried Mother and Her Child's
Project Kick Start5 has shown that early interventions for
very young mothers are an extremely good investment
since they eliminate a number of issues and costs and also
lead to social and economic benefits, as the Figure illus-
trates.
Potential social and economic returns
Quality of life for the individual
Physical and mental health
Positive network
Education
Break with the negative social legacy
Preventive measure
Poor �nances and housing
More invasive/ expensive measures
Psychological/ somatic problems
Negative network formation
Substance or alcohol abuse
Crime and violent behaviour
Lacking parental competence
Interruption of schooling
Self-reliance
Own home
Examples of problems and costs that can be avoided
Figure 3: Issues eliminated and benefits achieved.
The Figure's inner circle outlines a number of the issues
that typically entail major longstanding expenditure items
4 Ingvar Nilsson and Anders Wadeskog: "Det är bättre att stämma i bäcken än i ån" (A stitch in time saves nine) (2008).
5 Rasmus Højbjerg Jacobsen: "Beskrivende analyse og cost-benefit-analyse af en ekstra indsats over for unge mødre" (Descriptive analysis and cost-benefit analysis of extra interventions for young mothers). Centre for Economics and Business Research, CBS (2010).
32 ⁄Is It worth It?
on public budgets. The outer circle illustrates the social and
socioeconomic returns that can also result from successful
interventions. Effective interventions will thus have a dual
effect, since it is possible to make savings on the expendi-
ture side and also achieve economic and social returns. By
systematically collecting evidence of the outcomes of so-
cial welfare interventions, it is possible to specify which in-
terventions make a difference, why they do so, and how.
Since research indicates that preventive interventions are
particularly effective, there are many good reasons to focus
on them.
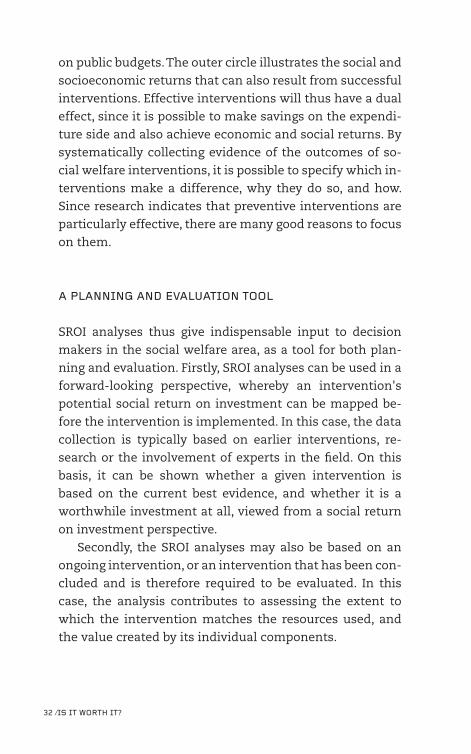
A PLANNING AND EVALUAtIoN tooL
SROI analyses thus give indispensable input to decision
makers in the social welfare area, as a tool for both plan-
ning and evaluation. Firstly, SROI analyses can be used in a
forward-looking perspective, whereby an intervention's
potential social return on investment can be mapped be-
fore the intervention is implemented. In this case, the data
collection is typically based on earlier interventions, re-
search or the involvement of experts in the field. On this
basis, it can be shown whether a given intervention is
based on the current best evidence, and whether it is a
worthwhile investment at all, viewed from a social return
on investment perspective.
Secondly, the SROI analyses may also be based on an
ongoing intervention, or an intervention that has been con-
cluded and is therefore required to be evaluated. In this
case, the analysis contributes to assessing the extent to
which the intervention matches the resources used, and
the value created by its individual components.
soCIAL rEtUrN oN INVEstMENt – A GUIDE For thE soCIAL wELFArE ArEA ⁄ 33
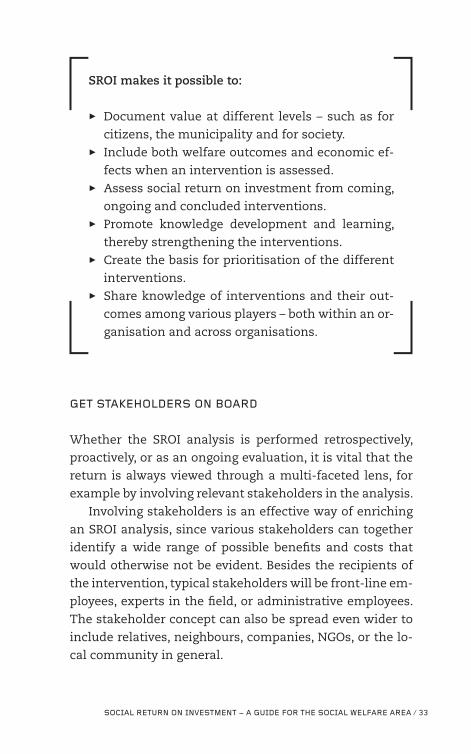
SROI makes it possible to:
> Document value at different levels – such as for
citizens, the municipality and for society.
> Include both welfare outcomes and economic ef-
fects when an intervention is assessed.
> Assess social return on investment from coming,
ongoing and concluded interventions.
> Promote knowledge development and learning,
thereby strengthening the interventions.
> Create the basis for prioritisation of the different
interventions.
> Share knowledge of interventions and their out-
comes among various players – both within an or-
ganisation and across organisations.
GEt stAkEhoLDErs oN BoArD
Whether the SROI analysis is performed retrospectively,
proactively, or as an ongoing evaluation, it is vital that the
return is always viewed through a multi-faceted lens, for
example by involving relevant stakeholders in the analysis.
Involving stakeholders is an effective way of enriching
an SROI analysis, since various stakeholders can together
identify a wide range of possible benefits and costs that
would otherwise not be evident. Besides the recipients of
the intervention, typical stakeholders will be front-line em-
ployees, experts in the field, or administrative employees.
The stakeholder concept can also be spread even wider to
include relatives, neighbours, companies, NGOs, or the lo-
cal community in general.
34 ⁄Is It worth It?
Stakeholders can thus contribute to expanding the
number of experienced returns (or experienced costs), but
can also help to expand the concept of return in itself. Re-
turns are thus not only expressed in the traditional sense –
what is typically called citizen-experienced quality – but also
as organisational or professional returns, which are at least
just as important. For example, an intervention that im-
proves internal work processes or case handling will con-
cern very different stakeholder groups to an intervention
that is based on close contact with clients. Front-line em-
ployees can pinpoint which outcomes stem from the inter-
vention, while in other cases it is important to elucidate the
citizen-experienced quality via interviews with or ques-
tionnaire surveys of the target group. This will make it pos-
sible to measure several aspects of social return on invest-
ment, just as it will be easier to identify which elements of
the intervention actually create value.
soCIAL rEtUrN oN INVEstMENt – oNE stEP At A tIME
We have, hopefully, now shown that SROI analyses are
worth spending time on. The obvious question is therefore:
How should an analysis of social return on investment be
implemented? The answer depends on the level of ambi-
tion, the focus of the analysis and the resources available.
In its simplest form, an analysis of social return on invest-
ment may consist of a number of simple before-and-after
measurements that reveal the connection between inter-
vention and outcome. In a more sophisticated form, the
analysis can follow the six continuous phases shown in the
Figure, which together constitute the actual SROI method
and help to ensure validity and systematisation.
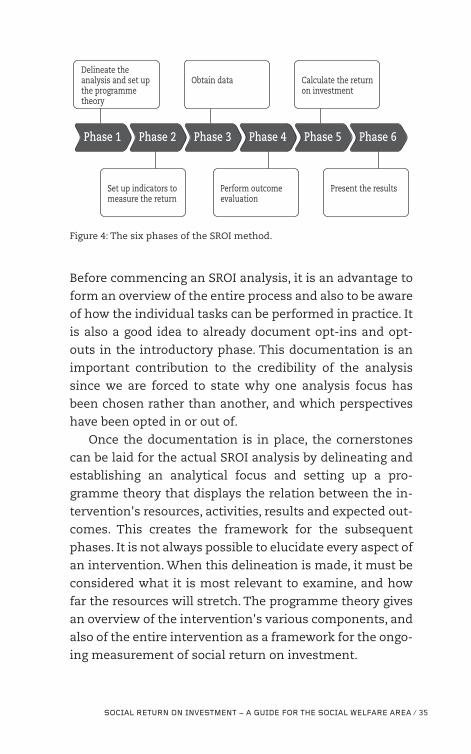
soCIAL rEtUrN oN INVEstMENt – A GUIDE For thE soCIAL wELFArE ArEA ⁄ 35
Phase 1 Phase 2 Phase 3 Phase 4 Phase 5 Phase 6
Delineate the analysis and set up the programme theory
Present the resultsPerform outcome evaluation
Set up indicators to measure the return
Obtain data Calculate the return on investment
Figure 4: The six phases of the SROI method.
Before commencing an SROI analysis, it is an advantage to
form an overview of the entire process and also to be aware
of how the individual tasks can be performed in practice. It
is also a good idea to already document opt-ins and opt-
outs in the introductory phase. This documentation is an
important contribution to the credibility of the analysis
since we are forced to state why one analysis focus has
been chosen rather than another, and which perspectives
have been opted in or out of.
Once the documentation is in place, the cornerstones
can be laid for the actual SROI analysis by delineating and
establishing an analytical focus and setting up a pro-
gramme theory that displays the relation between the in-
tervention's resources, activities, results and expected out-
comes. This creates the framework for the subsequent
phases. It is not always possible to elucidate every aspect of
an intervention. When this delineation is made, it must be
considered what it is most relevant to examine, and how
far the resources will stretch. The programme theory gives
an overview of the intervention's various components, and
also of the entire intervention as a framework for the ongo-
ing measurement of social return on investment.
36 ⁄Is It worth It?
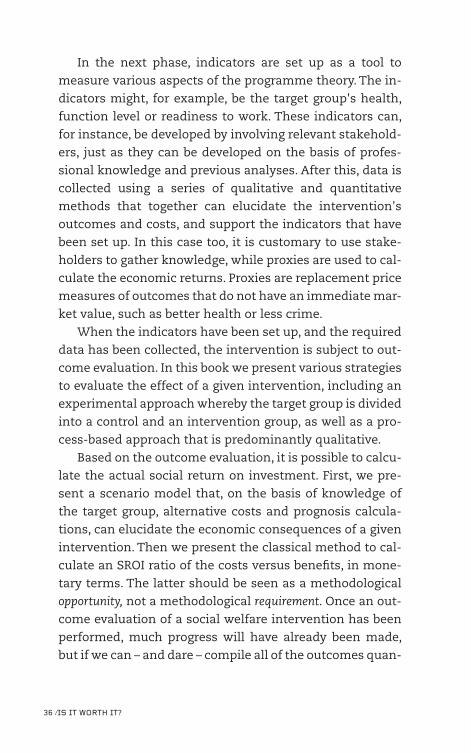
In the next phase, indicators are set up as a tool to
measure various aspects of the programme theory. The in-
dicators might, for example, be the target group's health,
function level or readiness to work. These indicators can,
for instance, be developed by involving relevant stakehold-
ers, just as they can be developed on the basis of profes-
sional knowledge and previous analyses. After this, data is
collected using a series of qualitative and quantitative
methods that together can elucidate the intervention's
outcomes and costs, and support the indicators that have
been set up. In this case too, it is customary to use stake-
holders to gather knowledge, while proxies are used to cal-
culate the economic returns. Proxies are replacement price
measures of outcomes that do not have an immediate mar-
ket value, such as better health or less crime.
When the indicators have been set up, and the required
data has been collected, the intervention is subject to out-
come evaluation. In this book we present various strategies
to evaluate the effect of a given intervention, including an
experimental approach whereby the target group is divided
into a control and an intervention group, as well as a pro-
cess-based approach that is predominantly qualitative.
Based on the outcome evaluation, it is possible to calcu-
late the actual social return on investment. First, we pre-
sent a scenario model that, on the basis of knowledge of
the target group, alternative costs and prognosis calcula-
tions, can elucidate the economic consequences of a given
intervention. Then we present the classical method to cal-
culate an SROI ratio of the costs versus benefits, in mone-
tary terms. The latter should be seen as a methodological
opportunity, not a methodological requirement. Once an out-
come evaluation of a social welfare intervention has been
performed, much progress will have already been made,
but if we can – and dare – compile all of the outcomes quan-
titatively, we will have a clear picture of whether the inter-
vention is a worthwhile investment.
rEAD MorE
> Dahler-Larsen, Peter: Evaluering af projekter – og andre ting,
som ikke er ting (Evaluation of projects – and other things
that are not things). Syddansk Universitetsforlag (2013)
> Hansen, Henning, Niels Rasmussen and Finn K. Hansen:
"Investeringer i tidlige sociale indsatser – samfund-
søkonomiske beregninger af indsatser i forhold til ud-
satte børn og unge" (Investments in early social welfare
interventions – socioeconomic calculations of interven-
tions concerning vulnerable children and adolescents")
(2010).
> Jacobsen, Rasmus Højbjerg: "Beskrivende analyse og
cost-benefit-analyse af en ekstra indsats over for unge
mødre" (Descriptive analysis and cost-benefit analysis of
an extra intervention for young mothers). Centre for Eco-
nomics and Business Research, CBS (2010)
> Jönsson, Jayne: "Social Return on Investment: Rooms for
improvement & research". Forum for Social Innovation
Sweden (2013)
> New Economics Foundation: "Small Slices of a Bigger Pie:
Attribution in SROI" (2011)
> Riisom, Thomas: Elementær evaluering (Elementary evalu-
ation). Gyldendal Akademisk (2013)
> Danish Health and Medicines Authority: "Vejviser til
evaluering" (Guide to evaluation) (2006)
> The SROI Network: "A Guide to Social Return on Invest-
ment" (2012)

oPtING IN AND oUt ⁄ 39
02oPtING IN AND oUt
Bill is aged 48. He is a trained educationalist and has a per-
manent job in an after-school centre. During the last month,
however, he has been on stress-related sick leave, and his
doctor believes that this condition has lasted for more than
a year. The doctor also assesses that Bill will not be able to
get back to work full-time until after another three months'
sick leave. Overall, this sick leave costs the municipality al-
most DKK 90,000, among other things to cover sick leave
benefit and follow-up interviews.
Based on the doctor's assessment, the municipality
grants sick leave benefit to Bill, who is then on passive sick
leave for the next three months, until he returns to work,
by agreement with his employer. After a few months back
at work, he goes back on sick leave, and once again the di-
agnosis is stress.
This time, the municipality takes a different approach.
Bill is granted ten hours of occupational psychologist con-
sultations – with the consequence that he gives up his job
as an educationalist and instead takes a subsidised-salary
position as a janitor in a lower secondary school. For the
first few months, he works 15 hours per week, and then
gradually builds up to full time.
40 ⁄Is It worth It?
The municipality's staff are satisfied with this result.
The psychologist consultations and subsidised salary cost
close to DKK 115,000 (i.e. DKK 25,000 more than the sick
leave benefit so far). On the other hand, Bill gains a new,
permanent job and does not go back on sick leave, which
gives major savings on welfare benefits, as well as extra an-
nual tax revenue from the salary he earns.
thE Art oF sEttING LIMIts
Hindsight is a wonderful thing when an intervention proves
to be a success, or a failure. Yet rather than rationalising af-
ter the event and coming up with explanations, the focus
should be on using the knowledge achieved.
Although SROI analyses are an effective means of gath-
ering information, to be able to perform a full analysis it is
necessary to clarify a number of key issues: What do we
wish to elucidate? To what extent do we wish to elucidate it?
Any why do we wish to elucidate it, i.e. for what purpose?
A good SROI analysis is based on a clear and well-de-
fined delineation that ensures focus on the particular in-
tervention (or aspects of the intervention) that is to be elu-
cidated. When this delineation is made, it is important to
take account of the overall purpose of the analysis, and to
focus on specific types of returns, and the available re-
sources.
A thorough delineation could be based on the following
four pieces of advice:
1. Clarify the purpose of the analysisThe best approach to performing an SROI analysis is to
state explicitly why it is to be performed. The decision to
perform an analysis of social return on investment is usu-
ally based on an overall objective, and it is important to
oPtING IN AND oUt ⁄ 41
highlight this objective. This might be a wish to prioritise
the array of interventions, to assess the return on invest-
ment of a pilot project in order to disseminate a given in-
tervention, or to gain an overview of the use of resources
and cost effectiveness in the longer term. A clear and ex-
plicit purpose of the analysis will give a clear objective and
set the direction for the ongoing work.
2. Determine types of returnAn analysis of social return on investment can elucidate
professional, organisational and citizen-experienced re-
turns. Professional returns are often related to the results of
an intervention. For example, does the citizen gain a wider
network, greater self-determination, or closer ties with the
education system or the labour market? Organisational re-
turns express whether the organisation can function more
effectively via, for example, better organisation of the work,
or better utilisation of resources. Finally, the citizen-experi-
enced returns are a measure of whether the intervention has
actually created value, viewed from the user's perspective.
For example, a municipal intervention to strengthen the
preventive social work for vulnerable children can be multi-
faceted and based on a number of activities. This might be
courses for employees in municipal childcare institutions,
more flexible cooperation between institutions and admin-
istrative departments, or greater focus on training parents.
There are also returns for society, which should be viewed in
a broader perspective, since the interventions often have a
positive outcome for more people than the actual citizens
who are the recipients of the interventions. Such outcomes
might be greater security in a residential area, or greater
well-being in school classes as a consequence of better in-
clusion methods. As the municipalities increasingly enter
into partnerships with NGOs and socioeconomic enter-
prises on handling welfare-related tasks, the returns may
42 ⁄Is It worth It?
also include various types of subsuppliers. In several cases
we have seen how subsuppliers even end up employing
personnel on special terms, including adults with func-
tional impairments or social problems.
In overall terms, an analysis of social return on invest-
ment can be centred on one or several such activities, de-
pending on which returns are to be elucidated. If the anal-
ysis focuses on the professional returns, for example, tools
to measure these returns are required, which often in turn
requires the involvement of professional experts. Assess-
ment of the citizen-experienced returns, on the other hand,
typically requires data to be collected from the target group,
for example via interviews or questionnaire surveys.
3. Consider the time frame and recipientsThe time frame of the analysis also determines the data
collection framework, and thereby the results that it is pos-
sible to measure. If the long-term goal of an intervention is,
for example, to reduce the proportion of children taken into
care, it will require a relatively long time frame to assess
the direct impact of the intervention on the number of chil-
dren taken into care. On the other hand, the outcomes in
the short and medium term, such as whether the parents
achieve enhanced parental skills, commence education, or
achieve employment, can also be assessed on the basis of a
shorter time frame.
It is likewise a good idea to determine the recipient
group of the analysis at an early stage. Various recipient
groups are naturally interested in different perspectives of
the results, and the content and dissemination of the anal-
ysis can be focused according to the recipients. Recipients
might, for example, be decision makers or front-line em-
ployees.
oPtING IN AND oUt ⁄ 43
4. Consider the resources availableFinally, it is necessary to consider the resources available,
which means how much time and how much money it is
possible to allocate, and thereby how extensive an analysis
it is possible to perform. This includes a decision on
whether the analysis is to be performed internally within
the organisation, or whether external expertise is to be in-
volved. Ownership of the process and further competence
development will be one of the advantages of performing
the analysis on an internal basis, just as the organisation's
employees will often know a lot about the target group. Ex-
ternal assistance, on the other hand, can contribute key
competences and a fresh take on the existing work.
Remember explicit considerationsIt is a good idea for any delineation considerations to
be formulated explicitly. Why are specific elements
prioritised, why are specific activities not elucidated,
or why has a specific time frame been selected? Ex-
plicit delineations are often beneficial later in the
process, and can also enhance the methodological
transparency.
SROI in practice
Meaningful employment for vulnerable groupsBybi is a socio-economic enterprise that produces
honey in different areas of Copenhagen. Today, there
are more than 25 apiaries across the city, including
in numerous courtyards and on the roofs of build-
ings such as Copenhagen City Hall and the Bella
Center, and at companies like Lundbeck and Carls-
44 ⁄Is It worth It?
berg. Together, the apiaries produce more than five
tonnes of honey per year.
Bybi is founded on the ambition to build up an in-
dustry that can both improve the environment and
create opportunities for people who have lost con-
tact with the labour market. The enterprise thus of-
fers meaningful employment to a number of socially
vulnerable groups, just as the many apiaries have a
positive impact on the local ecosystem. Bybi's actual
product is honey and products based on honey and
beeswax, which are all produced in the enterprise's
own beehives. Bybi handles the entire value chain:
from setting up and managing the apiaries, to centri-
fuging, packing and then selling back to the compa-
nies. Bybi also trains bee-keepers and provides na-
ture guides in the local area, as well as various infor-
mation events. Homeless people, asylum seekers
and residents in the local area and, not least, enter-
prises and local partners are all involved, and to-
gether they contribute to making honey production
a success in both welfare-economic and social terms.
An SROI analysis of Bybi might begin with the fol-
lowing:
Delineation of the analysis
Purpose of the analysis: Bybi wishes to demonstrate
the effects of its activities, since the enterprise is a
break with the customary framework for social in-
terventions and is also self-financing as a non-profit
association. Bybi will therefore investigate social re-
turn on investment for the socially vulnerable peo
oPtING IN AND oUt ⁄ 45
ple in the urban quarters, and for the residents in
general.
Bybi's objectives: Bybi's objective is to create sustain-
able development, meaningful employment for vul-
nerable people, economic value in society, and secu-
rity and well-being in vulnerable residential areas.
Some quarters of Copenhagen are defined as vulner-
able due to the physical and social challenges of
many small homes and a lack of green urban life, as
well as the residents' low levels of education and
employment.
Returns: The analysis of Bybi focuses especially on
the citizen-experienced returns from the intervention.
Recipients of the analysis: The results of the analysis
are intended for Bybi's partners, including enter-
prises and the City of Copenhagen.
Time frame for the analysis: Some outcomes occur im-
mediately, while others manifest themselves in a
more long-term perspective. The analysis focuses on
the short and medium term.
Available resources: There are sufficient resources to
perform an analysis of relevant elements of the in-
tervention.
Based on the aforementioned considerations, the
analysis can be delineated to an elucidation of social
return on investment created by the project, with fo-
cus on security and the conditions for the socially
46 ⁄Is It worth It?
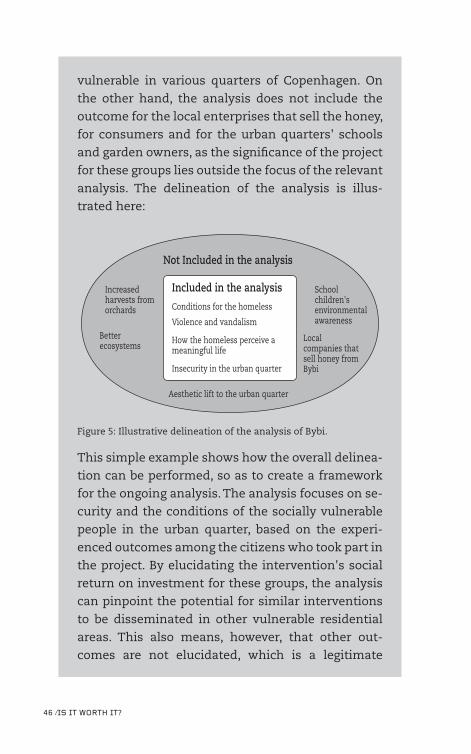
vulnerable in various quarters of Copenhagen. On
the other hand, the analysis does not include the
outcome for the local enterprises that sell the honey,
for consumers and for the urban quarters' schools
and garden owners, as the significance of the project
for these groups lies outside the focus of the relevant
analysis. The delineation of the analysis is illus-
trated here:
Included in the analysis
Conditions for the homeless
Violence and vandalism
How the homeless perceive a meaningful life
Insecurity in the urban quarter
Not Included in the analysis
Aesthetic lift to the urban quarter
Increased harvests from orchards
School children's environmental awareness
Local companies that sell honey from Bybi
Better ecosystems
Figure 5: Illustrative delineation of the analysis of Bybi.
This simple example shows how the overall delinea-
tion can be performed, so as to create a framework
for the ongoing analysis. The analysis focuses on se-
curity and the conditions of the socially vulnerable
people in the urban quarter, based on the experi-
enced outcomes among the citizens who took part in
the project. By elucidating the intervention's social
return on investment for these groups, the analysis
can pinpoint the potential for similar interventions
to be disseminated in other vulnerable residential
areas. This also means, however, that other out-
comes are not elucidated, which is a legitimate
oPtING IN AND oUt ⁄ 47
choice to make. In Bybi's case, this for example con-
cerns the outcome for the neighbouring schools, as
well as the socioeconomic effects of training asylum
seekers for an occupation from which they can later
earn a living.
MotIVAtED CoNCEPtIoNs oF whY AN INtErVENtIoN
works
Once the initial delineation has been made, a concrete pro-
gramme theory for the analysis will typically be set up.
Programme theories can be found in many different
variants and may be called logical models, programme theories
or change theories. The common denominator for these con-
cepts is that the theory sets out justified conceptions of
why an intervention works, thereby giving an (often visual)
overview of the intervention. The programme theory thus
provides an overview of the relation between, on the one
hand, the interventions to be made (or that have been
made) and, on the other hand, the expected effects or out-
comes.
The purpose of describing interventions and outcomes
in this way is to map chains of causes and effects. This en-
tails listing the concrete consequences of the individual el-
ements of an intervention, which might be that working in
an apiary means that vulnerable citizens and others who
are marginalised in our society achieve meaningful every-
day lives, as well as job skills.
By describing the intervention as a cause-and-effect
chain, it becomes easier to monitor the intervention and
assess whether there is continuity between each stage, or
whether the intervention is in reality based on incorrect as-
sumptions. A programme theory is the basis for the ongo-
48 ⁄Is It worth It?
ing analysis, and based on the programme theory it is pos-
sible to set up indicators in the following phases, and as-
sess the scope and duration of the effects.
What is a programme theory?Programme theory is a crucial aspect of an SROI
analysis. It describes how the resources invested are
implemented as short-term and long-term effects.
When a programme theory is drawn up, this high-
lights the intervention's causal relationships by vis-
ualising and describing how the required changes
arise or have arisen.
In concrete terms, the programme theory involves
mapping the causal relationships between resources
(financing, personnel and organisation), activities
(concrete actions), results (the services produced)
and outcomes (the outcomes of the intervention in
the short, medium and longer terms).
The theory makes it possible to assess whether it
is even realistic that the intervention will lead to the
desired results, or whether an observed outcome of
a completed intervention can actually be linked to
the intervention that is assumed to have created it.
On setting up a programme theory, it can be an advantage
to take inspiration from existing knowledge. This might be
research articles or evaluation reports within the field in
question, as well as the involvement of practicians that
have undertaken similar interventions. Stakeholders can
be an important source of knowledge and can contribute to
qualifying the interrelations in the programme theory.
Front-line employees may, for example, often point out
which outcomes are typically achieved from a given activ-
oPtING IN AND oUt ⁄ 49
ity, or define which resources are necessary to perform the
intervention's activities in practice.
Setting up a programme theory is thus a central aspect
of analysing social return on investment, irrespective of
whether a new intervention is to be initiated, or an existing
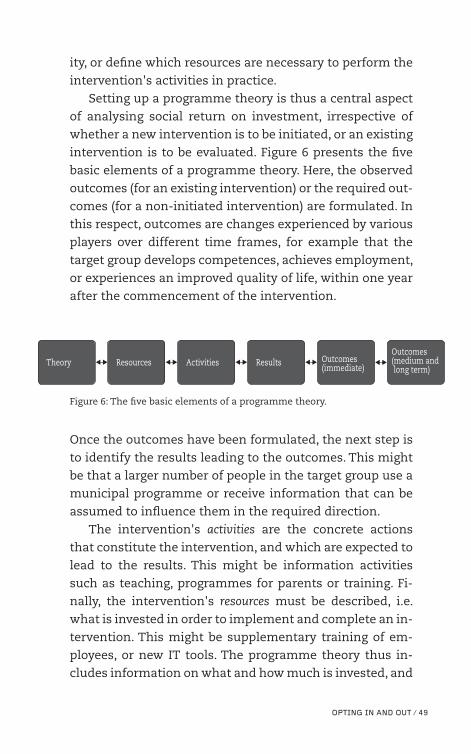
intervention is to be evaluated. Figure 6 presents the five
basic elements of a programme theory. Here, the observed
outcomes (for an existing intervention) or the required out-
comes (for a non-initiated intervention) are formulated. In
this respect, outcomes are changes experienced by various
players over different time frames, for example that the
target group develops competences, achieves employment,
or experiences an improved quality of life, within one year
after the commencement of the intervention.
Theory Resources Activities Results Outcomes(immediate)
Outcomes (medium and long term)
Figure 6: The five basic elements of a programme theory.
Once the outcomes have been formulated, the next step is
to identify the results leading to the outcomes. This might
be that a larger number of people in the target group use a
municipal programme or receive information that can be
assumed to influence them in the required direction.
The intervention's activities are the concrete actions
that constitute the intervention, and which are expected to
lead to the results. This might be information activities
such as teaching, programmes for parents or training. Fi-
nally, the intervention's resources must be described, i.e.
what is invested in order to implement and complete an in-
tervention. This might be supplementary training of em-
ployees, or new IT tools. The programme theory thus in-
cludes information on what and how much is invested, and
50 ⁄Is It worth It?
thereby constitutes a full overview of the costs of the inter-
vention.
ChECk LIst For thE ProGrAMME thEorY
üü In a clear and simple way, the programme theory de-
scribes the fundamental idea behind the intervention.
üü The programme theory describes how we expect the ac-
tivities to lead to the required results.
üü The intervention theory describes the outcomes we
would like the intervention to achieve – or the outcomes
we have already observed.
üü The intervention theory is probable and credible.
SROI in practice
Intervention theory for family centres in GreenlandAs already described, in Greenland a lot of resources
and money are spent on interventions for particu-
larly vulnerable families, who often have a long his-
tory of public welfare benefits and failed interven-
tions. The parents generally lack resources and typi-
cally do not have a stable network. Not surprisingly,
the children suffer as a consequence of the lack of
care and attention. They often attend school irregu-
larly and have family and friends with the same
problems, with consequential social welfare prob-
lems.
The following information is needed in order to
set up an intervention theory for the family centres
in Greenland:
oPtING IN AND oUt ⁄ 51
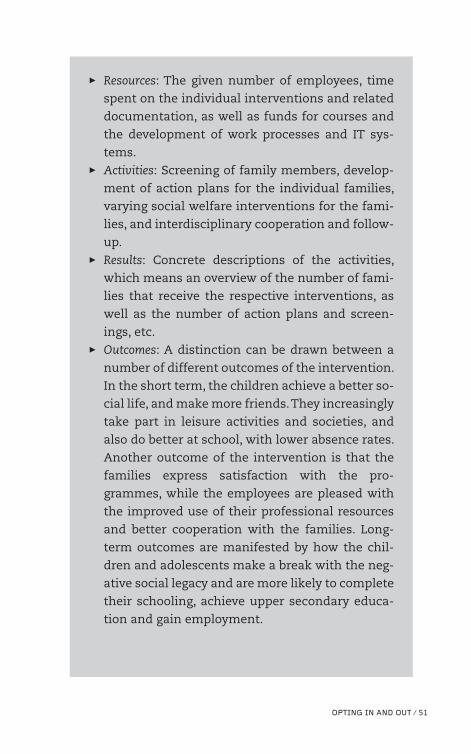
> Resources: The given number of employees, time
spent on the individual interventions and related
documentation, as well as funds for courses and
the development of work processes and IT sys-
tems.
> Activities: Screening of family members, develop-
ment of action plans for the individual families,
varying social welfare interventions for the fami-
lies, and interdisciplinary cooperation and follow-
up.
> Results: Concrete descriptions of the activities,
which means an overview of the number of fami-
lies that receive the respective interventions, as
well as the number of action plans and screen-
ings, etc.
> Outcomes: A distinction can be drawn between a
number of different outcomes of the intervention.
In the short term, the children achieve a better so-
cial life, and make more friends. They increasingly
take part in leisure activities and societies, and
also do better at school, with lower absence rates.
Another outcome of the intervention is that the
families express satisfaction with the pro-
grammes, while the employees are pleased with
the improved use of their professional resources
and better cooperation with the families. Long-
term outcomes are manifested by how the chil-
dren and adolescents make a break with the neg-
ative social legacy and are more likely to complete
their schooling, achieve upper secondary educa-
tion and gain employment.
52 ⁄Is It worth It?
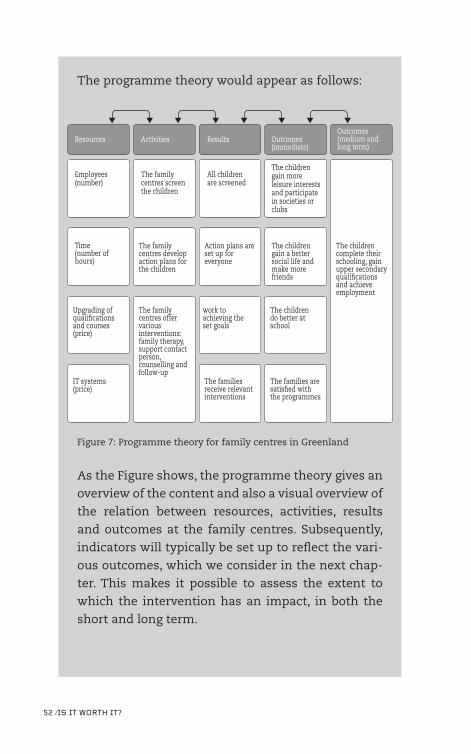
The programme theory would appear as follows:
Resources
Employees (number)
The family centres screen the children
All children are screened
Time (number of hours)
Activities Results Outcomes (immediate)
Outcomes (medium and long term)
The children gain more leisure interests and participate in societies or clubs
The family centres develop action plans for the children
Upgrading of quali�cations and courses (price)
IT systems (price)
The families receive relevant interventions
The families are satis�ed with the programmes
work toachieving theset goals
The children do better at school
The family centres offer various interventions: family therapy, support contact person, counselling and follow-up
Action plans are set up for everyone
The children gain a better social life and make more friends
The children complete their schooling, gain upper secondary quali�cations and achieve employment
Figure 7: Programme theory for family centres in Greenland
As the Figure shows, the programme theory gives an
overview of the content and also a visual overview of
the relation between resources, activities, results
and outcomes at the family centres. Subsequently,
indicators will typically be set up to reflect the vari-
ous outcomes, which we consider in the next chap-
ter. This makes it possible to assess the extent to
which the intervention has an impact, in both the
short and long term.
ChECk LIst For DELINEAtIoN AND ProGrAMME thEorY
üüIs there a clear picture of the purpose of the analysis?
üüIs there an overview of the intervention's resources, ac-
tivities, results and outcomes?
üüIs the relation between resources, activities, results and
outcomes clearly described?
üüIs the analysis based on knowledge from previous inter-
ventions?
üüDoes the analysis involve stakeholders, or otherwise
qualify the interrelations in the programme theory that
has been set up?
üüIs the programme theory precise, and does it include all
outcomes?
rEAD MorE
> Bybi's website: www.bybi.dk
> Den Boligsociale Helhedsplan for Sundholms- og Holm-
bladsgadekvartererne (The holistic social housing plan
for the Sundholm and Holmblad quarters): www.sund-
holmskvarteret.dk
> Helweg-Larsen, Karin, Marie Kruse, Jan Sørensen and
Henrik Brønnum-Hansen: "Voldens pris. Samfundsmæs-
sige omkostninger ved vold mod kvinder" (The price of
violence. Costs to society of violence against women).
The Danish National Institute of Public Health (2010)
> Jacobsen, Rasmus Højbjerg: "Beskrivende analyse og
cost-benefit-analyse af en ekstra indsats over for unge
mødre" (Descriptive analysis and cost-benefit analysis of
an extra intervention for young mothers). Centre for Eco-
nomics and Business Research, CBS (2010)
oPtING IN AND oUt ⁄ 53

> Riisom, Thomas: Elementær evaluering (Elementary evalu-
ation). Gyldendal Akademisk (2015)
> The SROI Network: "A Guide to Social Return on Invest-
ment" (2012)
CAN rEtUrNs ACtUALLY BE MEAsUrED? ⁄ 55
03CAN rEtUrNs ACtUALLY BE MEAsUrED?
Whether our focus is on an intervention to counter loneli-
ness among the elderly, on new cross-disciplinary cooper-
ation to strengthen municipal case handling, or on a spe-
cially designed programme for vulnerable young people, to
help them through the upper secondary education that
they would otherwise not be able to achieve, it is important
to known whether the intervention has the intended out-
come. To do this, indicators must be set up.
As the name suggests, these indicate whether some-
thing has been achieved. A typical indicator might be the
proportion of the target group who use the acquired tools,
rates of absence from school or institution, grades, user
satisfaction, or the proportion of the target group achieving
an education or a job.
Depending on what is measured, indicators can tell us
something about the resources, results or outcomes de-
scribed in the programme theory. Some indicators are dif-
ficult to use, while others are easy to bring into play: For ex-
ample, it is relatively easy to measure the effect of stronger
job interventions by monitoring the number of the unem-
ployed that manage to get jobs. Other factors such as qual-
56 ⁄Is It worth It?
ity of life and happiness may be more difficult to measure.
In these cases, extra care needs to be taken, to avoid erro-
neous interpretations or unintended manipulation.
You really have to try something newMette Lindgaard relates: One of the municipalities I
have had the pleasure of working with over several
years is Rebild Municipality, named for the wonder-
ful hills of Rold Skov.
At one point, the municipality had a dynamic and
creative director who wanted to do something spe-
cial for vulnerable families. In brief, he wanted to
"combine budgets and people", as he put it, to en-
sure holistic interventions for the families that, un-
fortunately all too often, are passed back and forth
between the various administrative departments.
These were some of the ideas that later became Pro-
ject New Start, which we described earlier in this
book. As the director was also the head of the job
centre, adult area, and children and adolescents
with special needs, he had a unique opportunity to
start up a cross-disciplinary project that included
several professional areas and budgets.
This was exactly what we joined forces to do: we
focused on several areas at the same time, on a
cross-disciplinary basis. The cross-disciplinary ap-
proach was that if, for years, you had been offering
various interventions to a vulnerable family without
any significant effect, you really had to try some-
thing new. Using this cross-disciplinary approach,
and working with the family on a holistic basis, it be-
came clear to everyone that most of the existing in-
terventions were really addressing the symptoms,
rather than offering solutions to concrete problems.
CAN rEtUrNs ACtUALLY BE MEAsUrED? ⁄ 57
For example, a lot of money was spent on remedial
classes at school for the children, even though the
root cause of the children's difficulties lay with the
parents.
Besides strengthening the intervention, the holis-
tic approach also made it possible to measure what
actually worked for the parents, children and overall
family. The case officers quite simply began to meas-
ure both the good and the poorer results, although
this did require challenging the old ways, as well as
certain cultural adjustments within the municipal
organisation. This was successful, showing how
well-structured, ongoing follow-up of the families'
welfare is an indispensable tool when interventions
are selected or discarded.
Today, Rebild Municipality is not alone in seeking
to work with vulnerable families on a more holistic
basis. Several other municipalities have followed
suit.
QUANtItAtIVE AND QUALItAtIVE INDICAtors
Indicators can thus be used to measure various aspects of
the intervention, showing whether the interrelations be-
tween resources, activities, results and outcomes described
in the programme theory do actually exist. Interventions in
the social welfare area are complex, and there may be a
number of challenges related to translating welfare out-
comes into measurable results. The solution includes com-
bining quantitative and qualitative indicators. Quantitative
indicators can be described with numerical precision, and
might be sick leave, grades or function level progression.
Qualitative indicators are based on assessments and per-
58 ⁄Is It worth It?
ceptions, thereby reflecting the individual citizen's benefit
from a given intervention. These indicators are e.g. col-
lected via structured interviews or focus groups with the
target group for the intervention, or other relevant stake-
holders.
Good indicators are valid and reliable measures of
whether a given intervention has an effect, whether it is
performed as planned, and whether it is of the necessary
quality. It is therefore also necessary to take a critical ap-
proach to setting up the indicators. It is important to ask
oneself, what can show whether the activities are achieved,
how the results can be measured, and which measurements
indicate that the expected results are achieved.
Examples of indicatorsA number of municipalities wish to strengthen the
preventive work focused on adolescents in disad-
vantaged housing areas by offering parents' meet-
ings, as well as mentoring schemes and group activ-
ities for the youngsters.
The municipalities have set up a programme the-
ory for their projects. This shows that the expected
outcomes include greater motivation to attend
school, more leisure activities for the youngsters,
and strengthening their parents' competences.
Whether the expected outcomes are achieved, and
whether the projects are thereby successful, is as-
sessed on the basis of outcome indicators that are
both quantitative and qualitative in nature. School
indicators are used to measure absence rates and
the proportion of the adolescents who complete
lower secondary school; a security indicator is used
to measure such parameters as the number of re-
ported assaults and acts of vandalism; and an indi-
CAN rEtUrNs ACtUALLY BE MEAsUrED? ⁄ 59
cator is used to capture the benefits of the interven-
tions experienced by both citizens and employees.6
DEVELoPMENt oF INDICAtors
Indicators are typically developed in a number of stages.
First, it is specified what is to be measured. This might be
an activity or an expected outcome. For example, to assess
the development in quality of life, it must first be defined
what quality of life actually is. Quality of life is a wide-rang-
ing concept (typically called a background concept), which is
open to interpretation: Is quality of life a question of phys-
ical health, mental health or a positive outlook– or a com-
bination of these parameters? It is not possible to measure
a given concept (as a systematised concept) unless it has been
defined.
The next stage is to set up indicators reflecting the se-
lected definition of the concept, thereby operationalising
the concept. In this respect, operationalisation concerns
making the concept measurable. For the concept of quality
of life, this may be such dimensions as good humour, social
relations and good health that together give a picture of a
person's quality of life. Finally, the individual indicators are
measured using data that may be quantitative or qualita-
tive.
Figure 8 summarises the development of indicators.
6 Deloitte: "Styrket indsats for udsatte unge i problemfyldte boligområder" (Stronger intervention for vulnerable adolescents in problematic hous-ing areas) (2011).
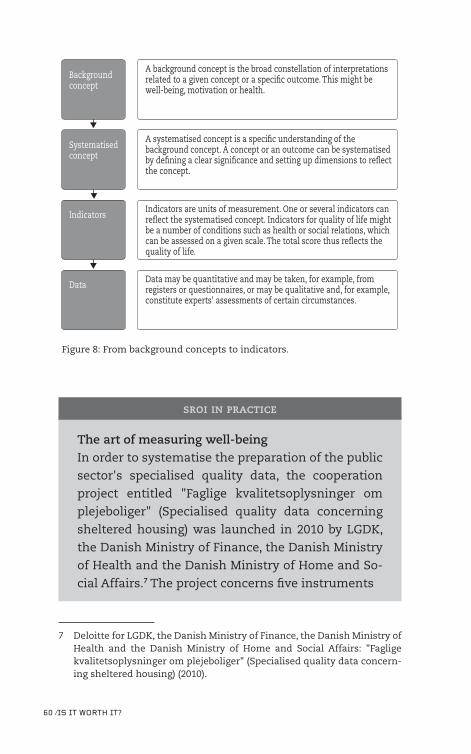
60 ⁄Is It worth It?
Background concept
Systematised concept
Indicators
Data
A background concept is the broad constellation of interpretations related to a given concept or a speci�c outcome. This might be well-being, motivation or health.
A systematised concept is a speci�c understanding of the background concept. A concept or an outcome can be systematised by de�ning a clear signi�cance and setting up dimensions to re�ect the concept.
Indicators are units of measurement. One or several indicators can re�ect the systematised concept. Indicators for quality of life might be a number of conditions such as health or social relations, which can be assessed on a given scale. The total score thus re�ects the quality of life.
Data may be quantitative and may be taken, for example, from registers or questionnaires, or may be qualitative and, for example, constitute experts' assessments of certain circumstances.
SROI in practice
The art of measuring well-beingIn order to systematise the preparation of the public
sector's specialised quality data, the cooperation
project entitled "Faglige kvalitetsoplysninger om
plejeboliger" (Specialised quality data concerning
sheltered housing) was launched in 2010 by LGDK,
the Danish Ministry of Finance, the Danish Ministry
of Health and the Danish Ministry of Home and So-
cial Affairs.7 The project concerns five instruments
7 Deloitte for LGDK, the Danish Ministry of Finance, the Danish Ministry of Health and the Danish Ministry of Home and Social Affairs: "Faglige kvalitetsoplysninger om plejeboliger" (Specialised quality data concern-ing sheltered housing) (2010).
Figure 8: From background concepts to indicators.
CAN rEtUrNs ACtUALLY BE MEAsUrED? ⁄ 61
that can be used independently of each other: in-
struments for wound care, everyday exercise, reduc-
tion in preventive hospital admissions, nutritional
status and knowledge of the elderly's well-being.
The last-mentioned instrument – knowledge of
well-being – is subject to a complex objective, since
well-being is not an unambiguous concept, but can
be seen as the sum of a large number of different fac-
tors that together make it possible to examine the
well-being of residents in sheltered housing.
As an element of systematising the concept of
well-being, the project partners developed an instru-
ment to measure well-being via nine different di-
mensions:
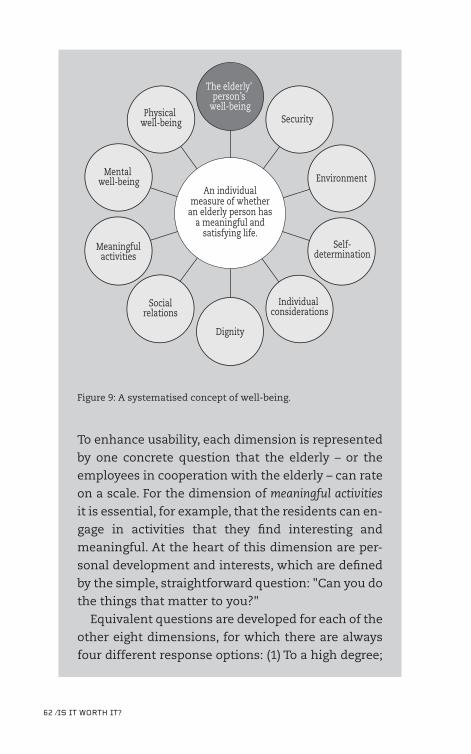
62 ⁄Is It worth It?
The elderly' person’s
well-beingSecurity
Environment
Self-determination
Individual considerations
Dignity
Socialrelations
Meaningfulactivities
Mental well-being
Physical well-being
An individual measure of whether
an elderly person has a meaningful and
satisfying life.
Figure 9: A systematised concept of well-being.
To enhance usability, each dimension is represented
by one concrete question that the elderly – or the
employees in cooperation with the elderly – can rate
on a scale. For the dimension of meaningful activities
it is essential, for example, that the residents can en-
gage in activities that they find interesting and
meaningful. At the heart of this dimension are per-
sonal development and interests, which are defined
by the simple, straightforward question: "Can you do
the things that matter to you?"
Equivalent questions are developed for each of the
other eight dimensions, for which there are always
four different response options: (1) To a high degree;
CAN rEtUrNs ACtUALLY BE MEAsUrED? ⁄ 63
(2) To a certain degree; (3) To a lesser degree; or (4)
Not at all.
The results of the measurement are compiled by
calculating a total score for each dimension. The in-
dicator thus reveals a number of relevant dimen-
sions of well-being, but is also simple and easy to use
in practice.
Nursing homes can use the indicator to perform a
simple assessment of a relatively complex entity,
and can also use the instrument for continuous fol-
low-up. The indicator can also be used to identify di-
mensions that the residents systemically give a low
rating. This gives the individual nursing homes and
municipalities an instrument to assess and enhance
professional quality within specific areas.
tIPs For sEttING UP INDICAtors
Whichever indicators are selected – and how few or many
– the key aspect is that each of them is relevant, robust,
valid and effective. We will return to what these criteria
mean; in the first instance the point is that it is important
that the indicators actually reflect the conditions that are
to be measured.
Here are five tips for setting up indicators:
1. Involve stakeholders > As we have stated several times, stakeholder involve-
ment is an important aspect of an SROI analysis. This
also applies to the selection of indicators, when both ex-
perts and practitioners will have relevant input. During
theSpecialised quality data concerning sheltered housing pro-
ject, for example researchers, experts and naturally the
64 ⁄Is It worth It?
employees who were in dialogue with the elderly them-
selves, were consulted. Specialised expertise was thereby
involved in the development of indicators, while also
gaining a practical view of how the indicators can be
used in everyday work. It can be worthwhile for employ-
ees to attend workshops in which they can give each
other inspiration and together develop or quality assure
the indicators. This applies especially to indicators that
include expert assessments. It is furthermore possible to
ensure the clarity of the measurements by presenting
case examples to the employees and seeing whether
they arrive at the same assessment of a case, just as in-
dicative examples can be developed on this basis.
> Involving stakeholders can also create ownership of the
indicators and acceptance of their subsequent use. It is
naturally important that indicators based on profes-
sional instruments – such as screening instruments –
make sense to the employees who are to use them. A
Danish research project has shown that professional in-
struments in the social welfare area are used and are
even welcomed if they are based on evidence and theo-
ries concerning social relations.8 Just as importantly, the
research project shows that the instruments are appre-
ciated by employees who have attended courses in using
them, while employees who have not been instructed in
the instruments' theoretical background and practical
use often consider the instruments to be cumbersome.
The researchers' conclusion includes that indicators in-
volving specialised personnel must be implemented and
motivated on a detailed basis.
8 Matilde Høybye-Mortensen: Velfærdsstatens dørvogtere. Procesregulering af visitationer på socialområdet. (The guardians of the welfare state. Process regu-lation of referrals in the social welfare area). Museum Tusculanum (2011).
CAN rEtUrNs ACtUALLY BE MEAsUrED? ⁄ 65
2. Use indicators already developed and validated > You often do not have to reinvent the wheel in order to
set up indicators. Indicators have already been devel-
oped and tested in a large number of areas. On setting up
indicators, one should therefore always start by examin-
ing which indicators already exist. An example of a well-
developed and validated indicator is the internationally
validated SDQ (strengths and difficulties questionnaire), de-
veloped in the UK to assess child development.9
> It is naturally not always possible to use indicators that
have already been developed, but time can be saved if
this is an option, together with greater certainty that the
right things are measured. It is also easier to compare
the results with other interventions.
3. Measuring quality at different levelsThe quality of interventions in the social welfare area can
seldom be determined using just one indicator. For exam-
ple, user satisfaction does not necessarily assess the over-
all quality of an intervention. It is also necessary to be
aware of which returns are to be measured, and which
types of indicators should be set up as a consequence. Ex-
amples of indicators are:
>> Indicators that measure professional quality. These express
whether the intervention lives up to the professional cri-
teria for what is to be delivered. Is the citizen offered the
right programme? Does the expected development actu-
ally take place with regard to health, physical function,
network or similar?
9 The Danish National Board of Social Services: www.socialstyrelsen.dk/om-os/instrumenter-til-evalueringer/praesentation-af-instrumenterne. Robert Goodman: "The Strengths and Difficulties Questionnaire: A Re-search Note". Journal of Child Psychology and Psychiatry 38, no. 5, 581-586 (1997).
66 ⁄Is It worth It?
> Indicators to measure the organisational quality express
whether the institution is able to deliver the best possi-
ble quality to the users. This may be indicators that re-
flect how the work is planned, management, use of re-
sources or organisational effectiveness.
> Indicators that measure the citizen-experienced quality reflect
whether, from the user's viewpoint, the intervention has
been relevant and effective – for example whether the
citizen is satisfied with the quality of care, whether par-
ents are satisfied with the childcare institution, or
whether vulnerable citizens feel that they are involved
in the planning of the assistance they receive.
> Indicators that measure broader returns for society reflect
outcomes of the intervention that extend beyond the cit-
izens who receive the intervention. Such indicators can,
for example, measure the expected returns on an inter-
vention for a local area, for NGOs or for enterprises. They
can also measure whether an intervention for disaf-
fected adolescents, for example, improves the sense of
security in a neighbourhood.
4. Combine quantitative and qualitative indicatorsAs stated, it is often necessary to combine quantitative and
qualitative indicators in order to illustrate several aspects
of an intervention. As we have already stated, the qualita-
tive indicators may, for example, be based on a case offic-
er's description of an expert assessment of a child, notes
from observation studies, case notes from a supported
housing employee, documentation of focus group inter-
views, etc. Quantitative indicators, on the other hand, are
based on figures and scales. This might be indicators that
reflect the development in a given target group by display-
ing the function level on a scale; health status shown by the
number of hospital admissions; or labour market participa-
tion illustrated by the proportion of the target group who
CAN rEtUrNs ACtUALLY BE MEAsUrED? ⁄ 67
achieve employment. As a rule, the combination of qualita-
tive and quantitative indicators can give a more rounded
view of the outcome of a given intervention than is possi-
ble with isolated indicators.
5. Prioritise indicators and lay a strategy for data collec-tionIt can be both time- and resource-consuming to implement
a large number of indicators, since indicators usually re-
quire the processing of large amounts of data. It is there-
fore a good idea to rank the indicators, so that priority can
be given to the most important. It is also useful to draw up
a strategy for data collection, with consideration of the fol-
lowing aspects:
>> Who will collect the data? Will the data be collected by the
organisation's employees, or is this so extensive a task
that external help must be hired?
>> When will the data be collected? Must data only be collected
after an intervention has been implemented, or is it nec-
essary to collect data before, during and after, in order to
monitor the development over time?
>> How will the data be collected? Will data be collected via
questionnaires, interviews or another method? Consider
the opportunity to use data that is already available, in
order to save resources and time.
Good indicatorsRACER is a simple method for quality assurance of
indicators. The method is used especially in the EU
system, where it is applied in a large number of are-
68 ⁄Is It worth It?
as.10 According to the RACER method, a good indica-
tor fulfils the following criteria:
> Relevant: Does the indicator measure the out-
comes that it is relevant to measure, rather than
the outcomes that are merely easy to measure?
> Accepted: Is the indicator generally accepted by
employees or others who are to work with it?
> Credible: Is the indicator credible, unambiguous
and easy to interpret?
> Easy: Is the indicator easy to measure, i.e. is it easy
to gather data?
> Robust: Can the indicator be manipulated or mis-
used?
SROI in practice
Holistic intervention for vulnerable families Vulnerable families rarely succeed in breaking the
negative spiral. Often, children from these homes
also end up as recipients of social welfare benefits,
and the interventions that are applied seldom create
any real value.
In an attempt to break this negative pattern, the
Danish Agency for Labour Market and Recruitment
and the Danish Ministry of Children, Gender Equal-
ity, Integration and Social Affairs have designated
ten pilot municipalities that are to take a more holis-
tic approach to vulnerable families via an overall as-
sessment of their problems and opportunities. If the
10 European Commission: "Impact Assessment Guidelines" (2009).
CAN rEtUrNs ACtUALLY BE MEAsUrED? ⁄ 69
project proves to be successful, it will be possible to
extend the intervention to additional municipalities.
By monitoring the intervention closely, social re-
turn on investment can be documented and the in-
tervention's potential benefits can be charted. This
makes it possible to document what works, and
whether the intervention proves to be a good invest-
ment in the longer term.
Outcome of the interventionThe intervention is centred on children and parents
within families. With regard to the parents, the aim
is to strengthen their labour market participation or
help them to start on a course of training or educa-
tion. At the same time, the parents must be sup-
ported, so that they can set out a clear framework for
the children and help them to achieve a stable eve-
ryday routine, with less absence from childcare in-
stitutions or schools.
An expected outcome of the intervention is that
the children thrive and develop positively, just as
their social lives will be strengthened. On the basis
of the programme theory, a number of indicators re-
flecting the outcomes are set up, which thereby
make it possible to monitor whether the required
change is achieved.
Outcome indicatorsA combination of indicators is used to collect knowl-
edge concerning the intervention. For example, the
parents' participation in the labour market and the
education system can be tracked at individual level
in the Danish Central Tax Administration’s eInd-
70 ⁄Is It worth It?
komst register and in DREAM, the Danish Ministry of
Employment's data register for transfer income re-
cipients. Extracts from eSundhed, a digital data plat-
form operated by the Danish State Serum Institute,
show the development in somatic and psychiatric
admissions, as well as medical consultations. Fi-
nally, the municipal finance systems can provide an
overview of the costs of the intervention.
Indicators are also used to show the personal de-
velopment of parents and children. Some of the in-
dicators are context-specific and developed for this
purpose, while others use validated scales and pro-
fessionally supported methods. The latter applies,
for example, to the previously mentioned SDQ tool
that is used to assess children's development, as
well as indicators developed on the basis of a stand-
ardised adult investigation method to assess the
adults' function level.
The Figure shows indicators of the outcomes of
the intervention for adult family members.
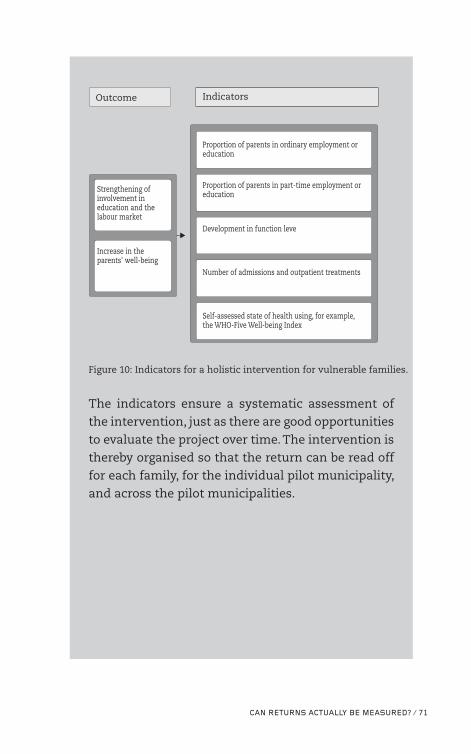
CAN rEtUrNs ACtUALLY BE MEAsUrED? ⁄ 71
Figure 10: Indicators for a holistic intervention for vulnerable families.
The indicators ensure a systematic assessment of
the intervention, just as there are good opportunities
to evaluate the project over time. The intervention is
thereby organised so that the return can be read off
for each family, for the individual pilot municipality,
and across the pilot municipalities.
Outcome Indicators
Proportion of parents in ordinary employment or education
Proportion of parents in part-time employment or education
Development in function leve
Number of admissions and outpatient treatments
Self-assessed state of health using, for example, the WHO-Five Well-being Index
Strengthening of involvement in education and the labour market
Increase in the parents' well-being
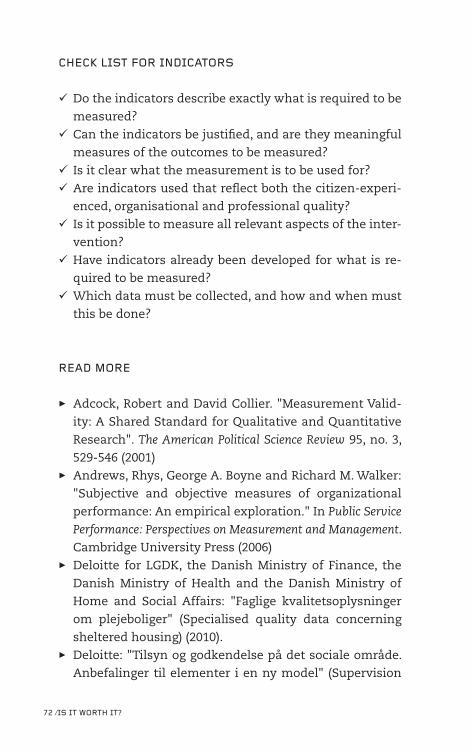
ChECk LIst For INDICAtors
üüDo the indicators describe exactly what is required to be
measured?
üüCan the indicators be justified, and are they meaningful
measures of the outcomes to be measured?
üüIs it clear what the measurement is to be used for?
üüAre indicators used that reflect both the citizen-experi-
enced, organisational and professional quality?
üüIs it possible to measure all relevant aspects of the inter-
vention?
üüHave indicators already been developed for what is re-
quired to be measured?
üüWhich data must be collected, and how and when must
this be done?
rEAD MorE
> Adcock, Robert and David Collier. "Measurement Valid-
ity: A Shared Standard for Qualitative and Quantitative
Research". The American Political Science Review 95, no. 3,
529-546 (2001)
> Andrews, Rhys, George A. Boyne and Richard M. Walker:
"Subjective and objective measures of organizational
performance: An empirical exploration." In Public Service
Performance: Perspectives on Measurement and Management.
Cambridge University Press (2006)
> Deloitte for LGDK, the Danish Ministry of Finance, the
Danish Ministry of Health and the Danish Ministry of
Home and Social Affairs: "Faglige kvalitetsoplysninger
om plejeboliger" (Specialised quality data concerning
sheltered housing) (2010).
> Deloitte: "Tilsyn og godkendelse på det sociale område.
Anbefalinger til elementer i en ny model" (Supervision
72 ⁄Is It worth It?
and approval in the social welfare area. Recommenda-
tions for elements in a new model) (2012)
> Deloitte and SFI-SURVEY: "Pilotprojekt med sammen-
lignelige brugertilfredshedsundersøgelser på handicap-
og ældreområdet" (Pilot project with comparable user
satisfaction surveys in the area of the disabled and the
elderly) (2009)
> Høybye-Mortensen, Matilde: Velfærdsstatens dørvogtere –
procesregulering af visitationer på socialområdet (The guardi-
ans of the welfare state – process regulation of referrals in the
social welfare area). Museum Tusculanum (2011).
> Olsen, Henning: "Guide til gode spørgeskemaer" (Guide
to good questionnaires). The Danish National Centre for
Social Research (2006)
> Pedersen, Carsten Strømbæk and the Danish National
Board of Social Services: "Overordnede strategier til ef-
fektmåling" (Overall outcome measurement strategies)
(2012)
> The Danish National Board of Social Services: "Vali-
derede instrumenter til evalueringer på det sociale om-
råde" (Validated instruments for evaluations in the so-
cial welfare area) (2013)
> The SROI Network: "A Guide to Social Return on Invest-
ment" (2012)
> The Danish Agency for Modernisation: "Case-samling –
inspiration til effekt" (Case collection – inspiration for
outcome) (2010)

DAtA, DAtA, DAtA ⁄ 75
04DAtA, DAtA, DAtA
Frank is doing well. Aged 44, he has a permanent job in a
factory and two adolescent sons whom he sees every other
weekend. Frank himself thinks that he has a good and rich
life. Yet it has not always been this way.
When Frank was 32, he started a relationship with Tina.
They moved in together, as you do when you are in love,
first in Tina's home, and then in a shared house. They also
got engaged and then married, and soon after welcomed
twin boys, whom they named Rasmus and Mads.
Frank was happy with Tina, and glad to be a father. Yet
something inside him was not quite right. Even though he
did not have too much to do at work, he still felt tired and
run down. He did not have much to do at home either, as
Tina took care of most of it, yet he still found it hard to cope
with everyday life and the many things that need to be
done in a family with two young children.
Frank went to the doctor, who in the first instance diag-
nosed stress. Frank did not agree with this assessment,
however, for why would he be suffering from stress when
he was no busier than so many other fathers? Frank went
to see another doctor who, after a long investigation,
reached the conclusion that Frank had ADHD. Frank was
pleased to get this diagnosis, as it explained many of the
76 ⁄Is It worth It?
concentration and attention deficiency problems he had
struggled with throughout his life. But he was also sad that
the diagnosis had not been made earlier, when he might
have been able to make some adjustments before he ended
up with a house, car, wife and children.
Frank learned how to live with his diagnosis, but his
marriage to Tina began to fail. The twins demanded atten-
tion and care, and even though Tina was aware that she
had to shoulder most of the burden, it was frustrating for
her to have to take care of the entire household.
After seven years' marriage, Tina asked for a divorce.
Frank could not understand this. He was frustrated and un-
happy, but also forced to accept that the marriage was over.
He moved out of the family home to a small rented flat.
After the divorce, Frank's life began to go downhill. He
lost his job and got into financial difficulties. He also started
to spend too much time in the local pub, and one day Tina
said that the boys had told her that they did not enjoy be-
ing at his place. She therefore intended to go to the State
Administration to obtain a new contact agreement, so that
in future Frank would only have supervised contact with
his children.
Although Frank's story could have ended very badly, it
did not. The municipality decided to launch a full-scale in-
tervention for Frank, so that he could return to the labour
market and continue to see his children as before.
The municipality therefore initiated numerous activi-
ties: Frank got a practical training position in a plastics fac-
tory. He was also assigned a company mentor as a support
contact, and he got help to tackle his alcohol consumption.
In addition, Tina was invited to join a family programme for
the families of people with ADHD. She accepted this offer,
as did Frank's brother, who was also a large part of his life.
Slowly, but surely, Frank got his life back. He got a perma-
nent job again, sorted out his finances, and later on also
DAtA, DAtA, DAtA ⁄ 77
managed to leave his alcohol habit behind him. Tina de-
cided that he could have contact with his children again, so
that they would not lose contact with their father. As a con-
sequence of her decision, Frank felt like a whole, decent
human being again. Despite one relapse, he was able to
look forward and get back on track again.
Many years later, Frank watches a TV programme about
how hard it is to live with ADHD, as a child and also as an
adult. The programme makes him think about his own dé-
route and all the people that helped him to get back on
track. Why did things go wrong? Why did he end up in such
a state? What exactly helped him to stop things spiralling
out of control?
No ANALYsIs wIthoUt DAtA
When an SROI analysis is performed, it is vital to obtain
data that can measure the indicators set up, and possibly
also document further aspects of social return that are not
captured by the indicators. The data collection also contrib-
utes to substantiating the programme theory, since typi-
cally information will be collected for all elements of the
programme theory, which means resources, activities, re-
sults and outcomes.
Like indicators, data can also be both qualitative and
quantitative. Quantitative data concerns things that can be
measured or counted. Quantitative data thus takes a stand-
ardised form and is very suitable for large-scale analyses.
Examples of quantitative data might be the number of days
that women aged over 75 have been admitted to hospital
for dehydration, or the specialised assessment of a citi-
zen's physical function level, on a scale from 1 to 5.
Quantitative data is thus "definitive" by nature and
therefore appears to be more imperative and irrefutable, al-
78 ⁄Is It worth It?
though it is naturally not always the "whole truth". Quali-
tative data, on the other hand, has an open structure that
makes it possible to gain new perspectives in a certain area,
and to explore new knowledge. This might be a citizen's de-
scription of the meeting with the municipality, or a de-
scription of a child's family circumstances in an expert
child assessment.
The next two sections will consider the two types of
data in practice.
QUALItAtIVE DAtA
In brief, data collection is relevant to support the indicators
set up and thereby illustrate whether the relations set out
in the programme theory can be confirmed or refuted. Here,
a qualitative method can be used for in-depth investigation
and to capture the nuances of the intervention. This might
be to investigate why and how an intervention is effective.
The qualitative methods are thus especially useful to pin-
point outcomes that are not included in the programme
theory, or that cannot be measured by indicators.
An example of how qualitative interviews can be used
to gather knowledge of social return are the positive out-
comes of the Bybi project. The people involved experience
the motivation and satisfaction of being able to do a job,
residential areas are improved aesthetically, and people are
proud of their local product. These are all outcomes that
would have been hard to measure without taking a qualita-
tive approach.
Below, we present a number of examples of how quali-
tative data can be collected.
DAtA, DAtA, DAtA ⁄ 79
InterviewsAn interview is the most common way of obtaining quali-
tative knowledge. This can take place as individual inter-
views, as well as focus group interviews. Interviews provide
good insight into how a stakeholder experiences a given
topic. For example, the respondent can be asked what he or
she got out of participating in a particular activity, or his or
her subsequent benefit. Vignette surveys can also be used,
in which a concrete scenario is described to the respond-
ent, who is then asked to consider one or several aspects of
this scenario. The advantage of using such surveys is that
the respondent has to consider a concrete situation in
which questions and answers will often be more focused
and less abstract. Based on interviews, often more general
questions can be set up, which can be investigated for a
larger element of the target group, e.g. by using question-
naires.
Before an interview is held, depending on its purpose, a
question guide should always be prepared that, to a greater
or lesser degree, structures the interview by topic, and puts
the questions in a specific order. Open questions can often
be used to capture unforeseen topics, while closed ques-
tions ensure that a number of pre-selected topics are cov-
ered. It is important to either record the interview or take
notes, so as to have material that can subsequently be an-
alysed.
ObservationWhile interviews and questionnaire surveys are good ways
of obtaining knowledge about various people's attitudes,
they are not always a good way of mapping people's behav-
iour. Instead, it is possible to observe behaviour directly in
the context in which the intervention takes place. Observa-
tions can be made via video recordings, and by being phys-
ically present. The advantage of observations is that they
80 ⁄Is It worth It?
can be made in the environment in which the intervention
takes place, and it is not necessary to ask about the behav-
iour, but watch it unfold (although with the reservation
that the presence of an observer as such can influence the
behaviour of the person who is observed).
Observations can be used, for example, to investigate
how case officers handle citizens, or how an intervention to
increase children's welfare is implemented in practice. As
for all methods, it is important to work with observations
systematically, and to be well-prepared for the focus of the
observation. It can be an advantage to draw up an observa-
tion form prior to the actual observation, in the same way
as an interview guide is prepared prior to an interview.
PersonasA third means to obtain knowledge concerning an inter-
vention is to set up personas. A persona is a comprehensive
portrait of a typical citizen that reflects the general charac-
teristics of the target group – for example "Frank", whom
we described at the beginning of this chapter. Personas are
thus not one single interviewee, but a general representa-
tion of several of them – a type of archetype of the people
in the target group. In other words, the personas set up re-
flect stylised citizens in the target group in relation to, for
example, relevant issues, interventions received, the social
context, or specific relations.
In some cases it may be easier to relate to a concrete
persona, rather than complex statistical analyses or seg-
ment analyses. Personas can thus bring the target group
closer and more tangible to the recipient. By examining
how a specific intervention will be planned for a number of
different personas, it is possible to map the outcomes of a
successful intervention, and how it can be performed in
practice. Personas should not be viewed as an exhaustive
representation of all persons in the target group, and in all
DAtA, DAtA, DAtA ⁄ 81
interventions, but are rather a picture of who the target
group might be.
Most significant changeMost significant change (MSC) is based on what is called a
participatory method. This means that stakeholders are in-
volved systematically in monitoring or evaluating a given
intervention. In practice, MSC is used by selecting groups or
persons in the target group that can pinpoint central
changes in conjunction with an intervention. The various
outcomes are designated through dialogue, discussion and
storytelling. Then the group together discuss which out-
comes can be seen as the most significant, and why and
how they arise. MSC is particularly useful in conjunction
with highly complex interventions where it is necessary to
nuance and further examine the outcomes via dialogue
with the stakeholders.11
QUANtItAtIVE DAtA
In contrast to the qualitative data that can help to add nu-
ance to an outcome and achieve a deeper understanding of
an intervention, quantitative data contributes, in particu-
lar, to compiling the extent of the activities, resource con-
sumption and outcomes. This might, for example, be the
number of participants in a given activity, the number of
activities held, the degree of user satisfaction, or the num-
ber of unemployed who manage to get jobs, etc. As a rule,
considering an intervention from a quantitative viewpoint
can present many advantages: It becomes easier to moni-
tor the target group's development, assess an intervention
11 Rick Davies: The Most Significant Change Technique – A Guide to Its Use. Davies and Dart (2005).
82 ⁄Is It worth It?
across geographical areas, or investigate whether the re-
sults for the recipients of the intervention are also repre-
sentative of other target groups.
Below we propose three sources of quantitative data.
Register data Register data is a highly relevant data source that gives ac-
cess to relevant information concerning many different
target groups. This might be labour-market related regis-
ters, health registers or statistics for pupils' progress in the
education system. If a municipality wishes to study the
outcome of proactive psychological counselling for stu-
dents at educational institutions in order to reduce drop-
out rates, register data for the students' grades and absence
rates can be used to assess whether the target group shows
any improvement. In addition, the students' GP appoint-
ments and psychiatric admissions can be tracked in the
Danish Health and Medicines Authority's registers. In this
way, register data at individual level can make it possible to
monitor a target group over time for a large number of pa-
rameters, thereby measuring outcomes that do not occur
until long after the intervention in question.
Other relevant register data include data from adminis-
trative and specialised systems, as well as financial sys-
tems. These systems can play an important data collection
role and make it possible to obtain key information con-
cerning the resources used, time prioritisation, knowledge
of work processes, or the services offered.
Questionnaire surveysQuestionnaire surveys are a frequently used source of
quantitative data. They can, for example, reveal users' or
employees' levels of satisfaction with a specific interven-
tion. Questionnaire surveys can also provide concrete
knowledge of elements of the programme theory – such as
DAtA, DAtA, DAtA ⁄ 83
how many have used an acquired instrument, or have
changed their patterns of action in the required direction.
In addition, questionnaires can be used as measurement
instruments that make it possible to assess even the more
complex concepts such as quality of life and health. This
applies, for example, to the WHO-Five Well-being Index
(WHO-5), which is a simple, but reliable, measure of general
well-being. Five statements are assessed by the user in or-
der to achieve an overall score. In the same way, the SDQ
tool previously described can be used to monitor children's
well-being. Both WHO-5 and SDQ make it possible to mon-
itor the individual's development, comparing results across
interventions. A large number of other scales by which to
measure the well-being and development of specific target
groups may be relevant in different contexts.12
Data collection via specialised assessments Specialised assessments of, for example. health-related,
personal and social competences on the basis of shared
concepts and scales can be used to gauge concepts that
cannot otherwise be easily measured.
Specialised assessments of this type will naturally al-
ways be estimates, but this does not mean that the assess-
ment is random, since a case officer does not randomly use
an investigation method, nor does a teacher give grades on
a random basis.
12 They include the International Classification of Functioning (ICF) devel-opment by WHO, Integrated Treatment for Dual Disorders developed by Professor Kim T. Mueser from Boston University, Model of Human Occu-pation (MOHO) developed by Gary Kielhofner from the University of Illi-nois, Canadian Occupational Performance Measure (COPM) developed under the auspices of Health Canada, Parent Management Training (PMTO) developed under the auspices of Oregon Social Learning Center, Fælles Sprog (Common Language) and Børnemiljøtermometeret (Chil-dren's Environmental Thermometer) developed by LGDK, the coming well-being measurements in Danish lower secondary schools, and sev-eral other measurement scales.
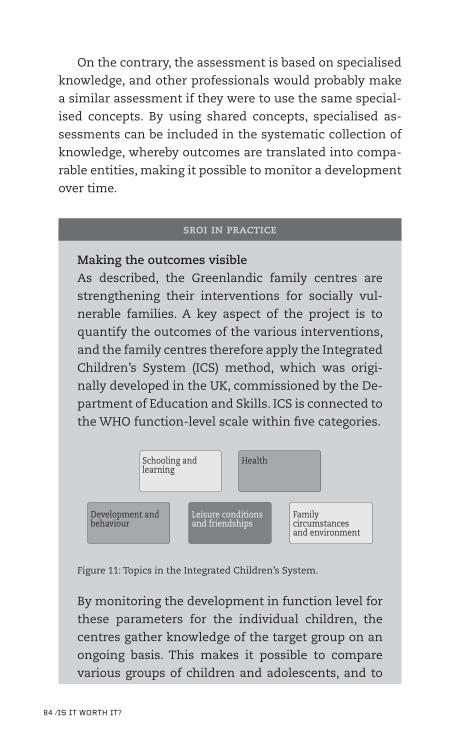
84 ⁄Is It worth It?
On the contrary, the assessment is based on specialised
knowledge, and other professionals would probably make
a similar assessment if they were to use the same special-
ised concepts. By using shared concepts, specialised as-
sessments can be included in the systematic collection of
knowledge, whereby outcomes are translated into compa-
rable entities, making it possible to monitor a development
over time.
SROI in practice
Making the outcomes visibleAs described, the Greenlandic family centres are
strengthening their interventions for socially vul-
nerable families. A key aspect of the project is to
quantify the outcomes of the various interventions,
and the family centres therefore apply the Integrated
Children’s System (ICS) method, which was origi-
nally developed in the UK, commissioned by the De-
partment of Education and Skills. ICS is connected to
the WHO function-level scale within five categories.
Schooling and learning
Health
Development and behaviour
Leisure conditions and friendships
Family circumstances and environment
Figure 11: Topics in the Integrated Children’s System.
By monitoring the development in function level for
these parameters for the individual children, the
centres gather knowledge of the target group on an
ongoing basis. This makes it possible to compare
various groups of children and adolescents, and to
DAtA, DAtA, DAtA ⁄ 85
monitor the development over time. The investiga-
tion method also makes it possible to collect data on
a simple and relevant basis, as the data collection
takes place as a daily routine – and not as part of a
particular project.
In this way, managers and employees have an op-
portunity to see the results of their work, just as they
can participate actively in showing what they have
achieved. The intervention for the children is also
strengthened considerably. For each child, special fo-
cus areas for the ongoing work are determined. This
might, for example, be special focus on absence from
school or on whether parents take care of the chil-
dren on an everyday basis – attention points that, in
turn, create greater awareness among the family
centres' employees concerning the key challenges.
In concrete terms, an electronic data registration
form has been developed. As shown in Figure 12, this
table of results will help to gather knowledge about
the children who receive support, in a simple and
relevant way. The table also presents the relation be-
tween the intervention (its type and extent) and the
status of the development within the individual ar-
eas.
The knowledge presented in these tables is vital
for the family centres in several ways; first of all be-
cause the regular registration of the child's situation
makes it possible to monitor the child's develop-
ment. On comparing the development with the in-
terventions made, it can be assessed whether the in-
tervention was appropriate, or should be adjusted.
There are also benefits to be gained across the reg-
istered data, however, since the registration also pro-
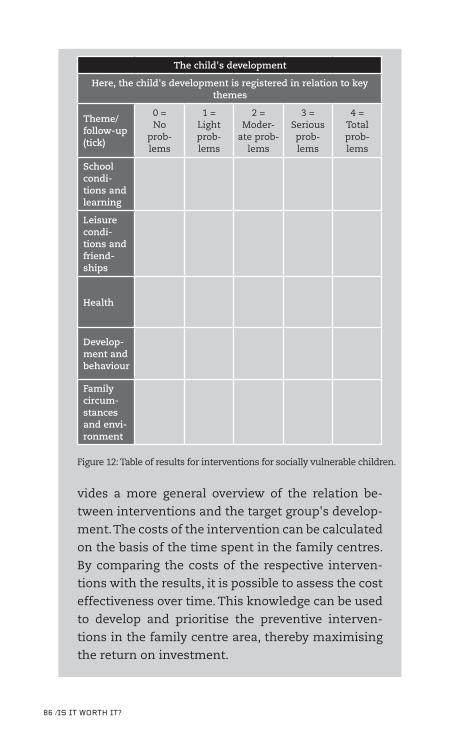
86 ⁄Is It worth It?
vides a more general overview of the relation be-
tween interventions and the target group's develop-
ment. The costs of the intervention can be calculated
on the basis of the time spent in the family centres.
By comparing the costs of the respective interven-
tions with the results, it is possible to assess the cost
effectiveness over time. This knowledge can be used
to develop and prioritise the preventive interven-
tions in the family centre area, thereby maximising
the return on investment.
The child's development
Here, the child's development is registered in relation to key themes
Theme/follow-up (tick)
0 = No
prob-lems
1 = Light prob-lems
2 = Moder-
ate prob-lems
3 = Serious prob-lems
4 = Total prob-lems
School condi-tions and learning
Leisure condi-tions and friend-ships
Health
Develop-ment and behaviour
Family circum-stances and envi-ronment
Figure 12: Table of results for interventions for socially vulnerable children.
DAtA, DAtA, DAtA ⁄ 87
Use existing knowledgeIt is by no means always necessary to collect the data one-
self. On the contrary, it can be an advantage to base the
SROI analysis on knowledge gathered in previous surveys,
or via research. Using the best knowledge currently availa-
ble is also a way of taking an evidence-based approach.
Whichever target group one works with, or whichever in-
tervention one wishes to evaluate, time and resources can
be saved by checking whether studies have already been
made of, for example, the citizen-experienced outcomes,
the development in the health or well-being of a target
group that receives the specific intervention, or in other ar-
eas. This knowledge can also be used to determine the fu-
ture value of an intervention, since it can provide data that
would not otherwise be available. It does not take many re-
sources to search via Google or look up the "Viden der
virker" (Knowledge that works) memo series from the Dan-
ish National Board of Social Services13, or studies by the
Danish National Centre for Social Research (SFI).14
INVoLVE stAkEhoLDErs IN DAtA CoLLECtIoN
It can be necessary to involve stakeholders in conjunction
with several of the data collection methods we have pre-
sented. This applies, for example, to interviews, focus group
interviews and questionnaire surveys. In this respect an el-
ement of reflection is important.
First of all, due to the nature of the case most resources
should be devoted to the stakeholders that are vital to per-
forming a comprehensive analysis. If no priorities are set,
13 The Danish National Board of Social Services: "Viden der virker",
www.socialstyrelsen.dk/viden-der-virker.
14 SFI: www.sfi.dk/effektmåling-_teori_og_metode.
88 ⁄Is It worth It?
there is a risk of spending too much time on less important
stakeholders. By listing all potential stakeholders, we can
gain an overview of the key stakeholders, and the resources
available, and prioritise the stakeholders on this basis.
Secondly, it can be a good idea to group the stakehold-
ers. An intervention in a residential area might, for exam-
ple, have very different target groups, resulting in various
returns. Residents might be categorised as "resourceful" or
"vulnerable". If there are significant differences, the groups
should be split up and viewed as different stakeholders.
When stakeholders are selected, one should also be aware
of the stakeholders that might experience negative changes
as a consequence of the intervention. The negative changes
are part of the overall picture of the return on investment
and should therefore also be included in the analysis.
Finally, it can be useful to designate representatives of
the relevant stakeholder groups, in order to achieve opti-
mum utilisation of the resources. There are naturally ad-
vantages to involving as many as possible in the stake-
holder group, but in view of the time and resources availa-
ble it may be necessary simply to contact the selection of
stakeholders that best represents the target group.
On involving stakeholders, it can be an advantage to list
them in a specific order. This will ensure an overview and
may also be useful when presenting methodological op-
tions chosen and discarded. Involving stakeholders may
seem to be a simple task, but planning and an overview can
save time for both oneself and the stakeholders.
DAtA, DAtA, DAtA ⁄ 89
Stakeholders can be involved by a number of different
methods: focus group interviews, questionnaire surveys,
workshops, telephone calls with stakeholder representa-
tives, or use of social media. How stakeholders are involved
depends on the amount of time available, and the stake-
holder group.
Let us consider how stakeholders were involved in the
GRIT (Gerry Rogan Initiative Trust) programme, which is an
Irish programme to help socially vulnerable adolescents.
The GRIT programme is supported by the International
Fund for Ireland, an Irish fund which works to help adoles-
cents who face serious problems, and to reduce prejudice
and sectarianism among young people in an environment
that is subject to religious and political tensions. The
youngsters who participate typically have criminal records,
may be at risk of suicide or violent, alcohol or substance
abusers, or unemployed, and are referred to the project by
case officers or youth institutions.
In brief, the GRIT intervention is an intensive workshop
that is followed up with interviews between professionals
and the young people, thereby helping them to tackle their
problems. Since the ongoing evaluation of the intervention
includes numerous welfare outcomes that are related to
the intervention, the young people and front-line employ-
ees are consulted when these outcomes are evaluated.
A plan for the evaluation activities is outlined according
to the table in Figure 13. This shows clearly that all inter-
views and questionnaire surveys have a clear purpose. The
plan also includes an overview of numbers of participants
in interviews, scheduling and outcomes. It also includes an
estimate of the number of hours allocated to each stake-
holder group.
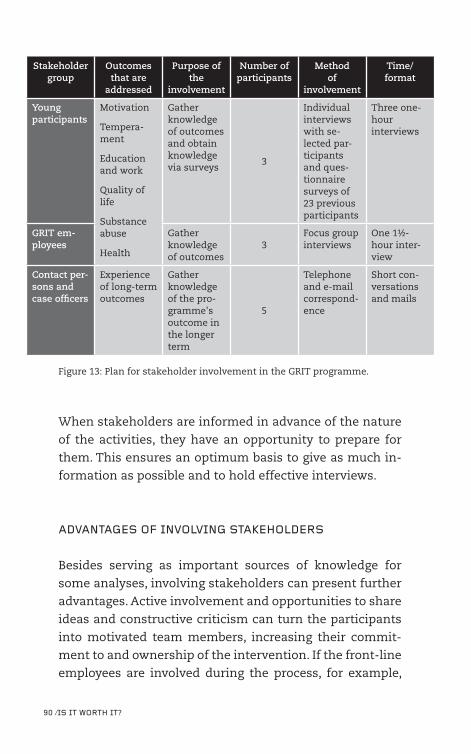
90 ⁄Is It worth It?
Stakeholder group
Outcomes that are
addressed
Purpose of the
involvement
Number of participants
Method of
involvement
Time/format
Young participants
Motivation
Tempera-ment
Education and work
Quality of life
Substance abuse
Health
Gather knowledge of outcomes and obtain knowledge via surveys
3
Individual interviews with se-lected par-ticipants and ques-tionnaire surveys of 23 previous participants
Three one-hour interviews
GRIT em-ployees
Gather knowledge of outcomes
3Focus group interviews
One 1½-hour inter-view
Contact per-sons and case officers
Experience of long-term outcomes
Gather knowledge of the pro-gramme's outcome in the longer term
5
Telephone and e-mail correspond-ence
Short con-versations and mails
Figure 13: Plan for stakeholder involvement in the GRIT programme.
When stakeholders are informed in advance of the nature
of the activities, they have an opportunity to prepare for
them. This ensures an optimum basis to give as much in-
formation as possible and to hold effective interviews.
ADVANtAGEs oF INVoLVING stAkEhoLDErs
Besides serving as important sources of knowledge for
some analyses, involving stakeholders can present further
advantages. Active involvement and opportunities to share
ideas and constructive criticism can turn the participants
into motivated team members, increasing their commit-
ment to and ownership of the intervention. If the front-line
employees are involved during the process, for example,
they will not only be important resources in the collection
of knowledge, but will also themselves have the opportu-
nity to reflect on their work, which in itself can strengthen
the intervention.
ChECk LIst For CoLLECtIoN oF DAtA
üü Have all relevant data collection strategies been consid-
ered?
üü Are data types and collection methods used that best il-
lustrate the intervention in question?
üü Is it possible to elucidate the resources, activities, re-
sults and outcomes described in the programme theory
üü Are there advantages to combining qualitative and
quantitative data?
üü How can stakeholders be involved in the analysis, to
gather knowledge of the return on investment?
üü Is there an overview of relevant stakeholder groups, and
are the resources prioritised in terms of involving the
most important?
üü Has a plan been made for the involvement of stakehold-
ers?
üü Do the stakeholders not only include specialised ex-
perts and front-line personnel, but also people who can
take a fresh look at the intervention?
rEAD MorE
> Andersen, Lotte Bøgh, Kasper M. Hansen and Robert
Klemmensen, ed.: Metoder i statskundskab (Political science
methods). Hans Reitzels Forlag (2012)
> Bason, Christian, Søren S. Toft and Sune Knudsen: Sæt
borgeren i spil – sådan involverer du borgere og virksomheder
DAtA, DAtA, DAtA ⁄ 91

i offentlig innovation (Put the citizen into play – how to in-
volve citizens and companies in public innovation). Gyl-
dendal Public (2009)
> Bryman, Alan: Social Research Methods. Oxford University
Press (2008)
> Dahler-Larsen, Peter: Evaluering af projekter – og andre ting,
som ikke er ting (Evaluation of projects – and other things
that are not things). Syddansk Universitetsforlag (2013)
> Davies, Rick: The Most Significant Change Technique – A
Guide to Its Use. Davies and Dart (2005).
> King, Ron: The Strategy of Research: Thirteen Lessons on the
Elements of Social Science. Montezuma Publishing (2004)
oUtCoM EVALUAtIoN ⁄ 93
05oUtCoME EVALUAtIoN
Imagine that we are stepping into a large hospital. Here,
doctors can operate on knees, drain wounds, remove tu-
mours, scan internal organs and prescribe medicine that
has been tried, tested and refined, in a long, controlled de-
velopment process.
Do we have confidence in the doctors' treatment? Yes,
as a rule we do. We know that it is based on sound profes-
sional expertise and comprehensive evidence. Therefore
most of us feel that we are in good hands when we consult
a doctor or are admitted to hospital. This confidence is im-
portant, and we cannot imagine compromising on our own
safety, since it is our lives that can be at stake when illness
strikes.
Why does this evidence-based approach apply to hospi-
tals, but not in the social welfare area? There may be com-
plex issues to face in the social welfare system, but it is not
necessarily more difficult to measure a social outcome
than to measure a medical effect. A life can need adjusting
in the same way as a knee can require surgery, or hearing
has to be checked.
While the evidence approach is used extensively in the
healthcare area, it is sorely missed as a systematic tool in
the social welfare area. In many cases, even the use of on-
94 ⁄Is It worth It?
going measurements and gathering structured knowledge
of the results would be a small revolution. This is not to say
that the municipalities do not work intensively on these in-
terventions, or that new ideas are not considered. It is quite
simply a question of not collecting the results on a suffi-
ciently systematic basis. The results are not analysed,
shared and used elsewhere. This is why we to a great extent
still do not know what works, but have to "find our way in
the dark".
Outcome evaluation is at the heart of an SROI analysis
and concerns assessing whether a development for the tar-
get group can be registered, and whether the development
is a result of the intervention, or is influenced by other fac-
tors. For this purpose we can take an experimental ap-
proach, use a process-based method, or a combination of
before and after measurements, just as we can, if required,
calculate an overall ratio for the investment. We will return
to this below.
Outcome and return on investment on an interdis-ciplinary basisMette Lindgaard relates: At Deloitte, we work closely
with many Danish municipalities, just as we also
work with the municipalities on state-financed pro-
jects. As both Danish and global leader of the welfare
area at Deloitte, I have contributed to running many
of these projects, which have included everything
from prevention and inclusion in the children area
to interventions for the mentally ill who also face
substance abuse problems.
Often, some of the very most difficult aspects have
been to improve the interventions across work pro-
cesses. This applies whether we are working across
administrative departments, or across systems, and
oUtCoM EVALUAtIoN ⁄ 95
it applies especially to working across sectors. Even
in an individual municipality, it can be difficult to or-
chestrate a cross-disciplinary intervention that, for
example, builds bridges between areas for children
and adults, or for vulnerable and normally-function-
ing individuals. The challenges become even greater
when several municipalities are to work together –
or when both region and municipality are to find
common ground and together strengthen interven-
tions for socially vulnerable families, for example.
We could ask ourselves why it is so difficult to
work on a cross-disciplinary basis, since there is def-
initely no lack of willingness or genuine interest. Part
of the answer is the simple question of cost alloca-
tion – putting a price on an intervention. Even though
Denmark is a small country, there is still great varia-
tion in how costs are recognised in the various ad-
ministrative departments, just as we rarely set item-
ised prices for services in the social welfare area. It
can naturally be difficult to state what it costs, for
example, to give a drug addict a meaningful life.
In addition, in Denmark we have a tradition for
framework management of institutions, which in
terms of resources makes good sense, since this
management form is relatively easy to implement.
The drawback is that it is almost impossible to find
out what we actually give to whom, why and with
which results. For most of the social interventions
we are therefore still not able to perform basic meas-
urements of such parameters as extent, duration
and outcome. Like so many other major life changes,
a meaningful life for an ex-drug addict is difficult to
write into a formula.
Yet once in a while – against all odds – such meas-
urements are possible, typically because the munic-
96 ⁄Is It worth It?
ipalities are extremely keen to implement concepts
and systems that can contribute to assessing out-
comes. Experience shows that if interventions are to
be strengthened, there must be a willingness to build
bridges between the areas, and a willingness to meas-
ure outcomes across professional divides – other-
wise the goals will not be achieved.
DArE It AND Do It
We know that the social welfare area is a complex field and
that it can naturally be difficult to assess outcomes with
any great certainty. Yet there is no reason to be scared off
by the complexity. Evaluating outcomes is the art of the
possible. We can never capture all aspects of an interven-
tion and its outcomes, but we can make our best effort.
In the evaluation literature, a distinction is made be-
tween three different methods of assessing outcomes: an
experimental approach, the use of before and after meas-
urements, and a process-based approach. The experimen-
tal approach takes inspiration from the world of medicine,
where lots are drawn to divide a target group into two
groups (randomisation). One group is subject to the inter-
vention (the intervention group), while the other group
serves as control group. If a difference between the two
groups is subsequently observed, with a reasonable degree
of certainty this difference can be ascribed to the interven-
tion.
In the case of before and after measurements, a target
group is assessed before and after the group has been sub-
ject to an intervention. Subject to certain reservations, a
development can be seen as the result of the intervention.
oUtCoM EVALUAtIoN ⁄ 97
Under the process-based approach, the same logic is ap-
plied as for a before and after measurement, but in this
case using a more qualitative approach. The process-based
approach seeks to demonstrate the relation between inter-
vention and outcome by examining why and how the inter-
vention works. This is typically by, in the first instance, set-
ting up a programme theory and then testing it.
The three approaches are considered in further detail in
the following three sections. It is important to state that all
three approaches may be useful for an analysis of social re-
turn on investment, and often the optimum approach is to
combine the interventions. Together the evaluation strate-
gies can contribute to mapping the significance of external
factors or random variations. This might be increasing un-
employment, which has a negative impact on job creation
schemes, or a large number of other structural conditions
that influence the outcomes, irrespective of the interven-
tion.
thE ExPErIMENtAL APProACh
The experimental approach is not particularly prevalent in
the social welfare area in Denmark. In recent years, how-
ever, it has become more common and there is no doubt
that there is still considerable potential to use experiments.
The experimental approach arises from a randomised exper-
iment, in which the results of an intervention are measured
in two randomly selected groups. They are the intervention
group, which received the intervention, and the control
group, which was not subject to the given intervention.
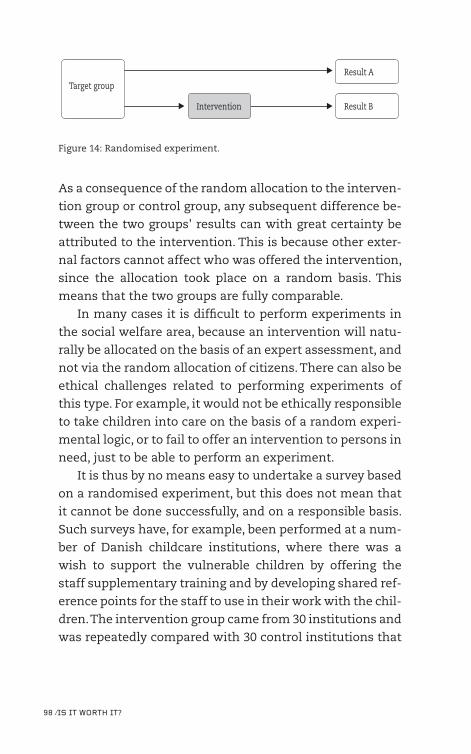
98 ⁄Is It worth It?
Target group
Result A
Result BIntervention
Figure 14: Randomised experiment.
As a consequence of the random allocation to the interven-
tion group or control group, any subsequent difference be-
tween the two groups' results can with great certainty be
attributed to the intervention. This is because other exter-
nal factors cannot affect who was offered the intervention,
since the allocation took place on a random basis. This
means that the two groups are fully comparable.
In many cases it is difficult to perform experiments in
the social welfare area, because an intervention will natu-
rally be allocated on the basis of an expert assessment, and
not via the random allocation of citizens. There can also be
ethical challenges related to performing experiments of
this type. For example, it would not be ethically responsible
to take children into care on the basis of a random experi-
mental logic, or to fail to offer an intervention to persons in
need, just to be able to perform an experiment.
It is thus by no means easy to undertake a survey based
on a randomised experiment, but this does not mean that
it cannot be done successfully, and on a responsible basis.
Such surveys have, for example, been performed at a num-
ber of Danish childcare institutions, where there was a
wish to support the vulnerable children by offering the
staff supplementary training and by developing shared ref-
erence points for the staff to use in their work with the chil-
dren. The intervention group came from 30 institutions and
was repeatedly compared with 30 control institutions that
oUtCoM EVALUAtIoN ⁄ 99
were not subject to the intervention. The survey showed
clear evidence that this type of intervention is effective.15
If it is not possible to implement an intervention by
drawing lots, there are other ways to create a basis for com-
parison via the experimental logic. Framework terms can
be set up for the comparison of groups based on approxi-
mately uniform conditions. To investigate the significance
of class size for lower secondary school leaving certificate
exam grades, for example, account can be taken of the
schools' varying framework conditions by comparing
schools with equal parameters, such as the pupils' socioec-
onomic background.
Alternatively, larger data volumes can be obtained, to
create a control group that resembles the target group. On
the commencement of an intervention, background varia-
bles such as gender, age, employment and number of days
in treatment can be compared, to show how the target
group reacts in relation to a control group, across time and
geographical location. To assess the outcome of an inter-
vention to reduce the probability that former criminals will
re-offend, for example, a statistical control group can be se-
lected that resembles the intervention group for relevant
parameters, and this group can be used as the basis for
comparison. This method is called matching and, as shown
by Deloitte's experience described below, can yield good re-
sults in practice.
15 Tim Vikær Andersen: Handlekompetencer i pædagogisk arbejde med socialt udsatte børn og unge – indsats og effekt (Action competences in pedagogi-cal work with socially vulnerable children and adolescents – intervention and outcome). Danmarks Pædagogiske Universitetsforlag (2008).
100 ⁄Is It worth It?
The control group shows the value of adult appren-ticesPeter Thorgaard relates: In 2013, the Danish Agency for
Labour Market and Recruitment requested Deloitte
to evaluate the adult apprenticeship scheme that
gives people over 25 years of age the opportunity for
specially subsidised vocational education.
Performing an evaluation of an intervention or a
scheme is nothing new for Deloitte, since we have
done this many times before. The new aspect of this
project was the method we used, which consisted of
a long series of register data as well as an actual con-
trol group, which is not seen so often in this area.
The specific method we used is called propensity
score matching. This is an advanced statistical method
that imitates the logic from randomised experi-
ments, with an intervention group and a control
group. This method gave us a unique opportunity to
investigate whether adult apprentices were more
likely to be in employment after completion of the
training, and whether they were paid more than
people who had previously had the same jobs, with
the same pay.
The control group was created from a population
of more than one million Danes. We quite simply
found people who resembled the typical adult ap-
prentice in respect of a number of selected parame-
ters such as income level, employment history, edu-
cational level, age, ethnic background, civil status
and place of residence. This gave us a group that was
by and large identical with the adult apprentice
group, with the important exception that the control
group had not been part of the adult apprentice
scheme.
oUtCoM EVALUAtIoN ⁄ 101
The analysis showed that the adult apprentice
scheme was a very effective way of getting social se-
curity benefit recipients and unemployment benefit
recipients into employment. The adult apprentices
did far better than other social security benefit recip-
ients and unemployment benefit recipients. Moreo-
ver, these outcomes were permanent. Four years af-
ter the social security benefit recipients had com-
pleted the adult apprentice scheme, they on average
earned DKK 78,226 more per annum than people
who had previously been in the same situation as
themselves. The costs to society of DKK 80,000 for
wage subsidies and more than DKK 200,000 in pay-
roll reimbursements could soon be set off against
the decreasing social security benefit costs and the
increased tax revenue as a consequence of higher
employment and income.
On the other hand, and quite surprisingly, the
analysis also showed that there was no employment
and income effect for the people who already had a
job before they became adult apprentices. This
means that the scheme did not increase the chances
of getting a job after completing the training, nor did
it increase your income if you already had a job be-
fore taking the training. This insight is vital for job
centres, decision makers and, not least, the adult ap-
prentices themselves, who all share an interest in
using the resources in the best possible way, with the
greatest possible effect. Our recommendation was
therefore that the adult apprentice scheme be tar-
geted especially at those who were out of work, and
that companies be offered greater incentives to em-
ploy social security benefit or unemployment bene-
fit recipients.
102 ⁄Is It worth It?
BEForE AND AFtEr MEAsUrEMENts
The experimental approach may thus present practical and
logistical challenges. It can also be difficult to create an ac-
tual basis for comparison, since everyone in a specific tar-
get group will have been subject to an intervention. For ex-
ample, all adults may receive benefits, subject to certain
conditions, just as any elderly person who cannot manage
everyday household chores can be offered home help.
If the experimental approach is not possible, before and
after measurements can be a good alternative. In before
and after measurements, key figures obtained before the
intervention commenced are compared with key figures
collected at the end of the intervention. With certain reser-
vations, the development as a consequence of the inter-
vention can be identified. Before and after measurements
are not quite as valid as the results from an experimental
approach, since we cannot be completely certain of whether
the outcomes can be ascribed solely to the intervention, al-
though they do provide a good indication. It is thus natural
to use before and after measurements as part of the survey
design for an SROI analysis.
As we will later show in this chapter, the adult investi-
gation method can, for example, be used as a tool to meas-
ure the function level of vulnerable adults. By continuously
monitoring the development and comparing it with a base-
line, i.e. a measurement before the given interventions are
implemented, the development for the individual, as well
as for the entire target group, can be monitored.
Plan the evaluation prior to the interventionFor the experimental approach, as well as for before
and after measurements, it is necessary to already
take the outcome evaluation into account before the
oUtCoM EVALUAtIoN ⁄ 103
intervention is implemented. If before and after
measurements are used, a baseline of data must nat-
urally be established before launching the interven-
tion, just as the experimental approach requires di-
vision into intervention and control groups, respec-
tively, before the intervention is launched.
ProCEss-BAsED APProACh
An alternative to the other two methods is a process-based
approach to outcome evaluation. The process-based ap-
proach differs from the experimental approach in that no
control group is used. Instead, a programme theory is set
up to explain why the intervention can be expected to yield
specific results, which we described in Chapter 2. In this
way, a fewer number of people or organisations is typically
investigated, since there is focus on gaining a deeper un-
derstanding of how the intervention works.
The process-based approach is thus a good supplement
to the experimental approach, and also to before and after
measurements, which both focus exclusively on whether a
given intervention has an outcome, and not on how the in-
tervention actually works. The process-based approach
qualifies the understanding of when and how the interre-
lation between intervention and result arises in a given
context. The advantage of a process-based approach is that
the evaluation provides detailed knowledge of effective
components of the intervention and potentially also con-
cerning any side effects, as well as which players influence
the outcomes. In a process-based evaluation model, the
question of what works is expanded to concern what works
for whom, and how, and in which circumstances it does this.
The actual outcome measurement takes place by system-
104 ⁄Is It worth It?
atically testing the programme theory’s stages by obtaining
data to show whether the activities lead to the required re-
sult.
In a process-based approach, the evaluation can be
based on the following questions:
> What was successful in the intervention?
> Which conditions or circumstances inhibited or facili-
tated the intervention?
> How can we explain why something did not go as ex-
pected?
> Were there problems with implementation, or other
conditions that affected the result?
> What should we take into account if a similar interven-
tion is to be performed?
Below is an overview of the three approaches to evaluation,
and their characteristics. If the evaluation focuses on the
average outcome of the intervention, the experimental ap-
proach should be selected, if possible. Often, however, it is
not possible to perform a randomised experiment, in which
case the experimental logic can be used to create a basis for
comparison with the help of matching, for example. If eve-
ryone in a target group is subject to the same intervention,
so that it is not possible to establish a basis for comparison,
a before and after measurement is a good alternative. The
process-based approach must be chosen if there is a need
for deeper knowledge concerning the intervention, so as to
understand why and how it works.
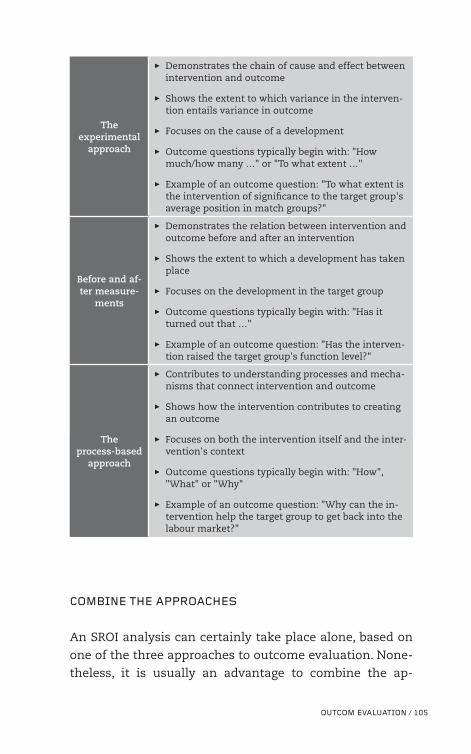
oUtCoM EVALUAtIoN ⁄ 105
The experimental
approach
> Demonstrates the chain of cause and effect between intervention and outcome
> Shows the extent to which variance in the interven-tion entails variance in outcome
> Focuses on the cause of a development
> Outcome questions typically begin with: "How much/how many …" or "To what extent …"
> Example of an outcome question: "To what extent is the intervention of significance to the target group's average position in match groups?"
Before and af-ter measure-
ments
> Demonstrates the relation between intervention and outcome before and after an intervention
> Shows the extent to which a development has taken place
> Focuses on the development in the target group
> Outcome questions typically begin with: "Has it turned out that …"
> Example of an outcome question: "Has the interven-tion raised the target group's function level?"
The process-based
approach
> Contributes to understanding processes and mecha-nisms that connect intervention and outcome
> Shows how the intervention contributes to creating an outcome
> Focuses on both the intervention itself and the inter-vention's context
> Outcome questions typically begin with: "How", "What" or "Why"
> Example of an outcome question: "Why can the in-tervention help the target group to get back into the labour market?"
CoMBINE thE APProAChEs
An SROI analysis can certainly take place alone, based on
one of the three approaches to outcome evaluation. None-
theless, it is usually an advantage to combine the ap-
106 ⁄Is It worth It?
proaches in order to get answers to as many as possible of
the following questions:
> What was successful in the intervention?
> Which, and how great an outcome can we register?
> Can we show or prove that the results are a consequence
of the intervention?
> What are the outcomes in the long term?
> Which conditions or circumstances inhibited or facili-
tated the intervention?
> How can we explain why something did not go as ex-
pected?
While the experimental approach and the before and after
measurements can give a quantitative measure of out-
come, the process-based approach can, as stated, explain
the relationship between intervention and outcome. A
combination of approaches will therefore often ensure op-
timum conditions to evaluate the outcome of an interven-
tion.
SROI in practice
How return on investment is measured Let us return to Project New Start in Rebild Municipal-
ity. Here, interventions for the least resourceful fam-
ilies are documented on an ongoing basis, so that
over time a body of data is established to show which
interventions create the best return on investment.
During the project period, the municipality keeps
a close eye on the costs and compiles results for both
adults and children. The family members are as-
sessed periodically via indicators that reflect the
function level of the individual child or adult. The in-
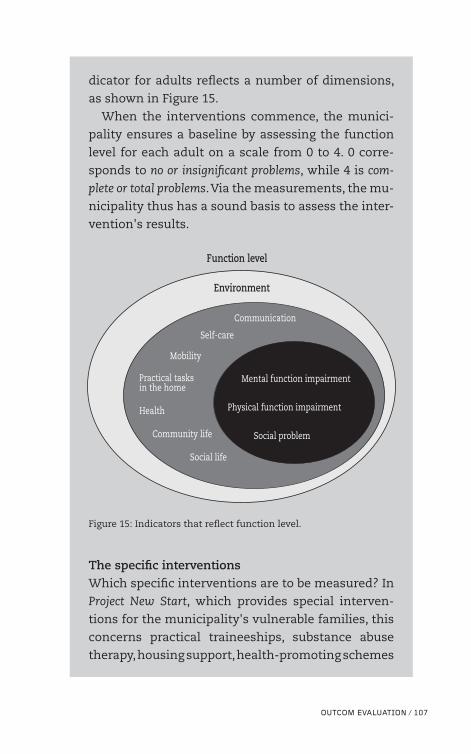
oUtCoM EVALUAtIoN ⁄ 107
dicator for adults reflects a number of dimensions,
as shown in Figure 15.
When the interventions commence, the munici-
pality ensures a baseline by assessing the function
level for each adult on a scale from 0 to 4. 0 corre-
sponds to no or insignificant problems, while 4 is com-
plete or total problems. Via the measurements, the mu-
nicipality thus has a sound basis to assess the inter-
vention's results.
Function level
Environment
Communication
Self-care
Mental function impairment
Physical function impairment
Social problem
Mobility
Practical tasks in the home
Health
Community life
Social life
Figure 15: Indicators that reflect function level.
The specific interventionsWhich specific interventions are to be measured? In
Project New Start, which provides special interven-
tions for the municipality's vulnerable families, this
concerns practical traineeships, substance abuse
therapy, housing support, health-promoting schemes
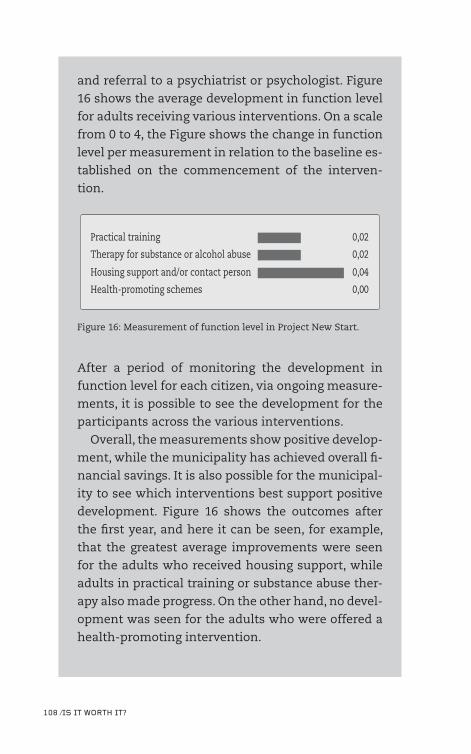
108 ⁄Is It worth It?
and referral to a psychiatrist or psychologist. Figure
16 shows the average development in function level
for adults receiving various interventions. On a scale
from 0 to 4, the Figure shows the change in function
level per measurement in relation to the baseline es-
tablished on the commencement of the interven-
tion.
0,02Practical training
0,02Therapy for substance or alcohol abuse
Housing support and/or contact person 0,04
Health-promoting schemes 0,00
Figure 16: Measurement of function level in Project New Start.
After a period of monitoring the development in
function level for each citizen, via ongoing measure-
ments, it is possible to see the development for the
participants across the various interventions.
Overall, the measurements show positive develop-
ment, while the municipality has achieved overall fi-
nancial savings. It is also possible for the municipal-
ity to see which interventions best support positive
development. Figure 16 shows the outcomes after
the first year, and here it can be seen, for example,
that the greatest average improvements were seen
for the adults who received housing support, while
adults in practical training or substance abuse ther-
apy also made progress. On the other hand, no devel-
opment was seen for the adults who were offered a
health-promoting intervention.
oUtCoM EVALUAtIoN ⁄ 109
By using a screening tool, the families' contact
person can monitor which interventions ensure im-
provements for the target group. The families' devel-
opment thus becomes more tangible, just as the re-
sults can be used by the municipal employees when
they work with the families on setting new targets
for the intervention. A score of between 0 and 4 may
not give an unambiguous picture of the individual
person's situation, but together the scores paint an
overall picture of the effectiveness of the various in-
terventions. Rebild Municipality can gain valuable
experience from the results, just as the municipality
can see, in the longer term, which interventions
have a good effect – and at least just as important:
which interventions do not have an effect.
The experience from Project New Start is sound and
emphasises the value of an overall intervention with
one coordinating case officer for the families who
are struggling with complex, interrelated problems.
It has become clearly apparent that in many cases
the parents are the reason for the children's prob-
lems, and that an intensive intervention for the
adult family members will generally also increase
the children's well-being. The project has also shown
a need to widen the range of interventions, introduc-
ing a number of new options in order to offer quali-
fied help to the target group.
sroI rAtIo: shoULD/shoULD Not?
Based on the evaluation performed, it is possible to calcu-
late an actual SROI ratio, i.e. the overall financial value of the
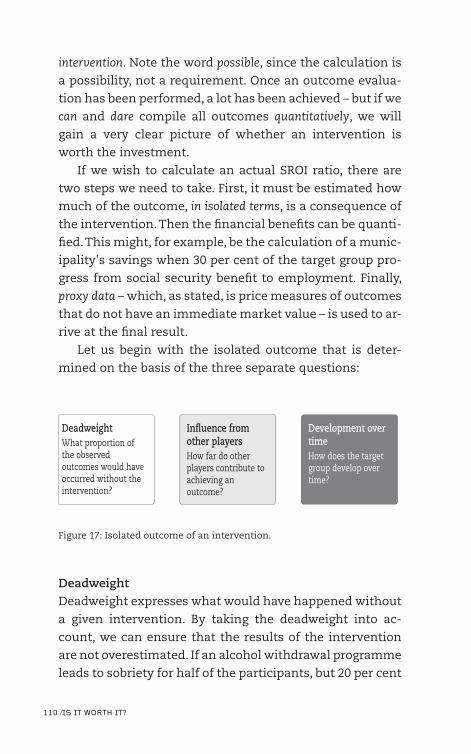
110 ⁄Is It worth It?
intervention. Note the word possible, since the calculation is
a possibility, not a requirement. Once an outcome evalua-
tion has been performed, a lot has been achieved – but if we
can and dare compile all outcomes quantitatively, we will
gain a very clear picture of whether an intervention is
worth the investment.
If we wish to calculate an actual SROI ratio, there are
two steps we need to take. First, it must be estimated how
much of the outcome, in isolated terms, is a consequence of
the intervention. Then the financial benefits can be quanti-
fied. This might, for example, be the calculation of a munic-
ipality's savings when 30 per cent of the target group pro-
gress from social security benefit to employment. Finally,
proxy data – which, as stated, is price measures of outcomes
that do not have an immediate market value – is used to ar-
rive at the final result.
Let us begin with the isolated outcome that is deter-
mined on the basis of the three separate questions:
DeadweightWhat proportion of the observed outcomes would have occurred without the intervention?
In�uence from other playersHow far do other players contribute to achieving an outcome?
Development over timeHow does the target group develop over time?
Figure 17: Isolated outcome of an intervention.
DeadweightDeadweight expresses what would have happened without
a given intervention. By taking the deadweight into ac-
count, we can ensure that the results of the intervention
are not overestimated. If an alcohol withdrawal programme
leads to sobriety for half of the participants, but 20 per cent
oUtCoM EVALUAtIoN ⁄ 111
of the target group would have achieved this anyway, with-
out the intervention, the deadweight is 20 per cent. For this
group, the intervention was superfluous, since they would
have done well in any circumstances. The isolated outcome
of the programme is thus half of the participants, less 20
per cent.
In some cases, before and after measurements may be
sufficient to determine the deadweight. If a target group is
very difficult to reach, and not likely to improve without
help, the deadweight loss will thus also be very modest.
This might be the long-term homeless who, from experi-
ence, have a very small chance of finding housing, unless
they are supported. An intervention that helps the home-
less to get a roof over their heads will thus have a dead-
weight of 0, and the results would be solely attributable to
the intervention.
In other cases, assessment of the deadweight loss re-
quires an experimental approach, comparing the interven-
tion group with a control group, as described at the begin-
ning of this chapter. If an experimental approach is not
possible, the deadweight loss must be assessed on the ba-
sis of qualified estimates by experts in the field.
Influence from other playersA given intervention will by and large always be subject to
external influences, i.e. other players or other interven-
tions. It is seldom possible to state exactly who these play-
ers are, and how much influence they exert, but we should
be aware that they exist, and that they can have a signifi-
cant influence on the outcomes that are measured.
This might be a vocational college that hires a psychol-
ogist to help students who are struggling with personal
problems and therefore have high absence rates. The inter-
vention has a clear impact and besides improved attend-
ance rates, the college can note that the young people are
112 ⁄Is It worth It?
more active in class, better prepared, and achieve higher
grades. Concurrently with the psychological counselling,
some of the young people are referred to a substance abuse
programme, where they are helped to reduce or give up
their cannabis abuse. The fact that some of the students do
better is not just a result of the psychological counselling
sessions, but is achieved in interaction with the municipal-
ity's substance abuse intervention.
Determining the influence from other players will there-
fore in some cases require a qualitative assessment. At the
college, qualitative interviews with both the target group
and the employees will be an obvious way of determining
what can lead to good results. Like the measure of dead-
weight, this parameter is also stated as a percentage. In this
case, it can be assumed, for example, that the value of the
school's intervention must be written down by 25 per cent.
Development over timeOn calculating an SROI ratio, it is vital to know how the tar-
get group develops over time. Let us assume that, after the
intervention's first year, it has been possible to help 20
homeless people, who would like a permanent home, to
find a flat. However, a follow-up measurement shows that
after five years half of them are back on the street. This
means that the intervention's outcome decreases by 50 per
cent over a five-year period.
The long-term outcomes can be measured by monitor-
ing the target group over time, for example on the basis of
register data. In other cases, the short-term outcomes can
be measured as the basis for assessing whether the out-
comes are permanent.
oUtCoM EVALUAtIoN ⁄ 113
SROI in practice
Isolated outcome In the GRIT programme (already presented above),
the outcomes were meticulously identified. The pro-
gramme for Irish adolescents is one of the few inter-
ventions that has been assessed under a full SROI
analysis by involving stakeholders, experts, and nat-
urally the actual recipients of the intervention. On
this basis, the project's sponsors identified a large
number of positive outcomes, including that a large
proportion of the target group gained employment,
reduced their drug abuse and put crime behind
them. Furthermore, validated scales were used to as-
sess the participants' mental state and how far they
were influenced by the intervention, just as the out-
come of the programme was isolated, the dead-
weight was estimated, and the significance of other
players was assessed.
The actual assessment, summarised in Figure 18,
was performed in cooperation between the GRIT
programme's management and Deloitte in Ireland. It
was found that a small proportion of the young peo-
ple had got back on the right course without taking
part in GRIT, so that it could be concluded that in
most cases the outcomes could be attributed to the
intervention. Based on the assessments of the ex-
pert staff who work with the target group on a daily
basis, as well as interviews with the participants
themselves, the deadweight loss was set at 5 per
cent. This means that for most of the target group
the observed outcomes were perceived to be conse-
quences of the intervention.
114 ⁄Is It worth It?
The intervention was also followed up by partner
organisations in the young people's local area, so
that the registered outcomes cannot be attributed
solely to GRIT. Instead, it was sought to quantify the
proportion of the outcomes that was attributable to
the influence of external players that, for example,
helped the participants to find practical training
places, or offered psychological support. On this ba-
sis it can be assumed that the GRIT outcomes must
be written down by between 15 and 50 per cent. It
was assessed, for example, that external players had
a positive effect on the participants' commitment to
the training, so that 20 per cent of the overall out-
come is deducted.
It should also be added that the analysis of GRIT
solely assessed the returns on the intervention as a
snapshot view, without calculating outcomes over
time. To do this, it would be necessary to follow the
target group for a longer period than was the case
here.
It may appear to be an abstract exercise to write
down the value of the individual outcomes as shown
in the Figure, but as the next chapter will show, this
write-down is of great significance to the actual out-
come evaluation, and especially to the subsequent
valuation.
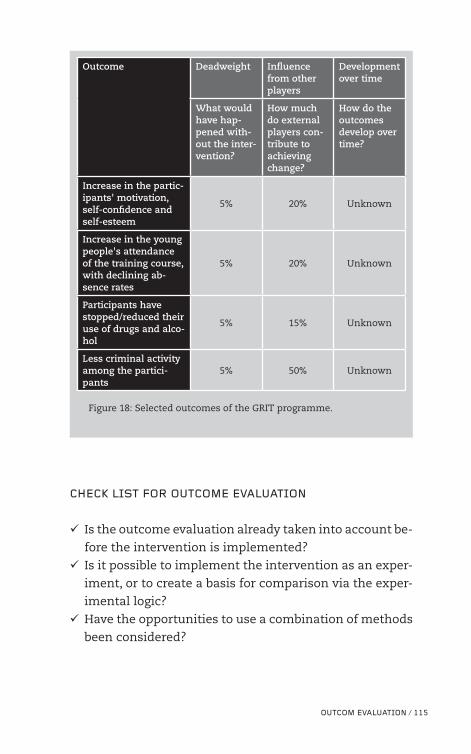
oUtCoM EVALUAtIoN ⁄ 115
Outcome Deadweight Influence from other players
Development over time
What would have hap-pened with-out the inter-vention?
How much do external players con-tribute to achieving change?
How do the outcomes develop over time?
Increase in the partic-ipants' motivation, self-confidence and self-esteem
5% 20% Unknown
Increase in the young people's attendance of the training course, with declining ab-sence rates
5% 20% Unknown
Participants have stopped/reduced their use of drugs and alco-hol
5% 15% Unknown
Less criminal activity among the partici-pants
5% 50% Unknown
Figure 18: Selected outcomes of the GRIT programme.
ChECk LIst For oUtCoME EVALUAtIoN
üüIs the outcome evaluation already taken into account be-
fore the intervention is implemented?
üüIs it possible to implement the intervention as an exper-
iment, or to create a basis for comparison via the exper-
imental logic?
üüHave the opportunities to use a combination of methods
been considered?
116 ⁄Is It worth It?
üüIs the intervention monitored over time using either be-
fore and after measurements or the process-based ap-
proach?
üüIs it possible to isolate external and internal variables'
influence on the results?
üüIs it possible to determine deadweight, other players' in-
fluence and the development over time?
rEAD MorE
> Boyne, George A.: Evaluating Public Management Reforms:
Principles and Practice. Open University Press (2003)
> Dahler-Larsen, Peter: Evaluering af projekter – og andre ting,
som ikke er ting (Evaluation of projects – and other things
that are not things). Syddansk Universitetsforlag (2013)
> Hansen, Hanne F., Olaf Rieper and Yosef Bhatti: "Evidens-
bevægelsens udvikling, organisering og arbejdsform. En
kortlægningsrapport" (The evidence movement's devel-
opment, organisation and working method. An investi-
gative report). AKF-Forlaget (2006)
> Jensen, Bente: Handlekompetencer i pædagogisk arbejde med
socialt udsatte børn og unge – indsats og effekt (Action com-
petences in pedagogical work with socially vulnerable
children and adolescents – intervention and outcome).
Danmarks Pædagogiske Universitetsforlag (2008)
> Riisom, Thomas: Elementær evaluering (Elementary evalu-
ation). Gyldendal Akademisk (2015)
> The Danish National Board of Social Services: "Over-
ordnede strategier til effektmåling" (Overall outcome
measurement strategies) (2012)
> The Danish National Board of Social Services: "Socialsty-
relsens vidensdeklaration af sociale indsatser og me-
toder" (The National Board of Social Services' knowledge
declaration for social interventions and methods) (2012)

> The Danish National Board of Social Services: "Viden til
gavn" (Knowledge put to good use) (2013)
> Wooldridge, Jeffrey M.: Introductory Econometrics: A Modern
Approach. South-Western College Publishing (2012)

rEtUrNs IN hArD CAsh ⁄ 119
06rEtUrN oN INVEstMENt IN hArD CAsh
In 2008, the Swedish macroeconomists Ingvar Nilsson and
Anders Wadeskog performed an economic analysis of the
losses to Swedish society when marginalised children and
adolescents grow up to an adult life on the margins of soci-
ety. The analysis compares selected municipalities' strate-
gies for handling vulnerable families and calculates the
economic consequences of a preventive and holistic inter-
vention, rather than a less active strategy.
The results are plain: The municipalities that took
timely and successful measures to help children at risk of
facing substance abuse problems, homelessness or crime,
achieved enormous returns over time. The costs of, for in-
stance, healthcare services and transfer incomes over
many years are an enormous burden on public finances.
The costs of neglecting vulnerable children and adoles-
cents are high and the analysis identifies significant poten-
tial savings if the municipalities manage to achieve an
early, large-scale and well-qualified intervention.16
16 Ingvar Nilsson and Anders Wadeskog: "Det är bättre att stämma i bäcken än i ån" (A stitch in time saves nine) (2008).
120 ⁄Is It worth It?
In the wake of this Swedish analysis we can ask whether
it is always possible or appropriate to put a price tag on so-
cial welfare interventions. The social welfare area is a com-
plex field, and interventions often have consequences that
are difficult to evaluate in monetary terms. It can also be
difficult to weight both economic and non-economic value.
Yet we still believe that it makes good sense to analyse
the economic consequences of social welfare interven-
tions. Well-documented analyses of this type help to show
the consequences of various interventions and thus consti-
tute an important instrument in the prioritisation discus-
sions. This knowledge contributes to the ongoing identifi-
cation of interventions that do not pay off – and thereby a
better distribution of the funds available.
In this chapter we present two different approaches to
calculating social return on investment. The point of depar-
ture for both approaches is the fundamental question: Is a
given intervention a worthwhile social investment?
> Method 1: Use a scenario model. The scenario model uses
scenarios and personas to illustrate the returns on an in-
tervention. It separates welfare effects and economic ef-
fects and is based on knowledge of the costs concerning
the target group. Based on various outcomes for success
and time frames, the scenarios can elucidate whether an
intervention is a worthwhile economic investment.
> Method 2: Use of the classical SROI ratio. In the classical ap-
proach, an SROI ratio is calculated that expresses the ra-
tio between returns and costs. A key element of this ap-
proach is the use of financial proxies to determine the
value of welfare effects.
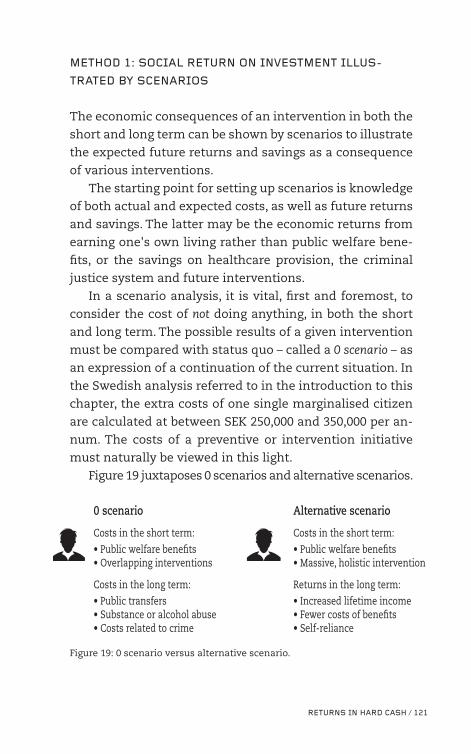
rEtUrNs IN hArD CAsh ⁄ 121
MEthoD 1: soCIAL rEtUrN oN INVEstMENt ILLUs-
trAtED BY sCENArIos
The economic consequences of an intervention in both the
short and long term can be shown by scenarios to illustrate
the expected future returns and savings as a consequence
of various interventions.
The starting point for setting up scenarios is knowledge
of both actual and expected costs, as well as future returns
and savings. The latter may be the economic returns from
earning one's own living rather than public welfare bene-
fits, or the savings on healthcare provision, the criminal
justice system and future interventions.
In a scenario analysis, it is vital, first and foremost, to
consider the cost of not doing anything, in both the short
and long term. The possible results of a given intervention
must be compared with status quo – called a 0 scenario – as
an expression of a continuation of the current situation. In
the Swedish analysis referred to in the introduction to this
chapter, the extra costs of one single marginalised citizen
are calculated at between SEK 250,000 and 350,000 per an-
num. The costs of a preventive or intervention initiative
must naturally be viewed in this light.
Figure 19 juxtaposes 0 scenarios and alternative scenarios.
0 scenario
Costs in the short term:
• Public welfare bene�ts• Overlapping interventions
Costs in the long term:
• Public transfers• Substance or alcohol abuse• Costs related to crime
Alternative scenario
Costs in the short term:
• Public welfare bene�ts• Massive, holistic intervention
Returns in the long term:
• Increased lifetime income• Fewer costs of benefits• Self-reliance
Figure 19: 0 scenario versus alternative scenario.
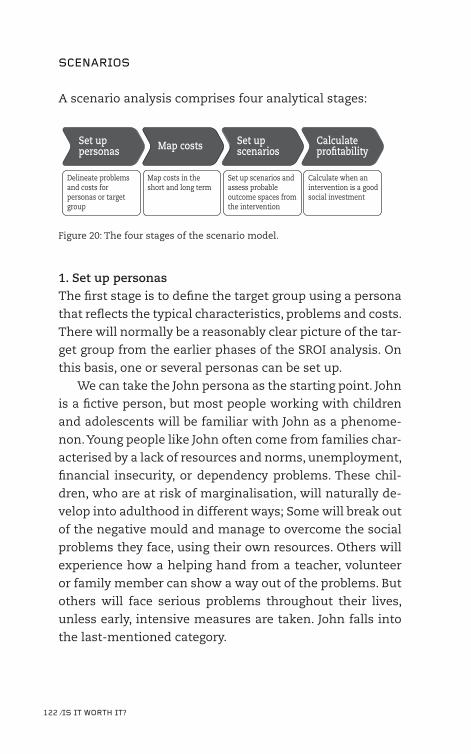
122 ⁄Is It worth It?
sCENArIos
A scenario analysis comprises four analytical stages:
Set up personas
Delineate problems and costs for personas or target group
Map costs in the short and long term
Set up scenarios and assess probable outcome spaces from the intervention
Calculate when an intervention is a good social investment
Map costs Set up scenarios
Calculate pro�tability
Figure 20: The four stages of the scenario model.
1. Set up personasThe first stage is to define the target group using a persona
that reflects the typical characteristics, problems and costs.
There will normally be a reasonably clear picture of the tar-
get group from the earlier phases of the SROI analysis. On
this basis, one or several personas can be set up.
We can take the John persona as the starting point. John
is a fictive person, but most people working with children
and adolescents will be familiar with John as a phenome-
non. Young people like John often come from families char-
acterised by a lack of resources and norms, unemployment,
financial insecurity, or dependency problems. These chil-
dren, who are at risk of marginalisation, will naturally de-
velop into adulthood in different ways; Some will break out
of the negative mould and manage to overcome the social
problems they face, using their own resources. Others will
experience how a helping hand from a teacher, volunteer
or family member can show a way out of the problems. But
others will face serious problems throughout their lives,
unless early, intensive measures are taken. John falls into
the last-mentioned category.
rEtUrNs IN hArD CAsh ⁄ 123
John's storyJohn's mother fell pregnant at a young age, and de-
cided to have John as a single mother, with little sup-
port from family and friends. She had rarely worked,
and had suffered long periods of severe depression,
with medication dependency, which naturally af-
fected her emotional resources and abilities as a
mother.
During John's childhood, the municipality re-
ceived several reports that he was not thriving or be-
ing taking care of properly at home. However, no
long-term cooperation was established between the
municipality and John's mother.
John was a boy of normal intelligence, but he was
severely understimulated and affected by a deprived
upbringing. He faced difficulties at school, where he
was lonely and often left to fend for himself. His
childhood was marked by severe family conflicts,
culminating in a fight between John and his moth-
er's boyfriend, after which John was placed in a resi-
dential institution.
2. Mapping costsBased on the persona of John, it is possible to map the costs
of various interventions targeted at young people like him.
In this case, this is a matter of the short-term costs of be-
ing taken into care, as well as the expected long-term costs.
This is achieved by setting up a cost map for the given tar-
get group.
A cost map shows the average costs concerning the tar-
get group. The cost map may be based on register data, as
well as existing data from surveys of the healthcare ser-
vices and the probation and prison services. This might be
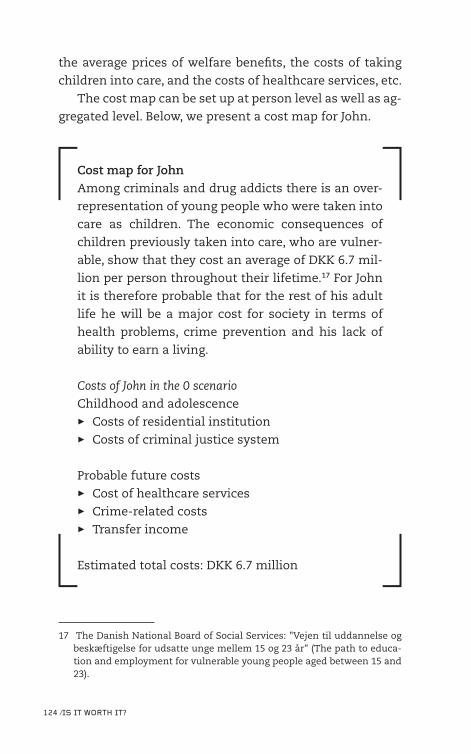
124 ⁄Is It worth It?
the average prices of welfare benefits, the costs of taking
children into care, and the costs of healthcare services, etc.
The cost map can be set up at person level as well as ag-
gregated level. Below, we present a cost map for John.
Cost map for JohnAmong criminals and drug addicts there is an over-
representation of young people who were taken into
care as children. The economic consequences of
children previously taken into care, who are vulner-
able, show that they cost an average of DKK 6.7 mil-
lion per person throughout their lifetime.17 For John
it is therefore probable that for the rest of his adult
life he will be a major cost for society in terms of
health problems, crime prevention and his lack of
ability to earn a living.
Costs of John in the 0 scenario
Childhood and adolescence
> Costs of residential institution
> Costs of criminal justice system
Probable future costs
> Cost of healthcare services
> Crime-related costs
> Transfer income
Estimated total costs: DKK 6.7 million
17 The Danish National Board of Social Services: "Vejen til uddannelse og beskæftigelse for udsatte unge mellem 15 og 23 år" (The path to educa-tion and employment for vulnerable young people aged between 15 and 23).
rEtUrNs IN hArD CAsh ⁄ 125
3. Setting up scenarios In the third stage, scenarios are set up to illustrate whether
the intervention is a worthwhile economic investment.
Both welfare returns and economic returns must be set up,
as well as estimates of the probability of a given scenario
being realised. In this case, often a main scenario, as well
as one or several alternative scenarios, will be set up, to
take account of the uncertainty relating to the main sce-
nario.
In the first instance, an alternative scenario can be set
up for the persona(s) used, thereby elucidating the poten-
tial returns from the intervention. Below, we outline an al-
ternative scenario that might apply to John's case.
Alternative scenario for JohnSocially vulnerable young people often lack experi-
ence from both the education system and the labour
market. Substance abuse or longstanding criminal
activities may become a lifestyle, and there is a risk
of chronic social isolation. Once a marginalisation
process has set in, it can be difficult to break out of.
Exhaustive, sustained motivation measures are re-
quired, and in many cases there will be a need for
longstanding, intensive strategies, accompanied by
personal support and contact.
When John was 12, the municipality therefore
launched an expert child assessment of John and his
family. The case officer then planned a cross-disci-
plinary family programme. This programme involved
cooperation with his school, as well as family ther-
apy and a fixed contact person. This was followed up
with subsequent counselling sessions and family
therapy. This strategy was very costly, to the tune of
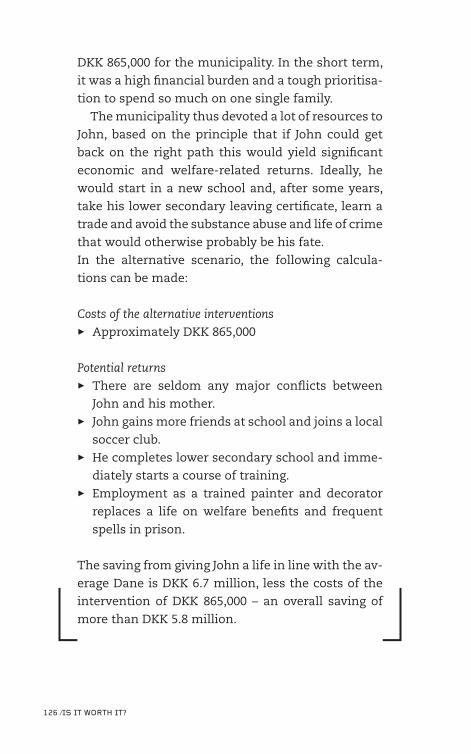
126 ⁄Is It worth It?
DKK 865,000 for the municipality. In the short term,
it was a high financial burden and a tough prioritisa-
tion to spend so much on one single family.
The municipality thus devoted a lot of resources to
John, based on the principle that if John could get
back on the right path this would yield significant
economic and welfare-related returns. Ideally, he
would start in a new school and, after some years,
take his lower secondary leaving certificate, learn a
trade and avoid the substance abuse and life of crime
that would otherwise probably be his fate.
In the alternative scenario, the following calcula-
tions can be made:
Costs of the alternative interventions
> Approximately DKK 865,000
Potential returns
> There are seldom any major conflicts between
John and his mother.
> John gains more friends at school and joins a local
soccer club.
> He completes lower secondary school and imme-
diately starts a course of training.
> Employment as a trained painter and decorator
replaces a life on welfare benefits and frequent
spells in prison.
The saving from giving John a life in line with the av-
erage Dane is DKK 6.7 million, less the costs of the
intervention of DKK 865,000 – an overall saving of
more than DKK 5.8 million.
rEtUrNs IN hArD CAsh ⁄ 127
With regard to the intervention for John, it is unknown how
often each intervention has long-term positive effects.
However, we know from evaluations of crime prevention
programmes for young people in the City of Copenhagen
that intensive interventions significantly reduce juvenile
crime rates and also significantly improve the young peo-
ple's involvement in the education system and the labour
market.18 In addition, studies of the outcomes of intensive
family interventions have shown how these interventions
are likely to have a positive effect. On this basis, we can as-
sume that an early preventive intervention for the target
group that John represents yields a long-term outcome in
20 per cent of cases.
As the Figure shows, the overall assessment of the long-
term effects consists of four elements.
18 Summary of evaluations of crime prevention programmes for young peo-ple aged 18 to 25 in the social services, unit for crime prevention pro-grammes (2013).
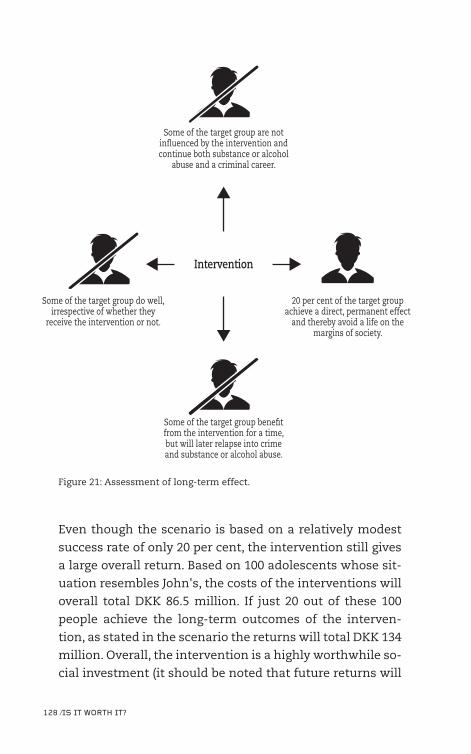
128 ⁄Is It worth It?
Some of the target group are not in�uenced by the intervention and continue both substance or alcohol
abuse and a criminal career.
Some of the target group do well, irrespective of whether they
receive the intervention or not.
20 per cent of the target group achieve a direct, permanent effect
and thereby avoid a life on the margins of society.
Some of the target group bene�t from the intervention for a time, but will later relapse into crime and substance or alcohol abuse.
Intervention
Figure 21: Assessment of long-term effect.
Even though the scenario is based on a relatively modest
success rate of only 20 per cent, the intervention still gives
a large overall return. Based on 100 adolescents whose sit-
uation resembles John's, the costs of the interventions will
overall total DKK 86.5 million. If just 20 out of these 100
people achieve the long-term outcomes of the interven-
tion, as stated in the scenario the returns will total DKK 134
million. Overall, the intervention is a highly worthwhile so-
cial investment (it should be noted that future returns will
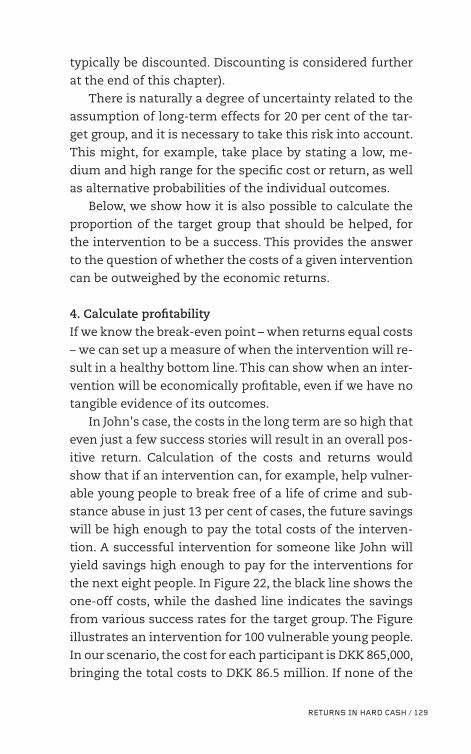
rEtUrNs IN hArD CAsh ⁄ 129
typically be discounted. Discounting is considered further
at the end of this chapter).
There is naturally a degree of uncertainty related to the
assumption of long-term effects for 20 per cent of the tar-
get group, and it is necessary to take this risk into account.
This might, for example, take place by stating a low, me-
dium and high range for the specific cost or return, as well
as alternative probabilities of the individual outcomes.
Below, we show how it is also possible to calculate the
proportion of the target group that should be helped, for
the intervention to be a success. This provides the answer
to the question of whether the costs of a given intervention
can be outweighed by the economic returns.
4. Calculate profitabilityIf we know the break-even point – when returns equal costs
– we can set up a measure of when the intervention will re-
sult in a healthy bottom line. This can show when an inter-
vention will be economically profitable, even if we have no
tangible evidence of its outcomes.
In John's case, the costs in the long term are so high that
even just a few success stories will result in an overall pos-
itive return. Calculation of the costs and returns would
show that if an intervention can, for example, help vulner-
able young people to break free of a life of crime and sub-
stance abuse in just 13 per cent of cases, the future savings
will be high enough to pay the total costs of the interven-
tion. A successful intervention for someone like John will
yield savings high enough to pay for the interventions for
the next eight people. In Figure 22, the black line shows the
one-off costs, while the dashed line indicates the savings
from various success rates for the target group. The Figure
illustrates an intervention for 100 vulnerable young people.
In our scenario, the cost for each participant is DKK 865,000,
bringing the total costs to DKK 86.5 million. If none of the
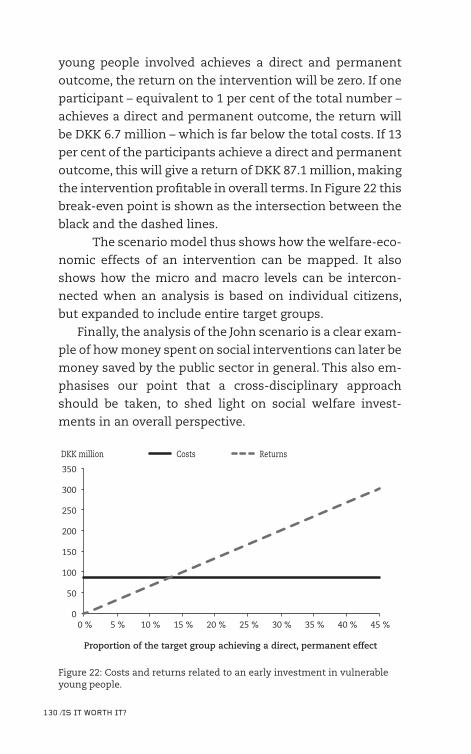
130 ⁄Is It worth It?
young people involved achieves a direct and permanent
outcome, the return on the intervention will be zero. If one
participant – equivalent to 1 per cent of the total number –
achieves a direct and permanent outcome, the return will
be DKK 6.7 million – which is far below the total costs. If 13
per cent of the participants achieve a direct and permanent
outcome, this will give a return of DKK 87.1 million, making
the intervention profitable in overall terms. In Figure 22 this
break-even point is shown as the intersection between the
black and the dashed lines.
The scenario model thus shows how the welfare-eco-
nomic effects of an intervention can be mapped. It also
shows how the micro and macro levels can be intercon-
nected when an analysis is based on individual citizens,
but expanded to include entire target groups.
Finally, the analysis of the John scenario is a clear exam-
ple of how money spent on social interventions can later be
money saved by the public sector in general. This also em-
phasises our point that a cross-disciplinary approach
should be taken, to shed light on social welfare invest-
ments in an overall perspective.
0
50
100
150
200
250
300
350
0 % 5 % 10 % 15 % 20 % 25 % 30 % 35 % 40 % 45 %
DKK million
Proportion of the target group achieving a direct, permanent effect
Costs Returns
Figure 22: Costs and returns related to an early investment in vulnerable young people.
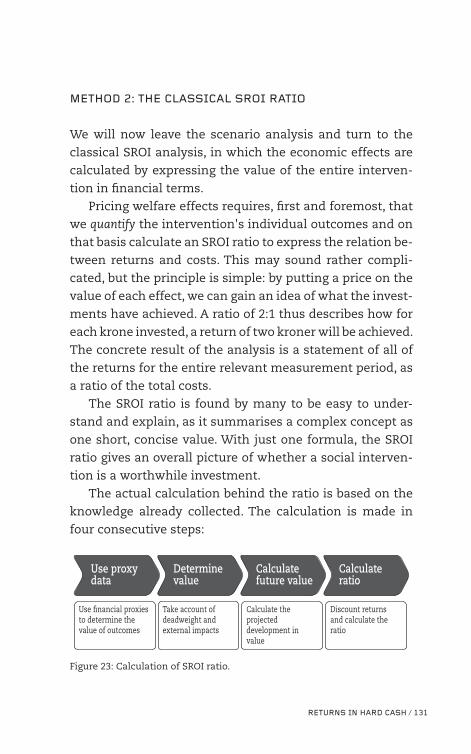
rEtUrNs IN hArD CAsh ⁄ 131
MEthoD 2: thE CLAssICAL sroI rAtIo
We will now leave the scenario analysis and turn to the
classical SROI analysis, in which the economic effects are
calculated by expressing the value of the entire interven-
tion in financial terms.
Pricing welfare effects requires, first and foremost, that
we quantify the intervention's individual outcomes and on
that basis calculate an SROI ratio to express the relation be-
tween returns and costs. This may sound rather compli-
cated, but the principle is simple: by putting a price on the
value of each effect, we can gain an idea of what the invest-
ments have achieved. A ratio of 2:1 thus describes how for
each krone invested, a return of two kroner will be achieved.
The concrete result of the analysis is a statement of all of
the returns for the entire relevant measurement period, as
a ratio of the total costs.
The SROI ratio is found by many to be easy to under-
stand and explain, as it summarises a complex concept as
one short, concise value. With just one formula, the SROI
ratio gives an overall picture of whether a social interven-
tion is a worthwhile investment.
The actual calculation behind the ratio is based on the
knowledge already collected. The calculation is made in
four consecutive steps:
Use proxy data
Use �nancial proxies to determine the value of outcomes
Take account of deadweight and external impacts
Calculate the projected development in value
Discount returns and calculate the ratio
Determine value
Calculate future value
Calculate ratio
Figure 23: Calculation of SROI ratio.
132 ⁄Is It worth It?
1. Use proxy dataOne element of the assessment of an SROI ratio is proxy
data, which is price measures of the outcomes that do not
have an immediate market value. Proxy data has long been
used in the infrastructure area, as well as in environmental
policy, where the data is used to determine the value of
communal assets such as roads and drinking water. In the
same way as for environmental effects, many social bene-
fits are not traded in a market and are therefore not imme-
diately translatable into financial values. Nonetheless, it is
actually possible to compile these benefits in price terms –
either by using estimated costs, or with the help of calcu-
lated averages. To price a criminal conviction, for example,
the cost can be calculated on an average basis as the total
costs of criminal activity in Denmark divided by the total
number of criminal convictions. This gives a cost of DKK
46,500 per criminal conviction.19 If an intervention leads to
a lower crime rate, there is a basis to evaluate the outcome
of this intervention.
SROI in practice
Value of GRITA comprehensive example of how these values can
be determined is found in the GRIT programme. Fig-
ure 24 shows how the value was analysed. In the
analysis, via interviews with both employees and
former participants a number of outcomes for the
19 Rasmus Højbjerg Jacobsen and Jens Kovsted: "Samfundsøkonomisk po-tentiale ved indførelse af Leksand-modellen i Danmark" (Economic po-tential of introducing the Leksand model in Denmark). Centre for Eco-nomics and Business Research, CBS (2012). The cost of DKK 46,500 is cal-culated on the basis of the number of convictions in 2005, discounted for-ward to the 2009 level.
rEtUrNs IN hArD CAsh ⁄ 133
participants were identified. They concern the par-
ticipants' mental and physical health, the fact that
more of them achieved employment or commenced
training or education, and the decrease in crime and
substance abuse. After this, questionnaires were cre-
ated to assess the extent of the outcomes for the for-
mer participants. As we showed in the previous
chapter, on this basis measures were estimated of
the proportion of the outcome that, in isolated terms,
originated from GRIT.
By applying a number of financial proxies, each
outcome could then be quantified and compiled in
monetary terms. A monetary value is thus deter-
mined for a participant becoming clean of drugs or
achieving a long-term improvement in mental
health. The outcomes related to participants' mental
well-being are, for example, priced on the basis of
the average cost of professional psychological coun-
selling. Financial proxies are used in the same way to
determine the other outcomes for the project.20
By setting a financial value for the various out-
comes and also determining the proportion of the
participants who experience the given outcomes, it
is possible to calculate the intervention's overall
value. When one person manages to stay clean or so-
ber, for example, this represents an annual economic
value of approximately £2,200. If this applies to one
fifth of the 144 participants, the value will be £63,800.
The analysis can thus identify the total economic
value of the registered outcomes.
20 Deloitte: "Evaluation of the GRIT Experience 2" (2012).
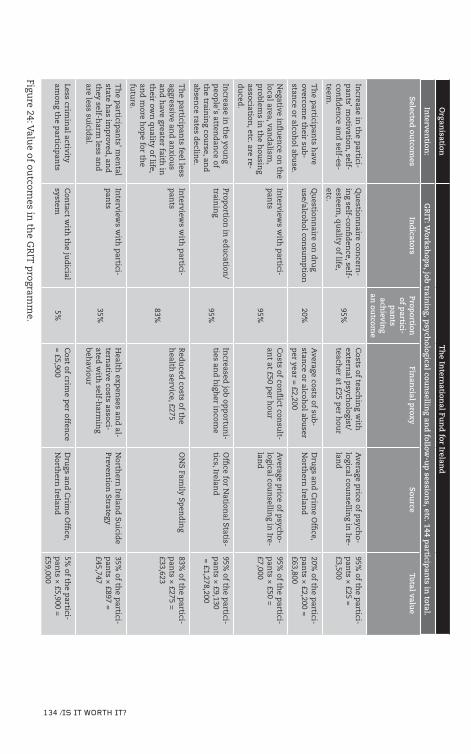
134 ⁄Is It worth It?
Organ
isationT
he In
ternation
al Fun
d for Irelan
d
Interven
tion:
GR
IT: W
orksh
ops, job
trainin
g, psych
ological coun
selling an
d follow
-up
sessions, etc. 144 p
articipan
ts in total.
Selected
outcom
esIn
dicators
Proportion
of p
artici -p
ants
achievin
g an
outcom
e
Finan
cial prox
yS
ource
Total value
Increase in
the p
artici -p
ants' m
otivation, self-
confi
den
ce and
self-es -teem
.
Qu
estionn
aire concern
-in
g self-confi
den
ce, self-esteem
, qu
ality of life, etc.
95%
Costs of teach
ing w
ith
external p
sychologist/
teacher at £25 p
er hou
r
Average p
rice of psych
o -logical cou
nsellin
g in Ire-
land
95% of th
e partici -
pan
ts × £25 =
£3,500
Th
e particip
ants h
ave overcom
e their su
b -stan
ce or alcohol abu
se.
Qu
estionn
aire on d
rug
use/alcoh
ol consu
mp
tion
20%A
verage costs of sub -
stance or alcoh
ol abuser
per year =
£2,200
Dru
gs and
Crim
e Offi
ce, N
orthern
Ireland
20% of th
e partici -
pan
ts × £2,200 =
£63,800
Negative in
flu
ence on
the
local area, vand
alism,
problem
s in th
e hou
sing
association, etc. are re -
du
ced.
Interview
s with
partici-
pan
ts95%
Costs of con
flict con
sult -
ant at £50 p
er hou
rA
verage price of p
sycho-
logical coun
selling in
Ire-lan
d
95% of th
e partici -
pan
ts × £50 =
£7,000
Increase in
the you
ng
peop
le's attend
ance of
the train
ing cou
rse, and
absen
ce rates declin
e.
Proportion
in ed
ucation
/train
ing
95%
Increased
job opp
ortun
i -ties an
d h
igher in
come
Offi
ce for Nation
al Statis-tics, Irelan
d95%
of the p
artici-p
ants ×
£9,130 =
£1,278,200
Th
e particip
ants feel less
aggressive and
anxiou
s an
d h
ave greater faith in
th
eir own
qu
ality of life, an
d m
ore hop
e for the
futu
re.
Interview
s with
partici -
pan
ts
83%
Red
uced
costs of the
health
service, £275O
NS Fam
ily Spen
din
g83%
of the p
artici -p
ants ×
£275 =
£33,623
Th
e particip
ants' m
ental
state has im
proved
, and
th
ey self-harm
less and
are less su
icidal.
Interview
s with
partici -
pan
ts35%
Health
expen
ses and
al-tern
ative costs associ-ated
with
self-harm
ing
behaviou
r
North
ern Irelan
d Su
icide
Prevention
Strategy35%
of the p
artici -p
ants ×
£897 =
£45,747
Less crimin
al activity am
ong th
e particip
ants
Con
tact with
the ju
dicial
system5%
Cost of crim
e per offen
ce =
£5,900D
rugs an
d C
rime O
ffice,
North
ern Irelan
d5%
of the p
artici-p
ants ×
£5,900 =
£59,000
Figure 24: V
alue of ou
tcomes in
the G
RIT
program
me.
rEtUrNs IN hArD CAsh ⁄ 135
2. Determine valueAs presented in Chapter 5, several factors are involved
when outcomes are isolated. To calculate the value of the
intervention, it is necessary to determine how much of the
value, in isolated terms, is a result of the intervention. As
we saw, this requires us to take account of the deadweight,
the impact from other players, and the time frame in which
the intervention is expected to achieve an outcome.
In the GRIT programme, the annual returns from the
participants kicking their drug or alcohol habit are esti-
mated at £63,800, or around DKK 600,000. After deducting 5
per cent as deadweight and 20 per cent attributable to ex-
ternal players' contributions, the isolated value is £48,448.
The isolated value for all outcomes is calculated in the
same way, so that the isolated financial value of the GRIT pro-
gramme after one year can be set as £1,116,870. The calcula-
tion is presented in Figure 25.
3. Calculate future valueThe overall return from the GRIT programme after year 1
has now been calculated. The next step is to determine the
value over time.
The projection can be made in two ways, of which the
most valid is naturally to perform an actual measurement
of outcome over time. If it is not possible to perform such
measurements, the projection can instead be based on a
qualified estimate of the year-on-year development in the
value of the intervention. For example, declining outcomes
may reflect how the strategies learned by the target group
may be forgotten, some members of the target group may
suffer relapses, or there may be other parameters that re-
duce the value of the intervention.
It has not been possible under the GRIT programme to
assess the results in the longer term, so that the projection
is based on an estimate. We can take the outcome "The par-
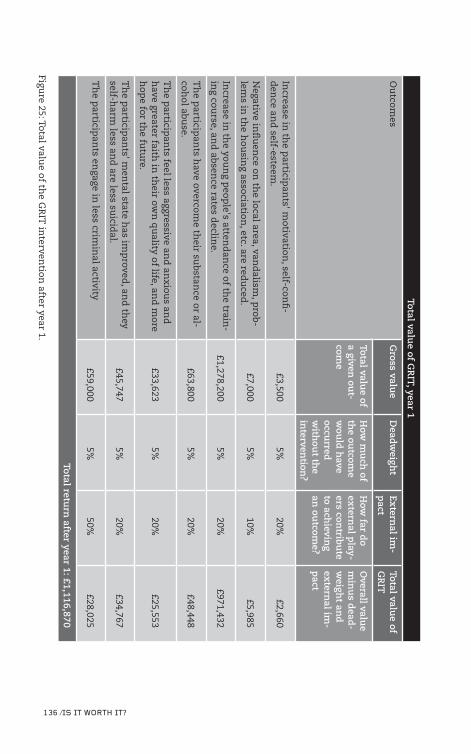
136 ⁄Is It worth It?
Total value of G
RIT, year 1
Ou
tcomes
Gross valu
eD
eadweigh
tEx
ternal im
-p
actTotal valu
e of G
RIT
Total value of
a given ou
t-com
e
How
mu
ch of
the ou
tcome
wou
ld h
ave occu
rred
with
out th
e in
tervention
?
How
far do
extern
al play-
ers contrib
ute
to achievin
g an
outcom
e?
Overall valu
e m
inu
s dead
-w
eight an
d
extern
al im-
pact
Increase in
the p
articipan
ts' motivation
, self-confi
-d
ence an
d self-esteem
.£3,500
5%20%
£2,660
Negative in
flu
ence on
the local area, van
dalism
, prob-
lems in
the h
ousin
g association, etc. are red
uced
.£7,000
5%10%
£5,985
Increase in
the you
ng p
eople's atten
dan
ce of the train
-in
g course, an
d absen
ce rates declin
e.£1,278,200
5%20%
£971,432
Th
e particip
ants h
ave overcome th
eir substan
ce or al-coh
ol abuse.
£63,8005%
20%£48,448
Th
e particip
ants feel less aggressive an
d an
xious an
d
have greater faith
in th
eir own
qu
ality of life, and
more
hop
e for the fu
ture.
£33,6235%
20%£25,553
Th
e particip
ants' m
ental state h
as imp
roved, an
d th
ey self-h
arm less an
d are less su
icidal.
£45,7475%
20%£34,767
Th
e particip
ants en
gage in less crim
inal activity
£59,0005%
50%£28,025
Total return
after year 1: £1,116,870
Figure 25: Total valu
e of the G
RIT
interven
tion after year 1.
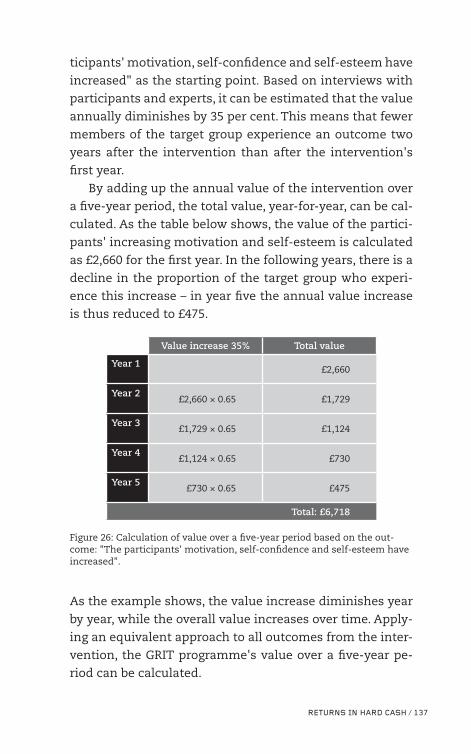
rEtUrNs IN hArD CAsh ⁄ 137
ticipants' motivation, self-confidence and self-esteem have
increased" as the starting point. Based on interviews with
participants and experts, it can be estimated that the value
annually diminishes by 35 per cent. This means that fewer
members of the target group experience an outcome two
years after the intervention than after the intervention's
first year.
By adding up the annual value of the intervention over
a five-year period, the total value, year-for-year, can be cal-
culated. As the table below shows, the value of the partici-
pants' increasing motivation and self-esteem is calculated
as £2,660 for the first year. In the following years, there is a
decline in the proportion of the target group who experi-
ence this increase – in year five the annual value increase
is thus reduced to £475.
Value increase 35% Total value
Year 1£2,660
Year 2£2,660 × 0.65 £1,729
Year 3£1,729 × 0.65 £1,124
Year 4£1,124 × 0.65 £730
Year 5£730 × 0.65 £475
Total: £6,718
Figure 26: Calculation of value over a five-year period based on the out-come: "The participants' motivation, self-confidence and self-esteem have increased".
As the example shows, the value increase diminishes year
by year, while the overall value increases over time. Apply-
ing an equivalent approach to all outcomes from the inter-
vention, the GRIT programme's value over a five-year pe-
riod can be calculated.
138 ⁄Is It worth It?
4. Calculate ratioIn an economic analysis for the social welfare area, many
returns will only emerge in the long term. Since the bene-
fits of the savings are not reaped until a future date, the re-
turn must be discounted back in order to assess the present
value of the investments. A return that does not emerge
until far into the future will thus have a lower present
value. Let us consider an intervention targeted at vulnera-
ble children. The costs of the intervention must be paid
while the intervention is taking place, but its returns will
only be seen over a long period. To compare the costs and
returns, which occur now and in the future, the future val-
ues are converted to present values using a discount rate.
The discount rate used is of vital importance since it can
determine whether an intervention targeted at vulnerable
children is a worthwhile investment.
Money today versus future returnsThere are various different views on what the dis-
count rate should be – the lower the discount rate,
the more worthwhile the investment, all other things
being equal. The Danish Ministry of Finance uses a
discount rate of 4 per cent for the first 35 years, while
the Danish Welfare Commission and the Danish Eco-
nomic Council apply a discount rate of 3 per cent.
Using a discount rate of 3 per cent means that if an
intervention yields a return of DKK 10 million ten
years after the intervention took place, it has a net
present value of almost DKK 7.5 million.
With a discount rate of 3 per cent, the value can be
calculated using the formula:
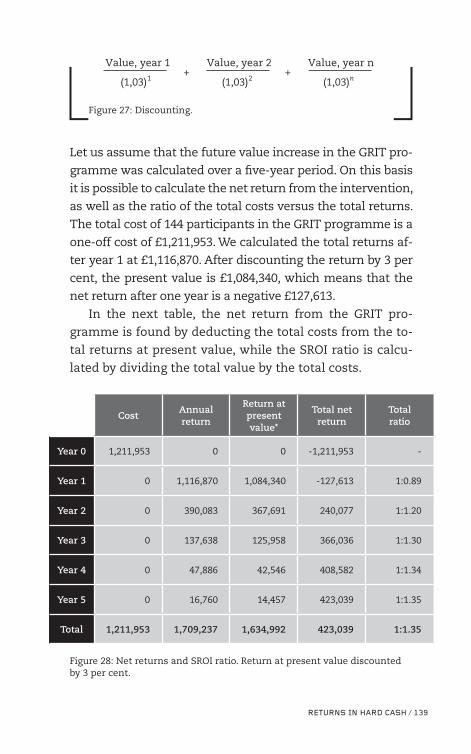
rEtUrNs IN hArD CAsh ⁄ 139
Value, year 1
(1,03)1
Value, year 2
(1,03)2 (1,03)n+ +
Value, year n
Figure 27: Discounting.
Let us assume that the future value increase in the GRIT pro-
gramme was calculated over a five-year period. On this basis
it is possible to calculate the net return from the intervention,
as well as the ratio of the total costs versus the total returns.
The total cost of 144 participants in the GRIT programme is a
one-off cost of £1,211,953. We calculated the total returns af-
ter year 1 at £1,116,870. After discounting the return by 3 per
cent, the present value is £1,084,340, which means that the
net return after one year is a negative £127,613.
In the next table, the net return from the GRIT pro-
gramme is found by deducting the total costs from the to-
tal returns at present value, while the SROI ratio is calcu-
lated by dividing the total value by the total costs.
CostAnnual return
Return at present value*
Total net return
Total ratio
Year 0 1,211,953 0 0 -1,211,953 -
Year 1 0 1,116,870 1,084,340 -127,613 1:0.89
Year 2 0 390,083 367,691 240,077 1:1.20
Year 3 0 137,638 125,958 366,036 1:1.30
Year 4 0 47,886 42,546 408,582 1:1.34
Year 5 0 16,760 14,457 423,039 1:1.35
Total 1,211,953 1,709,237 1,634,992 423,039 1:1.35
Figure 28: Net returns and SROI ratio. Return at present value discounted by 3 per cent.
The Figure shows that the total costs of the intervention
exceed the total returns in the first year, when the inter-
vention results in a ratio of 1:0.89. The ratio reflects how for
each pound invested there is a return of £0.89. In the slightly
longer term, however, the intervention is a good deal and
already proves its economic worth in the second year of the
intervention. After year five, the net return is thus more
than £420,000, which gives an SROI ratio of 1:1.35. For each
pound invested, a profit of £1.35 is achieved.
The Irish example shows that it is possible to put a price
on welfare outcomes and to calculate a ratio for the total
costs versus the total value. However, this calculation is
still subject to an element of uncertainty. We therefore rec-
ommend that a financial calculation never be allowed to
stand alone, but is presented as a sub-element of an over-
all SROI analysis.
ChECk LIst For rEtUrN oN INVEstMENt
For the scenario model:
üü Do the scenarios reflect knowledge of the results of a
given intervention – or are they as a minimum based on
realistic assumptions of possible outcomes?
üü Have the costs related to the 0 scenario been compiled?
üü Has account been taken of all of the economic conse-
quences, in both the short and long term?
üü Is it possible to determine break-even?
For the classical cost-benefit analysis:
üü Are there realistic proxies for all of the outcomes to be
included?
üü Is it possible to say anything about the size of the out-
come created by the intervention?
140 ⁄Is It worth It?
üü Is there any knowledge of the outcomes in the longer
term?
üü Does the ratio reflect a discounted return?
rEAD MorE
> Danish Ministry of Finance: "Vejledning i udarbejdelse af
samfundsøkonomiske konsekvensvurderinger" (Guide
to the preparation of economic consequence assess-
ments) (1999)
> Nilsson, Ingvar and Anders Wadeskog: "Det är bättre att
stämma i bäcken än i ån" (A stitch in time saves nine)
(2008).
> Nilsson, Ingvar and Anders Wadeskog: Handbok till en för-
enklad socioekonomisk analysmodell (Handbook for a
simplified socioeconomic analysis model). Skandia
(2010)
> The SROI Network: "A Guide to Social Return on Invest-
ment" (2012)

tArGEtED CoMMUNICAtIoN ⁄ 143
07tArGEtED CoMMUNICAtIoN
The last phase of an analysis of social return on investment
concerns the actual dissemination of the analysis results.
In this respect it is, for instance, important to communicate
to the stakeholders what an intervention signifies, for whom
it is significant, why it is significant, and whether it is viable
as a social welfare investment, preferably supplemented
with a number of explicit and realisable recommendations.
As for all communication, the dissemination should al-
ways be targeted at the relevant recipients. As previously
described, SROI is an instrument that can be used to collect
information at several levels, and various recipients have
different views of which success criteria an intervention is
subject to, and the premises for the evaluation of an inter-
vention. While decision makers lay down the overall objec-
tives and set priorities for the allocation of resources, it is
typically left to front-line employees to plan the work and
add the final touches to the professional intervention. The
two target groups thus have different perspectives, which
can be taken into account by emphasising various types of
return in the presentation.
144 ⁄Is It worth It?
All players must prove their valueMorten Wiene relates: The GRIT programme is in-
cluded in this book not only because the programme
has achieved impressive results for the vulnerable
young people. It is also included because the GRIT
programme was undertaken by a private player that,
even more than a public player, is required to justify
the intervention – and virtually market it to be able to
obtain sufficient financing.
The GRIT programme is Irish, but could just as
well have been Danish, since in Denmark we also
have many private players in the social welfare area,
such as private residential institutions, housing
schemes and nursing homes, to mention just a few.
From an SROI viewpoint, the private players are in-
teresting since they are obliged to communicate
clearly about what they do – and show that it has an
effect. The better they are at documenting and de-
scribing the value they create, the better they will be
able to attract citizens, staff and funding for the on-
going operations. The examples from Ireland, for in-
stance, also show that the documentation is a source
of marked professional pride among both manage-
ment and staff. I have experienced how several staff
members have enthusiastically described a newly
developed and documented method, or a specific ac-
creditation they have received. They are hereby also
showing how a method such as SROI is not intended
to exert more control – but to measure value and
make it visible. We expect that in future there will be
a greater expectation that public providers of social
interventions also be required to ensure that the
value they create is visible.
tArGEtED CoMMUNICAtIoN ⁄ 145
Being able to show their value presents many ad-
vantages for both public and private players – also in
Denmark. Nonetheless, only around one in ten invi-
tations to tender on the Danish National Board of So-
cial Services' procurement portal subject outcomes
to systematic follow-up, and also describe this fol-
low-up. In other words, we are behind the times in
Denmark when it comes to documenting what we
do. This is related, among other things, to our culture
of trust, our lack of instruments, the limited interest
in such instruments (until recently at any rate) and,
not least, our limited data.
As a result, we annually spend billions on inter-
ventions of which we do not know the effect. Even
when the interventions do work, we very rarely com-
pare the outcomes with the economic aspects. I am
therefore in no doubt that the tendency to document
value we can currently see in such countries as Can-
ada, Eire, the UK and the USA will also win ground in
Denmark. There will be more intense competition to
communicate the value of various interventions,
and a fight to prove their worth.
ProFEssIoNAL PrEsENtAtIoN to FroNt-LINE EMPLoY-
EEs
In cases where an SROI analysis is focused on the front-line
employees who perform a given intervention, the dissemi-
nation of the analysis should typically be centred on the
professional results of the intervention, as well as specific
examples of how the efforts generate a return on invest-
ment. Dissemination to front-line employees can thus be
146 ⁄Is It worth It?
based on the following clarifying questions, which are all
focused on the effects of the professional intervention:
> Is there agreement between the programme theory ap-
plied and the results seen in the analysis?
> Which elements of the intervention are especially im-
portant to achieving good results?
> Do we have sufficient knowledge of the intervention's
outcomes, and how we can work in future to obtain this
knowledge?
> How can we use (new) indicators in a way that is also
worthwhile in the front-line employees' day-to-day
work?
> How is user-experienced quality represented in the anal-
ysis? Is it possible to improve the results?
By focusing the dissemination on these questions, an over-
view can be gained of the relation between interventions
and the status of the target group's development. In addi-
tion, positive experience and successful interventions can
serve as examples of how the return on investment can be
maximised. This might be a case based on a description of
a citizen's actual situation, or a similar situation.
SROI in practice
Dissemination of return on investmentRebild Municipality has very successfully dissemi-
nated the holistic intervention for vulnerable fami-
lies, based on one of the families who benefited from
the intervention. Here, the Municipality gives a brief
description of the family's situation and the results
of the intervention for the family members, as shown
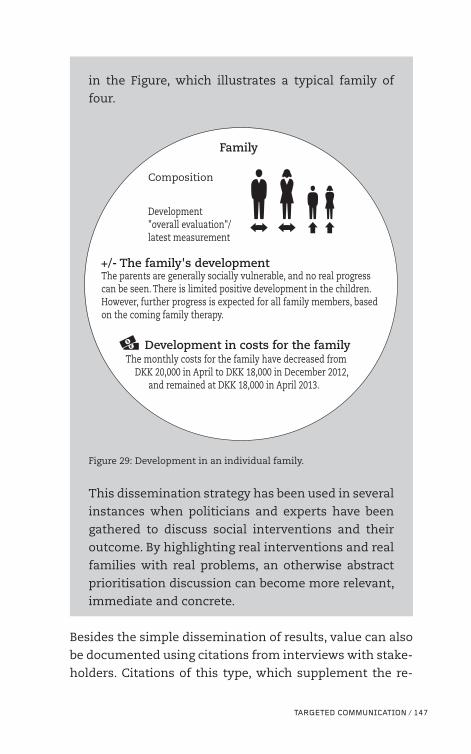
tArGEtED CoMMUNICAtIoN ⁄ 147
in the Figure, which illustrates a typical family of
four.
Family
Composition
Development "overall evaluation"/latest measurement
+/- The family's development
Development in costs for the family
The parents are generally socially vulnerable, and no real progress can be seen. There is limited positive development in the children. However, further progress is expected for all family members, based on the coming family therapy.
The monthly costs for the family have decreased from DKK 20,000 in April to DKK 18,000 in December 2012,
and remained at DKK 18,000 in April 2013.
Figure 29: Development in an individual family.
This dissemination strategy has been used in several
instances when politicians and experts have been
gathered to discuss social interventions and their
outcome. By highlighting real interventions and real
families with real problems, an otherwise abstract
prioritisation discussion can become more relevant,
immediate and concrete.
Besides the simple dissemination of results, value can also
be documented using citations from interviews with stake-
holders. Citations of this type, which supplement the re-
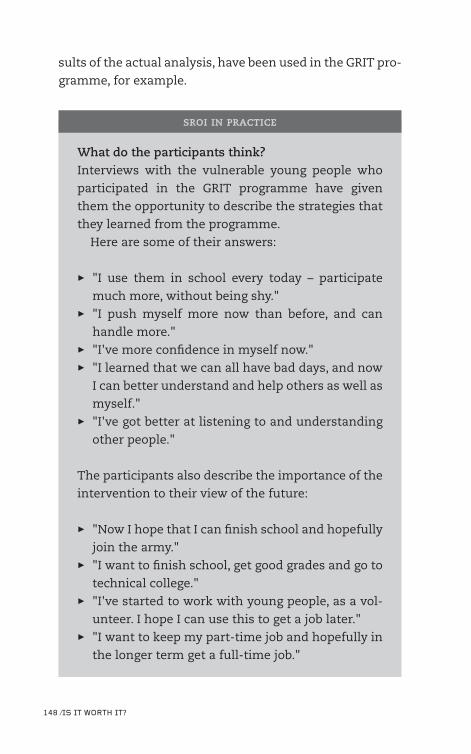
148 ⁄Is It worth It?
sults of the actual analysis, have been used in the GRIT pro-
gramme, for example.
SROI in practice
What do the participants think?Interviews with the vulnerable young people who
participated in the GRIT programme have given
them the opportunity to describe the strategies that
they learned from the programme.
Here are some of their answers:
> "I use them in school every today – participate
much more, without being shy."
> "I push myself more now than before, and can
handle more."
> "I've more confidence in myself now."
> "I learned that we can all have bad days, and now
I can better understand and help others as well as
myself."
> "I've got better at listening to and understanding
other people."
The participants also describe the importance of the
intervention to their view of the future:
> "Now I hope that I can finish school and hopefully
join the army."
> "I want to finish school, get good grades and go to
technical college."
> "I've started to work with young people, as a vol-
unteer. I hope I can use this to get a job later."
> "I want to keep my part-time job and hopefully in
the longer term get a full-time job."
tArGEtED CoMMUNICAtIoN ⁄ 149
Another effective dissemination strategy is to present the
quantitative results of the analysis. This might be the re-
sults of the outcome indicators set up, the results of any
questionnaires, or key targets such as increased employ-
ment or fewer criminal convictions. While cases and perso-
nas can concretise the intervention, the quantitative re-
sults can paint a broader picture of the return on invest-
ment and the general results.
In connection with the development of the documenta-
tion of results in the children and adolescent area, Deloitte
developed simple diagrams to show the development for
children and adolescents in relation to key factors such as
health, schooling and learning, leisure time, development
and behaviour, family circumstances and family rela-
tions.21 The diagram in Figure 30 thus shows the propor-
tions of children and young people who have experienced
positive development, no development or negative devel-
opment, respectively, since the previous measurement.
In the same way, a questionnaire survey can be pre-
sented using simple graphic diagrams. Figure 31 shows the
questionnaire results for the GRIT participants who were
asked to state how far they agreed or disagreed with a num-
ber of statements concerning the outcome of the pro-
gramme.
21 Deloitte for the Danish National Board of Social Services: "Resultatdoku-mentation på børne- og ungeområdet". (Documentation of results in the area of children and young people) Model description (2013).
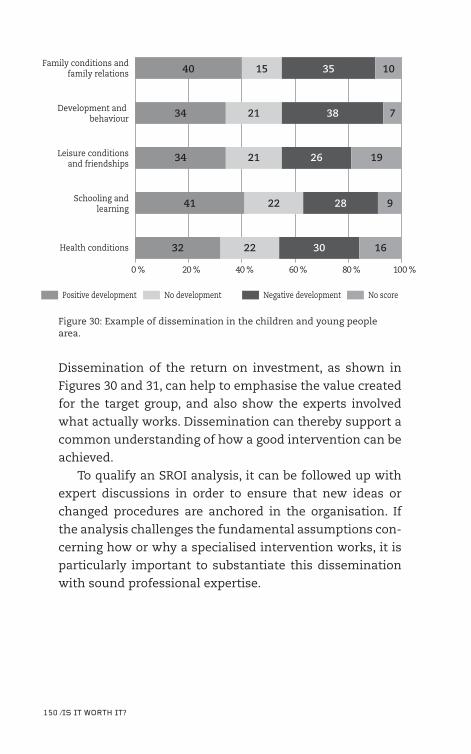
150 ⁄Is It worth It?
Figure 30: Example of dissemination in the children and young people area.
Dissemination of the return on investment, as shown in
Figures 30 and 31, can help to emphasise the value created
for the target group, and also show the experts involved
what actually works. Dissemination can thereby support a
common understanding of how a good intervention can be
achieved.
To qualify an SROI analysis, it can be followed up with
expert discussions in order to ensure that new ideas or
changed procedures are anchored in the organisation. If
the analysis challenges the fundamental assumptions con-
cerning how or why a specialised intervention works, it is
particularly important to substantiate this dissemination
with sound professional expertise.
Family conditions andfamily relations
Development and behaviour
Leisure conditionsand friendships
Schooling andlearning
Health conditions
0 % 100 %80 %60 %40 %20 %
40
34
34
41
32
15
21
21
22
22
35
38
26
28
30
10
7
19
9
16
Positive development No development Negative development No score
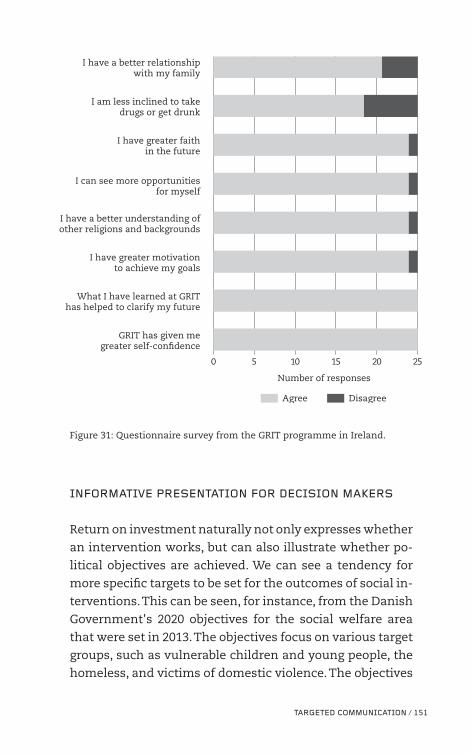
tArGEtED CoMMUNICAtIoN ⁄ 151
0 252015105
Agree Disagree
I have a better relationship with my family
Number of responses
I am less inclined to take drugs or get drunk
I have greater faith in the future
I can see more opportunities for myself
I have a better understanding of other religions and backgrounds
I have greater motivation to achieve my goals
What I have learned at GRIT has helped to clarify my future
GRIT has given me greater self-con�dence
Figure 31: Questionnaire survey from the GRIT programme in Ireland.
INForMAtIVE PrEsENtAtIoN For DECIsIoN MAkErs
Return on investment naturally not only expresses whether
an intervention works, but can also illustrate whether po-
litical objectives are achieved. We can see a tendency for
more specific targets to be set for the outcomes of social in-
terventions. This can be seen, for instance, from the Danish
Government's 2020 objectives for the social welfare area
that were set in 2013. The objectives focus on various target
groups, such as vulnerable children and young people, the
homeless, and victims of domestic violence. The objectives
include that by the age of 25, at least 50 per cent of vulner-
able children and young people have completed upper sec-
ondary education, and that the ratio of failed care place-
ments is reduced by at least 30 per cent.22 Besides the 2020
social welfare objectives, the Danish Government has set
the objective that 95 per cent of a youth cohort must com-
plete upper secondary education.23
Many municipalities work with equivalent political ob-
jectives, but there is considerable variation in how clear
and operational the objectives are, and how they are fol-
lowed up. We expect that the coming years will see greater
focus on the returns of social interventions at all levels. In
this respect, analysing returns on investment can provide
an important knowledge and prioritisation basis in relation
to both setting up and following up on objectives.
We recommend that the dissemination of a return on
investment analysis at the political level be centred on a
number of key issues:
> What is the return on investment from a given interven-
tion in a long-term perspective?
> Does the outcome match the investments that are nec-
essary in order to achieve the intervention?
> Is the intervention based on the best knowledge cur-
rently available?
> Does society get enough for its money from the current
intervention and is it still a good idea to implement the
intervention?
22 The Danish Government: "Alle skal med – Målsætninger for de mest ud-satte frem mod 2020" (Everyone must be included – Objectives for the most vulnerable towards 2020) (2013).
23 Danish Ministry of Education: www.uvm.dk/I-fokus/95-procent-maal-saetning.
152 ⁄Is It worth It?
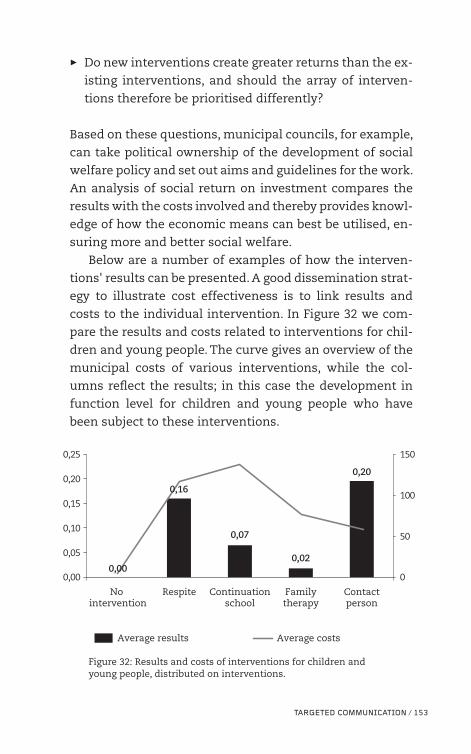
> Do new interventions create greater returns than the ex-
isting interventions, and should the array of interven-
tions therefore be prioritised differently?
Based on these questions, municipal councils, for example,
can take political ownership of the development of social
welfare policy and set out aims and guidelines for the work.
An analysis of social return on investment compares the
results with the costs involved and thereby provides knowl-
edge of how the economic means can best be utilised, en-
suring more and better social welfare.
Below are a number of examples of how the interven-
tions' results can be presented. A good dissemination strat-
egy to illustrate cost effectiveness is to link results and
costs to the individual intervention. In Figure 32 we com-
pare the results and costs related to interventions for chil-
dren and young people. The curve gives an overview of the
municipal costs of various interventions, while the col-
umns reflect the results; in this case the development in
function level for children and young people who have
been subject to these interventions.
Contactperson
0,00 0
50
100
150
0,05
0,10
0,15
0,20
0,25
0,16
0,07
0,02
0,20
0,00
Ave
rage
res
ult
s of
inte
rven
tion
Ave
rage
cos
ts (D
KK
1,0
00)
No intervention
Respite Continuationschool
Familytherapy
Average results Average costs
Figure 32: Results and costs of interventions for children and young people, distributed on interventions.
tArGEtED CoMMUNICAtIoN ⁄ 153
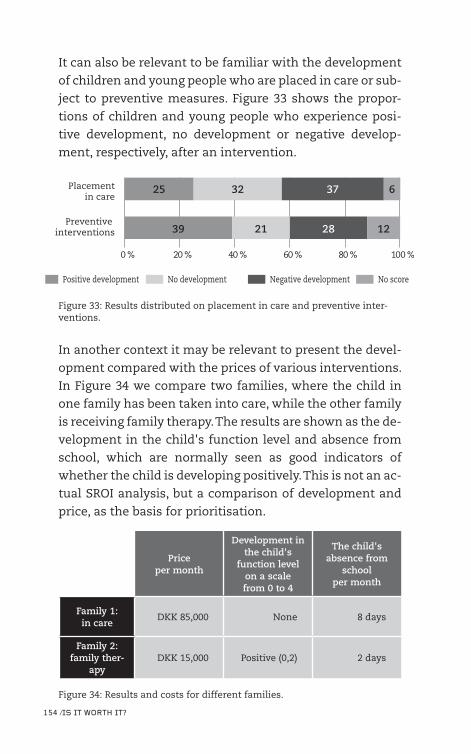
154 ⁄Is It worth It?
It can also be relevant to be familiar with the development
of children and young people who are placed in care or sub-
ject to preventive measures. Figure 33 shows the propor-
tions of children and young people who experience posi-
tive development, no development or negative develop-
ment, respectively, after an intervention.
Placementin care
Preventive interventions
0 % 100 %80 %60 %40 %20 %
25
39
32
21
37
28
6
12
Positive development No development Negative development No score
Figure 33: Results distributed on placement in care and preventive inter-ventions.
In another context it may be relevant to present the devel-
opment compared with the prices of various interventions.
In Figure 34 we compare two families, where the child in
one family has been taken into care, while the other family
is receiving family therapy. The results are shown as the de-
velopment in the child's function level and absence from
school, which are normally seen as good indicators of
whether the child is developing positively. This is not an ac-
tual SROI analysis, but a comparison of development and
price, as the basis for prioritisation.
Price per month
Development in the child's
function levelon a scale from 0 to 4
The child's absence from
school per month
Family 1: in care
DKK 85,000 None 8 days
Family 2: family ther-
apyDKK 15,000 Positive (0,2) 2 days
Figure 34: Results and costs for different families.
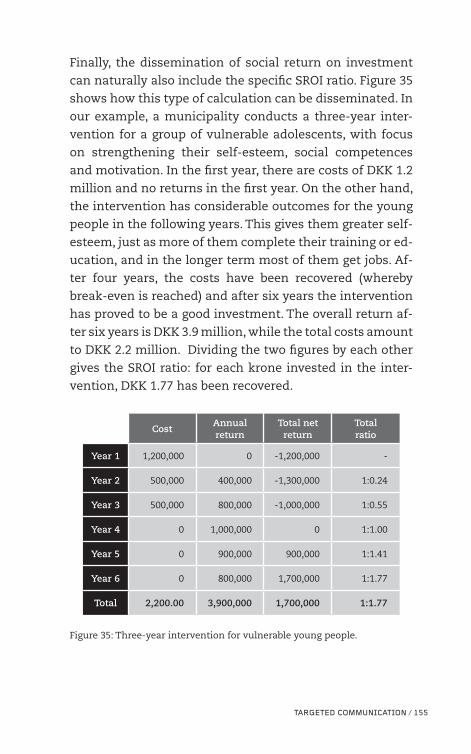
tArGEtED CoMMUNICAtIoN ⁄ 155
Finally, the dissemination of social return on investment
can naturally also include the specific SROI ratio. Figure 35
shows how this type of calculation can be disseminated. In
our example, a municipality conducts a three-year inter-
vention for a group of vulnerable adolescents, with focus
on strengthening their self-esteem, social competences
and motivation. In the first year, there are costs of DKK 1.2
million and no returns in the first year. On the other hand,
the intervention has considerable outcomes for the young
people in the following years. This gives them greater self-
esteem, just as more of them complete their training or ed-
ucation, and in the longer term most of them get jobs. Af-
ter four years, the costs have been recovered (whereby
break-even is reached) and after six years the intervention
has proved to be a good investment. The overall return af-
ter six years is DKK 3.9 million, while the total costs amount
to DKK 2.2 million. Dividing the two figures by each other
gives the SROI ratio: for each krone invested in the inter-
vention, DKK 1.77 has been recovered.
CostAnnual return
Total net return
Total ratio
Year 1 1,200,000 0 -1,200,000 -
Year 2 500,000 400,000 -1,300,000 1:0.24
Year 3 500,000 800,000 -1,000,000 1:0.55
Year 4 0 1,000,000 0 1:1.00
Year 5 0 900,000 900,000 1:1.41
Year 6 0 800,000 1,700,000 1:1.77
Total 2,200.00 3,900,000 1,700,000 1:1.77
Figure 35: Three-year intervention for vulnerable young people.
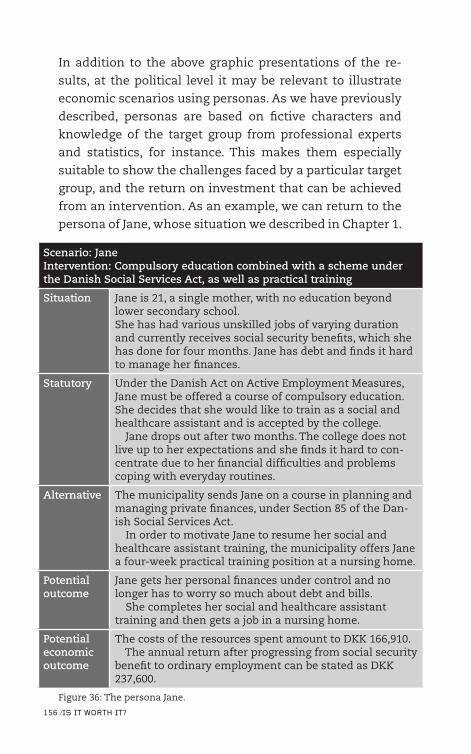
In addition to the above graphic presentations of the re-
sults, at the political level it may be relevant to illustrate
economic scenarios using personas. As we have previously
described, personas are based on fictive characters and
knowledge of the target group from professional experts
and statistics, for instance. This makes them especially
suitable to show the challenges faced by a particular target
group, and the return on investment that can be achieved
from an intervention. As an example, we can return to the
persona of Jane, whose situation we described in Chapter 1.
Scenario: JaneIntervention: Compulsory education combined with a scheme under the Danish Social Services Act, as well as practical training
Situation Jane is 21, a single mother, with no education beyond lower secondary school.She has had various unskilled jobs of varying duration and currently receives social security benefits, which she has done for four months. Jane has debt and finds it hard to manage her finances.
Statutory Under the Danish Act on Active Employment Measures, Jane must be offered a course of compulsory education. She decides that she would like to train as a social and healthcare assistant and is accepted by the college. Jane drops out after two months. The college does not live up to her expectations and she finds it hard to con-centrate due to her financial difficulties and problems coping with everyday routines.
Alternative The municipality sends Jane on a course in planning and managing private finances, under Section 85 of the Dan-ish Social Services Act. In order to motivate Jane to resume her social and healthcare assistant training, the municipality offers Jane a four-week practical training position at a nursing home.
Potential outcome
Jane gets her personal finances under control and no longer has to worry so much about debt and bills. She completes her social and healthcare assistant training and then gets a job in a nursing home.
Potential economic outcome
The costs of the resources spent amount to DKK 166,910. The annual return after progressing from social security benefit to ordinary employment can be stated as DKK 237,600.
Figure 36: The persona Jane.
156 ⁄Is It worth It?
Whether the results of an SROI analysis are to be dissemi-
nated to front-line employees or decision makers, the form
and content should always be considered carefully. There is
a risk of spending a lot of time and many resources on a
complex, value-creating analysis, without giving sufficient
priority to communicating and anchoring the results. Far
too many analysis results thus end up in a drawer or in a
pile on a desk, instead of being used actively to improve
practice.
When communication is planned, it is important to be
aware of the target group's perspectives and interests, in
order to target the communication on the best possible ba-
sis. In this chapter we have presented a number of consid-
erations that are important in the approach to front-line
employees and decision makers, although the results of an
SROI analysis may be relevant for many other stakeholders,
such as business associates, private players, various con-
tributors, the press, or society at large.
Irrespective of the target group, it is always a good idea
to keep the messages simple and to highlight the essence
of the analysis, after which the recipient is naturally free to
spend time on studying the analysis' basis, methods and
results in closer detail. In this respect the concept of "es-
sence" not only signifies the key conclusions of the analy-
sis, but also the manifestation of these conclusions via
cases, graphic presentations or stories from real life. There
is no doubt that an SROI analysis must naturally be based
on facts and logically-structured arguments, but behind
the facts there are always people, and these people's lives
have had ups and downs, triumphs and failures, with the
hope of a better life. Their stories can add a human face to
the numbers and arguments, making the SROI analysis dy-
namic and relevant. In the final analysis, these stories are
the key aspect when we ask each other the big question: Is
it worth it?
tArGtED CoMMUNICAtIoN / 157
ChECk LIst For DIssEMINAtIoN oF rEsULts
üü Is the dissemination focused according to the target
group?
üü Are the results disseminated precisely and clearly?
üü Do we use citations, cases or personas in our presenta-
tion of the results?
üü Are all of the results described at different levels?
üü Have all relevant prerequisites, assumptions and limita-
tions to the analysis been presented?
rEAD MorE
> Deloitte for the Danish National Board of Social Services:
"Resultatdokumentation på børne- og ungeområdet"
(Documentation of results for the children and young
people area) (2013)
> The SROI Network: "A Guide to Social Return on Invest-
ment" (2012)
> New Economics Foundation: "Small Slices of a Bigger Pie:
Attribution in SROI" (2011)
> LGDK: "Investér før det sker – sådan sætter vi handling
bag ordene" (Invest before it happens – how we put the
theory into practice) (2013)
> Hansen, Kasper Møller: Borgerinddragelse – et studie af bor-
gerinddragelsen i regioner og kommuner (Citizen involve-
ment – a study of citizen involvement in regions and mu-
nicipalities). Syddansk Universitetsforlag (2009)
EPILoGUE ⁄ 159
EPILoGUE: soCIAL rEtUrN oN INVEstMENt AND thE wELFArE oF thE FUtUrE
"Evidence is just common sense" wrote Manu Sareen, Dan-
ish Minister for Children, Gender Equality, Integration and
Social Affairs, in a contribution dated 10 April 2014 on
altinget.dk. He continued: "In practice this means that
whenever we spend time and money in the social welfare
area, we must take the trouble to do this in the way that we
know will have the best outcome. Without sufficient docu-
mentation in the social welfare area, we risk that the inter-
vention either does not work, or does more harm than
good. This is of no benefit whatsoever to the child in care,
or to you and me as taxpayers."
This book is based on the same philosophy: Evidence is
common sense. In fact, knowledge of what works is actu-
ally necessary in order to do our best in the social welfare
area, where the interventions available are all too often
based on entrenched habits, unqualified estimates or deci-
sions made on the basis of short-term parameters, without
considering how alternative interventions can create far
more value in the longer term.
160 ⁄Is It worth It?
Analyses of social return on investment are a good instru-
ment that can help both municipalities and other public
and private players to develop the quality of the social wel-
fare area and find new solutions that can ensure the social
welfare of the future.
There are several reasons that these instruments are
needed. First of all, social welfare activities concern so
many people in Denmark that we need to know what
works, and what we get for our money. In other words, we
have both an economic and an ethical obligation to deliver
the best possible interventions to help the socially vulner-
able. We owe it to both them and the taxpayers to prioritise
the interventions that work best, and create most value for
money.
Secondly, the demand for social interventions is in-
creasing year by year. The municipalities already face a
shortage of resources and are forced to make cuts and set
priorities between, for example, care of the elderly, schools
and childcare institutions and, not least, the vulnerable
and underprivileged. The overall costs in the social welfare
area have been increasing for many years. It is therefore vi-
tal that we as a society achieve the best possible return
from the funds invested.
Thirdly, it has become easier to analyse social return on
investment. Even though there are still many gaps in our
knowledge and a lack of data, we can see how research and
new methods are increasingly being integrated into pro-
grammes and interventions. One example is the adult in-
vestigation method, which on the basis of shared concepts
and targets paves the way for extensive knowledge assim-
ilation in the adult area. Yet it also concerns new opportu-
nities to use various IT solutions to obtain complex data
sets from different sources.
Last, but not least, documentation of outcome is a uni-
versal language that not only unites the social welfare area,
EPILoGUE ⁄ 161
but also extends to other professional groups and cross-
disciplinary research. If we can show which interventions
actually work, it will be increasingly possible to cooperate
across traditional divides and find shared cross-discipli-
nary solutions. At the same time, the SROI analyses can
also give employees insight into other professional groups'
areas of expertise, so that shared programme theories, ob-
jectives and procedures can be developed – which are all
necessary in order to create more value.
DrAwBACks oF sroI ANALYsEs
SROI analyses are useful tools to document value. Yet the
method also presents certain practical and theoretical
challenges. Like all other methods, SROI analyses are also
often subject to criticism. This criticism must be taken se-
riously, yet we should not be dissuaded from using the
method. It is always important to justify the relevance of
SROI analyses in relation to a given intervention, just as it
is always important to stay abreast of any challenges.
Here are three criticisms that are often voiced concern-
ing SROI analyses:
Criticism no. 1: It is time-consuming and expensive to perform an SROI analysis.Is it expensive and time-consuming to perform a full SROI
analysis? Yes, definitely – but a less comprehensive analy-
sis is also possible. No one says that an SROI analysis must
be performed from start to conclusion. Instead, sub-ele-
ments from the analysis framework can be used. These
sub-elements might be stakeholder involvement, a number
of easily accessible indicators, or merely a provisional pro-
gramme theory that clarifies the most basic causal rela-
tionships between intervention and outcome. Even a sim-
ple before and after measurement can in many cases con-
tribute to significantly increasing our knowledge concern-
ing an intervention. Even in its simplest form – such as set-
ting up a persona – the SROI method can help to unravel
the complexity and shed new light on the value of an inter-
vention.
Criticism no. 2: Humanism versus an evidence-based approachMany specialised professions within the social welfare area
are rooted in a strong humanist tradition. In such an envi-
ronment, there may be a certain reluctance to reduce social
conditions to individual causes and effects, just as the idea
of regarding work in the social welfare area as an invest-
ment often leads to doubts and scepticism. In this context
it comes as no surprise either that the debate concerning
evidence in the social welfare area can lead to vehement
discussion among professionals and stakeholder organisa-
tions. One argument is that worthwhile social welfare in-
terventions are created in the relation between citizen and
employee, and that this relationship of trust cannot be
measured or put into a formula. Other sceptics believe that
social welfare interventions are generally too complex and
intangible to be measured.24
As strong proponents of evidence, we would like to em-
phasise that SROI is not exclusively a quantitative evidence
tool. As the examples in the book have shown, the qualita-
tive data collection and stakeholder involvement are im-
portant elements of any analysis. Using an SROI analysis,
not only can we document whether an intervention works,
but also why it works and how it might perhaps be per-
formed better. Insight into these factors should be of inter-
24 See, for example, the discussions concerning evidence in the Danish trade periodical Socialpædagogen, 13 May 2005.
162 ⁄Is It worth It?
est to all of the parties involved, if we lower our profes-
sional guard a little.
Criticism no. 3: Fears of more control.Many front-line employees who work with social welfare
interventions on a day-to-day basis do not care to be sub-
ject to more control. Part of this fear is probably related to
a large number of new public-management inspired initia-
tives that for many years have contributed to increasing
control mechanisms and management by objectives. Even
the typical top-down dissemination of these initiatives can
lead to a certain anxiety about new ideas or methods. How-
ever, analyses of returns on investment extend far beyond
control and are first and foremost a tool for development
and learning. An important initial step in an SROI analysis
is therefore to prepare the ground before the actual imple-
mentation, so that employees understand that both they
and the recipients of the social welfare interventions are
certain to benefit from greater knowledge of which inter-
ventions actually work. Detailed regulation will be super-
fluous if a profession can demonstrate that its work actu-
ally yields a positive return.
DoCUMENtAtIoN CrEAtEs VALUE At sEVErAL LEVELs
Throughout this book we have emphasised the importance
of involving employees in the process. This not only
achieves a broader and more precise assessment of inter-
ventions, but also creates reflection among both decision
makers and practicians concerning resources versus out-
comes. All other things being equal, it is the public sector's
responsibility and obligation to seek to systematically col-
lect knowledge as the basis for the assessment of interven-
tions. The result is not more control but, on the contrary,
EPILoGUE ⁄ 163
that both employees and managers can fairly and squarely
explain why they act as they do.
The Danish public sector is strong, with dedicated em-
ployees. To continue to ensure quality and positive change
for citizens and society, we must set the agenda and take
the lead in a constant process of change towards new and
better interventions. This requires both the knowledge and
the will to change the customary ways of doing things.
We hope that with this book we have helped to show a
little of the way.
rEAD MorE
> Altinget: "Evidens er bare sund fornuft" (Evidence is just
common sense), 10 April (2014)
> LGDK: "Investér før det sker – sådan sætter vi handling
bag ordene" Socialpolitisk udspil" (Invest before it hap-
pens – how we put the theory into practice. Social-policy
intervention) (2013)
> Mandag Morgen: "Virker velfærden? Et debatoplæg om
evidens og velfærd" (Does welfare work? A discussion
paper concerning evidence and welfare) (2005)