Embed Size (px)
Citation preview

c e n t e r o n j a p a n e s e e c o n o m y a n d b u s i n e s s
Working Paper Series September 2012, No. 306
Is Japan Really a “Buy”? The Corporate Governance, Cash Holdings, and Economic Performance of Japanese Companies
Kazuo Kato, Meng Li, and Douglas J. Skinner
This paper is available online at www.gsb.columbia.edu/cjeb/research
C O L U M B I A U N I V E R S I T Y I N T H E C I T Y O F N E W Y O R K

Is Japan Really a “Buy”? The Corporate Governance, Cash Holdings, and Economic Performance of Japanese Companies
Kazuo Kato, Meng Li, and Douglas J. Skinner
April 2011; revised, June 2012
Abstract Over the past ten years there has been much discussion about whether corporate governance in Japan has improved and, if so, whether this results in improved corporate performance. We investigate whether observed changes in Japanese firms’ cash holdings and payout policy are consistent with improved governance. To do this, we benchmark Japanese firms against U.S. firms. We find mixed evidence on whether Japanese governance has improved overall, in that, conditional on firm characteristics, the cash holdings of Japanese firms are still systematically higher than those of U.S. firms. There is evidence, however, of a strong increase in total payouts (dividends and repurchases) for Japanese firms, especially those that make repurchases. We also find that there is an inverse relation between changes in (excess) cash holdings and changes in performance for Japanese firms, consistent with improvements in governance being associated with improved performance. Further, we find that the market valuation of cash holdings was lower for Japanese firms than U.S. firms in the 1990s, which is indicative of poorer governance, but that this difference largely reverses in the 2000s. Overall, the evidence suggests that governance practices in Japan have improved for some firms, and that when governance does improve it is associated with improvements in performance and valuation.
__________________________________________________ Kato is from the Osaka University of Economics; Li and Skinner are from the University of Chicago, Booth School of Business. We appreciate comments from Yasushi Hamao, Tomomi Takada, and workshop participants at the University of Arkansas, the University of Minnesota Empirical Conference, Southern Methodist University, Tilburg University, and USC. Li and Skinner acknowledge financial support from the University of Chicago, Booth School of Business.

1
1. Introduction
In the weeks after Japan’s recent earthquake and tsunami and the ensuing shock to equity
prices, a great deal of attention focused on whether Japanese equities were “cheap.”1 This is not
a new perspective. At least since French and Poterba (1991), it has been clear that common
valuation metrics for Japanese firms often differ systematically from those of firms in other
countries. At the time French and Poterba wrote their paper, Japanese equity prices seemed too
high. Since the “bubble” in Japanese real estate and equity prices burst in 1990, the reverse has
been true—Japanese equities have looked cheap by conventional measures. Over the last two
decades, Japanese price-to-book multiples have often been well below those of U.S. firms, with
many below 1. So interest in buying Japanese equities is not new, and many non-Japanese
(foreign) investors have been tempted to buy Japanese equities given their relative valuations.2
Figure 1 plots the Nikkei 225 from 1984 to the present, which reinforces this point.
Japanese firms are also known for holding unusually high levels of cash. Rajan and
Zingales (1995) examine the cash holdings of companies across the G7, and find that Japanese
firms held substantially more cash than their G7 counterparts in 1991. Pinkowitz and
Williamson (2001) argue that Japan’s main bank system exacerbates this problem because the
banks induce their industrial affiliates to hold excessive cash as a way of expropriating wealth, a
result that reinforces earlier findings on the role of main banks in Japan (Weinstein and Yafeh,
1998). Because large holdings of cash are generally viewed as symptomatic of poor
1 See, for example, “Buffett casts vote of confidence on Japan,” Financial Times, March 21, 2011. Buffett is quoted as saying that “(i)t will take some time to rebuild but it will not change the economic future of Japan…If I owned Japanese stocks, I would certainly not be selling them...Frequently, something out of the blue like this, an extraordinary event, really creates a buying opportunity.” 2 Milhaupt (2003) cites data showing that in 2000, approximately 13% of 779 non-financial firms on the Tokyo Stock Exchange were trading below their “bust up” values (measured as cash and cash equivalents plus investment securities minus debt).

2
governance, this evidence is consistent with the more general view that Japanese companies tend
to be poorly governed.
We examine whether recent corporate governance reforms in Japan have resulted in
improved firm performance. The Japanese economy has performed persistently poorly over the
last two decades. One of the alleged culprits has been Japan’s unusual and (some argue)
ineffective corporate governance.3 Our goal is to assess whether there has been any progress in
reforming the governance of Japanese companies and, if so, whether this translates into
improvements in economic performance. To do this, we examine whether the cash holdings of
Japanese companies have declined over the past two decades and whether this has resulted in
improved performance. Support for this position could legitimize the argument for “buying
Japan” because it would imply that investors could “unlock” value by improving the governance
practices of Japanese firms. Alternatively, it could be that there are legitimate and intractable
reasons that Japanese equities are persistently “cheap” using conventional metrics.
An important distinguishing factor of the Japanese financial system is the role of the
“main bank” system and the related keiretsu structure (Aoki et al., 1994; Hoshi and Kashyap,
2001). Under this system, creditors, especially banks, play an important role in governance, and
shareholders’ rights are less important. Since the late 1990s, however, when the Japanese
Government introduced an extensive set of reforms designed to remake its financial system,
corporate governance has moved towards a more shareholder-focused model with the goal of
improving economic performance (Aoki, 2007; Milhaupt, 2006; Patrick, 2004).
The jury is still out on whether these reforms have led to substantive changes in Japan’s
corporate governance practices and the performance of its corporate sector. While in some ways 3 Fukao (2003) and Hoshi and Kashyap (2001) discuss the Japanese financial system and its link to economic performance, especially during the 1990s. Morck and Nakamura (1999) argue that Japanese corporate governance helps explain the poor economic performance of the Japanese corporate sector.

3
things have improved—the importance of the banks and the keiretsu system generally have
declined—in other ways it seems that the old ways of doing business in Japan remain firmly in
place.4 Some changes that were touted earlier in the 2000s (such as the decline of the keiretsu
system and corporate cross-holdings of shares) have partially reversed as incumbent managers
seek to protect themselves from an increasingly active market for corporate control, especially
from foreign investors (e.g., the rise of defensive mechanisms such as poison pills, a rebound in
cross-holdings for defensive purposes).5
We examine the cash holdings of Japanese firms, along with their cash payouts to
stockholders, as a concrete way of assessing whether corporate governance has improved. This
approach has a number of advantages in assessing the effectiveness of corporate governance
reforms in Japan. First, this provides a relatively clean way of assessing corporate governance
reform in Japan. Although one can measure corporate governance using various metrics and
indices, these measures generally have limitations because, first, corporate governance is multi-
dimensional and so not subject to direct measurement and, second, because different corporate
governance structures are likely to be optimal for different firms (e.g., Larcker et al., 2007). This
is especially true in Japan, which allows firms to adopt either a western-style model or a more
traditional Japanese model (Milhaupt, 2003).
Second, and perhaps more important, the management of cash has become a flashpoint
for disagreements between corporate managers and investors. Jensen (1986) discusses the
4 Milhaupt (2003, p. 3) writes that “Over the past decade, the formal institutional environment for Japanese corporate governance has been reformed significantly and at an accelerated pace…Yet, despite substantial legal reform and decade after Japan’s economic problems emerged, there has been no sea change in Japanese corporate governance practices.” 5 Hamao et al. (2010) provide evidence on the returns to foreign investor activism in Japan between 1998 and 2009. They report largely mixed evidence on the ability of activist investors to reform Japanese companies, and widespread adoption of poison pills since 2006. The recent debacle at Olympus has again focused international attention on the governance practices of Japanese companies (for example, see “Pressure on Japan to probe Olympus,” Financial Times, October 25, 2011).

4
agency costs of free cash flow, under which managers of firms that generate strong free cash
flows have a tendency to over-retain cash that is then expropriated or simply wasted on bad
projects. LaPorta et al. (2000) find support for this idea using data drawn from a large cross-
section of firms from different countries, showing that dividend payouts decline more strongly in
growth opportunities for firms in countries with stronger investor protection. Dittmar et al.
(2003), Pinkowitz et al. (2006), Dittmar and Mahrt-Smith (2007), Harford et al. (2008), Price et
al. (2011), among others, also focus on cash holdings and dividend policy as a way of assessing
the quality of governance practices across firms and countries. Consistent with this view, activist
investors frequently cite firms’ cash balances as an example of poor governance, and lobby firms
to increase cash payouts to shareholders (e.g., Klein and Zur, 2009). The management of cash
has become a common focus of battles between external, activist investors and management over
the last decade in Japan.6
Our results show that Japanese firms still retain a lot of cash. The median Japanese non-
financial firm held about 11% of assets in cash in the last three years of our sample period (2006-
2008), only slightly less than the 12% median for early 1990s (1990-1992). Using regressions
that control for the effect of firm characteristics on cash holdings, we find that Japanese
managers have, on average, decreased their holdings of cash over the past decade but that the
decrease is modest, on the order of 2% of assets.
To provide a benchmark for assessing the Japanese experience, we also report evidence
on the cash holdings and payout practices of U.S. firms. U.S. firms have increased their holdings
of cash substantially over the last two decades (Dittmar and Mahrt-Smith, 2007; Bates et al.,
2009). Consequently, although Japanese firms have historically held high levels of cash 6 See “A Clash over Cash,” The Economist, May 16, 2002. For a more extensive discussion of activist investing in Japan, see Hamao et al. (2010). Chen et al. (2010) examine how governance affects the cash holdings of Chinese firms.

5
compared to firms in other countries, we find that Japanese and U.S. firms now hold roughly
comparable levels of cash, with the median U.S. firm holding cash of around 10-11% of assets
over 2003 to 2008.
Consistent with the idea that Japanese managers now manage cash more like their
western counterparts, empirical models of cash holdings that do a good job of explaining cash for
U.S. firms are increasingly useful for Japanese firms. We find adjusted R-squareds of over 30%
for U.S. firms in the 1990s and 2000s; for Japanese firms, the adjusted R-squared increases from
11% in the 1990s to around 25% in the 2000s. In addition, coefficient signs and magnitudes are
similar for U.S. and Japanese firms in the 2000s; this is not the case in the 1990s. Similar to
previous studies (Pinkowitz and Williamson, 2001), we find that Japanese firms that are part of
keiretsu groups hold less cash than other Japanese firms but more cash than U.S. firms.
When we use these regression models to control for the effect on cash holdings of firm
characteristics that vary through time and across firms, we find that Japanese firms still hold
consistently more cash than U.S. firms. A Japan dummy in the cash holdings regressions is
consistently positive and significant, and implies that, after conditioning on firm characteristics,
Japanese firms hold around 10% more cash (as a fraction of assets) than similar U.S. firms.
Japanese keiretsu firms hold 4% to 5% less cash (as a fraction of assets) than other Japanese
firms but still more than U.S. firms.
Japanese firms have very different dividend policies from those of firms in most other
countries. While the fraction of dividend payers in major western economies declines over the
last 25 years (Fama and French, 2001, Denis and Osobov, 2008), over 80% of Japanese
industrials continue to pay dividends. However, these dividends are small compared to those of
U.S. dividend payers. In the early 1990s, the median Japanese dividend-payer paid annual

6
dividends of just over 0.5% of total assets, compared to a median of over 2.0% for U.S. firms.
During the 2000s, Japanese dividend-payers increased the magnitude of their payouts to close to
1% of total assets, which is still around half of the level for U.S. companies.
Similar to what has occurred in the U.S. and other countries, stock repurchases have
become an important way for Japanese firms to return cash to stockholders. Japanese firms have
been able to make stock repurchases since the mid-1990s, a practice that was effectively
prohibited under the Commercial Code and securities exchange laws prior to this time. We
report evidence that beginning around 1997, a substantial minority of Japanese firms (in the 10%
to 30% range over 1999 to 2008) makes repurchases, and that the very large majority of these
firms also pay dividends (very few firms only make repurchases). Repurchases contribute to
strong growth in aggregate real payouts for Japanese firms, from around ¥3 billion in 1999 to
around ¥10 billion in 2008 (2006 real yen). Of these totals, aggregate dividends grow from ¥2.4
billion to ¥6.5 billion, or at a compound annual real rate of 11.7%. Firms that make repurchases
as well as paying dividends account for the bulk of this growth, and tend to be the largest firms.
As a fraction of assets or earnings, these firms pay out roughly three times as much cash as firms
that only pay dividends.
We use regression models that explain cash holdings to measure firms’ excess cash and
assess the persistence of firms’ excess cash levels over time. For three non-overlapping periods
(1994-1999, 1999-2004, and 2004-2008), we sort firms into deciles based on the excess cash
measure. We then report transition matrices which show how firms’ excess cash changes over
these periods. This analysis shows that firms’ excess cash levels tend to be persistent, that the
persistence is larger for Japanese firms than U.S. firms, and that the persistence is more

7
pronounced for Japanese firms with high levels of excess cash. These are the firms that we posit
have the most serious governance problems.
We then analyze whether changes in excess cash during these periods are associated with
changes in performance. For Japanese but not U.S. firms we find an inverse relation between
changes in holdings of (excess) cash and changes in firm performance (ROE, ROA). This is
consistent with our argument that firms that lower cash holdings do so because of improved
governance, and that this is associated with improved performance. We also find that
performance generally improves for keiretsu firms over these periods, although there is no
evidence of any interaction between this effect and changes in these firms’ excess cash holdings.
We also investigate whether there has been a change in investors’ valuation of the cash
holdings of Japanese firms. Following the idea that cash holdings are more vulnerable to
expropriation or waste by managers (Myers and Rajan, 1998), Pinkowitz et al. (2006) and
Dittmar and Mahrt-Smith (2007) use country-level governance data and provide evidence that
investors systematically discount the cash holdings of poorly governed firms. We adapt this
approach to our setting and find that: (i) investors’ valuations of Japanese firms’ cash holdings
were systematically lower than those of U.S. firms in the 1990s, consistent with Japanese firms
being poorly governed during that period, and (ii) the valuation of cash for Japanese firms, on
average, improves in the 2000s in that differences relative to U.S. firms largely disappear. This
is consistent with the idea that, on average, the governance practices of Japanese firms improve
over time, resulting in better management of cash and so higher cash valuations, consistent with
our evidence on cash holdings and firm performance.

8
The next section provides details of sample selection and data. Section 3 provides the
empirical analysis on cash holdings while Section 4 provides evidence on the valuation of cash
holdings. Section 5 concludes.
2. Sample and data
Our sample and data are from WorldScope, collected via Thomson Reuters DataStream.
The initial sample includes all Japanese firms listed on the Tokyo Stock Exchange and JASDAQ
(Japanese OTC market), and all U.S. firms listed on the NYSE, AMEX, and NASDAQ. The
sample period is from 1980 to 2008 although certain data requirements described below
effectively limit our sample to 1990 to 2008. Because our sample period begins in 1990, it
encompasses the early 1990s bursting of the bubble in Japan, which began the economic malaise,
and so is a suitable starting point for our study (see Figure 1).7 We delete observations with
missing total assets. We exclude firms from the utilities, transportation, and financial industries
because their cash holdings and payout policies are likely to differ from those of industrials.
Bates et al. (2009) define cash as the sum of cash and marketable securities in their study
of U.S. firms. Because of possible differences in Japanese firms’ use of marketable securities,
we exclude marketable securities and measure cash holdings as cash divided by total assets.8 To
be consistent, we do the same for U.S. firms.
Our data on Japanese firms’ stock repurchases comes from Nikkei Quest, supplemented
by data drawn directly from the financial statements of Japanese firms. Measuring share
7 “Traditional” governance practices were still in place in the early 1990s, including almost exclusive reliance by firms on bank financing, the importance of the main bank/keiretsu system, substantial corporate cross-holdings, etc. Reforms began in the mid to late 1990s as the economic problems deepened and there was universal recognition of the need for reform (e.g., Hoshi and Kashyap, 2001). 8 Pinkowitz and Wiliamson (2001) also exclude holdings of marketable securities in measuring cash for Japanese firms. There is an upward trend in U.S. firms’ holdings of marketable securities, from less than 5% of assets in the early 1990s to 8-10% of assets in the mid 2000s. Japanese firms tend to hold a lower fraction of marketable securities than U.S. firms, especially after 2000 when the median Japanese firm held less than 1% of assets as marketable securities. Mark-to-market accounting for marketable securities was introduced in Japan in 2001, which likely affected Japanese firms’ holdings of these securities (a similar rule was introduced in the U.S. in 1994).

9
repurchases is not straightforward using U.S. data, and is even less so using Japanese data. The
measurement of repurchases in Japanese firms is described further below.
3. Evidence on cash holdings and corporate performance
3.1 Comparison of cash holdings, valuation, and profitability of Japanese and U.S. firms
In this section we report evidence on the comparative cash holdings, valuation,
performance, and payout policy of Japanese and U.S. companies since 1990. Table 1 presents
means and medians for four variables—cash deflated by total assets, market-to-book ratio, price-
earning ratio, and profitability (EBIT/TA)—by country and year. We then report certain payout
policy comparisons in Figures 2 and 3, as well as more detailed data on how Japanese firms’
payouts to shareholders, including repurchases, changes over time.9
We first report on cash holdings. Bates et al. (2009) report a large increase in the cash
holdings of U.S. industrial firms from 1980 to 2006 (see also Dittmar and Mahrt-Smith, 2007).
This same trend is evident in our data. In 1990, the mean (median) cash holdings of U.S. firms
represented 6.9% (2.8%) of assets. This number increases steadily over the sample period,
reaching 17.4% (10.9%) in 2008.
For Japanese firms, mean (median) cash holdings were 16.0% (13.8%) in 1990,
substantially higher than those of U.S. firms, consistent with the evidence in Rajan and Zingales
(1995).10 After 1990 there is a decline in the cash holdings of Japanese companies through 1997
and 1998, when the average reaches around 11% (median 9%). After this, there is a modest
increase to a mean (median) of 13.9% (10.8%) in 2008, numbers similar to those of U.S.
companies. For 2007 and 2008 we cannot reject the null that the median cash holdings of U.S.
9 To control for outliers that may impact our results, return-on-asset (EBIT/lagged TA) ratios that are greater than 1 (less than -1) are set to 1 (-1). Cash-to-total assets ratios that are greater than 1 (less than 0) are set to 1 (0). Market-to-book ratios that are greater than 30 (less than 1) are set to 30 (1). 10 In Table 1, italicized numbers for Japanese firms indicate that the number is significantly different from the corresponding number for U.S. firms at the 5% level or better under two-‐tailed tests.
10
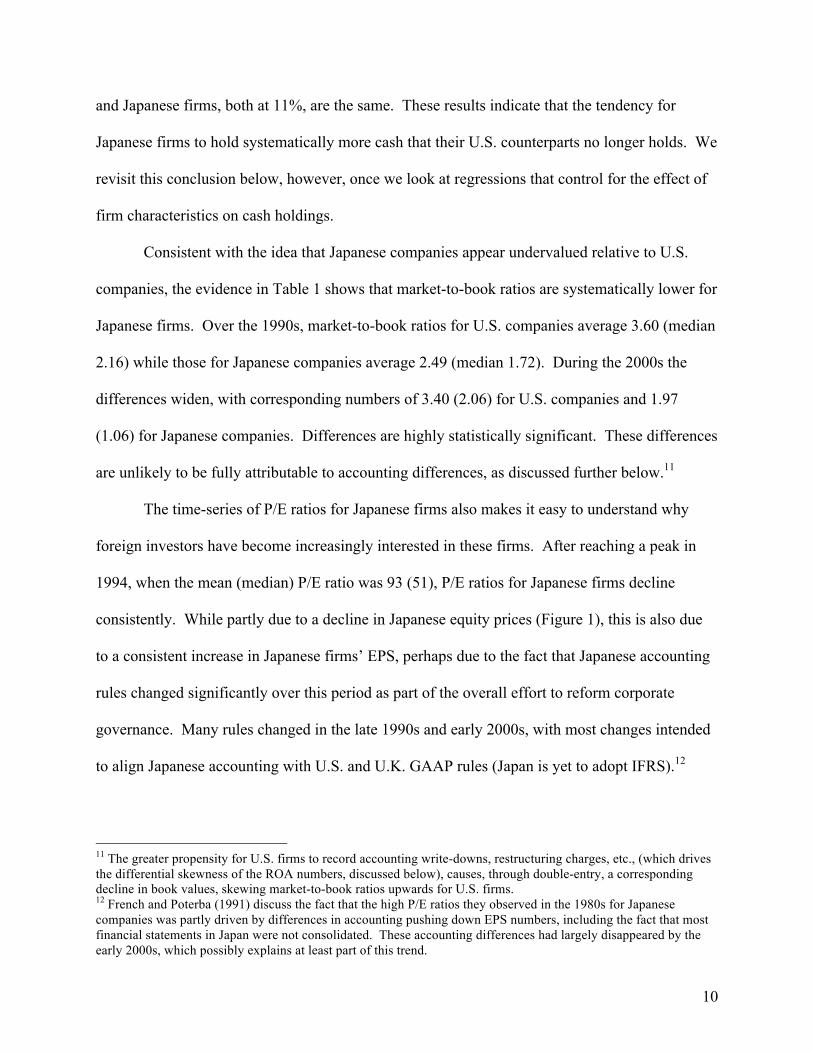
and Japanese firms, both at 11%, are the same. These results indicate that the tendency for
Japanese firms to hold systematically more cash that their U.S. counterparts no longer holds. We
revisit this conclusion below, however, once we look at regressions that control for the effect of
firm characteristics on cash holdings.
Consistent with the idea that Japanese companies appear undervalued relative to U.S.
companies, the evidence in Table 1 shows that market-to-book ratios are systematically lower for
Japanese firms. Over the 1990s, market-to-book ratios for U.S. companies average 3.60 (median
2.16) while those for Japanese companies average 2.49 (median 1.72). During the 2000s the
differences widen, with corresponding numbers of 3.40 (2.06) for U.S. companies and 1.97
(1.06) for Japanese companies. Differences are highly statistically significant. These differences
are unlikely to be fully attributable to accounting differences, as discussed further below.11
The time-series of P/E ratios for Japanese firms also makes it easy to understand why
foreign investors have become increasingly interested in these firms. After reaching a peak in
1994, when the mean (median) P/E ratio was 93 (51), P/E ratios for Japanese firms decline
consistently. While partly due to a decline in Japanese equity prices (Figure 1), this is also due
to a consistent increase in Japanese firms’ EPS, perhaps due to the fact that Japanese accounting
rules changed significantly over this period as part of the overall effort to reform corporate
governance. Many rules changed in the late 1990s and early 2000s, with most changes intended
to align Japanese accounting with U.S. and U.K. GAAP rules (Japan is yet to adopt IFRS).12
11 The greater propensity for U.S. firms to record accounting write-downs, restructuring charges, etc., (which drives the differential skewness of the ROA numbers, discussed below), causes, through double-entry, a corresponding decline in book values, skewing market-to-book ratios upwards for U.S. firms. 12 French and Poterba (1991) discuss the fact that the high P/E ratios they observed in the 1980s for Japanese companies was partly driven by differences in accounting pushing down EPS numbers, including the fact that most financial statements in Japan were not consolidated. These accounting differences had largely disappeared by the early 2000s, which possibly explains at least part of this trend.
11
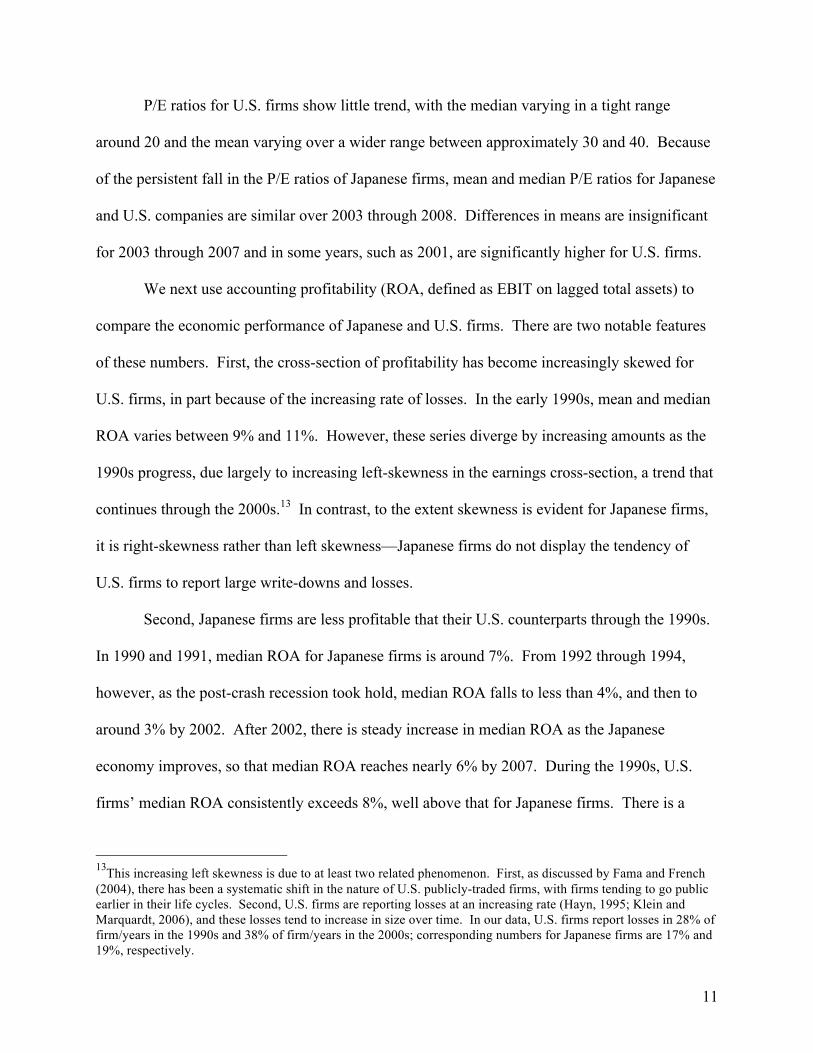
P/E ratios for U.S. firms show little trend, with the median varying in a tight range
around 20 and the mean varying over a wider range between approximately 30 and 40. Because
of the persistent fall in the P/E ratios of Japanese firms, mean and median P/E ratios for Japanese
and U.S. companies are similar over 2003 through 2008. Differences in means are insignificant
for 2003 through 2007 and in some years, such as 2001, are significantly higher for U.S. firms.
We next use accounting profitability (ROA, defined as EBIT on lagged total assets) to
compare the economic performance of Japanese and U.S. firms. There are two notable features
of these numbers. First, the cross-section of profitability has become increasingly skewed for
U.S. firms, in part because of the increasing rate of losses. In the early 1990s, mean and median
ROA varies between 9% and 11%. However, these series diverge by increasing amounts as the
1990s progress, due largely to increasing left-skewness in the earnings cross-section, a trend that
continues through the 2000s.13 In contrast, to the extent skewness is evident for Japanese firms,
it is right-skewness rather than left skewness—Japanese firms do not display the tendency of
U.S. firms to report large write-downs and losses.
Second, Japanese firms are less profitable that their U.S. counterparts through the 1990s.
In 1990 and 1991, median ROA for Japanese firms is around 7%. From 1992 through 1994,
however, as the post-crash recession took hold, median ROA falls to less than 4%, and then to
around 3% by 2002. After 2002, there is steady increase in median ROA as the Japanese
economy improves, so that median ROA reaches nearly 6% by 2007. During the 1990s, U.S.
firms’ median ROA consistently exceeds 8%, well above that for Japanese firms. There is a
13This increasing left skewness is due to at least two related phenomenon. First, as discussed by Fama and French (2004), there has been a systematic shift in the nature of U.S. publicly-traded firms, with firms tending to go public earlier in their life cycles. Second, U.S. firms are reporting losses at an increasing rate (Hayn, 1995; Klein and Marquardt, 2006), and these losses tend to increase in size over time. In our data, U.S. firms report losses in 28% of firm/years in the 1990s and 38% of firm/years in the 2000s; corresponding numbers for Japanese firms are 17% and 19%, respectively.

12
decline in 2001 due to the U.S. recession, followed by a rebound to around 8% over 2004
through 2007. So U.S. firms continue to outperform Japanese firms, but the gap is not as wide as
was the case in the 1990s. Further, the profitability of Japanese firms displays much less cross-
sectional variability than for U.S. firms.
To summarize, in the early 1990s, Japanese industrials looked very different to their U.S.
counterparts, with higher holdings of cash, higher P/E ratios but lower market-to-book ratios, and
substantially lower profitability. However, by the mid to late 2000s Japanese and U.S.
companies looked more similar: U.S. firms had increased their holdings of cash while Japanese
companies had improved their profitability. P/E ratios for Japanese companies are now largely
in-line with those of U.S. firms. However, market-to-book ratios of Japanese companies are still
lower than those of U.S. firms, and profitability is still 200 to 300 basis points lower than that of
U.S. firms.
3.2 Payout policy for Japanese firms
We next compare the dividend policies of U.S. and Japanese firms. Figure 2 reports the
fraction of dividend-payers in each country. As expected based on Fama and French (2001),
there is a consistent decline in the fraction of U.S. dividend-payers over most of this period, from
55% in 1990 to around 20% in 2002. However, after 2002 the fraction of dividend-payers
increases steadily, to around 30% in 2007 and 2008.14 The fraction of dividend-payers in Japan
is much higher than that in the U.S. throughout this period. This fraction is over 90% in the early
1990s, falls slowly to around 80% in the late 1990s and to 78% by 2002, before increasing to
87% in 2008. These trends (through the early 2000s) are similar to those reported by Denis and
Osobov (2008) in their comparison of payout policy across the G7.
14See Floyd et al. (2011) for more discussion of recent trends in the payout policy of U.S. firms.

13
Although a much higher fraction of Japanese firms pay dividends, those dividends are
substantially smaller than those paid by U.S. firms. Figure 3 plots the median size of dividends,
computed as (annual) common cash dividends deflated by total assets (these numbers are
computed across the set of dividend payers only). In 1990 the median annual dividend paid by
U.S. firms was around 2% of total assets compared to 0.6% for Japanese firms. The size of the
dividend paid by the median U.S. dividend-payer falls steadily during the 1990s and early 2000s,
reaching a low of 1.4% in 2003. After that there is a rebound, with the median returning to 2%
in 2008. The dividends of Japanese firms are largely flat through the 1990s but increase over the
2000s, with the median reaching around 0.9% by 2008. Nevertheless, it is clear that the
dividends paid by Japanese firms remain smaller than those of their U.S. counterparts, with U.S.
firms’ dividends consistently at least twice the size of those for Japanese firms.
Dividends, however, paint an incomplete picture of payout policy given the emergence of
stock repurchases. Stock repurchases emerge in significant quantities for U.S. firms in the early
1980s (e.g., Bagwell and Shoven, 1989; Grullon and Michaely, 2002; Skinner, 2008). There is
little evidence on stock repurchases for Japanese companies. As we discuss in more detail in the
appendix, restrictions on stock repurchases by Japanese companies were gradually lifted
beginning in the mid 1990s. Following previous research using U.S. data, we measure Japanese
repurchases as changes in treasury stock (if the company uses treasury stock) or as net stock
purchases from the cash flow statement; see appendix for more detail. Figure 4 reports the
fraction of Japanese firms in four non-mutually exclusive groups: firms that pay dividends, firms
that pay repurchases, firms that pay both dividends and repurchases, and firms that pay neither
dividends nor repurchases (non-payers). Figure 5 reports aggregate dividends and repurchases

14
paid by Japanese firms, measured in 2006 yen. In both cases repurchases are reported over 1994
to 2010, which covers the emergence of repurchases in Japan.
Figure 4 shows that the fraction of Japanese firms making repurchases increases from
close to 0 in 1997 to around 10% from 1999 to 2001 and then fluctuates from in the 12% to 30%
range from 2002 to 2010. The increase over 1997 to the early 2000s is likely explained by the
gradual liberalization of legal restrictions on repurchases that occurs from 1994 to 2001 (see
appendix for more detail). The variation in the fraction of repurchases since 2001 likely reflects
variation in payouts; the principal advantage of repurchases is that they do not commit managers
to an ongoing payout. Figure 4 also shows that very few firms make repurchases without also
paying dividends (the fraction of firms that pay both closely tracks the fraction that make
repurchases). This is also similar to the evidence for U.S. firms
Figure 5 shows the aggregate amount of payouts by Japanese firms divided into
dividends and repurchases (in billions of 2006 yen). The growth of repurchases that begins
around 1997 is also clear in this figure. The use of repurchases by Japanese firms leads to a
strong increase in aggregate payouts from 2000 through 2008, with dividends also increasing
strongly over this period. Total payouts increase from ¥3 billion in 1999 to ¥10 billion in 2008.
Of these amounts, repurchases increase from approximately ¥0.6 billion to ¥3.5 billion while
dividends increase from ¥2.4 billion to ¥6.5 billion. While the overall growth in total payouts is
similar to that for US firms over the same period (Floyd et al., 2011), in Japan payouts and the
growth therein is more heavily tilted towards dividends than repurchases. The fact that these
Japanese firms increase payouts so strongly offers evidence of an improvement in governance.
This increased payout by Japanese firms is not shared equally among all types of payers.
For those firms that only pay dividends, total real payout increases by 59% over the 1999 to 2008

15
period, and contributes to around 16% of the overall increase in aggregate real payout (these
results not reported in tables). For those firms that both pay dividends and make repurchases, the
increase in total real payout is 636% over this period, and accounts for 84% of the overall
increase. Put differently, the annual compound real growth rate for firms that only pay dividends
is 5.3% compared to 24.8% for firms that pay both dividends and repurchases.15 So the strong
growth in real payouts, while clearly respectable for the dividend-only firms, is driven largely by
firms that now pay both dividends and repurchases, which is similar to what we see for U.S.
firms (Skinner, 2008; Floyd et al., 2011).
Tables 2 and 3 provide further evidence on the characteristics and payouts of three groups
of Japanese firms: non-payers, firms that only pay dividends, and firms that pay both dividends
and repurchases. Table 2 shows that the largest firms tend to pay both dividends and
repurchases, and that the firms that pay dividends tend to be larger than non-payers (these
differences are typically significant for medians and are less often significant for means). In
addition, and perhaps not surprisingly, dividend payers in general are much more profitable than
non-payers, which report relatively poor performance. Further, while dividend payers tended to
be slightly more profitable than firms that pay both dividends and repurchases from 1999
through 2004, these differences disappear in more recent years.
Table 3 compares the magnitude of payouts for firms that only pay dividends to the
magnitude of payouts for firms that pay both dividends and repurchases. While it may not be
surprising that firms that make repurchases in addition to paying dividends pay out more, the
magnitude of the difference is substantial, which complements the evidence above on aggregate
15 These results are based on a comparison of payouts for the set of firms that pay only dividends in each year to firms that pay both dividends and repurchases in each year. Membership in each group changes from one year to the next (that is, a firm would move from the dividend-only group to the “both” group in those years it pays repurchases).

16
payouts. While the median dividend-only firm pays dividends that vary from 0.6% of assets in
1998 to 0.8% of assets in 2008, the median firm that pays both dividends and repurchases pays
out two to three times this amount, from 1.4% to 2.2% of assets, depending on year. If we
instead deflate payouts by earnings (net income) to compute payout ratios, the median dividend-
only firm pays out around 20% of earnings fairly consistently (the ratio is higher at the beginning
and end of the sample period, when earnings were low), while the median firm that pays both
pays out considerably more, from 49% to 85% of earnings, with a median of 60%. Overall, the
evidence shows that those Japanese firms that make repurchases as well as paying dividends pay
out substantially more than Japanese firms that only pay dividends. In future drafts we will
investigate how these measures of payout policy are related to changes in corporate performance
and valuation.
3.3 Cash Regressions
Our primary interest is in whether there have been systematic changes in Japanese firms’
payout policies and cash balances (our proxy for corporate governance improvements) that are
related to changes in these firms’ economic performance. To model cash balances, we follow
Opler et al. (1999) and Bates et al. (2009). Based on the transactions costs and precautionary
demands for cash,16 these papers model cash holdings as a function of firm size, a dividend-
payer dummy, leverage, profitability, a loss dummy, market-to-book, the fraction of closely-held
shares, industry sigma, net working capitals, R&D intensity, capital expenditures, and cash
flow.17
16 The idea behind the transactions costs argument is that raising funds or liquidating assets involves transactions costs that can be avoided by holding cash. The precautionary demand argument says that cash is valuable because it can be used to finance investments if alternative sources of funding become unavailable or too costly. 17 We measure size as the natural log of total assets, leverage as the ratio of long-term debt to total assets, ROE as net income deflated by lagged total assets, net working capital as current assets minus current liabilities minus cash, R&D as research and development expenditures deflated by sales, capital expenditures as capital expenditures deflated by lagged total assets, and cash flow as funds from operations deflated by lagged total assets.

17
Following Bates et al. (2009), we construct industry sigma as the mean of the standard
deviations of cash flow/assets over the past 10 years for firms in a given industry. We define
industry using the industry group variable (WC06011) from WorldScope. We use a three-digit
code for miscellaneous industry and two-digit codes for all other industries. Because this
computation requires ten years of past cash flow data, industry sigma could not be calculated for
observations before 1990. As a result, most of our analyses include a sample period from 1990
to 2008.
We use two types of estimation. First, we estimate regressions separately for each
country, both for the overall period (1990-2008) and by decade (1990-1999 and 2000-2008);
these results are reported in Table 4. This allows us to assess whether the economic
determinants of cash holdings differ significantly across Japanese and U.S. firms, as well as to
gauge how these determinants change over time in each country. When we estimate the
regressions for the full time period, we include dummies for 2000-2003 and 2004-2008 to see
how cash balances change in each country after 1999 after conditioning on firm characteristics.
Second, we estimate annual pooled cross-sectional regressions for all U.S. and Japanese
companies with data available in a given year (Table 5). These regressions include Japan and
Japan/keiretsu intercept dummies to assess whether the cash holdings of Japanese companies are
systematically different from those of U.S. companies conditional on the other variables.
For the Japanese firms, the Table 4 regressions also include a measure of keiretsu
inclination. As discussed in Section 1, the extent to which Japanese firms are affiliated with
corporate groups is likely to systematically affect corporate policies such as cash holdings and
payouts. The direction of this effect is not clear, however. Some authors argue that firms in
these groups have less severe information and agency problems, which implies they are likely to
18
hold less cash and distribute more cash to shareholders (e.g., Hoshi and Kashyap, 2001;
Dewenter and Warther, 1998). Other authors argue that the banks that sit at the heart of these
groups use their influence to cause keiretsu firms to hold excessive cash balances as part of a
systematic expropriation of external holders (e.g., Pinkowitz and Williamson, 2001; Weinstein
and Yafeh, 1998).
Following Dewenter and Warther (1998), we define keiretsu firms as those that belong to
one of the largest six large horizontal keiretsu, also known as enterprise groups.18 We obtain
these data from Industrial Groupings in Japan (IGJ, 2001), a standard source of these data, and
classify firms as either keiretsu firms (if they are classified in IGJ as horizontal keiretsu firms
with inclination scores of 2-4) or not (otherwise).19 We assume that keiretsu affiliation does not
change over the sample period.
Table 4 reports the first set of regression estimates. As indicated above, for each country
regressions are estimated for the full period as well as for two sub-periods (with two-way
clustering of standard errors). For U.S. firms, these regressions have R-squares of 30.5% for
1990-1999, 32.0% for 2000-2008, and 33.1% for the overall period. Coefficients on key
variables are mostly in-line with those of Opler et al. (1999) and Bates et al. (2009). Cash
holdings are positively related to industry sigma, market-to-book, R&D intensity, and cash flow,
and negatively related to size, dividend payment, leverage, net working capital, and capital
expenditures. The significance and magnitude of regression coefficients are mostly consistent
across sub-periods (one notable exception is the coefficient on industry sigma, which is
18 See Hoshi and Kashyap (2001, pp. 10-12) for more discussion of the nature of these groups. 19 IGJ measures inclination based on five factors: (i) the characteristics and historical background of the groups and/or the company; (ii) sources and amount of bank loans, (iii) board of directors sent by and/or sent to nucleus and/or other group companies, (iv) the company attitude towards the group, (v) the company connections with other groups and/or non-group companies. Measured inclination ranges from 0 (none) to 5 (for “nucleus” firms that have the strongest group affiliations). IGJ has not released updated data since 2001.

19
substantially lower in the second sub-period). The period dummies (for 2000-2003 and 2004-
2008) are positive and significant, indicating that U.S. firms increased their propensity to hold
cash in the 2000s by about 1% to 2% of assets after controlling for firm characteristics.
The model does not explain cash balances as well for Japanese firms in the 1990s. For
1990-1999, the adjusted R-squared is 11.4%, about a third of that for U.S. firms. The only
variables that are significant in this regression are dividend payer (which is reliably positive,
opposite to the result for U.S. firms), ROE (reliably positive, consistent with the result for U.S.
firms), R&D intensity (reliably positive, also consistent), and capex (reliably negative, also
consistent). The keiretsu dummy is reliably negative, indicating that these firms hold about 3%
less cash than other firms.
Results are more similar to those for U.S. firms in the second sub-period. For this period
the adjusted R-squared increases to 25.4% and the coefficients on size, leverage, market-to-book,
industry sigma, net working capital, R&D, capex, and cash flow are consistent with those for
U.S. firms, in terms of sign and significance of coefficients. Once again, the dividend-payer
variable is positive rather than negative—in Japan, dividend-payers have higher, not lower, cash
balances (recall that Japanese dividends are typically much smaller than those paid in the U.S.,
and that a large majority of Japanese firms pay dividends). Thus, Japanese firms with more cash
are more likely to pay dividends, but these dividends are small enough not to affect cash
holdings materially. The coefficient on industry sigma is also much larger than it is for U.S.
firms in the 2000s, suggesting that the precautionary demand is more important for Japanese
firms. Finally, consistent with results for the 1990s, the coefficient on the keiretsu dummy is
20
negative and highly significant, indicating that keiretsu firms hold about 3% less of assets in cash
than other Japanese firms.20
Overall, this evidence indicates that the determinants of cash for Japanese firms become
more similar to those of U.S. firms in the 2000s than they were in the 1990s. One interpretation
is that Japanese managers are now more conscious of the need to manage cash effectively, so
their cash holdings are more sensitive to firm characteristics that measure the economic
determinants of cash holdings, consistent with the view that governance practices have improved
in Japan. In addition, the 2004-2008 period dummy in the full period regression is significantly
negative, indicating a modest decline (of around 2% of assets) in the average cash holdings of
Japanese firms once we condition on firm characteristics.
Table 5 reports on the second set of cash regressions. Here, we estimate a single
regression in each annual cross-section with all available U.S. and Japanese firms, with dummies
for Japanese firms and keiretsu firms (the keiretsu variable is set to zero for U.S. firms). The
idea is to compare the cash holdings of Japanese firms in general, as well as keiretsu firms in
particular, to those of U.S. firms after conditioning on other firm characteristics that affect cash
holdings. To economize on the numbers we report, Table 5 only reports the coefficients on these
two intercept dummy variables.21 For ease of comparison, Figure 6 plots the coefficients on the
Japan intercept dummies as well as the sum of these coefficients and the keiretsu dummies, to
show how the cash holdings of Japanese firms and Japanese keiretsu firms, respectively,
compare to U.S. firms (i.e., the figure plots the differences versus U.S. firms).
20 Pinkowitz and Williamson (2001) also find a significantly negative coefficient on a keiretsu dummy variable in cross-sectional cash regressions. 21 In most cases, the sign and significance of the coefficients is roughly consistent with that for the regressions reported in Table 4, although for those variables where there was some inconsistency between the results for the U.S. and Japanese firms, the coefficients are less significant. For example, in Table 4 the coefficient on the dividend-payer dummy is negative for U.S. firms and positive for Japanese firms, so it is not surprising that the results on this variable are less significant in the pooled cross-sectional regressions.

21
The coefficient on the Japan intercept dummy is reliably positive in all years, indicating
that Japanese firms hold more cash than U.S. firms. The differences are largest in the early
1990s, when the coefficients indicate that Japanese firms held substantially more cash than U.S.
firms, with differences ranging from 15% to 19% of total assets. These differences decline from
1996 through 2001, reaching a low of 3.5% in 2001, but then rebound to 11%-12% over 2003 to
2007. There is no obvious evidence here in favor of the hypothesis that Japanese firms reduce
their holdings of cash as corporate governance improves over the past decade: while there was a
steady decline in cash holdings over 1994 to 2001, a good part of this reverses over 2003-2007
although cash holdings over the period are still substantially lower than during the early 1990s.
Consistent with the previous results, the coefficient on the keiretsu dummy is reliably negative in
all years with some time variation: keiretsu firms hold 3% to 5% less cash than other Japanese
firms over most of the time period (with smaller differences in the later 1990s and early 2000s)
but still hold more cash than U.S. firms.
The differences in the cash holdings of the U.S. and Japanese firms implied by these
regressions are larger than the univariate differences reported in Table 1, suggesting that changes
in firm characteristics across the two countries help explain the smaller differences evident there.
These results indicate that Japanese firms, on average, still hold substantially more cash than
U.S. firms, even given the fact that U.S. firms have increased their cash holdings significantly
since 1990.
3.4 Excess cash and the relation to firm performance
Based on our working assumption that Japanese firms’ management of cash is a proxy for
the quality of their corporate governance, we next report on two aspects of changes in firms’
management of cash. First, we use the regression models discussed above to sort sample firms

22
into deciles based on their holdings of excess cash in each year. To do this, we use the residuals
from the regressions reported in Table 4 (estimated for U.S. and Japanese firms separately for the
full time period, without the time dummies) to proxy for excess cash. We then look to see how
stable this characteristic is—do firms consistently, over a period of years, hold high or low levels
of excess cash? If they persistently hold high levels of excess cash, that would indicate relatively
poor governance. Conversely, firms that improve their management of cash (excess cash
declines over time) likely do so because of improved governance.
Second, we look to see whether changes in excess cash (measured as movements across
excess cash deciles over time) are associated with changes in firm performance (measured as
changes in ROA and ROE). We expect to see that declines in excess cash holdings are related to
improvements in performance for Japanese firms. We also condition these results on whether
the Japanese firms are part of keiretsu, as defined above.
We report the results of these analyses in Tables 6. Panel A of Table 6 presents excess
cash transition matrices for U.S. firms while Panel B reports the same matrices for Japanese
firms. To perform this analysis, we sort firms into excess cash deciles in an initial year and then
re-sort in the final year of each period. We report transitions for three periods, 1994-1999, 1999-
2004, and 2004-2008. Although these time periods are arbitrary, we think they make sense as a
way of assessing the “stickiness” of firms’ cash policies over the sample period while
economizing on the number of analyses. The transition matrices report percentages based on the
rows, and so add to 100 across rows. Each row comprises observations in a given excess cash
decile for the initial year, from 1 to 10, where 1 denotes the lowest excess cash and 10 the
highest excess cash. The columns comprise deciles defined in the same way in the last year.
Thus, observations on the diagonal are those that are in the same decile in the first and last years.

23
Observations above the diagonal are those for which excess cash increases so that firms move up
the deciles. For example, observations in row 2, column 3 move from decile 2 in the first year to
decile 3 in the last year. This analysis requires that firms have available data in the first and last
years of each period; for this reason, especially in the earlier period, we have relatively few
observations.
If membership in excess cash deciles is independent over time, we would see percentages
of 10 in all cells. However, looking at the numbers in Table 6, we in fact see clustering, most
notably in cells on the diagonal and just off the diagonal, indicating that firms’ relative levels of
excess cash tend to persist over time. To get a more parsimonious way of comparing the
matrices, we focus on the extremes of high and low excess cash, and sum the percentages in the
nine extreme north-west (low excess cash) and south-east (high excess cash) cells. For example,
for U.S. firms over 1994-1999, this number is 117 for the nine low excess cash cells (firms in
deciles 1, 2, or 3 in both years) and 124 in the nine high excess cash cells (firms in deciles 8, 9,
or 10 in both years). This is more than expected by chance (90 = 9 x 10) and so indicates
“stickiness” at both extremes. Numbers are similar at the high end of excess cash for U.S. firms
for 1999-2004 and 2004-2008 (totals are 131 and 129, respectively) and get somewhat higher
than this at the low end (totals are 168 and 145), which indicates increased persistence at low
levels of excess cash.
Consistent with the view of Japanese firms’ cash management practices discussed in
Section 1, the persistence of excess cash tends to be more pronounced for Japanese firms,
especially at high levels of excess cash. For these firms, at the low (high) end of excess cash the
percentages are 156 (217), 151 (169), and 202 (191) for the three periods, respectively. These
numbers are noticeably higher than those for U.S. firms in 5 of 6 cases. Moreover, this is always

24
true for the high excess cash deciles, indicating that Japanese firms with high levels of excess
cash tend to continue that practice over time, more so than U.S. firms in the same situation, and
(usually) more so than Japanese firms with low excess cash levels. These firms (Japanese firms
with high excess cash) are the ones that we posit as having poor governance practices.
We next link changes in excess cash to firm performance. For each country and each
transition period, we divide observations into those for which excess cash increases or decreases,
measured based on whether firms move up or down the deciles from the first year to the last
year. If improvements in cash management practices (lower excess cash) result from
improvements in governance, we expect this to translate into improved performance, and vice
versa. We expect any such effect to be more pronounced for Japanese firms, for which we argue
that cash management practices and corporate performance have both been relatively poor due to
poor governance. Table 6 also reports the results of this analysis—in particular, we report the
change in profitability (measured as ROA and ROE) over the transition period for the two groups
(higher and lower excess cash).
There is little evidence of any relation between excess cash transitions and changes in
performance for U.S. firms. For two of the three transition periods (1999-2004 and 2004-2008),
the changes are similar across the two groups (increases and decreases in deciles) and differences
are not statistically significant. For the first period (1994-1999) the differences are significant
and show, contrary to expectations, that firms that moved down the deciles (lower excess cash)
performed worse than firms that moved up the deciles.
The results for Japanese firms suggest that firms that improve their cash management
practices enjoy better performance than firms for which cash management gets worse. In all
three periods, firms that move down the deciles (that lower excess cash) display changes in

25
performance that exceed those for firms that move up the deciles. In the most recent period
(2004 through 2008), firms that move up the deciles report a mean change in ROA (ROE) of -
1.4% (-2.8%) versus 0.4% (-0.2%) for firms that move down the deciles, a difference significant
at the 5% (10%) level (two tailed). Results are stronger in the second period (1999 through
2004), with differences in ROA (ROE) significant at 5% (1%). In the earliest period, these
differences are not significant for ROA but are significant at 1% for ROE (although there are
relatively few observations in the first transition period).22
The Table 6 results show that, consistent with our predictions, there is an inverse relation
between changes in excess cash and changes in performance for Japanese firms. Table 7
examines how this result varies across keiretsu and non-keiretsu firms in Japan by regressing the
change in performance for a given period on the change in excess cash decile, the keiretsu
dummy, and an interaction between these variables. Based on the evidence above, we expect a
negative coefficient on the change in excess cash decile. The interaction term tests whether this
effect is systematically different for keiretsu firms, a possibility given their different governance
characteristics. We estimate these regressions for the two performance measures (ROA and
ROE), for the three time periods, and for the full period pooled. We multiply coefficients by 100
so they can be interpreted as percentages.
The Table 7 results for ROA confirm the findings from Table 6: there is an inverse
relation between changes in excess cash and changes in performance for Japanese firms. The
coefficient on the change in excess cash decile is negative and statistically significant for the
second and third sub-periods (1999-2004 and 2004-2008) as well as overall, with t-statistics of -
2.27, -2.36, and -3.27, respectively. The coefficients seem reasonable in economic terms. The
22Differences in medians tests (two-sample Wilcoxon rank sums) are also statistically significant at the 5 level or better for 1999-2004 and 2004-2008 and at the 10 level or better for 1994-1999.

26
overall coefficient is -0.33, implying that moving down five excess cash deciles (holding less
excess cash) improves performance by 165 basis points. These regressions also indicate that
keiretsu firms generally improve their performance relative to non-keiretsu firms over the second
and third sub-periods, by 131 basis points (t = 1.65) and 159 basis points (t = 2.68), respectively,
as well as overall (by 140 basis points, t = 3.16). This is evidence that keiretsu firms have
performed better than other Japanese firms since 1999.23 There is little evidence of an
interaction between the cash and keiretsu effects.
The Table 7 results for ROE are similar but not as strong as those for ROA.24 The
coefficient on the change in excess cash decile is negative and significant for the overall period
and the second sub-period (1999-2004) but not in either of the other periods. In the third sub-
period, the keiretsu variable is again reliably positive, with a coefficient of .038 (t = 2.90), as
well as being significant for the overall period. The interaction term is significantly negative
overall but only significant in the first sub-period (t = -2.13), similar to the results for ROA,
suggesting a relation between cash holdings and performance for the keiretsu firms.
Overall, these results are consistent with our view that poor cash management practices
are indicative of poor governance in Japanese firms, and that improvements in cash management
(lower excess cash) are associated with improved corporate performance. Thus, while the
evidence in Tables 4 and 5 provides somewhat mixed evidence on whether the cash management
practices of Japanese firms improve over time, the evidence in Tables 6 and 7 shows that cross-
sectional variation in Japanese firms’ holdings of cash is inversely related to changes in
23 One possible explanation for this is that foreign investors are more likely to invest in keiretsu firms and then push for improvements in governance and performance, an idea we will test in the next version of the paper. 24 We place less weight on the ROE numbers (which are based on bottom-line earnings) relative to ROA (which are based on EBIT) for two reasons. First, ROE includes the effect of taxes, which is likely to muddy the waters in terms of measuring economic performance. Second, and more important, ROE reflects the effects of extraordinary items, which in Japan includes a larger set of non-operating items than in the U.S., which also distorts the usefulness of net income and hence ROE as a measure of economic performance.

27
performance—for those Japanese firms that improve their cash management practices by holding
less excess cash there are improvements in performance.
4. Cash holdings, governance, and valuation
Our basic research question is whether the relatively high cash holdings of Japanese
companies reflect poor governance practices, whether these practices improve over the last ten
years, and, to the extent they have, whether this has translated into improved corporate
performance. The evidence in Section 3 shows that Japanese companies tend to hold relatively
large amounts of cash and that changes in cash holdings are inversely related to improvements in
corporate performance, consistent with the idea that improvements in governance, as manifested
in lower holdings of excess cash, are related to improved performance. A number of papers
investigate the relation between governance and cash holdings by examining whether the relation
between firm value and cash holdings varies as a function of governance quality (e.g., Dittmar
and Mahrt-Smith, 2007; Pinkowitz et al., 2006). More specifically, these papers examine
whether variation in the quality of governance is related to variation in the valuation of cash
holdings (and dividend policy). These papers generally find that cash holdings (dividend
payouts) are valued at lower (higher) amounts in countries/firms where governance is poor,
suggesting that cash holdings are more easily expropriated by managers when governance is
weak and that dividends help solve this problem.
We adapt this approach to our setting and investigate two predictions: (a) to the extent
that cash holdings in Japanese companies are unusually high because of poor governance, we
expect cash to be valued more highly in U.S. firms than Japanese firms, (b) to the extent that
governance in Japan improves over time, we expect any such differences to decline from the
1990s to the 2000s. We do not examine the relative valuation of dividends in these countries

28
because our earlier evidence indicates that the large majority of Japanese companies pay modest
dividends, so it is not clear that dividends in Japan are large enough to help resolve agency
problems.25
To perform this analysis we follow previous research and use two different regression
specifications, both of which are based on the approach in Fama and French (1998). In our case,
rather than estimating the regressions using panel data, we estimate the regressions by year and
country because our predictions are about differences between U.S. and Japanese companies and
how these differences evolve over time. The first specification follows the cash level
specification of Pinkowitz et al. (2006):26
Vi,t = α + β1Ei,t + β2dEi,t + β3dEi,t+1 + β4dNAi,t + β5dNAi,t+1 + β6RDi,t + β7dRDi,t + β8dRDi,t+1 +
β9Di,t + β10dDi,t + β11dDi,t+1 + β12dVi,t + β13Ci,t + εi,t … (1)
where dXt denotes changes in X from t-1 to t, V denotes firm value, measured as the market
value of equity plus the book value of debt, E denotes earnings (EBIT), NA denotes net assets
(total assets minus cash), RD is research and development expense, D is common dividends, and
C is cash holdings. Our focus in this regression is on β13, which we expect to be smaller for
Japanese firms than U.S. firms, and to increase for Japanese firms as governance improves over
the sample period. Because this specification requires one year lead values, we can only
estimate (1) through 2007.
The second specification follows Dittmar and Mahrt-Smith (2007):
25 Consistent with this, our Table 4 regressions show that while cash holdings are negatively related to dividend payment for U.S. firms, implying that dividend-payers tend to hold less cash (in part because they are better governed and pay dividends), the opposite holds for Japanese firms, implying that dividends in these firms are generally too small to help resolve agency problems. 26 This is what Pinkowitz et al. (2006) refer to as their “level of cash” specification. They also use a “change in cash” specification. We have also estimated a version of their changes specification with similar results to those of the specifications discussed in the text.

29
Vi,t = α + β1Ei,t + β2dEi,t + β3dEi,t+2 + β4RDi,t + β5dRDi,t + β6dRDi,t+2 + β7Di,t + β8dDi,t +
β9dDi,t+2 + β10dNAi,t + β11dNAi,t+2 + β12dVi,t+2 + β13Ci,t + εi,t … (2)
Here, all variables are deflated by NAt, and dXi,t denotes changes in X from t-2 to t. Thus, this
specification requires an extra lead year of data relative to (1), which means we can only
estimate (2) through 2006. Our focus is again on β13 for which we have the same expectations as
for (1). We use cash in this specification rather than excess cash because, as discussed in Section
3, the fit of our cash model varies over time and between countries, which would then affect
inferences from this model (i.e., there would be systematically more measurement error in the
excess cash variable for Japanese firms in the 1990s, clouding interpretation of trends in
coefficients on excess cash in the value regressions).
We report the results of these analyses in Table 8. To economize on the numbers in
tables, we report only the cash coefficients (with robust t-statistics) on cash for U.S. and
Japanese firms, along with tests for differences between these coefficients by year. The first two
columns report the cash coefficients from model (1) above; these numbers are also plotted in
Figure 7. For U.S. firms, the coefficients move around over time but are reliably positive at the
1% level or better in 15 of 18 years, and vary in roughly the 1 to 3 range over the sample period
without any obvious trend. In contrast, the coefficients for Japanese firms during the 1990s are
smaller than 1 and in most cases not significantly different from 0.27 Moreover, differences
between the coefficients for U.S. and Japanese firms are statistically significant (with those for
U.S. firms reliably larger) for all but two years over 1990 to 1999. Overall, these numbers
support our view that Japanese firms were less well-governed than U.S. firms in the 1990s and
27 When the coefficients are significantly different from zero, they are also reliably less than 1; for example, the coefficients for 1993, 1994, and 1995 are 0.53 (t = 4.31), 0.28 (t = 2.38), and 0.34 (t = 3.21).

30
that this results in investors pricing the cash holdings of Japanese firms at a discount to those of
U.S. firms.
Beginning in 2000, coefficients for the Japanese firms increase to around 1 or more, and
are consistently reliably greater than 1. Moreover, the coefficients for U.S. firms are no longer
consistently higher than those of Japanese firms (coefficients for U.S. firms are significantly
higher than those of Japanese firms in 2000, 2003, and 2006; differences are insignificant in
2001, 2002, 2004, and 2007; the difference is significantly larger for Japanese firms in 2005).
This evidence suggests that the governance of Japanese firms improves from the 1990s to the
2000s to levels comparable to those of U.S. firms.
The next two columns of Table 8 report cash coefficients from our estimations of (2) (the
Dittmar and Mahrt-Smith model). The overall conclusions here are similar to those from the first
specification: the coefficients on cash tend to be higher for U.S. firms than Japanese firms, with a
discernible upward trend for Japanese firms beginning around 1997 (see Figure 8). For U.S.
firms, the coefficients vary between 1.52 (t = 4.68) and 3.77 (t = 7.27) over 1990 to 1997, but
then show some tendency to increase, with numbers of 4 or larger in 1998 and 1999 and 2004 to
2006. For Japanese firms, the numbers vary from 0.51 (t = 3.63) to 1.69 (t = 8.25) over the
1990s, numbers that are significantly lower (at 5% or better) than those for U.S. firms in 7 of 10
years. The numbers for Japanese firms are generally higher in the 2000s, with values between
2.15 and 2.99 over 2003 to 2006. Coefficients for U.S. firms are significantly higher than for
Japanese firms in 3 of 7 years over 2000-2006, with the magnitude of the differences in favor of
U.S. firms but by smaller amounts than in the 1990s.
Overall, the evidence from these regressions is largely consistent with our predictions:
the valuation of the cash of Japanese firms is low during the 1990s, both in absolute terms and

31
relative to that of U.S. firms, but improves in the 2000s, to levels comparable to those of U.S.
firms. (We have also examined whether these results different for keiretsu and non-keiretsu
Japanese firms, but find little evidence of consistent or reliable differences.) This complements
the evidence from Section 3, where we find that Japanese firms’ management of cash changes
systematically from the 1990s to the 2000s, to more closely resemble how U.S. firms manage
cash, and that improvements in Japanese firms’ management of excess cash are associated with
improvements in performance.
5. Summary
We investigate whether the governance practices of Japanese companies, as manifested in
their holdings of cash, have improved over the past two decades, and whether any such
improvements translate into improved economic performance. We find that, in general, some of
the differences between Japanese and U.S. companies that were evident during the 1990s have
become less pronounced over the past 10 years but that important differences remain. While
overall levels of cash holdings are now roughly the same for U.S. and Japanese companies, when
we condition on firm characteristics we find that Japanese firms still hold substantially more cash
than U.S. firms. We do find, however, that regressions of the determinants of firms’ cash
holdings developed using U.S. data (Opler et al., 1999; Bates et al., 2009) fit Japanese firms
better in the 2000s than in the 1990s, suggesting that Japanese managers now pay more attention
to the economic determinants of their firms’ cash holdings, consistent with improved
governance.
Although the large majority of Japanese companies continue to pay dividends, and the
size of those dividends has increased for some Japanese firms, dividends paid by the median
Japanese firm are still about half as large as those of the median U.S. dividend payer. However,

32
some Japanese firms now supplement dividends with share repurchases, and these firms’ payouts
are substantial in economic terms, measuring about 2% of assets and over half of earnings.
Overall, aggregate payouts by Japanese firms increase impressively over the period from 1999
through 2008, an increase that is driven largely by those firms that pay both dividends and
repurchases.
We find mixed evidence on whether the cash management practices of Japanese firms
have improved over time, perhaps because governance has improved for some firms but not
others. Consistent with this, we find that levels of excess cash display greater persistence for
Japanese firms than U.S. firms, and that this tendency is stronger for high levels of excess cash,
which we associate with poor governance. Further, and consistent with the idea that
improvements in governance manifest themselves in lower holdings of cash, we find an inverse
relation between the (excess) cash holdings of Japanese firms and changes in their performance.
This result does not hold for U.S. firms, which we argue are generally better governed. Further,
we find that the valuations of cash holdings for Japanese firms were systematically lower than
those of U.S. firms in the 1990s, consistent with the idea that these firms were, on average,
poorly governed during this period. The valuation of cash holdings of Japanese firms increases
from the 1990s to the 2000s, to levels comparable to those of U.S. firms, consistent with an
improvement in governance.
Overall, our findings support two conclusions. First, there is mixed evidence on whether
governance practices in the average Japanese firm improve over the last 10 years, at least as
manifested in their management of cash holdings. However, there is evidence that some
Japanese firms—those that pay both dividends and repurchases—now distribute substantial
amounts of cash to shareholders on a regular basis, which is a positive sign for governance.

33
Second, those Japanese firms that are able to improve their management of cash enjoy both an
improvement in performance and improved valuation of cash holdings. This evidence generally
then supports the ideas that there has been some improvement in the governance practices of
Japanese companies and that this translates into improved performance. This evidence offers
hope that further improvements in the governance of Japanese companies will improve corporate
performance and perhaps stimulate overall economic performance in Japan.

34
Appendix: Repurchases in Japan: Institutional details and measurement
Repurchases in the U.S.
In the U.S., repurchases are conventionally measured using the approach used by Fama and
French (2001) and Skinner (2008). Under this approach, repurchases are measured net, after
subtracting from share purchases shares issued for employee stock option programs, acquisitions,
and for other corporate purposes. Measurement is complicated by the fact that repurchases may
be accounted for in either of two ways, the “treasury stock” method (under which the
repurchased shares are held in treasury until they are reissued) or the “permanent retirement”
method (under which the outstanding shares are permanently retired, with a corresponding
reduction in paid-in capital).
Based on this accounting, repurchases by U.S. firms are measured as the increase in
common treasury stock if the firm uses the treasury stock method for repurchases. If the firm
uses the “retirement” method instead (inferred from the fact that the treasury stock is zero in the
current and prior year), repurchases are measured as the difference between stock purchases and
stock issuances from the cash flow statement. If either of these amounts (the change in treasury
stock or the difference between stock purchases and issuances) is negative or missing,
repurchases are set to zero.
Researchers using U.S. data implement this method using Compustat data. Because we
use WorldScope data for U.S. firms and because WorldScope data does not separate purchases
and sales of common and preferred stock, using the method above for U.S. firms from
WorldScope data systematically overstates measured repurchases relative to Compustat.
Consequently, we do not report repurchases for U.S. firms.

35
The emergence of Repurchases in Japan
Beginning in 1994, Japan has gradually lifted restrictions on firms’ ability to repurchase shares.
In 1994, Japan modified the law to allow repurchases but only by permanently retiring shares
using retained earnings. However, because of uncertainty about the tax treatment of such
retirements, managers didn’t actually use this method until November 1995.28
The special law for stock retirement in June 1997 further liberalized the rules for stock
repurchases by removing restrictions over their timing. Under the 1994 regime, firms could only
consider plans to make repurchases once a year, at the annual regular shareholders’ meeting, and
these plans were subject to shareholder approval. Under the special law, once managers obtained
approval from shareholders to set up a maximum amount and number of shares for repurchases
in the corporate articles, managers could then make repurchases decisions (amount and timing)
without shareholder approval. The subsequent amendment of this special law in 1998 and the
enactment of the law for evaluation of land in 1999 expanded the components of shareholders’
equity that were available to fund repurchases: the former included legal capital surplus; the
latter added revaluation reserves from land.29 Related laws also liberalized firms’ ability to make
repurchased shares available for management incentive compensation, including stock options.
The 2001 modified Commercial Code further expanded firms’ ability to make
repurchases. First, for the first time the treasury stock method was permitted. Second, minimum 28 The Japanese Tax Code treats repurchases as a return of net assets to shareholders, that is, the payment is a combination of contributed capital and retained earnings. Similar to the tax treatment of dividends, the Tax Code could recognize that part of the payout corresponding to retained earnings as taxable income. As a result, shareholders receiving cash from such repurchases would pay both capital gains and income taxes, effectively being taxed twice. Because of this treatment, in June 1995, the Japanese tax office announced its intention to exclude repurchases by listed firms from dividend taxation. The corresponding amendment of the Tax Code was enacted in November 1995. 29 In general, Japanese law (Commercial Code) has very detailed restrictions regarding firms’ ability to make dividends and repurchases that are based on various components of shareholders’ equity. These restrictions are similar in spirit to corporate laws in U.S. states, as well as debt covenants in loan agreements, that typically restrict firms’ ability to pay dividends to retained earnings or some fraction thereof. The difference is that Japanese legal and accounting practices mean that Japanese firms have numerous categories of capital, retained earnings, and reserves within shareholders’ equity on the balance sheet.

36
capital restrictions over firms’ ability to pay out cash as either dividends or repurchases were
relaxed. Under the previous law, firms with insufficient capital needed to increase legal retained
earnings before making payouts. Under the modified law, firms for which the sum of legal
retained earnings and legal capital surplus, instead of legal retained earnings alone, exceeded one
quarter of capital stock were exempt from this requirement. Third, firms that met the above
capital requirements could reduce the excess portion of the legal capital surplus and add it to
retained earnings. Previously reduction in legal capital surplus was admitted either to offset loss
carry forwards or to increase in capital stock.
Finally, further legal changes in 2006 effectively lifted all remaining restrictions on
managers’ ability to return cash to shareholders, including repurchases.
Most of the data we use for the study are from Worldscope. However, Worldscope does
not separate purchases and sales of common and preferred stock, so using the method described
above to measure repurchases would systematically overstates repurchases by including changes
in preferred stock and failing to net out common stock issuances. Consequently, we measure
repurchases for Japanese firms using the method outlined above and data from Nikkei Quick,
supplemented as necessary by data drawn directly from firms’ financial statements.

37
!"
#!!!"
$!!!!"
$#!!!"
%!!!!"
%#!!!"
&!!!!"
&#!!!"
'!!!!"
'#!!!"
$('()'"
$('()#"
$('()*"
$('()+"
$('())"
$('(),"
$('(,!"
$('(,$"
$('(,%"
$('(,&"
$('(,'"
$('(,#"
$('(,*"
$('(,+"
$('(,)"
$('(,,"
$('(!!"
$('(!$"
$('(!%"
$('(!&"
$('(!'"
$('(!#"
$('(!*"
$('(!+"
$('(!)"
$('(!,"
$('($!"
$('($$"
$('($%"
!"#$%&'()'*"++&"',,-.'/012'(345'67%8$#7'90%2',:(,.';8167<='><8?&2'

38
!"!!!#
!"$!!#
!"%!!#
!"&!!#
!"'!!#
!"(!!#
!")!!#
!"*!!#
!"+!!#
!",!!#
$"!!!#
$,,!# $,,$# $,,%# $,,&# $,,'# $,,(# $,,)# $,,*# $,,+# $,,,# %!!!# %!!$# %!!%# %!!&# %!!'# %!!(# %!!)# %!!*# %!!+#
!"#$%&
'(&)(*+,+*-'
*./#
0-"1(
!+23"-(45(!"#$%&'(&)(6+,+*-'*(7#0-"15(89(:1&;+*(;+'-<(#'*(=#/#'-1-(:*#1>-*(;+'-<(?"@1A(BCCD.4DDE(

39
!"
!#!!$"
!#!%"
!#!%$"
!#!&"
!#!&$"
!#!'"
!#!'$"
!#!("
!#!($"
%))!" %))%" %))&" %))'" %))(" %))$" %))*" %))+" %))," %)))" &!!!" &!!%" &!!&" &!!'" &!!(" &!!$" &!!*" &!!+" &!!,"
!"#"$%
&$'()*
+
,"-./%+01+23456/67#%+'"8%+39+$"#"$%&$'+93/+:;+6&$+<656&%'%+=/4'>+?@@ABCAAD+
-."/012"
-."/03412"
56"/012"
56"/03412"

40
!"!!!##
!"$!!##
!"%!!##
!"&!!##
!"'!!##
!"(!!##
!")!!##
!"*!!##
!"+!!##
!",!!##
$"!!!##
$,,'# $,,(# $,,)# $,,*# $,,+# $,,,# %!!!# %!!$# %!!%# %!!&# %!!'# %!!(# %!!)# %!!*# %!!+# %!!,# %!$!#
!"#$%&'()'*+,-$.'/-0"1,'-2'3+/+4&5&'4-4674+41"+0'7%859':;;(6<=:=)'*+,&%'#%-$/5'>2%+1?-45@'
-./0#
12345"#
6789#
:7;<3=>250#

41
!"!#
$%!!!"!#
&%!!!"!#
'%!!!"!#
(%!!!"!#
)!%!!!"!#
)$%!!!"!#
)**&# )**+# )**'# )**,# )**(# )***# $!!!# $!!)# $!!$# $!!-# $!!&# $!!+# $!!'# $!!,# $!!(# $!!*# $!)!#
!"##"$%&'$(')*+
*%,&,'-,%.'/001'+2"3,&'
'4"562,'78'9,*#'*552,5*:,';"<";,%;&'=;"*5$%*#'#"%,&>'*%;'2,+623?*&,&'
=&$#";>'($2')*+*%,&,'%$%@"%;6&:2"*#'A2B&.'CDD0@/00E'

42
!"
!#!$"
!#!%"
!#!&"
!#!'"
!#("
!#($"
!#(%"
!#(&"
!#('"
!#$"
())!"())("())$"())*"())%"())+"())&"()),"())'"()))"$!!!"$!!("$!!$"$!!*"$!!%"$!!+"$!!&"$!!,"$!!'"
!"#$%&'(
)*+,-.(/0(!"#$($123*4+#(15(6"7"4.#.(8.*-.9#,("43(414:8.*-.9#,(;-<#(-.2"=>.(91(?@(;-<#("A.-(B143*=14*4+(14(;-<(B$"-"B9.-*#=B#C(
DEEF:GFFH(
-./.0121"030451671829":7;2"
<1671829":7;2"
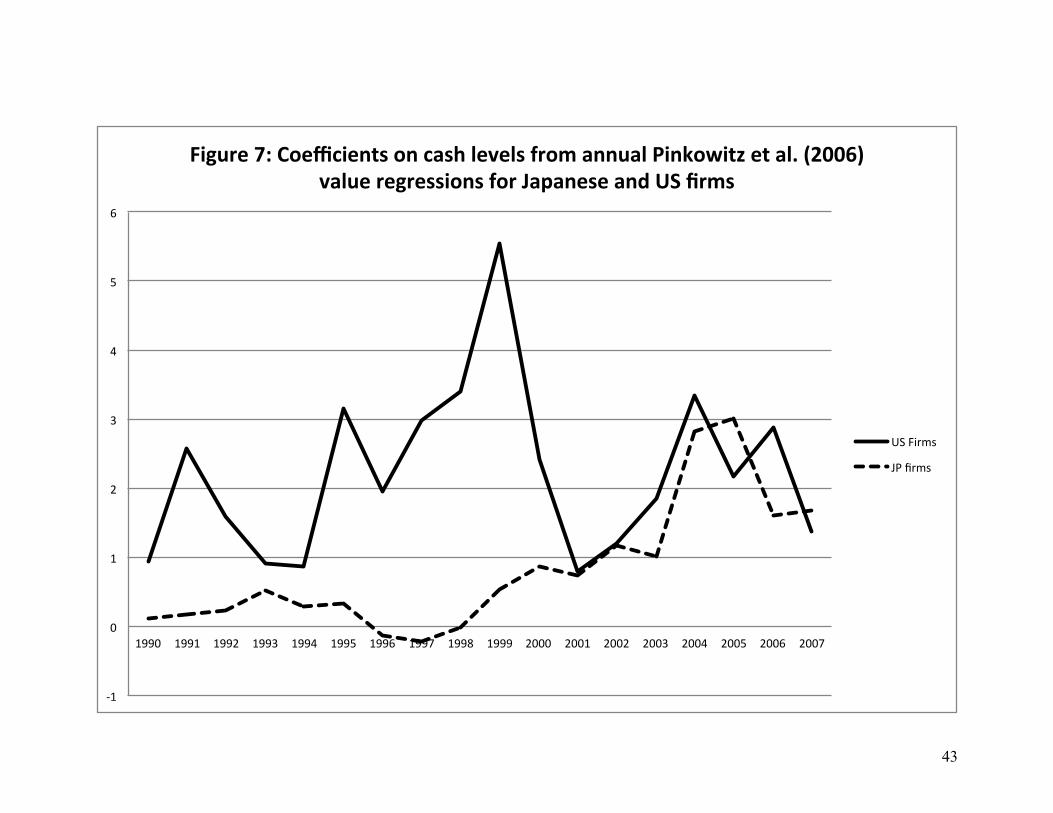
43
!"#
$#
"#
%#
&#
'#
(#
)#
"**$# "**"# "**%# "**&# "**'# "**(# "**)# "**+# "**,# "***# %$$$# %$$"# %$$%# %$$&# %$$'# %$$(# %$$)# %$$+#
!"#$%&'()'*+&,-"&./0'+.'-102'3&4&30'5%+6'1..$13'7".8+9"/:'&/'13;'<=>>?@'413$&'%&#%&00"+.0'5+%'A1B1.&0&'1.C'DE'F%60'
-.#/0123##
45#6123#

44
!"
#"
$"
%"
&"
'"
("
#))!" #))#" #))$" #))%" #))&" #))'" #))(" #))*" #))+" #)))" $!!!" $!!#" $!!$" $!!%" $!!&" $!!'" $!!("
!"#$%&'()'*+&,-"&./0'+.'-102'3&4&30'5%+6'1..$13'7"861%'1.9':12%/;<6"/2'413$&'%&#%&00"+.0'5+%'=1>1.&0&'1.9'?<'@%60'
'
,-"./01"
23"./01"

45
Table 1: Comparison of cash holdings, valuation metrics, and profitability of Japanese and U.S. non-‐financial firms, 1990-‐2008 Cash/Total Assets Market/Book P/E EBIT/lagged TA US Japan US Japan US Japan US Japan Mean Med. Mean Med. Mean Med. Mean Med. Mean Med. Mean Med. Mean Med. Mean Med. 1990 0.069 0.028 0.160 0.138 2.15 1.31 4.64 3.45 21.0 13.6 79.9 50.1 0.114 0.111 0.079 0.071 1991 0.081 0.040 0.146 0.124 2.99 1.75 3.66 2.82 35.9 19.7 64.6 40.8 0.095 0.093 0.078 0.070 1992 0.086 0.049 0.136 0.113 3.08 2.00 2.42 1.92 31.9 20.5 62.9 35.9 0.091 0.092 0.064 0.058 1993 0.085 0.049 0.126 0.107 3.19 2.21 2.29 1.81 36.4 20.9 76.7 42.4 0.088 0.094 0.047 0.044 1994 0.098 0.054 0.128 0.107 3.00 2.02 2.61 1.97 28.1 16.8 93.4 51.1 0.106 0.110 0.041 0.037 1995 0.110 0.059 0.125 0.104 3.62 2.39 2.21 1.67 33.4 18.7 74.2 39.9 0.101 0.113 0.043 0.038 1996 0.123 0.068 0.115 0.095 3.72 2.44 2.57 1.94 35.9 20.4 75.7 41.2 0.089 0.112 0.045 0.039 1997 0.125 0.071 0.107 0.085 3.82 2.56 1.93 1.40 37.5 21.4 52.2 31.2 0.055 0.105 0.045 0.039 1998 0.136 0.068 0.110 0.087 3.81 2.07 1.69 1.00 38.1 19.8 50.2 24.7 0.020 0.091 0.038 0.032 1999 0.153 0.063 0.120 0.096 5.02 2.19 2.06 1.01 42.6 18.4 55.8 28.4 -‐0.001 0.078 0.036 0.029 2000 0.142 0.069 0.131 0.102 3.45 1.72 2.17 1.00 33.6 16.1 50.9 23.4 0.009 0.077 0.040 0.033 2001 0.143 0.072 0.135 0.104 3.42 1.93 1.86 1.00 44.5 23.2 37.3 20.3 -‐0.024 0.046 0.040 0.033 2002 0.144 0.079 0.151 0.113 2.75 1.50 1.63 1.00 29.6 17.4 43.9 20.0 -‐0.009 0.050 0.032 0.026 2003 0.169 0.099 0.158 0.119 3.83 2.34 1.57 1.00 38.8 23.3 35.1 17.1 0.013 0.061 0.048 0.034 2004 0.157 0.096 0.161 0.117 3.81 2.55 2.31 1.15 38.6 22.8 37.5 20.7 0.033 0.080 0.064 0.048 2005 0.160 0.096 0.160 0.120 3.68 2.47 2.38 1.33 36.1 21.4 38.6 20.5 0.034 0.082 0.069 0.054 2006 0.163 0.095 0.150 0.114 3.75 2.54 2.50 1.58 36.5 21.5 38.7 23.5 0.038 0.085 0.064 0.057 2007 0.174 0.106 0.142 0.112 3.55 2.25 1.83 1.25 34.4 20.0 31.6 18.1 0.036 0.083 0.060 0.058 2008 0.174 0.109 0.139 0.108 2.24 1.19 1.43 1.00 22.0 13.3 25.5 13.4 -‐0.006 0.056 0.048 0.048 Total 0.139 0.075 0.137 0.108 3.50 2.11 2.18 1.32 35.0 19.7 49.4 25.6 0.038 0.084 0.051 0.044

46
All data are from Worldscope. Years correspond to fiscal years (for example, for Japanese firms fiscal year-‐ends from 1.16.91 through 1.15.92 are classified as 1991, a fiscal year-‐end of March 31, 1991 is thus classified as 1991; for U.S. firms the cut-‐off is February 10). Italics for Japanese numbers indicate that US versus Japan difference is significant at 5% level or better.

47
Table 2: Size and profitability of Japanese industrials classified according to payout policy, 1998-‐2008: (i) non-‐payers, (ii) firms that only pay dividends, (iii) firms that pay dividends and repurchases. Size (total assets), yen millions Profitability (EBIT/TA), % Non-‐payers Dividend-‐only Dividend-‐
repurchase Non-‐payers Dividend-‐
only Dividend-‐repurchase
Mean Med. Mean Med. Mean Med. Mean Med. Mean Med. Mean Med. 1998 95,332 25,319 183,351 35,592 419,911 49,015 -‐0.7 0.7 4.7 3.9 4.1 3.6 1999 155,671 27,670 162,604 36,738 226,757 50,350 -‐3.1 -‐1.4 4.8 3.8 3.4 3.2 2000 164,762 29,337 161,232 32,419 203,258 60,276 -‐2.8 0.4 5.1 4.1 3.6 3.5 2001 149,751 23,104 161,331 31,876 199,522 58,846 -‐1.1 0.3 5.1 4.4 3.3 3.2 2002 117,782 20,604 153,752 27,937 215,248 54,667 -‐3.7 -‐1.0 4.5 3.7 3.0 2.7 2003 98,167 16,277 137,464 26,480 199,768 58,846 -‐0.8 1.3 5.3 4.6 4.4 3.5 2004 92,239 15,020 141,069 27,821 229,955 47,063 -‐0.4 2.5 6.4 5.2 5.5 4.7 2005 69,429 12,891 136,491 29,340 328,301 48,332 0.8 2.7 6.5 5.5 6.2 5.5 2006 61,850 12,304 160,371 31,900 349,450 57,099 -‐1.9 1.4 6.3 5.7 6.8 6.2 2007 54,915 10,960 171,762 34,164 370,696 50,786 -‐5.0 1.0 6.7 6.0 7.2 6.3 2008 42,891 9,557 182,619 34,963 301,021 44,990 -‐10.5 -‐1.1 6.0 5.1 6.9 6.4 Table reports size (total assets, in millions of yen) and profitability (EBIT/TA, %) for Japanese industrials divided into three groups of firms: (a) firms that do not pay dividends or make repurchases in year (non-‐payers), (b) firms that pay dividends but do not make repurchases in a given year (dividend-‐only firms), and (c) firms that pay dividends and make repurchases in a given year (dividend-‐repurchase firms). Italics indicate that dividend-‐repurchase (dividend-‐only) firms are significantly different from dividend-‐only (non-‐payer) firms at the 1% level. Bold indicates that numbers for dividend-‐repurchase firms are significantly different from numbers for non-‐payers firms at the 1% level. All data from Worldscope. Years correspond to fiscal years (for example, for Japanese firms fiscal year-‐ends from 1.16.91 through 1.15.92 are classified as 1991, a fiscal year-‐end of March 31, 1991 is thus classified as 1991; for U.S. firms the cut-‐off is February 10).

48
Table 3: Total payouts (dividends plus repurchases) ratios for Japanese non-‐financial firms that pay only dividends versus those that pay both dividends and repurchases, 1998-‐2008
Total payout/Total assets (%) Total payout/Net income (%) Dividend-‐only firms Dividend-‐repurchase
firms Dividend-‐only firms Dividend-‐repurchase
firms Mean Median Mean Median Mean Median Mean Median 1998 0.7 0.6 2.5 1.8 70.2 28.8 178 85.2 1999 0.8 0.6 1.8 1.4 79.9 27.4 184 70.5 2000 0.8 0.6 1.9 1.5 71.9 21.2 143 66.6 2001 0.7 0.6 3.9 1.4 48.7 19.8 938 61.6 2002 0.8 0.6 2.2 1.5 58.8 21.6 117 62.8 2003 0.7 0.6 2.2 1.5 48.8 21.6 118 64.7 2004 0.8 0.6 2.1 1.4 31.0 20.7 78.7 57.8 2005 0.9 0.7 2.6 1.6 35.8 20.1 142 48.7 2006 0.9 0.7 3.3 2.0 218 20.9 104 52.9 2007 1.0 0.8 3.3 2.0 37.1 22.6 162 57.3 2008 1.1 0.8 3.2 2.2 47.6 25.7 105 59.2
Dividend-‐only firms are those that only pay dividends in a given year. Dividend-‐repurchase firms are firms that pay both dividends and repurchases in a given year. Total payout is the sum of dividends and repurchases in a given year. Data are from Worldscope except for repurchases which are from Nikkei Quick and individual firm financial statements. Years correspond to fiscal years (for example, fiscal year ends from 1.16.91 through 1.15.92 are classified as 1991). All differences for both variables are statistically significant at the 1% level or better under two-‐tailed tests.

49
Table 4: OLS regressions of firms’ cash holdings (cash/ta) on set of predicted determinants for U.S. and Japanese industrial firms with available data over 1990-‐2008.
U.S.:
1990-‐2008 U.S.: 1990-‐1999
U.S.: 2000-‐2008
Japan: 1990-‐2008
Japan: 1990-‐1999
Japan: 2000-‐2008
Int. 0.242
(21.3) 0.180 (11.3)
0.273 (23.0)
0.227 (2.11)
0.097 (2.11)
0.248 (9.11)
Year 2000-‐2003 0.015 (3.66)
-‐0.13 (-‐1.47)
Year 2004-‐2008 0.017 (3.64)
-‐.020 (-‐2.18)
Size -‐0.013 (-‐9.88)
-‐0.010 (-‐7.85)
-‐0.014 (-‐8.34)
-‐0.012 (-‐4.60)
0.001 (0.17)
-‐0.015 (-‐6.50)
Div. pay dummy -‐.037 (-‐8.46)
-‐0.038 (-‐7.26)
-‐0.033 (-‐5.39)
0.019 (3.46)
0.026 (4.07)
0.015 (2.42)
Leverage -‐0.172 (-‐19.5)
-‐0.164 (-‐12.7)
-‐0.170 (-‐15.0)
-‐0.128 (-‐4.75)
-‐0.055 (-‐1.07)
-‐0.156 (-‐5.69)
ROE 0.016 (2.16)
0.008 (1.04)
0.019 (1.73)
0.019 (1.89)
0.052 (2.16)
0.010 (1.10)
Loss dummy -‐0.007 (-‐1.65)
-‐0.006 (-‐1.55)
-‐0.007 (-‐1.20)
0.001 (0.39)
0.002 (0.20)
0.003 (0.73)
Market/Book 0.002 (5.08)
0.003 (4.81)
0.002 (3.63)
0.007 (4.83)
0.002 (1.40)
0.008 (5.06)
Closely held -‐0.003 (-‐0.30)
-‐0.004 (-‐0.36)
0.002 (0.20)
0.032 (2.67)
0.027 (1.10)
0.034 (2.76)
Ind. Sigma 0.177 (5.25)
0.567 (5.48)
0.159 (5.88)
0.812 (4.62)
-‐0.141 (-‐0.38)
0.796 (4.54)
Net WC -‐0.228 (-‐17.1)
-‐0.177 (-‐8.22)
-‐0.258 (-‐21.0)
-‐0.070 (-‐4.34)
-‐0.034 (-‐1.24)
-‐0.080 (-‐4.88)

50
R&D 0.208 (16.3)
0.176 (10.3)
0.221 (14.4)
0.514 (10.20)
0.317 (2.26)
0.517 (9.26)
Capex -‐0.345 (-‐11.0)
-‐0.306 (-‐6.75)
-‐0.367 (-‐9.20)
-‐0.557 (-‐7.67)
-‐0.444 (-‐3.10)
-‐0.591 (-‐7.54)
Cash Flow 0.073 (6.12)
0.076 (5.39)
0.074 (4.60)
0.273 (5.95)
0.227 (1.31)
0.288 (6.01)
Keiretsu dummy na na na -‐0.028 (-‐6.72)
-‐0.031 (-‐4.27)
-‐0.027 (-‐6.38)
Obs. 22,095 9,684 12,411 12,736 2,779 9,957 Adj. R-‐square 0.331 0.305 0.320 0.223 0.114 0.254 We measure size as the natural log of total assets, leverage as the ratio of long-‐term debt to total assets, ROE as net income deflated by lagged stockholders’ equity, net working capital as current assets minus current liabilities minus cash deflated by total assets, R&D as research and development expenditures deflated by sales, capital expenditures as capital expenditures deflated by total assets, and cash flow as funds from operations deflated by total assets. The dividend-‐payer dummy is set to 1 for dividend-‐payers and 0 otherwise. The loss dummy is set to 1 for firms with negative net income and 0 otherwise. Closely held is the fraction of shares held by insiders; in Japan, it is measured as the fraction of shares held by the ten largest shareholders. We construct industry sigma as the mean of the standard deviations of cash flow/assets over the past 10 years for firms in a given industry. We define industry by using industry group variable (WC06011) from WorldScope. We use three-‐digit code for miscellaneous industry and two-‐digit code for all other industries. Due to the requirement of cash flow data in the past 10 years, industry sigma could not be calculated for observations before 1990. The keiretsu dummy is set to 1 for firms with relatively high inclination to the largest six horizontal “enterprise” groups in Japan, measured in 2001, and sourced from Industrial Groupings in Japan (2001); see text for more detail. We report t-‐statistics in parentheses (standard errors are computed after clustering by firm and year).

51
Table 5: Selected summary statistics from annual cross-‐sectional regressions explaining U.S. and Japanese firms’ cash holdings
Obs. Adj. R-‐squared Japan intercept
dummy (t-‐stat) Keiretsu intercept dummy (t-‐stat)
1990 934 0.255 0.145 (8.02) -‐0.035 (-‐2.42) 1991 916 0.285 0.164 (9.44) -‐0.045 (-‐3.31) 1992 926 0.274 0.190 (10.7) -‐0.045 (-‐3.40) 1993 997 0.237 0.170 (10.5) -‐0.046 (-‐3.71) 1994 996 0.335 0.181 (10.3) -‐0.044 (-‐3.37) 1995 1,184 0.321 0.150 (8.46) -‐0.055 (-‐3.96) 1996 1,550 0.264 0.097 (6.44) -‐0.028 (-‐2.96) 1997 1,652 0.224 0.094 (6.46) -‐0.024 (-‐2.39) 1998 1,667 0.252 0.101 (6.45) -‐0.020 (-‐1.90) 1999 1,697 0.293 0.063 (3.83) -‐0.022 (-‐1.80) 2000 2,094 0.278 0.069 (4.77) -‐0.027 (-‐2.93) 2001 2,257 0.233 0.035 (2.57) -‐0.033 (-‐3.68) 2002 2,509 0.206 0.089 (7.35) -‐0.039 (-‐4.80) 2003 2,534 0.278 0.113 (9.13) -‐0.048 (-‐5.69) 2004 2,878 0.269 0.116 (10.4) -‐0.046 (-‐5.58) 2005 2,931 0.287 0.123 (11.0) -‐0.048 (-‐5.85) 2006 2,685 0.332 0.112 (10.3) -‐0.040 (-‐5.21) 2007 2,437 0.340 0.111 (9.61) -‐0.041 (-‐5.18) 2008 2,285 0.322 0.084 (6.95) -‐0.038 (-‐4.75)
The table reports selected summary statistics from regressions of cash holdings on firm characteristics for Japanese and U.S. firms. These regressions are estimated as annual cross-‐sections for all U.S. and Japanese firms with available data. The dependent variable is cash/total assets. Independent variables are the Japan intercept dummy (set to one for Japanese firms and zero for U.S. firms), size, dividend-‐payer dummy, leverage, ROE, a loss dummy, market-‐to-‐book, the percentage of closely held shares, industry sigma, net working capital, R&D, capital expenditures, and cash flow. For more detailed definitions, see Table 2 notes.

52
Table 6: Transition matrices showing changes in firms’ holding of excess cash, where firms are sorted into excess cash deciles at the beginning and end of three periods (1994-1999, 1999-2004, 2004-2008) and tables show transitions between excess cash deciles during these periods. Panel A: U.S. Firms U.S. Firms, 1994-1999
Obs. 1 2 3 4 5 6 7 8 9 10 1 79 17.07 29.27 17.07 7.32 4.88 9.76 2.44 2.44 9.76 0.00 2 81 8.82 2.94 23.53 23.53 11.76 5.88 8.82 2.94 11.76 0.00 3 80 6.82 6.82 4.55 22.73 11.36 15.91 13.64 9.09 6.82 2.27 4 80 3.23 16.13 19.35 19.35 22.58 6.45 9.68 3.23 0.00 0.00 5 80 2.50 5.00 10.00 7.50 20.00 22.50 15.00 10.00 7.50 0.00 6 80 0.00 0.00 5.26 13.16 18.42 21.05 21.05 10.53 5.26 5.26 7 80 10.00 12.50 7.50 5.00 2.50 17.50 20.00 10.00 7.50 7.50 8 80 0.00 0.00 5.26 5.26 21.05 21.05 21.05 10.53 10.53 5.26 9 80 4.76 7.14 9.52 4.76 2.38 7.14 19.05 26.19 16.67 2.38 10 81 4.55 2.27 2.27 11.36 15.91 2.27 9.09 18.18 22.73 11.36
Obs. Mean ROA
change Median ROA change
Mean ROE change
Median ROE change
Firms that move up 150 -0.3% -0.7% 1.0% 0.0% Firms that move down 149 -5.3% -1.8% -6.1% -2.1% P-value for diff. 0.030 0.314 0.030 0.263
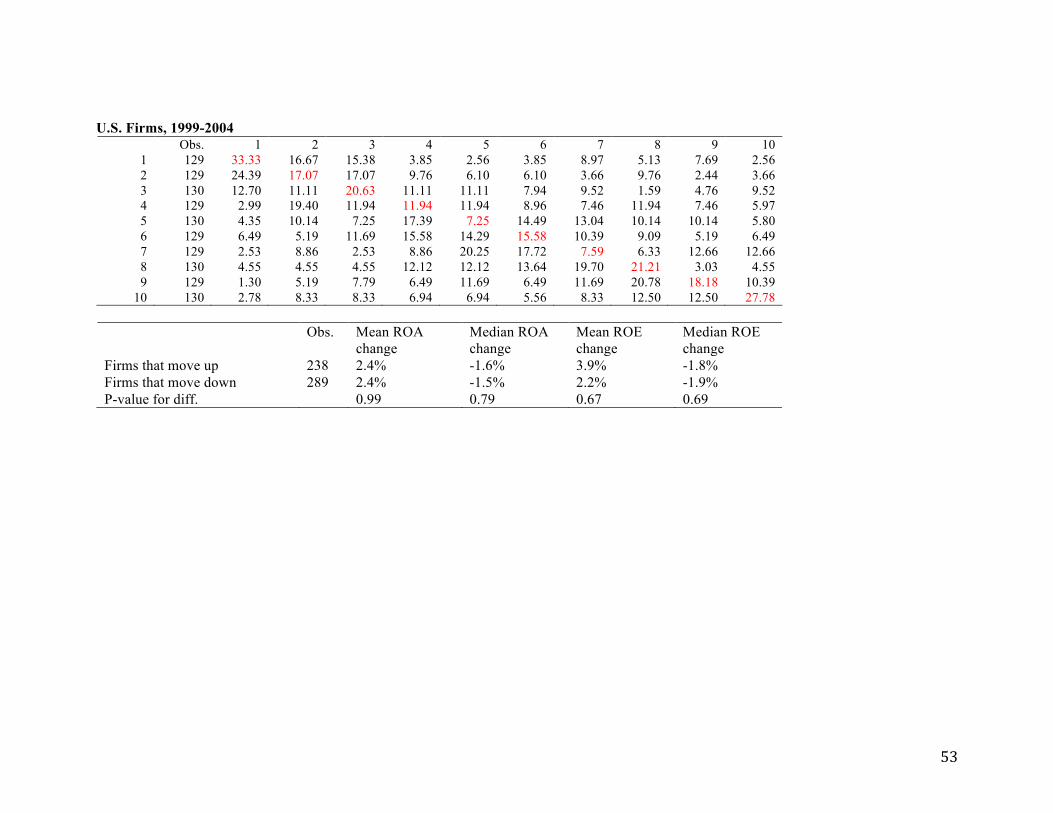
53
U.S. Firms, 1999-2004 Obs. 1 2 3 4 5 6 7 8 9 10
1 129 33.33 16.67 15.38 3.85 2.56 3.85 8.97 5.13 7.69 2.56 2 129 24.39 17.07 17.07 9.76 6.10 6.10 3.66 9.76 2.44 3.66 3 130 12.70 11.11 20.63 11.11 11.11 7.94 9.52 1.59 4.76 9.52 4 129 2.99 19.40 11.94 11.94 11.94 8.96 7.46 11.94 7.46 5.97 5 130 4.35 10.14 7.25 17.39 7.25 14.49 13.04 10.14 10.14 5.80 6 129 6.49 5.19 11.69 15.58 14.29 15.58 10.39 9.09 5.19 6.49 7 129 2.53 8.86 2.53 8.86 20.25 17.72 7.59 6.33 12.66 12.66 8 130 4.55 4.55 4.55 12.12 12.12 13.64 19.70 21.21 3.03 4.55 9 129 1.30 5.19 7.79 6.49 11.69 6.49 11.69 20.78 18.18 10.39
10 130 2.78 8.33 8.33 6.94 6.94 5.56 8.33 12.50 12.50 27.78
Obs. Mean ROA change
Median ROA change
Mean ROE change
Median ROE change
Firms that move up 238 2.4% -1.6% 3.9% -1.8% Firms that move down 289 2.4% -1.5% 2.2% -1.9% P-value for diff. 0.99 0.79 0.67 0.69

54
U.S. Firms, 2004-2008 Obs. 1 2 3 4 5 6 7 8 9 10
1 166 23.88 20.90 8.96 10.45 5.97 2.99 1.49 8.96 7.46 8.96 2 167 16.00 21.33 13.33 16.00 4.00 4.00 8.00 8.00 4.00 5.33 3 167 8.99 10.11 21.35 11.24 14.61 5.62 4.49 8.99 6.74 7.87 4 167 14.81 4.94 9.88 16.05 14.81 4.94 9.88 8.64 12.35 3.70 5 167 5.62 5.62 11.24 22.47 11.24 12.36 13.48 5.62 4.49 7.87 6 167 5.95 11.90 5.95 11.90 10.71 14.29 11.90 13.10 10.71 3.57 7 167 3.70 2.47 11.11 9.88 16.05 13.58 18.52 11.11 8.64 4.94 8 167 1.23 7.41 6.17 7.41 11.11 12.35 14.81 16.05 14.81 8.64 9 167 8.00 6.67 8.00 2.67 6.67 17.33 9.33 13.33 17.33 10.67
10 167 12.16 9.46 0.00 2.70 9.46 9.46 8.11 9.46 13.51 25.68
Obs. Mean ROA change
Median ROA change
Mean ROE change
Median ROE change
Firms that move up 283 -3.3% -2.9% -7.8% -4.1% Firms that move down 310 -4.8% -2.4% -4.0% -4.5% P-value for diff. 0.46 0.71 0.31 0.92

55
Panel B: Japanese Firms Japanese Firms, 1994-1999
Obs. 1 2 3 4 5 6 7 8 9 10 1 19 44.44 11.11 5.56 5.56 11.11 5.56 11.11 5.56 0.00 0.00 2 20 9.09 27.27 18.18 27.27 9.09 0.00 9.09 0.00 0.00 0.00 3 19 6.67 20.00 13.33 13.33 0.00 26.67 13.33 0.00 6.67 0.00 4 20 0.00 12.50 18.75 18.75 12.50 18.75 12.50 6.25 0.00 0.00 5 19 14.29 14.29 7.14 7.14 28.57 7.14 0.00 14.29 0.00 7.14 6 20 0.00 15.38 15.38 0.00 15.38 15.38 15.38 7.69 7.69 7.69 7 19 0.00 6.25 0.00 6.25 0.00 25.00 31.25 25.00 6.25 0.00 8 20 0.00 0.00 0.00 12.50 12.50 0.00 12.50 12.50 37.50 12.50 9 19 0.00 0.00 0.00 9.09 9.09 0.00 0.00 27.27 36.36 18.18
10 20 0.00 0.00 9.09 0.00 0.00 9.09 9.09 9.09 54.55 9.09
Obs. Mean ROA change
Median ROA change
Mean ROE change
Median ROE change
Firms that move up 53 -2.2% -2.2% -9.3% -3.8% Firms that move down 45 -0.9% -0.6% -0.5% -1.0% P-value for diff. 0.125 0.077 0.004 0.015

56
Japanese Firms, 1999-2004 Obs. 1 2 3 4 5 6 7 8 9 10
1 40 28.13 21.88 18.75 6.25 9.38 9.38 3.13 3.13 0.00 0.00 2 40 14.71 14.71 23.53 26.47 2.94 5.88 5.88 2.94 2.94 0.00 3 40 8.82 8.82 11.76 14.71 26.47 8.82 2.94 11.76 2.94 2.94 4 41 12.12 21.21 12.12 9.09 12.12 21.21 3.03 6.06 3.03 0.00 5 40 2.94 14.71 5.88 26.47 17.65 14.71 8.82 2.94 2.94 2.94 6 40 11.11 5.56 13.89 19.44 13.89 8.33 19.44 5.56 2.78 0.00 7 41 3.13 21.88 12.50 12.50 9.38 9.38 15.63 9.38 6.25 0.00 8 40 8.82 2.94 8.82 5.88 11.76 5.88 8.82 14.71 23.53 8.82 9 40 2.78 5.56 11.11 2.78 11.11 2.78 5.56 19.44 33.33 5.56
10 41 3.03 0.00 3.03 3.03 6.06 6.06 15.15 15.15 12.12 36.36
Obs. Mean ROA change
Median ROA change
Mean ROE change
Median ROE change
Firms that move up 125 0.6% 1.0% 0.9% 2.7% Firms that move down 149 2.4% 2.6% 8.0% 4.1% P-value for diff. 0.040 0.003 0.006 0.001

57
Japanese Firms, 2004-2008 Obs. 1 2 3 4 5 6 7 8 9 10
1 120 53.54 16.16 9.09 4.04 6.06 3.03 3.03 1.01 0.00 4.04 2 121 24.11 27.68 19.64 10.71 3.57 7.14 2.68 1.79 1.79 0.89 3 121 4.35 23.48 23.48 17.39 11.30 3.48 6.96 4.35 2.61 2.61 4 121 7.14 11.61 11.61 18.75 16.07 16.07 9.82 5.36 1.79 1.79 5 121 4.39 7.02 11.40 13.16 15.79 15.79 9.65 13.16 7.02 2.63 6 121 3.74 1.87 8.41 11.21 22.43 13.08 14.95 14.95 7.48 1.87 7 121 2.54 3.39 5.08 11.02 10.17 16.95 20.34 12.71 9.32 8.47 8 121 1.87 4.67 3.74 5.61 8.41 12.15 16.82 19.63 21.50 5.61 9 121 2.73 1.82 4.55 4.55 4.55 9.09 10.00 10.00 30.00 22.73
10 121 1.90 0.95 2.86 2.86 1.90 3.81 3.81 13.33 21.90 46.67
Obs. Mean ROA change
Median ROA change
Mean ROE change
Median ROE change
Firms that move up 395 -1.4% -0.1% -2.8% -0.7% Firms that move down 407 0.4% 0.7% -0.2% 0.1% P-value for diff. 0.018 0.021 0.091 0.015
Notes. For each year (beginning and end of each of the three periods) and each country, observations are sorted into deciles based on excess cash. Excess cash is measured using the residuals from the same type of cash holdings regressions described in Table 2, but estimated by country for the full time period and without the time dummies. The cells of the matrices report the number of firms in a given excess cash row/column at the beginning/end of each period, expressed as a percentage of row totals. The tables below each matrix report on changes in ROA and ROE from the beginning to the end of each period for firms that move up (down) deciles from the beginning to the end of each period, as well as two-tailed p values for differences of means and medians tests. We use two sample Wilcoxon rank sums tests to test differences in medians.

58
Table 7: OLS regressions of change in firm performance on changes in excess cash deciles, keiretsu membership, and interaction term Panel A: Dependent variable is change in ROA
1994-1999 1999-2004 2004-2008 Pooled Intercept -0.89
(-1.93) 1.17
(2.29) -0.54
(-1.75) -0.24
(-0.98) Change in excess cash decile -0.00
(-0.01) -0.40
(-2.27) -0.30
(-2.36) -0.33
(-3.27) Keiretsu dummy -0.52
(-0.69) 1.31
(1.65) 1.59
(2.68) 1.40
(3.16) Interaction -0.51
(-1.73) 0.15
(0.53) 0.14
(0.55) 0.02
(0.14) Adjusted R-squared 0.037 0.017 0.009 0.014 Observations 127 332 1,067 1,526
Panel B: Dependent variable is change in ROE
1994-1999 1999-2004 2004-2008 Pooled Intercept -2.61
(-1.60) 3.69
(2.38) -2.10
(-3.04) -1.00
(-1.66) Change in excess cash decile -0.87
(-1.22) -1.25
(-2.34) -0.10
(-0.35) -0.49
(-2.02) Keiretsu dummy -0.72
(-2.13) 3.26
(1.36) 3.83
(2.90) 3.54
(3.28) Interaction -2.22
(-2.13) -0.88
(-1.01) -0.68
(-1.22) -1.19
(-2.77) Adjusted R-squared 0.122 0.040 0.010 0.021 Observations 129 333 1,075 1,537

59
Table reports the results from regressions of changes in firm performance (measured as either ROA, EBIT on lagged total assets, or ROE, NI on lagged stockholders’ equity) on changes in excess cash decile (from Table 4), a keiretsu dummy (measured as in Tables 2 and 3), and an interaction between these variables. We estimate this regressions for all Japanese industrials with available data at the beginning and ending year of each sub-period.

60
Table 8: Cash coefficients (t-statistics) from “value” regressions of firm value on level of cash and other determinants estimated annually for Japanese and U.S. industrial firms
Pinkowitz et al. (2006) specification Dittmar and Mahrt-Smith (2007) specification
U.S. firms Japanese firms U.S. firms Japanese firms (1) (2) (3) (4) 1990 0.95 (2.67) 0.11 (0.49)*** 1.52 (4.68) 0.68 (4.35)** 1991 2.58 (3.79) 0.18 (1.13)*** 2.46 (4.62) 0.51 (3.63)*** 1992 1.59 (2.67) 0.22 (1.75)*** 3.77 (7.27) 1.42 (13.47)*** 1993 0.91 (1.46) 0.53 (4.31) 1.45 (3.65) 1.16 (11.90) 1994 0.88 (1.85) 0.28 (2.38) 2.18 (5.63) 1.66 (14.93)* 1995 3.16 (6.04) 0.34 (3.21)*** 2.96 (5.21) 1.23 (13.80)*** 1996 1.97 (3.77) -0.13 (-1.04)*** 1.68 (3.72) 1.14 (9.89) 1997 2.97 (6.84) -0.22 (-1.79)*** 2.87 (6.26) 0.90 (7.92)*** 1998 3.41 (5.97) -0.02 (-0.17)*** 4.40 (11.20) 1.12 (7.54)*** 1999 5.54 (7.87) 0.54 (2.22)*** 4.78 (9.58) 1.69 (8.25)*** 2000 2.43 (4.71) 0.87 (4.05)** 1.75 (5.05) 1.34 (9.54) 2001 0.80 (1.70) 0.74 (3.41) 2.56 (7.44) 1.60 (9.54) 2002 1.21 (3.18) 1.17 (6.37) 2.35 (7.30) 1.89 (12.03) 2003 1.86 (5.52) 1.02 (7.15)** 3.00 (12.66) 2.15 (15.04)* 2004 3.35 (9.84) 2.83 (16.82) 4.67 (18.95) 2.83 (20.94)*** 2005 2.17 (7.01) 3.01 (18.71)** 3.62 (20.92) 2.99 (25.20)** 2006 2.89 (8.80) 1.61 (11.55)*** 3.92 (19.75) 2.47 (21.55)*** 2007 1.37 (4.35) 1.68 (12.00) na na
*(**)(***) Denotes statistically significant difference between U.S. and Japanese firms at the 10%(5%)(1%) level, two-tailed. The table reports coefficients on the cash variable (C) in the following regression specifications. Columns (1) and (2) report the estimated cash coefficients (β13) from the following regressions for US and Japanese firms, respectively, by year:
Vi,t = α + β1Ei,t + β2dEi,t + β3dEi,t+1 + β4dNAi,t + β5dNAi,t+1 + β6RDi,t + β7dRDi,t + β8dRDi,t+1 + β9Di,t + β10dDi,t + β11dDi,t+1 + β12dVi,t + β13Ci,t + εi,t
where dXt denotes changes in X from t-1 to t, V denotes firm value, measured as the market value of equity plus the book value of debt, E

61
denotes earnings (EBIT), NA denotes net assets (total assets minus cash), RD is research and development expense, D is common dividends, and C is cash holdings. Columns (3) and (4) report the estimated cash coefficients (β13) from the following regressions for US and Japanese firms, respectively, by year:
Vi,t = α + β1Ei,t + β2dEi,t + β3dEi,t+2 + β4RDi,t + β5dRDi,t + β6dRDi,t+2 + β7Di,t + β8dDi,t + β9dDi,t+2 + β10dNAi,t + β11dNAi,t+2 + β12dVi,t+2 + β13Ci,t + εi,t
Here, all variables are deflated by NAt, and dXi,t denotes changes in X from t-2 to t.
62
REFERENCES
Aoki, M. 2007. Whither Japan’s corporate governance? In M. Aoki, G. Jackson, and H. Miyajima (eds). Corporate governance in Japan: Institutional change and organizational diversity. Oxford University Press.
Aoki, M., H. Patrick, and P. Sheard. 1994. The Japanese Main Bank System: An Introductory Overview. In The Japanese Main Bank System. Masahiko Aoki and Hugh Patrick (eds.), Oxford University Press.
Bagwell, L. S., and J. B. Shoven, Cash distributions to shareholders. 1989. Journal of Economic Perspectives 3, 3: 129-140.
Bates, T. W., K. M. Kahle, and R. M. Stulz. 2009. Why do U.S. firms hold so much more cash than they used to? Journal of Finance 64: 1985-2021.
Chen, Q., X. Chen, K Schipper, Y. Xu, and J. Xue. 2010. The sensitivity of corporate cash holdings to corporate governance. Duke University working paper, November.
Denis, D. J., and I. Osobov. 2008. Why do firms pay dividends? International evidence on the determinants of dividend policy. Journal of Financial Economics 89: 62-82.
Dewenter, K.L., and V.A. Warther. 1998. Dividends, asymmetric information, and agency conflicts: Evidence from a comparison of the dividend policies of Japanese and U.S. firms. Journal of Finance 53: 879-904.
Dittmar, A., J. Mahrt-Smith, and H. Servaes. 2003. International corporate governance and
corporate cash holdings. Journal of Financial and Quantitative Analysis 38: 111-134. Dittmar, A., and J. Mahrt-Smith. 2007. Corporate governance and the value of cash holdings.
Journal of Financial Economics 83: 599-634. Doidge, C., G. A. Karolyi, and R. M. Stulz. 2004. Why are foreign firms listed in the U.S.
worth more? Journal of Financial Economics 71: 205-238. Fama, E.F., and K.R. French. 1998. Taxes, financing decisions, and firm value, Journal of
Finance 53: 819–843.
Fama, E.F., and K. R. French. 2001. Disappearing dividends: changing firm characteristics or lower propensity to pay? Journal of Financial Economics 60: 3-43.
Fama, E.F., and K. R. French. 2004. New lists: Fundamentals and survival rates. Journal of Financial Economics 73: 229-269.
Floyd, E., N. Li, and D. J. Skinner. 2011. Payout policy through the financial crisis: The growth of repurchases and the resilience of dividends. Unpublished paper, University of Chicago, October.
63
French, K.R., and J.M. Poterba. 1991. Were Japanese stock prices too high? Journal of Financial Economics 29: 337-363.
Fukao, M. 2003. Japan’s Lost Decade and its Financial System. The World Economy Vol. 26 No. 3. March 2003: 365-384.
Grullon, G., and R. Michaely. 2002. Dividends, share repurchases and the substitution
hypothesis. Journal of Finance 57: 1649-1684.
Hamao, Y., K. Kutsuna, and P. Matos. 2010. Foreign investor activism in Japan: the first ten years. Working paper, U.S.C and Kobe University. June 1.
Harford, J., S. Mansi, and W. Maxwell, 2008, Corporate governance and a firm’s cash holdings,
Journal of Financial Economics 87: 535–555. Hayn, C., 1995. The information content of losses. Journal of Accounting and Economics 20:
125-153.
Hoshi, T., and A. K. Kashyap. 2001. Corporate Financing and Governance in Japan: The Road to the Future. Cambridge, Mass.: The MIT Press.
Jensen, M. C. 1986. Agency costs of free cash flow, corporate finance, and takeovers. American Economic Review 76: 323-329.
Kaplan, S.N., and B.A. Minton. 1994. Appointments of outsiders to Japanese boards: Determinants and implications for managers. Journal of Financial Economics 36: 225-258.
Klein, A., and C. Marquardt. 2006. Fundamentals of Accounting Losses, The Accounting
Review 81: 179-206.
Klein, A., and E. Zur. 2009. Entrepreneurial shareholder activism: Hedge funds and other private investors. Journal of Finance 64: 187-229.
LaPorta, R., F. Lopez-de-Silanes, A. Shleifer, and R.W. Vishny. 2000. Agency problems and dividend policies around the world. Journal of Finance 55: 1-33.
Larcker, D., S. Richardson, I. Tuna. 2007. Corporate governance, accounting outcomes, and organizational performance. The Accounting Review 82: 963-1008.
Milhaupt, C.J. 2006. Lost decade for Japanese corporate governance reform? What’s changed,
what hasn’t, and why. In: M. Blomstrom and S. LaCroix (eds.). Institutional Change in Japan. Routledge, 2006.
Morck, R., and M. Nakamura. 1999. Japanese corporate governance and macroeconomic
problems. Available at http://papers.ssrn.com/paper.taf?abstract_id=235758. Myers, S.C., and R.G. Rajan. 1998. The paradox of liquidity. Quarterly Journal of Economics
113: 733-771.

64
Opler, T., L. Pinkowitz, R. Stulz, and R. Williamson. 1999. The determinants and implications of corporate cash holdings. Journal of Financial Economics 52: 3-46.
Patrick, H. 2004. Evolving corporate governance in Japan. Unpublished paper. Columbia
Business School. February. Pinkowitz, L., R. Stulz, and R. Williamson. 2006. Does the contribution of corporate cash
holdings and dividends to firm value depend on governance? A cross-country analysis. Journal of Finance 61: 2725-2751.
Pinkowitz, L., and R. Williamson. 2001. Bank power and cash holdings: Evidence from Japan.
Review of Financial Studies 14: 1059-1082. Price, R., F.J. Roman, and B. Rountree. 2011. The impact of governance reform on
performance and transparency. Journal of Financial Economics 99: 76-96. Rajan, R.G., and L. Zingales. 1995. What do we know about capital structure? Some evidence
from international data. Journal of Finance 50: 1421-1460. Weinstein, D.E., and Y. Yafeh. 1998. On the costs of a bank centered financial system:
Evidence from the changing main bank relations in Japan. Journal of Finance 53: 635-672.