Embed Size (px)
Citation preview

Is Monetary Policy Too Complex for the Public? Evidence from the UK . Adriel Jost
SNB Working Papers 15/2017
DISCLAIMER The views expressed in this paper are those of the author(s) and do not necessarily represent those of the Swiss National Bank. Working Papers describe research in progress. Their aim is to elicit comments and to further debate. COPYRIGHT© The Swiss National Bank (SNB) respects all third-party rights, in particular rights relating to works protected by copyright (infor-mation or data, wordings and depictions, to the extent that these are of an individual character). SNB publications containing a reference to a copyright (© Swiss National Bank/SNB, Zurich/year, or similar) may, under copyright law, only be used (reproduced, used via the internet, etc.) for non-commercial purposes and provided that the source is menti-oned. Their use for commercial purposes is only permitted with the prior express consent of the SNB. General information and data published without reference to a copyright may be used without mentioning the source. To the extent that the information and data clearly derive from outside sources, the users of such information and data are obliged to respect any existing copyrights and to obtain the right of use from the relevant outside source themselves. LIMITATION OF LIABILITY The SNB accepts no responsibility for any information it provides. Under no circumstances will it accept any liability for losses or damage which may result from the use of such information. This limitation of liability applies, in particular, to the topicality, accuracy, validity and availability of the information. ISSN 1660-7716 (printed version) ISSN 1660-7724 (online version) © 2017 by Swiss National Bank, Börsenstrasse 15, P.O. Box, CH-8022 Zurich
Legal Issues

1
Is Monetary Policy Too Complex for the Public?Evidence from the UK
Adriel Jost∗
November 19, 2017
Central banks have increased their engagement in the information and edu-
cation of the broad public. But what can be said about the nonprofessional’s
knowledge of monetary policy and central banking? Based on the Bank of
England’s Inflation Attitudes Survey, I construct a score to capture the cen-
tral banking knowledge of the respondents. I show that the average British
person displays limited knowledge of central banking. At the same time, the
data reveal that satisfaction with the Bank of England’s policies increases with
a better understanding of monetary policy.
Keywords: Economic literacy; Monetary policy; Bank of England
JEL classification: D83, E52, E58, I21
∗University of St. Gallen and Swiss National Bank (SNB). Contact address: Laupenstrasse 18, 3003 Berne,[email protected]. I thank Monika Butler, Martin Brown, Till Ebner, Anna Faber, Rita Fleer, Niklas Potrafke,Nikola Mirkov, George Murphy, Manuel Walti and Martin Weder as well as seminar participants at the Universityof St. Gallen and the SNB for helpful comments. The views, opinions, findings and conclusions or recommen-dations expressed in this paper are strictly those of the author. They do not necessarily reflect the views of theSNB.
1

2
1 Introduction
Many central banks have enhanced their communication and information to the general public
over the past 20 years, for example, through educational programmes (Fluch, 2007). For the
Bank of England, it is a “key strategic objective” to build public understanding of and support
for price stability as well as the chosen approach to achieve this target (Bank of England, 2003).
Thus, central banks justify their educational efforts with the claim that people’s knowledge and
support of the central banks’ tasks and strategies increase the effectiveness of monetary policy.
Using a knowledge score based on data from the Bank of England’s Inflation Attitudes
Survey, this study addresses two questions related to the central banks’ efforts to inform and
educate the broad public. First, it provides evidence on how well informed the general public
actually is. Second, it examines the link between the public’s understanding and approval of the
central bank’s policies.
The main findings are that, first, knowledge among the British population is, on average,
rather limited. Concerning socio-demographic factors, the data show the importance of gender,
age, social class, income, education and housing tenure for the results. Second, satisfaction
with the Bank of England’s policy depends on the knowledge score. The less someone knows
about central banking, the less likely he or she will be satisfied with the institution.
British data are relevant for at least two reasons. First, due to the role of expectations,
the knowledge and support of the wider public is particularly important when a central bank
pursues an inflation target. The Bank of England was one of the first central banks to introduce
an inflation-targeting approach of this kind. Second, the country has its own currency. The
results are more universally valid than results for countries in a currency union, such as the
Euro area. In the case of a currency union, survey results regarding a national central bank
remain ambiguous because the national central bank does not pursue its own monetary policy.
This study adds to the growing literature covering the general public’s knowledge of central
banks. In general, it is poorly understood how nonprofessionals understand economic phe-
nomena (Leiser & Krill, forthcoming). The existing literature points to a rather low level of
2
3
knowledge of monetary policy and central banking. Binder (2017) concludes, based on survey
results from the 1950s until today, that the US public generally lacks knowledge of monetary
policy and central banks. Based on Dutch household survey data, van der Cruijsen, Jansen &
de Haan (2015) find that knowledge of the ECB’s objectives is rather poor. At the same time,
the households exhibit a lack of awareness of their limited knowledge and show little desire to
be better informed. Their study also shows that more-intensive use of information improves un-
derstanding and that better knowledge relates to people’s ability to formulate realistic inflation
expectations. Finally, Fluch, Fritzer & Rumler (2013) show for Austria that the level of public
knowledge of central banking proves to be rather limited. Only a third of the respondents knew
the ECB’s inflation target. Two-thirds were unable to assess the effects of deflation. The data
show that people’s education level strongly influences their knowledge about these subjects.
In a different approach, Drager, Lamla & Pfajfar (2015) use data from the Survey of Con-
sumers conducted by Thompson Reuters and the University of Michigan (“Michigan Survey”).
The results are somewhat more positive. They show that a substantial share of the respondents
have expectations that are consistent with the Fisher equation, the Taylor rule and the Philipps
curve. In addition, they argue that central bank communication improves people’s understand-
ing of these concepts. Similarly, Carvalho & Nechio (2014), also using data from the Survey of
Consumers, show that the extent of the understanding depends positively on the respondents’ in-
come and education levels. The results differ over the business cycle. During times of recession
and/or labour market weakness, the answers are more consistent with Taylor rule principles.
Concerning the relationship between knowledge and the satisfaction with and trust in central
banks, Kaltenthaler, Anderson & Miller (2010) show that lack of knowledge is an important
source of mistrust. Based on their own German database, Hayo & Neuenkirch (2014) come to
the same conclusion.
This paper also relates to the extensive literature on financial literacy. The literature review
by Lusardi & Mitchell (2014) shows the consistent influence of socio-demographic factors on
financial literacy. Specifically, it points to the hump-shaped life cycle profile (financial literacy
3
4
is the lowest among the young and the old) and a large gender gap (with women of all ages per-
forming worse). In addition, higher levels of income and education are associated throughout
the literature with higher levels of financial literacy. In a multi-country survey, OECD/INFE
(2013) gives further evidence of the described influence of socio-demographic factors, espe-
cially the gender gap.1 However, in a meta-study on the effects of financial literacy, Fernandes,
Lynch & Netemayer (2014) show that an increase in financial literacy has negligible effects
on financial behaviour. This paper shows that similar socioeconomic demographics that are
associated with general financial literacy are also associated with knowledge about monetary
policy.
The literature on expectation formation, especially on inflation expectations, is also closely
related to this paper. For example, based on evidence from a laboratory experiment, Burke &
Manz (2014) show that economic literacy influences inflation expectations. Based on the Bank
of England’s Inflation Attitudes Survey, Blanchflower & Kelly (2008) show the influence of
socio-demographic factors on inflation expectations. Individuals with higher age, income and
education believe that prices will rise at a slower pace than their younger, less educated and
affluent counterparts. They also present evidence (mainly based on high non-response rates)
that the public has low levels of knowledge regarding inflation developments.2
Finally, a vast body of literature on central bank transparency and communication exists.
However, most of the literature covers central banks’ communication with financial market
participants, as opposed to their communication with the general public (Blinder, Ehrmann,
Fratzscher, de Haan & Jansen, 2008).3 This paper helps to fill this gap by providing data on the
general public’s knowledge of the central banks’ goals and organisation.
The remainder of the paper is structured as follows. Section 2 provides details of the survey
1Regarding specific knowledge of economic policy, Blinder & Krueger (2004) show that economic status andpolitical involvement explain the differences in the literacy. In their study, gender only plays a comparably minorrole.
2In addition, Blanchflower & Kelly (2008) deduce low levels of knowledge from the high non-response rate tothe question about how satisfied the respondents are with the job the Bank of England is doing.
3Blinder et al. (2008) argue: “It may be time to pay some attention to communication with the general public.Admittedly, studying communication with the general public will pose new challenges to researchers – not leastbecause financial market prices will be less relevant. But the issues are at least as important. In the end, it is thegeneral public that gives central banks their democratic legitimacy, and hence their independence” (p. 941).
4
5
setup, the data and the knowledge score. Section 3 discusses the socio-demographic determi-
nants of the results, while section 4 describes the developments over time. Section 5 highlights
the relationship between the knowledge score and monetary policy preferences. Section 6 in-
vestigates the relationship between people’s knowledge of central banking and satisfaction with
the Bank of England’s policy. Finally, section 7 concludes.
2 Data
2.1 Survey
The Bank of England’s Inflation Attitudes Survey has been conducted since 2001.4 The quar-
terly survey mainly includes questions on the interest rates and inflation expectations. Once a
year, the survey also contains questions on the knowledge and understanding of the monetary
policy process. All questions have remained identical over the years. The market research in-
terviewers use Computer Assisted Personal Interviewing (CAPI) for the in-home face-to-face
interviews. The surveys are based on random location samples and are conducted in randomly
selected districts. Approximately 4,000 people aged 16 and over are questioned for each survey.
The design and weights of the sample reflect known population data on age, gender, social class
and region, so the sample is representative of all adults in Great Britain. Using a weighting
factor in the calculations does not lead to qualitatively different results throughout the analyses
of this paper. In total, I use 16 yearly surveys between 2001 and 2016. In total, the repeated
cross-section dataset comprises 63,478 individuals.
2.2 Knowledge questions
The basis of a knowledge score is knowledge questions in economic literacy surveys. Useful
questions cover observable, objective facts. Knowledge questions should not be confused with
attitude questions. If someone prefers low unemployment over low inflation, it reflects an at-
titude and not an inaccurate understanding of monetary policy. One should not assume a low
level of knowledge only because someone’s attitude differs from that of the central bank.4The surveys are carried out by GfK NOP.
5
6
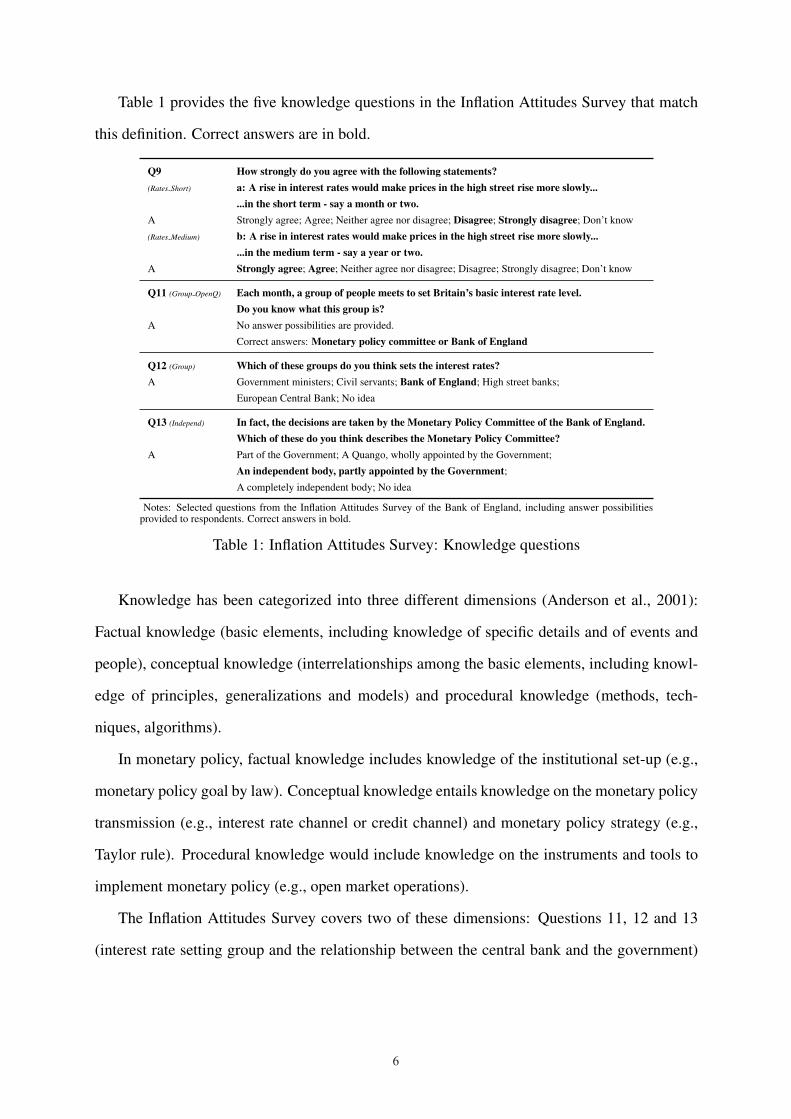
Table 1 provides the five knowledge questions in the Inflation Attitudes Survey that match
this definition. Correct answers are in bold.
Q9 How strongly do you agree with the following statements?(Rates Short) a: A rise in interest rates would make prices in the high street rise more slowly...
...in the short term - say a month or two.A Strongly agree; Agree; Neither agree nor disagree; Disagree; Strongly disagree; Don’t know
(Rates Medium) b: A rise in interest rates would make prices in the high street rise more slowly......in the medium term - say a year or two.
A Strongly agree; Agree; Neither agree nor disagree; Disagree; Strongly disagree; Don’t know
Q11 (Group OpenQ) Each month, a group of people meets to set Britain’s basic interest rate level.Do you know what this group is?
A No answer possibilities are provided.
Correct answers: Monetary policy committee or Bank of England
Q12 (Group) Which of these groups do you think sets the interest rates?A Government ministers; Civil servants; Bank of England; High street banks;
European Central Bank; No idea
Q13 (Independ) In fact, the decisions are taken by the Monetary Policy Committee of the Bank of England.Which of these do you think describes the Monetary Policy Committee?
A Part of the Government; A Quango, wholly appointed by the Government;
An independent body, partly appointed by the Government;A completely independent body; No idea
Notes: Selected questions from the Inflation Attitudes Survey of the Bank of England, including answer possibilitiesprovided to respondents. Correct answers in bold.
Table 1: Inflation Attitudes Survey: Knowledge questions
Knowledge has been categorized into three different dimensions (Anderson et al., 2001):
Factual knowledge (basic elements, including knowledge of specific details and of events and
people), conceptual knowledge (interrelationships among the basic elements, including knowl-
edge of principles, generalizations and models) and procedural knowledge (methods, tech-
niques, algorithms).
In monetary policy, factual knowledge includes knowledge of the institutional set-up (e.g.,
monetary policy goal by law). Conceptual knowledge entails knowledge on the monetary policy
transmission (e.g., interest rate channel or credit channel) and monetary policy strategy (e.g.,
Taylor rule). Procedural knowledge would include knowledge on the instruments and tools to
implement monetary policy (e.g., open market operations).
The Inflation Attitudes Survey covers two of these dimensions: Questions 11, 12 and 13
(interest rate setting group and the relationship between the central bank and the government)
6

7
require factual knowledge. Conceptual knowledge is needed to answer questions 9a and 9b (the
relationship between interest rates and prices). The survey does not include knowledge of the
Bank of England’s inflation goal, which is important to form inflation expectations. Neverthe-
less, the five questions cover a broad enough range to deduce the respondents’ knowledge of
central banking.
For each question, Table 2 includes the fraction of correct answers and the fraction of those
with no answer (“Don’t know” or “No idea”). A particularly high fraction could not provide an
answer to question 11. In contrast, question 12 is the only question that was correctly answered
by the majority of respondents. The difference between these two questions lies in the provided
answer possibilities. Question 11 is asked as an open question without answer possibilities,
while question 12 provides five options.
Question Fraction of correct answers Fraction of “Don’t knows”
Q9a: Rise in interest rates (short term) 0.22 0.23Q9b: Rise in interest rates (medium term) 0.38 0.24Q11: Interest rate setting group (open question) 0.39 0.53Q12: Interest rate setting group 0.67 0.13Q13: Description MPC: Independence 0.35 0.20
Notes: Fraction of those respondents who provided correct answers and fraction of those who provided the answer“Don’t know” to selected questions from the Inflation Attitudes Survey of the Bank of England (2001-2016).
Table 2: Knowledge questions: Fraction of correct answers and fraction of “Don’t know”s
Correlation among the correct answers to the five questions is low (Table 3). While the
answers to questions 11 and 12 exhibit the highest correlation, even this correlation is below
0.5. The answers to question 9a are slightly negatively correlated with those in question 9b,
due to respondents making no distinction between the consequences of interest rate hikes in the
short and long term, resulting in one correct and one wrong answer.
Because of the low correlation among the correct answers, there is little redundancy in the
data. In a principal component analysis among the correct answers, even the fifth factor explains
10% of the variation (Table 4).
7

8
Q9a Q9b Q11 Q12 Q13
Q9a (Rates Short) 1Q9b (Rates Medium) -0.05 1Q11 (Group OpenQ) 0.09 0.07 1Q12 (Group) 0.10 0.11 0.48 1Q13 (Independ) 0.06 0.09 0.11 0.20 1
Notes: Correlation among correct answers to selected questions(Q9, Q11, Q12, Q13) from the Inflation Attitudes Survey of theBank of England (2001-2016).
Table 3: Knowledge questions: Correlation table
Eigenvalue Proportion explained Cumulative proportion explained
Factor 1 1.63 0.33 0.33Factor 2 1.05 0.21 0.54Factor 3 0.94 0.19 0.72Factor 4 0.87 0.17 0.90Factor 5 0.51 0.10 1.00
Notes: Results based on a principal component analysis among correct answers to selectedquestions (Q9, Q11, Q12, Q13) from the Inflation Attitudes Survey of the Bank of England(2001-2016).
Table 4: Knowledge questions: Principal component analysis
2.3 Score
The literature on composite indicators widely discusses different weighting methodologies. Of-
ten, they come to the conclusion that equal weights ”remain least objectionable” (Sharpe &
Andrews, 2012). Other methodologies might be technically and mathematically more reward-
ing, but they usually lack any intuition, which makes it difficult to defend them. Thus, the
simplest but also the most promising way to construct the knowledge score is to take the sum
of all correctly answered knowledge questions from the Inflation Attitudes Survey for each re-
spondent. Not answering a question correctly or claiming to be unable to answer at all leads to
zero points in a question. Answering each question correctly leads to a maximum of 5 points.
For robustness tests, I include an alternative measure based on the loadings of the principal
component analysis.5 The decision about how many factors should be used usually depends on
the following criteria: (1) the Eigenvalues (above 1), (2) the variance explained (at least 70%
or 80%), (3) the scree test (breaks in a linear display of the Eigenvalues), and (4) the loadings
(interpretation of content). The criteria are thereby somewhat arbitrary and do not need to be
5The appendix includes a third knowledge score, based on equally weighted conceptual (Questions 9a and 9b)and a factual knowledge score (Question 11, 12 and 13). Its development is very similar to the two other knowledgescores.
8

9
followed strictly.
According to the first criterion, factor 5 should be dropped because its Eigenvalue is clearly
below 1. Factors 3 and 4 only marginally fail this criterion and thus do not need to be dropped.
Applying the second criterion in its strong version, factors 3 and 4 should be used. These
factors should also be included according to the scree test, which displays breaks after the first
and fourth factors (see Figure 5 in the appendix). The loadings in Table 5 reveal that factors 1
and 2 capture questions 11 and 12 and 9a and 9b, respectively. Factor 3 depends on different
questions, but mostly on question 13. Thus, the first three factors cover all questions and should
be used according to this criterion. In summary, factors 1, 2 and 3 should be taken into account.
Factor 5 should not be used. The decision about factor 4 is less straightforward. The stronger
version of the variance explanation criterion as well as the scree test speak in favour of this
factor, while the other criteria are not clearly against using it. Hence, I use four factors for the
knowledge score.
Factor 1 Factor 2 Factor 3 Factor 4 Factor 5
Q9a (Rates Short) 0.26 -0.70 0.46 0.49 0.01Q9b (Rates Medium) 0.28 0.73 0.23 0.58 0.03Q11 (Group OpenQ) 0.77 -0.10 -0.40 0.00 0.48Q12 (Group) 0.82 -0.03 -0.22 -0.05 -0.52Q13 (Independ) 0.46 0.16 0.68 -0.53 0.10
Notes: Loadings based on a principal component analysis among the correctness to an-swers to selected questions (Q9, Q11, Q12, Q13) from the Inflation Attitudes Survey ofthe Bank of England.
Table 5: Knowledge questions: Loadings (principal component analysis)
Table 6 provides summary statistics for all important variables of the dataset, including the
knowledge score and its alternative, monetary policy attitudes and satisfaction with the Bank of
England’s policy and several socio-demographic factors.
The overall results according to the two alternative knowledge scores confirm a rather low
central banking knowledge. For the knowledge score based on equally weighted questions,
the mean of the total sample is 2.00. Only 1.5% of the respondents answered all questions
correctly; 15% of the respondents did not give any correct answer. Almost 30 percent of the
respondents provided two correct answers. The mean of the PCA-based knowledge score is
9

10
Variables Observations Mean Std. dev. Knowledge score
Knowledge score 63478 2.00 1.29
Knowledge score (PCA) 63478 1.52 1.11
Inflation target preferences 53917 0.62 0.491 = Is too high (lower) 13382 (24.8%) 1.842 = About right 33212 (61.6%) 2.233 = Is too low (higher) 7322 (13.6%) 2.35
Inflation aversion 48446 0.21 0.41Higher interest rates = 0 38054 (78.5%) 2.20Higher inflation = 1 10392 (21.4%) 2.25
Satisfaction with BoE 56512 3.39 1.011 = Very dissatisfied 3570 (6.3%) 1.722 = Fairly dissatisfied 6358 (11.3%) 1.943 = Neither dissatisfied/satisfied 15895 (28.1%) 1.784 = Fairly satisfied 25805 (45.7%) 2.405 = Very satisfied 4884 (8.7%) 2.63
Age category 63478 3.69 1.701 = 15-24 7945 (12.5%) 1.382 = 25-34 10969 (17.3%) 1.823 = 35-44 11277 (17.8%) 2.124 = 45-54 10087 (15.9%) 2.255 = 55-64 8883 (14.0%) 2.306 = 65+ 14317 (22.5%) 2.03
Gender 63478 0.54 0.500 = Male 29353 (46.2%) 2.291 = Female 34125 (53.7%) 1.76
Social class 63478 2.71 1.121 = AB 11736 (18.5%) 2.592 = C1 16957 (26.7%) 2.223 = C2 12984 (20.5%) 1.974 = DE 21801 (34.3%) 1.54
Employment status 63478 0.51 0.500 = Working 30825 (48.6%) 2.181 = Not working 32653 (51.4%) 1.83
Income category 33739 2.62 1.201 = <9500 8313 (24.6%) 1.622 = 9500-17499 8402 (24.9%) 2.013 = 17500-24999 4912 (14.6%) 2.334 = >25000 12112 (35.9%) 2.59
Education level 61764 1.96 0.701 = Low (GCSE) 16460 (26.7%) 1.712 = Medium (A-Level) 31239 (50.1%) 1.973 = High (Uni) 14065 (22.8%) 2.46
Housing tenure 63478 2.31 1.111 = Owned outright 18623 (29.4%) 2.262 = Mortgage 20449 (32.2%) 2.313 = Rent 10621 (16.7%) 1.424 = Other 13784 (21.7%) 1.63
Notes: The dataset is based on the Q1 editions from the Inflation Attitudes Survey of the Bank ofEngland (2001-2016).
Table 6: Inflation Attitudes Survey: Summary statistics
10
11
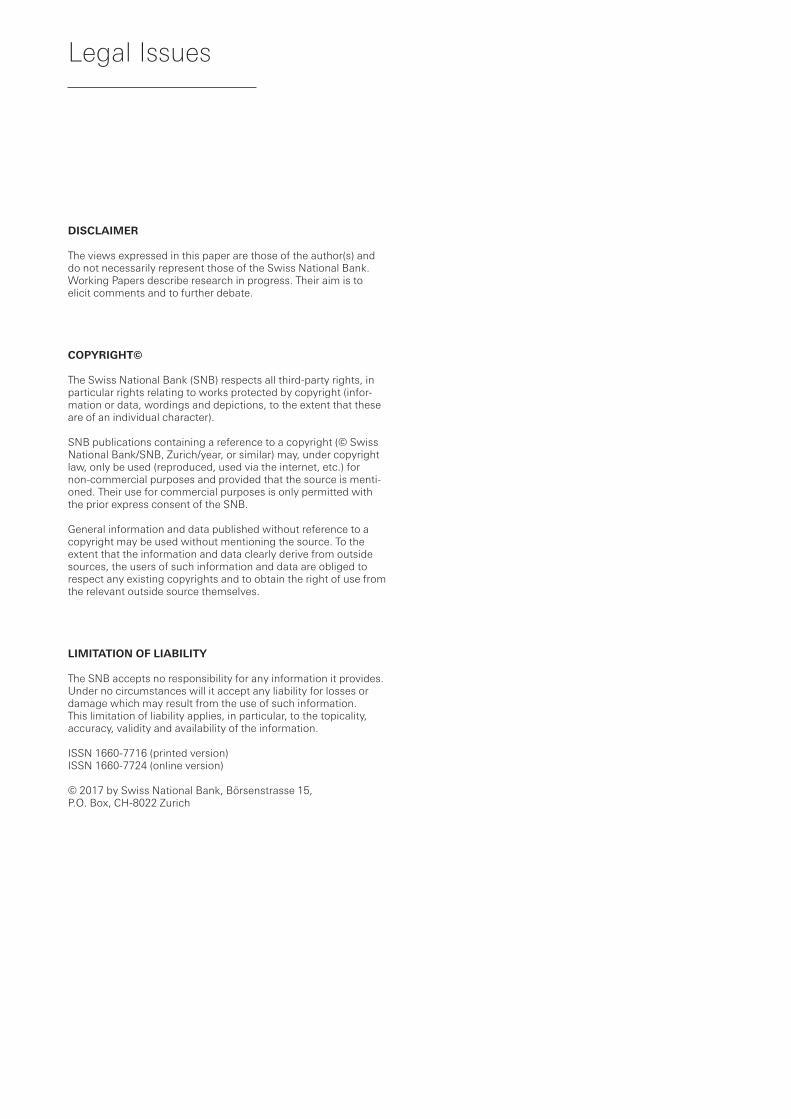
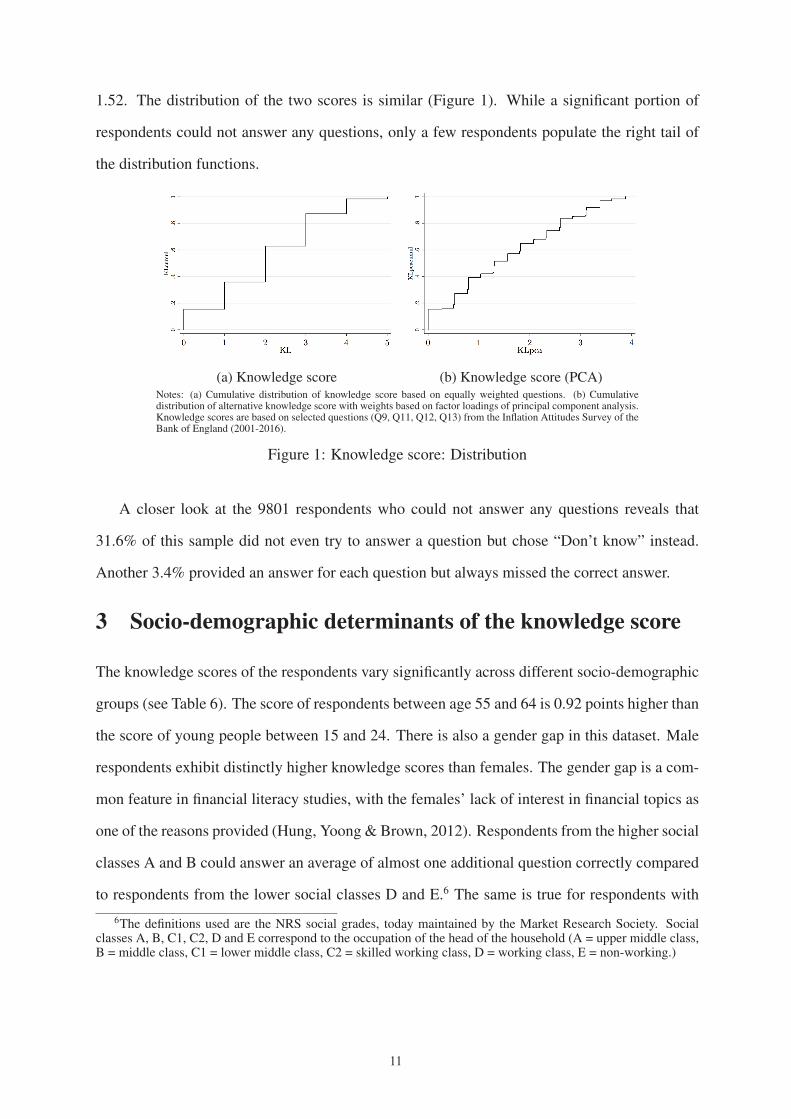
1.52. The distribution of the two scores is similar (Figure 1). While a significant portion of
respondents could not answer any questions, only a few respondents populate the right tail of
the distribution functions.
(a) Knowledge score (b) Knowledge score (PCA)Notes: (a) Cumulative distribution of knowledge score based on equally weighted questions. (b) Cumulativedistribution of alternative knowledge score with weights based on factor loadings of principal component analysis.Knowledge scores are based on selected questions (Q9, Q11, Q12, Q13) from the Inflation Attitudes Survey of theBank of England (2001-2016).
Figure 1: Knowledge score: Distribution
A closer look at the 9801 respondents who could not answer any questions reveals that
31.6% of this sample did not even try to answer a question but chose “Don’t know” instead.
Another 3.4% provided an answer for each question but always missed the correct answer.
3 Socio-demographic determinants of the knowledge score
The knowledge scores of the respondents vary significantly across different socio-demographic
groups (see Table 6). The score of respondents between age 55 and 64 is 0.92 points higher than
the score of young people between 15 and 24. There is also a gender gap in this dataset. Male
respondents exhibit distinctly higher knowledge scores than females. The gender gap is a com-
mon feature in financial literacy studies, with the females’ lack of interest in financial topics as
one of the reasons provided (Hung, Yoong & Brown, 2012). Respondents from the higher social
classes A and B could answer an average of almost one additional question correctly compared
to respondents from the lower social classes D and E.6 The same is true for respondents with6The definitions used are the NRS social grades, today maintained by the Market Research Society. Social
classes A, B, C1, C2, D and E correspond to the occupation of the head of the household (A = upper middle class,B = middle class, C1 = lower middle class, C2 = skilled working class, D = working class, E = non-working.)
11
12
an income of over 25’000 pounds compared to respondents with lower income. Employment
status is also associated with different knowledge scores, with a lower knowledge score of those
not working, although the effect is comparably small. Not surprisingly, education also seems
to have a positive influence on the knowledge score. Finally, homeowners are better informed
than others. Interestingly, only a small difference between mortgage owners and those who own
the house outright emerges. Because mortgage owners have more incentives to follow interest
rate developments, their higher knowledge score could have been expected to be higher. One
explanation could be that those who own the house outright were mortgage owners before they
redeemed it. In addition, homeowners without a mortgage also have incentives to monitor in-
terest rate developments, because house prices and investments outside the real estate market
also depend on interest rates. This incentive might be less distinct in cases where the house was
inherited.
Of the available socio-demographic attributes provided by the survey, one factor seems to
play only a minor role: regional origin. Almost no difference can be detected in the average
knowledge score of the respondents in different regions.
To extract the influence of single determinants of people’s knowledge of central banking, I
use the following linear regression equation:
κi = α + β ∗ Xi + εi (1)
where κi is the knowledge score of individual i (based on equally weighted questions or weights
according to PCA, depending on the specification), α is a constant, Xi is a vector of respondent-
specific explanatory variables and dummies (age, gender, social class, employment status, in-
come, education, tenure, dummies for survey year and region), β is a vector of coefficients, and
εi is the error term.
Table 7 shows the results of the OLS regressions on different dependent variables. The
knowledge score based on equally weighted questions is a variable with possible integer out-
comes between 0 and 5. Thus, the knowledge score is a count variable. For such cases, Poisson
models can be useful. However, interpretation of the coefficients is easier if one uses a linear
12

13
model instead. The findings do not differ from those based on a Poisson model (see Table 15 in
the appendix).
In specifications (1a), (1b) and (1c), the basic knowledge score (equally weighted questions)
is the dependent variable. Specifications (2a) and (2b) were run on the alternative knowledge
score (weighted according to PCA). The differences between the results of the different knowl-
edge scores are small. Specification (1c) includes variables for the macroeconomic environ-
ment.7 While unemployment rates and, to a lesser degree, inflation rates have a statistically
significant influence, they only marginally alter the coefficients of the other variables. The
unemployment rate itself has a small negative influence on the knowledge score. A higher un-
employment rate is thus related to a lower knowledge score, in contrast to Carvalho & Nechio
(2014). Similarly, a lower inflation rate (i.e., during a crisis) is negatively correlated with the
knowledge score.
The influence of age, gender, social class, employment status, income, education and hous-
ing tenure are statistically significant.8 In general, the results fit very well with the results of
existing studies in monetary policy and financial literacy. I discuss the economic significance
of the results according to specification (1b).
Older people are generally better informed than younger people (similar to van der Cruijsen
et al., 2015, OECD/INFE, 2013). However, literacy is lower again among people aged 65 and
older (this common life cycle profile in financial literacy is called “hump-shaped” in Lusardi &
Mitchell, 2014). Controlling for other attributes, people between 55 and 64 have a 0.85 point
higher knowledge score than those aged between 15 and 24.
Concerning gender, being female is associated with a 0.48 point lower knowledge score.
This gender gap is similar to that of van der Cruijsen et al. (2015). Gender differences
are usually less significant after controlling for socio-economic conditions, but they still ex-
ist (OECD/INFE, 2013 and Lusardi & Mitchell, 2014 for further discussion).9 Regressions for
7The survey is conducted at the beginning of a year. The corresponding unemployment and inflation rates arebased on yearly values from the year before.
8Multicollinearity is not an issue. No variance inflation factors (VIFs) above 5 are reported.9Including interaction terms in the model to capture correlations of gender with other socio-demographic factors
13

14
Independent variables (1) Score (2) Score: PCA(1a) (1b) (1c) (2a) (2b)
Coefficients
Age25-34 0.33*** 0.26*** 0.26*** 0.18*** 0.12**
(0.018) (0.018) (0.018) (0.017) (0.017)35-44 0.57*** 0.49*** 0.49*** 0.30*** 0.23***
(0.018) (0.018) (0.018) (0.017) (0.017)45-54 0.71*** 0.63*** 0.63*** 0.36*** 0.29***
(0.019) (0.019) (0.019) (0.017) (0.017)55-64 0.85*** 0.77*** 0.77*** 0.42*** 0.35***
(0.020) (0.020) (0.020) (0.018) (0.018)65+ 0.72*** 0.65*** 0.65*** 0.32*** 0.27***
(0.020) (0.020) (0.020) (0.019) (0.019)GenderFemale -0.48*** -0.47*** -0.47*** -0.32*** -0.31***
(0.009) (0.009) (0.009) (0.009) (0.009)Social classAB 0.53*** 0.46*** 0.47*** 0.34*** 0.29***
(0.016) (0.017) (0.017) (0.015) (0.015)C1 0.39*** 0.36*** 0.36*** 0.25*** 0.23***
(0.014) (0.014) (0.014) (0.012) (0.012)C2 0.18*** 0.16*** 0.16*** 0.12*** 0.11*
(0.014) (0.014) (0.014) (0.013) (0.013)Employment statusNot working -0.09*** -0.05*** -0.06*** -0.07*** -0.05***
(0.012) (0.012) (0.012) (0.011) (0.011)Income9500-17499 0.13*** 0.12*** 0.08***
(0.018) (0.018) (0.014)17500-24999 0.23*** 0.22*** 0.14***
(0.022) (0.021) (0.020)>25000 0.26*** 0.25*** 0.17***
(0.021) (0.019) (0.018)Not known -0.10*** -0.10*** -0.12***
(0.015) (0.015) (0.014)EducationMedium (A-Level) 0.28*** 0.26*** 0.25*** 0.16*** 0.14***
(0.012) (0.012) (0.012) (0.011) (0.011)High (degree) 0.49*** 0.47*** 0.46*** 0.27*** 0.26***
(0.016) (0.016) (0.016) (0.015) (0.015)Housing tenureOwned outright 0.39*** 0.39*** 0.40*** 0.25*** 0.26***
(0.016) (0.016) (0.016) (0.015) (0.015)Mortgage 0.47*** 0.43*** 0.44*** 0.30*** 0.28***
(0.016) (0.016) (0.016) (0.014) (0.014)Other 0.10*** 0.10*** 0.09*** 0.06*** 0.06***
(0.015) (0.015) (0.015) (0.014) (0.014)Unemployment -0.04***
(0.005)Inflation 0.02***
(0.005)Fixed effects Year, region Year, region Region Year, region Year, region
Constant 0.93*** 1.08*** 1.28*** 0.98*** 1.07***(0.029) (0.031) (0.035) (0.027) (0.029)
R squared 0.21 0.22 0.22 0.11 0.12
Observations 61764 61764 61764 61764 61764
Notes: Dataset is based on the Inflation Attitudes Survey of the Bank of England (2001-2016). Co-efficients are based on linear regressions. Significance level: *** = 1%, ** = 5% , * = 10%. Robuststandard errors in parentheses. Dependent variables: (1) Knowledge score based on equally weightedquestions; (2) Knowledge score based on weights according to PCA. Reference categories: Age: 15-24;Gender: Male; Class: DE; Employment status: Working; Income: <9500; Education: Low (GCSE)<40; Tenure: Rent. Unemployment and inflation data are used with a time lag of one year (example:figures from 2000 for 2001 survey data).
Table 7: Knowledge score and sociodemographic factors: Estimation results
14

15
each year show that the coefficient for gender has decreased slightly since 2001. The gender
gap has been closing slightly.
Being in the highest social classes A or B increases the respondents’ knowledge score by
0.53 points, compared to members of the lowest social classes D and E, again controlling for
other attributes (van der Cruijsen et al., 2015 present a similar outcome). The effect is thus
similar to the effect of gender.
Higher income correlates with a better understanding (similar to Carvalho & Nechio, 2014).
The knowledge score of persons with an income between 17’500 and 25’000 pounds is 0.26
points higher than that of persons with an income of less than 9’500 pounds. Social class and
income may correlate with interest in monetary policy and thus lead to higher knowledge scores.
The income effect is somewhat lower than the effects of age, gender and social class. Excluding
income (columns 1a and 2a) does not qualitatively change the results, but the omission increases
the coefficients of the variables age, social class and education, due to the correlation of these
variables with income.10
Being employed is associated with a higher knowledge score. The coefficient of unemploy-
ment status becomes insignificant if the reported income is excluded from the model, due to the
high correlation with the income variable (see Table 14 in the appendix).
A higher education level is also associated with a higher knowledge score (in line with
Carvalho & Nechio, 2014, Fluch et al., 2013 and Lusardi & Mitchell, 2014). A university
degree increases the knowledge score by 0.47 points.
Finally, homeowners (who either own the house outright or bought it through a mortgage)
are better informed than those who rent their house or apartment. The coefficient of those
who own the house through a mortgage is slightly higher, at 0.43. The difference is small, but
statistically significant.
In summary, a male, who is around 60 years old, owns a house, belongs to social classes A
does not increase the level of explanation.10Table 14 in the appendix provides regression results for two different samples: one for those respondents who
did not provide income data and one for only those who did provide. The results differ only slightly.
15
16
or B, has a university degree and an income above 25’000 pounds has an expected knowledge
score of 3.45 (according to specification 1b). In contrast, a female around 20 years old who
rents an apartment and belongs to social classes D or E, has a GCSE level education and an
income below 9500 pounds has an expected knowledge score of 0.56.
The socio-demographic characteristics of the respondents who answered “Don’t know” dif-
fer from those who tried but failed to provide correct answers. Young female respondents with
low education and income and belonging to lower social classes were less likely to provide
an answer. The results above thus overestimate somewhat the effects of socio-demographic
characteristics on knowledge. They also partly reflect the fact that the same socio-demographic
characteristics play a role in the likelihood of answering. It is thereby impossible to differentiate
between the respondents who provided a correct answer by knowledge and those who answered
correctly by chance. In any case, the effects of socio-demographic characteristics are still highly
statistically significant after excluding all respondents who did not provide answers.
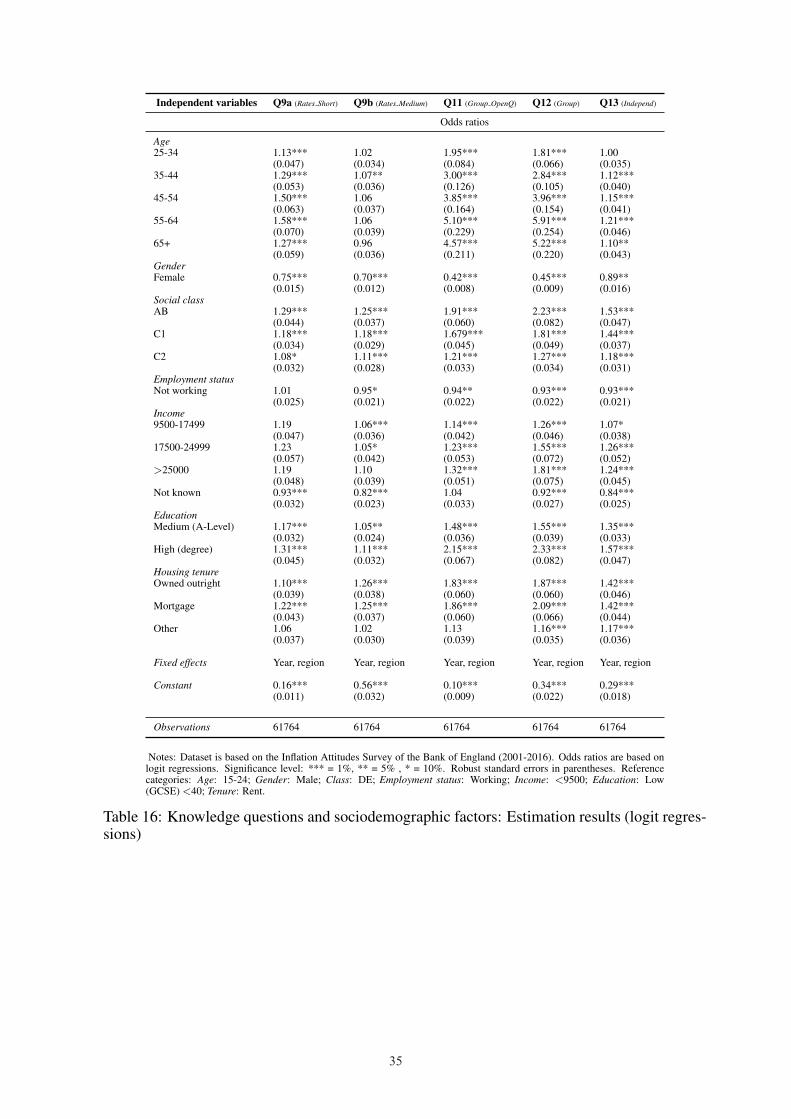
Table 8 presents regressions on single questions.11 Several differences emerge. While the R
squared for questions 11 (Group OpenQ) and 12 (Group) is comparably large at 0.16 and 0.19,
respectively, the explanatory factors only play a minor role in explaining the other questions.
The gender gap is especially large for questions 11 and 12. Generally, socio-demographic fac-
tors seem to have less influence on the knowledge differences in the conceptual questions (Q9a:
Rates Short and Q9b: Rates Medium) and in the question on the independence of the central
bank (Q13: Independ). One reason for these differences might be that random guessing is more
prevalent in the multiple-choice questions, leading to less-predictable results. In contrast, ran-
dom guessing is not possible when answering open question 11, while question 11 might have
had an influence on answering the corresponding question 12.
11For better comparability to the previous results, I use OLS regressions. Results stemming from logit modelsdo not lead to other conclusions; see Table 16 in the appendix.
16

17
Independent variables Q9a (Rates Short) Q9b (Rates Medium) Q11 (Group OpenQ) Q12 (Group) Q13 (Independ)
Coefficients
Age25-34 0.02*** 0.01 0.10*** 0.14*** 0.00
(0.006) (0.008) (0.006) (0.007) (0.007)35-44 0.04*** 0.02** 0.18*** 0.23*** 0.03***
(0.006) (0.008) (0.006) (0.007) (0.007)45-54 0.07*** 0.01 0.24*** 0.28*** 0.03***
(0.007) (0.008) (0.007) (0.007) (0.008)55-64 0.08*** 0.01 0.30*** 0.35*** 0.04***
(0.007) (0.008) (0.007) (0.008) (0.008)65+ 0.04*** -0.01 0.27*** 0.34*** 0.02**
(0.007) (0.008) (0.007) (0.008) (0.008)GenderFemale -0.05*** -0.08*** -0.18*** -0.14*** -0.02**
(0.003) (0.004) (0.004) (0.003) (0.004)Social classAB 0.05*** 0.05*** 0.14*** 0.14*** 0.10***
(0.006) (0.007) (0.006) (0.006) (0.007)C1 0.03*** 0.04*** 0.10*** 0.12*** 0.08***
(0.005) (0.005) (0.005) (0.005) (0.005)C2 0.01 0.02*** 0.03*** 0.06*** 0.03***
(0.005) (0.006) (0.005) (0.005) (0.005)Employment statusNot working 0.00 -0.01** -0.01** -0.02*** -0.01***
(0.004) (0.005) (0.005) (0.005) (0.005)Income9500-17499 0.03*** 0.01* 0.03*** 0.05*** 0.02**
(0.006) (0.008) (0.007) (0.007) (0.007)17500-24999 0.04*** 0.01 0.04*** 0.08*** 0.06***
(0.006) (0.009) (0.007) (0.008) (0.009)>25000 0.03*** 0.03*** 0.06*** 0.09*** 0.05***
(0.007) (0.008) (0.009) (0.007) (0.008)Not known -0.01** -0.04*** 0.00 -0.01** -0.03***
(0.005) (0.006) (0.006) (0.006) (0.006)EducationMedium (A-Level) 0.03*** 0.01** 0.08*** 0.08*** 0.06***
(0.004) (0.005) (0.005) (0.005) (0.005)High (degree) 0.05*** 0.02*** 0.16*** 0.14*** 0.10***
(0.006) (0.007) (0.006) (0.006) (0.007)Housing tenureOwned outright 0.01** 0.05*** 0.12*** 0.14*** 0.07***
(0.006) (0.007) (0.006) (0.006) (0.006)Mortgage 0.03*** 0.05*** 0.12*** 0.16*** 0.07***
(0.006) (0.007) (0.006) (0.006) (0.006)Other 0.01 0.00 0.02 0.04*** 0.03***
(0.005) (0.006) (0.006) (0.006) (0.006)
Fixed effects Year, region Year, region Year, region Year, region Year, region
Constant 0.14*** 0.36*** 0.08*** 0.32*** 0.23***(0.011) (0.013) (0.012) (0.013) (0.013)
R squared 0.02 0.03 0.16 0.19 0.05
Observations 61764 61764 61764 61764 61764
Notes: Dataset is based on the Inflation Attitudes Survey of the Bank of England (2001-2016). Coefficients are based onlinear regressions. Significance level: *** = 1%, ** = 5% , * = 10%. Robust standard errors in parentheses. Dependentvariables: Correct answers to single questions. Reference categories: Age: 15-24; Gender: Male; Class: DE; Employmentstatus: Working; Income: <9500; Education: Low (GCSE) <40; Tenure: Rent.
Table 8: Knowledge questions and sociodemographic factors: Estimation results
17
18
4 Historical development of the knowledge score
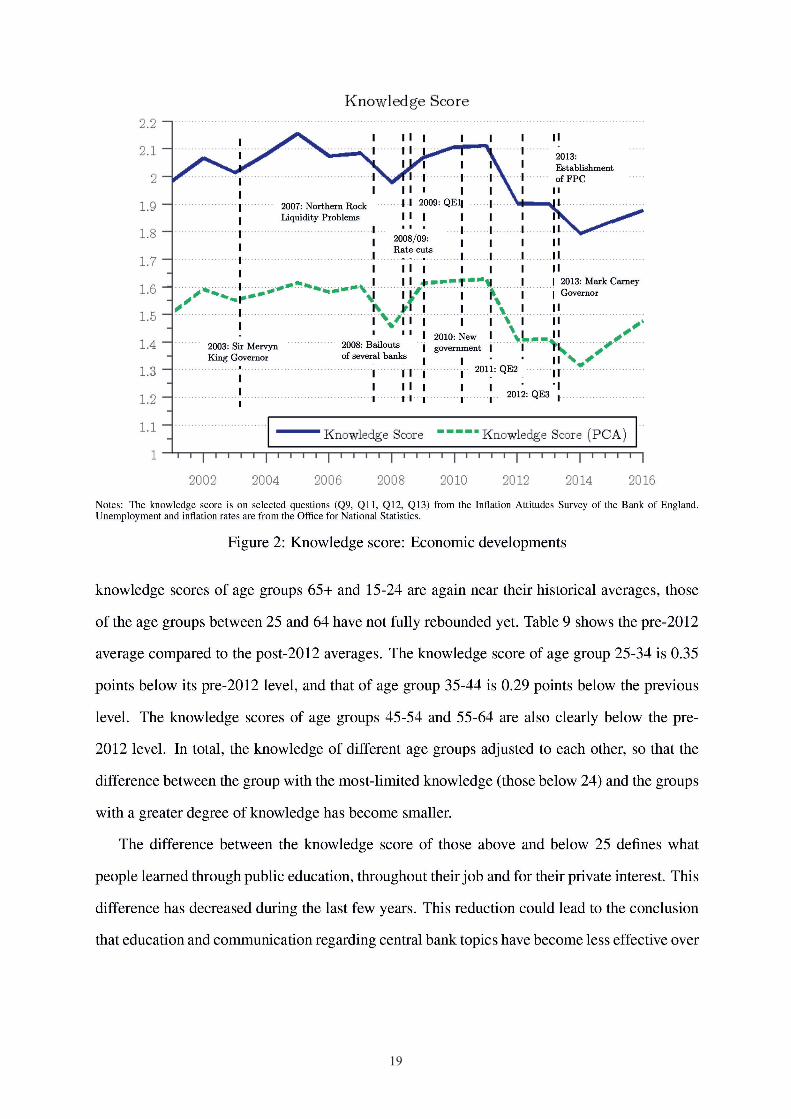
Since 2001, both knowledge scores have developed in similar ways (Figure 2). Until 2011, the
results were quite stable. Since then, a slight downward trend can be detected.12 However, the
trend stopped again in 2015. The downturn is not due to composition effects: The coefficients
of the year dummies in the regressions shown in Table 7 are significantly lower after 2012 than
before 2012.
Since 2001, several events that were important for the Bank of England and the British
financial sector took place. Carvalho & Nechio (2014) show that public understanding increases
during recessions and labour market downturns.13 The global financial crisis, including the
bailout of banks and unprecedented measures by the Bank of England, might have played a role
when the average knowledge score (based on equally weighted questions) slightly increased
from 1.98 in 2008 to 2.11 in 2011. At the same time, both the unemployment rate and inflation
increased. Overall, however, the knowledge score is negatively related to the unemployment
rate (as shown in the previous section).
How can this downturn since 2011 be explained? While all questions contributed to the
downturn, it is mainly driven by questions 9b (Rates Medium), 12 (Group) and 13 (Independ)
(see Figure 7 in the appendix). Regarding question 13, the rate of correct answers has not
completely recovered. The average respondent still knows less about the relationship between
the government and the central bank than before 2012.14 The changes in the government (in
2010) and the position of the governor (in 2013) might have had an influence on the the general
public’s perception of this relationship. However, the downturn since 2011 remains somewhat
puzzling, even if one considers various relevant events.
All age groups performed statistically significantly worse since 2011. It is thus useful to
take a closer look at the development of the different age groups’ knowledge scores. While the
12The 95% confidence interval is approximately +/- 0.04 points above/below the values. The downtrend is thusstatistically significant.
13The authors do not use any time lags to discuss the correlation between public understanding and recessions.14In particular, more respondents incorrectly answered that the central bank is a part of the government, and
more respondents did not have any answer.
18
19

20
Age group Knowledge score (averages)Total sample 2001-2011 2012-2016 Difference (pre-/past-2011)
15-24 1.38 1.41 1.33 -0.08***25-34 1.82 1.93 1.57 -0.35***35-44 2.10 2.19 1.91 -0.29***45-54 2.25 2.31 2.10 -0.22***55-64 2.30 2.36 2.18 -0.18***65+ 2.03 2.06 1.98 -0.08***
Notes: Average knowledge score (based on equally weighted questions) among different agegroups for the periods 2001-2016, 2001-2011, and 2012-2016 and the difference between thelatter two averages. Significance level: *** = 1%. The knowledge score is based on selectedquestions (Q9, Q11, Q12, Q13) from the Inflation Attitudes Survey of the Bank of England.
Table 9: Knowledge score: Age groups
the years. The sample period from 2001 to 2016 allows a comparison of the same cohorts over
a 10 years period. Figure 3 presents the average knowledge scores for the different age groups
in different years. The same cohorts in different years are connected with a line. For example,
the average knowledge score of the 15-24 age group in 2001 can be compared with that of the
25-34 age group in 2011. The results show that age groups 25-34 and 35-44 perform especially
worse 10 years later when the respondents’ age is 35-44 and 45-54, respectively. Excluding any
composition effects, it seems that the same questions became slightly less comprehensible on
average for the same sort of people.15 Of course, I cannot exclude that unknown factors related
to the survey realization led to lower knowledge rates after 2011.
5 The knowledge score as a determinant of attitudes
Does a higher knowledge score lead to attitudes that are more in line with those of the central
bank? The answer to this question represents a first step in the discussion on the link between
understanding monetary policy and approval of the central bank. Two additional questions in the
Bank of England Inflation Attitudes Survey help to answer this question (Table 10). Question 10
adresses the general attitudes towards monetary policy, whereas question 4 examines a specific
inflation target. Question 10 remains ambiguous because no exact figures are provided. If
inflation falls below the target rate, an inflation-targeting central bank would also prefer higher
prices. In contrast, question 4 explicitly asks for the support of the pursued inflation target of
15However, there is no similar trend downwards in “Don’t know”s.
20

21
Notes: Comparison of average knowledge scores (based on unweighted questions) for different age-related cohorts. Specifically, the averageknowledge score of age group 15-24 in 2001 is connected with that of age group 25-34 in 2011, etc. The knowledge score is based on selectedquestions (Q9, Q11, Q12, Q13) from the Inflation Attitudes Survey of the Bank of England.
Figure 3: Knowledge score: Cohorts since 2001
the central bank.
Q4 (Target) The government has set an inflation target of 2.0%. Do you think this target...A ...is too high?; ...or too low?; ...or about right?; No idea
Q10 (Aversion) If a choice had to be made, either to raise interest rates to try to keep inflation down;or keep interest rates down and allow prices in the shops to rise faster, which would you prefer:
A Interest rates to rise; Prices to rise faster; No idea
Notes: Selected questions from the Inflation Attitudes Survey of the Bank of England, including answer possibilitiesprovided to respondents.
Table 10: Inflation Attitudes Survey: Monetary policy attitude questions
Concerning question 10, most respondents (60%) preferred higher interest rates over higher
inflation. Only 16% of the respondents chose the opposite. Nearly one quarter (24%) could not
answer the question. In answer to question 4, the majority of respondents (52%) decided that
the inflation target of 2% is appropriate, 21% said that this inflation target is too high, and 12%
claimed that it is too low; 15% did not answer the question.
From the bivariate relationship, it remains unclear whether the respondents’ choice between
21

22
higher interest rates and higher inflation rates depends on their knowledge of central banking
(Table 6). Those who prefer higher inflation rates have a slightly higher knowledge score.
However, the difference is so small that this general question does not give a clear hint that
knowledge plays a role in attitudes. In contrast, the results regarding the inflation target prefer-
ences differ more. Those who prefer a lower inflation target exhibit a distinctively lower average
knowledge score. At the same time, those who prefer a higher target even have a slightly higher
knowledge score than those who agree with the current target. In other words, higher levels of
knowledge come, on average, with lower inflation aversion.
I use the following regression equation to test whether respondents’ knowledge scores have
an influence on their responses to the two questions about attitudes:
φi = α + β ∗ κi + γ ∗ Xi + εi (2)
where φi is the monetary policy preference of respondent i (based on Q4 or Q10, depending
on the specification), α is a constant, κi is the knowledge score (based on equally weighted
questions), Xi is a vector of respondent-specific control variables (age, gender, social class,
employment status, income, education, tenure and dummies for the survey year and region), β
is a coefficient, γ is a vector of coefficients, and εi is the error term.
As the dependent variable for question 10, I use a binary variable that equals 1 for those who
prefer higher inflation and 0 for those who prefer higher interest rates. Including the respon-
dents who did not have an answer would require the use of multinomial logistic regression (see
Table17 in the appendix for these results). The multinomial logistic regression on the answers
to question 4 show that those with a lower knowledge score prefer a lower target, and those with
a higher knowledge score prefer a higher target (see Table 18 in the appendix). The sizes of the
inflation target and knowledge scores are thus positively correlated, and the use of an ordered
variable for the inflation target (1 = too high, 2 = about right, 3 = too low) seems appropriate.
Alternatively, one could build a binary variable that equals 1 for those who agree with the Bank
of England’s target and 0 for those who do not agree (see Table 19 in the appendix for these
results). However, theses results are difficult to interpret because of the mutually cancelling
22
23
Independent variables (1) Higher inflation vs. higher interest rates (2) Inflation target(1a) (1b) (2a) (2b)
Coefficients
Knowledge score 0.01*** 0.00 0.07*** 0.04***(0.002) (0.001) (0.002) (0.002)
Age25-34 0.03*** 0.01
(0.079) (0.011)35-44 0.02** 0.06***
(0.080) (0.011)45-54 -0.02** 0.16***
(0.008) (0.011)55-64 -0.05*** 0.22***
(0.008) (0.012)65+ -0.06*** 0.23***
(0.008) (0.012)GenderFemale -0.02* -0.09***
(0.004) (0.005)Social classAB -0.01 0.08***
(0.007) (0.009)C1 -0.01** 0.06***
(0.005) (0.008)C2 -0.01 0.01
(0.006) (0.008)Employment statusNot working -0.03*** 0.00
(0.005) (0.007)Income9500-17499 0.00 0.01
(0.007) (0.011)17500-24999 0.00 0.00
(0.009) (0.012)>25000 -0.01 0.04***
(0.008) (0.011)Not known 0.00 0.00
(0.006) (0.009)EducationMedium (A-Level) -0.01 0.01
(0.005) (0.007)High (degree) -0.01 0.02**
(0.006) (0.009)Housing tenureOwned outright 0.01 0.04**
(0.006) (0.009)Mortgage 0.12*** 0.01
(0.006) (0.009)Other -0.02** 0.00
(0.006) (0.010)
Fixed effects - Year, region - Year, region
Constant 0.20*** 0.22*** 1.60***(0.004) (0.013) (0.018)
R squared 0.00 0.05 0.02 0.06
Observations 48446 47227 53916 52550
Notes: Dataset is based on the Inflation Attitudes Survey of the Bank of England (2001-2016). Coeffi-cients are based on linear regressions. Significance level: *** = 1%, ** = 5% , * = 10%. Robust standarderrors in parentheses. Dependent variables: Inflation vs. Interest rates: Preferences for higher interestrates = 0, preferences for higher inflation = 1. Inflation target: 1 = Too high, 2 = About right, 3 = Too low.Independent variable: Knowledge score: Equally weighted questions. Reference categories: Age: 15-24;Gender: Male; Class: DE; Employment status: Working; Income: <9500; Education: Low (GCSE) <40;Tenure: Rent
Table 11: Knowledge score and attitudes: Estimation results
23
24
effects concerning the knowledge score.
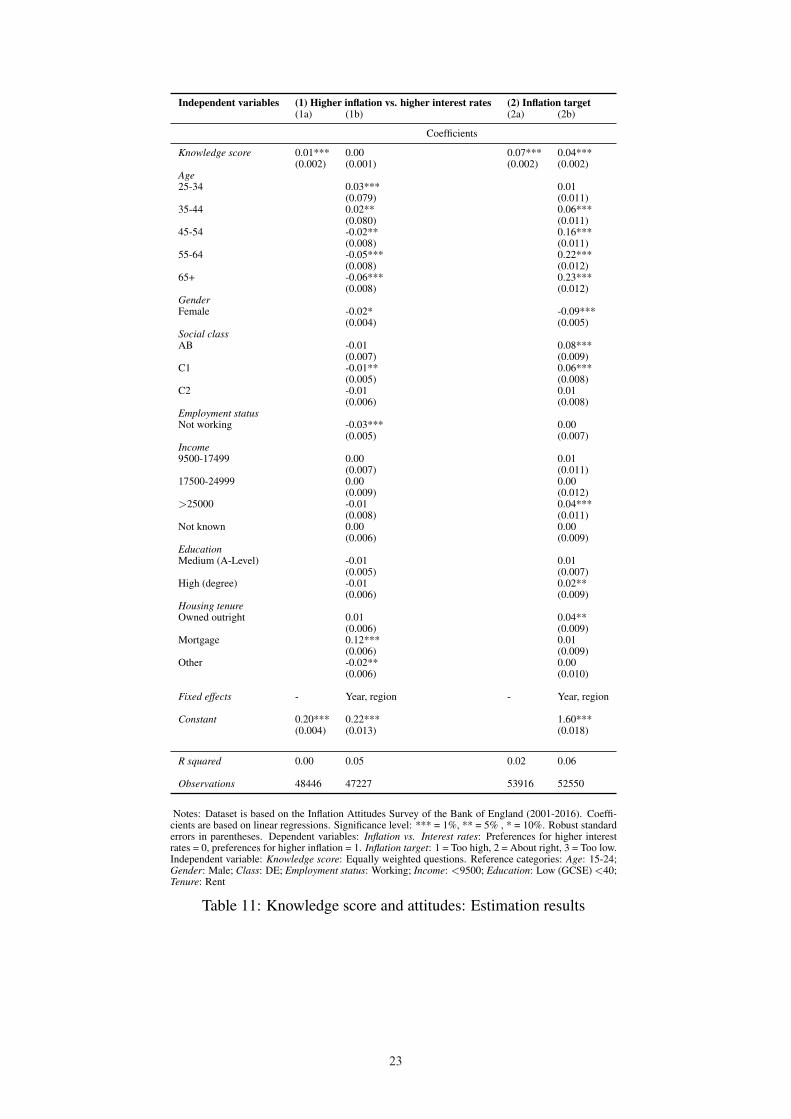
The results without control variables indicate that the respondents’ knowledge has a greater
influence on their preference for a specific inflation target than on their choice between higher
inflation or interest rates (columns 1a and 2a in Table 11). Including socio-demographic factors
as control variables lowers the influence of knowledge. The knowledge score is no longer sta-
tistically significant in the regression on the choice between higher inflation and interest rates
(column 1b). Socio-demographic factors directly influence the inflation aversion without rely-
ing on the knowledge score as a mediator. For example, respondents with debts (i.e., mortgage
owners) have a 12 percentage point higher probability of preferring higher inflation over higher
interest rates. The influence of age and employment status is also statistically significant (older
and unemployed persons prefer higher interest rates).
Concerning the inflation target preferences, the knowledge score remains statistically sig-
nificant, including when taking into account various control factors (column 2b). The effect
is rather small, however, as the maximum knowledge score increases the inflation target vari-
ables (which is defined as an ordered variable between 1 and 3) by only 0.20 points. Age has
the greatest influence among the control variables. Gender, social class and income also signifi-
cantly influence the inflation target preferences. Factors such as employment status and housing
tenure only play a subordinate role.16
In summary, the results of this section indicate that knowledge plays a role in the support
for the central bank. Respondents’ knowledge of central banking would appear to influence
inflation target preferences. Higher knowledge scores are thereby related to a preference that
is more in line with the actual target of the central bank. However, only those individuals
who prefer an inflation target lower than 2% exhibit a lower knowledge score. Thus, higher
knowledge scores seem first and foremost to be related to less inflation aversion. In addition,
the relationship between knowledge and the general attitude towards monetary policy measured
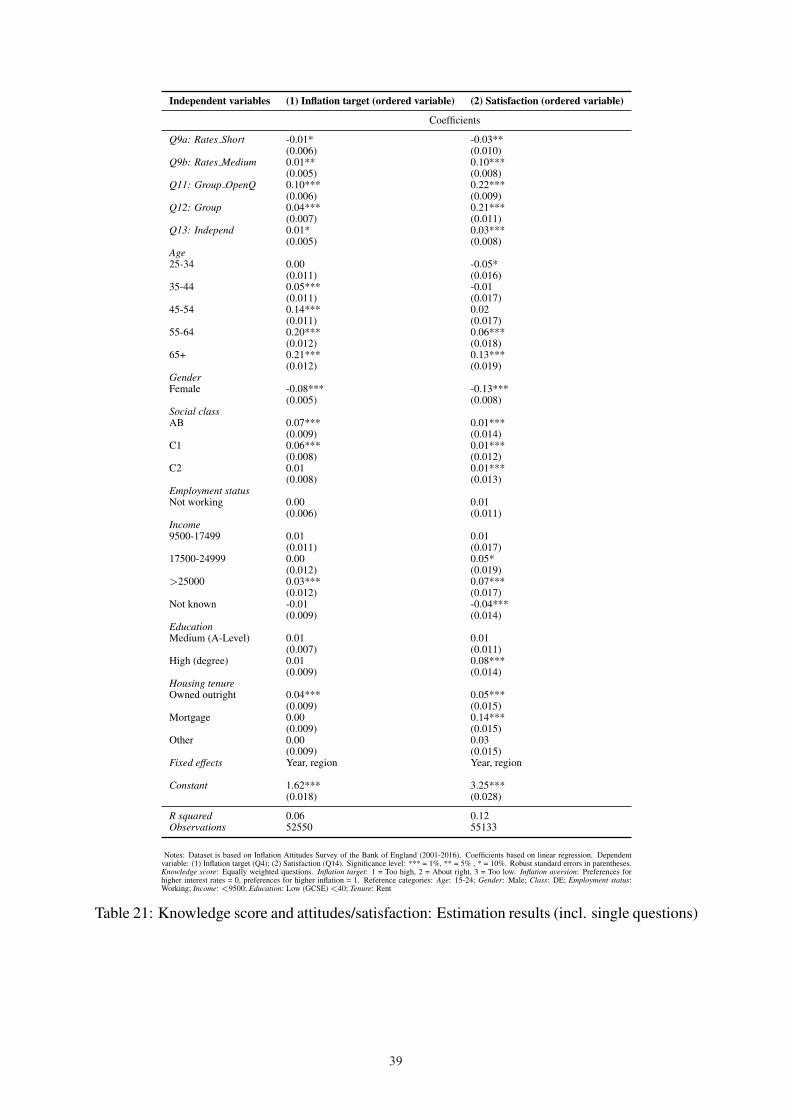
16In column (1) in Table 21 in the appendix, the single questions are used as explanatory variables instead ofthe knowledge score. It becomes clear that the results are mainly driven by questions 11 (Group OpenQ) and 12(Group). Knowledge related to factual questions seems more important for the inflation aversion than knowledgeof conceptual issues.
24
25
as a choice between higher inflation and higher interest rates remains ambiguous.
6 The knowledge score as a determinant of satisfaction
From a central bank’s perspective, a higher knowledge score should lead to a higher level of
satisfaction with its policies. The assumption is that well-informed nonprofessionals should
come to the same conclusion about the appropriateness of policies as the central bank. For a
central bank, public support is important because it increases the effectiveness of its measures
(e.g., Bank of England, 2003). Does a better understanding of central banking indeed lead to a
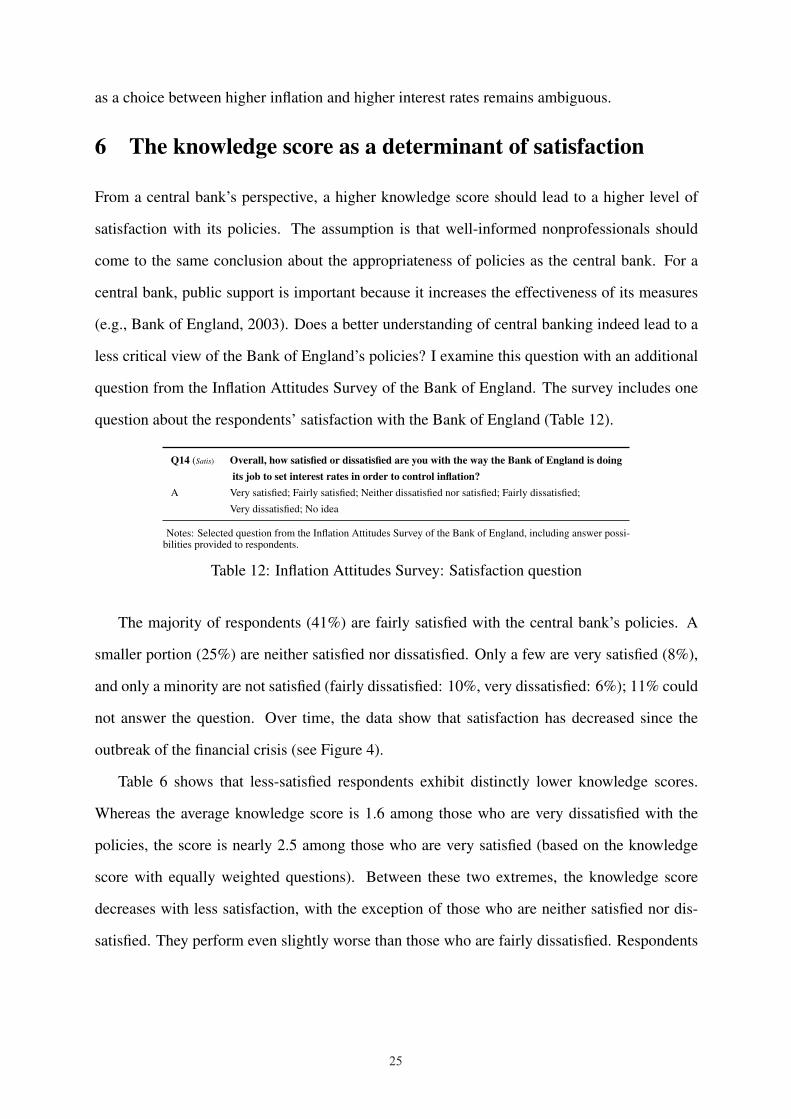
less critical view of the Bank of England’s policies? I examine this question with an additional
question from the Inflation Attitudes Survey of the Bank of England. The survey includes one
question about the respondents’ satisfaction with the Bank of England (Table 12).
Q14 (Satis) Overall, how satisfied or dissatisfied are you with the way the Bank of England is doingits job to set interest rates in order to control inflation?
A Very satisfied; Fairly satisfied; Neither dissatisfied nor satisfied; Fairly dissatisfied;
Very dissatisfied; No idea
Notes: Selected question from the Inflation Attitudes Survey of the Bank of England, including answer possi-bilities provided to respondents.
Table 12: Inflation Attitudes Survey: Satisfaction question
The majority of respondents (41%) are fairly satisfied with the central bank’s policies. A
smaller portion (25%) are neither satisfied nor dissatisfied. Only a few are very satisfied (8%),
and only a minority are not satisfied (fairly dissatisfied: 10%, very dissatisfied: 6%); 11% could
not answer the question. Over time, the data show that satisfaction has decreased since the
outbreak of the financial crisis (see Figure 4).
Table 6 shows that less-satisfied respondents exhibit distinctly lower knowledge scores.
Whereas the average knowledge score is 1.6 among those who are very dissatisfied with the
policies, the score is nearly 2.5 among those who are very satisfied (based on the knowledge
score with equally weighted questions). Between these two extremes, the knowledge score
decreases with less satisfaction, with the exception of those who are neither satisfied nor dis-
satisfied. They perform even slightly worse than those who are fairly dissatisfied. Respondents
25

26
27
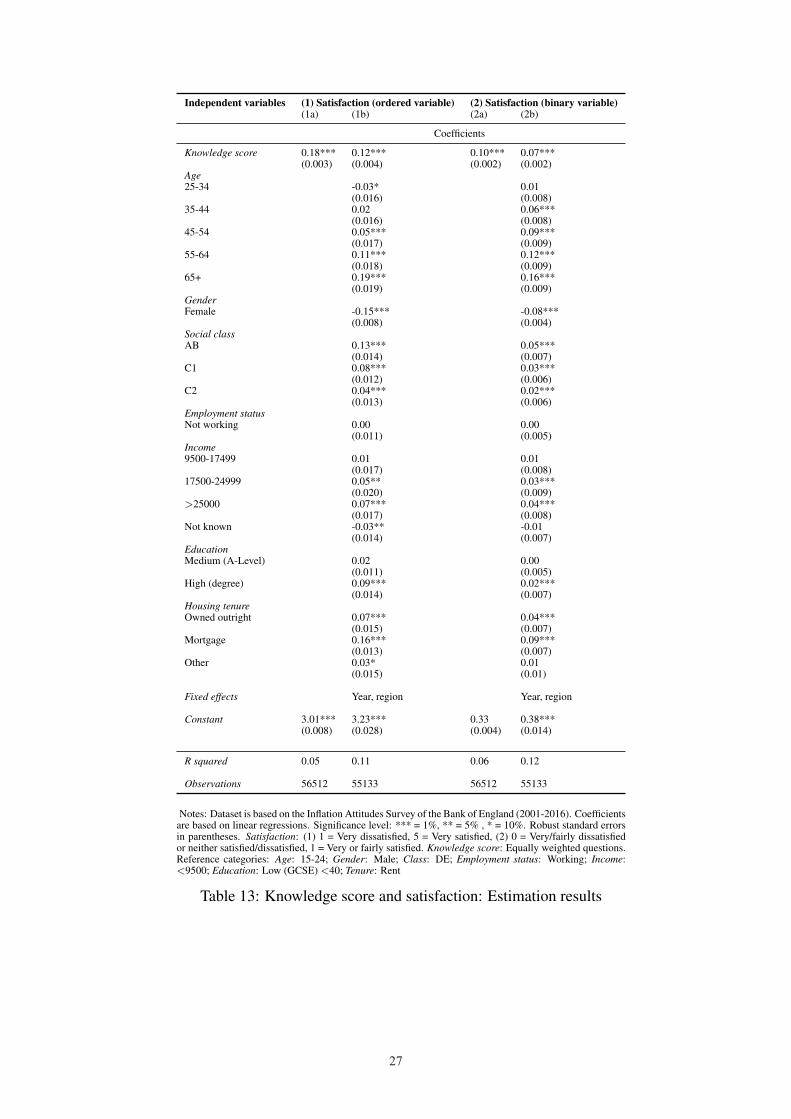
Independent variables (1) Satisfaction (ordered variable) (2) Satisfaction (binary variable)(1a) (1b) (2a) (2b)
Coefficients
Knowledge score 0.18*** 0.12*** 0.10*** 0.07***(0.003) (0.004) (0.002) (0.002)
Age25-34 -0.03* 0.01
(0.016) (0.008)35-44 0.02 0.06***
(0.016) (0.008)45-54 0.05*** 0.09***
(0.017) (0.009)55-64 0.11*** 0.12***
(0.018) (0.009)65+ 0.19*** 0.16***
(0.019) (0.009)GenderFemale -0.15*** -0.08***
(0.008) (0.004)Social classAB 0.13*** 0.05***
(0.014) (0.007)C1 0.08*** 0.03***
(0.012) (0.006)C2 0.04*** 0.02***
(0.013) (0.006)Employment statusNot working 0.00 0.00
(0.011) (0.005)Income9500-17499 0.01 0.01
(0.017) (0.008)17500-24999 0.05** 0.03***
(0.020) (0.009)>25000 0.07*** 0.04***
(0.017) (0.008)Not known -0.03** -0.01
(0.014) (0.007)EducationMedium (A-Level) 0.02 0.00
(0.011) (0.005)High (degree) 0.09*** 0.02***
(0.014) (0.007)Housing tenureOwned outright 0.07*** 0.04***
(0.015) (0.007)Mortgage 0.16*** 0.09***
(0.013) (0.007)Other 0.03* 0.01
(0.015) (0.01)
Fixed effects Year, region Year, region
Constant 3.01*** 3.23*** 0.33 0.38***(0.008) (0.028) (0.004) (0.014)
R squared 0.05 0.11 0.06 0.12
Observations 56512 55133 56512 55133
Notes: Dataset is based on the Inflation Attitudes Survey of the Bank of England (2001-2016). Coefficientsare based on linear regressions. Significance level: *** = 1%, ** = 5% , * = 10%. Robust standard errorsin parentheses. Satisfaction: (1) 1 = Very dissatisfied, 5 = Very satisfied, (2) 0 = Very/fairly dissatisfiedor neither satisfied/dissatisfied, 1 = Very or fairly satisfied. Knowledge score: Equally weighted questions.Reference categories: Age: 15-24; Gender: Male; Class: DE; Employment status: Working; Income:<9500; Education: Low (GCSE) <40; Tenure: Rent
Table 13: Knowledge score and satisfaction: Estimation results
27
28
1a).17 They show that knowledge is indeed positively correlated with levels of satisfaction
with the Bank of England’s policies. A knowledge score that is one point higher increases
respondents’ satisfaction level by 0.18 points. People seem more dissatisfied with the policies
because they do not understand central banking and monetary policy. While an increase of 0.18
points is small, regressions for each year show that the coefficients have remained stable since
2001.
Using control variables, the coefficient for the knowledge score adjusts only slightly (col-
umn 1b). In this specification, respondents’ satisfaction with the central bank increases by 0.12
points with every additional point in their knowledge score. Knowledge would thus appear to
have an impact on the satisfaction with monetary policy. Socio-demographic factors show that
young people, female respondents and those coming from a lower social class are notably less
satisfied with the Bank of England. All these factors are positively correlated with the knowl-
edge score. Central banks therefore have good incentives to strengthen their communication
and teaching efforts especially to these groups.18
Alternatively, I run regressions on a binary dependent variable where 1 is coded for those
who are very or fairly satisfied with the Bank and 0 for all others (columns 2a and 2b). The
results are similar to the regressions on the ordered variable.19 An additional correct answer
increases the probability of being satisfied by 10 percentage points (without control variables)
and 7 percentage points (with control variables). To some extent, this result stems from the
higher likelihood of choosing “neither satisfied nor dissatisfied” when not knowing the interest
rate setting group.
17The satisfaction level is defined as an ordinal measure between 1 (very dissatisfied) and 5 (very satisfied).Satisfaction is an ordered dependent variable. Therefore, I could have applied an ordered logistic regression modelto the data. However, interpretation of the coefficients is much more intuitive with a linear model, which led meto choose an OLS regression. Again, I excluded those respondents who did not answer these questions. Includingtheir answers and using a multinomial logistic regression does not alter the results. See Table 20 in the appendix.Using logistic regressions instead of the linear regression model does not change the results either.
18Column (2) in Table 21 in the appendix indicates the relative influence of individual questions to the results.Answers to question 9a (Rates Short) have a different impact on the overall results that than do responses to theother questions. A correct answer to this question is negatively correlated with satisfaction, although the effect isvery small. Falsely thinking that central banks have influence in the short term might promote expectations that acentral bank can never fulfil.
19Logit regressions also do not provide any different conclusions.
28

29
In summary, one can conclude that satisfaction with the central banks’ measures corresponds
to the people’s understanding of monetary policy. To underline this conclusion, it is important
to be aware that the knowledge score is based on objective facts and not on attitudes shaped
by the central bank. From a central bank perspective, the results support the need for public
economic education.
7 Conclusion
According to central banks, public understanding of monetary policy and of the role of central
banks should ensure public support and thus enable successful monetary policy (see, e.g., Bank
of England, 2003). Based on data from the Bank of England’s Inflation Attitude Survey, I
show that satisfaction with the Bank of England indeed increases with a better understanding
of monetary policy. However, the results show that the average British person’s knowledge of
central banking is limited.
Many central banks already put significant resources into public information and education
(Fluch, 2007). In doing so, they use various tools: public speeches, interviews, information on
websites, videos and also tools for teachers and schools. The analysis of the socio-demographic
determinants of people’s knowledge of central banking showed that central banks should tar-
get their communication towards young people with low levels of education and incomes and
towards women in particular. Because children, adolescents and students already feature in
central banks’ key target groups (Fluch, 2007), central banks may not only need to improve the
quantity and target group orientation, but also the quality and adequacy of their communication.
Finally, no one can be forced to learn. People may simply have no incentives to learn
about monetary policy, especially if they are generally satisfied with the central bank. Lusardi,
Michaud & Mitchell (forthcoming) show that some level of financial ignorance can be optimal
because financial literacy is expensive to acquire. All the more, ignorance in monetary policy
may be appropriate, as monetary policy knowledge is less necessary in everyday decisions than
financial knowledge.
29

30
A Construction of the knowledge score
Notes: Results based on a principal component analysis among correct answers to selected questions from the Inflation Attitudes Survey of theBank of England for the period 2001-2016 (Q9, Q11, Q12, Q13).
Figure 5: Knowledge score: Principal component analysis (Scree plot)
30
31
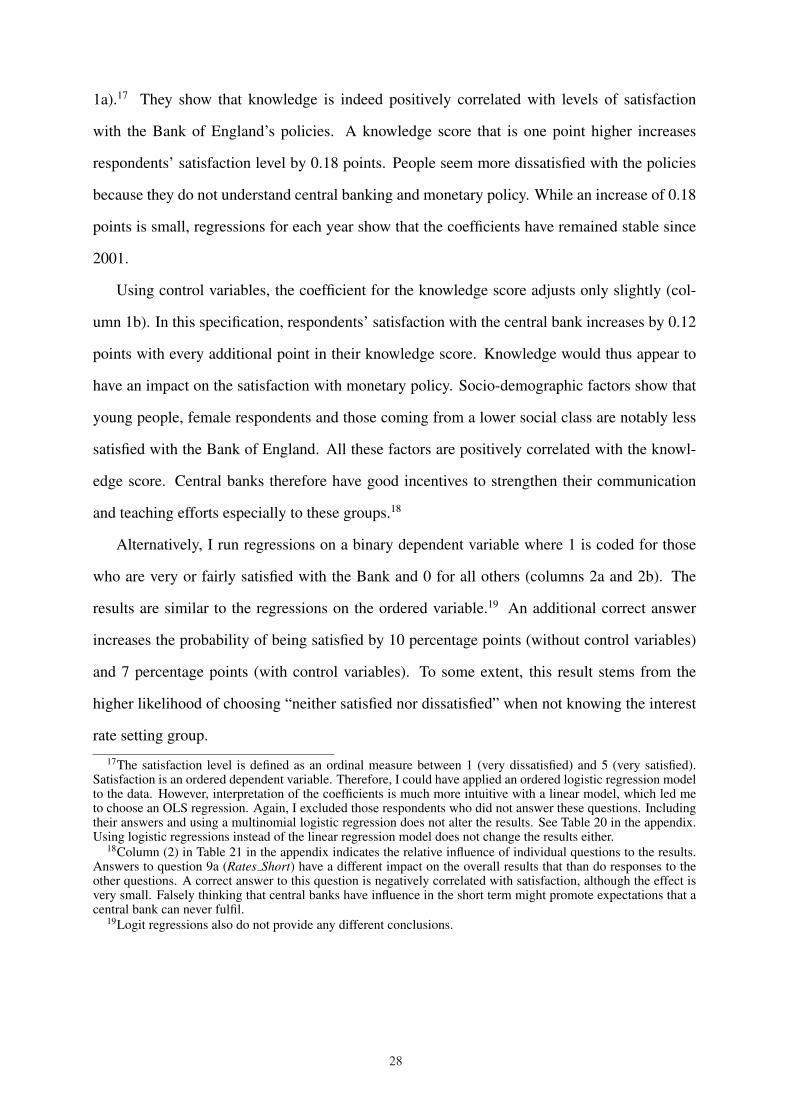
Notes: The overall knowledge score is based on selected questions (Q9, Q11, Q12, Q13) from the Inflation Attitudes Survey of the Bank ofEngland, weighted half for the conceptual knowledge score and half for the factual knowledge score. The conceptual knowledge score is basedon questions 9a and 9b (green dotted line) and the factual knowledge score is based on questions 11, 12 and 13 (pink dotted line).
Figure 6: Knowledge score: Average since 2001
31
32
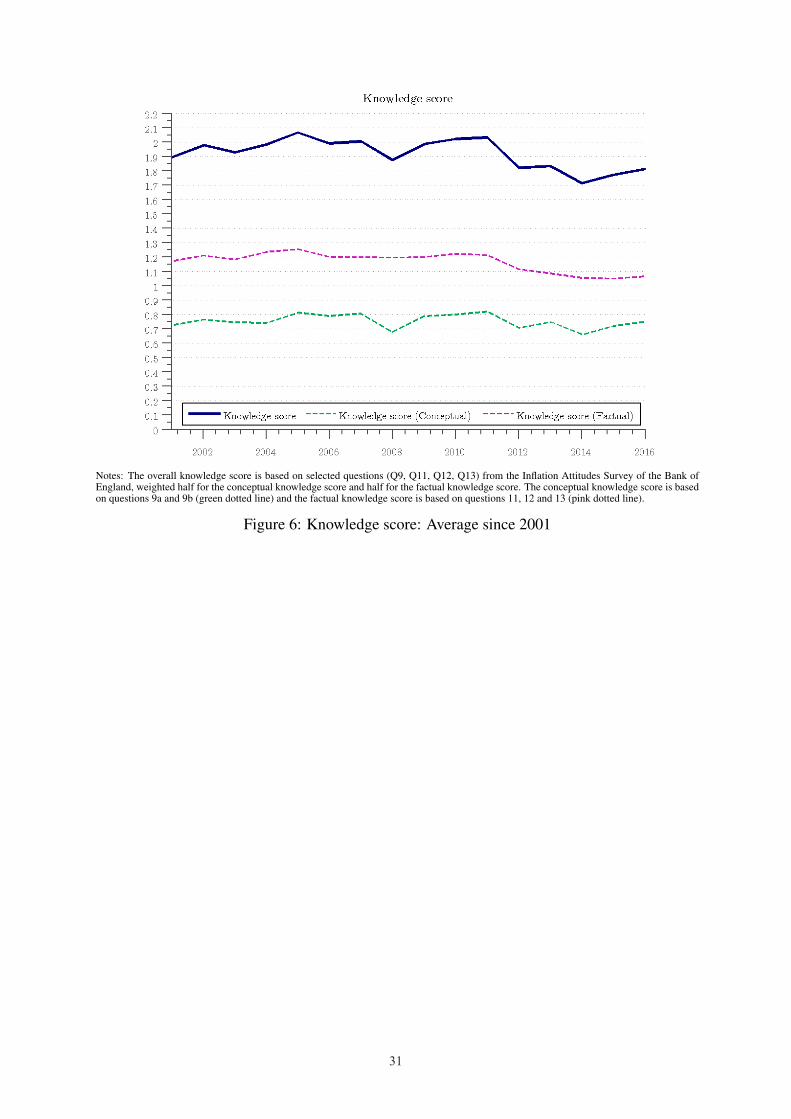
(a) Q9a: Rates Short (b) Q9b: Rates Medium
(c) Q11: Group OpenQ (d) Q12: Group
(e) Q13: IndependNotes: Fraction of respondents who provided correct answers to selected questions from the Inflation Attitudes Survey of the Bank of Englandbetween 2001 and 2016.
Figure 7: Knowledge questions: Corrects answers since 2001
32

33
B Alternative specifications and models
Independent variables (1) Score(1d): No income data provided (1e): Income data provided
Age25-34 0.30*** 0.16***
(0.025) (0.028)35-44 0.55*** 0.38***
(0.025) (0.028)45-54 0.71*** 0.50***
(0.026) (0.029)55-64 0.82*** 0.67***
(0.027) (0.030)65+ 0.70*** 0.56***
(0.027) (0.032)GenderFemale -0.46*** -0.49***
(0.014) (0.013)Social classAB 0.48*** 0.43***
(0.024) (0.023)C1 0.35*** 0.35***
(0.019) (0.019)C2 0.18*** 0.12***
(0.020) (0.020)Employment statusNot working -0.08*** -0.02
(0.017) (0.016)Income9500-17499 0.15***
(0.019)17500-24999 0.28***
(0.023)>25000 0.33***
(0.022)EducationMedium (A-Level) 0.29*** 0.22***
(0.018) (0.016)High (degree) 0.53*** 0.40***
(0.024) (0.021)Housing tenureOwned outright 0.37*** 0.40***
(0.023) (0.023)Mortgage 0.40*** 0.44***
(0.023) (0.022)Other 0.08*** 0.10**
(0.023) (0.021)Fixed effects Year, region Year, region
Constant 0.90*** 1.18***(0.042) (0.043)
Observations 28396 33368
R squared 0.18 0.23
Notes: Dataset is based on Inflation Attitudes Survey of the Bank of England (2001-2016).Coefficients are based on linear regressions. Significance level: *** = 1%, ** = 5% , * = 10%.Robust standard errors in parentheses. (1): Only respondents who did not provide incomedata. (2): Only respondents who provided income data. Reference categories: Age: 15-24;Gender: Male; Class: DE; Employment status: Working; Income: <9500; Education: Low(GCSE) <40; Tenure: Rent.
Table 14: Knowledge score and sociodemographic factors: Estimation results (II)
33

34
Independent variables (1) Score: Incidence rate ratios
Age25-34 1.21***
(0.015)35-44 1.36***
(0.016)45-54 1.45***
(0.017)55-64 1.55***
(0.019)65+ 1.48***
(0.019)GenderFemale 0.79***
(0.004)Social classAB 1.26***
(0.010)C1 1.22***
(0.009)C2 1.11***
(0.009)Employment statusNot working 0.96
(0.006)Income9500-17499 1.07***
(0.011)17500-24999 1.11***
(0.012)>25000 1.11***
(0.011)Not known 0.95***
(0.009)EducationMedium (A-Level) 1.14***
(0.008)High (degree) 1.25***
(0.010)Housing tenureOwned outright 1.26***
(0.012)Mortgage 1.29***
(0.012)Other 1.08**
(0.011)Fixed effects Year, region
Observations 61764
Notes: Dataset is based on Inflation Attitudes Survey of theBank of England (2001-2016). Incidence rate ratios are basedon a Poisson regression. Significance level: *** = 1%, ** = 5% ,* = 10%. Robust standard errors in parentheses. Reference cate-gories: Age: 15-24; Gender: Male; Class: DE; Employment sta-tus: Working; Income: <9500; Education: Low (GCSE) <40;Tenure: Rent.
Table 15: Knowledge score and sociodemographic factors: Estimation results (ordered logit)
34
35
Independent variables Q9a (Rates Short) Q9b (Rates Medium) Q11 (Group OpenQ) Q12 (Group) Q13 (Independ)
Odds ratios
Age25-34 1.13*** 1.02 1.95*** 1.81*** 1.00
(0.047) (0.034) (0.084) (0.066) (0.035)35-44 1.29*** 1.07** 3.00*** 2.84*** 1.12***
(0.053) (0.036) (0.126) (0.105) (0.040)45-54 1.50*** 1.06 3.85*** 3.96*** 1.15***
(0.063) (0.037) (0.164) (0.154) (0.041)55-64 1.58*** 1.06 5.10*** 5.91*** 1.21***
(0.070) (0.039) (0.229) (0.254) (0.046)65+ 1.27*** 0.96 4.57*** 5.22*** 1.10**
(0.059) (0.036) (0.211) (0.220) (0.043)GenderFemale 0.75*** 0.70*** 0.42*** 0.45*** 0.89**
(0.015) (0.012) (0.008) (0.009) (0.016)Social classAB 1.29*** 1.25*** 1.91*** 2.23*** 1.53***
(0.044) (0.037) (0.060) (0.082) (0.047)C1 1.18*** 1.18*** 1.679*** 1.81*** 1.44***
(0.034) (0.029) (0.045) (0.049) (0.037)C2 1.08* 1.11*** 1.21*** 1.27*** 1.18***
(0.032) (0.028) (0.033) (0.034) (0.031)Employment statusNot working 1.01 0.95* 0.94** 0.93*** 0.93***
(0.025) (0.021) (0.022) (0.022) (0.021)Income9500-17499 1.19 1.06*** 1.14*** 1.26*** 1.07*
(0.047) (0.036) (0.042) (0.046) (0.038)17500-24999 1.23 1.05* 1.23*** 1.55*** 1.26***
(0.057) (0.042) (0.053) (0.072) (0.052)>25000 1.19 1.10 1.32*** 1.81*** 1.24***
(0.048) (0.039) (0.051) (0.075) (0.045)Not known 0.93*** 0.82*** 1.04 0.92*** 0.84***
(0.032) (0.023) (0.033) (0.027) (0.025)EducationMedium (A-Level) 1.17*** 1.05** 1.48*** 1.55*** 1.35***
(0.032) (0.024) (0.036) (0.039) (0.033)High (degree) 1.31*** 1.11*** 2.15*** 2.33*** 1.57***
(0.045) (0.032) (0.067) (0.082) (0.047)Housing tenureOwned outright 1.10*** 1.26*** 1.83*** 1.87*** 1.42***
(0.039) (0.038) (0.060) (0.060) (0.046)Mortgage 1.22*** 1.25*** 1.86*** 2.09*** 1.42***
(0.043) (0.037) (0.060) (0.066) (0.044)Other 1.06 1.02 1.13 1.16*** 1.17***
(0.037) (0.030) (0.039) (0.035) (0.036)
Fixed effects Year, region Year, region Year, region Year, region Year, region
Constant 0.16*** 0.56*** 0.10*** 0.34*** 0.29***(0.011) (0.032) (0.009) (0.022) (0.018)
Observations 61764 61764 61764 61764 61764
Notes: Dataset is based on the Inflation Attitudes Survey of the Bank of England (2001-2016). Odds ratios are based onlogit regressions. Significance level: *** = 1%, ** = 5% , * = 10%. Robust standard errors in parentheses. Referencecategories: Age: 15-24; Gender: Male; Class: DE; Employment status: Working; Income: <9500; Education: Low(GCSE) <40; Tenure: Rent.
Table 16: Knowledge questions and sociodemographic factors: Estimation results (logit regres-sions)
35

36
Inflation aversion Independent variables Relative risk ratios
Raising rates (Base outcome)
Higher inflation Knowledge score 0.99(0.010)
... ...
No idea Knowledge score 0.59***(0.006)
... ...
Notes: 61764 observations based on the Inflation Attitudes Survey ofthe Bank of England (2001-2016). Relative risk ratios are based on amultinomial logistic regression. Significance level: *** = 1%, ** = 5% , *= 10%. Robust standard errors in parentheses. Knowledge score: Equallyweighted questions.
Table 17: Knowledge score and attitudes (higher inflation vs. higher interest rates): Multinomiallogistic regression
Inflation target Independent variables Relative risk ratios
Is too high Knowledge score 0.88***(0.008)
... ...
Is too low Knowledge score 1.06***(0.013)
... ...
Is about right (Base outcome)
No idea Knowledge score 0.54***(0.007)
... ...
Notes: 61764 observations based on the Inflation Attitudes Survey ofthe Bank of England (2001-2016). Relative risk ratios are based on amultinomial logistic regression. Significance level: *** = 1%, ** = 5%, * = 10%. Robust standard errors in parentheses. Knowledge score:Equally weighted questions.
Table 18: Knowledge score and attitudes (inflation target): Multinomial logistic regression
36

37
Independent variables (3) Inflation target (binary: agreement with BoE’s target)(3a) (3b)
Coefficients
Knowledge score 0.03*** 0.01***(0.002) (0.002)
Age25-34 -0.02**
(0.009)35-44 0.00
(0.009)45-54 0.00
(0.010)55-64 0.03***
(0.010)65+ 0.06***
(0.010)GenderFemale -0.03***
(0.004)Social classAB 0.05***
(0.007)C1 0.03***
(0.006)C2 0.00
(0.006)Employment statusNot working 0.00
(0.006)Income9500-17499 -0.01
(0.008)17500-24999 -0.01
(0.010)>25000 0.03***
(0.009)Not known -0.01
(0.007)EducationMedium (A-Level) 0.00
(0.006)High (degree) 0.02***
(0.007)Housing tenureOwned outright 0.05**
(0.008)Mortgage 0.05
(0.008)Other 0.02
(0.007)
Fixed effects - Year, region
Constant 0.55*** 0.59***0.00 (0.015)
R squared 0.01 0.03Observations 53916 52550
Notes: Dataset is based on the Inflation Attitudes Survey of the Bank of England (2001-2016). Coefficients are based on linear regressions. Significance level: *** = 1%, ** = 5%, * = 10%. Robust standard errors in parentheses. Dependent variable: Inflation target: 1= About right, 0 = Too low or too high. Independent variable: Knowledge score: Equallyweighted questions. Reference categories: Age: 15-24; Gender: Male; Class: DE; Employ-ment status: Working; Income: <9500; Education: Low (GCSE) <40; Tenure: Rent
Table 19: Knowledge score and inflation target: Binary variable
37

38
Satisfaction Independent variables Relative risk ratios
Very satisfied Knowledge score 1.47***(0.023)
... ...
Fairly satisfied Knowledge score 1.35***(0.013)
... ...
Neither satisfied/dissatisfied (Base outcome)
Fairly dissatisfied Knowledge score 1.07***(0.015)
... ...
Very dissatisfied Knowledge score 0.95***(0.016)
... ...
No idea Knowledge score 0.47***(0.008)
... ...
Notes: 61764 observations based on the Inflation Attitudes Survey of the Bankof England (2001-2016). Relative risk ratios are based on a multinomial logisticregression. Significance level: *** = 1%, ** = 5% , * = 10%. Robust standarderrors in parentheses. Knowledge score: Equally weighted questions.
Table 20: Knowledge score and satisfaction: Multinomial logistic regression
38
39
Independent variables (1) Inflation target (ordered variable) (2) Satisfaction (ordered variable)
Coefficients
Q9a: Rates Short -0.01* -0.03**(0.006) (0.010)
Q9b: Rates Medium 0.01** 0.10***(0.005) (0.008)
Q11: Group OpenQ 0.10*** 0.22***(0.006) (0.009)
Q12: Group 0.04*** 0.21***(0.007) (0.011)
Q13: Independ 0.01* 0.03***(0.005) (0.008)
Age25-34 0.00 -0.05*
(0.011) (0.016)35-44 0.05*** -0.01
(0.011) (0.017)45-54 0.14*** 0.02
(0.011) (0.017)55-64 0.20*** 0.06***
(0.012) (0.018)65+ 0.21*** 0.13***
(0.012) (0.019)GenderFemale -0.08*** -0.13***
(0.005) (0.008)Social classAB 0.07*** 0.01***
(0.009) (0.014)C1 0.06*** 0.01***
(0.008) (0.012)C2 0.01 0.01***
(0.008) (0.013)Employment statusNot working 0.00 0.01
(0.006) (0.011)Income9500-17499 0.01 0.01
(0.011) (0.017)17500-24999 0.00 0.05*
(0.012) (0.019)>25000 0.03*** 0.07***
(0.012) (0.017)Not known -0.01 -0.04***
(0.009) (0.014)EducationMedium (A-Level) 0.01 0.01
(0.007) (0.011)High (degree) 0.01 0.08***
(0.009) (0.014)Housing tenureOwned outright 0.04*** 0.05***
(0.009) (0.015)Mortgage 0.00 0.14***
(0.009) (0.015)Other 0.00 0.03
(0.009) (0.015)Fixed effects Year, region Year, region
Constant 1.62*** 3.25***(0.018) (0.028)
R squared 0.06 0.12Observations 52550 55133
Notes: Dataset is based on Inflation Attitudes Survey of the Bank of England (2001-2016). Coefficients based on linear regression. Dependentvariable: (1) Inflation target (Q4); (2) Satisfaction (Q14). Significance level: *** = 1%, ** = 5% , * = 10%. Robust standard errors in parentheses.Knowledge score: Equally weighted questions. Inflation target: 1 = Too high, 2 = About right, 3 = Too low. Inflation aversion: Preferences forhigher interest rates = 0, preferences for higher inflation = 1. Reference categories: Age: 15-24; Gender: Male; Class: DE; Employment status:Working; Income: <9500; Education: Low (GCSE) <40; Tenure: Rent
Table 21: Knowledge score and attitudes/satisfaction: Estimation results (incl. single questions)
39
40
References
[1] Anderson, L.W., D.R. Krathwohl, P.W. Airasian, K. A. Cruikshank, R.E. Mayer, P.R. Pin-
trich, J. Raths & M.C. Wittrock (2001). A Taxonomy for Learning, Teaching and Assessing.
A Revision of Bloom’s Taxonomy of Educational Objectives, Abridged Edition. Longman:
White Plains.
[2] Bank of England (2003). Public Attitudes to Inflation. Quarterly Bulletin, Q2 2003: 228-
234.
[3] Binder, C. (2016). Fed speak on main street: Central bank communication and household
expectations. Journal of Macroeconomics, 52: 238-251.
[4] Blanchflower, D.G. & R. Kelly (2008). Macroeconomic literacy, numeracy and the impli-
cations for monetary policy. Speech on 29 April 2008, Bank of England.
[5] Blinder, A.S. & A.B. Krueger (2004). What Does the Public Know about Economic Policy,
and How Does It Know It? Brooking Papers on Economic Activity, 2004 (1): 327-397.
[6] Blinder, A.S., M. Ehrmann, M. Fratzscher, J. de Haan & D.-J. Jansen (2008). Central
Bank Communication and Monetary Policy: A Survey of Theory and Evidence. Journal
of Economic Literature, 46 (4): 910-945.
[7] Burke, M.A. & M. Manz (2014). Economic Literacy and Inflation Expectation: Evidence
from a Laboratory Experiment. Journal of Money, Credit and Banking, 46 (7): 1421-1456.
[8] Carvalho, C. & F. Nechio (2014). Do People Understand Monetary Policy? Journal of
Monetary Economics, 66: 108-123.
[9] van der Cruijsen, C., D.-J. Jansen & J. de Haan (2015). How much does the public know
about the ECB’s monetary policy? Evidence from a survey of Dutch households. Interna-
tional Journal of Central Banking, 11 (4), 169-218.
40
41
[10] Drager, L., M.J. Lamla & D. Pfajfar (2015). Are Survey Expectations Theory-Consistent?
The Role of Central Bank Communication and News. Finance and Economics Discussion
Series 2015-035, Board of Governors of the Federal Reserve System.
[11] Fernandes, D., J.G. Lynch & R.G. Netemeyer (2014). Financial Literacy, Financial Edu-
cation and Downstream Financial Behaviors. Management Science, 60 (8): 1861-1883.
[12] Fluch, M. (2007). Selected Central Banks’ Economic and Financial Literacy Programs.
Moentary Policy & The Economy, Q3/07: 85-104.
[13] Fluch, M., F. Fritzer & F. Rumler (2013). Inflation und Preiswahrnehmung eine Be-
standesaufnahme fur Osterreich, OeNB Statistiken, Q4/13: 67-85.
[14] Hayo, B. & E. Neuenkirch (2014). The German public and its trust in the ECB: The Role
of knowledge and information search. Journal of International Money and Finance, 47:
286-303.
[15] Hung, A., J. Yoong & E. Brown (2012). Empowering Women Through Financial Aware-
ness and Education. OECD Working Papers on Finance, Insurance and Private Pensions,
14.
[16] Kaltenthaler, K., C.J. Anderson, W.J. Miller (2010). Accountability and Independent Cen-
tral Banks: Europeans and Distrust of the European Central Bank. Journal of Common
Market Studies, 48 (5): 1261-1281.
[17] Leiser, D. & Z. Krill (forthcoming). How laypeople understand economics. In: Ranyard, E.
(ed.). Economic psychology: the science of economic mental life and behaviour. Hoboken:
Wiley-Blackwell.
[18] Lusardi, A. & O.S. Mitchell (2014). The Economic Importance of Financial Literacy:
Theory and Evidence. Journal of Economic Literature, 52 (1): 5-44.
41

42
[19] Lusardi, A. P.-C. Michaud & O.S. Mitchell (2017). Optimal Financial Knowledge and
Wealth Inequality. The Journal of Political Economy, 125, (2): 431-477.
[20] OECD/INFE (2013). Financial Literacy and Inclusion: Results of OECD/INFE Survey
Across Countries And By Gender. Financial Literacy & Education, Russia Trust Fund.
[21] Sharpe, A. & B. Andrews (2012). An Assessment of Weighting Methodologies for Com-
posite Indicators: The Case of the Index of Economic Well-Being. Centre for the Study of
Living Standards.
42
43
List of Figures
1 Knowledge score: Distribution . . . . . . . . . . . . . . . . . . . . . . . . . . 11
2 Knowledge score: Economic developments . . . . . . . . . . . . . . . . . . . 19
3 Knowledge score: Cohorts since 2001 . . . . . . . . . . . . . . . . . . . . . . 21
4 Inflation Attitudes Survey: Average satisfaction with policy since 2001 . . . . . 26
5 Knowledge score: Principal component analysis (Scree plot) . . . . . . . . . . 30
6 Knowledge score: Average since 2001 . . . . . . . . . . . . . . . . . . . . . . 31
7 Knowledge questions: Corrects answers since 2001 . . . . . . . . . . . . . . . 32
List of Tables
1 Inflation Attitudes Survey: Knowledge questions . . . . . . . . . . . . . . . . 6
2 Knowledge questions: Fraction of correct answers and fraction of “Don’t know”s 7
3 Knowledge questions: Correlation table . . . . . . . . . . . . . . . . . . . . . 8
4 Knowledge questions: Principal component analysis . . . . . . . . . . . . . . 8
5 Knowledge questions: Loadings (principal component analysis) . . . . . . . . 9
6 Inflation Attitudes Survey: Summary statistics . . . . . . . . . . . . . . . . . . 10
7 Knowledge score and sociodemographic factors: Estimation results . . . . . . 14
8 Knowledge questions and sociodemographic factors: Estimation results . . . . 17
9 Knowledge score: Age groups . . . . . . . . . . . . . . . . . . . . . . . . . . 20
10 Inflation Attitudes Survey: Monetary policy attitude questions . . . . . . . . . 21
11 Knowledge score and attitudes: Estimation results . . . . . . . . . . . . . . . . 23
12 Inflation Attitudes Survey: Satisfaction question . . . . . . . . . . . . . . . . . 25
13 Knowledge score and satisfaction: Estimation results . . . . . . . . . . . . . . 27
14 Knowledge score and sociodemographic factors: Estimation results (II) . . . . 33
15 Knowledge score and sociodemographic factors: Estimation results (ordered
logit) . . . . . . . . . . . . . . . . . . . . . . . . . . . . . . . . . . . . . . . . 34
43
44
16 Knowledge questions and sociodemographic factors: Estimation results (logit
regressions) . . . . . . . . . . . . . . . . . . . . . . . . . . . . . . . . . . . . 35
17 Knowledge score and attitudes (higher inflation vs. higher interest rates): Multi-
nomial logistic regression . . . . . . . . . . . . . . . . . . . . . . . . . . . . . 36
18 Knowledge score and attitudes (inflation target): Multinomial logistic regression 36
19 Knowledge score and inflation target: Binary variable . . . . . . . . . . . . . . 37
20 Knowledge score and satisfaction: Multinomial logistic regression . . . . . . . 38
21 Knowledge score and attitudes/satisfaction: Estimation results (incl. single
questions) . . . . . . . . . . . . . . . . . . . . . . . . . . . . . . . . . . . . . 39
44

Recent SNB Working Papers
2017-15 Adriel Jost: Is Monetary Policy Too Complex for the Public? Evidence from the UK.
2017-14 David R. Haab, Thomas Nitschka: Predicting returns on asset markets of a small, open economyandtheinfluenceofglobalrisks
2017-13 Mathieu Grobéty: Government Debt and Growth: The Role of Liquidity.
2017-12 Thomas Lustenberger and Enzo Rossi: Does Central Bank Transparency and Communication AffectFinancialandMacroeconomicForecasts? 2017-11 AndreasM.Fischer,RafaelGremingerandChristian Grisse: Portfolio rebalancing in times of stress.
2017-10 ChristianGrisseandSilvioSchumacher:Theresponse of long-term yields to negative interest rates: evidence from Switzerland.
2017-9 PetraGerlach-Kristen,RichhildMoessnerandRina Rosenblatt-Wisch: Computing long-term market inflationexpectationsforcountrieswithoutinflation expectation markets. 2017-8 AlainGalli:Whichindicatorsmatter?Analyzingthe Swiss business cycle using a large-scale mixed- frequency dynamic factor model .
2017-7 GregorBäurle,MatthiasGublerandDiegoR.Känzig: Internationalinflationspillovers-theroleofdifferent shocks.
2017-6 LucasMarcFuhrer:LiquidityintheRepoMarket.
2017-5 ChristianGrisse,SigneKrogstrupandSilvio Schumacher: Lower bound beliefs and long-term interest rates.
2017-4 ToniBeutler,RobertBichsel,AdrianBruhinandJayson Danton: The Impact of Interest Rate Risk on Bank Lending.
2017-3 RaphaelA.Auer,AndreiA.LevchenkoandPhilipSauré: InternationalInflationSpilloversThroughInput Linkages.
2017-2 AlainGalli,ChristianHepenstrickandRolfScheufele: Mixed-frequency models for tracking short-term economic developments in Switzerland.
2017-1 MatthiasGublerandChristophSax: TheBalassa-SamuelsonEffectReversed: New Evidence from OECD Countries.
2016-19 JensH.E.ChristensenandSigneKrogstrup:APortfolio Model of Quantitative Easing.
2016-18 JonasMeuli,ThomasNellenandThomasNitschka: Securitisation, loan growth and bank funding: the Swiss experiencesince1932.
2016-17 RitaFleer,BarbaraRudolfandMathiasZurlinden:Price change dispersion and time-varying pass-through to consumer prices.
2016-16 GregorBäurle,DanielKaufmann,SylviaKaufmann and Rodney W. Strachan: Changing dynamics at the zero lower bound.
2016-15 AdrianJäggi,MartinSchlegelandAttilioZanetti: Macroeconomic surprises, market environment and safe - haven currencies.