Embed Size (px)
Citation preview

10.2217/IIM.13.60Castiella et al.IS MRI
5
6
515524
This article addresses whether or not determination of liver iron concentration by MRI is becoming the new gold standard for diagnosing iron overload in hereditary hemochromatosis and other liver iron-surcharge diseases. Hepatic iron concentration obtained by liver biopsy has been the gold standard for years. In recent years the development of MRI techniques, via signal intensity ratio methods or by relaxometry, has provided a noninvasive and more accurate approach to the diagnosis of liver iron overload. Nowadays, liver biopsy indications have diminished and only prognostic purposes or diagnostic difficulties may justify its indication. We comment on the difficulty that liver steatosis creates for liver iron determination, a paper on MR elastography for fibrosis prognosis in hemochromatosis, the relationship between iron-free nodules and hepatocarcinoma, and the importance of the MR machine’s calibration for accurate liver iron concentration determinations. Finally, based on the available evidence, we conclude that MRI is the new gold standard for the diagnosis of hepatic iron overload, in hemochromatosis and other liver iron disorders.
KEYWORDS: magnetic resonance imaging n hemochromatosis n liver biopsy n liver diseases n iron overload n signal intensity ratio n relaxometry
Agustin Castiella1*
Jose M Alústiza2
Eva Zapata1 & José I Emparanza3
1Gastroenterology Service, Mendaro Hospital, Spain 2Radiology, Osatek Donostia, Spain 3Clinical Epidemiology Unit, Donostia Hospital, Spain *Author for correspondence: [email protected]
part of
515ISSN 1755-519110.2217/IIM.13.60 © 2013 Future Medicine Ltd Imaging Med. (2013) 5(6), 515–524
PersPective
The aim of this article is to show the available evi-dence that allows us, in 2013, to have a new gold standard for liver iron concentration (LIC) deter-mination in hereditary hemochromatosis (HH) and other liver iron disorders. Liver biopsy has been considered the gold standard for LIC deter-mination in HH for years [1]. Since 1996, with the discovery of HFE gene mutations by Feder et al. [2], the utilization of liver biopsy for the diagnosis of HH has been limited and progressively reserved for prognostic purposes [3]. MRI, a noninvasive radiologic tool, has been demonstrated to be useful for the accurate determination of LIC and, pres-ently, has become the new gold standard for LIC determination in HH [4].
We will begin with some background on the dif-ferent methods of LIC determination in HH (liver biopsy-radiologic tools), explaining in particular the evolution of MRI [5–7]. We will point out other utilities of MRI in HH, principally in the non-invasive approach to prognosis (fibrosis determi-nation) [8,9] and the diagnosis of hepatocarcinoma [10,11]. Finally, we will speculate about the future of this technique in the diagnosis and prognosis of liver iron surcharge diseases, especially HH [3,12].
BackgroundChange is not easy in normal life. In medicine, some changes take years to become reality. 'Peptic' gastroduodenal ulcer is a good example
to summarize how gold standards can change in medicine. After many years with the 'with-out acid no ulcer' mantra, the discovery of Helicobacter pylori by Warren and Marshall was an authentic revolution [13,14]. At first, there were many detractors but, finally, everyone was won over to the 'right' side.
HH is the most prevalent genetic disease in the Caucasian population of North European origin. Phenotypic expression causes a progressive depo-sition of iron in the liver, the target organ of the disease, resulting in cirrhosis and hepatocellular carcinoma if it is not diagnosed and treatment is not initiated. For years, for diagnosing the disease, LIC determination by biopsy was considered the gold standard [1]. In 1996 Feder et al. discovered the HFE gene, with the mutations responsible for the disease [2]. But it seemed that LIC determi-nation by biopsy continued to be necessary for iron overload diagnosis in patients with the muta-tion and serologic risk factors of a high degree of fibrosis (ferritin >1000, raised AST, platelet count < 200,000) [3,15–18]. There is no indication to do a liver biopsy in HH if the patient is C282Y homozygous, serum ferritin is less than 1000 and aspartate transaminase (AST) is not raised [3,4].
Liver biopsy not only provided a quantitative diagnosis of iron concentration in the liver but also a histologic view of iron deposition within the lobular zone. If there is a decreasing gradient
Is MRI becoming the new gold standard for diagnosing iron overload in hemochromatosis and other liver iron disorders?

Imaging Med. (2013) 5(6)516 future science group
PersPective Castiella, Alústiza, Zapata & Emparanza
of iron deposition from zone 1 (periportal) to zone 3 (centrilobular), the histology was typical of HH. If the iron was retrieved predominantly in the reticuloendothelial system (RES), a sec-ondary hemochromatosis was very probably pre-sent. This information is also available thanks to MRI [19]. When the deposition is predominantly in the hepatocytes and not in the RES, the spleen will have a hyperintense image on MRI and the image will typically be that of a HH. When the hemochromatosis is secondary or, for example, a HH due to ferroportin disease [20], the spleen will be full of iron too and hypointensive images will be obtained (Figure 1).
In 2001 the International Workshop of the National Institute of Diabetes and Digestive and Kidney Diseases (NIDDK) concluded that a quantitative, noninvasive, safe and accurate approach to the assessment of body iron stor-age was needed to improve the diagnosis and management of patients with iron overload [21].
Liver MRI has clearly been shown to make an accurate assessment of LIC over a large range of iron concentrations, either by signal intensity ratio (SIR) or relaxometry methods [22]. MRI provides a quantitative and safe, noninvasive approach to determining LIC, which perfectly reflects body iron storage [23].
Some authors continue to say that liver biopsy is useful in non-HFE hemochromatosis, to con-firm iron overload. LIC by MRI is the first diagnostic tool to be used in these cases. The noninvasive approach is ready and preferable, and if a mutation determination is made, MRI will establish the need for treatment [4].
n Liver biopsyLIC is the better indicator of the total iron burden in the human body. The liver is the most accessible tissue to determine the presence of iron overload in humans. Liver biopsy has classically been used
for this purpose, and LIC determination was made by atomic absorption spectrophotometry of a liver specimen [19]. Liver biopsy has associated risks inherent to the technique, with a related mortality of approximately 1/1000–1/10,000 [24,25]. There is also a wide variation in the values obtained by this method, especially in patients with hepatic cirrhosis [26]. Different values may be determined in different places in the liver. The coefficient of variation in the quantification obtained by biopsy is 19% in normal liver and rises up to 40% in cirrhotic livers [19]. Sampling error studies have shown that a single biopsy will miss cirrhosis in 10–30% of patients and incorrectly classify fibro-sis by at least one stage in 20–30% [27]. If iron-free foci are biopsied, LIC will never be raised; this may occur in cirrhotic livers. All these problems can be solved with the aid of MRI.
Both patients and hemochromatosis asso-ciations have their objections to the technique [3,28]. Furthermore, liver fibrosis and, in some cases, cirrhosis, may regress after venesection treatment [29]. Perhaps the prognostic utility of this procedure is better once the treatment is finished [3,28].
n MRI-based techniques for assessing LICLIC may be determined by MRI [30–35]. Susceptibility is assessed by the shortening of T2, which is measured by a proportional decrease in the iron concentration. We must measure SIR and T2.
There are two methods for the assessment of LIC by MRI: SIR methods and relaxometry methods. Different techniques have been used for this purpose. Classically, the SIR method com-pared the signal intensity (SI) from the hepatic tissue with the SI from other locations where iron was not deposited. The liver to muscle ratio has been the more used ratio and the paraspinal
Figure 1. Quantification of liver iron concentration by MRI. (A) Important reduction in signal intensity from the liver: hemochromatosis. (B) Normal liver signal intensity: prolongs treatment with phlebotomies. (C) Reduction in signal intensity in the liver and the spleen in secondary hemochromatosis. Reproduced with permission from [3].
www.futuremedicine.com 517future science group
MRI for diagnosing iron overload in hemochromatosis & other liver iron disorders PersPective
muscles were the elected ones for the technique. The relaxometry methods have measured two different sequences: they measured absolute T2 or they measured T2*, with echo (GRE) sequences. Nowadays, we need a worldwide accepted method, which must be accurate enough for clinical practice and which can also be repro-duced and standardized. This MRI method must also be widely available all around the world [23].
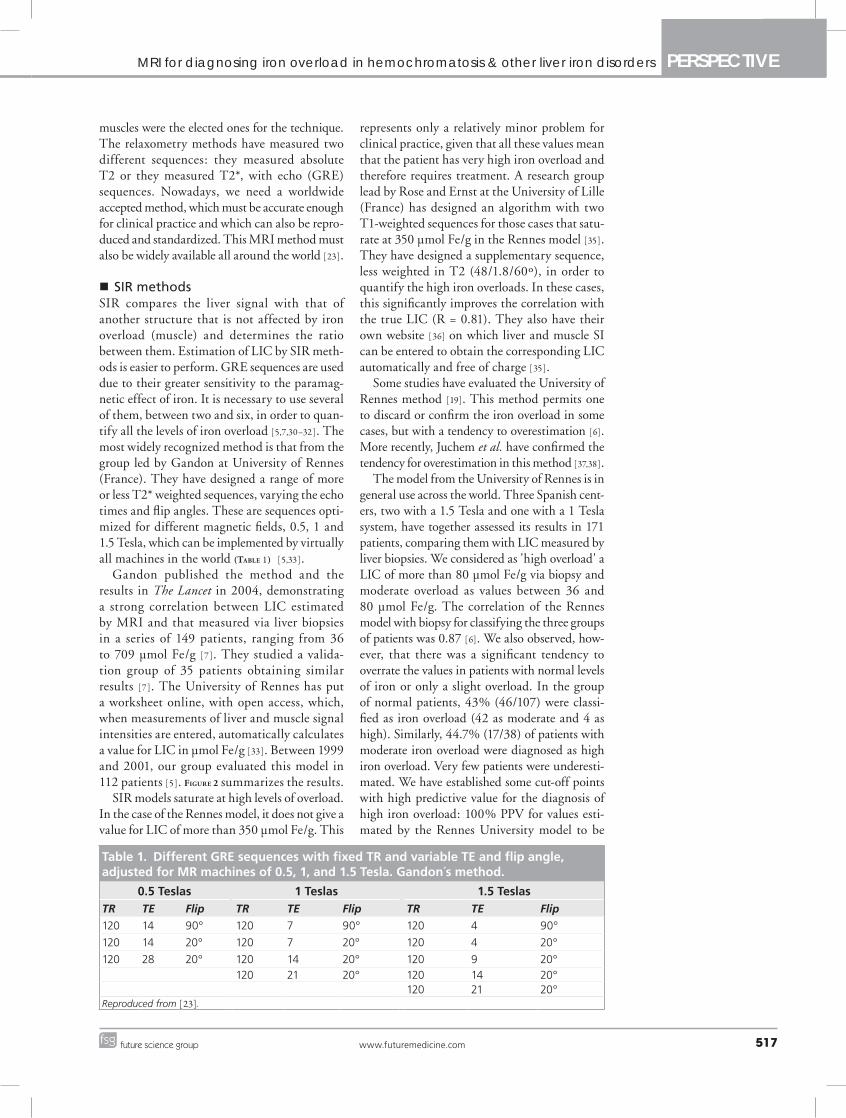
n SIR methodsSIR compares the liver signal with that of another structure that is not affected by iron overload (muscle) and determines the ratio between them. Estimation of LIC by SIR meth-ods is easier to perform. GRE sequences are used due to their greater sensitivity to the paramag-netic effect of iron. It is necessary to use several of them, between two and six, in order to quan-tify all the levels of iron overload [5,7,30–32]. The most widely recognized method is that from the group led by Gandon at University of Rennes (France). They have designed a range of more or less T2* weighted sequences, varying the echo times and flip angles. These are sequences opti-mized for different magnetic fields, 0.5, 1 and 1.5 Tesla, which can be implemented by virtually all machines in the world (Table 1) [5,33].
Gandon published the method and the results in The Lancet in 2004, demonstrating a strong correlation between LIC estimated by MRI and that measured via liver biopsies in a series of 149 patients, ranging from 36 to 709 µmol Fe/g [7]. They studied a valida-tion group of 35 patients obtaining similar results [7]. The University of Rennes has put a worksheet online, with open access, which, when measurements of liver and muscle signal intensities are entered, automatically calculates a value for LIC in µmol Fe/g [33]. Between 1999 and 2001, our group evaluated this model in 112 patients [5]. Figure 2 summarizes the results.
SIR models saturate at high levels of overload. In the case of the Rennes model, it does not give a value for LIC of more than 350 µmol Fe/g. This
represents only a relatively minor problem for clinical practice, given that all these values mean that the patient has very high iron overload and therefore requires treatment. A research group lead by Rose and Ernst at the University of Lille (France) has designed an algorithm with two T1-weighted sequences for those cases that satu-rate at 350 µmol Fe/g in the Rennes model [35]. They have designed a supplementary sequence, less weighted in T2 (48/1.8/60º), in order to quantify the high iron overloads. In these cases, this significantly improves the correlation with the true LIC (R = 0.81). They also have their own website [36] on which liver and muscle SI can be entered to obtain the corresponding LIC automatically and free of charge [35].
Some studies have evaluated the University of Rennes method [19]. This method permits one to discard or confirm the iron overload in some cases, but with a tendency to overestimation [6]. More recently, Juchem et al. have confirmed the tendency for overestimation in this method [37,38].
The model from the University of Rennes is in general use across the world. Three Spanish cent-ers, two with a 1.5 Tesla and one with a 1 Tesla system, have together assessed its results in 171 patients, comparing them with LIC measured by liver biopsies. We considered as 'high overload' a LIC of more than 80 µmol Fe/g via biopsy and moderate overload as values between 36 and 80 µmol Fe/g. The correlation of the Rennes model with biopsy for classifying the three groups of patients was 0.87 [6]. We also observed, how-ever, that there was a significant tendency to overrate the values in patients with normal levels of iron or only a slight overload. In the group of normal patients, 43% (46/107) were classi-fied as iron overload (42 as moderate and 4 as high). Similarly, 44.7% (17/38) of patients with moderate iron overload were diagnosed as high iron overload. Very few patients were underesti-mated. We have established some cut-off points with high predictive value for the diagnosis of high iron overload: 100% PPV for values esti-mated by the Rennes University model to be
Table 1. Different GRE sequences with fixed TR and variable TE and flip angle, adjusted for MR machines of 0.5, 1, and 1.5 Tesla. Gandon´s method.
0.5 Teslas 1 Teslas 1.5 TeslasTR TE Flip TR TE Flip TR TE Flip
120 14 90° 120 7 90° 120 4 90°
120 14 20° 120 7 20° 120 4 20°
120 28 20° 120 14 20° 120 9 20° 120 21 20° 120 14 20° 120 21 20°Reproduced from [23].

Imaging Med. (2013) 5(6)518 future science group
PersPective Castiella, Alústiza, Zapata & Emparanza
>170 µmol Fe/g (sensitivity of 69%) and 100% NPV for values <60 µmol Fe/g (specificity was 75%). For the intermediate range, with estimated values between 60 and 170 µmol Fe/g, the status remains uncertain. The number of patients in this range was 44 (25.7%) and included 12 normal patients and eight patients with high iron over-load. Such cases should be assessed in the clinical context, and a second more precise measurement of iron concentration may be deemed necessary.
Our working group, following our evaluation between 1999 and 2001 of the Rennes University method on 112 patients with different levels of LIC determined by liver biopsies, has further refined the method, designing our own model that uses only two sequences and has a strong correlation with liver biopsy results [5]. With this model, the cut-off points with positive and negative predictive values of 100% for high iron overload are respectively 85 (sensitivity of 86%) and 40 (specificity was 75%). We obtained a bet-ter correlation (r = 0.937) with hepatic biopsy than that obtained using the algorithm from the University of Rennes (r = 0.887) (Figure 3). The formula is LIC = e (5.808-(0.877xT2))-(1.518xIW), where T2 is the L/M value of the sequence (120/14/20º, TR/TE/ flip angle) and IW the L/M value of the sequence (120/4/20º). In our group of patients with LIC < 391 µmol Fe/g, the inclusion of other sequences did not improve the results. This work revealed a method that was more accurate than the University of Rennes method [5].
Signal intensity ratio methods are sufficiently accurate for many cases in clinical practice and
are reproducible, standardized and already widely available.
n T2 relaxometry methods:Nowadays, T2 relaxometry methods (T2* if we use gradient echo [GRE] sequences), are without any doubt the best for LIC determination [23]. They are the most accurate for the assessment of levels of iron surcharge. The concentration of iron in the myocardium is a very important parameter for managing patients with secondary hemochro-matosis. The R2 or T2 values can be computed directly from the fitting of the decay curve with a 'R2' or a 'T2' model. Some groups prefer to use R2* values. The R2* values are linearly correlated with LIC. Other groups prefer to use T2* [39–44].
MRI is a succession of excitations and relaxa-tions and T2 corresponds to the time required for transverse relaxation of 67% of the hydrogen nuclei after an excitation. Iron deposits increase the heterogeneities in the magnetic field, resulting in an acceleration of the T2 relaxation curve that leads to a decline in liver MRI signal proportional to the prominence of LIC. To calculate T2 we need to plot the curve, and for this we need as many data points as possible. Each point corresponds to an echo. These days this is performed automatically with multiecho sequences, using a large number of echoes, referred to as an 'echo train', with a first echo arriving at the 'first echo time (TE)' and a time interval between pulses as short as possible. This may be useful in the case of patients with severe iron overload where T2* is very short.
Many studies have shown a high correlation between the values of T2 and R2 or T2* and R2* and the concentration of iron measured from liver biopsies. Furthermore, it has been con-firmed that the technique is reproducible with different machines [42–44], and has been vali-dated recently in a multicenter validation study developed in Australia [45].
LIC assessed by biopsy has a important vari-ability in normal liver [19]. The same problem could arise in MRI if we perform a single meas-urement. Italian investigators have demonstrated that a single measurement is equivalent to a global one in a population of young thalassemia major patients, with limited steatosis or fibrosis in the livers [46,47]. When the liver presents diffuse steatosis or fibrosis, multi-sample measurements may be necessary.
Classifications have been published that enable patients to be categorized as having different lev-els of overload according to the value of T2 [48], as have mathematical models to transform MRI measurements into values of LIC in milligrams
2.5
2.0
1.5
1.0
0.5
0.0
2.0
1.5
1.0
0.5
0.00 100 200 300 400
Rat
io L
/M
LIC (µmol Fe/g)
2.5 2.0
1.5
1.0
0.5
0.00 100 200 300 400
Rat
io L
/M
LIC (µmol Fe/g)
1.5
1.0
0.5
0.00 100 200 300 400
Rat
io L
/M
Rat
io L
/M
Rat
io L
/M
LIC (µmol Fe/g)0 100 200 300 400 0 100 200 300 400
LIC (µmol Fe/g) LIC (µmol Fe/g)
0
1
2
3
T2+ T2 TW T1 SE
Figure 2. Calculation of R2* values by three different magnetic resonance methods for LIC determination. Correlation with liver biopsy values. LIC: Liver iron concentration. Reproduced from [23].

www.futuremedicine.com 519future science group
MRI for diagnosing iron overload in hemochromatosis & other liver iron disorders PersPective
[42]. However, if we analyse the various reports in the literature, we see that the parameters used and the constants calculated differ greatly from one paper to another and, therefore, in turn, so does the correlation between MRI measure-ments and iron concentrations determined from biopsies.
The parameters used for acquisition of the sequences completely determine the results yet, nevertheless, there is still no consensus on this matter. Hankins et al. compared R2* values with respect to LIC measured by liver biopsies for three different MRI methods in the same
group of patients [35,44]. The model with a first echo of 2 ms had a worse correlation than two models with a first echo of 1 ms (Figure 2).
There is no general consensus on which index (R2, R2*) is the best for LIC determination [49–51]. For T2* calculations, GRE sequences are more sensitive to low iron content but suf-fer from inaccurate results for high iron overload [52]. Christoforidis et al. compared two differ-ent MRI models in 98 patients with thalassemia. One model calculated the R2 and the other R2*; both were validated and there was a lack of cor-relation between the two methods [34].
Figure 3. Magnetic resonance sequences (Gandon's method) in three patients with different values of LIC. (A) Normal levels of LIC; (B) moderate liver iron overload; (C) high iron overload in a hemochromatosis patient; (D) scatterplots of L/M ratio and LIC for each magnetic resonance sequence. LIC: Liver iron concentration. Reproduced with permission from [23].
2.5
2.0
1.5
1.0
0.5
0.0
2.0
1.5
1.0
0.5
0.00 100 200 300 400
Rat
io L
/M
LIC (µmol Fe/g)
2.5 2.0
1.5
1.0
0.5
0.00 100 200 300 400
Rat
io L
/M
LIC (µmol Fe/g)
1.5
1.0
0.5
0.00 100 200 300 400
Rat
io L
/M
Rat
io L
/M
Rat
io L
/MLIC (µmol Fe/g)
0 100 200 300 400 0 100 200 300 400LIC (µmol Fe/g) LIC (µmol Fe/g)
0
1
2
3
T2+ T2 TW T1 SE

Imaging Med. (2013) 5(6)520 future science group
PersPective Castiella, Alústiza, Zapata & Emparanza
Wood and Ghugre have recently reviewed the use of R2 and R2* methods [53]. They have studied in this review the importance of technical MRI aspects: decay models, pixel-wise or ROI based measures, and the importance of the field strength.
T2 calculation has still notable limitations: there is no consensus concerning the best con-stant to measure T2, T2*, R2 or R2*, nor con-cerning the MRI acquisition parameters; nor is there an established model for transforming the MRI measurements to iron concentration values. The main technical weakness on T2* relaxometry is the impossibility to measure very low T2* values (severe iron overload). This is due to the technical limits in first TE setting. But, in our opinion, the most serious limitation is the limited access to the technique. In fact, few machines are available in the world to make these calculations in an automated way [48,54,55].
Recently, Meloni et al. have studied the feasi-bility, reproducibility, and reliability for the T2* iron evaluation at 3T in comparison with 1.5T. T2 and T2* methods, which are dependent on the strength of the magnetic field [56]. The meas-urement of severe iron overload with 3T may be ineffective as T2* significantly decreases at 3T. The diffusion of MRI 3 T machines may weaken the possibility to determine LIC by MRI.
We see that T2 calculation models, in 2013, are already accurate and reproducible but are not standardized and available yet.
n Liver steatosis & LICWestphalen et al. analyzed the interference between iron overload and steatosis in MRI to quantify fat in the liver by using in-phase and opposed-phase sequences [57]. They concluded that it is impossible to use in-phase and opposed-phase sequences to evaluate fat content in the liver in all cases of iron overload.
Steatosis represents an important problem for LIC determination and it is mandatory to take it into account [58]. All the iron sequences must be performed as in-phase sequences to be sure that fat does not interfere with signal intensity measure-ments. If a decreased signal intensity at in-phase imaging is detected, we must perform a LIC study.
Other techniques for fat quantification that are not affected by the presence of iron should be investigated.
n Indications for liver biopsyLiver biopsy in patients with HH is indicated in three situations:1. To determine the disease prognosis by
establishing the fibrosis grade. With
the appearance of noninvasive fibrosis markers, it is known that a serum ferritin value > 1000, a raised AST, and a platelet count < 200,000 are good markers of a high degree of fibrosis [17], and a liver biopsy may be indicated in these patients for prognosis;
2. Diagnosis of other liver diseases associated with iron overload, such as alcoholic liver disease, and nonalcoholic fatty liver disease and nonalcoholic steatohepatitis, and to study the severity of the lesion and the fibrosis grade.
With the coexistence of another disease, liver biopsy may help to clarify the diagnosis and which one is the main cause of the liver disease [3].3. Identification of lesions with preneoplastic
characteristics [10,11], iron-free foci, and dysplastic nodules.
But MRI may help to clarify these three situations too, and, perhaps, liver biopsy is not always necessary. In our opinion, the indication of liver biopsy is nowadays only for the diagnosis of associated diseases or in patients where dis-crepancies between radiologic and biochemical markers exist [3].
n LIC determination & fibrosis predictionThe risk of significant fibrosis or cirrhosis has been associated with the level of LIC [8]. Bassett et al. [59] introduced the concept of a threshold for LIC above which cirrhosis was more likely [59] and Sallie et al. reported that, in addition to LIC, an age greater than 45 years may be a risk factor for significant fibrosis or cirrhosis [60]. In 2005 Olynyk et al. showed that the duration of iron exposure by the liver increases the risk of signifi-cant fibrosis in HH, and considered patient's age as a significant factor for fibrosis prediction [8]. Given the slow progressive nature of iron deposi-tion and the mild inflammation that occurs in HH, Olynyk et al. hypothesized and demon-strated that the duration of hepatic iron exposure, expressed by time and LIC, may be very relevant to the development of significant liver fibrosis [8]. They retrospectively studied 60 patients who had undergone liver biopsy for LIC determination for assessment of HH. They then conducted a pro-spective pilot study in ten additional patients to evaluate the utility of LIC determined by MRI to predict fibrosis. The product of age and LIC (fibrosis-index) obtained by liver biopsy or by MRI, with a 480,000 cut-off, resulted in 100% sensitivity and 86% specificity for the diagnosis

www.futuremedicine.com 521future science group
MRI for diagnosing iron overload in hemochromatosis & other liver iron disorders PersPective
of high degree-fibrosis (F3–F4) [8]. MRI to assess iron load is currently available [19,50,61,62]; conse-quently, liver biopsy is no longer required for the evaluation of iron load [20,63] and the presence of iron in the reticuloendothelial system may be assessed by MRI of the spleen [20], thus discard-ing cases of secondary hemochromatosis (Figure
3). This fibrosis index has been validated exter-nally by our group [9]. The results we obtained were close to those in the original paper, but we think that this index must be taken into account in conjunction with other predictive parameters.
n MRI elastography for fibrosis-prognosis in HHRecently, another noninvasive radiologic tool has been developed for the study of liver fibro-sis: MR elastography [12]. Large Az values for elasticity (>0.990 for scores ≥F2, ≥F3, and F4) showed that MR elastography was accurate in liver fibrosis staging and that it was superior to biochemical testing with s. It seems that it will provide a higher technical success rate than ultrasound elastography and a better diagnostic accuracy than ultrasound elastography and AST to platelet ratio index for staging liver fibrosis [12]. To our knowledge, this promising new non-invasive method has not yet been utilized for the study of hemochromatosis patients.
n Hepatocarcinoma diagnosisHepatic iron-free foci, nodules of hepatocytes without iron or with less iron than the surround-ing liver, are frequently described in the livers of HH patients that are diagnosed with HCC [10]. Deugnier et al. demonstrated in 1993 that these lesions are proliferative and should be considered as preneoplastic foci [10]. Therefore, it was rec-ommended that, if we find these lesions in the initial liver biopsy from a patient with HH, we must perform regular screening for HCC. The authors, in another study, suggest that the pres-ence of iron-free foci may be markers of an early stage of HCC in HH [64].
MRI provides a noninvasive approach to detect these iron-free foci in the livers of patients with HH. In HH the presence of normal liver MRI signal intensity areas reveals iron-free nodules. These lesions are highly suspected to be neoplastic. Guyader et al. studied 116 HH patients in a prospective study to assess the accu-racy of MRI in assessing the prevalence of these iron-free lesions and to determine their nature [11]. The study revealed a high prevalence of HCC at the time of diagnosis of HH, mainly in cirrhotic patients more than 45 years of age.
They concluded that when we perform a LIC determination by MRI in HH patients, a com-plete MRI study is preferable to a simple SIR method in patients at risk of HCC (cirrhosis).
n The importance of a calibrated machine to accurately determine LICMRI may overestimate LIC values [ 65,66]. Standardization of the quantification of iron concentration is fundamental to accurately deter-mine LIC. Since the 1990s, the ability of MRI to accurately measure LIC [5,7,35,39,41,42,44] has been probed and, as a noninvasive tool, this requires standardization of the method with the use of acquisition techniques that are widely available and allow reproducibility of results [54,55].
If this is not done, LIC determinations may be not accurate. In a study performed by our group, the University of Rennes method was useful in 74% of patients to rule out and/or diagnose high iron overload. But the method has a tendency to overestimate [6]. Other groups have com-pared different methods and their accuracies in determining LIC. Recently, Juchems et al. have confirmed that the method of the University of Rennes tends to overestimate LIC [37,38]. This could lead to different decisions concerning treatment management in individual patients.
The reproducibility of a LIC determination by MRI methods requires its validation in differ-ent machines. There are groups that propose a specific calibration of each machine. The SI can vary between similar MR machines. This varia-tion can be observed even with machines from the same commercial brand [5,7,21,30,31]. The tech-nique appears to be more reproducible than was thought, as it has been demonstrated, but it has to be performed in more centers. Specific phantoms may help the reproducibility analysis [21,32].
In Australia, the group from St Pierre et al. developed a phantom with MnCl
2 at different
concentrations that obtained R2 values that are compatible with those of healthy and high over-loaded livers. This phantom is being used and sold in the FerriScan quantification web model [67] and it has provided a correct configuration for the different machines [39].
Our group have designed an iron chloride (III) phantom, with different Fe solutions [68,69]. We used 0.3, 0.5, 0.6 and 1.2 mgFe/ml concen-trations with the aim of obtaining ratios that were similar to average L/M values in patients with moderate and high liver iron overload. This was performed for the two sequences that our group has used for our proposed LIC by MRI algorithm [68,69].

Imaging Med. (2013) 5(6)522 future science group
PersPective Castiella, Alústiza, Zapata & Emparanza
Other centers in Spain have shown interest in using our model. This has raised the question of its reproducibility using other machines. With this objective, we designed and validated phan-toms with various levels of iron concentration that exactly reproduce the behavior of patients with slight to moderate and high overload in our model. Between 2004 and 2007, with the support of the Spanish Society for Abdominal Radiology, we calibrated a total of 40 different centers in Spain. In these centers we can work together and assess various pathologies and treat-ments using the same standardized protocol. Two centers have had to modify their sequences and another two found it necessary to introduce a correction factor to the output value [68,69].
There is online access to LIC determina-tions via the web of the Spanish Society for Abdominal Radiology (SEDIA) [70].
ConclusionIn 2004, Gandon wrote that, “surprisingly, the technique [MRI] is rarely used in management of patients with suspected iron overload, which is probably attributable to the absence of mul-ticentric studies assessing the reproducibility of MRI” [7]. Unfortunately, in 2013, the situation has not substantially improved.
In 2013, generalization of the use of the tech-nique is only possible through SIR models. The MRI technique proposed by Gandon is capable of recognizing all levels of iron overload and is straightforward to implement with any machine; it is reproducible and available. For a model to calculate LIC there are three possibilities. There is the online model of the University of Rennes, which has the limits we have already seen with some patients with normal LIC or moderate iron
overload. There is our model, which, as well as precision in the calculation, offers the advan-tage of there being a phantom freely available to calibrate any 1.5 Tesla machine. Finally, there is also the University of Lille model, which enables patients with values of more than 350 µM in the Rennes model to be assessed more accurately.
In 2005, Pietrangelo wrote an article titled: Non invasive assessment of hepatic iron overload: are we finally there? [71]. It seems that with the available evidence nowadays we can affirm that noninvasive LIC determination by MRI, when we utilize a calibrated MR machine, is clearly accurate enough to be the new gold standard.
Future perspectiveVery probably T2* methods will be standardized and more accurate techniques will be provided to determine LIC by MRI in HH and other liver diseases with iron overload. In the not too distant future, approximately 5–10 years, correct meas-urements of T2 will be more available, the acqui-sition parameters will be agreed on and there will be standardized models to transform the results to µmol Fe/g in an automatic and reliable way.
The need of liver biopsy for prognostic pur-poses will be, very probably, anecdotal.
Financial & competing interests disclosureThe authors have no relevant affiliations or financial involvement with any organization or entity with a finan-cial interest in or financial conflict with the subject matter or materials discussed in the manuscript. This includes employment, consultancies, honoraria, stock ownership or options, expert testimony, grants or patents received or pending, or royalties.
No writing assistance was utilized in the production of this manuscript.
Executive summary
� The gold standard for the diagnosis of disease and liver iron concentration (LIC) has been liver biopsy for many years. � There is not an indication to perform a liver biopsy in hereditary hemochromatosis if the patient is C282Y homozygous and doesn’t have
risk factors for high degree fibrosis. � MRI frequently avoids a liver biopsy to determine LIC. � Liver MRI has clearly shown an accurate assessment of LIC over a range of iron concentrations, either by signal intensity ratio (SIR) or
relaxometry methods. � In non-HFE hemochromatosis, MRI confirms the presence or not of iron overload and establishes the need for treatment. � Fat may interfere with signal intensity measurements. To be sure that this will not occur, all the iron sequences must be performed as
in-phase sequences. � To respond to the current challenges in clinical practice, it is necessary to have a universally accepted MRI method that is accurate,
reproducible, standardized and widely available. � Standardization of LIC quantification by MRI is fundamental to accurately determine it. If not, MRI may overestimate LIC. � Relaxometry methods are the best, and already accurate and reproducible, but they are not standardized and widely available yet. � SIR methods are sufficiently accurate for many cases in clinical practice and are reproducible, standardized and already widely available. � We can conclude that, nowadays, MRI provides the gold standard for LIC determination for HH patients and for non-HFE
hemochromatosis. MRI provides an accurate determination of LIC in patients with liver diseases without HH.

www.futuremedicine.com 523future science group
MRI for diagnosing iron overload in hemochromatosis & other liver iron disorders PersPective
ReferencesPapers of special note have been highlighted as:n of interestnn of considerable interest
1. Pietrangelo A. Hereditary hemochromatosis – a new look to an old disease. N. Engl. J. Med. 350, 2383–2397 (2004).
•• A great review of hereditary hemochromatosis (HH) in 2004 that pointed out all the changes developed to date in the pathophysiology and diagnosis of the disease.
2. Feder JN, Gnirke A, Thomas W et al . A novel MHC class I-like gene is mutated in patients with hereditary hemochromatosis. Nat. Genet. 13, 399–408 (1996).
•• This article in 1996 was an authentic revolution for the diagnosis and management of hereditary hemochromatosis. They describe the discovery of the HFE gene and the mutations responsible for the disease.
3. Castiella A, Alústiza JM, Zapata E. Non invasive methods for liver fibrosis prediction in hemochromatosis: one step beyond. World J. Hepatol. 2, 251–255 (2010).
4. Castiella A, Alústiza JM, Zapata E et al . Is the role of liver biopsy changing in hemochromatosis? A non-invasive approach is ready. Gastrointest. Liver Dis. 21, 326–327 (2012).
5. Alustiza JM, Artetxe J, Castiella A. MR quantification of hepatic iron concentration. Radiology 230, 479–484 (2004).
•• This study of 112 patients with liver biopsy and liver iron concentration (LIC) determination by MRI externally validated the method of Gandon et al. They developed a mathematical formula with the two most efficient sequences that demonstrated a more accurate determination of LIC.
6. Castiella A, Alústiza JM, Emparanza JI, Zapata E, Costero B, Díez M. Liver iron concentration quantification by MRI: are recommended protocols accurate enough for clinical practice? Eur. Radiol. 21, 137–141 (2011).
• This study evaluated the accuracy of LIC determination by MRI with the University of Rennes protocol. They revealed a tendency to overestimation that has since been confirmed by others.
7. Gandon Y, Olivie D, Guyader PD. Non-invasive assessment of hepatic iron stores by MRI. Lancet 363, 357–362 (2004).
•• This work presented the results of 149 patients with liver biopsies and MRI studies. The estimation of LIC was performed by a signal intensity ratio (SIR) model. This is the most widely recognized and utilized
method for LIC determination. They also established online access to perform LIC determination calculations using their method.
8. Olynyk JK, Pierre TG, Britton RS, Brunt EM, Bacon BR. Duration of hepatic iron exposure increases the risk of significant fibrosis in hereditary hemochromatosis: A new role for magnetic resonance imaging. Am. J. Gastroenterol. 100, 837–841 (2005).
9. Castiella A, Emparanza JI. External validation for fibrosis predicting index in hereditary hemochromatosis. Am. J. Gastroenterol. 100, 2366–2367 (2005).
10. Deugnier YM, Charalambous P, Le Quilleuc D, et al. Preneoplastic significance of hepatic iron-free foci in genetic hemochromatosis: a study of 185 patients. Hepatology 18, 1363–1369 (1993).
11. Guyader D, Gandon Y, Sapey T et al . Magnetic resonance iron-free nodules in genetic hemochromatosis. Am. J. Gastroenterol. 94,1083–1086 (1999).
12. Huwart L, Sempoux C, Vicaut E et al. Magnetic resonance elastography for the noninvasive staging of liver fibrosis. Gastroenterology 135, 32–40 (2008).
13. Warren JR. Unidentified curved bacilli on gastric epithelium in active chronic gastritis. Lancet 1, 1273 (1983).
14. Marshall B. Unidentified curved bacilli on gastric epithelium in active chronic gastritis. Lancet 1, 1273–1274 (1983).
15. Guyader D, Jacquelinet C, Moirand R et al. Noninvasive prediction of fibrosis in C282Y homozygous hemochromatosis. Gastroenterology 115, 929–936 (1998).
16. Bacon BR, Olynyk JK, Brunt EM, Britton RS, Wolff RK. HFE genotype in patients with hemochromatosis and other liver diseases. Ann. Intern. Med. 130, 953–962 (1999).
17. Beaton M, Gutader D, Deugnier Y, Moirand R, Chakrabarti S, Adams P. Noninvasive prediction of cirrhosis in C282Y-linked hemochromatosis. Hepatology 36, 673–678 (2002).
18. Morrison ED, Brandhagen DJ, Phatak PD et al. Serum ferritin level predicts advanced hepatic fibrosis among U.S. patients with phenotypic hemochromatosis. Ann. Intern. Med. 138, 627–633 (2003).
19. Alustiza JM, Castiella A, De Juan MD Emparanza JI, Artetxe J, Uranga M. Iron overload in the liver: diagnostic and quantification. Eur. J. Radiol. 61, 499–506 (2007).
20. Pietrangelo A, Corradini E, Ferrara F et al. Magnetic resonance imaging to identify classic and nonclassic forms of ferroportin
disease. Blood Cells Mol. Dis. 37, 192–196 (2006).
21. Brittenham GM, Badman DG. Non-invasive measurement of iron: report of an NIDDK workshop. Blood 101, 15–19 (2003).
22. Kruger PC, Leahy MF, Olynyk JK. Assessing iron overload: are we there yet? Clin. Cancer Res. 18, 6395–6397 (2012).
23. Alustiza JM, Castiella A, Emparanza JI. Quantification of iron concentration in the liver by MRI. Insights Imaging 3, 173–180 (2012).
24. Froehlich F, Lamy O, Fried M, Gonvers JJ. Practice and complications of liver biopsy. Results of a nationwide survey in Switzerland. Dig Dis Sci 38, 1480–1484 (1993).
25. Thampanitchawong P, Piratvisuth T. Liver biopsy: complications and risk factors. WJG 5, 301–304 (1999).
26. Villeneuve JP, Bilodeau M, Lepage R,, Cote J, Lefebvre M. Variability in hepatic iron concentration measurement from needle-biopsy specimens. J Hepatol 25, 172–177 (1996).
27. Bedossa P, Dargere D, Paradis V. Sampling variability of liver fibrosis in chronic hepatitis C. Hepatology 38, 1449–1457(2003).
28. de Sterke P. Should we continue to perform liver biopsies in hereditary hemochromatosis (HH)? Open letter to all doctors involved in hereditary hemochromatosis. January 5 (2010).
29. Falize L, Guillygomarc’h A, Perrin M et al . Reversibility of hepatic fibrosis in treated genetic hemochromatosis: a study of 36 cases. Hepatology 44, 472–477 (2006).
30. Ernst O, Sergent G, Bonvarlet P, Canva-Delcambre V, Paris JC, L’Herminé C. Hepatic iron overload: diagnosis and quantification with MR imaging. AJR 168, 1205–1208(1997).
31. Ernst O, Rose C, Sergent G et al. Hepatic iron overload: quantification with MR imaging at 1.5 T. AJR 172, 1141 –1142 (1999).
32. Bonkovsky HL, Rubin RB, Cable EE et al. Hepatic iron concentration: noninvasive estimation by means of MR Imaging techniques. Radiology 212, 227–234 (1999).
33. Gandon Y. Iron and liver. www.radio.univ-rennes1.fr
34. Christoforidis A, Perifanis V, Spanos G et al. MRI assessment of liver iron content in thalassemic patients with three different protocols: comparisons and correlations. Eur. J. Haematol. 82, 388–392 (2009).
35. Rose C, Vandevenne P, Bourgeois E, Cambier N, Ernst O. Liver iron content assessment by routine and simple magnetic imaging procedure in highly transfused patients. Eur. J. Haematol. 77, 145–149 (2006).

Imaging Med. (2013) 5(6)524 future science group
PersPective Castiella, Alústiza, Zapata & Emparanza
36. Quantification of high liver iron concentration (>300 µmol/g dw/w) by magnetic resonance imaging. http://oernst.f5lvg.free.fr/liver/iron.html
37. Juchems MS, Cario H, Schmid M et al. Liver iron content determined by MRI: spin-echo vs. gradient-echo. Rofo 184, 427–431 (2012).
38. Juchems MS, Cario H, Wunderlich A. Comparison of different methods for determination of liver iron content. ESR CongressC-2248 (2012).
39. St PierreTG, Clark PR, Chua-anusorn W. Noninvasive measurement and imaging of liver iron concentrations using proton magnetic resonance. Blood 105, 855–861 (2005).
•• Study of 105 patients with liver biopsies and MRI determination of LIC. They utilized a relaxometry method. A phantom for calibration of different machines was developed.
40. Alexopoulou E, Stripeli F, Baras P et al. R2 relaxometry with MRI for the quantification of tissue iron overload in beta-thalassemic patients. J. Magn. Reson. Imaging 23, 163–170 (2006).
41. Anderson LJ, Holden S, Davis B. Cardiovascular T2-star (T2*) magnetic resonance for the early diagnosis of myocardial iron overload. Eur. Heart 22, 2171–2179 (2001).
• This study enabled, for the first time, assessment of myocardial and liver iron concentrations along with cardiac function in the same scan. The cardiac magnetic resonance T2* scanning in 106 patients revealed marked discordance between liver and heart iron concentrations in many patients with thalassaemia major.
42. Wood JC, Enriquez C, Ghugre N et al. MRI R2 and R2* zapping accurately estimates hepatic iron concentration in transfusion-dependent thalassemia and sickle cell disease patients. Blood 106, 1460–1465 (2005).
43. Westwood MA, Anderson LJ, Firmin DN et al. A single breath-hold multiecho T2* cardiovascular magnetic resonance technique for diagnosis of myocardial iron overload. J Magn Reson Imaging 18, 33–39 (2003).
44. Hankins JS, McCarville MB, Loeffler RB et al. R2* magnetic resonance imaging of the liver in patients with iron overload. Blood 113, 4853–4855 (2009).
45. St PierreJP, El-Beshlawy A, Elalfy M. Multicenter validation of spin-density
projection assisted R2-MRI for the noninvasive measurement of liver iron concentration. Magn. Reson. Med. DOI 10.1002/mrm.24854 (2013) (Epub ahead of print).
46. Positano V, Salani B, Pepe A. Improved T2* assessment in liver iron overload by magnetic resonance imaging. Magn. Reson. Imaging 27, 188–197 (2009).
47. Meloni A, Luciani A, Positano V. Single region of interest versus multislice T2* MRI approach for the quantification of hepatic iron overload. J. Magn. Reson. Imaging 33, 348–355 (2011).
48. Angelucci E, Barosi G, Camaschella C et al. Italian Society of Hematology practice guidelines for the Management of iron overload in thalassemia major and related disorders. Haematologica 93, 741–752 (2008).
49. St Pierre TG, Clarck PR, Chua-Anusorn W. Single spin-echo proton transverse relaxometry of iron loaded-liver. NMR Biomed. 17, 446–448 (2004).
50. Wood JC. Magnetic resonance imaging measurement of iron overload. Curr. Opin. Hematol. 14, 183–190 (2007).
51. Argyropoulou MI, Astrakas L. MRI evaluation of tissue iron burden in patients with beta-thalassemia major. Pediatr. Radiol. 37, 1191–1200 (2007).
52. Papakonstantinou O, Kostaridou S, Man’s T. Quantification of liver iron overload by T2 quantitative magnetic resonance imaging in thalassemia: impact of chronic hepatitis C on measurements. J. Pediatr. Hematol. Oncol. 21, 142–148 (1999).
53. Wood JC, Ghugre N. Magnetic resonance imaging assessment of excess iron in thalassemia, sickle cell disease and other iron overload diseases. Hemoglobin 32, 85–96 (2008).
54. Taouli B, Ehman RL, Reeder SB. Advanced MRI methods for assessment of chronic liver disease. AJR 193, 14–27 (2009).
55. Wood JC. History and current impact of cardiac magnetic resonance imaging on the management of iron overload. Circulation 120, 1937–1939 (2009).
56. Meloni A, Positano V, Keilberg P. Feasibility, reproducibility, and reliability for the T2* iron evaluation at 3T in comparison with 1.5T. Magn. Reson. Med. 68, 543–551 (2012).
57. Westphalen AC, Qayyum A, Yeh BM. Liver fat: effect of hepatic iron deposition on evaluation with opposed-phase MR imaging. Radiology 242, 450–455 (2007).
58. Alústiza JM, Castiella A. Liver fat and iron at in-phase and opposed-phase MR imaging. Radiology 246, 641 (2008).
59. Bassett ML, Halliday JW, Powell LW. Value of hepatic iron measurements in early hemochromatosis and determination of the critical level associated with fibrosis. Hepatology 6, 24–29(1986).
60. Sallie RW, Reed WD, Shilkin KB. Confirmation of the efficacy of hepatic tissue iron index in differentiating genetic haemochromatosis from alcoholic liver disease complicated by alcoholic haemosiderosis. Gut 32, 207–210 (1991).
61. Queiroz-Andrade M, Blasbalg R, Ortega CD. MR imaging findings of iron overload. Radiographics 29, 1575–1589 (2009).
62. Tziomalos K, Perifanis V. Liver iron content determination by magnetic resonance imaging. World J. Gastroenterol. 16, 1587–1597 (2010).
63. Pietrangelo A. Non-invasive assessment of hepatic iron overload: are we finally there? J. Hepatol. 42, 153–154 (2005).
64. Deugnier YM, Guyader D, Crantock L et al . Primary liver cancer in genetic hemochromatosis: a clinical, pathological, and pathogenetic study of 54 cases. Gastroenterology 104, 228–234 (1993).
65. Chen LY, Chang SD, Sreenivasan GM et al. Dysmetabolic hyperferritinemia is associated with normal transferring saturation, mild hepatic iron overload and elevated hepcidin. Ann. Hematol. 90, 139–143 (2011).
66. Castiella A, Alústiza JM, Zapata E et al. Mild hepatic iron overload in dysmetabolic hyperferritinemia: MRI may overestimate the liver iron concentration values. Ann. Hematol. 91, 961 (2012).
67. FerriScan quantification web model. www.FerriScan.com
68. Alústiza JM, Emparanza JI, Aldazábal P et al. Standardization of the quantification of iron concentration in the liver by magnetic resonance imaging. Radiologia 54, 149–154 (2012).
69. Alústiza JM, Emparanza JI, Casado A et al. Phantom for the standardisation of the quantification of liver iron concentration (LIC) using MRI. The European Iron Club (EIC). Abstracts Book. p072 (2006).
70. SEDIA www.sedia.es
71. Pietrangelo A. Non-invasive assessment of hepatic iron overload: are we finally there? J. Hepatol. 42, 153–154 (2005).