Embed Size (px)
Citation preview

DPRIETI Discussion Paper Series 14-E-048
Is Productivity Growth Correlated with Improvementsin Management Quality?
An empirical study using interview surveys in Korea and Japan
MIYAGAWA TsutomuRIETI
Keun LEESeoul National University
EDAMURA KazumaNational Institute of Science and Technology Policy
YoungGak KIMSenshu University
Hosung JUNGSamsung Economic Research Institute
The Research Institute of Economy, Trade and Industryhttp://www.rieti.go.jp/en/

1
RIETI Discussion Paper Series 14-E-048
August 2014
Is Productivity Growth Correlated with Improvements in Management Quality?
An empirical study using interview surveys in Korea and Japan1
MIYAGAWA Tsutomu (Gakushuin University and RIETI)
Keun LEE (Seoul National University)
EDAMURA Kazuma (National Institute of Science and Technology Policy)
Young Gak KIM (Senshu University)
Hosung JUNG (Samsung Economic Research Institute)
Abstract Bloom and Van Reenen (2007) show that differences in management practices are correlated with productivity differences at the firm level. In this paper, we conducted similar interview surveys on management practices in Japanese and Korean firms in 2008 and 2012. We find that overall management scores in Japan—as an average of organizational and human resource management scores—are higher than those in Korea. However, the second survey shows that the gap in management scores between the two countries has shrunken over time. In addition, the average management quality in Korean large firms has surpassed that of Japanese large firms. This result is consistent with the literature comparing big businesses in Korea and Japan. This study also compares additional aspects of management styles, such as speed in decision making and the role of various communication channels, which is not done in the literature. When we estimate a production function including management score using all samples, we find a positive and significant relationship between management scores and productivity. Most estimation results show that organizational management scores are correlated with firm performances in Japanese firms, while human resource management scores are correlated with performance in Korean firms. We also find that management practices are correlated with improvements in capital and labor efficiencies. In the case of Japan, better organizational management practices in the past improve current firm performance. Our results show that the Japanese government and firms should promote management reforms to restore international competitiveness.
Keywords: Management practices, Organizational management, Human resource management, Kolmogorov=Smirnov
Test, Capital efficiency, Labor efficiency
JEL classification numbers: D22, L20, M11, M12, M54
1 This study is conducted as a part of the Project “Study on Intangible Assets in Japan” undertaken at Research Institute of Economy, Trade and Industry (RIETI) We thank Professor Masahisa Fujita (President of RIETI), Dr. Masayuki Morikawa (Vice President of RIETI), and Professor Fukao (Hitotsubshi Univeristy) for helpful comments and discussions at the seminar in RIETI. This study is partly supported by a Grant-in-Aid for Scientific Research from the Ministry of Education, Culture, Sports, Science and Technology (No.22223004) of Japan.
RIETI Discussion Papers Series aims at widely disseminating research results in the form of professional papers, thereby
stimulating lively discussion. The views expressed in the papers are solely those of the author(s), and neither represent those of the
organization to which the author(s) belong(s) nor the Research Institute of Economy, Trade and Industry.

1
1. Introduction
In 1997, Japan and Korea suffered similar financial crises and successive deep recessions. However, the recovery
processes in the two countries are in stark contrast with each other. Although the Japanese economy has stagnated for
a long time due to large non-performing loans, the Korean economy recovered rapidly. As a result, firm performance
in Korea overcame that in Japan in some competing industries such as electric machineries and electric devices as
shown in Fukao et al. (2008). In growth accounting using the framework of McGrattan and Prescott (2005, 2010),
Miyagawa and Takizawa (2011) showed that the labor productivity gap between Japan and Korea after the financial
crises could be explained by the differing accumulation in intangible assets as well as TFP growth.
Many studies at the firm level found that the Korean firms are rapidly catching up with Japanese firms in terms
of productivity and market shares in several sectors. Jung, Lee, and Fukao (2008) noted that while productivity at
Korean firms was as low as half of the Japanese in the mid 1980s, there had been substantial catch-up and productivity
of Korean firms were on average within 10 percent of Japanese firms in the late 1990s. Jung and Lee (2010) find
factors at both sectoral and firm levels leading to the converging productivity rates: while explicit-knowledge-oriented
sectors, like IT, tend to show faster catch-up, firm-level factors, such as innovation capability and export-orientation,
were also significant. Joo and Lee (2010) compare Samsung and Sony in various measures created from patent data,
including citations. They conclude that while Samsung caught up with Sony in the mid-2000s in terms of market
capitalization and sales volume, technological catch-up, in terms of patent count, quality and mutual citations, etc.,
occurred as early as the mid-1990s. While there would be many diverse reasons that Korea caught up with Japan,
existing studies tend to consider mostly tangible aspects of the firms -- often reflected in standard financial statements
or patent application data. As Aoki (2010) emphasized, intangible factors such as the organizational architecture
within a firm are major drivers of corporation system in each country. The aim of our study is to apply the previous
studies to the firm level, looking into more intangible aspects including management practices of the firms in the two
countries.
The role of these intangible assets on economic performance was found through empirical studies in the first
half of the 2000s. When the IT revolution started in the middle of the 1990s, many economists and policymakers
believed that the rapid growth in the IT industry and increased IT investment contributed to the acceleration of US
economic growth. As a result, many governments in advanced countries supported the IT industry and encouraged IT
investment. However, the gaps in economic or productivity growth rates between the US and other advanced countries

2
have remained intact, even in the early 2000s. Since then, many economists have begun to pay attention to the
complementary role of intangible assets in productivity growth. That is, they started to understand that IT assets
without intangible assets, do not contribute to productivity growth at the firm and aggregated level.2
Corrado, Hulten and Sichel (hereafter referred to as CHS, 2005, 2009), estimated the investment in intangible
assets at the aggregate US economy level, classifying intangible assets into three categories: computerized information,
innovative property, and economic competencies. Many researchers in other advanced countries followed CHS (2009),
and tried to estimate intangible investment.3 Comparing the estimation results in Japan with those in the US and the
UK, Fukao et al. (2009) and Pyo, Chun and Rhee (2011) found the following characteristics of intangible investment
in Japan and Korea. First, investment in computerized information in Japan and Korea, measured as a share of GDP, is
almost the same as that in the US and the UK. Second, due to the large R&D investment levels in Japan, the ratio of
investment in innovative property to GDP is greater than in the US and the UK. Third, as for investment in economic
competencies, the investment/GDP ratio in Japan and Korea is much smaller than that in the US and the UK.
The third category includes investment in brand equity, firm-specific human capital, and organizational reform.
Among these, the investment in firm-specific human capital and organizational reform in Japan is much smaller than
that in the US and the UK. However, it is difficult to estimate these investment amounts at the aggregate level and to
compare these amongst advanced countries.4 In addition, these investments depend on management practices at the
firm level. Therefore, recent studies on intangible investment have focused on management practices on human
resource management and organizational reform at the firm level using micro-data.
Bloom and Van Reenen (2007) examined the effects of management practices on firm performance based on
interview surveys of plant managers. Management practices were converted to scores based on interview results, and
these scores were included as independent variables when they estimated the production function. The key finding in
their paper was that there is a large difference in management scores among surveyed countries (France, Germany, the
UK, and the US). US firms attained the highest score of the four countries studied. They believed that the low score in
continental European firms was partially explained by weak competition and the prevalence of many family-owned
firms. The estimation results showed that the differences in productivity were correlated with the differences in
average management scores. We conduct an interview survey similar to Bloom and Van Reenen’s in Japan and Korea
2 Economic Report of the President 2007 stated ‘Only when they (businesses) made intangible investments to complement their IT investments did productivity growth really take off.’ (p. 56) 3 See Corrado, Haskel, Jona-Lasinio, and Iommi (2013) for the US, EU countries and Japan, Chun, Fukao, Hisa and Miyagawa (2012) for Korea and Japan. 4 For example, CHS (2009) does not account for the investment in firm-specific human capital through on-the–job training while this type of investment is very important in Japanese and Korean firms.
3
and use it to explain the performance gap between Japanese and Korean firms. In Japan, Kurokawa and Minetaki
(2006), Kanamori and Motohashi (2006), and Shinozaki (2007) examined the effects of organizational reform
resulting from IT investment on firm performance by using the Basic Survey on Business Enterprise Activities and IT
Workplace Survey. Their studies suggested that organizational reform from IT investment was partially responsible for
improving firm performance. Our work develops on previous studies in Japan by comparing the performance in
Japanese firms with that in Korean firms.
In the next section, we describe our interview survey. Although it pretty much follows Bloom and Van Reenen
(2007), we incorporate some questions that were not included there to capture some unique features of Japanese and
Korean firms, such as the role of informal meetings within the firm and on-the-job training. In the third section, we
construct management scores by quantifying the interview results of Japanese and Korean firms, and compare the
management practices of firms. In the fourth section, using the management scores and financial statements of
Japanese and Korean firms, we estimate a production function and examine the effects of management practices on
firm performance. In the last section, we summarize our studies.
2. Outline of Interview Surveys in Japan and Korea
The interview surveys on management practices on organization and human resource in Japan and Korea were
conducted twice: First in 2008 and the second time in 2011-2012.5 The description of each survey is summarized in
Table 2. The two Japanese surveys were conducted by the Research Institute of Economy, Trade & Industry (RIETI).
The first Korean survey was conducted by the Japan Center for Economic Research (JCER), and the second Korean
survey was conducted by the Samsung Economic Research Institute. The second Japanese survey was originally
scheduled to be conducted in 2011, but was postponed to 2012 due to the Great East-Japan Earthquake of March 2011.
The number of responses in the second survey was drastically lower than the first, partly because of the earthquake
and also because we limited the interviewees to publicly traded firms.
(Place Table 1 here)
In our study, though we followed the interview survey conducted by Bloom and Van Reenen (2007) we
conducted the survey by meeting the managers of the planning departments of firms face-to-face, rather than by
5 The interview survey in Japan is called as ‘Intangible Assets Interview Survey in Japan” in RIETI website.

4
telephone as Bloom and Reenen did. The reason we conducted our interviews in this way is that we were anticipating
low response rates. In Japan and Korea, when we want to ascertain qualitative features in firms, face-to-face
communication is a more effective tool than telephone interviews.
Bloom and Van Reenen (2007) classified their eighteen interview questions into four categories: product
management, monitoring, the firm’s target on business, and incentives for workers. While their survey focused on only
manufacturing plants, our survey covered firms in the service sector as well. Thus, we excluded questions about
product management for the service sector. As a result, we can classify our questions into two categories:
organizational management and human resource management. In the first category, we wanted to examine the
organizational goals, communication within the firm, and organizational reform. The second category about human
resource management covers questions on promotion and training programs.
The interview also includes questions that are not directly related to management practices or human resource
management. Since the IT revolution, changing the pyramid-type decision-making process into a more flat process
became more common. We ask questions to understand whether firms underwent organizational restructuring that
included changes in the decision-making process. In the first round, we also asked about the vision of the firm. In the
second round of interviews, considering the globalization that was taking place, we included questions regarding firms’
primary market and competitiveness (number of competitors), and the time it takes to enter and exit businesses. The
detailed interview questions are shown in Appendices1 and 2.
For each question, we have three sub questions. The structure of the point system is that the more sub-questions
answered in the affirmative in each large question, the more points you score for instance, in human resource
management. In each question with 3 sub-questions, a score of 4 points would be applied if all of the 3 sub-questions
were answered affirmatively. Similarly, with affirmative answers to the first 2 sub-questions only, you would score 2
points. In other words, we quantify the responses to the above questions as follows: If the firm manager responds in
the negative to the first sub-question, we would give the response 1 out of a possible total of 4 points for the entire
question, and move to the next question. If the manager responds affirmatively to the first sub-question, we move to
the second sub-question. If the manager responds negatively to the second sub-question, we mark a 2 and move to the
next question. If he responds affirmatively to the second sub-question, we move to the last and third sub-question. In
the last sub-question, if the manager responds with an affirmative answer, he is given 4 points for affirmative response
for all three sub-questions while a negative response is given 3 points for the two previous sub-questions he answered
in the affirmative.

5
3. Comparison of Interview Survey Results in Korea and Japan
3-1. Distribution of sample firms by sector and by size
We first show the distribution of the firms interviewed. Table 2 shows the share of firms in the manufacturing sector
and the service sector for both surveys. In the first survey, we interviewed machinery industries in the manufacturing
sector, and in the service sector, we interviewed information service, media-related and the retail industry. In the
second survey, since the sample was limited to publicly traded firms, we did not limit the interview to specific
industries. As the first Japanese survey focused on specific industries in the manufacturing sector, the share of firms in
the manufacturing sector was relatively small, and the share of firms in the manufacturing to service sector was about
33%. In the second survey, the ratio is reversed. In both the Korean surveys, on the other hand, the manufacturing
sector constitutes approximately 80% of the interviewees.
(Place Table 2 here)
Table 3 shows the distribution of firms by size. In the Japanese surveys, small and medium sized firms with
fewer than 300 employees constituted about half of the sample. On the other hand, in the first Korean survey, the share
of small and medium-sized firms dominated the survey and accounted for 73% of the sample. In the second Korean
survey, however, this share fell to 54%.
(Place Table 3 here)
3-2. Comparison of management scores
We now compare management scores. In the first survey, we take the average of these scores in Q2, Q4, Q5, and
Q7-Q13 to obtain an overall management score. In the second survey, we take the average of the scores assigned to Q3,
Q4, Q5, Q6-1, Q10-2, Q10-3, and Q10-4. The organizational management scores are the average scores in Q2 in the first
survey and the average score in Q3 and Q10-1 in the second survey. Also, the human resource management score is
the average score in the questions that are not related to organizational management. A high management score
implies that management targets within a firm are set and widely recognized by the employees. On the other hand, the
human resource management score is high when high performing employees receive rewards and promotion swiftly,

6
and when firms invest in human capital accumulation.
Table 4 shows the management scores in Japan and Korea. In both surveys, management scores in Japanese
firms are higher than those in Korean firms except for the case of management scores for large firms in the second
survey. However, the Japanese management score falls slightly between the first and second survey while the Korean
management score increases greatly between the first and second survey, catching up with Japan. In particular, the
management score in Korean large firms surpasses that in Japanese large firms in Japan.
(Place Table 4 here)
Figures 1-1 to 1-4 show the distribution of scores in all firms and all interview questions in Japan and Korea
by using the Kernel density. We find that the distributions of management scores in Korean firms are more dispersed
than in Japanese firms. This implies that there are many high scoring firms and low scoring firms in Korea while
management scores in Japanese firms are more concentrated around their mean values. When we compare the
distributions in the two surveys in both countries, the distributions in the second survey in Japan is shifted slightly to
the left. On the other hand, the distributions in the second survey in Korea shift drastically to the right
(Place Figure 1-1 to Figure 1-4 here)
We check similar distributions by type of management and by firm size (see Figures 2-1 to 2-8). The
distributions of organizational management scores and human resource management scores show similar patterns to
Figures 1-3 and Figure 1-4. When we compare the two surveys, the distributions of the two types of management
scores in the second survey in Japan are pretty much the same. However, the two distributions of the management
scores in the second survey in Korea shift greatly to the right. In the case of small and medium-sized firms, we also
see similar patterns for other cases.
(Place Figure 2-1 to Figure 2-8 here)
The distributions of management scores by firm size show similar patterns to those by type of management. In
large firms, the distribution of management score in the second survey in Korea showed a great shift to the right, while

7
that in Japan shifted slightly to the left. These shifts suggest that the means of the management scores in Korean large
firms is greater than that in Japanese large firms. In addition, these results support the notion that the performances in
the listed Korean firms surpassed those in the Japanese listed firms, as shown by Jung, Lee, and Fukao (2008) and
Joo and Lee (2010). Similarly, the distribution of management scores of the Korean SMEs shifts to the right, although
the distribution of management scores in the Japanese SMEs in the second survey does not move much.
We compare the two distributions of the first and second surveys of Japan and Korea by using the
Kolmogorov=Smirnov test. Let us examine the two cumulative distribution functions (F(x) and G(x)) and take the
maximum differences between two distributions ( ) defined from the sample distribution functions of F(x) and
G(x).
In the Kolmogorov=Smirnov test, the null hypothesis is that the two distributions are the same (F(x)=G(x)). If
the test statistics and c is an appropriate constant, the null hypothesis is rejected.
The test results are shown in Table 5. The Kolmogorov=Smirnov test is conducted in four cases: the comparison
of the two distributions in Japan and Korea in the first survey, the comparison of the two distributions in Japan and
Korea in the second survey, the comparison of the two distributions in the first and second surveys in Japan, and the
comparison of the two distributions in the first and second surveys in Korea. In the first two rows of the first two
tables, we test the hypothesis of whether the sample values in Japan are significantly smaller than those in Korea. The
last row shows the combined results of the previous two tests. ‘Distance’ in the second column shows the maximum
distance in the case where the sample value in Japan is less than that in Korea. P values in the first and second surveys
show that sample values in Japan are not significantly smaller than those in Korea. Similarly, the P value in the third
table shows that the sample values in the first survey are not significantly smaller than those in the second survey in
Japan. In the case of Korea, however, the sample values in the first survey are significantly smaller than those in the
second survey. The second row of the table tests the opposite case. The Kolmogorov=Smirnov test shows that sample
values in Japan are significantly larger than those in Korea in both surveys. In the case of the first and second surveys
in Japan, the sample values in the first survey are significantly larger than those in the second survey in Japan.
(Place Table 5 here)
mnD
)()(sup xGxFD nmxmn −= ∞<<∞−
cDnm
mnmn >+
2/1)(

8
These tests imply that the distributions of management scores in Japan have shifted significantly to the right to a
greater degree than those in Korea in both interview surveys. Since high scores in organizational management indicate
a greater degree of transparency of organizational goals or aggressive organizational reform we can conclude that
overall, either the organizational targets are clear to all employees in Japan in more cases than in Korea, or Japanese
firms improve their organizational structures more aggressively than Korean firms, or both. As for human resource
management, Japanese firms are more flexible in their human resource management than Korean firms. However, the
flexibility of human resource management has improved in Korea, while it declined in Japan.
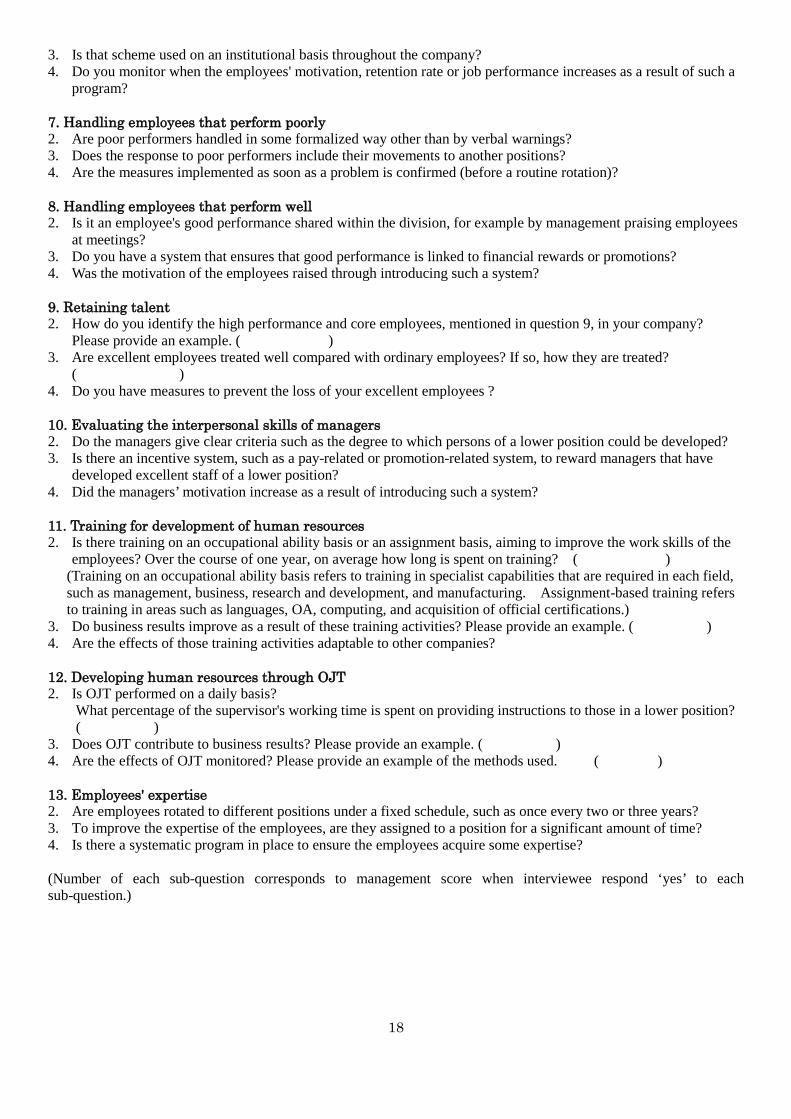
However, the difference in management scores partially reflects the difference in samples between the first and
the second survey. When we limit the sample to be the same and consistent between two surveys for Japan, the
management scores in these samples show similar patterns to those in the entire sample in the second survey (see
Table 6). This implies that the shrinking gap in management scores between Japan and Korea cannot be entirely
attributed to changes in the samples.
(Place Table 6 here)
3-3 Features of the results in the second survey
In the second survey, we asked additional questions to shed some light on management styles in Japanese and Korean
firms and the market conditions that they face. Table 7 summarizes the responses to the supplementary questions.
Question 1 in the second survey asks for an outline of the business and the economic environments that Korean and
Japanese firms face. As for the first question in Question 1 -- that asks the main market for a firm -- almost two thirds
(2/3) of Japanese firms answered that they sell more than 75 percent of their products in their domestic market. On the
other hand, less than half of the Korean firms would say the same (see Table 7-1). Responses to the fourth question
in Question 1 – that asks about the competitive environment -- also differs greatly between Japan and Korea. While
more than half of the Japanese firms have six competitors or more, only 40% of the Korean firms would say the same
(see table 7-2).
(Place Table 7 here)

9
It is often argued that the major difference between Japanese and Korean firms is the speed of the
decision-making process. In the second survey, we ask questions related to this issue. Table 7-3 illustrates that it takes
much less time to change the existing targets of the firm for Korean firms than for Japanese firms, based on responses
to the second question in Question 3-3-4. While 65 percent of Korean firms revise organizational goals and other
production processes within 3 months, it takes more than 6 months for approximately three fourths (3/4) of the
Japanese firms to reach similar decisions.
However, in Table 7-4, constructed from responses to Question 9-1, over 40 percent of Japanese firms
responded that less than 20 percent of the time before the project begins is spent on the “nemawashi” informal
consensus building. On the other hand, approximately 60 percent of Korean firms spend 20-60 percent of their time on
this consensus building. Yet, considering the time it takes for Japanese firms to change its targets, we cannot conclude
this preparations is shorter for Japanese firms than Korean firms. Based on the information in Table 7-3, it takes ten
months for organizational decisions to be made in Japanese firms. Since the time spent on the informal consulting
building constitutes 20 percent of that time, that is two months. On the other hand, Korean firms spend on average of
three months to make organizational decisions. Then, 40 percent of the three months would be spent on this consensus
building, which would be only 1.2 months.
However, Table 7-5 with the results of the supplementary question in Question 9-1 shows that the time it
takes to decide on new projects is not necessarily shorter for the Korean firms. In Japan, the cases can be extreme:
there are examples where decisions are made very quickly and those where decisions take more than six months. On
the other hand, almost 60 percent of Korean firms need more than six months to make a decision on new projects. A
similar trend is observed when it comes to the termination of existing projects in Table 7-6, with results from the
supplementary question in Question 9-2. Contrary to common perceptions, a large fraction of Japanese firms take less
time to make decisions than their Korean counterparts.
Lastly, we compare the amount of information shared with the manager at the establishment level by using
the results from Questions 9-3 and 9-4. Table 7-7 indicates that only 12 percent of Korean firms share less than 40
percent of pertinent information to project managers while 40 percent of Japanese firms do. This indicates that,
overall, Korean firms give more decision-making authority to project managers than Japanese firms, and that
decentralization is more common in Korea. Table 7-8 also shows that the share of information obtained by a
project manager is via informal routes and is not necessarily higher in Japan than in Korea.

10
4. Are Management Practices Related to Firm Performance?
Using the scores on management practices explained in the previous section, we examine whether an improvement in
firm performance is associated with better management practices. Modifying Bloom and Van Reenen (2007) we
estimate the following production functions:
(1)
Equation (1) is a standard production function using the management score (MS). As for MS, we take not only
the average score in all interview questions, but also management scores in organizational management and human
resource management.
VA is value added, L is labor input, and K is capital input. Bloom and Van Reenen (2007) constructed
pseudo-panel data by matching management scores to other variables in the production function in the past ten years.
With this they examined the long-term relationship between management practices and firm performance. Following
them, we take the variables in Equation (1), except for the management score, from firm-level data from 2006 to 2008
and from 2009 to 2011.6 When we estimate Equation (1) using all samples, we include a sector dummy, a year
dummy, and the second survey dummy in the estimations.
Statistics of all variables used in the estimation except the management scores are summarized in Table 8-1. In
Table 8-2, capital-labor ratios and average productivity of labor are calculated. It is shown here that the capital-labor
ratios are consistently higher in the Korean firms, regardless of whether they are measured in medians or means using
the number of workers, working hours, or the sum of wage payment as measurement of labor. The only exception is
when it is measured as the mean using working hours. In contrast, the average productivity of labor and capital are
higher in the Japanese firms measured in terms of value-added per labor.
(Place Table 8-1, 8-2 here)
4.1 Basic Estimation Results
We have first run regressions for each country data and for the merged data. The results are shown in Table 9. First, we
6 The firm level data from 2006 to 2008 correspond to the management scores in the first survey and those from 2009 to 2011 correspond to the management scores in the second survey.
iiiii LKMSconstVA εααα ++++= lnln.ln 321

11
note that they show that the average management score has a positive and significant relationship with firm
performance in Korea and Japan -- which is not found in the estimation using only the first survey in Miyagawa et al.
(2010).
(Place Table 9 here)
Next, the average management score is divided into an organizational management score and a human resource
management score. Table 9 shows that both management scores are significantly positive in Japanese firms and only
the human resource management score is significantly positive in Korean firms. We find that the significance of the
total management scores is mostly due to the impact of the human resource management score in both countries and
the combined sample regressions. There is little impact of the organizational management score and its contribution is
sometimes even negative in Miyagawa et al. (2010). Estimation results by using sub-samples are different from
those using the whole sample. When we divide the entire sample into the manufacturing sector and the service sector,
the results in the manufacturing sector in Japanese and Korean firms are similar to those using the entire sample.
However, in the Japanese service sector, only the human resource management score is significantly positive. When
we divide the entire sample into SME and large firms, the estimation results in SMEs in Korea and Japan are similar
to those using the whole sample. However, in the estimation results in large firms, better performances in Korean
firms are associated with high organizational management scores as well as high human resource management scores,
while for Japanese large firms, only the organizational management score is related to improvements in firm
performances.
From the coefficients of the estimated production functions, we are also able to compare output elasticities of
capital and labor. We find in general that the output elasticity of labor is higher in Japan, and that the output elasticity
of capital is higher in Korea except in the manufacturing sector and SMEs. In contrast, we note from Table 8-2 that
average productivity of labor and capital are higher in Japan. The above facts imply that different production functions
apply to Korean and Japanese firms.
4.2 Effects of Management Practices on Production Efficiencies
In the basic estimation, we assume that management practices affect Hicks-neutral technological progress. However,
management practices may improve capital efficiency, labor efficiency or efficiencies of both production factors. To

12
check these effects of management practices, we estimate the following equations,
(2-1) iiiiii LMSKKconstVA µβββ ++++= lnln*lnln.ln 321
(2-2) iiiiii MSLLKconstVA µγγγ ++++= ln*lnlnln.ln 321
(2-3) iiiiiiii MSLLMSKKconstVA µλλλλ +++++= ln*lnlnln*lnln.ln 4321
The results are reported in Table 10. Table 10-1 shows that the total average score significantly improves capital
efficiency in Korea and Japan. When we examine the contributions of the organizational management score and
human resource management score to capital efficiency, both management scores contribute to capital efficiency in
Japan and human resource management score contributes to capital efficiency in Korea. Table 10-2 shows the case of
labor efficiency. In Table 10-2, we find significant contributions of the total management score to labor efficiency only
in Korea. As in Table 10-1, strong human resource management scores significantly improve labor efficiency in
Korea.
(Place Table 10 here)
Finally we estimate Equation (2-3). The estimation results in Table 10-3 show the significant and positive
contributions of management scores to capital efficiency only in Japanese firms. However, we do not find the
significant contributions of management scores to labor efficiency in either country. 7
4.3. Estimation results considering causality
As the previous estimations examined the contemporaneous relationships between management practices and firm
performance, we are not able to examine the effects of management practices on firm performances. Then, we
estimate a production function for the period from 2009 to 2011 by using management scores in the first survey that
was conducted in 2008.8
Estimation results are shown in Table 11. In Table 11, although we do not find a positive and significant effect 7 We also estimate Equations (2-1), (2-2), and (2-3) by using sub-samples. In the estimations in Equations (2-1) and (2-2), the organizational management scores contribute to capital and labor efficiencies in large firms or service firms in Korea. We also find the significant contribution of human resource management score to capital efficiencies of manufacturing firms and SMEs and to labor efficiencies of SMEs in Japan. Other results are similar to Tables 10-1 and 10-2. In the sub-sample estimation of Equation (2-3), we find no significant contributions of management scores to efficiencies of production factors. 8 We estimate a production function including management scores in the first survey only in Japan because we are not able to obtain enough financial statements that correspond to the management score in the first survey in Korea.

13
of the total average management score on firm performances, we do find that organizational management score affects
firm performances. 9
(Place Table 11 here)
5. Conclusions and Discussions for Future Research
In the last twenty years, Korean firms have been catching-up with the Japanese firms and some firms have already
overtaken the performance of competing Japanese firms. According to the growth accounting in Japan and Korea by
Miyagawa and Takizawa (2011), accumulation in intangible assets have played a key role in explaining the difference
in the economic performance of the two countries. Among several kinds of intangibles, management skills and human
capital are crucial to the improvement in a firm’s performance. Bloom and Van Reenen (2007) examined the effects of
organizational and human resource management on firm performance using interview surveys conducted in France,
Germany, the UK, and the US. Following their study, we conducted two interview surveys on organizational and
human resource management in Japan and Korea.
Based on Bloom and Van Reenen (2007), we constructed scores on management practices in each firm based on
the interview surveys. For organizational management, firms that have clear organizational targets, better
communication amongst employees, and conduct organizational reforms would have a higher score. For human
resource management, firms that evaluate human resources flexibly and strive to keep employees motivated would
mark higher scores.
When we compared the distributions in the average management scores between Japanese and Korean firms,
the mean value of the average management score in Japan was higher than that in Korea in both surveys except for the
case of management scores in large firms in the second survey. However, the gaps in management scores between
Japan and Korea in the second survey are smaller than those in the first survey in every aspect of management
practices. The results are consistent with the fact that performances in Korean firms have rapidly caught up with those
in Japanese firms, and some large Korean firms have overtaken some large Japanese firms.
The resulting Kolmogorov=Smirnov statistics show that the distributions in average score in Japan is
significantly different from those in Korea. When we compare the first and second survey, the distribution of
management scores in the second survey in Korea shifted to the right significantly from that in the first survey, while 9 When we estimate a production function including the management scores in the first survey by using sub-samples in Japan, we find organizational management scores in service firms and large firms improve firm performances significantly.

14
the distribution in the second survey in Japan also shifts but in the opposite direction of the Korean distribution.
Using these scores, we examined whether the improvement in firm performance is correlated to better
management practices. Estimation results of a simple production function including the management score show that
the measure indicating management practices has a positive and significant relationship to the improvement in firm
performance in both countries. Even when we divide the management scores into organizational management and
human resource management scores, both are significantly and positively correlated with better firm performance in
large firms or SMEs in Japan and large firms in Korea. In Korean firms, high human resource management scores are
associated with firm performance in all sub-sample estimations.
When we estimate a production function to examine the effects of management practices on efficiencies of
production factors and include cross terms of management scores with production factors, we find that management
scores improve capital efficiency in Japanese firms. On the other hand, in Korean firms human resource management
scores improve efficiencies in both capital and labor.
Finally, we examine the effects of management practices on firm performance to estimate a production function
in the second survey that include the management scores from the first survey. The estimation results show that the
organizational management scores affect the improvement in firm performance in Japanese firms.
Overall estimation results show that better management practices are related to improvements in firm
performance in Japan. In particular, a high organizational management score contributes to improved firm
performance in Japanese firms. In the case of Korean firms, better management practices are associated with improved
firm performance in large firms. In addition, the human resource management score is positively related to firm
performance in every type of Korean firms. These results are consistent with the recent trends showing that Korean
firms have caught up with Japanese firms and the performances in some large Korean firms have surpassed that of
large Japanese firms.
Our results imply that to restore their competitiveness, Japanese firms should conduct organizational reform and
improve human resource management. Since Miyagawa and Hisa (2013) show there is a drastic decline in investment
in human resources at the aggregate level, the Japanese government should support enhanced human resource
management. However, the better human resource management defined in Bloom and Van Reenen’s score may not
improve performance in the Japanese service firms, because the management score developed by Bloom and Van
Reenen (2007) was applied only to the manufacturing sector.
Bloom, Propper, Seiler, and Van Reenen (2010) developed another list of interview questions to examine

15
performances in public hospitals. In addition, Japanese firms in the service sector employ many non-regular workers
who are not managed by human resource management for regular workers. Our next task is to examine human
resource management in the service sector based on the Japanese traditional labor market.10
10 We obtained data for non-regular workers and college graduates in the first survey. Estimating a production function controlling these variables, we find that the human resource management score is significantly and positively correlated with firm performances.

16
Appendix 1: Questionnaire (The first interview survey) 1. Dissemination of management principles (vision) 2. Does your company have management principles that it has upheld for many years? 3. What efforts are in place to have those management principles shared by all employees? (For example,
announcing them at morning assemblies, or making them portable by writing them on business cards etc.) 4. Are management principles also supported by parties such as external partners (customers, suppliers) or the
shareholders? 2. Implementation of organizational goals 2. Are there specific quantifiable goals on multiple levels that go beyond being just a vision or a slogan, regardless of
the level of the goals (such as company-wide, divisional or sectional goals)? 3. Do you ensure that the goals amongst divisions are consistent? 4. Is consistency maintained between these goals and the goals of management principles or long-term
company-wide goals? 2-1. Implementation of organizational goals (setting target levels) 2. For example, are the parameters for divisional or sectional target levels simply given to you in a top-down fashion?
Or is the input of your division or section considered in the setting of these goals? 3. Are the target levels appropriately set as non-binding challenges? 4. Are target levels checked to ensure they are equitable between divisions or sections? Please provide an example of
how they are checked. ( ) 2-2. Implementation of organizational goals (penetration of goals) 2. Are all employees aware of these goals? 3. If goals exist on various levels (such as company-wide, divisional and sectional goals), do all employees
understand the level of priority of the goals? 4. Do all employees accept these target levels? Please provide an example if possible. ( ) 2-3. Implementation of organizational goals (degree to which goals are met, checks on performance) 2. Are checks conducted to see how far goals have been achieved? Please give an example of how such checks are
conducted. ( ) 3. Are such checks conducted on a periodic rather than on an as-needed basis? And how frequently are such checks
conducted? ( ) 4. Are additional checks conducted that are decided by the section or department involved itself, rather than just
being mandated checks? 2-3-1. Implementation of organizational goals (permeation of degree to which goals are met, and results of performance checks) 2. Are the results of such checks made openly available within your division? 3. Are the results of such checks made openly available within not only your division but also between relevant
divisions? 4. Are adjustments made to ensure that the comparison of the attainment of goals between divisions is fair? (for
example, by utilizing common measures such as overtime hours?) 2-3-2. Implementation of organizational goals (results of checks - response when goals have not been achieved) 2. Is a meeting of managerial staff and employees held as soon as it is determined that the goals were not achieved? 3. After investigations, are action items to improve shared throughout the division, and are measures for handling the
failure to achieve the goals promptly implemented? 4. Are problematic issues and countermeasures made thoroughly known throughout the relevant division, and if
necessary, other divisions? Please provide an example if possible. ( ) 2-3-3. Implementation of organizational goals (results of checks - response when goals have been achieved)

17
2. When goals are achieved, are investigations conducted so that those goals are renewed on a continuous basis or so that higher goals are set?
3. How long does it take for the operation / implementation of those goals after the higher goals have been set? 4. Are these measures institutionalized at a company-wide level? 3. Informal communication within the organization 2. Are measures and activities other than formal meetings used to enhance informal communication? (for example,
informal meetings consisting only of key personnel)? Please provide an example. ( ) 3. Are informal meetings held between divisions? 4. Are informal meetings held between persons of various ranks? 4. Implementation of organizational reform 2. Has your company undergone any organizational reforms in the last ten years? When did these occur?
( ) 3. Did your company use a consulting company at that time? What was the cost? ( ) 4. Did you determine the results of the reform in a quantifiable manner? By what percentage did profits increase or
by what percentage were costs reduced? ( )
4-1. Period of organizational reform or strategic change 2. Did the implementation of the organizational reform take more than one year? How many years were spent
including the preparation period? ( ) 3. Why was organizational reform necessary? Did this have to do with the leadership of senior management? 4. During the organizational reform, did mid-level management also strive to achieve the reform, thereby giving the
sense of unity in the company? 4-2. Scope of the effects of organizational reform 2. Were the effects of the reform evident in the divisions or sections? If they were, please provide an example of the
effects. ( ) 3. Were the effects of the reform evident between divisions, and not just within one division? If they were seen
between divisions, please provide an example of the effects. ( ) 4. Were the effects of the reform evident between the company and the business partners, and not just within the
company? If they were, please provide an example of the effects. ( ) 4-3. Details of the organizational reform (delegation of authority) 2. Was decision-making authority delegated to those in a lower position as a result of the organizational reform? 3. Were posts simplified in conjunction with decision-making authority being delegated to those in a lower position? 4. As a result, was there a change in the description of the job or the way of doing the job? Please provide an
example. ( ) 4-4. Details of the organizational reform (IT activities) 2. Did the IT system make your company more streamlined, for example by reducing the amount of paper-based
documentation? 3. In the last decade, did your company launch organizational reform, rather than raise business efficiency, by
utilizing the IT system? 4. Did an opportunity to earn new profits arise as a result of the organizational reform based on the IT system?
Please provide an example. ( ) 5. Promotion system 2. Does your company have a mainly performance-based promotion system? 3. If the promotion system is mainly performance-based, does your company have a management-by-objectives
system? If so, when did that system begin? 4. Did the performance of the employees improve as a result of using the management-by-objectives system and
introducing a performance-based promotion system? 6. Programs to improve motivation 2. Are there any programs other than promotion or pay-related schemes to increase the motivation of the employees?
Please provide an example. ( )
18
3. Is that scheme used on an institutional basis throughout the company? 4. Do you monitor when the employees' motivation, retention rate or job performance increases as a result of such a
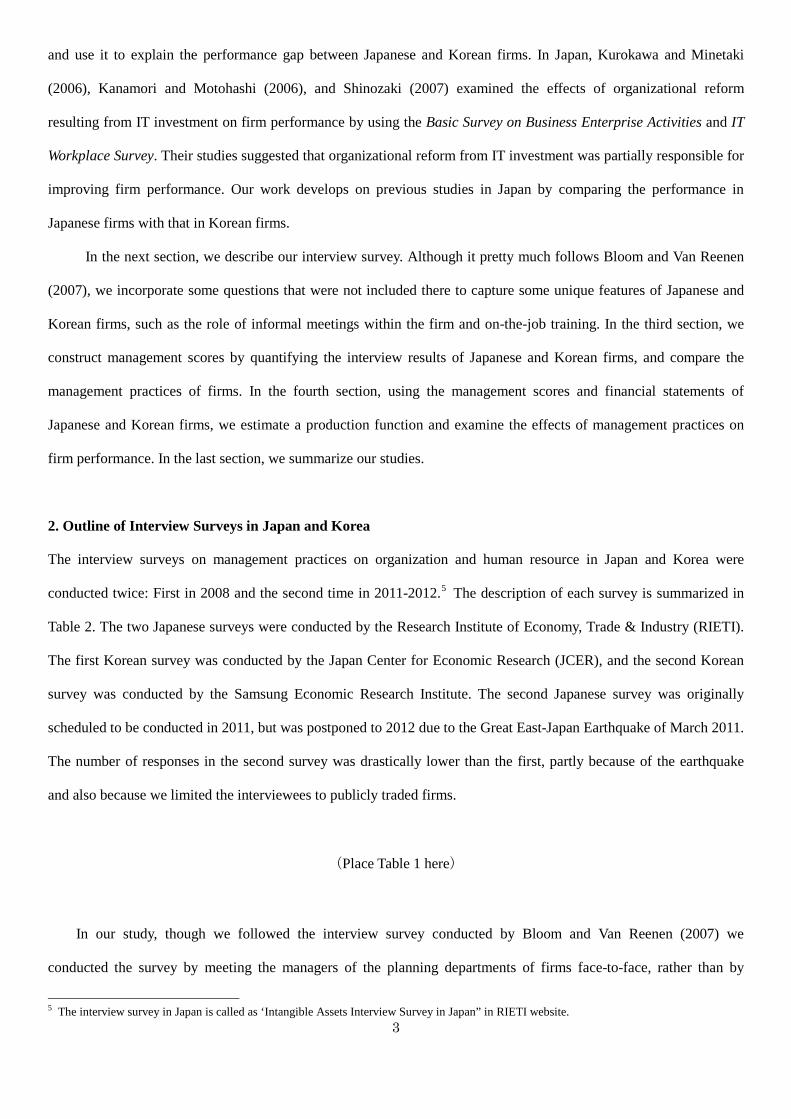
program? 7. Handling employees that perform poorly 2. Are poor performers handled in some formalized way other than by verbal warnings? 3. Does the response to poor performers include their movements to another positions? 4. Are the measures implemented as soon as a problem is confirmed (before a routine rotation)? 8. Handling employees that perform well 2. Is it an employee's good performance shared within the division, for example by management praising employees
at meetings? 3. Do you have a system that ensures that good performance is linked to financial rewards or promotions? 4. Was the motivation of the employees raised through introducing such a system? 9. Retaining talent 2. How do you identify the high performance and core employees, mentioned in question 9, in your company?
Please provide an example. ( ) 3. Are excellent employees treated well compared with ordinary employees? If so, how they are treated?
( ) 4. Do you have measures to prevent the loss of your excellent employees ? 10. Evaluating the interpersonal skills of managers 2. Do the managers give clear criteria such as the degree to which persons of a lower position could be developed? 3. Is there an incentive system, such as a pay-related or promotion-related system, to reward managers that have
developed excellent staff of a lower position? 4. Did the managers’ motivation increase as a result of introducing such a system? 11. Training for development of human resources 2. Is there training on an occupational ability basis or an assignment basis, aiming to improve the work skills of the
employees? Over the course of one year, on average how long is spent on training? ( ) (Training on an occupational ability basis refers to training in specialist capabilities that are required in each field, such as management, business, research and development, and manufacturing. Assignment-based training refers to training in areas such as languages, OA, computing, and acquisition of official certifications.)
3. Do business results improve as a result of these training activities? Please provide an example. ( ) 4. Are the effects of those training activities adaptable to other companies? 12. Developing human resources through OJT 2. Is OJT performed on a daily basis?
What percentage of the supervisor's working time is spent on providing instructions to those in a lower position? ( )
3. Does OJT contribute to business results? Please provide an example. ( ) 4. Are the effects of OJT monitored? Please provide an example of the methods used. ( ) 13. Employees' expertise 2. Are employees rotated to different positions under a fixed schedule, such as once every two or three years? 3. To improve the expertise of the employees, are they assigned to a position for a significant amount of time? 4. Is there a systematic program in place to ensure the employees acquire some expertise? (Number of each sub-question corresponds to management score when interviewee respond ‘yes’ to each sub-question.)

19
Appendix 2: Questionnaire (Second interview survey) 1. Business environment and responses to changes a. With regard to the market your company is operating in, what are the percentages of revenue from your domestic and overseas markets? 1. Domestic market accounts for 75% or higher. 2. Domestic market accounts for 50-75%. 3. Domestic market accounts for 25-50%. 4. Overseas market accounts for 75% or higher. b. How do you see the competitive environment surrounding the market for your company's major product or service (i.e., the product or the service that has the largest share in your company's revenue)? 1. Mild 2. Medium 3. Intense 4. Highly intense c. What is your market share of the major product or service which relates previous question? 1. About 0-5 % 2. About 5-10 % 3. About 10-25 % 4. 25% or higher d. How many rival firms are competing for a larger market share? 1. None or one firm 2. Two to five firms 3. Six to ten firms 4. Eleven or more firms e. What actions are typically taken when the market for your main product is favorable and prevailing prices are rising? (Please choose one or two that best describe the situation.) 1. Expand investment 2. Increase operating time to expand production capacity 3. No changes 4. Increase employees (transfer, or newly recruit employees) 5. Reduce advertising and marketing expenses f. What actions are typically taken when the market for your main product remains stagnant? 1. Cut down operations (reduction in sales and production including restructuring) 2. Reduce prices 3. Develop production methods to save production costs 4. Explore new marketing methods 5. Improve product quality and design as well as develop new products g. We would like to offer our deepest condolences to your employees who greatly suffered from the East Japan Earthquake that hit Japan on March 11, 2011. Please provide any examples of significant changes in corporate strategy caused by this unprecedented disaster, such as the relocation of production bases, or changes in product line-up. Thank you for sharing your business environment with us so far. We would appreciate it if we could obtain a brochure that explains your major product or service when we leave your office after completing today's interview. We would like to study it to have a better understanding of your company. (Yes/No) Then, let us move on to topics concerning corporate visions, followed by goals/targets on a more operational

20
level. Questions can be answered 'Yes' or 'No'. 2. Production management system 2-1 Production system 2. Please describe your company's production system? Has your company introduced a system aimed at minimizing inventory on the production line? 3. Please let us know if your plant has a unique system of inventory management. 4. How does your company manage inventory? How do you maintain the proper balance between inventory management and smooth operation of the production line? 2-2 Reason that your company introduced the production system 2. What factors led to the introduction of your production system? 3. Is your inventory management system mainly designed to reduce costs? 4. Or do you believe that your system is more than just a cost-reduction method and that the system has far-reaching positive impacts on logistics, innovation and other systems? 2-3 Improvement of production process 2. How has your company improved the production process in the last five years? 3. How are problems regarding production processes typically identified and fixed? Please provide an example in which your workers recently identified and fixed a problem with regard to the production line. 4. Do factory workers take the initiative to suggest ideas for improving production process? 3. Organizational goals/targets 3-1 Questions about goal or target setting 2. Is each operating division responsible for setting its own goals/targets, rather than their being set at higher departmental levels? 3. In terms of the difficulty of achieving the goals/targets, does the company consider ways to maintain appropriate levels of the division's goals/targets (i.e., ensure they are not too difficult, not too easy)? 4. Does the company ensure that all the divisions are treated fairly in terms of difficulty of division's goals/targets? If any, can you provide an example of specific ways to manage these goals/targets? ( )
3-2 Questions about how goals/targets are shared by employees 2. Do all employees understand the goals/targets of their divisions? 3. If different goals/targets are established on various levels such as section, department, company etc., do employees understand how they relate to each other and what these priorities are? 4. Have most employees fully bought into the goals/targets and are motivated into action by them, rather than just "being aware of" the goals/targets? 3-3 Questions about monitoring the degree of achievement 2. Does your company monitor the achievement of the goals/targets? If so, can you provide an example of the monitoring method used? ( ) 3. Is such monitoring conducted periodically? If so, what is the frequency that it is conducted? ( ) 4. In addition to a system of institutional monitoring, do employees take the initiative to monitor their own achievements? 3-3-2 Questions about how monitored results are utilized 2. Do employees share the monitored results of achievement, regardless of whether the results are good or bad? 3. Do employees have easy access to the monitored results of achievement of the other departments with whom they work closely? 4. Are there specific ways to make a fair evaluation of achievement across divisions such as the measurement of overtime etc.? If so, can you provide an example of such evaluation method? ( ) 3-3-3 Questions about cases in which goals/targets are not achieved 2. In case set goals/targets are not achieved, do managers and staff have a meeting in a timely manner? 3. When the mangers and staff come up with ideas for improving performance in such meetings, are these

21
ideas shared by staff in the division and put into action in a timely manner? 4. Does the company ensure that such ideas for improvement are also shared by the other divisions? Please provide an example of specific ideas for improvement that are shared by the other division ( ) 3-3-4 Questions about cases in which goals/targets are achieved 2. When the goals/targets are met, does your company consider revising them to higher goals/targets? 3. Is the time frame required to revise the goals/targets and to implement actions toward such new goals/targets within three months? How long is the time frame? ( ) 4. When revising the goals to higher level after earlier goals are achieved, are such actions institutionalized as part of a formal corporate process? 4. Human resource management 4-1 We understand that various measures are taken to improve employee motivation. 2. Do managers evaluate employees mainly on the basis of performance (performance-based system)? When was such performance-based evaluation system introduced? (Year ) 3. Do you use incentives other than promotion and compensation to help improve the motivation of employees? If so, can you provide an example? ( ) 4. Do you monitor how these incentives lead to better outcome, such as greater motivation, higher retention rate or better financial results? 4-2 When we discussed organizational issues previously, we touched on the management and achievement of goals. Here, we would like to ask similar questions in terms of human resource management. 2. Do managers take any specific measures other than verbal advice to employees when their achievements do not reach targets? 3. Do such measures include transferring the employee to another position even if he or she has been in their current position for less than the average rotation period? 4. Do such internal transfers take place promptly, and no later than the timing of regular rotation? 4-3 Questions regarding high-achieving employees 2. When an employee achieves a high performance, do managers announce this within the division by praising the employee at meetings, for example? 3. Does your company adopt a compensation and promotion system that is aligned with performance targets and achievements? 4. Have you seen improvements in motivation by adopting such performance-based systems of compensation and promotion? 4-4 Questions about managers 2. Does the company provide managers with clear guideline as to how they should cultivate the talent of their subordinates? 3. Does your company adopt a promotion or compensation system in which managers are incentivized to foster high-achieving employees? 4. Have you seen an improvement in the motivation of managers by adopting such an incentive scheme? 5. Human resource development 5-1 Questions about human resource development 2. Does your company conduct employee training on a regular basis to develop their business skills? a. How many days a year, on average, does an employee spend on training? ( days) b. There are two types of corporate training programs: 1) functional training designed to obtain technical knowledge and 2) theme-based training designed primarily to obtain a certificate. Which do you focus on? - Focus on functional training - Focus on theme-based training - Both training are conducted roughly equally. 3. Do these training programs contribute to improving financial results? If so, please provide an example. ( ) 4. Do employees obtain a high level of transferable skills that could be utilized soon after she or he moves to

22
another company? 5-2 Questions about OJT (on-the-job training), which is also an important training program 2. Does on-the-job training (OJT) take place during daily operations? Roughly what percentage of a manager's time is allocated to such OJT? If it is difficult to specify the corporate-wide percentage, please base your answers on one of the divisions. a. On average (throughout the company) ( %) b. Front office/factory ( %) c. Back office ( %) d. Other specialist divisions ( %) 3. Does this OJT contribute to improving financial results? If so, please provide an example. ( ) 4. Do you monitor the results of OJT? If so, please provide an example of how you monitor them. ( ) 5-3 We understand that job rotation leads to the development of a company’s human resources. 2. Ia your company's job rotation program flexible? Do you think, for example, that the majority of employees are transferred within the base rotation period of two to three years? 3. Do some employees stay in one division for a long period to cultivate a high level of specialized skill and expertise? 4. Do you have a human resource development program that integrates various aspects such as training, OJT and job rotation that will help acquire a high level of skill and expertise? 6. Acquisition of human resources 6-1 Questions about your workforce, human resources itself 2. Is your company able to identify core skilled workforce (star performers) in each division? What quality is typically shared by such star performers? ( ) 3. Are these star performers treated differently from other employees? If so, in what regard are they treated differently? ( ) 4. Has your company been successful in retaining your top talent? 6-2 An increasing number of Japanese companies are interested in utilizing non-Japanese employees or management. 2. Does your company have non-Japanese employees or management? What is the percentage of non-Japanese to total number of management and employees? ( %) 3. Do overseas subsidiaries have non-Japanese management? 4. Do your board members (head office) include any non-Japanese persons? 7. Lifetime employment system Last topic is lifetime employment. How does your company view the lifetime employment system? 1. Important 2. Somewhat important 3. Somewhat unimportant 4. Unimportant 8. Relationships between employees (mainly full-time) and management Which of the followings best describe your company situation regarding how corporate strategy is formulated? 1. Top down decision making 2. There are regular meetings between management and employees regarding compensation and human
resource management, but corporate strategy is determined only by the management. 3. In addition to 2, informal communication is common, where management tries to reflect the opinions of
employees when it comes to issues related to compensation and human resource management, though corporate strategy is decided only by the management.
4. Communication between management and employees plays a key role in reflecting employees’ opinions not only in human resource issues but also in corporate strategy.

23
9. Decision making and information flow 9-1 Let us suppose that multiple divisions are involved to discuss a new business project. If we say the total time spent from starting the feasibility study to launch the project is 100%, what is the percentage of the time spent on nemawashi (i.e., the consensus-building process outside of formal meetings)? 1. 60% or above 2. 40-59% 3. 20-39% 4. 19% or below 9-2 Let us assume the case in which you must close or exit an existing business. Let us also say that the total time spent from the formation of the project team for winding down the business to start implementing the plan is 100%, what is the percentage of the time spent on nemawashi (i.e., consensus-building process outside of formal meetings)? 1. 60% or above 2. 40-59% 3. 20-39% 4. 19% or below Next, let us cover topics on information flow within the company. 9-3 Let us suppose that the total amount of strategic information within the company is 100%, what percentage of information does the person who is in charge of one business unit have? 1. 40% or below 2. 40-60% 3. 60-80% 4. 80% or above 9-4 Let us suppose that the total amount of strategic information that one employee has is 100%, what percentage of information does the person obtain informally (e.g., unofficial dinner with colleagues or bosses) rather than through formal ways such as conversation with the boss during business hours or corporate meetings? 1. 20% or below 2. 20-40% 3. 40-60% 4. 60% or above 10. Organizational reform 10-1 Please let us know whether your company underwent organizational reform in the past and how great the reform was. 1. Has the company undergone an organizational reform in the last 10 years? If yes, we will continue questions. If no, we will move to question 5. 2. Did the organizational reform entail changes to the existing organizational framework (e.g., was there restructuring of existing departments and/or sections)? 3. Did the organizational reform go beyond the creation of a new business groups or the consolidation of existing business groups? 4. Was the organizational reform conducted on a far greater scale that involved company-wide reform? The examples include transformation from a functional organization to a divisional organization or to a matrix organization, transition to a divisional organization or creation of a pure holding company. Please allow us to continue asking about organizational reform. a. In which year did the organizational reform start? ( ) b. How many employees were involved in planning and/or implementing the reform as a percentage of total employees? How long did the reform take? ( %) ( ) c. What was the major reason that your company decided to implement organizational reform? ( ) (If the answer is not apparent, we ask you to consider the following possibilities). - It was clear that the existing organizational structure was not effective to save the company from

24
further deteriorating business performance. - Though business performance was not deteriorating, we felt it necessary to transform the organization
as a countermeasure to competitors who had made similar reforms. - Though business performance was not deteriorating, our external stakeholders such as major customers
advised us to do so. - Though business performance was not deteriorating, we felt it necessary to better meet the changing
needs of the future.
d. What was the major focus of the objective of such organizational reform? (If the answer is not apparent, we ask you to consider the following possibilities). - The major objective was to meet customer demand in a more timely manner. - The major objective was to increase capacity to develop new products, services or new production
processes - Instead of volume or quantity, the major objective was to enhance the ability to offer better quality of
new products or services. - The major objective was to reduce costs, such as labor cost.
We imagine that much internal coordination was required to reform the organization. Such a reform must have resulted in a number of changes. Please answer Yes or No to following questions. 10-2 Questions about the organizational reform process. 2. Was the time required for the proposed organizational reform to be accepted by a majority of employees less than one year? 3. Did a majority of employees work with middle management in line with the proposed reform after the plan was accepted? 4. Did employees suggest other constructive alternatives regarding organizational reform? 10-3 Questions about changes due to organizational reform 2. Was some of the decision-making authority delegated to lower-level managers/employees as a result of organizational reform? 3. Did such delegation of decision-making authority help simplify the organizational structure? 4. Did the organizational reform lead to changes in terms of what employees do and how they view their jobs? If any, please provide an example.( ) 10-4 Questions about the relationship between IT investment and organizational reform, which are generally considered to be correlated. 2. Did your company step up investment in IT after the organizational reform compared with the same period prior to the reform? 3. Did your company make company-wide efforts to improve the utilization of information technology, rather than each section or division making IT-related plans individually? 4. Did your company strengthen IT management to include not only the internal network but also external business partners such as customers and/or suppliers? Please provide an example where an effective use of IT helped generate a new business opportunity, if any. ( ) 10-5 We understand that a large budget is generally required for organizational reform. Please let us know about funding the reform, which is usually one of the challenges. What do you estimate is spent on organizational reform as a percentage to your company's annual revenue? ( %) a. How does your company raise these funds required for reorganization? b. Please provide a ballpark figure of the percentage of each source of funds to the budget? Internally-generated cash flow ( %) Borrowings ( %) Issuance of bonds ( %) Issuance of stocks ( %) Other ( %)

25
Please specify if you choose "other". ( ) Next question is asked only to those who answered "borrowings" in the question b. c. How did lenders such as banks evaluate the proposed organizational reform? Please choose the response closest to lenders' attitude. - The reorganization plan was incorporated into their evaluation and reflected in borrowing conditions
(loan amount, interest rate, maturity, security etc.). - The reorganization plan was evaluated but was not reflected in borrowing conditions. - The reorganization plan was not evaluated. Next question is asked only to those who did not choose "borrowings" to the above question b. c’. Did your company discuss with the banks the possibility of borrowing to fund your reorganization? How did banks evaluate the proposed plan of organizational reform? Next question is asked only to those who answered yes to the above question c'. Please choose the response closest to the lenders' stance. - The banks analyzed the reorganization plan and tried to reflect it in borrowing conditions (loan amount,
interest rate, maturity, security etc.). - The banks analyzed the reorganization plan but it did not seem to be reflected in borrowing conditions. - The banks did not analyze the reorganization plan. d. If reorganization costs can be recorded as assets, over how many years do you think they should be amortized / depreciated? Please choose the one closest to your opinion. - Over 7 years - 5-6 years - 3-4 years - 2 years - 1 year

26
References
Aoki, M. (2010), Corporations in Evolving Diversity, Cognition, Governance, and Institutions, Oxford University
Press.
Bloom, N. and J. Van Reenen (2007), “Measuring and Explaining Management Practices across Firms and Countries,”
Quarterly Journal of Economics 122 (4), pp.1351-1408.
Bloom, N., C. Propper, S. Seiler, and J. Van Reenen (2010), “The Impact of Management Quality: Evidence from
Public Hospitals,” NBER Working Paper No. 16032.
Corrado, C., C. Hulten, and D. Sichel (2005), “Measuring Capital and Technology: An Extended Framework,” in C.
Corrado, J. Haltiwanger, and D. Sichel (eds.), Measuring Capital in the New Economy, The University of
Chicago Press, Chicago.
Corrado, C., C. Hulten, and D. Sichel (2009), “Intangible Capital and U.S. Economic Growth,” The Review of Income
and Wealth 55 (3), pp. 661-685.
Corrado, C., J. Haskel, C. Jona-Lasinio, and M. Iommi (2013), “Innovation and Intangible Investment in Europe,
Japan and the US,” Discussion Paper 2013/1 Imperial College Business School.
Chun, H., K. Fukao, S. Hisa, and T. Miyagawa (2012), “Measurement of Intangible Investments by Industry and Its
Role in Productivity Improvement Utilizing Comparative Studies between Japan and Korea”. RIETI Discussion
Paper Series 12-E-037.
Fukao, K., T. Miyagawa, K. Mukai, Y. Shinoda, and K. Tonogi (2009), “Intangible Investment in Japan: Measurement
and Contribution to Economic Growth,” The Review of Income and Wealth 55 (3), pp. 717-736.
Joo, S. H., and Keun Lee (2010), “Samsung’s Catch-up with Sony: An Analysis Using U.S. Patent Data,” (with Si
Hyung Joo), Journal of the Asia-Pacific Economy. vol. 15 (3), pp. 271-287.
Jung, Mooseop, and Keun Lee, (2010), “Sectoral Systems of Innovations and Productivity Catch-up by the Korean
firms with the Japanese firms,” Industrial and Corporate Change, vol. 19 (4), pp. 1037-1069.
Jung, Moosup, Keun Lee, and Kyoji Fukao, (2008), “Total Factor Productivity of Korean Firms and Catching up with
the Japanese firms,” Seoul Journal of Economics, vol. 21 (1), pp. 93-137.
Kanamori, T. and K. Motohashi (2006), ‘Centralization or Decentralization of Decision Rights? Impact on IT
Performance of Firms,’ RIETI Discussion Paper Series 06-E-032.
Kurokawa, F. and K. Minetaki (2006), “How Can IT Raise Productivity Linked with Workplace Re-organization and
Human Capital in Japan?,” (in Japanese), The Economic Analysis No. 178, pp. 54-95.

27
Lee, K., T. Miyagawa, S. Kabe, J. Lee, H. Kim, and Y. Kim (2009), “Management Practices and Firm Performance in
Japanese and Korean Firms,” JCER Discussion Paper No. 120.
McGrattan, E., and E. Prescott (2005), “Expensed and Sweat Equity”, Federal Reserve Bank of Minneapolis, Working
Paper no. 636.
McGrattan, E., and E. Prescott (2010), “Unmeasured Investment and the Puzzling U.S. Boom in the 1990s”, American
Economic Journal: Macroeconomics, 2, pp.88–123
Miyagawa, T. and S. Hisa, (2013) “Estimates of intangible investment by industry and productivity growth in Japan,”
The Japanese Economic Review, 64, pp. 42-72.
Miyagawa, T., K. Lee, S. Kabe, J. Lee, H. Kim, Y. Kim, and K. Edamura (2010), “Management Practices and Firm
Performance in Japanese and Korean Firms – An Empirical Study Using Interview Surveys,” RIETI Discussion
Paper Series 10-E-013.
Miyagawa, T. and M. Takizawa (2011), “Productivity Differences between Japan and Korea and the Role of Intangible
Assets,” (in Japanese), K. Asako, N. Iiduka and T. Miyagawa, eds., Great Recessions in the Global Economy and
Business Cycle Analysis, The University of Tokyo Press.
Pyo, H. K., H. Chun, and K. H. Rhee (2011), “Productivity Growth in the Republic of Korea,” Presented at the first
Asia KLEMS Conference held on July 27, 2011.
Shinozaki, A. (2007), “Effective Reforms with Information Technology: Logit Model Analysis on Business Process
Reengineering, Business Unit Restructuring, and Human Resource Management,” (in Japanese), The Economic
Analysis No. 179, pp. 36-54.

28
Table 1 Outline of Intangible Assets Interview Survey in Japan and Korea
Table 2 Distribution of Industries Surveyed
Table 3 Size Distribution of Surveyed Firms
First Second First SecondSurvey period Feb-Sep, 2008 Oct-March, 2011 May-Sep, 2008 Oct, 2011-May, 2012
July-Sep, 2012
Firms surveyed
Machinery industries (Electric,Information and communication,Transportation, Precision), Informationservice, Media Service, and Retailindustries
All industries, Publicly Traded Firms
Machinery industries (Electric,Information and communication,Transportation, Precision), Informationservice, Media Service, and Retailindustries
All industries, Publicly Traded Firms
Number of surveyed firmsthat responded 573 402 350 505
Response rate 52.8% 22.2% 59.2% 28.9%Organizations thatconducted Surveys
Research Institue of Economy, Tradeand Industry
Research Institue of Economy, Tradeand Industry Japan Center for Economic Research Samsung Economic Research Institue
Japan Korea
(%)
First Second First SecondManufacturing 33.9 67.7 84.9 79.0Services 66.1 32.3 15.1 21.0
Japan Korea
Table 3 Size Distribution of Surveyed Firms(%)
First Second First Secondless than 300 44.0 42.5 72.8 54.3300~499 15.3 14.7 10.5 17.0above 500 40.7 42.8 16.7 28.7
Number ofemployees
Japan Korea

29
Table 4 Management Scores Based on the Interview Surveys
The 1st surveyN mean variance N mean variance N mean variance
MS (all questions)All samples 923 2.458 0.321 573 2.609 0.243 350 2.211 0.351Manufacturing firms 491 2.343 0.336 194 2.606 0.245 297 2.171 0.321Service firms 432 2.588 0.273 379 2.610 0.243 53 2.433 0.468Large firms 397 2.643 0.269 304 2.697 0.220 93 2.469 0.394Small and Medium-sized firms 488 2.317 0.309 239 2.517 0.241 249 2.126 0.299
MS (Organizational management)All samples 923 2.593 0.463 573 2.749 0.398 350 2.339 0.466Manufacturing firms 491 2.493 0.459 194 2.782 0.367 297 2.305 0.430Service firms 432 2.707 0.444 379 2.732 0.414 53 2.528 0.634Large firms 397 2.759 0.436 304 2.837 0.387 93 2.507 0.517Small and Medium-sized firms 488 2.472 0.433 239 2.664 0.363 249 2.287 0.432
MS (Human resource Management)All samples 923 2.356 0.398 573 2.504 0.305 350 2.115 0.458Manufacturing firms 491 2.231 0.424 194 2.475 0.322 297 2.071 0.428Service firms 432 2.499 0.330 379 2.518 0.296 53 2.361 0.562Large firms 397 2.556 0.323 304 2.592 0.274 93 2.440 0.470Small and Medium-sized firms 488 2.202 0.402 239 2.407 0.323 249 2.005 0.400
The 2nd surveyN mean variance N mean variance N mean variance
MS (all questions)All samples 907 2.541 0.311 402 2.568 0.226 505 2.518 0.379Manufacturing firms 671 2.530 0.336 272 2.552 0.242 399 2.515 0.401Service firms 236 2.570 0.240 130 2.603 0.191 106 2.530 0.300Large firms 462 2.670 0.284 231 2.642 0.213 231 2.698 0.355Small and Medium sized firms 445 2.406 0.305 171 2.469 0.226 274 2.367 0.350
MS (Organizational management)All samples 907 2.669 0.413 402 2.694 0.322 505 2.649 0.485Manufacturing firms 671 2.662 0.442 272 2.668 0.343 399 2.657 0.511Service firms 236 2.691 0.330 130 2.750 0.276 106 2.618 0.391Large firms 462 2.755 0.411 231 2.755 0.336 231 2.755 0.487Small and Medium sized firms 445 2.580 0.401 171 2.612 0.293 274 2.560 0.468
MS (Human resource Management)All samples 907 2.444 0.414 402 2.474 0.313 505 2.420 0.495Manufacturing firms 671 2.432 0.443 272 2.465 0.320 399 2.409 0.526Service firms 236 2.479 0.334 130 2.492 0.300 106 2.463 0.379Large firms 462 2.606 0.380 231 2.557 0.314 231 2.655 0.444Small and Medium sized firms 445 2.276 0.395 171 2.361 0.291 274 2.223 0.454
Total Japan Korea
Total Japan Korea

30
Table 5 Kolmogorov-Smirnov Test
Note 'Japan <Korea' means that sample values in Japan are smaller than those in Korea, and vice versa. 2. * p<0.10, ** p<0.05, and *** p<0.01.
Distance p-value Distance p-value Distance p-valueJapan<Korea 1 0.007 0.981 0.005 0.987 0.009 0.965Japan>Korea 1 -0.326 *** 0.000 -0.273 *** 0.000 -0.294 *** 0.000Combined test 0.326 *** 0.000 0.273 *** 0.000 0.294 *** 0.000
Distance p-value Distance p-value Distance p-valueJapan<Korea 1 0.060 0.195 0.048 0.354 0.047 0.369Japan>Korea 1 -0.110 *** 0.004 -0.100 ** 0.011 -0.109 *** 0.005Combined test 0.110 *** 0.009 0.100 ** 0.022 0.109 ** 0.010
Distance p-value Distance p-value Distance p-valueJapan 1st<Japan 2nd1 0.017 0.869 0.053 0.265 0.017 0.866Japan 1st>Japan 2nd1 -0.081 ** 0.047 -0.103 *** 0.006 -0.065 0.140
Combined test 0.081 * 0.093 0.103 ** 0.013 0.065 0.279
Distance p-value Distance p-value Distance p-valueKorea 1st<Korea 2nd1 0.215 *** 0.000 0.199 *** 0.000 0.203 *** 0.000Korea 1st>Korea 2nd1 -0.003 0.996 0.000 1.000 -0.003 0.997
Combined test 0.215 *** 0.000 0.199 *** 0.000 0.203 *** 0.000
Note 1. 'Japan <Korea' means that sample values in Japan are smaller than those in Korea, and vice versa. 2. * p<0.10, ** p<0.05,and *** p<0.01.
First surveyAll questions Organizational Management Human Resource Management
Note 1. 'Japan <Korea' means that sample values in Japan are smaller than those in Korea, and vice versa. 2. * p<0.10, ** p<0.05,and *** p<0.01.
Second surveyAll questions Organizational Management Human Resource Management
Japan All questions Organizational Management Human Resource Management
Note 1. 'Japan <Korea' means that sample values in Japan are smaller than those in Korea, and vice versa. 2. * p<0.10, ** p<0.05,and *** p<0.01.
Korea All questions Organizational Management Human resource management
31
Table 6 Comparison of Management Scores in Corresponding Industries in the First and Second Surveys in Japan
N mean variance N mean variance N mean varianceMS (all questions)
All samples 573 2.609 0.243 105 2.545 0.266 402 2.568 0.226Manufacturing firms 194 2.606 0.245 67 2.516 0.269 272 2.552 0.242Service firms 379 2.610 0.243 38 2.596 0.265 130 2.603 0.191Large firms 304 2.697 0.220 63 2.638 0.244 231 2.642 0.213Small and Medium-sized firms 239 2.517 0.241 42 2.405 0.272 171 2.469 0.226
MS (Organizational management)All samples 573 2.749 0.398 105 2.656 0.370 402 2.694 0.322Manufacturing firms 194 2.782 0.367 67 2.642 0.419 272 2.668 0.343Service firms 379 2.732 0.414 38 2.680 0.293 130 2.750 0.276Large firms 304 2.837 0.387 63 2.735 0.395 231 2.755 0.336Small and Medium-sized firms 239 2.664 0.363 42 2.536 0.318 171 2.612 0.293
MS (Human resource Management)All samples 573 2.504 0.305 105 2.462 0.356 402 2.474 0.313Manufacturing firms 194 2.475 0.322 67 2.422 0.323 272 2.465 0.320Service firms 379 2.518 0.296 38 2.533 0.416 130 2.492 0.300Large firms 304 2.592 0.274 63 2.566 0.340 231 2.557 0.314Small and Medium-sized firms 239 2.407 0.323 42 2.307 0.346 171 2.361 0.291
First survey Second survey (correspondingindustries)
Second survey (entire sample)

32
Table 7 Summary of Responses to Additional Questions in the Second Interview Survey
Table 7-1
(%)
Japan Korea75%~ 66.4 43.650%~75% 16.7 18.225~50% 9.7 18.8~25% 6.0 19.4
Share in Domestic Market (based onQuestion 1a in the second interviewsurvey)
Table 7-2
(%)
Japan KoreaOne firm 1.5 2.2From 2 to 5 firms 40.8 52.9From 6 to 9firms 20.0 19.8Above 10 firms 36.5 25.1
Number of Competitive Firms (based onQuestion 1d in the second interviewsurvey)
Table 7-3
(%)
Japan KoreaLess than one month 5.8 25.6From 1 to 3 months 16.0 40.1From 3 to 6 months 4.6 17.5From 6 months toone year
63.2 10.4
Above one year 10.4 6.3
Months Required to ReviseOrganizational Goals and ImplementMeasures to Attain Them (based on thesecond question in Question 3-3-4 in thesecond interview survey)

33
Table 7-4
(%)
Japan KoreaAbove 60% 10.1 17.440%~59% 18.3 29.620~39% 27.5 29.8Less than 20% 44.2 23.0
Table 7-5
(%)
Japan KoreaLess than one month 26.3 2.0From 1 to 3 months 17.9 11.6From 3 to 6 months 8.9 21.6From 6 months toone year
21.3 37.5
One year and above 24.3 27.3
Table 7-6
(%)
Japan KoreaLess than one month 26.6 4.9From 1 to 3 months 17.1 16.3From 3 to 6 months 13.5 20.4From 6 months toone year
23.5 29.5
One year and above 18.0 28.9
The Share of 'nemawashi' Hours Requiredfor Organizational Decision for StartingNew Business (based on the Question 9-1in the second interview survey)
Period from the Initial Consideration ofNew Business until It Begins (based onthe supplementary question in Question 9-1 in the second interview survey)
Period from the Initial Consideration ofExit until the company Exits (based on thesupplementary question in Question 9-2 inthe second interview survey)

34
Table 7-7
(%)
Japan KoreaAbove 80% 12.7 29.960%~79% 17.3 34.540~59% 29.4 24.0Less than 40% 40.8 11.7
Table 7-8
(%)
Japan KoreaAbove 60% 3.2 4.040%~59% 7.1 12.320~39% 25.7 34.1Less than 20% 64.0 49.5
Share of Information Held by Managers ofthe Total Information within a Firm (basedon Question 9-3 in the second interviewsurvey)
Share of Informal Information to the TotalInformation Held by Managers (based onthe Question 9-4 in the second interviewsurvey)

35
Table 8-1 Summary of Statistics
Table 8-2: Capital/Labor Ratios and Average Productivity
Obs. Mean Standard dev. Min Max
Managementscore (All) 2715 2.6 0.48 1.21 4Organizationalmanagement score 2715 2.73 0.6 1 4
Human resourcemanagement score 2715 2.5 0.55 1 4VA (million US$) 2715 99.84 343.62 0.1 4296.68K (million US$) 2715 320.96 1272.58 0 21464.55L 2715 762.94 2965.9 0.01 47181Manufacturingdummy 2715 0.48 0.5 0 1
Obs. Mean Standard dev. Min MaxManagementscore (All) 2122 2.43 0.62 1 4Organizationalmanagement score 2122 2.56 0.7 1 4Human resourcemanagement score 2122 2.34 0.71 1 4VA (million US$) 2122 91.73 389.63 0 6053.74K (million US$) 2122 230.61 1002.76 0.03 12599.07L 2122 194.91 945.72 0 18226Manufacturingdummy 2122 0.83 0.37 0 1
Japan
Korea
Variable Country Obs. Mean Standard dev. Min. Median Max.Japan 2715 229.76 915.53 0 0.11 28803.75Korea 2122 159.29 314.05 0 73.39 3809.55Japan 2709 13.28 32.23 0 2.37 410.55Korea 1253 4.78 9.81 0.03 2.51 142.48Japan 2715 37.43 97.42 0 0.08 1785.66Korea 2122 66.8 89.99 0 51.03 839.27Japan 2706 10.5 70.28 0 0.59 2331.49Korea 2122 1.52 5.98 0 0.59 176.42
K / Wage
VA / L
VA / K
Note: VA and K are value-added, and capital respectively, and are in millions of Yen. L is the number of regular workers. LH isthe number of regular workers multiplied by hours worked.
K / L

36
Table 9-1 Estimation Results Using by Country
Country Japan Korea Japan Korea Japan Korea Japan KoreaManagement score (All) 0.129*** 0.131***
<0.039> <0.056>(3.686) (4.195)
Organizational managementscore
0.102*** 0.029 0.088*** -0.063**
<0.039> <0.014> <0.034> <-0.030>(3.689) (1.076) (2.919) (-2.054)
Human resourcemanagement score
0.078*** 0.155*** 0.041 0.188***
<0.027> <0.075> <0.014> <0.091>(2.582) (5.660) (1.260) (5.927)
lnK 0.193*** 0.426*** 0.193*** 0.433*** 0.193*** 0.423*** 0.193*** 0.423***<0.306> <0.502> <0.306> <0.510> <0.307> <0.498> <0.306> <0.498>(17.345) (29.381) (17.332) (29.938) (17.341) (29.210) (17.337) (29.266)
lnL 0.888*** 0.782*** 0.891*** 0.796*** 0.893*** 0.774*** 0.888*** 0.773***<1.654> <1.360> <1.658> <1.383> <1.663> <1.344> <1.653> <1.343>(40.053) (22.013) (40.334) (22.389) (40.377) (21.799) (40.049) (21.786)
constant 0.475*** 0.891*** 0.517*** 0.980*** 0.582*** 0.928*** 0.468*** 1.005***(3.808) (5.318) (4.353) (5.752) (4.903) (5.628) (3.752) (5.947)
Manufacturing dummy Yes Yes Yes Yes Yes Yes Yes YesThe second survey dummy Yes Yes Yes Yes Yes Yes Yes Yes
Year dummy Yes Yes Yes Yes Yes Yes Yes YesNumber of observations 2715 2122 2715 2122 2715 2122 2715 2122
Adjusted R2 0.706 0.678 0.706 0.676 0.705 0.68 0.706 0.681
Note 1. Standardised partial regression coefficients in angle brackets, t statistics in parentheses.
Note 3. * p<0.10, ** p<0.05, and *** p<0.01.
Note 2. Standardised partial regression coefficients are the coefficients found by the regression of standardised dependentvariable on standardised explanatory ones. They are used in case we compare the relationship of the impact of explanatoryvariables on the dependent variable among different models.

37
Table 9-2 Estimation Results by Sector
Table 9-3 Estimation Results by Size
Japan Korea Japan Korea Japan Korea Japan Korea Japan Korea Japan Korea Japan Korea Japan KoreaAverage score 0.168*** 0.096*** 0.036 0.246***
<0.050> <0.043> <0.012> <0.084>(4.063) (2.968) (0.737) (2.614)
Organizational managementscore
0.091*** 0.009 0.039 -0.068** 0.057 0.088 0.067* -0.071
<0.033> <0.004> <0.014> <-0.035> <0.024> <0.035> <0.029> <-0.028>(2.633) (0.314) (1.024) (-2.133) (1.506) (1.104) (1.669) (-0.758)
Human Resourcemanagement score
0.144*** 0.123*** 0.127*** 0.158*** -0.007 0.276*** -0.034 0.317***
<0.050> <0.063> <0.044> <0.081> <-0.003> <0.105> <-0.013> <0.120>(4.060) (4.331) (3.248) (4.822) (-0.160) (3.266) (-0.738) (3.159)
lnK 0.470*** 0.482*** 0.471*** 0.490*** 0.473*** 0.478*** 0.471*** 0.479*** 0.099*** 0.340*** 0.100*** 0.346*** 0.099*** 0.336*** 0.100*** 0.335***<0.580> <0.534> <0.581> <0.543> <0.584> <0.530> <0.581> <0.532> <0.172> <0.482> <0.173> <0.490> <0.172> <0.475> <0.173> <0.474>(24.292) (26.775) (24.186) (27.328) (24.505) (26.643) (24.301) (26.733) (7.849) (12.819) (7.880) (13.004) (7.825) (12.667) (7.874) (12.610)
lnL 0.724*** 0.732*** 0.730*** 0.740*** 0.725*** 0.723*** 0.724*** 0.718*** 0.859*** 0.794*** 0.856*** 0.818*** 0.863*** 0.793*** 0.859*** 0.800***<1.276> <1.334> <1.286> <1.347> <1.277> <1.317> <1.275> <1.308> <1.647> <1.165> <1.643> <1.201> <1.656> <1.164> <1.648> <1.174>(21.137) (17.561) (21.252) (17.729) (21.162) (17.344) (21.127) (17.221) (31.842) (10.649) (32.052) (10.916) (32.152) (10.775) (31.871) (10.777)
Cons -0.535*** 0.470*** -0.390** 0.546*** -0.480*** 0.510*** -0.527*** 0.607*** 6.157*** 5.401*** 6.093*** 1.701*** 6.269*** 5.382*** 6.148*** 1.592***(-3.373) (2.725) (-2.539) (3.095) (-3.157) (3.005) (-3.318) (3.458) (34.055) (15.903) (37.032) (4.166) (37.852) (16.888) (34.006) (3.934)
The second survey dummy Yes Yes Yes Yes Yes Yes Yes Yes Yes Yes Yes Yes Yes Yes Yes YesYear dummy Yes Yes Yes Yes Yes Yes Yes Yes Yes Yes Yes Yes Yes Yes Yes Yes
Number of observations 1308 1763 1308 1763 1308 1763 1308 1763 1407 359 1407 359 1407 359 1407 359Adj. R-Squared 0.811 0.679 0.809 0.677 0.811 0.681 0.811 0.681 0.647 0.672 0.647 0.667 0.647 0.675 0.647 0.675
Note 3. * p<0.10, ** p<0.05, and *** p<0.01.
Note 1. Standardised partial regression coefficients in angle brackets, t statistics in parentheses.
Manufacturing
Note 2. Standardised partial regression coefficients are the coefficients found by the regression of standardised dependentvariable on standardised explanatory ones. They are used in case we compare the relationship of the impact of explanatoryvariables on the dependent variable among different models.
ServicelnVA
Japan Korea Japan Korea Japan Korea Japan Korea Japan Korea Japan Korea Japan Korea Japan KoreaAverage score 0.128*** 0.115*** 0.055 0.061
<0.039> <0.050> <0.022> <0.029>(3.001) (3.473) (1.291) (0.873)
Organizational managementscore
0.105*** 0.03 0.089** -0.044 0.060* 0.013 0.064* -0.045
<0.038> <0.015> <0.033> <-0.022> <0.031> <0.007> <0.033> <-0.026>(2.999) (1.072) (2.347) (-1.366) (1.841) (0.218) (1.827) (-0.617)
Human resourcemanagement score
0.078** 0.132*** 0.041 0.155*** 0.015 0.079 -0.013 0.108
<0.027> <0.065> <0.014> <0.077> <0.006> <0.041> <-0.006> <0.055>(2.135) (4.525) (1.040) (4.604) (0.388) (1.232) (-0.319) (1.358)
lnK 0.178*** 0.377*** 0.178*** 0.381*** 0.178*** 0.375*** 0.178*** 0.376*** 0.098*** 0.435*** 0.097*** 0.439*** 0.097*** 0.430*** 0.097*** 0.426***<0.311> <0.450> <0.311> <0.456> <0.312> <0.448> <0.311> <0.449> <0.140> <0.505> <0.139> <0.509> <0.139> <0.498> <0.139> <0.494>(13.372) (24.070) (13.357) (24.372) (13.384) (24.061) (13.358) (24.103) (6.241) (10.049) (6.226) (10.159) (6.220) (9.849) (6.209) (9.644)
lnL 1.597*** 1.223*** 1.601*** 1.245*** 1.603*** 1.206*** 1.597*** 1.202*** 0.901*** 0.538*** 0.899*** 0.534*** 0.905*** 0.543*** 0.900*** 0.546***<2.204> <1.817> <2.209> <1.849> <2.213> <1.791> <2.204> <1.785> <0.749> <0.387> <0.748> <0.384> <0.753> <0.391> <0.749> <0.393>(35.123) (22.127) (35.286) (22.601) (35.269) (21.733) (35.122) (21.621) (34.143) (7.586) (34.313) (7.532) (34.490) (7.645) (34.145) (7.657)
Cons -2.658*** -0.792*** -2.630*** -0.762*** -2.554*** -0.718*** -2.671*** -0.651*** 1.291*** 2.427*** 1.284*** 2.549*** 1.370*** 2.423*** 1.303*** 2.520***(-12.270) (-3.409) (-12.329) (-3.233) (-12.080) (-3.113) (-12.311) (-2.763) (7.791) (5.341) (8.246) (5.503) (8.465) (5.580) (7.853) (5.447)
Manufacturing dummy Yes Yes Yes Yes Yes Yes Yes Yes Yes Yes Yes Yes Yes Yes Yes YesThe second survey dummy Yes Yes Yes Yes Yes Yes Yes Yes Yes Yes Yes Yes Yes Yes Yes Yes
Year dummy Yes Yes Yes Yes Yes Yes Yes Yes Yes Yes Yes Yes Yes Yes Yes YesNumber of observations 1825 1909 1825 1909 1825 1909 1825 1909 890 213 890 213 890 213 890 213
Adj. R-Squared 0.708 0.664 0.708 0.662 0.707 0.666 0.708 0.666 0.763 0.785 0.763 0.784 0.762 0.786 0.763 0.785
Note 3. * p<0.10, ** p<0.05, and *** p<0.01.
Note 1. Standardised partial regression coefficients in angle brackets, t statistics in parentheses.Note 2. Standardised partial regression coefficients are the coefficients found by the regression of standardised dependentvariable on standardised explanatory ones. They are used in case we compare the relationship of the impact of explanatoryvariables on the dependent variable among different models.
SME LargelnVA

38
Table 10-1 Estimation Results Examining Effects of Management Practices on Capital Efficiency
Japan Korea Japan Korea Japan Korea Japan KorealnK 0.110***0.357***0.123***0.407***0.148***0.353***0.109***0.361***
<0.174> <0.420> <0.195> <0.479> <0.234> <0.416> <0.173> <0.425>(5.071) (17.390) (6.506) (21.237) (7.792) (18.516) (5.065) (17.734)
lnK ×ln(AVG. score) 0.065***0.054***<0.145> <0.121>(4.473) (5.323)
lnK ×ln(ORG. score) 0.054*** 0.020** 0.048*** -0.012<0.127> <0.045> <0.112> <-0.026>(4.618) (2.230) (3.777) (-1.133)
lnK ×ln(HRM. Score) 0.037***0.056*** 0.018 0.062***<0.081> <0.136> <0.039> <0.149>(2.969) (6.469) (1.339) (6.170)
lnL 0.885***0.776***0.886***0.793***0.893***0.766***0.883***0.765***<1.648> <1.348> <1.649> <1.378> <1.662> <1.331> <1.645> <1.329>(39.913) (21.836) (40.050) (22.335) (40.411) (21.568) (39.841) (21.546)
constant 0.825***1.279***0.818***1.086***0.780***1.361***0.831***1.359***(7.831) (7.477) (7.798) (6.487) (7.448) (7.921) (7.890) (7.909)
Yes Yes Yes Yes Yes Yes Yes YesYes Yes Yes Yes Yes Yes Yes YesYes Yes Yes Yes Yes Yes Yes Yes
2715 2122 2715 2122 2715 2122 2715 21220.707 0.68 0.707 0.676 0.706 0.682 0.707 0.682
Note 1. Standardised partial regression coefficients in angle brackets, t statistics in parentheses.
Note 3. * p<0.10, ** p<0.05, and *** p<0.01.
lnVA
Note 2. Standardised partial regression coefficients are the coefficients found by the regression ofstandardised dependent variable on standardised explanatory ones. They are used in case wecompare the relationship of the impact of explanatory variables on the dependent variable amongdifferent models.
Capital efficiency
ObservationAdj. R-Squared
Manufacturing dummyThe second survey dummy
Year dummy

39
Table 10-2 Estimation Results Examining Effects of Management Practices on Labor Efficiency
Japan Korea Japan Korea Japan Korea Japan KorealnK 0.193***0.435***0.193***0.435***0.193***0.435***0.193***0.435***
<0.306> <0.512> <0.307> <0.512> <0.306> <0.512> <0.306> <0.513>(17.252) (30.157) (17.304) (30.188) (17.266) (30.160) (17.275) (30.216)
lnL 0.959***0.812***0.906***0.851***0.967***0.772***0.954***0.812***<1.786> <1.410> <1.687> <1.478> <1.801> <1.341> <1.777> <1.411>(21.327) (13.987) (23.757) (16.378) (24.607) (14.251) (21.442) (14.032)
lnL ×ln(AVG. score) -0.039 -0.01<-0.097> <-0.020>(-1.484) (-0.308)
lnL ×ln(ORG. score) -0.003 -0.038 0.013 -0.061**<-0.008> <-0.081> <0.034> <-0.131>(-0.150) (-1.402) (0.613) (-1.962)
lnL ×ln(HRM. Score) -0.046** 0.017 -0.051** 0.047<-0.111> <0.035> <-0.123> <0.096>(-2.022) (0.625) (-2.107) (1.508)
constant 0.690***1.009***0.729***0.981***0.685***1.058***0.695***1.048***(6.423) (5.842) (6.858) (5.837) (6.449) (6.084) (6.467) (6.030)
Yes Yes Yes Yes Yes Yes Yes YesYes Yes Yes Yes Yes Yes Yes YesYes Yes Yes Yes Yes Yes Yes Yes
2715 2122 2715 2122 2715 2122 2715 21220.705 0.675 0.705 0.676 0.705 0.676 0.705 0.676
Note 1. Standardised partial regression coefficients in angle brackets, t statistics in parentheses.
Note 3. * p<0.10, ** p<0.05, and *** p<0.01.
lnVALabor efficiency
Number of observationsAdj. R-Squared
Manufacturing dummy
Year dummy
Note 2. Standardised partial regression coefficients are the coefficients found by the regression ofstandardised dependent variable on standardised explanatory ones. They are used in case wecompare the relationship of the impact of explanatory variables on the dependent variable among
The second survey dummy

40
Table 11 Estimation Results Considering Effects of Management Scores on Firm Performances
lnVA (2009-2011)0.044
<0.015>(1.478)
0.052** 0.057**<0.023> <0.025>(2.259) (2.289)
0.009 -0.015<0.004> <-0.006>(0.356) (-0.519)
0.045*** 0.045*** 0.044*** 0.045***<0.072> <0.072> <0.071> <0.072>(4.920) (4.956) (4.882) (4.953)
0.947*** 0.946*** 0.951*** 0.947***<0.863> <0.862> <0.866> <0.863>(59.420) (59.805) (59.913) (59.459)
Cons 1.491*** 1.468*** 1.563*** 1.487***(15.846) (16.815) (17.746) (15.803)
Manufacturing dummy Yes Yes Yes YesYear dummy Yes Yes Yes Yes
Number of observations 1443 1443 1443 1443Adj. R-Squared 0.858 0.858 0.858 0.858
Note 1. Standardised partial regression coefficients in angle brackets, t statistics in parentheses.
Note 3. * p<0.10, ** p<0.05, and *** p<0.01.
lnL
Japan
Average score (the 1st survey)
Organizational managementscore
Human resource managementscore (the 1st survey)
lnK
Note 2. Standardised partial regression coefficients are the coefficients found by the regression of standardiseddependent variable on standardised explanatory ones. They are used in case we compare the relationship of the impactof explanatory variables on the dependent variable among different models.

41
Figure 1 – 1 Distribution of Management Scores (All firms in the 1st survey)
Figure 1 – 2 Distribution of Management Scores (All firms in the 2nd survey)
0.2
.4.6
.8Ke
rnel
den
sity
1 2 3 4Average score
Japan
Korea
0.2
.4
.6
.8
Kernel density
1 2 3 4Average score
Japan
Korea

42
Figure 1 – 3 Distribution of Management Scores (1st vs 2nd in Japan)
Figure 1 – 4 Distribution of Management Scores (1st vs 2nd in Korea)
0.2
.4
.6
.8
Kernel density
1 2 3 4Average score
1st survey
2nd survey
0.2
.4
.6
Kernel density
1 2 3 4Average score
1st survey
2nd survey
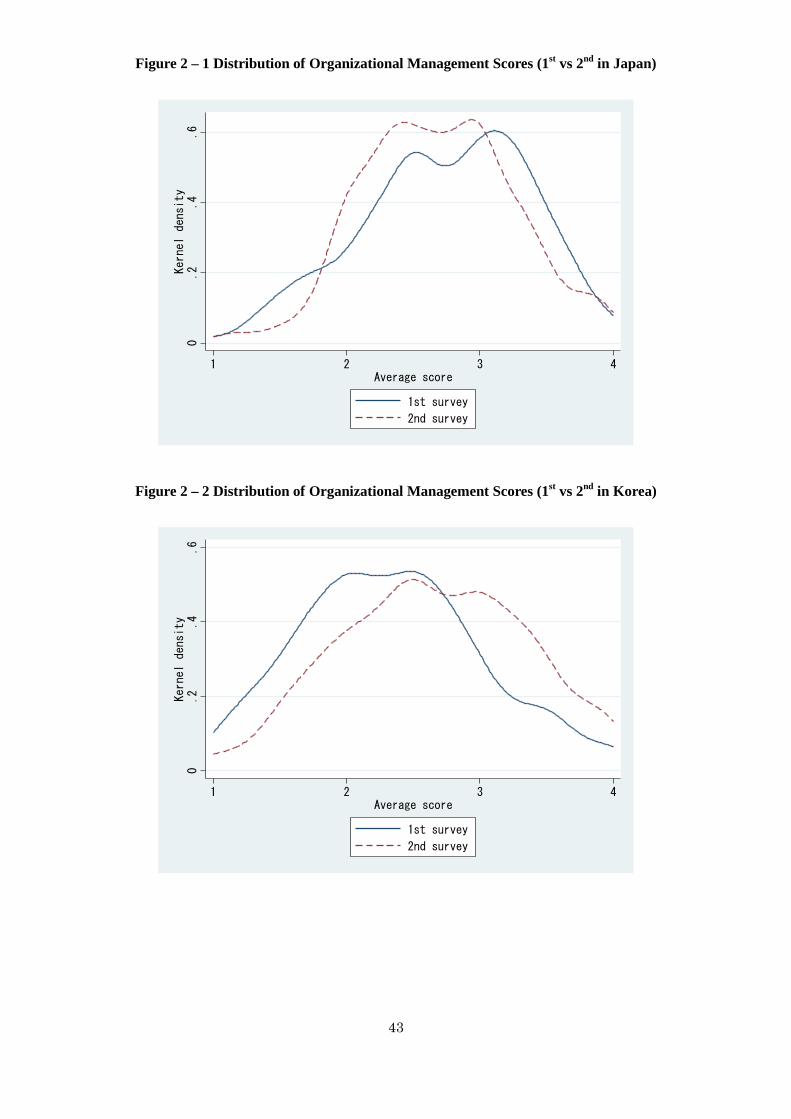
43
Figure 2 – 1 Distribution of Organizational Management Scores (1st vs 2nd in Japan)
Figure 2 – 2 Distribution of Organizational Management Scores (1st vs 2nd in Korea)
0.2
.4
.6
Kernel density
1 2 3 4Average score
1st survey
2nd survey
0.2
.4
.6
Kernel density
1 2 3 4Average score
1st survey
2nd survey

44
Figure 2 – 3 Distribution of Human Resource Management Scores (1st vs 2nd in Japan)
Figure 2 – 4 Distribution of Human Resource Management Scores (1st vs 2nd in Korea)
0.2
.4
.6
.8
Kernel density
1 2 3 4Average score
1st survey
2nd survey
0.2
.4
.6
Kernel density
1 2 3 4Average score
1st survey
2nd survey

45
Figure 2-5 Distribution of Management Scores in Large Firms (1st vs 2nd in Japan)
Figure 2-6 Distribution of Management Scores in Large Firms (1st vs 2nd in Korea)
0.2
.4
.6
.8
1Kernel density
1 2 3 4Average score
1st survey
2nd survey
0.2
.4
.6
.8
Kernel density
1 2 3 4Average score
1st survey
2nd survey

46
Figure 2-7 Distribution of Management Scores in SME (1st vs 2nd in Japan)
Figure 2-8 Distribution of Management Scores in SME (1st vs 2nd in Korea)
0.2
.4
.6
.8
Kernel density
1 2 3 4Average score
1st survey
2nd survey
0.2
.4
.6
.8
Kernel density
1 2 3 4Average score
1st survey
2nd survey

47