Embed Size (px)
Citation preview
Av: Diana Santana Handledare: Stig Blomskog
Södertörns högskola | Institutionen för samhällsvetenskap
Kandidatuppsats 15 hp
Nationalekonomi | höstterminen 2016
Is the Economic Growth in Developing Countries affected by Free Trade?
ii
Abstract
This bachelor thesis examines the relationship between free trade and the economic growth in
developing countries. The developments of a more integrated and globalized world challenges
countries in new ways by easier access to information and technology, intensified competition
and larger requirements on economic efficiency and increased productivity. It is important to
examine if trade can induce economic growth, since long-run economic growth determine
how living standards change, and provides an opportunity to improve the welfare and reduce
the worlds poverty rates. Trade affects countries in different ways and developing countries
have diverse growth experiences, where some countries have managed to increase their
economic growth compared to others. The thesis presents trade policies and theories, and a
brief overview of the controversies regarding trade. The relationship between economic
growth and trade is dynamic and complex and trade can be used as a mean to benefit from
technological transfers and knowledge spillovers, factors that have a substantial influence on
economic growth, along with investments. A cross-section regression analysis is conducted to
examine the relationship between trade openness and economic growth. The empirical results
show a positive correlation between trade openness and economic growth in developing
countries. High initial GDP and population growth are negatively correlated with GDP per
Capita growth, while Rule of Law has a positive impact on GDP per Capita growth.
Key Words
Trade Openness, Trade Policy, Economic Growth, Developing Countries

iii
Table of Contents
1. Introduction .................................................................................................................................................. 1 1.2 Study Objective ....................................................................................................................................................... 2 1.3 Problem Statement ............................................................................................................................................... 2 1.4 Methodology ............................................................................................................................................................ 2 1.5 Scope of the Study ................................................................................................................................................. 2 1.6 Outline of the Thesis ............................................................................................................................................ 3
2. Trade Policies ............................................................................................................................................... 4 2.1 World Trade Organization ................................................................................................................................. 4 2.2 Trade Agreements ................................................................................................................................................. 5 2.3 Trade Regulations and Trade Policies .......................................................................................................... 6 2.4 Controversies of Trade ........................................................................................................................................ 8
3. Theoretical Framework ......................................................................................................................... 12 3.1 Trade Theory ........................................................................................................................................................ 12
3.1.1 Models of Absolute and Comparative Advantage ........................................................................ 12 3.1.2 Economies of Scale and Monopolistic Competition .................................................................... 13
3.2 Endogenous Growth Theory .......................................................................................................................... 14
4. Previous Studies ....................................................................................................................................... 16
5. Empirical Analysis ................................................................................................................................... 20 5.1 Regression Model ............................................................................................................................................... 20 5.2 Data and Definitions of the Variables......................................................................................................... 21 5.3 Regression Results and Analysis .................................................................................................................. 24
6. Summary and Conclusions ................................................................................................................... 29
7. Bibliography............................................................................................................................................... 30 Electronical sources ............................................................................................................................................ 31 Statistical sources ................................................................................................................................................. 34
Appendix 1 .......................................................................................................................................................... i
Appendix 2 ..................................................................................................................................................... viii

1
1. Introduction
The idea of international trade as an engine of growth goes back to David Hume and Adam
Smith. They discovered the connection between trade, prosperity and growth, and linked it to
the interaction between trade, high levels of savings and investment to growth (Gylfason
1998). The developments of a more integrated and globalized world make it important to
examine the impact trade has on economic growth. Economic growth can enable people to
enjoy improved living standards. A country with a per capita growth rate of 2 percent may
result in a doubling of GDP per capita within 35 years, if growth is sustained (Ray 1998).
Nevertheless, whether trade a determinant of economic growth, create controversies.
Disagreements regarding its actual influence and the proper means to make most use of it in
order to achieve economic growth, intensifies the debates further.
The developing countries favoured import substitution in the years following the World War
II. They wanted to protect domestic production and industrialize in rapid pace. The outcome
did not meet the expectations and the results were market failures, restricted trade and a
slowdown in growth (Krueger 1998). This was followed by a shift in the 70s and 80s when
export promotion and outward orientation was pursued (Greenaway, Morgan and Wright
2002). International trade was also challenged when the price in raw material fell and the debt
increased in many developing countries. The over-dependence in agriculture and extraction of
primary products, created a narrow and vulnerable base for the developing countries
involvement in the world economy (Dicken 2007).
Debates regarding the effects of trade and its contribution to enhance economic growth had a
new swing due to changes in the terms of trade, poor economic performance in developing
countries and negative external effects. There are differences between advanced and
developing countries with inequalities of income, standards of living and investments in
health and education. Trade affects countries in different ways. Developing countries have
diverse growth experiences where some countries such as Brazil, China and India are
accompanied by the fast-growing Asian tigers; Hong Kong, Singapore, South Korea and
Taiwan. They have managed to increase their economic growth compared to other countries
(Ray 1998). However, there are still disparities and large differences within countries were
great poverty and enormous wealth coexist. A prosperous country experiencing growth may
still be poor in terms of standard of living and welfare. Many developing countries still

2
experience low economic growth and poor development due to internal factors and structural
problems. An institutional environment with poor governance, political turmoil, fragile legal
systems and misguided macroeconomic policies have negative effects on economic growth
(Wacziarg and Welch 2008). The globalized and integrated world challenges countries in new
ways by easier access to information and technology, the expansion of credit markets, larger
requirements of economic efficiency, enhanced productivity and intensified competition. The
importance of good governance and functioning institutions has increased along with the
pressure from the established international institutions promoting trade. The ability to adapt to
the new conditions and requirements to participate in the world market is a challenge, but the
anticipation is that there is an overall gain from trade. The importance of growth is essential
since long-run economic growth determine how living standards change and provides an
opportunity to improve the welfare of individuals and reduce the worlds poverty rates.
1.2 Study Objective The aim of the thesis is to examine whether there is a significant relationship between free
trade and economic growth in developing countries. The impact of trade policies and their
ability to induce economic growth will be examined along with trade theory and the
endogenous growth theory.
1.3 Problem Statement Is the economic growth in developing countries affected by free trade?
1.4 Methodology The empirical part of the thesis is carried out by conducting a cross-sectional regression
analysis to examine if there is a significant and positive relationship between trade and
economic growth. The dependent variable is the average growth of GDP per capita during the
period of 1992-2014. The independent variables that are included in the analysis are trade
openness, initial GDP per capita, education level, investment, population growth, life
expectancy and rule of law. The data was obtained from the World Development Indicators
and the Worldwide Governance Indicators from the World Bank database. The data and the
regression analysis was estimated with Eviews 9, student version.
1.5 Scope of the Study The study is confined to 63 developing countries, covering the period of 1992-2014. The
countries are categorized as low income, lower middle income and middle income countries
by the World Bank. The countries and the averaged, yearly values of the chosen variables are

3
listed in Appendix 1. The list also provides information of the countries’ main export good,
where the majority are exporters of petroleum oils, metals, coffee and cotton cloth. Only a
few exports electronic circuits and parts of data processes. The amount of countries is
constrained due to lack of data, some countries do not systematically report all data and were
omitted.
1.6 Outline of the Thesis The following section, Trade Policies, presents an overview of the World Trade Organization,
different types of trade agreements and trade policies. A narrative of the controversies of trade
is included. The aim is to clarify the diversity of trade agreements, policies and their effects. It
is followed by the section Theoretical Framework, that provides a description of trade
theories and the endogenous growth theory. Theories of comparative advantage are presented,
along with economies of scale and monopolistic competition. The fourth section, Previous
Studies, presents an overview of earlier studies and their conclusions. The fifth section,
Empirical Analysis presents a cross-section regression model, definitions of the selected
variables and the estimated data. A presentation and an analysis of the result are included in
the section. The last section is Summary and Conclusion. Tables, figures and descriptive
statistics related to the study are placed in the Appendix.

4
2. Trade Policies
2.1 World Trade Organization The World Trade Organization (WTO) was established in 1995 and replaced the General
Agreement on Tariff and Trade (GATT). The number of members have developed from 112
to 164 by 2016, and the objective is to reduce trade barriers and agree on rules and policies
concerning the conduct of international trade, so trade may flow as freely as possible. The
multilateral trade agreements regulate the trade of goods, services and intellectual property.
The principles of the trading system are based on reducing trade barriers through negotiation.
Competitiveness is encouraged by discouraging unfair practices, such as export subsidies and
dumping products at below cost to gain market share. WTO is run by its member
governments and decisions are generally taken by consensus of the entire membership. The
organization provides a forum for negotiations as well as a legal and institutional framework
for the implementation and monitoring of the agreements and the members trade policies. A
membership designates the countries to make commitments and comply by the rules, along
with the privileges they benefit from, such as security regarding trading rules and access to
membership countries markets. WTO members operate in a non-discriminatory trading
system that spells out their rights and their obligations. Member countries mutually abide to
not discriminate between trading partners, nor between its own and foreign products and
services. Nevertheless, trade does cause friction, disagreements and violations of trade rules.
By the year 2016, the number of disputes that have been brought to the WTO was 520. A
dispute arises when one country adopts a trade policy measure that other members consider to
be a violation of the agreements, or if a member country fails to comply with its’ obligations.
The Dispute Settlement is a procedure for settling disputes, instead of members acting
unilaterally or begin to use retaliatory measures. The system encourages countries to settle the
dispute through consultation and mediation but if they fail, the dispute settlement procedure
sets in. The members abide by the agreed procedures and respect the judgements made by an
independent, expert panel. The judgements can be endorsed, or rejected, by the WTO’s full
membership. The countries involved in the dispute must comply with the decision and the
rules. The aim is to contribute to stability, security and predictability of the multilateral
trading system and use a rule-based system, where rules are enforced to ensure that trade
flows smoothly (wto).

5
2.2 Trade Agreements Trade agreements can be bilateral, regional or multilateral, and many regional trade
agreements eventually turn into multilateral ones (Feenstra 2004). The degree of economic
integration varies, depending on the type of trade agreement and the barriers to trade tend to
decrease, as economic integration increase. Regional trade agreements are defined as
reciprocal trade agreements between two or more partners, and include free trade agreements
and customs unions. They allow groups of countries to negotiate rules and commitments that
may not have been possible during the multilateral trade negotiations. Regional trade
agreements may support and complement the multilateral trading system by reducing trade
barriers, create economic integration and pave the way for new agreements. The principle of
“most favoured nation” states that all members of GATT should be granted the same tariffs
and would be violated when countries join regional trade agreements, granting zero tariffs to
countries within the agreement (wto 2016) (Feenstra 2004). But there are exceptions. GATT’s
Article 24 allow regional arrangements if certain criteria are met. The reduction or removal of
duties and trade barriers should cover substantially all sectors of trade flows in the group and
non-members should not find trade with the group more restrictive than before (wto 2016).
The participants of a preferential trade agreement reduce tariffs for certain goods with respect
to each other. There is no general reduction of internal tariffs, nor a common external tariff.
A free trade area is a form of market integration where internal tariffs are eliminated among
members. The members keep their own trade policy and external tariffs towards non-members
(Kjeldsen-Kragh 2001). The free-trade areas lack of common, external, trade policies require
measurements, such as the use of certificates of origin for goods crossing the borders. The
objective is to prevent countries to take advantage of arbitrage opportunities by importing
goods from outside and then sell it in the free trade area. A customs union on the other hand,
abolish internal tariffs and trade restrictions among the members of the union. The union
develops a common trade policy with common external tariffs on imports from non-members
(Marrewijk 2002). A customs union tend to lead to an increase in intra-industry trade
(Kjeldsen-Kragh 2001).
When custom unions are created, trade creation and trade diversion will occur and have
impact on welfare and the resource allocation. Jacob Viner (1950) concluded that the
advantages of a customs union increased and raised welfare for the members of the union, if
trade-creation was dominant. Trade creation occur when the most efficient producer of a good
6
joins the union, or replaces a less efficient union member producer. The allocation of
resources will improve, since the more competitive and efficient country will produce the
good. Trade-diversion on the other hand, is an efficiency reducing effect that occur when
member countries prefer to import goods from a less efficient union member, instead of from
the most efficient producer, who may not a member of the union. The member country’s
export of the good rise but the non-member fall. The world efficiency falls since trade is
diverted from low-cost to high cost sources (Theo, Mutti and Turnovsky 2009). Negative
welfare effects arise from the reallocation of resources, from the more efficient to the less
efficient producer, which is a result of trade-diversion. It is a misallocation, when the cheaper
foreign supplier is replaced by a more expensive supplier who is a union member (Marrewijk
2002) (Kjeldsen-Kragh 2001).
2.3 Trade Regulations and Trade Policies The purpose of trade policies is to support the countries own production. Most countries use a
variety of policy instruments that restrict and affect trade, directly or indirectly. They can be
selective or general, where the former affect a specific market and the latter has a widespread
effect on several macroeconomic variables. Trade restrictions affect economic factors such as
production, consumption, terms of trade, competitiveness, trade flows, income and
government finances in different ways (Kjeldsen-Kragh 2001). The policies may be pure
quantity restrictions, but may also extended to different types of regulations and price
restrictions. Quantity restrictions are import quotas, export limitations, import–export
embargoes, bans and voluntary export restraints (heritage). Voluntary export restraint is an
example on non-tariff barrier that limits the quantity of exports and results in an increase in
the domestic price, above the level of the world market price. Regulatory restrictions are
composed by licensing, safety and industrial standards, packaging, labelling, and trademark
regulations. The products can be exported if they live up to the safety, health, quality or
customs regulations set by the importing country. If the conditions are not met, the exporting
country will be denied market access (Kjeldsen-Kragh 2001). Local content requirements are
another example of regulatory restrictions, with requirements that a specified fraction of a
final good, is produced domestically. Price restrictions include antidumping duties and border
tax adjustments, while investment restrictions concern different types of financial controls
(heritage).

7
There are a variety of government interventions, such as government procurement, which
oblige government agencies to purchase goods from domestic suppliers, even if they charge
higher prices compared to foreign suppliers. Direct government interventions are composed
by industrial policies, state trading, government monopolies and subsidies among others
(heritage). The polices affect trade and the economy in different ways and may even be
counterproductive. The effect, depends on which policy and restriction the country imposes
and on the market structures and the size of the country (Feenstra 2004). The bureaucratic
control over producers, restrictive import licensing and exchange controls may result in
corruption, increasing black market activity and smuggling (Krueger 1998). Policies are often
politically motivated. Tariffs are granted in response to demands by special interest groups
that lobbies for industries, unions and state owned companies and multinationals (Feenstra
2004).
A quota is quantity restrictions on imports or exports and usually enforced by issuing licenses
to a group of individuals or firms. A binding import quota will push up the price of the
imported good and decrease the quantity supplied (Feenstra 2004). License holders are then
able to buy imports and resell them at a higher price at the domestic market. The revenue,
called quota rents, is collected by the holders of the licenses. The difference, between a quota
and a tariff is that the use of quotas results in no revenue received by the government. When
the rights to sell in the domestic market is assigned to the government of the exporting
country, the transfer of rents makes the cost of a quota substantially higher than the equivalent
tariff. With imperfect competition, a quota leads to stronger anti-competitive behaviour on the
part of domestic producers, compared to a tariff.
Tariffs on imported goods raise the price, which is often the principal objective. The aim may
be to protect the traditional industry by restricting imports of goods that will compete with the
domestic production. The relative price of the traditional industry will increase and attract
more resources at the expense of other industries. The domestic price ratio will be distorted
due to the tariff. Even if production may increase, the full advantages of product
specialization will not be exploited. When the country decides to liberalize, and participate in
free trade by removing the tariff, the distorted price will change and equalize with the world
market price due to competition. The resources may then be transferred and reallocated to
other sectors and industries (Gylfason 1998). Administratively, export tariffs are an easy way
to generate government revenues, as opposed to commodity taxes and income taxes.

8
Countries with poor or unidentified tax bases and undeveloped tax systems tend to take
advantage of tariff rates, since it is easier for governments to collect revenue by tariffs at the
border (Kjeldsen-Kragh 2001).
2.4 Controversies of Trade There are many discussions and disagreements regarding the effects of trade and whether it is
a determinant of economic growth. There is a difference between trade and free trade, and the
definitions of liberalization and openness. None of them should be equalized (Greenaway,
Morgan and Wright 1998). Free trade may be defined as the absence of trade barriers and
policies that aim to restrict trade. In a free market, producers and consumers allocate
resources most efficiently when governments do not distort the market prices through trade
policies. Trade may provide access to new markets, investments, technological advances,
knowledge, intermediate goods and development of R&D. The benefits of trade are vital to
the development processes of developing countries (Yanikkaya, 2003). Trade may therefore
be a valuable mean that create integration of new knowledge and technological innovations.
Human capital and technology transfers are influential factors that affect economic growth
and may act as trade capacity enhancers (wto 2016). Trade increase competitiveness and
allow firms and industries to specialize, increase their efficiency, allow them to benefit from
economies of scale, lower the costs and adapt new technologies. The increase in exports may
also result in a boost of the economy due to job creation and increased productivity. The
consumers benefit from larger variety of goods and lower prices, due to increased competition
and trade. Trade may raise growth rates and bring gain to all countries, but the positive effects
of trade on growth depends strongly on whether there are international spillovers of
knowledge (Feenstra 2004) and technological transfers. (Marrewijk 2002) (Kjeldsen-Kragh
2001).
The effects of free trade and integration at the world market does not always result in gains
and increased welfare. Trade may have negative external effects such as exploitation of
natural resources, depletion, environmental damages and displacements. Trading relationships
create tensions between countries due to differences in the factors of production, such as
physical and human capital. The scarcity of these contribute to low level of per capita income
and prevention from realizing the economies of scale, from which many richer nations benefit
(Krugman, Obstfeld and Melitz 2012). Different occupational and production structures add
to the tensions since the demand and price for manufactured goods are higher than for primary
products. The situation intensifies further due to the international competition, not only

9
between developed and developing countries but also between developing ones. The
competition is most severe in the lower-skill, labour-intensive activities (Dicken 2007). The
activities are often associated with low wages and may be used as a requirement or incentive
to attract foreign capital and multinationals.
Countries with lower per capita income tend to have smaller trade volumes. They do not only
trade less, but they also have a lower number of trading partners. The costs of access to
foreign markets, plays an important role in explaining the correlation between trade and per
capita income. Poorer countries may face higher entry barriers to foreign markets. Export
firms are often required to meet certain product standards and quality requirements, which
may result in export and profit losses. Poor infrastructure and bureaucracy also play a role of
entry barriers to foreign markets for firms in less developed countries. Entry barriers to
foreign markets are higher for firms from less developed countries and the relationship
between trade costs and countries’ development levels have importance (Tarasov 2012). The
difficulties for developing countries’ exporters in accessing developed markets have fallen
since 1980, but they are still 50 per cent higher, than those faced by exporters in developed
countries. Tariffs have influence on trade patterns, but they do not explain a large part of the
border effect. Differences in infrastructure and trade facilitation such as documentation
requirements, administrative regulations and border procedures seems to impose high costs on
trade (Sousa, Mayer and Zignago 2012).
A main subject of the controversies regards developing countries over dependency in natural
resources. Especially, the least developed countries that depend highly on exports of natural
resources such as fuels and mining products. It may be harmful if they are poorly managed by
inefficient, corrupt government-run corporations. They tend to fail due to excessive rent-
seeking, influenced by special interests and neglect other economic activities, such as
investments in other sectors and industries. The expansion of primary product export
discourages exports of other goods, if other sectors are neglected. It will then affect total
exports and the economic growth. It also creates a vulnerability and exposure, since the
primary market is characterized by financial volatility and fluctuations that creates higher
uncertainty and instability (Ray 1998). Primary products are mostly priced in US dollars and a
stronger US currency generally allows the same quantity of goods to be purchased with fewer
dollars. Thus, the appreciation of the US dollar may contribute to falling commodity prices
(wto 2016). The vulnerability is magnified due to the previous discouragement of investing

10
and diversifying the production and industries. The barriers to diversify are altered further
when tariffs on agricultural products are higher than manufactured goods. Tariff peaks on
some products and tariff escalation, discriminate against imports from developing countries.
The result is that developing countries continue with the export of primary products, since the
incentive to advance industries and export value added goods is hampered (De Vylder,
Nycander and Laanatza 2001). This is problematic, and the reliance on natural resources in
the least developing countries tend to be connected to low levels of saving, investment,
technology and education, since the economic activities are based on mining, fishing and
agriculture. These sectors do not require the same need of high skilled workers and
investment in education and technology, as in the advanced sectors. Some of the developing
countries with an over dependency in natural resources may not be able to diversify and shift
their production, thus they will experience less economic growth (Gylfason 1998). The
inequalities between countries is further reinforced by the cumulative process of economic
growth. The larger differences in price between manufactured and primary goods create
divergence of the terms of trade (Dicken 2007). Developing countries need to diversify, add
value to their production and produce competitive goods which may be achieved by
improvements in technology and human capital (De Vylder, Nycander and Laanatza 2001).
High investment rates in physical and human capital are closely related to higher living
standards, along with low population growth. Governments can affect the level of economic
efficiency by the use of fiscal, macroeconomic and trade policies (Weil 2009). Trade policies
can be used to increase trade openness, and thereby induce economic growth by using trade as
a mean to access technological innovations and knowledge spillovers (Gylfason 1998). But,
the extent of the impact of trade is limited by the ability of to make most of it due to the lack
of the necessary skills, human capital and expertise. Most firms are unable to invest in new
technology, especially in the face of intense import competition (Deraniyagala and Fine 2001)
(Rogers 2003) (Jawara and Kwa 2003). A country that has been able to diversify and take
advantage of technological advancements is Bangladesh. It has become an emerging exporter
of information and communications services, and is an attractive IT and business outsourcing
location. The country has emerged as a hub for freelance of IT services via online sites where
professionals offer various services, from simple data entry to application development and
project management (wto 2016). It is an example of taking advantage of existing technology,
and use it as a mean that enables new ways of trading, by offering products and services
online such as computer programs, music apps and consultation services.
11
Trade debates and the ability to trade is not only restricted to trade barriers and market access.
There are also controversies regarding which types of policies, implementations and adaptions
liberalizing countries should implement in order to experience economic growth. Developing
countries often need international adjustment, regarding certificates, licences, standardization
and quality of products to gain market access. They also need to adapt to the changes and
make market improvements, improve their fiscal and macroeconomic policies and establish
functional legal- and financial systems and increase bureaucratic efficiency (De Vylder,
Nycander and Laanatza 2001). Appropriate economic policies and institutional reforms are
important to increase efficiency and achieve economic growth in the long run (Gylfason
1998). Investments in education, technology and infrastructure is vital for growth, along with
political stability. They are determinants since they affect individuals and firms’ willingness
to make long-term investments in capital, skills and technology, all associated with long-run
economic growth. Economies in which the government provides an environment that
encourage production, tend to be more dynamic and successful, compared to others where the
government abuses its authority to engage in and permit diversion (Jones 2002).

12
3. Theoretical Framework
3.1 Trade Theory International trade theory is a wide field where the source and structure of international trade
flows can be examined in relation to geography, industrial organization, multinationals, intra-
industry trade, market power and strategic trade policies. The traditional trade theory uses
differences in comparative advantage and resources as a reason for countries to trade. New
models include increasing returns and imperfectly competitive markets to examine the effect
of firms, industries and the world market.
3.1.1 Models of Absolute and Comparative Advantage
Adam Smith (1776) concluded that absolute advantage results in mutual gains of trade. A
country has an absolute advantage, when it is more efficient in producing a good, compared to
other countries. The countries can specialize in the production of the goods where they are
most efficient and imports goods in which they have a disadvantage (Zhang 2008). David
Ricardos’ theory use differences in comparative advantage as a reason for countries to engage
in trade. Comparative advantage is the ability to produce a good more efficiently, compared to
other products. Countries will specialize in the production of a good or service, if the
opportunity cost of producing the good is lower, compared to other countries. The opportunity
cost reflects differences in production abilities and countries will export the good in which
they have relatively high productivity. The specialization in production of goods increases
output and increase the ability to take advantage of economies of scale. Gains of trade arise,
since trade enlarges the amount of produced goods and consumers can enjoy a larger variety
of goods due to trade. Trade is beneficial for a country even if it has lower productivity than
its trading partners, and even if the countries are competitive due to low wages, since they
specialize in the production of the good, where they have relatively lower unit labour
requirements (Krugman, Obstfeld, & Melitz 2012).
The Heckscher-Ohlin model assume that the driving force behind international trade is
determined by countries differences in factor endowments and intensities (Zhang 2008). The
country that is abundant in a factor, exports the good, whose production is intensive in that
factor. Thus, a country will export the goods that it can produce most efficiently, with respect
to its resources and the amount of capital and labour that is required in the production. The
amount of capital and labour that is necessary in the production differs and effects what type

13
of good the country will produce. The production of cloth requires more labour and less
capital, compared to the production of computers. The choice of production will therefore
depend on the relative cost of capital and labour. It will influence the allocation of production,
since the cost of producing a good depends on the factor prices. The economy will allocate
more labour and capital to the production of cloth, if the labour-capital ratio in the cloth sector
is higher, than in the computer sector. Thus, more cloth will be produced and less computers.
The production of cloth will always use more labour relative to capital, compared to the
production of computers. The production of cloth is therefore labour-intensive while
production of food is capital-intensive. When countries trade, the labour-abundant countries
will export cloth and capital-abundant countries on the other hand, will produce and export
capital-intensive products. (Krugman, Obstfeld and Melitz 2012).
3.1.2 Economies of Scale and Monopolistic Competition
Industries characterized by economies of scale, also referred to as increasing returns,
experience that production is more efficient, the larger the scale at it takes place. Doubling the
inputs will more than double the industry production. Countries may concentrate on
producing a limited number of goods, in which they specialize, become efficient and benefit
from the economies of scale. Trade increases the overall industry efficiency and enables
consumers in countries to enjoy a larger variety of goods and lower prices. External and
internal economies of scale differ and they have different implication for the market structure.
An industry with purely external scale typically consists of several small firms and can be
perfectly competitive. An industry characterized by internal economies of scale has an
imperfectly competitive market structure, where large firms have a cost advantage over small
firms. The firms differ due to product differentiation and a firm’s cost of production decrease
as output increase, if the firm is efficient.
Economies of scale give rise to trade and gains from trade. The monopolistic competition
model show that trade is caused by economies of scale instead of differences in factor
endowments or technology. Trade is a way of extending the market, allowing exploitation of
scale economies and result in gains from trade. (Krugman 1990). Trade leads to reallocations
of resources across firms within an industry, since the imperfectly competitive market affect
the entry and exit of firms. The existence of export market entry costs, treated as a fixed sunk
cost, affects how the impact of trade is distributed across different types of firms. The
profitable, low-cost firm adapt to the increased competition by lowering their mark-up price

14
in order to gain additional market shares. They thrive and expand by taking advantage of new
markets, while the most inefficient, high-cost firms contract and are forced to exit the market.
The effects of increased integration lead to important composition effects and productivity
gains, where the industry composition will change and the aggregate, industry productivity
will grow. The production will be concentrated among the more productive, low-cost firms
which will have greater incentive to engage in the global economy. Firms that export tend to
consist of relatively larger and productive firms, compared to firms that do not export. A firm
that exports increases its share of industry revenues and increase both their market share and
profits. Intermediate-performing firms may choose not to export their goods due to high trade
costs. They will remain in the industry and continue to sell their products at the domestic
market, but they will incur losses of both market shares and profits. The industry’s exposure
to trade lead to additional inter-firm reallocations and the industry will consist of high-,
intermediate-, and low-performing firms, while the lowest-performing firms will exit the
domestic and international market. Trade has effect on the market structure. The reallocation
of profits and market shares generates an aggregate productivity gain and an increase in
welfare. Trade enable each country to specialize in a narrower range of differentiated products
through the increase in the scale of production. A country will import the goods it does not
produce, while it will be able to enjoy a larger variety of products (Krugman 1990) (Krugman,
Obstfeld and Melitz 2012).
3.2 Endogenous Growth Theory The theory emphasize that economic growth is a result of endogenously given factors where
investments in human capital, technological innovation and accumulation of knowledge are
contributors of long-run economic growth. (Vernon 2007). The endogenously models allow
for capital to grow continuously and the key assumption is that there are constant returns to
scale and diminishing returns to capital (Ben-David and Loewy 1998).
When a firm increase its physical capital, it learns how to produce more efficiently, i.e. it
learns by doing. The increase leads to a parallel increase in its stock of knowledge, which
spills over instantly across the whole economy and generate positive, external effects on the
production technology of other firms (Vernon 2007). The technological progress follows the
rate of growth per output per capita through learning by doing, so when growth increase or
decrease, so does the pace of technological change.
The growth of knowledge and technology on the other hand, depends on the level of human
capital. The more educated and skilled people are, the more inventive and innovative they

15
become (Rogers 2003). The larger supply of skilled, experienced labour devoted to the
production of high-tech goods, the greater and faster technological knowledge rate. Countries
with greater relative abundance of skilled labour, will specialize relatively more in human
capital-intensive activity and produce high technology goods (Barro and Sala-i-Martin 2004).
Rich countries are not only endowed with more capital, they tend to invest more in education
and training the labour force, compared to poor countries. They can therefore operate with
higher returns on capital. (Vernon 2007). The endogenous models have been extended to
incorporate international trade, and the role of institutions and policy interventions in new
ways which facilitates the explanation of catch-up effects, leapfrogging and the use of trade
policy instruments, among many others. (Rogers 2003,129) (Deraniyagala and Fine 2001,812-
818) (Islam 2004,194)

16
4. Previous Studies
There are a variety of studies and empirical research that have examined the impact of trade
openness on economic growth. When trade liberalization in developing countries is
implemented, the expectation is that growth will be stimulated, but the evidence of the growth
enhancing effects are inconclusive and ambiguous. The degree of impact varies between
studies due to problems like the use of different methodologies, measurements and the
diversity of liberalization indices, where qualitative and raw data are mixed (Greenaway,
Morgan and Wright 2002). Trade is affected by several types of trade barriers and it is hard to
construct a single indicator, since the outcome and effects differ. Some indices and proxies of
trade measure the level of tariffs but ignore other distortions (Edwards 1998). Some data is
not always reported and the variety of restrictions, subsidies, tariffs, rules and regulations
differ among countries. It makes it hard to estimate and generalize and use a uniform
openness measure (De Vylder, Nycander and Laanatza 2001). Another shortcoming of
measuring the liberalisation effect occur when liberalisations are politically conditioned and
initiated at a time of crisis which gives rise to potential endogeneity problems. Studies are
inconclusive regarding the relationship between trade liberalisation in the short run growth,
where some show positive association and others show none or even a negative association
(Greenaway, Wyn and Wright 2002).
Using a dynamic model with terms of trade variables and different liberalisation proxies,
Greenaway, Wyn and Wright (2002) conclude that liberalisation may impact favourably on
growth of real GDP per capita. The effects on growth differ depending on the type of
openness indicator, and if trade reforms are forced on by a crisis, because of less favourable
initial conditions. The short run impact of liberalisation is unlikely to be instantaneous, the
effect appeared to be lagged and the impact is shown in subsequent years. Liberalisations vary
in depth, intensity and never amount to an immediate shift to free trade. Economies become
more open through time, due to incremental trade reforms, but also because of other factors
such as reductions in transportation and communication costs, technological change and so
on. Low initial GDP and high initial level of schooling are associated with faster growth in
GDP per capita. High investment ratio and favourable terms of trade has also an impact,
whereas fast population growth is associated with slower GDP per capita (Greenaway,
Morgan and Wright 2002).

17
Wacziarg and Welch (2008) used fixed effect regressions to estimate the effect of openness
on growth. A binary openness indicator based on the dates of liberalization was constructed to
compare performance of countries under liberalized and non-liberalized regimes across time.
The study showed that the packaging and timing of reforms are important factors in
explaining differences in growth patterns. Investment also constitutes an important channel
through which trade-centred liberalization affects growth. Hence, liberalization fosters growth
in part through its effect on physical capital accumulation. Countries that liberalised
experienced average annual growth rates that were 1.5 percentage points higher than before
and the average trade to GDP ratio increased by roughly 5 percentage points, suggesting that
trade policy liberalization did raise the actual level of openness. However, the extent to which
per capita income growth changed after trade reforms varied widely across countries.
Countries that experienced positive effects tended to follow through and deepen trade
reforms. Countries that experienced negative effects often suffered from political instabilities,
contractionary macroeconomic policy or counteractive trade reforms (Wacziarg and Welch
2008).
Knight, Loayza and Villanueva (1993) used a proxy for restrictiveness of the economy's
foreign trade regime, estimated with a ᴨ-matrix approach, and found that the positive effects
trade had on growth was its function as a source of technological transfers. Goods imported
from advanced nations result in technological improvements, benefiting the importing
country. Tariffs had a negative effect on output growth since it discouraged imports of capital
goods and lead to less technological transfer. The overall economic efficiency was influenced
significantly, and positively, by the extent of openness to international trade and by the level
of government fixed investment in the domestic economy. Further, investments and human
capital were positively related to growth, and the effect alters in combination with openness
and public capital. But, the investment in physical capital was less productive for developing
countries, compared to developed. Further, developing countries tended to exhibit slow
growth in per capita terms while experiencing rapid rates of population growth (Knight,
Loayza and Villanueva 1993).
Ben-David and Lowey (2003) agrees with the view that trade acts as a conduit for the flow of
knowledge across international borders and creates a positive link between trade liberalization
and growth (Ben-David and Loewy 2003). A multicounty model was used to analyse the
effects of unilateral trade liberalization. The study concluded that trade flows make it easier to

18
transfer knowledge and spur the growth process. Elimination of tariffs in countries with the
greatest stocks of knowledge will have the greatest growth effects. Increased trade will in
general lead to faster knowledge growth and faster per capita output growth. The more open
an economy, the greater the competitive pressures on it, and the greater the need for it to
incorporate foreign knowledge into its production processes to be able to compete with
foreign firms. The overall tariff elimination, even when being carried out by one single
country, leads to a faster steady-state growth for all trading countries (Ben-David and Loewy
1998).
Yanikkaya (2003) examined the growth effects on a large number of trade openness measures
which were divided into measures of trade volumes and measures of trade restrictions.
Yanikkaya used cross-country regressions, covering over 100 developed and developing
countries. The trade volume estimates indicated a positive and significant association between
trade openness and growth. A surprising result was that trade barriers in form of tariffs were
positively and significantly associated with growth, especially for developing countries. The
measure between import duties and growth contradict the conventional view. Trade enhance
growth if a country can obtain technology from its trading partners through trade and the
result was positive and significant, but not particularly crucial to growth, compared to access
to markets. The latter is related to the exploitation of scale economics and comparative
advantage. Countries that import goods and services and trade with innovative countries are
likely to grow faster since trade is used as a channel that increase the transfer of technology
and knowledge. If growth is driven by R&D activities, then trade provides access to the
advances of technological knowledge of its trade partners. Trade also allows producers to
access bigger markets and encourage the development of R&D through increasing returns to
innovation. This is vital for the development process in developing countries since they gain
access to investment and intermediate goods. Yanikkaya concludes that if the engine of
growth is the introduction to new products, then trade also plays an important role (Yanikkaya
2003).
Edwards (1998) used nine alternative indices of trade policies to estimate the relationship
between trade policies and productivity growth. The indices capture different aspects of trade
policy where some reflect higher degrees of trade intervention and distortion. The result was a
significantly, positive relationship between openness and productivity growth for eight of the
different measurements of openness. Countries that are more open will tend to experience

19
faster productivity growth than more protectionist countries. The protection of property rights
played an important role in explaining cross country differences in the productivity growth
along with initial GDP and human capital (Edwards 1998).
Deraniyagala and Fine (2001) highlight that existing empirical research fails to capture the
complexity and the ambiguous effects of liberalisation and openness. The measurements
between technology imports and R&D has a positive, but weak association. The effects of
trade vary greatly, depending on the type of trade policy and industrial sector. The magnitude
of the gains from trade policy reforms differ when welfare costs, distortions, negative
externalities and distributional problems are considered. The results are ambiguous and
complex, where some countries experience growth and others deterioration. Depending on the
model, the assumptions and variables, the estimates of long-run effects on growth vary from 2
to 46 percent (Deraniyagala and Fine 2001).
Frankel and Romer (1999) considered that countries whose incomes are high for reasons other
than trade, may trade more since free-market trade policies are adopted, and combined with
free-market domestic policies and stable fiscal and monetary policies. These policies are
likely to affect income, resulting in that countries' trade policies are likely to be correlated
with other factors. By using geographical characteristics such as the size of a country,
distance and whether they are landlocked, instrumental variables were obtained to estimate
the effect that international trade has on income. The impact that trade openness has on
income is substantial, robust and positive. A one percentage point increase in the ratio of trade
to GDP raise income per person by between one-half and two percent. They also conclude
that common borders raise trade and geographical variables are major determinants of
bilateral trade. Trade is a proxy for the ways where interactions between countries raise
income. It results in specialization, spread of knowledge, technology and ideas. Trade is
therefore likely to be correlated with the extent of these interactions, and is therefore an
imperfect measure of growth enhancing interactions among countries (Romer and Frankel
1999)
20
5. Empirical Analysis
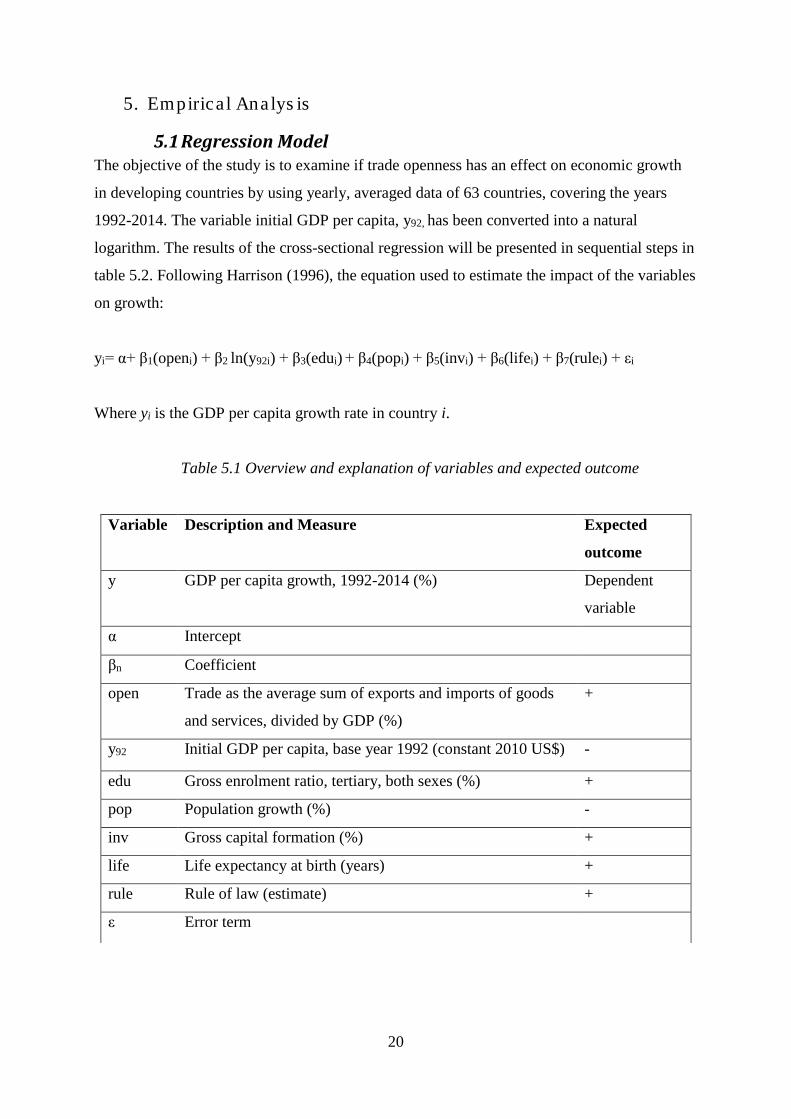
5.1 Regression Model The objective of the study is to examine if trade openness has an effect on economic growth
in developing countries by using yearly, averaged data of 63 countries, covering the years
1992-2014. The variable initial GDP per capita, y92, has been converted into a natural
logarithm. The results of the cross-sectional regression will be presented in sequential steps in
table 5.2. Following Harrison (1996), the equation used to estimate the impact of the variables
on growth:
yi= α+ β1(openi) + β2 ln(y92i) + β3(edui) + β4(popi) + β5(invi) + β6(lifei) + β7(rulei) + εi
Where yi is the GDP per capita growth rate in country i.
Table 5.1 Overview and explanation of variables and expected outcome
Variable Description and Measure Expected
outcome
y GDP per capita growth, 1992-2014 (%) Dependent
variable
α Intercept
βn Coefficient
open Trade as the average sum of exports and imports of goods
and services, divided by GDP (%)
+
y92 Initial GDP per capita, base year 1992 (constant 2010 US$) -
edu Gross enrolment ratio, tertiary, both sexes (%) +
pop Population growth (%) -
inv Gross capital formation (%) +
life Life expectancy at birth (years) +
rule Rule of law (estimate) +
ε Error term

21
5.2 Data and Definitions of the Variables The dependent variable, GDP per capita, is measured as the average, annual percentage
growth rate of GDP per capita, based on constant local currency. The yearly, averaged values
of the period 1992-2014 are used. GDP per capita is defined as “gross domestic product
divided by midyear population. GDP is the sum of gross value added by all resident producers
in the economy plus any product taxes and minus any subsidies not included in the value of
the products” (worldbank).
The variable OPEN aim to represent free trade and is calculated as the sum of exports and
imports of goods and services, as percentage of gross domestic product. The value is trade
expressed a percentage, with averaged, yearly values from 1992 to 2014. The openness ratio
is expected to have a positive effect on GDP per capita and capture the benefits that results
from trade. International trade may enable countries to gain market access among other things
but it may also serve as a mean to spread new technologies and knowledge. The relationship
between openness and GDP per capita can be seen in figure 5.1, placed in Appendix 2. It is
difficult to make adequate comparison with other studies when measuring openness due to the
variety of methodologies and measurements. Some data is not always reported and the variety
of restrictions, subsidies, tariffs, rules and regulations differ among countries. It makes it hard
to estimate and generalize and use a uniform openness measure (De Vylder, Nycander and
Laanatza 2001). The actual effects of protection, restrictions and especially non-tariff barriers
are cumbersome to estimate in absolute terms, given all instruments in combination. Further,
the full effect of trade might not be noted instantaneous, thus using longer lag periods might
show more adequate estimates.
Initial GDP per capita refers to the GDP per capita the year 1992, which is used as base year.
It is measured in constant 2010 US$ and the variable has been converted into its natural
logarithm. The aim is to control for a low initial income level, since the growth of a country
may depend on the countries initial conditions and size of economy. Initial GDP per capita
may be interpreted as a test of the convergence hypothesis or another assumption: that
countries with a lower initial per capita income have greater opportunities to catch up with
more advanced nations (Harrison 1996). The assumption is that countries that are relatively
wealthy cannot grow as fast as poor, or developing countries. The wealthier countries may

22
already be in their steady states, since they may have adapted to and implemented the new
technologies. Theory state that a country, in equilibrium, will grow when it implements new
technologies in order to spur and improve productivity. Hence, if a country is in, or close to
its steady state, the smaller the growth rate. The variable is assumed to have a negative
impact, since higher initial GDP per capita tend to have negative effect on growth.
The variable for education, EDU is applied to reflect human capital. It is represented by the
gross enrolment ratio, tertiary level, given in percent. The value is an averaged, yearly value
of expected years of education. It is defined as “the ratio of total enrolment, regardless of age,
to the population of the age group that officially corresponds to the level of education shown
(worldbank). The data is not gathered regularly since countries have different school system
length and is harder to compile. There are difficulties with estimating education and human
capital as an input, since the effects of investments in the educational system and human
capital does not give an immediate, measurable result. In addition, the activities and resources
used in the educational system often exclude informal activities, like job training and learning
by doing undertaken by firms and individuals (Aghion and Howitt 1999). Hence, the result
and full effect of the variable may not appear. It may result that the variable has an
insignificant effect on the economic growth rate in a regression analysis even if the effect
ought to be positive.
The POP variable is the annual population growth rate, given in percent, and include “all
residents regardless of legal status or citizenship, except for refugees not permanently settled
in the country of asylum, who are generally considered part of the population of their country
of origin” (worldbank). The values used are yearly, averaged values for the period 1992-2014.
The variable is expected to have a negative impact on economic growth. An increase in the
population growth has negative impact on economic growth (Gylfason 1998).
The variable INV, investments, is represented by gross capital formation and measured as
percentage of GDP. The value used is a yearly, averaged value of the period 1992-2014. It
“consists of outlays on additions to the fixed assets of the economy plus net changes in the
level of inventories. Fixed assets include land improvements, plant, machinery, the
construction of roads, railways, schools, offices, hospitals, private residential dwellings, and
commercial and industrial buildings" (worldbank). The aim of the variable is to be an
indicator of government investments and the anticipation is that it has a positive impact on

23
economic growth. There variable may be a bit cumbersome since the investments aimed to
improve technology, communication, education, health care, infrastructure and production in
value added goods differ greatly from investments made in arms, military forces or
constructing private residents for the head of state.
The LIFE variable reflect improvements in health and nutrition, and to some extent higher
living standards. It implies that a healthy labour force who lives longer will contribute to
production and to economic growth. The value is expressed as total years and the yearly,
averaged values from 1992 to 2014 have been used. “Life expectancy at birth indicates the
average number of years a new-born infant would live if prevailing patterns of mortality at the
time of birth were to stay the same throughout its life” (worldbank). The anticipation is that
the coefficient has an overall positive correlation with economic growth. The assumption is
that higher GDP per capita leads to improvements in other factors such as education, health
and nutrition, which improves productivity. Thus, a positive cycle is created with long run,
positive impact on growth.
The variable RULE is an estimate and the Rule of Law “captures perceptions of the extent to
which agents have confidence in and abide by the rules of society, and in particular the quality
of contract enforcement, property rights, the police, and the courts, as well as the likelihood of
crime and violence. Estimate gives the country's score on the aggregate indicator, in units of a
standard normal distribution, i.e. ranging from approximately -2.5 to 2.5” (worldbank). Rule
of Law is an important public good the government provides, a necessity that contributes to
economic efficiencies by functioning juridical systems and enforcement of contracts (Weil
2009) and is expected to have a positive impact on GDP per capita. Data is available for the
years 1996, 1998, 2000 and 2002-2015.

24
5.3 Regression Results and Analysis
Table 5.2 Regression Results
Standard errors are reported in parenthesis: *significant at 10% level **significant at 5% level ***significant at
1% level
Descriptive statistics of the variables and a correlation matrix does not show large collinearity
between the variables. They are shown in table 5.3 and 5.4 and placed in Appendix 2, along
with a figure of GDP per capita and openness.
Dependent variable: GDP per Capita Growth
Model 1 2 3 4 5
Independent Variables
Coefficient 0.354*
(0.196)
1.154
(0.766)
1.82*
(0.907)
2.36**
(0.934)
2.58**
(1.18)
open
0.005**
(0.002)
0.005**
(0.002)
0.005**
(0.002)
0.006**
(0.002)
0.0048**
(0.002)
y92 -0.111
(0.1003)
-0.229*
(0.132)
-0.219*
(0.13)
-0.321**
(0.133)
inv 0.0033
(0.005)
0.002
(0.005)
0.0003
(0.005)
0.0006
(0.0052)
edu
0.01
(0.007)
-0.0005
(0.009)
0.0034
(0.01)
pop
-0.236**
(0.127)
-0.163
(0.127)
life
0.009
(0.015)
rule 0.409**
(0.180)
R2 0.085 0.11 0.14 0.19 0.28
Adj R2 0.069 0.064 0.078 0.11 0.18
F-stat 5.3 2.32 6.21 2.55 2.87
P-value 0.02 0.084 0.077 0.038 0.013
N 63
25
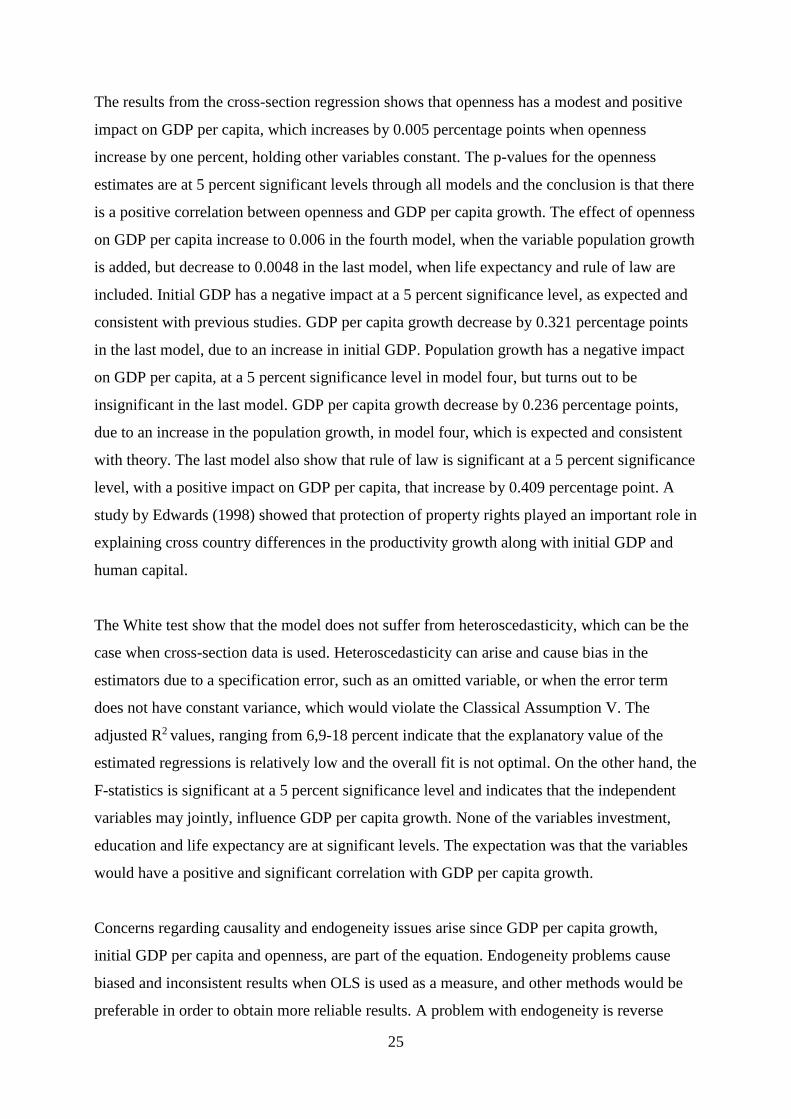
The results from the cross-section regression shows that openness has a modest and positive
impact on GDP per capita, which increases by 0.005 percentage points when openness
increase by one percent, holding other variables constant. The p-values for the openness
estimates are at 5 percent significant levels through all models and the conclusion is that there
is a positive correlation between openness and GDP per capita growth. The effect of openness
on GDP per capita increase to 0.006 in the fourth model, when the variable population growth
is added, but decrease to 0.0048 in the last model, when life expectancy and rule of law are
included. Initial GDP has a negative impact at a 5 percent significance level, as expected and
consistent with previous studies. GDP per capita growth decrease by 0.321 percentage points
in the last model, due to an increase in initial GDP. Population growth has a negative impact
on GDP per capita, at a 5 percent significance level in model four, but turns out to be
insignificant in the last model. GDP per capita growth decrease by 0.236 percentage points,
due to an increase in the population growth, in model four, which is expected and consistent
with theory. The last model also show that rule of law is significant at a 5 percent significance
level, with a positive impact on GDP per capita, that increase by 0.409 percentage point. A
study by Edwards (1998) showed that protection of property rights played an important role in
explaining cross country differences in the productivity growth along with initial GDP and
human capital.
The White test show that the model does not suffer from heteroscedasticity, which can be the
case when cross-section data is used. Heteroscedasticity can arise and cause bias in the
estimators due to a specification error, such as an omitted variable, or when the error term
does not have constant variance, which would violate the Classical Assumption V. The
adjusted R2 values, ranging from 6,9-18 percent indicate that the explanatory value of the
estimated regressions is relatively low and the overall fit is not optimal. On the other hand, the
F-statistics is significant at a 5 percent significance level and indicates that the independent
variables may jointly, influence GDP per capita growth. None of the variables investment,
education and life expectancy are at significant levels. The expectation was that the variables
would have a positive and significant correlation with GDP per capita growth.
Concerns regarding causality and endogeneity issues arise since GDP per capita growth,
initial GDP per capita and openness, are part of the equation. Endogeneity problems cause
biased and inconsistent results when OLS is used as a measure, and other methods would be
preferable in order to obtain more reliable results. A problem with endogeneity is reverse

26
causality, where one variable has impact on other variables and causes feedback effects of the
variables (Verbeek 2008). Difficulties arise when variables are lagged and if they affect each
other in a dynamic way. One should consider the effect of previous values of GDP per capita,
along with the openness variable, since they may affect GDP per capita the year 1992, which
is used as a base year. The effect may have been lagged and previous events may have had
impact and drastically increased, or decreased, GDP per capita. There is a difference if trade
reforms have been forced on by a crisis, as a consequence of less favourable initial conditions,
or if the economy suffered from an external shock, political turmoil or economic instability
prior to 1992, which decreased the value of GDP per capita in 1992. It may also be the other
way around where the effects had a positive impact. Countries may have experienced
increased growth due to prior events, such as policy interventions, liberalization or successful
investments in education and technology that they reap the benefits from. This applies to the
openness variable as well, since the degrees and depth of trade liberalization vary, and the
timing has importance. Wacziarg and Welch (2008) concluded that countries tend to liberalize
gradually, and countries experiencing positive effects of trade tend to deepen trade reforms.
Further, the full effect of trade might not be noted instantaneous, thus using longer lag periods
might show more adequate estimates (Greenaway, Wyn and Wright 2002).
The causality between exports, imports and economic growth, has been highlighted by several
researchers. The question is if trade openness induce growth, or if economic growth induces
trade openness, since both are affected by an increase in income and the level of openness that
a nation already experience. Harrison (1996) concluded that countries with more open trade
policies do precede higher growth rates, but it has also been shown that higher growth rates
lead to more open trade regimes. It is likely that a country with free-market domestic policies
tend to have free-market trade policies and they may therefore be correlated, i.e. countries that
adopt free-trade policies are likely to adopt other policies that raise income (Harrison 1996).
Another aspect concerns the developing countries that depended on tariff revenues and
reduced them as they became more developed. A country protects the domestic industry but
decrease the tariffs as it become competitive and efficient enough to participate in
international trade and export goods. It may therefore seem as the reduced tariffs and
increased openness caused growth (Frankel, Romer and Cyrus 1996). Knight, Loayza and
Villanueva (1993), Yanikkaya (2003), Feenstra (2004) and Ben-David and Lowey (2003)
points out that trade has positive effects on growth, since it is a channel that increase the
transfer of technology and knowledge. Goods imported from advanced nations result in
27
technological improvements and knowledge spillovers, benefiting the importing country.
Saaed and Hussain (2015) agree that imports are a source of economic growth, but the
increase in imports may be a result of an increase in consumer income, which result in an
increasing demand. When the income increase, the demand for a larger variety of goods and
especially luxurious and expensive goods, increase. Hence, richer consumers increase demand
which results in an increase in trade. Demanding consumers may also put pressure on firms to
improve quality and be more competitive, as in the monopolistic competitive model.
Further aspects regarding trade concern countries that are wealthy for reasons other than
trade. They are likely to have better infrastructure and transportation systems, and are
therefore be able export more (Frankel, Romer and Cyrus 1996) (Rodrick 1994). Some
developing countries may lack suitable infrastructure, face high export costs and difficulties to
access new markets, which complicates trade. Market access is crucial for economic growth
according to Yanikkaya (2003) and developing countries may need adequate investments to
improve their trade capacity. They may also benefit from membership of trade organizations,
join and participate in trade agreements, free trade areas or custom unions. Deeper economic
integration can be used as a mean to access new markets and a country may benefit from the
trade creation that arise. Trade affects the market structure and composition by a reallocation
of resources which increase in the overall productivity and affects the market entry and exit.
The profitable, low-cost firm that adapt to the increased competition will thrive, expand and
gain market shares, while the inefficient firms contract and exit the market. Trade is a way of
extending the market, allowing for countries with a comparative advantage to specialize,
increase efficiency, become competitive and exploit scale economies, which result in gains
from trade.
Trade policies can be used to increase trade openness, and thereby induce economic growth
by using trade as a mean to access technological innovations and knowledge spillovers
(Gylfason 1998). But, the extent of the impact of trade is limited by the ability of to make
most of it due to the lack of the necessary skills, human capital and expertise (Deraniyagala
and Fine 2001). Knight, Loayza and Villanueava (1993) concluded that investments and
human capital have a positive impact on economic growth, but investments in physical capital
was less productive for developing countries, compared to developed. Hence, investment in
human capital and education is important and may enable developing countries to benefit
from knowledge spillovers and technological transfers, which may result in a possibility to
28
diversify the production towards capital-abundant goods, produced by high-skilled workers in
more advanced sectors. Some of the least developed countries main export goods are primary
products, as seen in Appendix 1. The over-dependency in primary goods can be problematic
when other sectors are discouraged and if a country is unable to diversify the production.
Many developing countries are characterized as labour-abundant with comparative advantage
in the production of lower-skill, labour-intensive goods, compared to developed nations that
are capital-intensive and produce high-tech and capital-intensive goods.
Doubts arise due to the insignificant result of the variable education, aimed to reflect human
capital. Measuring years of education does not equal the quality of education, which may vary
between countries and educational systems. The result of the variable has an insignificant
effect on the economic growth rate, even if the effect ought to be positive. The effects of
education and human capital, does not necessarily give an immediate, measurable result and
the full effect might be lagged. Informal activities like job training, learning by doing and
knowledge spillovers are not included, or accounted for. Hence, there is a risk that
investments in human capital may be underestimated and the result and full effect of
education may not appear. Another reason for the insignificant result might be that the study
is confined to developing countries, since rich countries tend to invest more in education and
training the labour force. Countries with greater relative abundance of skilled labour,
specialize relatively more in human capital-intensive activity and produce high technology
goods (Barro and Sala-i-Martin 2004).
A final remark is that there are difficulties to make adequate comparison between studies of
liberalization effects and trade openness. The variety of measurements, methodologies,
samples, time periods and composed indices used by researchers differs. So does the variety
of restrictions, subsidies, tariffs, rules and regulations, which makes it hard to estimate and
generalize and use a uniform openness measure (De Vylder, Nycander and Laanatza 2001).
This study examined the relationship between trade and economic growth and a cross-section
regression was conducted, based on a sample that consists of developing countries. Ann
Harrison (1996) pointed out that there is a possibility that significant variations in individual
country performance are likely to be hidden, when cross-country regressions, based on period
averages values, is used as a method. It may therefore be preferable to extract and use panel
data, since it contain richer information. The data can then be estimated with another
technique where the differences between and across countries’ performance over time is
evaluated.

29
6. Summary and Conclusions
Previous studies and empirical research show that trade has a positive impact on economic
growth but the degree of the impact varies. Trade is as a valuable mean and source of
technological transfers and knowledge spillovers that spur the growth process. Increased trade
will in general lead to faster knowledge growth and faster per capita output growth. Trade is
beneficial when countries can benefit from their comparative advantages, specialize, take
advantage of economies of scale and access new markets. Trade increase the competition and
affect the market structure by a reallocation that generates an overall productivity gain and an
increase in welfare. Developing countries have diverse growth experiences and some of the
least developed countries are mainly exporting primary products. They have not been able to
diversify the production, while others are exporting labour-intensive goods that require low-
skilled workers. Developing countries may benefit from knowledge spillovers and
technological innovations, if they have the ability to extract most of it.
The results from the cross-section regression shows that trade openness has a positive impact
on GDP per capita, which increase by 0.005 percentage points, due to an increase in trade
openness. Hence, there is a positive correlation between trade openness and GDP per capita
growth in developing countries. Higher initial GDP has a significant, negative correlation
with GDP per capita growth. Initial GDP cause a decrease in GDP per capita growth by 0.321
percentage points. An increase in population growth has a negative impact on GDP per capita,
which decrease by 0.236 percentage points. Rule of Law is significant and has a positive
impact on GDP per capita, which increases by 0.409 percentage point. None of the variables
investment, education and life expectancy are at significant levels.
Further improvements can be made in a study where developed and developing countries are
compared. It might generate results that improve and facilitates the identification of
determinants that have a positive impact on economic growth. It would be preferable to use
another method and fully exploit the panel data. Panel data provides more information and
may contribute to more insight regarding the short- and long-run effects of trade
liberalization, structural changes and policy interventions and the effects along the transition
period. The study can evaluate the dynamics due to the lagged endogenous variables, the dual
causality and feedback effects of the variables. The dynamics due may imply that policy
intervention or structural change generally have effect over some time period. The study
might give insights regarding the role of governments and institutions and what type of
strategies, trade policies, interventions and investments that are feasible and vital in the
development process, in order to induce economic growth.

30
7. Bibliography
Aghion, Philippe and Peter Howitt. 1999. Endogenous Growth Theory. Cambridge: MIT
Press.
Alam, Shawkat. 2008. Sustainable Development and Free Trade, Institutional approaches.
New York: Routhledge.
Barro, Robert and Xavier Sala-i-Martin. 2004. Economic Growth. Vol. 2. Cambridge: MIT
Press.
Begg, David. 2008. Economics. London: Mc Graw-Hill Education.
Dasgupta, Biplab. 1998. Structural Adjustment, Global Trade and the New Political Economy
of Development. London: Zed Books Ltd.
De Vylder, Stefan, Gunnel Axelsson Nycander and Marianne Laanatza. 2001. De minst
utvecklade länderna och världshandeln. Gothenburg: Novum Grafiska AB.
Dicken, Peter. 2007. Global Shift, Mapping the Changing Contours of the World Economy.
Vol. 5. London: SAGE Publications Ltd.
Feenstra, C. Robert. 2004. Advanced International Trade. Princeton: Princeton University
Press.
Gylfason, Thorvaldur. 2008. Understanding Economic Growth. Kristianstad: SNS Förlag.
Jawara, Fatoumata and Aileen Kwa. 2003. Behind the scenes at the WTO. New York: Zed
books.
Jones, I. Charles. 2002. Introduction to Economic Growth. New York: W.W. Norton &
Company, Inc.
Kjeldsen-Kragh, Soren. 2001. International Trade Policy. Copenhagen: Copenhagen Business
School Press.
Krugman, Paul 1990. Rethinking International trade. Ed. 2. Cambridge: The MIT Press
Krugman, Paul, Maurice Obstfeld and Marc Melitz. 2012. International Economics, Theory
and Policy. Vol. 9. Essex: Pearson Education Limited.
Mankiw, N. Gregory. 2010. Macroeconomics. Vol. 7. New York: Worth Publishers.
Marrewijk van, Charles. 2002. International Trade and the World Economy. New York:
Oxford University Press.
Novales, Alfonso, Esther Fernandez and Jesus Ruiz. 2009. Economic Growth: Theory and
Numerical Solution Methods. Heidelberg: Springer.
Ray, Debraj. 1998. Development Economics. Princeton: Princeton University Press.
Seth, Torsten. 2008. WTO och den internationella handelsordningen. Lund: Studentlitteratur.

31
Stock, H. James and Mark W. Watson. 2012. Introduction to Econometrics. Edinburgh:
Pearson Education Limited.
Theo, S. Eicher, John H. Mutti and Michelle H. Turnovsky. 2009. International Economics.
Vol 7. New York: Routhledge.
Treblicock J. Michael and Robert Howse. 1999. The Regulation of International Trade.
London: Routledge
Verbeek, Marno. 2008. A Guide to Modern Econometrics. West Sussex: Wiley.
Weil, N. David. 2013. Economic Growth. Vol. 3. Essex: Pearson.
Zhang, Wei-Bin. 2008. Internationa Trade Theory: Capital, Knowledge, Economic Structure,
Money and Prices over Time. Berlin: Springer.
Electronical sources
Balassa, Bela (1965).” Tariff Protection in Industrial Countries; An Evaluation.” Journal of
Political Economy 73(6):573-594. DOI: 10.1086/259085
Baldwin, Richard, Philippe Martin and Gianmarco I.P. Ottaviano (2001).” Global Income
Divergence, Trade and Industrialization: The Geopgraphy of Growth Take-Offs.” Journal of
Economic Growth 6(1):5-37. DOI: 10.1023/A:1009876310544
Ben-David, Dan and Michael Loewy (1998).” Free Trade, Growth and Convergence.”
Journal of Economic Growth 3(2):143-170. DOI: 10.1023/A:1009705702579
Ben-David, Dan and Michael Loewy (2003).” Trade and the Neoclassical Growth Model.”
Journal of Economic Integration 18(1):1-16. http://www.jstor.org/stable/23000729
Caselli Francesco, Gerardo Esquivel and Fernando Lefort (1996). “Reopening the
Convergence Debate: A New Look at Cross-Country Growth Empirics.” Journal of Economic
Growth 1(3):363-389. http://www.jstor.org/stable/40215922
Devereux, John and Lein Chen (1999). “Growth, the external terms of trade and endogenous
trade liberalization.” Public Choice 98(1):43-57. DOI: 10.1023/A:1026420915038
Deraniyagala, Sonali and Ben Fine (2001).” New Trade Theory versus Old Trade Policy: A
Continuing Enigma.” Cambridge Journal of Economics 25(6):809-825.
http://EconPapers.repec.org/RePEc:oup:cambje:v:25:y:2001:i:6:p:809-25
Dornbusch, Rudiger (1992).” The Case for Trade Liberalization in Developing Countries.”
The Journal of Economic Perspectives 6 (1):69-85. Accessed may 2016,
http://www.jstor.org/stable/2138374
Edwards, Sebastian (1998). “Openness, Productivity and Growth: What do we really know?”
The Economic Journal 108(447):383-398. DOI: 10.1111/1468-0297.00293
32
Edwards, Sebastian (1993).” Openness, Trade Liberalization and Growth in Developing
Countries.” Journal of Economic Literature 31(3):1358-1393.
http://www.jstor.org/stable/2728244
Frankel, A. Jeffrey and David H. Romer (1999).” Does Trade Cause Growth?” American
Economic Review 89(3):379-399. DOI: 10.1257/aer.89.3.379
Frankel, A. Jeffrey, David H. Romer and Teresa Cyrus (1996).”Trade and Growth in East
Asian Countries: Cause and Effect?”NBER Working Paper No. 5732. DOI: 10.3386/w5732
Greenaway, David, Wyn Morgan and Peter Wright (2002).” Trade Liberalisation and Growth
in Developing Countries.” Journal of Development Economics 67(1):229-244. DOI:
10.1016/S0304-3878(01)00185-7
Greenaway, David, Wyn Morgan and Peter Wright (1998).” Trade Reform, Adjustment and
Growth: What Does the Evidence Tell Us?” The Economic Journal 108(450):1547-1561.
DOI: 10.1111/1468-0297.00360
Grossman, M. Gene and Elhanan Helpman (1994). “Endogenous Innovation in the Theory of
Growth.” Journal of Economic Perspectives 8(1):23-44. DOI: 10.1257/jep.8.1.23
Grossman, M. Gene and Elhanan Helpman (2015). “Globalization and Growth.” American
Economic Review 105(5):100-105. DOI: 10.1257/aer.p20151068
Harrison, Ann (1996). “Openness and growth: A time-series, cross-country analysis for
developing countries.” Journal of Development Economics 48(2):419-447. DOI:
10.1016/0304-3878(95)00042-9
Heritage Foundation (2016). About the Index. Heritage foundation.
http://www.heritage.org/index/about#faqs, accessed december 2016
Islam, Nazrul (1995). “Growth empirics: A Panel Data Approach” The Quarterly Journal of
Economics 110(4):1127-1170. http://www.jstor.org/stable/2946651
Islam, Nazrul (2004).” New Growth Theories: What is in there for Developing Countries?”
The Journal of Developing Areas 38(1):171-212. http://www.jstor.org/stable/20066701
Jones, I Charles (1995). “Time Series Test of Endogenous Growth Models.” The Quarterly
Journal of Economics 110(2):495-525. http://www.jstor.org/stable/2118448
Knight, Malcom, Norman Loayza and Delano Villanueva (1993).” Testing the Neoclassical
Theory of Economic Growth: A Panel Data Approach.” Staff Papers-International Monetary
Fund 40(3):512-541. DOI: 10.2307/3867446
Krueger, Anne (1998).” Why Trade Liberalisation is Good for Growth.” The Economic
Journal 108(450):1513-1522. DOI: 10.1111/1468-0297.00358

33
Krugman, Paul (2009). “The Increasing Returns Revolution in Trade and Geography”.
American Economic Review 99(3):561-571. DOI: 10.1257/aer.99.3.561
Krugman, Paul and Raul Livas Elizondo (1996).” Trade policy and the Third World
metropolis.” Journal of Development Economics 49(1):137-150. DOI: 10.1016/0304-
3878(95)00055-0
Lucas, Robert (1988).” On the Mechanics of Economic Development.” Journal of Monetary
Economics 22(1):3-42. http://EconPapers.repec.org/RePEc:eee:moneco:v:22:y:1988:i:1:p:3-
42
Melitz, J. Marc (2003). “The Impact of Trade on Intra-Industry Reallocations and Aggregate
Industry Productivity”. Econometrica 71(6):1695-1725. DOI: 10.1111/1468-0262.00467
Mountford, Andrew (1999). “Trade Dynamics and Endogenous Growth: An Overlapping-
Generations Analysis.” Economica 66(262):209-224. DOI: 10.1111/1468-0335.00165
Peletier, D. Ben (1998). “Terms of Trade Effects on Endogenous Growth Rates in LDCs.”
Oxford Development Studies 26(3)351-373.
http://EconPapers.repec.org/RePEc:taf:oxdevs:v:26:y:1998:i:3:p:351-373
Rodriguez, Francisco and Dani Rodrik (2001). “Trade Policy and Economic Growth: A
Skeptic’s Guide to the Cross-National Evidence.” NBER Macroeconomics Annual 2000 Vol.
15, p.261-338. DOI: 10.2307/3585399
Rodrik, Dani (1999).” Where Did All the Growth Go? External Shocks, Social Conflict and
Growth Collapses.” Journal of Economic Growth 4(4):385-412.
DOI:10.1023/A:1009863208706
Rogers, Mark (2003). “Survey of Economic Growth.” The Economic Record 79(244):112-
135. DOI: 10.1111/1475-4932.00082
Romer, M. Paul (1986). “Increasing Returns and Long-Run Growth. “The Journal of Political
Economy 94(5):1002-1037. DOI: 10.1086/261420
Saaed, Afaf Abdull and Majeed Ali Hussain (2015). “Impact of Exports and Imports on
Economic Growth: Evidence from Tunisia. “Journal of Emerging Trends in Economics and
Management Sciences” 6(1):13-21. ISSN: 2141-6990
Sampson, Thomas (2016). “Dynamic selection: An Idea Flows Theory of Entry, Trade and
Growth”. Quarterly Journal of Economics 131(1):315-380. DOI: 10.1093/qje/qjv032
Santos-Paulino, U. Amelia (2011). “Trade specialization, export productivity and growth in
Brazil, China, India, South Africa, and a cross section of countries.” Econ Change Restruct
2011(44):75-97. DOI 10.1007/s10644-010-9087-3

34
Solow, Robert (1994).” Perspectives on Growth Theory.” The Journal of Economic
Perspectives 8(1):45-54. DOI: 10.1257/jep.8.1.45
Sousa, José, Thierry Mayer and Soledad Zignago (2012). “Market Access in Global and
Regional Trade”. Regional Science and Urban Economics 42(6):1037-1052. DOI
10.1016/j.regsciurbeco.2012.07.011
Tarasov, Alexander (2012). “Per Capita Income, Market Access Costs, and Trade Volumes”.
Journal of International Economics 86(2):284-294. DOI: 10.1016/j.jinteco.2011.10.006
Vernon W. Ruttan (2007).” The New Growth Theory and Development Economics: A
survey.” Journal of Development Studies 35(2):1-26. DOI: 10.1080/00220389808422562
Wacziarg, Roman and Karen Horn Welch (2008).” Trade Liberalization and Growth: New
Evidence.” World Bank Economic Review 22(2):187-231. DOI: 10.1093/wber/lhn007
WTO (2016).” World Trade Statistical Review 2016”. World Trade Organization 2016 pp. 1-
165. World Trade Organization.
https://www.wto.org/english/res_e/statis_e/wts2016_e/wts16_toc_e.htm
WTO. “About WTO”. World Trade Organization 2016
https://www.wto.org/english/thewto_e/whatis_e/who_we_are_e.htm
Yanikkaya, Halit (2003). “Trade openness and economic growth: a cross-country empirical
investigation.” Journal of Development Economics 72(1):57-89. DOI: 10.1016/S0304-
3878(03)00068-3
Statistical sources
The World Bank (2016). Countries and Economies. World Data Bank.
http://data.worldbank.org/country, accessed december 2016
The World Bank (2016). Explore, Create, Share: Development Data. World Data Bank.
http://data.worldbank.org/indicator, worldbank, accessed december 2016
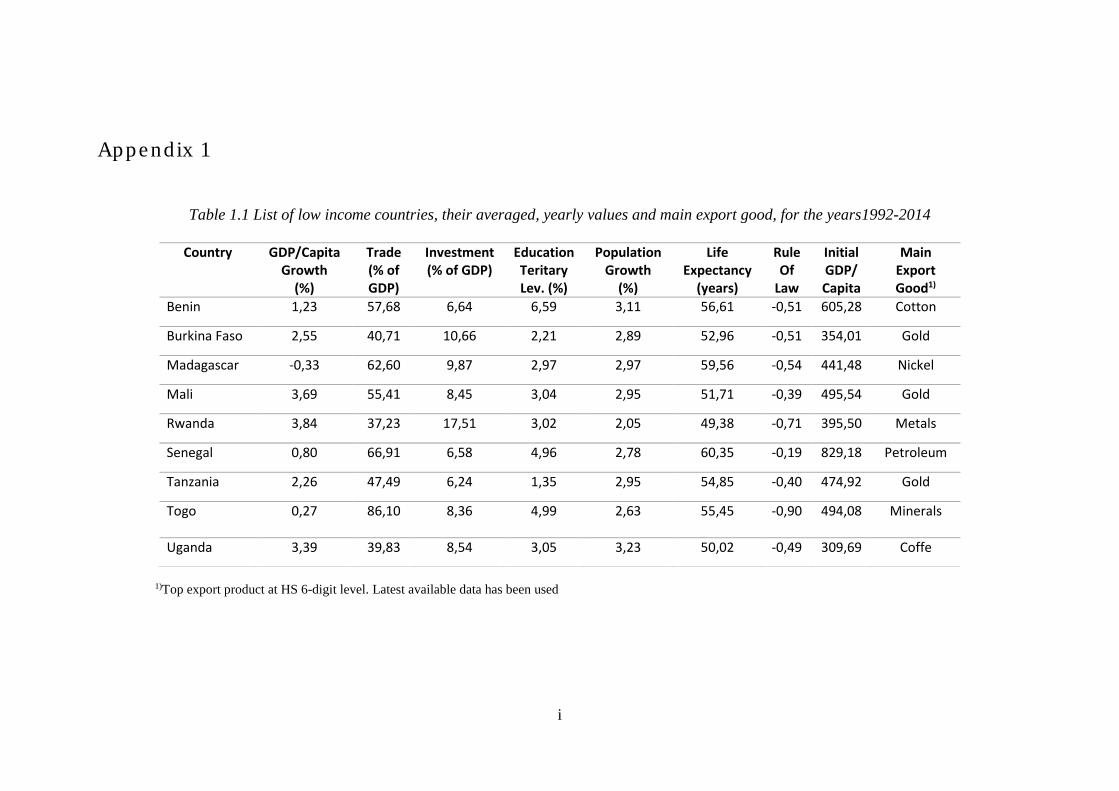
i
Appendix 1
Table 1.1 List of low income countries, their averaged, yearly values and main export good, for the years1992-2014
1)Top export product at HS 6-digit level. Latest available data has been used
Country GDP/Capita Growth
(%)
Trade (% of GDP)
Investment (% of GDP)
Education Teritary Lev. (%)
Population Growth
(%)
Life Expectancy
(years)
Rule Of
Law
Initial GDP/ Capita
Main Export Good1)
Benin 1,23 57,68 6,64 6,59 3,11 56,61 -0,51 605,28 Cotton
Burkina Faso 2,55 40,71 10,66 2,21 2,89 52,96 -0,51 354,01 Gold
Madagascar -0,33 62,60 9,87 2,97 2,97 59,56 -0,54 441,48 Nickel
Mali 3,69 55,41 8,45 3,04 2,95 51,71 -0,39 495,54 Gold
Rwanda 3,84 37,23 17,51 3,02 2,05 49,38 -0,71 395,50 Metals
Senegal 0,80 66,91 6,58 4,96 2,78 60,35 -0,19 829,18 Petroleum
Tanzania 2,26 47,49 6,24 1,35 2,95 54,85 -0,40 474,92 Gold
Togo 0,27 86,10 8,36
4,99 2,63 55,45 -0,90 494,08 Minerals
Uganda 3,39 39,83 8,54 3,05 3,23 50,02 -0,49 309,69 Coffe
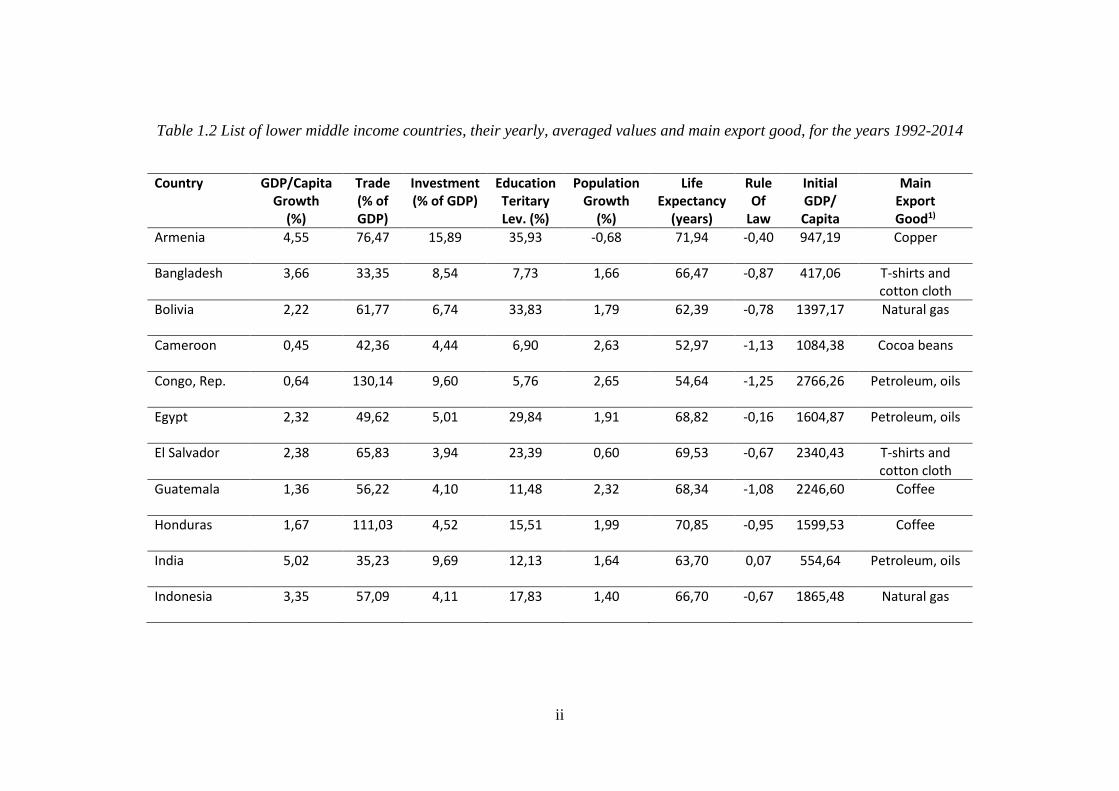
ii
Table 1.2 List of lower middle income countries, their yearly, averaged values and main export good, for the years 1992-2014
Country GDP/Capita Growth
(%)
Trade (% of GDP)
Investment (% of GDP)
Education Teritary Lev. (%)
Population Growth
(%)
Life Expectancy
(years)
Rule Of
Law
Initial GDP/ Capita
Main Export Good1)
Armenia 4,55 76,47 15,89 35,93 -0,68 71,94 -0,40 947,19 Copper
Bangladesh 3,66 33,35 8,54 7,73 1,66 66,47 -0,87 417,06 T-shirts and cotton cloth
Bolivia 2,22 61,77 6,74 33,83 1,79 62,39 -0,78 1397,17 Natural gas
Cameroon 0,45 42,36 4,44 6,90 2,63 52,97 -1,13 1084,38 Cocoa beans
Congo, Rep. 0,64 130,14 9,60 5,76 2,65 54,64 -1,25 2766,26 Petroleum, oils
Egypt 2,32 49,62 5,01 29,84 1,91 68,82 -0,16 1604,87 Petroleum, oils
El Salvador 2,38 65,83 3,94 23,39 0,60 69,53 -0,67 2340,43 T-shirts and cotton cloth
Guatemala 1,36 56,22 4,10 11,48 2,32 68,34 -1,08 2246,60 Coffee
Honduras 1,67 111,03 4,52 15,51 1,99 70,85 -0,95 1599,53 Coffee
India 5,02 35,23 9,69 12,13 1,64 63,70 0,07 554,64 Petroleum, oils
Indonesia 3,35 57,09 4,11 17,83 1,40 66,70 -0,67 1865,48 Natural gas

iii
1)Top
export product at HS 6-digit level. Latest available data has been used
Kenya 0,86 56,94 7,91 3,14 2,68 55,18 -0,91 875,04 Black tea
Kyrgyz Republic
0,36 104,06 7,56 36,04 1,17 68,20 -1,05 845,71 Gold
Lesotho 2,84 165,13 3,82 3,93 1,13 49,36 -0,16 749,13 Cotton cloth
Mauritania 1,33 91,80 31,34 3,86 2,81 60,65 -0,70 1000,23 Iron ores and concentrates
Morocco 2,51 64,21 5,53 12,94 1,26 69,78 -0,09 1736,97 Acids
Nicaragua 2,08 72,79 50,67 14,22 1,52 70,72 -0,73 1096,11 Coffee
Nigeria 3,05 57,67 8,51 8,28 2,58 48,49 -1,23 1299,28 Petroleum, oils
Pakistan 1,70 33,75 2,34 4,52 2,24 63,45 -0,83 795,54 Rice
Philippines 2,38 84,24 5,48 29,04 1,94 67,00 -0,42 1448,87 Electronic Circuits
Sri Lanka 4,62 69,85 7,39 7,57 0,79 72,33 0,06 1284,45 Black tea
Tajikistan -0,39 107,99 -1,84 21,01 1,85 65,46 -1,23 806,15 Aluminium, gold, zinc
Tunisia 2,74 92,88 4,78 24,55 1,21 72,96 -0,01 2419,54 Petroleum, oils
Ukraine -0,22 95,69 -4,65 62,53 -0,59 68,69 -0,84 3263,37 Iron, steel, semi-prod.
Vietnam 5,52 119,63 13,56 13,33 1,30 73,59 -0,43 495,45 Petroleum, oils

iv

v
Table 1.3 List of middle income countries, their yearly, averaged values and main export good, for the time period 1992-2014
Country
GDP/Capita Growth
(%)
Trade (% of GDP)
Investment (% of GDP)
Education Teritary Lev. (%)
Population Growth
(%)
Life Expectancy
(years)
Rule Of
Law
Initial GDP/Capita
(1992)
Main Export Good1)
Algeria 1,41 61 5,48 19,78 1,66 71,22 -0,78 3404,98 Petroleum oils
Belarus 3,69 129,24 5,16 62,94 -0,31 69,58 -1,04 2668,29 Petroleum oils
Belize 1,64 115,32 4,64 17,55 2,65 69,38 -0,24 3404,36 Frozen orange juice
Botswana 2,65 95,95 7,25 11,12 1,94 56,77 0,61 4027,65 Diamonds
Bulgaria 2,93 101,07 126,96 46,94 -0,71 72,40 -0,17 3607,79 Petroleum oils
Colombia 2,31 35,82 7,88 28,85 1,36 71,57 -0,58 4472,69 Petroleum oils
Costa Rica 2,98 87,38 7,40 33,36 1,76 77,77 0,51 5228,50 Parts of data processes
Cuba 2,47 34,80 1,01 48,64 0,28 77,30 -0,80 3289,34 Nickel oxide
Dominican Rep
3,93 70,14 6,47 29,96 1,53 71,28 -0,63 2769,58 Gold
Ecuador 1,59 53,11 5,78 24,84 1,82 73,39 -0,94 3782,19 Petroleum oils

vi
Equatorial Guinea
19,44 255,33 27,60 3,23 3,23 53,24 -1,32 715,53 Petroleum oils
Gabon -0,28 88,99 5,65 7,92 2,37 60,83 -0,48 10835,94 Petroleum oils
Iran 1,75 43,82 2,86 28,71 1,35 71,22 -0,82 4116,40 Petroleum oils
Jordan 2,08 123,31 6,42 33,12 3,22 72,27 0,35 2803,78 Minerals, chemical fertilizer
Kazakhstan 3,33 85,47 4,31 41,39 0,22 66,77 -0,86 4936,99 Petroleum oils
Macedonia 1,39 92,06 6,30 28,25 0,19 73,59 -0,38 3411,51 Metal catalysts
Malaysia 3,55 181,86 5,72 25,23 2,04 73,17 0,50 5080,53 Electronic Circuits
Mauritius 3,64 121,50 4,95 19,34 0,71 71,91 0,95 4026,89 T-shirt and cotton cloth
Mexico 1,10 52,13 3,65 21,03 1,57 74,62 -0,52 7508,79 Petroleum oils
Namibia 2,08 97,30 18,44 7,21 2,15 59,10 0,17 3802,71 Diamonds
Panama 4,00 146,06 10,31 37,83 1,86 75,60 -0,16 4570,25 Antibiotics
Paraguay 1,55 99,28 3,71 23,86 1,81 70,74 -0,96 2672,45 Soya beans
Peru 3,48 40,97 8,82 33,25 1,43 71,22 -0,64 2614,86 Gold
Romania 3,06 68,79 6,09 38,38 -0,63 71,65 -0,06 4323,06 Petroleum oils

vii
1)Top export product at HS 6-digit level. Latest available data has been used
Russia 1,30 57,31 -0,24 63,26 -0,14 66,93 -0,87 7717,10 Petroleum oils
South Africa 0,95 53,51 5,12 15,41 1,78 56,21 0,10 5888,51 Gold
Thailand 3,35 114,66 2,49 37,80 0,73 71,85 0,06 2876,62 Storage units
Turkey 2,57 47,92 6,99 36,30 1,50 70,99 0,04 6638,29 Petroleum oils
Venezuela 0,53 50,91 10,48 44,64 1,79 72,57 -1,40 13168,32 Petroleum oils

viii
Appendix 2
Table 5.3 Descriptive Statistics
Variable Mean Median Maximum Std. dev
GDP per Capita Growth 2.52 2.32 19.44 2.53
Openness 79.91 68.78 255.32 40.10
Initial GDP per Capita 2757.19 2340.43 13168.32 2489.76
Investment 9.83 6.41 126.96 16.78
Education 21.39 19.33 63.26 16.12
Population Growth 1.65 1.79 3.23 1.02
Life expectancy 65.52 68.68 77.76 8.04
Rule of Law -0.49 -0.53 0.95 0.50
Observations: 63
Table 5.4 Correlation Matrix Table
GDP/
Capita
Growth
Openness Initial GDP/
Capita Investment Education
Population
Growth
Life
Expectancy
Rule of
Law
GDP per Capita
Growth
1 0.497 -0.204 0.179 -0.086 0.020 -0.067 0.04
Openness 1 -0.004 0.134 0.058 -0.007 0.040 0.132
Initial GDP per
Capita
1 -0.053 0.467 -0.25 0.388 0.105
Investment 1 0.033 -0.156 0.024 0.046
Education 1 -0.739 0.655 -0.015
Population
Growth
1 -0.567 -0.098
Life Expectancy 1 0.206
Rule of Law 1

ix
Figure 5.1 GDP per Capita and Openness
0
40
80
120
160
200
240
280
-4 0 4 8 12 16 20
GDPCM
OP
EN
M