Embed Size (px)
Citation preview

7 November, 2015 © S A Partners
Is the Effectiveness of your
Equipment your Weakest Link?
And can TPM Strengthen your
Supply Chain?
0044(0)7702285528

7 November, 2015 © S A Partners
• What do we mean by Lean Enterprise / Operational Excellence and TPM Best Practice?
• How should TPM align with our Operations Strategy & Philosophy?
• How do we go about dispelling some of the Common Myths of OEE and Autonomous Maintenance to our Workforce ?
• How do we create the right Environment to generate the right Behaviours In order to Sustain the Gains?
• What are the common Pitfalls to Avoid?
To answer 5 x Questions…….

7 November, 2015 © S A Partners
• The Shingo model of Enterprise Excellence
is focused on delivering sustainable ideal
business results.
• Through a combination of research and
application, the Shingo Model has proven
that Ideal Sustainable Business Results
can only be achieved when Ideal
Behaviours are embedded in all aspects of
an organisation’s activities.
• These Ideal behaviours must be actively
managed across all key business systems.
• These key business systems must operate
in a way to enable and support ideal
behaviours of those working within that
system.
Ideal behaviours delivery ideal and
sustainable business results

7 November, 2015 © S A Partners
• In any physical asset based enterprise the effective and efficient operation of your assets is a critical factor in the consistent delivery of customer value.
• Therefore we can consider our ability to maintain and optimise the performance of those assets as ONE of the critical systems within your business.
• As a system therefore it must be designed to support and encourage Ideal Behaviours of those working within and around the companies asset management and supporting activities.
Asset management and its
optimisation as a system

7 November, 2015 © S A Partners
• The bottom line is that you will almost certainly
need to do more with less.
• In the Maintenance sense, this all has to be
achieved in parallel with yet more pressure and
demands on increasing environmental conformity,
increasing energy costs and of course, zero
accidents.
The challenge

7 November, 2015 © S A Partners
So,Why Change?
TRADITIONAL BLAME
CULTURE
FINGER POINTING
FUTURE OEE
CULTURE
BUSINESS MEASURE
DOWNTIME = Maintenance
Dept
PRODUCTION = Production
SHORTFALL Dept
SCRAP = Quality Dept
AVAILABILITY %
x
PERFORMANCE RATE %
x
QUALITY RATE %
OVERALL
EQUIPMENT
EFFECTIVENESS
=

7 November, 2015 © S A Partners
Measuring Equipment Effectiveness Floor
to Floor Losses
Overall
Administration
Effectiveness =
Availability x Performance Rate x Quality Rate
Idling & Minor
Stoppages
Reduced Speed
Losses
Breakdowns
C/O & Set up and
Adjustment Losses
Scrap,
Quality Defect &
Rework Losses
Start up Losses
The 6 x Classic Equipment Based Losses-(Floor to Floor)

7 November, 2015 © S A Partners
Where would you prefer to work?
With an OEE of 33%?

7 November, 2015 © S A Partners
Where would you prefer to work?
With an OEE of 33%?

7 November, 2015 © S A Partners
Where would you prefer to work?
……or with an OEE of 74%
7 November, 2015 © S A Partners
Where would you prefer to work?
……or with an OEE of 74%
In a plant with well designed, fit for purpose, safe, reliable and with well
maintained equipment?

7 November, 2015 © S A Partners
1-
Out of Control-Process Unstable
2-
In Control-Process Stabilised
3-
Improving-Process Optimised
4-
Able to Forecast with Confidence
The Classic 4 x Phases of
Improvement

7 November, 2015 © S A Partners
First 4 Months OEE Figures

7 November, 2015 © S A Partners
1413121110987654321
140
120
100
80
60
40
20
0
Weeks
Pe
rce
nta
ge
of
Av
aila
bilit
y
_X=67.8
UCL=136.9
LCL=-1.4
Availability
Out of Control
In Control

7 November, 2015 © S A Partners
1413121110987654321
100
90
80
70
60
50
Weeks
Pe
rce
nt o
f P
erfo
rm
an
ce
_X=75.40
UCL=99.54
LCL=51.26
Performance
Unacceptable
Dramatic Improvement

7 November, 2015 © S A Partners
1413121110987654321
105
100
95
90
85
80
Weeks
Pe
rce
nta
ge
of
Qu
ality
_X=93.77
UCL=105.58
LCL=81.96
Quality
Progressive Improvement
& In Control
Unacceptable

7 November, 2015 © S A Partners
Wk 2 Jan 2010
72% OEE
Refurbishment Step
6
September 2009
Kick off
Net Positive Result on OEE
First 4 Months OEE Figures

7 November, 2015 © S A Partners
Reactor Performance before TPM
Batch Reactor
• 2 cycles in a 24hr
period
• Suffering from the
six losses and non-
standardised
operations
• We are not in
control of our
process
• We cannot predict
our batch times Cycle 1 Cycle 2

7 November, 2015 © S A Partners
Reactor Performance after TPM
Batch Reactor
• 3.5 cycles in a 24
hr period
• Identical trends
hence process is in
control
Cycle 1 Cycle 2 Cycle 3

7 November, 2015 © S A Partners
Bag Filler Performance before
TPM
Bag Filler
• Each Peak
represents a bag of
finished product
• 8 bags produced in
24hrs
• Heavily affected by
the six losses
• We are not in
control of our
process
Breakdowns Minor stops

7 November, 2015 © S A Partners
Bag Filler performance after TPM
Bag Filler
• Each Peak
represents a bag of
finished product
• 26 bags produced
in 24hrs out of a
possible 30
• Still some minor
losses but we are
Improving! Few Minor
stops

7 November, 2015 © S A Partners
• Additional c. € 1.2 m t/o with net margin 10%
• Total training and refurbishment costs of € 60k
• 6 months Pay-back
• Result ? WIN /WIN !
Also Winner of UK National Training Awards for
internal training and development of front line staff
using 11 x step TPM model
Result
7 November, 2015 © S A Partners
Developing Best Practice
30%
DAILY OPERATIONS
70%
FIREFIGHTING
20%
FIRE-FIGHTING
20%
DAILY
OPERATIONS
In any Company, 70% fire-fighting is
caused by two main phenomena:
Lack of Communication-(Cause)
Lack of Adherence to Standards-(Cause)
No Standards Exist (Solution)
No Time to Deliver 100yr fix(Solution)
> 95%
Leaving only Unknown, Novel Issues of……
This is the first time this has ever happened !!
< 5%
}
}
60%
SYSTEMATIC CONTINUOUS
IMPROVEMENT

7 November, 2015 © S A Partners Slide 24
Current vs. (say,3yr) Benchmark Maintenance
Time Allocation

7 November, 2015 © S A Partners
Development of maintenance ‘Culture’
Versatile People focused
(Tomorrow)
Flexible (2000’s)
Single Skilled
(60’S / 70’S)
Multi Skilled
(1980’s / 90’s) Specialist Craftsmen
Experienced Proficient
Professional
Adaptable Responsive
Resourceful All Purpose
Told Narrow
Fixed
Told Wider
Semi Variable
Explained Broad
Variable Delegated
Team focus
Involved in Decisions Able to participate, Autonomous within
clear boundaries and rules.
Capability
Time

7 November, 2015 © S A Partners
Purpose
People
Process
S A Partners Enterprise
Excellence Model
Imp
rove
Purpose & People Purpose & Process
Process & People
Results Customer

7 November, 2015 © S A Partners
• Our TPM programme is applied via a defined introductory and deployment process within the business unit-Purpose
• The application of our TPM model is applied through a defined sequence of team based ‘learning by doing’ activity-Process
• The outputs of this application are aligned to an evidence based assessment process linked to the teams progress through the model-People
The TPM System Model

7 November, 2015 © S A Partners
• Your TPM Programme will be at Risk of Failure if it is seen to
be Implemented as an Equipment Engineering or
Maintenance Department Driven Initiative
• There is much less risk of Failure if it is Implemented and
Managed under the umbrella of ‘Operations’ and hence the
Manufacturing Function which embraces both the
Maintenance Engineer and the Operator as Equal Partners
• TPM therefore becomes Total Productive Manufacturing
Ensuring TPM Success
-a note of Caution

7 November, 2015 © S A Partners
Totally Productive Operations
TPM Manufacturing
TPM (Maint) TPM (Design)
TPA (Admin)
The Value Stream & TPM
Suppliers Company/
Plant Customers
• Supply Chain
• Office
• Support Services
THE COMMON GOAL: To Maximise Added Value
and Eliminate Waste
“…..In All That We Do.”
7 November, 2015 © S A Partners
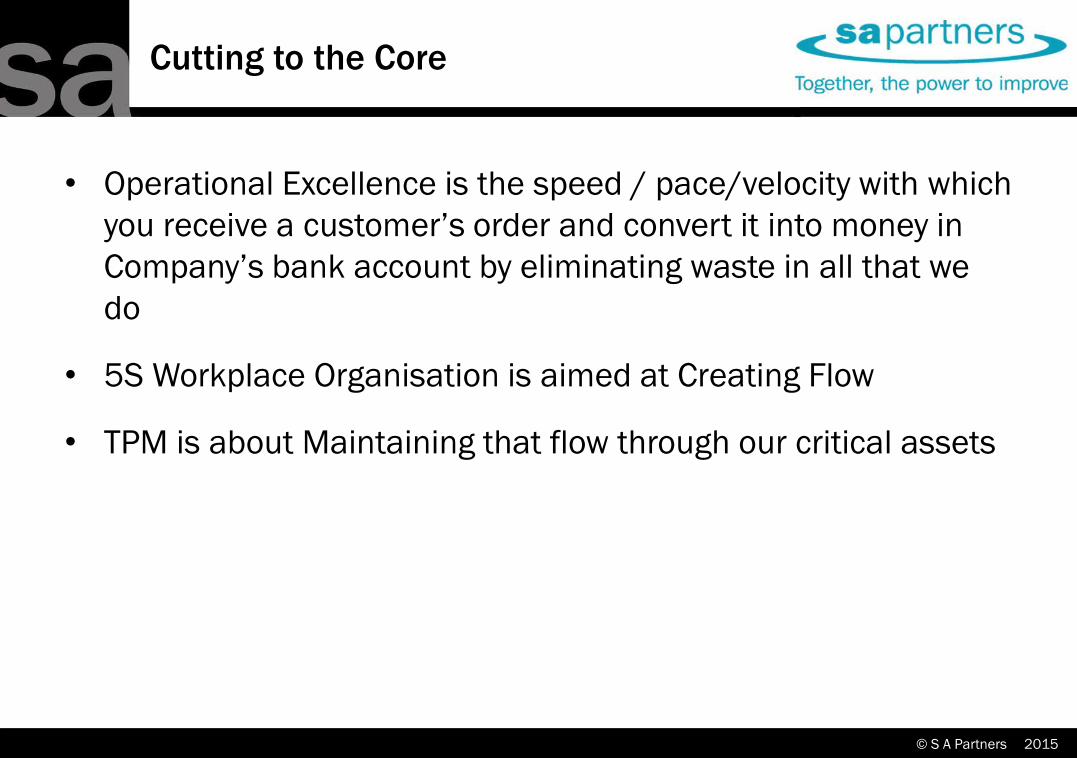
• Operational Excellence is the speed / pace/velocity with which
you receive a customer’s order and convert it into money in
Company’s bank account by eliminating waste in all that we
do
• 5S Workplace Organisation is aimed at Creating Flow
• TPM is about Maintaining that flow through our critical assets
Cutting to the Core

7 November, 2015 © S A Partners
• You cannot achieve Operational Excellence (OE ) without
Operational Basics in place!!
• This means the fundamentals of:-
– Standard Work (and therefore Safe) Operating Procedures,
– Basic Manufacturing Process Control & Capability
– Best Practice’ Work Place Organisation / 5S
– A Disciplined, self determined, Total Asset Care Regime
– Reliable Data Collection & Interpretation
– Continuous Development and Training of our People
A Key Message to Remember

7 November, 2015 © S A Partners
1 Month 2 - 6 Months 7-24 Months +
Roll-Out Evolution Pilot Process
TPM Implementation Journey
-the Purpose
Scoping
Study
Senior
Management
Workshop
4 x Day
TPM
Practitioner’s
Workshop
Secure Management Commitment Trial & Prove the Route Milestones 1-4
POLICY DEVELOPMENT & DEPLOYMENT
Pilot Projects,
Plant Clear
& Clean,
Training &
Communication
Feedback
Mgt
Review
Improvement Zone Partnership
Operational Improvement
Project Improvement
Business Process Improvement

7 November, 2015 © S A Partners
TPM is about Team-Work
MANAGER/
SUPERVISOR
TPM
FACILITATOR
DESIGNERS &
ENGINEER(S)
FINANCE
& HR
QUALITY &
PROD PLANNING
STEERING
GROUP
PRODUCTION
PROCESS
MAINTENANCE
TECHNICIAN
THE CORE TEAM
KEY CONTACTS

7 November, 2015 © S A Partners
Four Cycle-11 Step TPM Process
The Football
Review Performance
Criteria & History
Measurement & Opportunity
analysis of KPIs (incl. OEE)
Equipment Criticality
Assessment
Condition Appraisal &
Restoration plan
Root cause Analysis &
Problem Resolution
Individual & Team Skill
Development
Leadership
& Behaviours
Audit & Review Process
MEASURE CURRENT STATE
& IDENTIFY OPPORTUNITY
CONDITION REVIEW
(INCL. SAFETY ENERGY, &
ENVIRONMENT)
PROBLEM PREVENTION & BEST PRACTICE
ROUTINES
FUTURE STATE
REALISATION
THROUGH A
HABIT OF
CONTINUOUS
IMPROVEMENT
Fe
ed
ba
ck
A
B
C
D
Assess Hidden Losses/wastes&
Set Improvement
priorities
Develop Future Total Asset Care
Best Practice & Standard Work
1 2 3
7
4 5 6
9
8
10 11

7 November, 2015 © S A Partners
Four Cycle-11 Step TPM Process
Review Performance
Criteria & History
Measurement & Opportunity
analysis of KPIs (incl. OEE)
MEASURE CURRENT STATE
& IDENTIFY OPPORTUNITY
A Assess Hidden Losses/wastes&
Set Improvement
priorities
1 2 3

7 November, 2015 © S A Partners
• What Sources do we have?
• How Comprehensive are they and…
• How Trustworthy are they?
• List and Rank them 1to 5, where:-
– 1 is Poor,
– 2 is Fair,
– 3 is Adequate,
– 4 is Very Good
– 5 is Excellent
Step 1 - Sources of Information

7 November, 2015 © S A Partners
SOURCE How Comprehensive ? How Trustworthy?
SAP 4 1 to 5
Efficiency Files (AO1only) 3 3
Kissler Monitor (E14 only) 4 4 to 5
Operator Log Book 3 2
Maintenance Log Book 2 to 3 2 to 3
Tool History Log 3 to 4 3 to 4
Materials Handling Sy 3 5
Robot History (E14 only) 3 Rarely Used
OEM Manuals 4 to 5 2
Operator Knowledge 1 to 5 1 to 5
Maintainer Knowledge 1 to 5 1 to 5
M/C History Single Page 1 5
SORT-Suspect Parts 4 4
Spares Usage 5 5
Daily Activity Sheet 3 to 4 3 to 4
Daily Management Board 3 1 to 5
Material Cycle Count 4 4
Process Change Management 4 3
Example STEP 1 Sources of Information 1 = Poor, 2= Fair , 3= Adequate, 4= Very Good, 5 = Excellent

7 November, 2015 © S A Partners
• Brainstorm and Review the number of different sources, their variety, their comprehensiveness and their integrity
• Is there scope to subject each source to the ECRS test?
• What sources can we-Eliminate or Combine and if not, can we at least Replace with something smarter or at least Simplify ?
• Can we extract the OEE metric from these sources or do we need to design and implement a OEE Shift Log sheet ?
Step 1 KLP’s

7 November, 2015 © S A Partners
Availability % Performance
Rate % Quality Rate % OEE %
Breakdowns
Set Ups/ Changeovers
Running at Reduced Speed
Minor Stops & Idling
Scrap Rework
Start-up Losses
Current 4 Wks Average OEE
80 90 97 70
4 Weeks Best of Best (BoB)
90 (Wk1) 95 (Wk3) 98 (Wk1& 4) 84
World Class 95 96 99 90
Step 2 Self Assessment Example
Difference between Current Average & BoB is (14 / 70) x 100%
= 20% Real improvement In Productive Capacity

7 November, 2015 © S A Partners
Step 2-What is BoB & WC OEE Worth to Us?
If this asset is planned to be manned for 168 Hours per week
At 70 % OEE we only achieve 118 Productive Hrs / week
At 84% OEE we can achieve 141 Productive Hrs / week
Yielding a benefit of 23 productive Hrs / week or 1,150 hrs / Yr
Namely
a CHOICE of flexibility at 84% OEE that we do not enjoy
at 70% OEE !!
(When we hit WC levels of 90% OEE the benefit is worth
1,660 extra productive hrs / year)

7 November, 2015 © S A Partners
• Have we calculated a current average OEE?
• What is our interim Best of Best OEE target?
• What is our ultimate WC-OEE ?
• What is the value of additional productive hours per
week when our BoB is achieved?
• This potential value will help to make a compelling
business case to implement TPM and justify our
step 5b) Refurbishment Plan
Step 2 KLP’s

7 November, 2015 © S A Partners
Boxes/reams reloaded onto
line after stoppages
Broke trim
Box/paper jams in m/c’s
Step 3-Fishbone format for
Assessing 6 Losses
Availability
Rate
Performance
Rate
Quality
rate
IDLING & MINOR STOPS YIELD, REWORK, SCRAP
X X
SET-UPS
CHANGEOVERS
REDUCED SPEED
LOSSES
START-UP
LOSSES
Sensor Replacement -
5 mins
Gripper rods breaking
Wait for craftsmen
Reel change - 24 mins
Re-set gripper - 17 mins
Width curl (poor quality paper) -
165 mins
Manhandling of reels
Box Lid Jams -13 mins (5)
Ream label jams -10 mins (3)
Box label jams -11 mins (2)
Pemco jams - 8 mins (2)
6 reel instead of 4/8 reel runs
Running @ 18 instead of 20
reams/min to reduce jams
Restriction to 14 reams/mins
on involvo as chain slips
Pallets not full
Boxes damaged by robot
Approx. 1/2” off reel diameter when
loading reel on back-stands
Damaged/poor quality paper
80% 90% 97%
70%
Downtime = 211 mins
Figures in brackets denote
frequency of occurrence (Lost production = 8.96 tonnes)
OEE
BREAKDOWNS

7 November, 2015 © S A Partners
• These are the classic 6 x loss reasons and why the
current OEE is what it is
• Also differentiating between Floor to Floor
‘Equipment based Losses v’s the Door to Door or
‘Management Losses’
Step 3 KLP’s

7 November, 2015 © S A Partners
Four Cycle-11 Step TPM Process
Review Performance
Criteria & History
Measurement & Opportunity
analysis of KPIs (incl. OEE)
Equipment Criticality
Assessment
Condition Appraisal &
Restoration plan
MEASURE CURRENT STATE
& IDENTIFY OPPORTUNITY
CONDITION REVIEW
(INCL. SAFETY ENERGY, &
ENVIRONMENT)
A
B
Assess Hidden Losses/wastes&
Set Improvement
priorities
Develop Future Total Asset Care
1 2 3
4 5 6

7 November, 2015 © S A Partners
Step 4: Criticality Assessment
Outputs
List all Elements
Assess all Elements
Impact on Six Losses
Optimum Conditions
EQUIPMENT DESCRIPTION
Packing Line 6 (P6)
1-3 RANKING AS IMPACT ON:
S A P Q R M E C TOT
1. Checkweigher 2 3 3 3 1 1 1 3 17
• Safety
• Availability
• Performance
• Quality
• Reliability
• Maintainability
• Environment
• Cost
• 1 = No impact
• 2 = Some impact
• 3 = Major impact
Optimum Checkweigher Conditions
• The checkweigher is calibrated (FLOAC) • The belts are clean (FLOAC)
• The correct format is entered (FLOAC) • Load cells are clean (FLOAC)
• Motors are in good condition and bearings are good (FLOAC, PM, condition monitoring)
• All rollers are free and easy to rotate (FLOAC, PM, condition monitoring)

7 November, 2015 © S A Partners
Builds Teamwork between Operators & Maintainers
Understanding of the Equipment Functionality
Checklist for Condition Appraisal (Step 5a)
Focus for Future Asset Care Asset Care (Step 7)
Highlights Safety & Environmentally Critical Items
Potential Impact on OEE
Highlights Weaknesses Regarding:-
Ease of Operation
Inherent Reliability
Ease of Maintenance
Step 4 - Criticality Assessment
Outputs

7 November, 2015 © S A Partners
• The Operators and their Maintenance colleagues
become far more ‘Equipment Conscious’
• They now actually understand how the equipment
works
• Highlights the Impact of Safety, Reliability,
Environment and APQ(ie the OEE)
• Focuses on parts that need to be kept in Optimum
Condition as part of Steps 7 & 8
Step 4 KLP’s

7 November, 2015 © S A Partners
STEP 5a ‘Spot the Rot’
Go to the machine and systematically inspect every square centimetre for deterioration
and refurbishment needs. Look for:
► Dirty or Neglected equipment (Packaging debris and / or dust particles)
► Disconnected hoses
► missing nuts and bolts producing visible instability
► steam leaks and air leaks
► Air Filter Drains That Need Cleaning
► jammed valves
► hydraulic, lubricating and oil leaks
► measuring instruments too dirty to read
► abnormal noises in pumps and compressors
Pay particular attention to critical components. They should be kept in optimum
condition.
Step 5a-Condition Appraisal

7 November, 2015 © S A Partners
Step 5a)-Spot the Rot summary
Asset Total No
of Issues
Safety
Issues
Environment
Issues
High OEE
Impact
Medium
OEE
Impact
Low
OEE
Impact
Cum
OEE
Impact
Auto 1 30 15 26 7 4 1 12
Auto 2 38 15 2 5 9 10 24
Tape 24 6 0 - 10 2 12
Braze 57 36 11 10 2 9 21
Total 149 72 39 22 25 22 69
Spot the Rot Summary
Total of 149 issues of which…
•48% are potential safety issues,
•26% environmental issues and ….
•46% perceived as having a potentially negative impact
on the OEE
7 November, 2015 © S A Partners
Step 5a)-KLP’s
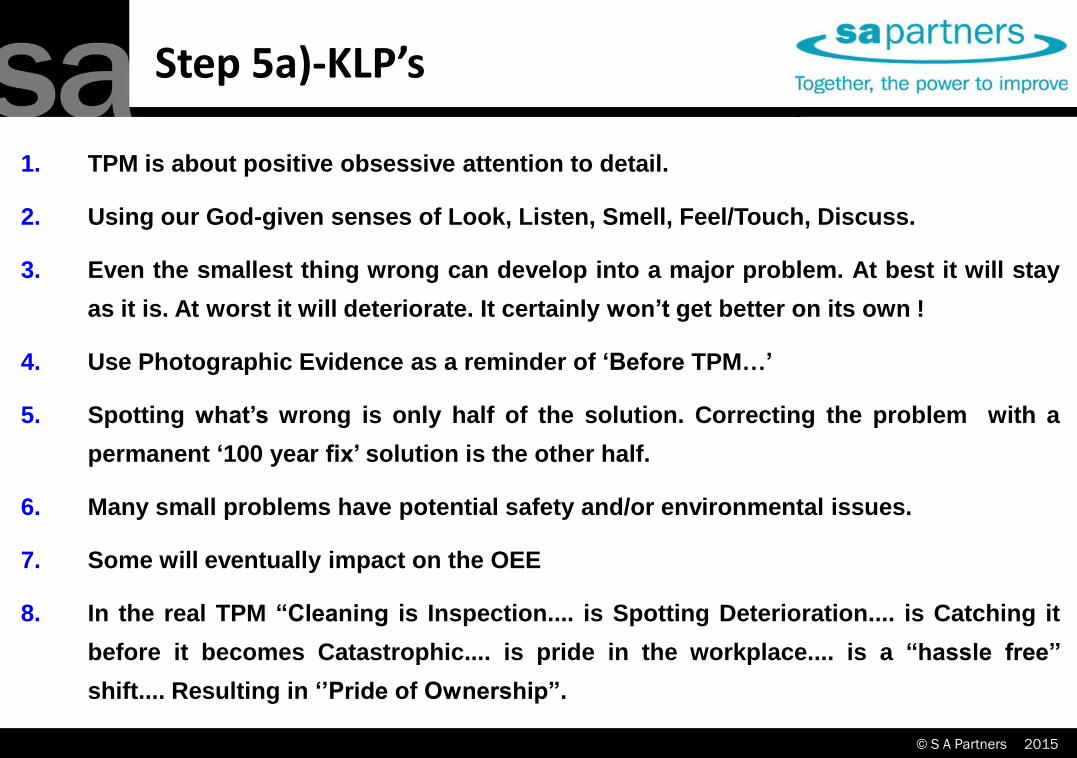
1. TPM is about positive obsessive attention to detail.
2. Using our God-given senses of Look, Listen, Smell, Feel/Touch, Discuss.
3. Even the smallest thing wrong can develop into a major problem. At best it will stay
as it is. At worst it will deteriorate. It certainly won’t get better on its own !
4. Use Photographic Evidence as a reminder of ‘Before TPM…’
5. Spotting what’s wrong is only half of the solution. Correcting the problem with a
permanent ‘100 year fix’ solution is the other half.
6. Many small problems have potential safety and/or environmental issues.
7. Some will eventually impact on the OEE
8. In the real TPM “Cleaning is Inspection.... is Spotting Deterioration.... is Catching it
before it becomes Catastrophic.... is pride in the workplace.... is a “hassle free’’
shift.... Resulting in ‘’Pride of Ownership”.

7 November, 2015 © S A Partners
STEP 5b REFURBISHMENT
The objective of the Refurbishment Programme is to set up a Repair and
Replacement Plan, based on the Condition Appraisal (step 5 )
The plan will provide a detailed summary of actions to be co-ordinated by the
team and will include:
Dates and Timescales
Resource (labour, materials, time)
Responsibilities
Control and feedback (Management of Change)
To aid Planning and Completion of Refurbishment Tasks, it may be helpful to
categorise up to three work packages:
On the Run (Low Cost/Easy to Do/No Outage)
Minor Planned Outage (8 to 24 hours)
Major Planned Outage (involving Redesign/Fabrication).
Step 5b) Condition Cycle

7 November, 2015 © S A Partners
Step 5b) Refurbishment
Plan Summary

7 November, 2015 © S A Partners
Step 5b) KLP’s
•Restore to ‘as new’ condition,
•The need for a progress Tracker,
•Now able to justify cost/benefit via OEE’s Best of Best
additional productive hours

7 November, 2015 © S A Partners
Condition Cycle-Step 6
DEVELOP ASSET CARE LISTS, INSPECTION & PM’S
Overall Plan
Critical
Assessment(4)
Condition
Appraisal(5a) Refurbishment
Plan(5b)
CMMS
Pre-Programmed
Technical/Servicing Timetable
Maintainer
PM’s
Shared
Responsibility
CBM
Operator FLOAC
ASSET
Spares List
FEEDBACK
Machine-side
plus
Visual Indicators Single
Point
Lessons
OPERATOR/MAINTAINER
TRAINING RECORDS
ROUTINE ASSET
CARE Timetable
(Machine-Side)
Step 8-BPR

7 November, 2015 © S A Partners
Step 6-Front Line Operator Asset Care
(FLOAC) Operator as the Nurse
• The operator takes on the role of first
line asset care
• Checking the condition of the
equipment during operation
• Carrying out checks during the
weekly asset care shift windows
• Progressing carrying out change
overs on equipment
• The operator carries out
more interesting tasks
and expands their
knowledge

7 November, 2015 © S A Partners
Step 6-Condition Based Maintenance
via the Maintenance Technician
CBM via Vibration Monitoring, Oil Debris analysis & Thermography
is the responsibility of the Maintenance Technician (the Doctor)

7 November, 2015 © S A Partners
Step 6-Maintenance Technician as the
PM Engineer (Doctor))
• As well as PM’s-The technicians
spends more time on design and
engineering out problems (the
occasional Surgeon)
• Less work is outsourced
• More knowledge and ability is
developed in-house
• Technicians feel more motivated and
more valued

7 November, 2015 © S A Partners
Step 6 FLOAC Example
Line Six East Satellite Asset Care
What’s This ? See next Slide ►

7 November, 2015 © S A Partners
Step 8
Make It Easy to do Things Right

7 November, 2015 © S A Partners
Step 6 KLP’s
•FLOAC’s -Use of Visual Indicators ,
Make it Easy to do right, and difficult to do wrong,
• How many minutes (usually less than 10)
to carry out FLOAC checks.
•Full Step 6 must also include CBM
& a comprehensive review of the fixed interval PM’s

7 November, 2015 © S A Partners
Four Cycle-11 Step TPM Process
Review Performance
Criteria & History
Measurement & Opportunity
analysis of KPIs (incl. OEE)
Equipment Criticality
Assessment
Condition Appraisal &
Restoration plan
Root cause Analysis &
Problem Resolution
MEASURE CURRENT STATE
& IDENTIFY OPPORTUNITY
CONDITION REVIEW
(INCL. SAFETY ENERGY, &
ENVIRONMENT)
PROBLEM PREVENTION & BEST PRACTICE
ROUTINES
A
B
C
Assess Hidden Losses/wastes&
Set Improvement
priorities
Develop Future Total Asset Care
Best Practice & Standard Work
1 2 3
7
4 5 6
8

7 November, 2015 © S A Partners
Step 7
P-M Analysis - On the Job Reality
P-M Analysis is the Problem Solving Tool used in TPM, which Emphasises the
Machine/Human Interface:
There are:
The 4 P’s
Phenomena, which are
Physical, which can be
Prevented
Caused by:
Because they are to do with:
The 5 M’s
Materials & Mother nature
Machines
Methods
Manpower
Involving:
Problems, due to
……and We Need a 6th M Which is Measurement

7 November, 2015 © S A Partners
Step 7 -Problem Solving
Causes Of Chronic Losses
CAUSE
CAUSE
CAUSE
CAUSE
CAUSE
CAUSE
(Single Cause) (Complex Combination of Causes)(Multiple Causes)
Difficulty in pinpointing Cause
CAUSE CAUSE No Single
Solution

7 November, 2015 © S A Partners
Step 7 KLP’s
•Use of the Event Analysis form to not only solve the problem
but to also prevent re-occurrence with the ‘100 year fix’
•The importance of the P-M mindset of the 4 x P’s and 6 x M’s
•Strong links back to solve highlighted issues on Step 3 fishbone
•Use of Ask Why? 5 x times or A3, DMAIC and FMEA tools
to deliver the 100 year fix mentality

7 November, 2015 © S A Partners
Agree Best Practice
Standardise (Train and Assess)
Practice and Refine (Pass on Lessons Learnt)
Step 8
Standard Work-Best Practice Routines

7 November, 2015 © S A Partners
The Right Tools, Information,
Spares, Facilities,
Equipment
Best Techniques
of Asset Care
Correct Operation
Step 8 - Best Practice Framework

7 November, 2015 © S A Partners
Step 8
Make It Easy to do Things Right

7 November, 2015 © S A Partners
Contain content which can be delivered in 10 minutes or less
Are highly Visual
Are an Essential aid to communication for Operators,
Maintainers, Managers and Support Staff
Address the Main Stages of the Learning Process:-
Explain (Awareness)
Demonstrate (Understanding)
Practice (Skill Development)
Confirm (Competent to Train Others)
Step 8-Single Point Lessons

7 November, 2015 © S A Partners
Step 8: Develop Best Practice
Standard Work and SPL’s
JOB BREAKDOWN SHEET
MAJOR STEPS KEY POINTS REASON FOR
KEY POINTS
(WHAT) (HOW) (WHY)
STEP # 1
Turning On The
Grip Verification
For The Robot
1) Turn the key to pgm/man mode. Press the power button , then press the GRIP VER. button to enable the green light.
1) To ensure the robot will not operate if it fails to pick sprue. This ensures the mould won’t close on sprue and damage tooling.
STEP # 5
Checking The
Water Flow In
The Machine
1) Check and make sure that there’s an adequate water
flow level in the machine.
1) To ensure that the water system is operating correctly.
STEP # 6
Check To
Ensure The
Regrind Return
Selector Box Is
Switched To
No.2 For L.C.P
Return
1) Check to ensure that the selector box which is located
at the rear of the machine is on the correct number to
co-operate with the regrind return system.
1) To ensure the regrind return works correctly.

7 November, 2015 © S A Partners
There is only one Best Way
Use of SPL’s & Skills Matrix
Standard Work
Step 8 KLP’s

7 November, 2015 © S A Partners
Four Cycle-11 Step TPM Process
Review Performance
Criteria & History
Measurement & Opportunity
analysis of KPIs (incl. OEE)
Equipment Criticality
Assessment
Condition Appraisal &
Restoration plan
Root cause Analysis &
Problem Resolution
Individual & Team Skill
Development
Leadership
& Behaviours
Audit & Review Process
MEASURE CURRENT STATE
& IDENTIFY OPPORTUNITY
CONDITION REVIEW
(INCL. SAFETY ENERGY, &
ENVIRONMENT)
PROBLEM PREVENTION & BEST PRACTICE
ROUTINES
FUTURE STATE
REALISATION
THROUGH A
HABIT OF
CONTINUOUS
IMPROVEMENT
Fe
ed
ba
ck
A
B
C
D
Assess Hidden Losses/wastes&
Set Improvement
priorities
Develop Future Total Asset Care
Best Practice & Standard Work
1 2 3
7
4 5 6
9
8
10 11

7 November, 2015 © S A Partners
1
2
3
4
Problems given to
management- top down
improvement
Bottom up improvement
-Stabilise
Self managed team
activities
-Optimise
World class
Performance
4 zero’s
Reactive
Proactive
4 Milestones of TPM &
Team Performance-People

7 November, 2015 © S A Partners
• Practitioners Competency can be certified to Cardiff
University Lean Competency System, Basic Intermediary
and Advanced.
• Training workshops incorporate class room learning, process
simulations exercises and shop floor activity.
The TPM Model (a PS…)

7 November, 2015 © S A Partners
Important to recognise the
differences
It’s important to recognise the different industry
characteristics in for example , Process,
Manufacturing, Packaging ,Utilities, Warehousing,
Especially (but not exclusively) in terms of :-
• OEE Measurement
• Operator Impact on Performance
• Maintainer Impact on Performance
• 5S Work place Organisation
• Changeovers

7 November, 2015 © S A Partners
Recognising the differences
Type of Facility OEE Measure Operator Impact
Maintainer Impact
5S -WPO Change overs
Process Campaign or
Batch OEE or a
Fixed Repeating
Schedule
Significant Major Significant
(contamination
control)
Significant
+ CIP’s
Manufacturing Running Clock
OEE
Major Major Major (to create
Flow)
Major
Packaging Running Clock
OEE
Major Major Major (to create
Flow)
Major
Utilities Relevance of
OEE??
Very Little Major
‘Housekeeping’
Eng ‘Pride’
N/A?
Warehousing Running Clock
OEE
Major Major Major (to create
Flow)
Pre-Kitting
ECRS

7 November, 2015 © S A Partners
CI-TPM Infrastructure
for Programme Governance
Steering Group
FAC DEV
FLM COACHING
PUB’ & COMMS
TOP DOWN TARGET DRIVEN
MANAGEMENT
MASTER ROLL-OUT PLAN LEARNING
ORGANISATION
PIL
LA
R
CH
AM
PIO
NS
11 STEP TPM PROCESS AND
5S / WPO
Top Down SLT 30 pt
Review x2 per yr
Bottom up Level 1a
/ 1b to 4a/4b
Evidence based
Audits
Pil
lar
Ch
am
pio
ns
OEE
FLOAC
PM/QM
SD
EEM
5S
P &C
LOG
QA
HSE

7 November, 2015 © S A Partners Slide 77
Typical Pillar Champions
Pillar Champion Typical Job Holder
OEE Value Stream Managers (+Fin manager)
FLOAC Production Manager ( Shift Supervisors)
PM & Q of M Maintenance Manager
Skill Development (Generic) Human Resources Manager
Skill Development (Technical) Production Manager
6S –Workplace Organisation Shift Supervisors (Production Manager )
EM/Major Projects Manufacturing Engineering Manager
Publicity and Comms TPM Facilitator
(Logistics) Planning Manager
(Quality ) Quality Manager
(HSE) HSE Manager

7 November, 2015 © S A Partners
Interpretation of the Result
Weak Infrastructure for Change.
Limited Control of
Key Business Issues and/or
Technology
Excellent Control and
Understanding of the
Business People are really
Encouraged and Active
but in an Unstructured
Way and Potentially
Destructive Way
Poor Reward,
Recognition and
Encouragement
In Theory Everything Works but the
Operation is Vulnerable to Change
and Potentially slow to
Identify Opportunities
Excellent
Recognition and
Motivation to
Continuously
Improve
4 yr WC
B’Mark

7 November, 2015 © S A Partners
Top Down 30 Point Bi-Annual
Review Example of Results

7 November, 2015 © S A Partners
INPUT
EFFORT
OWNERSHIP
RESPONSIBILITY
OPERATOR AS TECHNICIAN
MAINTAINER AS ENGINEER
FIRST LINE MANAGER
MANAGER AS ENTREPRENEUR
CONSULTANT
MANAGEMENT
SUPERVISION
Initial Pilot
Trial & Prove
the Route
Milestone 1
Introduction
Everyone
Involved
Milestone 2
Refine Best Practice
& Standardise
Get the Basics
Right
Milestone 3
Build
Capability
Innovation Achieve Spark
to Start Vision
Milestone 4
Strive for
Zero Losses
TIME 3 - 5 YEARS
CAPABILITY
TPM Roll Out Evolution

7 November, 2015 © S A Partners
Milestone 4:
Strive for Zero Targets
Set Fast Track
Everyone Involved
Define Accountabilities
Milestone 1:
(Introduction)
Milestone 3:
(Build Capability)
Milestone 2:
(Refine Best Practice
& Standardise)
Level 4B
Checklist Level 1A
Checklist
Level 4A
Checklist
Level 3A
Checklist
Level 2B
Checklist
Level 2A
Checklist
Level 1B
Checklist
Level 3B
Checklist
Achieve Optimum Conditions
Reduce Effort
Increase Customer
Responsiveness
Reset Vision
Define Optimum Conditions
Use P-M Analysis
Improve Equipment Precision
Improve the Quality of Maintenance
Achieve skill levels for zero
targets
Define Training Needs
Make it Easy to Do
Involve Support Departments
Set up Early Warning System
Achieve Adherence
Step 11 - Organisational Learning
4 x Milestones.
Delivering the Production Response through 10 Point Audits / Reviews

7 November, 2015 © S A Partners
• Respect every individual
• Lead with Humility
• Flow and Pull Value
• Assure quality at the source
• Seek Perfection
• Focus on process
• Embrace Scientific thinking
• Think systematically
• Create constancy of purpose
• Create value to the customer
10 Shingo Principles / Attributes

7 November, 2015 © S A Partners
Behaviour
Potential Impact of TPM
At What Milestone onwards
My organisation maintains open and honest two-way communication throughout the entire organization My organisation treats all ideas as equal in value, no matter whose idea it is Leaders and managers focus on asking supportive questions rather than giving answers or solutions We are always accountable for our work and our results
2
2
2 to 3
2
MS 3 MS 1 MS 2 MS 2
% Significance 71%
0 = No Impact ,1 = Some Impact, 2 = Significant Impact, 3 = Major Impact
1-Respect every individual

7 November, 2015 © S A Partners
Principle
% significance
1. Respect every individual 2. Lead with Humility 3. Flow and Pull Value 4. Assure quality at the source 5. Seek Perfection 6. Focus on process 7. Embrace Scientific thinking 8.Think systematically 9. Create constancy of purpose 10.Create value to the customer
71%
79%
79%
67%
83%
100%
67%
71%
71%
75%
Total 76%
Summary
Potential impact of TPM

7 November, 2015 © S A Partners
TPM Benefits
after 9 months (and after c .2 years)
1st 9 Months • Reduced Maintenance spend $ 52,000 • Reduced Non core Hours Over Time $ 211,000 • Less Consumables $ 50,000 • Additional Annualized Savings $ 213,000
• TOTAL $ 526,000
• Plus Cap Ex Cost Avoidance $ 950,000
(After c.2 years ,accumulated cost avoidance = $ 4.75 m)

7 November, 2015 © S A Partners
Fill & Pack Line 6 Improvements
(at Milestone 2 Achievement)
12 Months
Average Reference Point
OEE 20.7%
Eq Failures 25.7%
Idle Time 38.0%
No Data 2.1%
Line Restraint 5.9%
Minor Stops 7.8%
Actual v. Target 73.0%
(Prod Plan)
Following 9 x Months
4 Wks Moving Average
49.5%
4.0%
21.5%
0%
0%
2.7%
100 %
Improvement
x 2.5 increase
Down by x 6
Halved
Eliminated
Eliminated
Down by 65%
100% OTIF

7 November, 2015 © S A Partners
From TPM Project…………..
STEP Project
1. History & Standards
2. OEE
3. Assess 6 Losses
4. Critical & Risk Assessment
5.Pt 1 Condition Appraisal
5. Pt 2 Refurbishment /Restore
6. Future TAC Asset Care
(FLOAC,CBM & PM)
7. Problem Prevention
8. BPR
CLOSE
OUT x
Measurement
Cycle
Condition
Cycle
Problem
Prevention
Cycle

7 November, 2015 © S A Partners
……..to CI-PDCA Process
STEP Project C I Process
1. History & Standards
2. OEE
3. Assess 6 Losses
4. Critical & Risk Assessment
5.Pt 1 Condition Appraisal
5. Pt 2 Refurbishment /Restore
6. Future TAC Asset Care
(FLOAC,CBM & PM)
7. Problem Prevention
8. BPR
OEE
REFINING
PDCA
Measurement
Cycle
Condition
Cycle
Problem
Prevention
Cycle

7 November, 2015 © S A Partners
Line-side Weekly Review GAP Boards from
an example
• Goals
-OEE-78%
-Schedule Ad-98%+
-CRD <8 days
-MPD <7 days
-Unit cost <€0.15/k
-Spl’s signed off
-Training / Skills matrix
• Performance
72%
94.5%
8 days
6.5 days
€0.12/k
18
60% adherence
2015 Strategic Intent Goals
•12% Yr on Yr Productivity Improvement
•CC’s / QN’s down from 68 to 40
Actions for Nov
-Mould Protect Project
-Pl Review 15 Nov
-Offer 7 days
-Keep in check
- Keep on track
-Complete next 30
-3 x sessions planned
Asset & VS
A01 –VS1
Month
Oct 2015.

7 November, 2015 © S A Partners Slide 90
Focus & Influence Time Horizons
What we have today-(Micro Management)
Business
Lead Team
Shift Process
& Line
Leaders &
Teams
VS &
Production &
Maintenance
Managers
Monthly Qtrly
Primary
Primary Primary Sec
Sec
Sec Primary Sec
Sec
Annually
See Next Slide for What we Need ►
Primary
Primary Primary
Note-Sec=Secondary Focus
Shift / Daily Weekly

7 November, 2015 © S A Partners Slide 91
Focus & Influence Time Horizons
What we need from tomorrow onwards!
Business Lead
Team
Shift Process
& Line
Leaders &
Teams
VS &
Production &
Maintenance
Managers
Monthly Qtrly
Primary
Primary
Primary Sec
Sec
Annually
Primary
Primary
Note-Sec=Secondary Focus
Shift / Daily Weekly
Sec
Primary
Trust to Delegate

7 November, 2015 © S A Partners Slide 92
The Right Framework & Infrastructure
..to Generate the Right
Behaviours
???
….use of the Right Tools & Techniques
A Sustainable Continuous Improvement
Environment Demands:-

7 November, 2015 © S A Partners
Reasons Why Change Fails
or is not Sustainable-A Health Warning
• Lack of Clear, Consistent Leadership and Direction
• Lack of Planning and Preparation, Measurement and Feedback
• Change Programme has no Clear Vision
• Lack of a thorough Risk Assessment & Countermeasure Definition
• Poor Communication
• Unclear Roles / Responsibilities / Accountabilities (as described & delivered via the Bi-annual , Top Down 30pt Review)
Minimising these 6 x RED risks via correct Governance

7 November, 2015 © S A Partners
9 x other common Reasons Why Change
Fails or is not Sustainable
• Goals are set ,but too far in the Future
• Misunderstanding of what Change is
• The Quick- fix Solution
• The Legacy of Previous Change
• Sacred Cows-‘This is the way we do things around here’
• Fear of Failure
• Employee Resistance
• Ill-Prepared Employees
• Inappropriate and Inadequate external training and advice
7 November, 2015 © S A Partners Slide 95
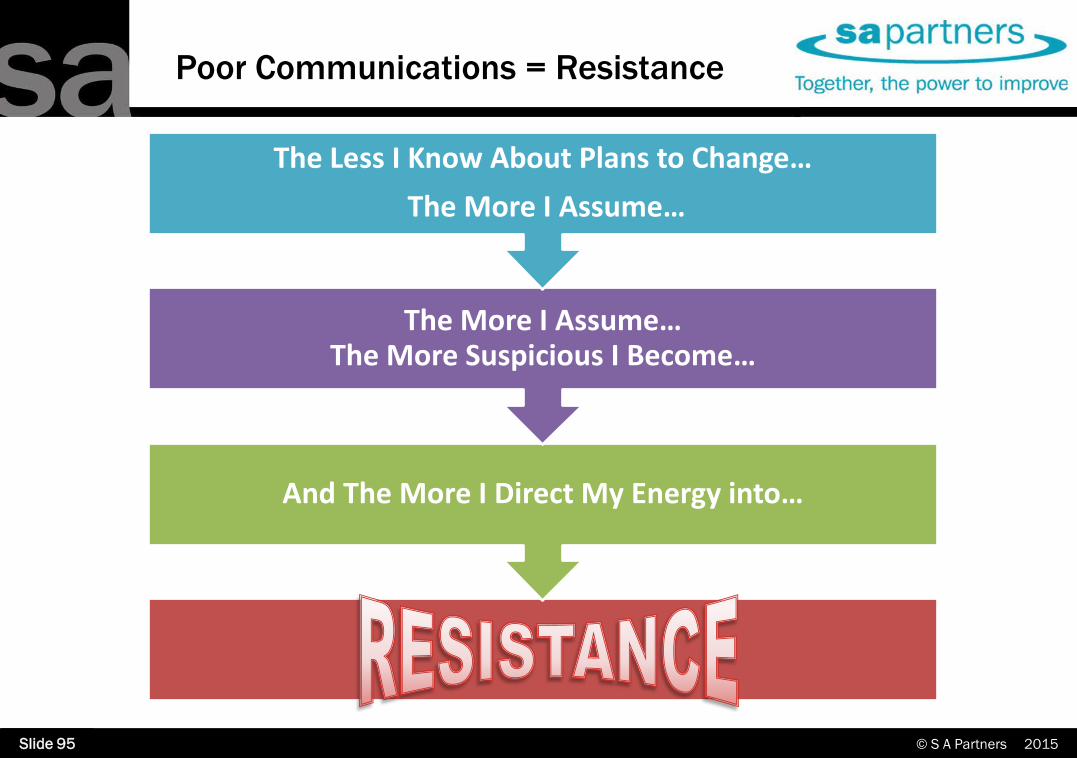
And The More I Direct My Energy into…
The More I Assume… The More Suspicious I Become…
The Less I Know About Plans to Change…
The More I Assume…
Poor Communications = Resistance

7 November, 2015 © S A Partners Slide 96
Effective Communication = Team Work
C o m m u n i c a t i o n
Total Today
Productive People
Maintenance Matter
Being Informed
Being Involved
Being Part of the decision
Process
Being Treated with Respect
Gaining Recognition and
Self Esteem
Being prepared for
change
Being a part of change
Influencing the outcome
This is Our Aspiration !!
► If it Stops Here
We’re in Trouble
If it Stops Here
We’re in Trouble ◄
7 November, 2015 © S A Partners Slide 97
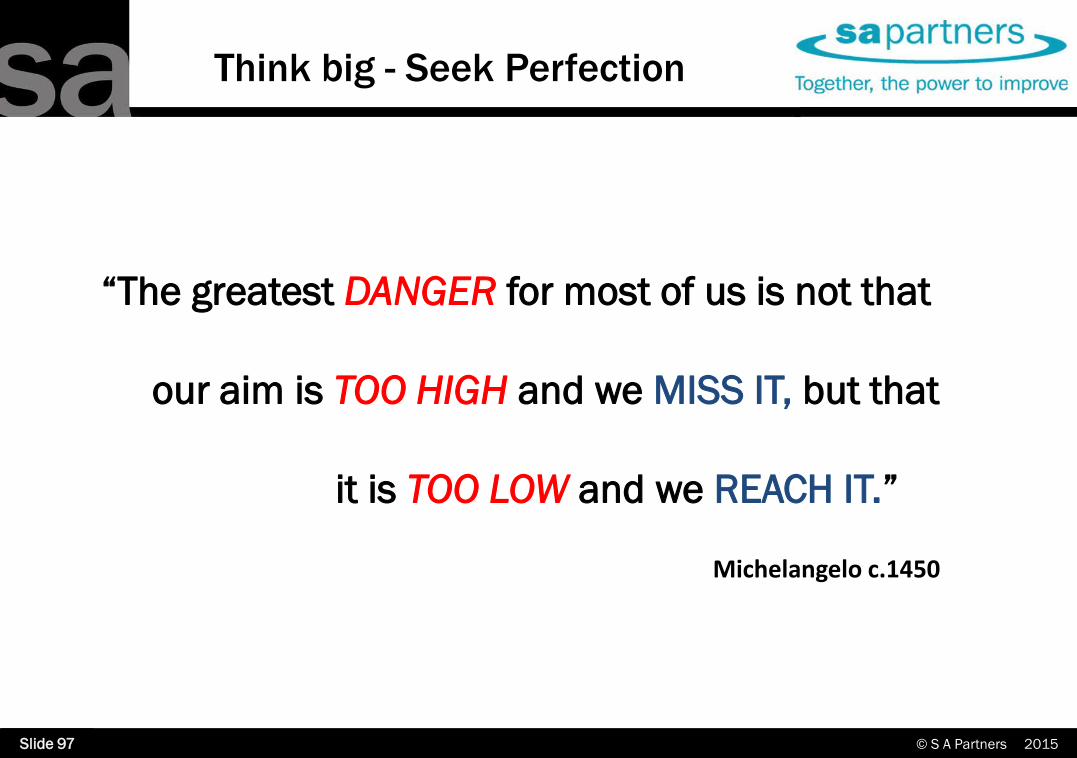
Think big - Seek Perfection
“The greatest DANGER for most of us is not that
our aim is TOO HIGH and we MISS IT, but that
it is TOO LOW and we REACH IT.”
Michelangelo c.1450

7 November, 2015 © S A Partners Slide 98
Think big - Seek Perfection
Anon 2015
“If we Strive for PERFECTION we might not reach
it…….
….But at least we will be `Making Progress”
7 November, 2015 © S A Partners Slide 99
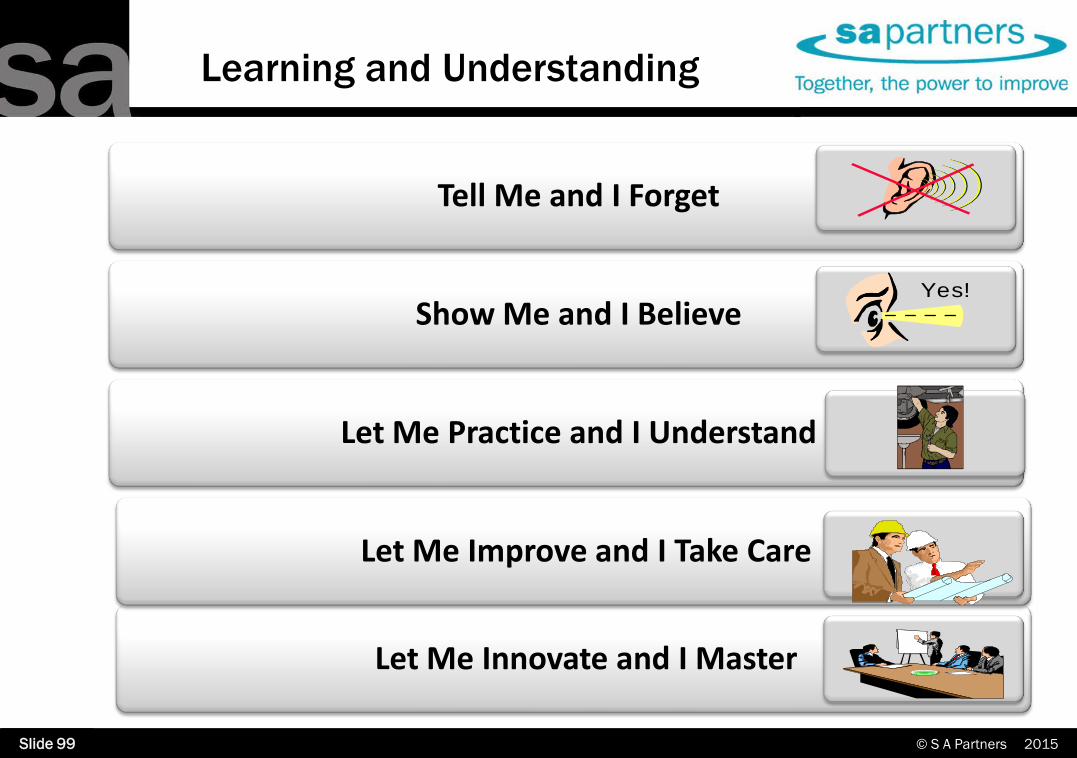
Learning and Understanding
Tell Me and I Forget
Show Me and I Believe Yes!
Let Me Practice and I Understand
Let Me Innovate and I Master
Let Me Improve and I Take Care

7 November, 2015 © S A Partners
Before TPM Activity

7 November, 2015 © S A Partners
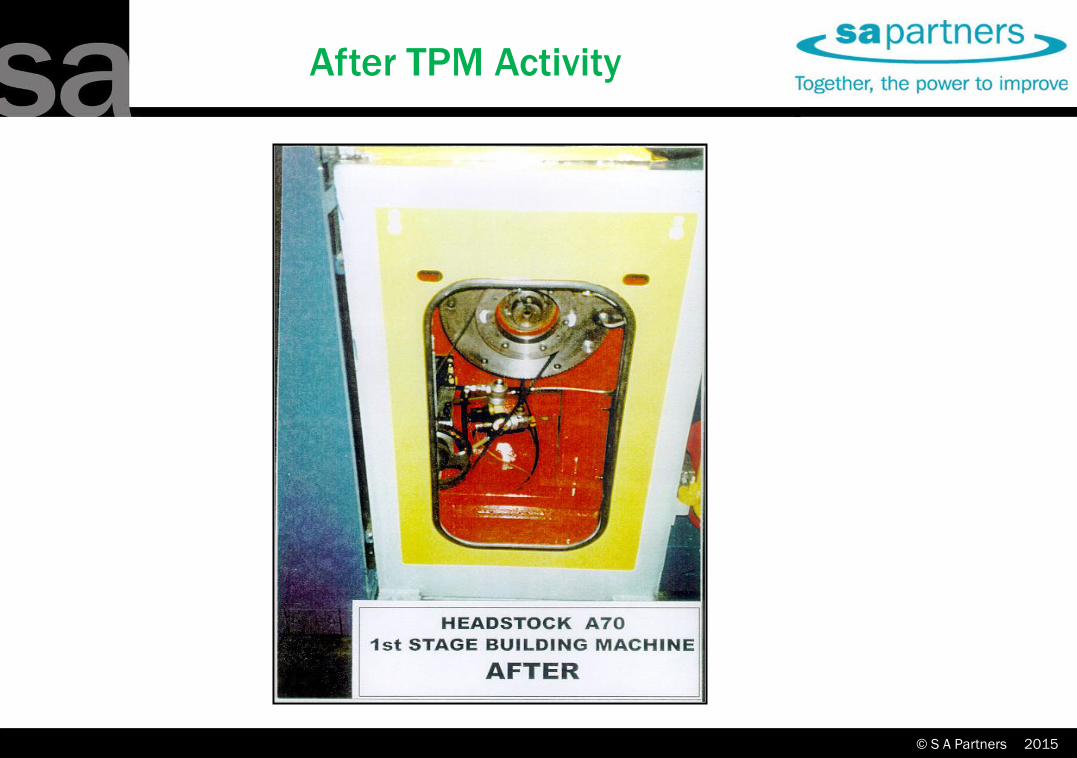
After TPM Activity
16 Weeks Later

7 November, 2015 © S A Partners
Control Panel-Make it easy to do
things right & Difficult to do wrong 102
Before TPM
After TPM

7 November, 2015 © S A Partners
Before TPM
7 November, 2015 © S A Partners
After TPM

7 November, 2015 © S A Partners
Before TPM-out of sight

7 November, 2015 © S A Partners
Before TPM-in sight !!
7 November, 2015 © S A Partners
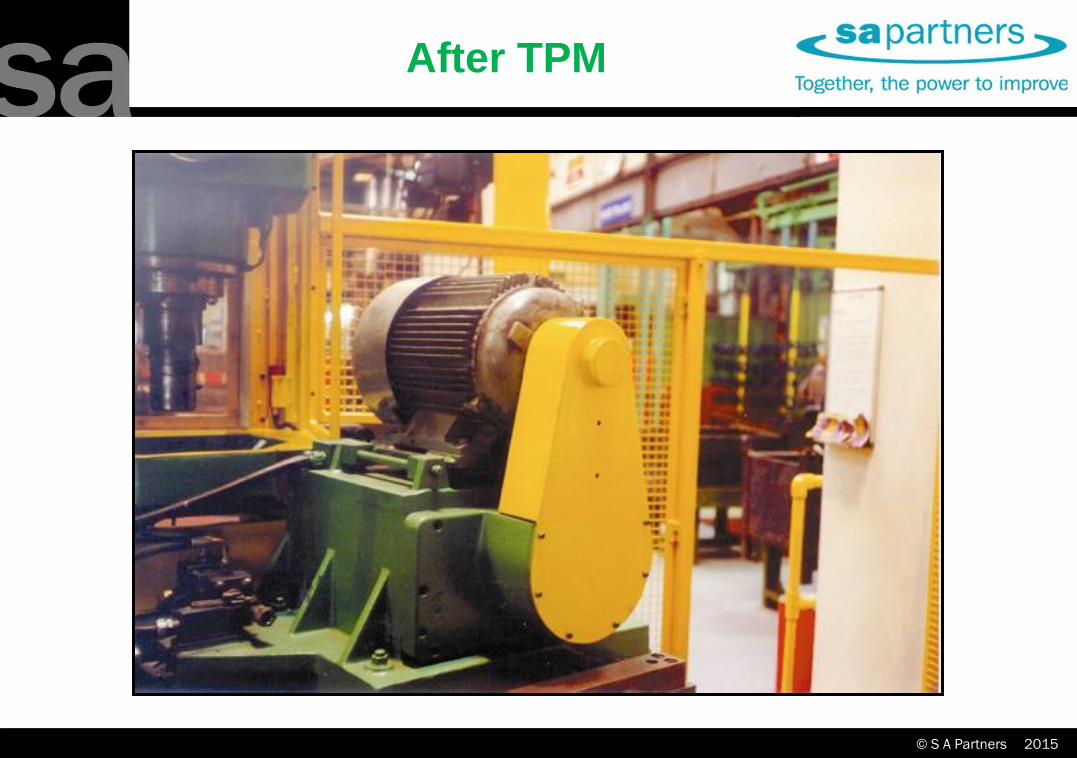
After TPM Activity

7 November, 2015 © S A Partners
Visual Equipment Indicators
BEFORE AFTER

7 November, 2015 © S A Partners
Make it easy to do things right…
BEFORE
xxxxxx
AFTER

7 November, 2015 © S A Partners
TPM Project-OEE Improvements
Pinch Point Asset Mile
Stone
Maturity
Level
%OEE
Start
%OEE
Current
% Increase
in Productive
Capacity
Average OEE of all
12 Assets
1 to 4 35% 64% 83%
Pinch
Point
Asset
Mile Stone
Maturity
Level
Alarms
Start
Alarms
Now
Moulding
Starvation
Hrs -Start
Moulding
Starvation
Hrs- Now
Materials
Handling
System
3 463 /wk 76 /wk 18 hrs /wk 3 hrs /wk
7 November, 2015 © S A Partners
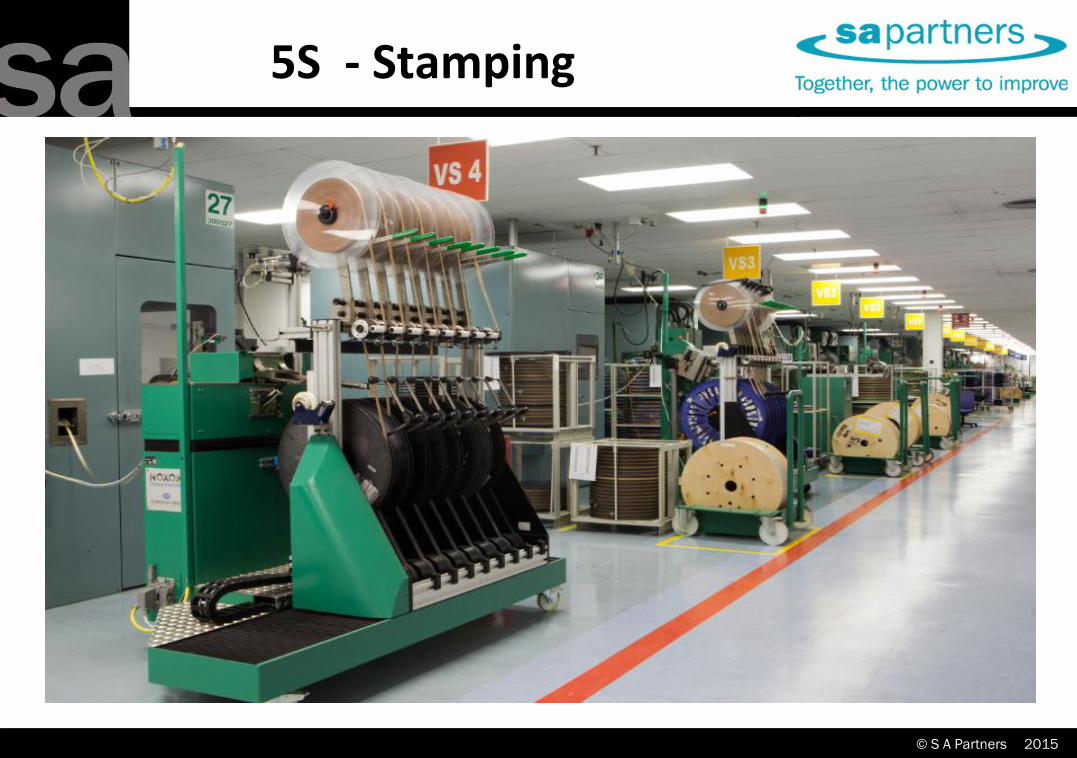
5S - Stamping

7 November, 2015 © S A Partners
5S- Auto Assembly

7 November, 2015 © S A Partners
Milestone Audit Level Achievement
Milestone Audit Level Current Achievement
4
3
2
1

7 November, 2015 © S A Partners
Where would you prefer to work ?
OEE of 30% OEE of 65%

7 November, 2015 © S A Partners
Thank You for Listening and….
Any Questions ???