Embed Size (px)
Citation preview
Is There a Link Between Executive Compensation and Accounting Fraud?
Merle Erickson Graduate School of Business
University of Chicago
Michelle Hanlon* University of Michigan Business School
Edward Maydew
Kenan-Flagler Business School University of North Carolina
February 24, 2004
*Corresponding author: 701 Tappan Street, Ann Arbor, MI 48109. Email: [email protected] Tel: 734.647.4954 Fax: 734.936.0282.
We have benefited from comments fro m Robert Bushman, Ilia Dichev, Arthur Kraft, Mark Lang, Shiva Rajgopal, John Robinson, Steve Rock, Phil Shane, Joel Slemrod and workshop participants at UC-Berkeley, UCLA, the University of Colorado, the University of Florida, London Business School, Michigan State University, the University of North Carolina, the University of Oregon, the University of Texas at Austin, and Washington University. Judson Caskey, Scott Dyreng, and Brad Lindsey provided valuable research assistance. We appreciate funding fro m the University of Chicago Graduate School of Business, the University of Michigan and an Ernst & Young Faculty Fellowship, and the University of North Carolina Kenan-Flagler Business School, respectively.
Is There a Link Between Executive Compensation and Accounting Fraud?
Abstract:
This study investigates the association between the structure of executive compensation and accounting fraud. We study 50 firms accused of accounting fraud by the Securities and Exchange Commission (SEC) during the period 1996-2003 as compared to firms not accused of accounting fraud during the same period. We find that the probability of accounting fraud is increasing in the percent of total executive compensation that is stock-based (termed stock-based mix) after controlling for governance characteristics, financial performance, financial distress, firm size, and the likelihood of management wanting to obtain external financing. We find that while the unconditional likelihood of accounting fraud is small, a one standard deviation increase in the proportion of compensation that is stock-based increases the probability of an accounting fraud by approximately 68%.
For managers to undertake fraud they must perceive positive benefits from it. We examine the extent to which managerial wealth was overstated prior to the alleged fraud by measuring the decline in managerial wealth once the alleged fraud was made public. We find that the value of managerial stock holdings in firms accused of fraud declined by 49% at the median over the six months following the accusation of fraud.
We do not conclude from this evidence that stock-based compensation is inefficient. Rather, the evidence suggests that compensation committees face a trade-off between the positive incentive effects afford by stock-based compensation and the negative effect of increasing the probability of accounting fraud. JEL classification: G30, G32, J33, M41 Keywords: Management compensation, Accounting fraud, Corporate governance, Incentives
2
1. Introduction
Some of the largest alleged accounting frauds in history occurred in the last several years,
leading to the well-known upheaval in the accounting industry and sweeping legislative and
regulatory changes. These events have left legislators, regulators, practitioners, and academics
searching for answers about the causes of these alleged frauds. Understanding the underlying
forces that gave rise to the alleged frauds is a necessary precursor to effectively preventing future
occurrences. Many have suggested that the explanation lies in the incentives and opportunities
for personal gain faced by executives.
One of the incentives that managers might be responding to is the increase in the
proportion of their wealth that is tied to stock-based compensation. It is well documented that
the use of stock options as a form of executive compensation rose dramatically during the 1990s,
as did other forms of pay-for-performance plans such as grants of restricted stock and bonus
plans tied to performance.1 A substant ial body of theoretical work, beginning with Jensen and
Meckling (1976), shows that these plans can be useful in aligning the incentives of managers
with those of shareholders.2 Following this work, many empirical researchers have predicated
their analyses on the premise that granting options is consistent with firm value maximization
1 Ironically, Congress contributed to this trend by changing the tax code in 1993 to favor pay-for-performance
over straight salary in executive compensation. Congress enacted these rules in response to some well-publicized cases of firms increasing their executive compensation while at the same time downsizing their labor forces in the early 1990s. Specifically, Congress created Section 162(m), which eliminated deductions for salaries paid in excess of $1 million for top executives. However, Congress put in an exception for compensation tied to performance, including employee stock options, allowing firms to deduct such compensation without limit.
2 There are also several empirical papers that find results consistent with the incentive alignment view. For example, Brickley, Bhagat and Lease (1985) find that the average stock price reaction to an announcement of a long-term managerial compensation plan is positive (consistent with incentive alignment, although they cannot distinguish between a tax or signaling explanation). Another example includes Lewellen, Loderer and Rosenfield (1985) who find evidence consistent with managers being less likely to make merger bids that lower their stock prices when they hold more stock in the firm, consistent with their interests being aligned with shareholders.
3
(for examples see Demsetz and Lehn, 1985; Himmelberg, Hubbard and Palia, 1999; Core and
Guay, 1999; and Ragjopal and Shevlin, 2002). Indeed, there is even some empirical evidence
that, on average, such executive stock options are effective in generating positive future payoffs
for the firm in terms of accounting earnings (Hanlon et al., 2004).3 However, there are others
that view option compensation differently. Some argue that options are an inefficient way to
compensate managers (Jenter, 2001; Meulbroek, 2001; and Hall and Murphy, 2002), that
managers use option grants for their own benefit (Aboody and Kasznik, 2000; Yermack, 1997),
and that stock options do not exhibit empirical relations consistent with the economic
motivations behind granting them (Yermack, 1995). Further, recent work by Bebchuk, Fried
and Walker (2002) puts forth the possibility that executives have power to influence their own
pay, they use that power to extract rents, and that the desire to camouflage rent extraction might
lead to the use of inefficient pay arrangements that provide suboptimal incentives thereby hurting
shareholder value.
As many observers have noted, it is possible that the timing of the increase in
performance-based compensation and the perceived increase in corporate fraud is no
coincidence. In testimony before the Senate Banking Committee, Alan Greenspan pointed to
compensation structures as creating incentives for misleading reporting, stating that
…the highly desirable spread of shareholding and options among business managers perversely created incentives to artificially inflate reported earnings in order to keep stock prices high and rising. This outcome suggests that the options were poorly structured, and, consequently, they failed to properly align the long-term interests of shareholders and managers, the paradigm so essential for effective corporate governance. (Greenspan, 2002).
3 In addition, in a study of new economy firms, Ittner, Larcker and Lambert (2002) find that lower than expected
stock option grants and/or existing option holdings are associated with lower accounting and stock price performance in subsequent years. However, they find little consistent association between future performance and greater than expected option grants and holdings.
4
Others are more colorful in their language. For example, Michael Jensen noted that for some
firms, “Equity based compensation is like throwing gasoline on a fire.”4 Further, the Financial
Economists Roundtable argued for changes in tax laws that currently encourage the use of stock
options. The group noted that “The popularity of stock options may have created incentives for
managers to manipulate company financial statements in order to drive up stock prices,
contributing to the recent corporate scandals.”5
There is anecdotal evidence consistent with such an association. It was reported that the
CEOs from nine of the corporations targeted by recent government investigations earned a
combined $2 billion from 1997-2001.6 In 1997, the Wall Street Journal quoted Dennis
Kozlowski as saying “Options are a free ride … a way to earn megabucks in a bull market” in
response to a question about why he had never received options in Tyco. Several months later,
Kozlowski reportedly received 3.3 million Tyco options. All told, Kozlowski is alleged to have
obtained more than $400 million in salary, stock grants and gains from the sale of stock options
during his last five years at Tyco.7
In its investigations, the SEC has also alleged links between compensation and fraud. For
example, in its investigation of alleged accounting fraud at Vari-L, the SEC stated: “The
complaint alleges that Sherman, Clark and Hume realized the fruits of Vari-L’s fraudulent
financial reporting by exercising stock options and selling Vari-L stock for substantial profits.”8
In the academic literature, Jensen (2001) demonstrates that non- linearity in pay-for-performance
4 Source: “Boom gives execs and unnatural high.” Chicago Tribune, Section 3, page 11, November 4, 2003.
Jensen also asserted that “overvalued equity is like heroin in the bloodstream of corporate executives.” 5 Source: “Economists Group Is Seeking Repeal of Executive-Pay Curb.” The Wall Street Journal, November 24,
2003. 6 Source: Money Magazine, September 2002, pages 63-64. 7 Source: M. Maremont and L. Cohen, “How Tyco’s CEO Enriched Himself” The Wall Street Journal , August 7,
2002. 8 Source: SEC AAER 1460 (September 27, 2001).
5
systems induces managers to lie and argues that such lying is so pervasive that firms would be
better off adopting solely linear pay-for-performance systems.
Though stock-based compensation likely enhances performance on average, there appear
to be a growing number of observers who perceive accounting fraud to be a negative side effect
from heavy use of stock-based compensation, and employee stock options in particular. The
purpose of this paper is to provide some empirical evidence on the topic. Specifically, we
examine whether the incidence of alleged accounting fraud is higher for firms and executives
that have compensation plans with high proportions of stock option compensation and high pay-
for-performance sensitivity relative to other firms. We also provide evidence that the value of
managerial equity stakes in firms accused of committing fraud were inflated as a result of the
accounting fraud.
We begin by identifying all firms accused of accounting fraud by the SEC during the
period January 1996 to November 2003. After some restrictions based on availability of
executive compensation data, our sample consists of 50 firms accused of accounting fraud by the
SEC during this period. We compare these 50 firms accused of fraud to firms from the same time
period that were not accused of accounting fraud by the SEC.
Using the sample of 50 firms compared to all other firm-years on Execucomp, we find
results consistent with the likelihood of accounting fraud increasing in the extent to which
executives’ pay is tied to performance. Specifically, the likelihood of being accused of fraud is
generally decreasing in the amount of salary paid to executives, increasing in the amount of
stock-based compensation, and increasing in the percent of total executive compensation that is
stock-based (hereafter called stock-based mix). We also find that the sensitivity of the
executives’ stock-based wealth to stock price changes (i.e., the change in the value of the
6
executives’ portfolios of stock, restricted stock, and stock options for a one percent change in
stock price) is positively associated with the likelihood of accounting fraud. Of the control
variables, one that is consistently significant is a variable that proxies for the likelihood that
management will want to obtain external financing in the next two years, with the probability of
fraud increasing in this proxy.
The positive relation between performance based compensation and accounting fraud
survives a battery of robustness tests. For example, the results are robust to industry. When we
add control variables to account for the effects of firm financial performance (e.g., ROE, ROA,
EP, and BM) the conclusions are unchanged. If we only use a subsample of fraud firms for
which we have Execucomp data, the conclusions are unchanged. In addition, the results are
robust to logging the independent variables. Thus, the evidence consistently supports the
conclusion that the level of stock-based compensation, the proportion of stock-based
compensation relative to total compensation, and the sensitivity of executives’ stock-based
wealth to a change in stock price are each positively associated with the likelihood of fraud.
In additional tests, we implement a two-stage instrumental variables procedure to control
for endogeneity. We use the industry average of stock-based mix of compensation as an
instrument for each firm’s stock-based mix of compensation. After implementing this control for
endogeneity, inferences remain the same.
We interpret the weight of the evidence as consistent with the probability of fraudulent
accounting increasing in stock-based compensation. We do not conclude from this evidence that
stock-based compensation is inefficient. Rather, the evidence suggests that compensation
committees face a trade-off between the positive incentive effects afforded by stock-based
7
compensation and the negative side effects, such as increasing the probability of accounting
fraud, than can arise from performance-based compensation.
For managers to engage in accounting fraud, they must perceive positive net benefits
from it. To examine whether the alleged accounting fraud led to overstated managerial wealth
during the fraud, we estimate the portfolio value of the top five managers at different points
surrounding the SEC’s allegation of fraud. Our estimates indicate that the value of managerial
holdings of sample firm equity declined by an average (median) of 39% (49%) during the six
months after announcement of the fraud. The median decrease in wealth of the top five managers
during the six month period is approximately $19 million. These results indicate that the value of
the equity holdings of top management at the firms accused of fraud were substantially
overstated prior to the revelation of the allegedly fraudulent behavior.
The paper proceeds as follows. In section 2 we discuss prior related literature. In section
3 we discuss the sample selection. Section 4 contains the results and Section 5 concludes.
2. Prior research on the determinants of fraud and related issues
While the set of papers focusing on accounting fraud is manageable, the broader context
of this study relates to earnings management, compensation, and corporate governance, for
which there exists a vast set of prior and current research (for reviews see Bushman and Smith,
2001; Murphy, 1999; Pavlik, Scott, and Tiessen, 1993; Sloan, 2001). Consequently, our
discussion of the literature will be in general terms with the exception of some papers that are
very closely related to this paper. For this purpose, we classify research into three categories:
research on the determinants of violations of accounting principles and restatements, research on
compensation and earnings management, and research on compensation and accounting fraud.
8
2.1 Research on violations of accounting principles and research on restatements
Dechow, Sloan and Sweeney (1996) examine the causes and consequences of firms
subject to SEC enforcement actions during the years 1982-1992. They posit the following
potential causes of fraud: 1) external financing needs, 2) proximity to debt covenant violations,
3) governance variables, and 4) executive wealth variables. They find that firms subject to
enforcement actions are more likely to have boards of directors dominated by management, a
CEO who is also Chairman of the Board, a CEO who is also firm’s founder, no audit committee,
and no outside blockholder.
Dechow et al. (1996) find no significant link between executive compensation and
stockholdings and the likelihood of an SEC enforcement action. The executive wealth variables
that Dechow et al. (1996) include are: 1) the total dollar of stock sales made by officers and
directors during the manipulation period, 2) total dollar of stock sales made by the CEO during
the manipulation period, and 3) whether the firm had an earnings-based bonus plan. They find
the following results with respect to executive compensation variables. First, relative to officers
and directors of control firms, officers and directors of firms subject to SEC enforcement actions
did not sell a significantly greater proportion of their firm. Second, the relative value of CEO
sales does not differ from that of the CEOs of control firms. Finally, the existence of an
earnings-based bonus plan does not differ significantly across the SEC and the control samples.
Thus, Dechow et al. (1996) do not find evidence of a link between executive compensation and
SEC enforcement actions. However, Dechow et al. (1996, p. 21) note that
…the firms examined are predominantly from high growth industries. Smith and Watts (1992) suggest that firms in high growth industries are more likely to employ stock-based rather than earnings-based incentive plans. We find that 94.2 percent of the SEC firms, versus only 80 percent of the control firms have stock-based compensation (not reported in the table). This is consistent with SEC firms placing a relatively greater weight on stock price-based incentives versus earnings-based incentives in compensating management, but provides no support
9
for the bonus hypothesis.
The emergence of Execucomp database and the advances in measurements of stock option based
incentives allow us to extend these tests further. For example, at present there are eleven years
of data in the Execucomp database from which to gather detailed disclosures of executive
compensation for a broad sample of firms.
It is important to extend the tests of Dechow et al. using stock option measures of
compensation for at least two reasons. First, Murphy (1999) documents that levels of pay and
pay-performance sensitivities in the U.S. have increased substantially over the past decade,
driven primarily by an explosion in stock-option compensation. Second, although stock options
comprise the fastest growing component of top management compensation, there is no consensus
on the costs and benefits of the incentives provided by executive stock options (see for example
Hanlon, Rajgopal and Shevlin, 2004; Rajgopal and Shevlin, 2002; Yermack, 1995; Jenter, 2001;
Meulbroek, 2001; Hall and Murphy, 2002; Ittner, Lambert and Larcker, 2003).
Other papers that are concurrent with or extend Dechow et al. (1996) include Beasley
(1996), Summers and Sweeney (1998), Beneish (1999), and Bradshaw, Richardson and Sloan
(2001). Beasley (1996) compares firms that were accused of fraud to a control sample of non-
fraud firms, matched by size, industry and time. His sample of fraud firms comes from the
period 1982-1991 and is comprised of 67 firms identified through AAERs and 8 firms identified
from the Wall Street Journal articles. Consistent with Dechow et al. (1996), Beasley (1996)
finds that outside directors decrease the probability of fraud, as does higher tenure and ownership
by outside directors. He finds that the presence of an audit committee has no effect on the
probability of fraud.
10
Like Dechow et al. (1996), Beneish (1999) examines firms subject to enforcement actions
by the SEC. Beneish (1999) extends Dechow et al. (1996) by examining whether managers
overstate their firms’ earnings and then sell their personal holdings (i.e., stock and options) in the
firm at inflated prices. Beneish (1999) finds that managers of firms sub ject to AAERs are more
likely to sell their own stock during periods when the earnings management is taking place than
are managers of control firms. In contrast to Dechow et al. (1996), Beneish (1999) does not find
evidence that managers are motivated to inflate earnings in advance of an equity issuance by the
firm.
Bradshaw, Richardson and Sloan (2001) investigate whether analysts and auditors utilize
information about future earnings performance in accruals. They also extend Dechow et al.
(1996) and find that high accruals are associated with a higher incidence of SEC enforcement
actions for GAAP violations. Finally, Summers and Sweeny (1998) investigate the relation
between insider trading and fraud and find that in the presence of fraud, insiders reduce their
holdings of company stock through high levels of selling activity as measured by either the
number of transactions, the number of shares sold, or the dollar amount of shares sold.
Several studies examine the factors associated with restatements. While in most cases the
behavior underlying a restatement does not rise to the level of fraud, restatements possibly
indicate some violation or disagreement about the application of Generally Accepted Accounting
Principles (GAAP). Thus, there is likely common ground between the factors associated with
restatements and the factors associated with fraud. At least four recent papers investigate
restatements.
First, Palmrose and Scholz (2002) examine restatements. Among other things, they find
that out of 492 restatements, only 52 (11%) result in an AAER issued against the restatement
11
firm. Further, only 186 (38%) result in litigation. This is consistent with restatements reflecting
a wide variety of behavior ranging from genuine disagreements ove r the application of GAAP to
a specific set of transactions to behavior constituting fraud.
Second, Agrawal and Chadha (2002) investigate the probability of an earnings
restatement as a function of a number of hand-collected corporate governance metrics. Among
other things, they find that most restatements are initiated by the company rather than by
regulators (141 initiated by the company versus 21 initiated by regulators).
Third, Richardson, Tuna, and Wu (2002) investigate 440 restatements by 225 firms from
1971-2000. Richardson et al. (2002) compare restatement-years to all other Compustat years to
avoid problems with nonrandom matched samples, citing Zmijewski (1984) and Palepu (1986).
Compared to non-restatement firms they find that restatement firms have higher market-to-book
and price-to-earnings ratios, higher leverage, and greater use of external financing. They also
find that restatement firms have longer strings of positive quarterly earnings growth and longer
strings of positive quarterly earnings surprises than non-restatement firms.
Finally, Kedia (2003) examines the option grants and exercises of the top executives of
224 firms that announce restatements of earnings due to accounting irregularities. Keida finds
that firms that both 1) announce a restatement and 2) have a negative market response to the
announcement had granted approximately 50% more options to their top executives in the years
prior to the restatements. Moreover, the executives of these firms also exercised more options
than did the executives of a control sample of firms matched by size and industry. Kedia (2003)
concludes that private gains in option portfolios of the top executives might have given them
incentives for aggressive interpretation of GAAP.
12
2.2. Research on executive compensation and earnings management
The study of compensation and earnings management dates back to Healy (1985) and
Watts and Zimmerman (1986).9 Our paper relates to those studies and recent working papers
that investigate whether there is a link between earnings management and executive
compensation or weak corporate governance. For example, Cheng and Warfield (2002) find that
the magnitude of abnormal accruals is positively related to the magnitude of stock-based
compensation. Further, they find a lower earnings/returns association in firms that use higher
stock based compensation than other firms. Ke (2002) examines the possible link between CEO
compensation and two empirical regularities: 1) the tendency of firms to report small earnings
increases more often than they report small earnings decreases and 2) the tendency of firms to
report long strings of increasing earnings. Ke (2002) finds that firms whose CEOs have high
amounts of equity incentives related to unrestricted stock and whose CEOs have options
immediately exercisable both exhibit this behavior more than firms whose CEOs have low
amounts of these incentives. Gao and Shrieves (2002) find that the absolute value of
discretionary accruals is affected by executive compensation structure. Earnings management
intensity is increasing in the amount of options and bonuses and decreasing in salaries.
These studies have the advantage that they can examine large samples and they are
certainly useful for better understand ing earnings management across a broad set of firms. The
disadvantage of these studies is that they for the most part rely on models of discretionary
accruals, which have well known limitations. While these studies are useful, none of them focus
9 There are also studies of compensation and other types of managerial action. For example, Bizjak, Brickley,
and Coles (1993) investigate how concern over current stock price may motivate managers to use observable investments to manipulate the market’s inferences about the firm resulting in either over- or under-investment. They find evidence consistent with firms having high information asymmetries favoring contracts that focus on long-run stock returns (current and future) over contracts that focus on near term stock returns alone.
13
on accounting fraud – the most extreme form of earnings management and the behavior that lead
to the downfall of Arthur Andersen and regulatory changes by Congress, e.g., the Sarbanes-
Oxley Act and the formation of the Public Company Accounting Oversight Board (PCAOB).
Using AAERs allows us to investigate a sample of firms that the SEC alleges to have engaged in
accounting fraud. As a result, we are not forced to identify firms engaged in accounting related
malfeasance using models that estimate earnings management.
2.3. Research on compensation and accounting fraud
Despite the importance of understanding the factors associated with accounting fraud, we
are aware of no published research on the possible link between compensation and accounting
fraud, other than what is in the studies mentioned above. However, there are related
contemporaneous working papers. For example, Johnson, Ryan, and Tian (2003) present
univariate comparisons between executives of firms accused of fraud and executives of firms not
accused of fraud. They find that executives of firms accused of fraud had higher financial
incentives to increase stock price than did executives of firms not accused of fraud. In addition,
Goldman and Slezak (2003) develop an agency model in which stock-based compensation is a
double-edged sword, inducing managers to exert productive effort but also inducing managers to
divert valuable resources to misrepresent performance. Finally, Peng and Roell (2003) examine
the role of executive compensation in inducing management behavior that triggers private
securities litigation and find that incentive pay in the form of options (but not restricted stock or
base pay) increase the probability of lawsuit incidence. They also find evidence consistent with
accounting earnings management (measured as discretionary accruals) being a mediating factor
in this relation.
14
3. Sample selection and description
To identify firms accused of accounting fraud, we searched SEC Accounting and
Auditing Enforcement Releases (AAERs) for the word “fraud” during the years 1996-2003.
AAERs are summaries of the SEC’s accounting-based enforcement actions and describe the
SEC’s investigations of alleged violations of accounting provisions of the securities laws.
AAERs include several types of alleged violations by firms and/or their employees including
fraud, non-fraudulent but reckless or grossly negligent disclosure, and instances where the
company failed to comply with reporting provisions of the Securities Acts but was neither
fraudulent nor grossly negligent (Feroz et al. 1991).10
Table 1 summarizes our sample selection procedure. From the set of AAERs during the
period January 1, 1996 to November 19, 2003, we identify 287 instances (excluding repeat
accusations) in which the SEC uses the word “fraud.” We exclude AAERS that are not relevant
for the subject of this inquiry, such as alleged fraud by brokers and dealers, government
personnel, or charitable organizations. We also require sufficient disclosure about executive
compensation to compute our estimates of compensation mix and executive wealth sensitivity to
stock price changes. We first look to the S & P Execucomp database (Execucomp). For the
firms without Execucomp data, whenever possible we hand-collect the necessary data from
proxy statements filed with the SEC.11 This results in a sample of 50 firms that are both accused
of fraud by the SEC and for which we have compensation data. Panel B of table 1 presents the
name of each of the 50 sample firms accused of fraud by the SEC. As the list indicates, the
10 For more detail on AAER and the SEC’s process in investigating firms, see Pincus, Holder, and Mock (1988),
Feroz, Park and Pastena (1991) and Dechow, Sloan and Sweeney (1996). 11 Note that data are hand-collected for 22 firms. Because the sample of firm-years not accused of fraud are all
from the Execucomp database, as a sensitivity test we estimate the regression results excluding the hand-collected observations to eliminate any potential bias. We find results that are qualitatively similar—see section 4.4. and table 5C for further discussion and tabulation of the results.
15
sample captures the well-publicized alleged accounting frauds of recent years as well as some of
those that were less publicized.
In table 2 we break down the number of fraud and non-fraud firms by industry (panel A)
and by year (panel B). To make panel A of manageable size, we break out only those two-digit
SIC codes for which we have one or more firms accused of fraud. Most two digit SIC codes
have no firms accused of fraud by the SEC during the time period in this study and we lump
those together into an “all other” category.
The first observation one can make regarding panel A is that the incidence of fraud does
not seem to be highly concentrated in a few industries. The 50 firms accused of fraud are spread
over 20 different two-digit SIC codes. A reasonable expectation would have been that entire
industries become prone to fraud at the same time due to common external influences and
common governance and compensation structures across firms in a given industry. But we do
not observe much industry clustering of alleged fraud.
The industry with the largest absolute number of alleged frauds is business services (SIC
73), which has 10 firms accused of fraud. Business services firms are over twice as likely as the
average firm to be accused of fraud, accounting for 8.44 percent of the non-fraud firms and 20
percent of the alleged frauds. Miscellaneous retail (SIC 59) is also over-represented in the
alleged fraud sample; firms in this industry are about five times more likely than the average firm
to be accused of fraud, accounting for 1.9 percent of the non-fraud sample and 10 percent of the
fraud sample. Other over-represented industries in the fraud sample include communications
(SIC 48) and fabricated metal (SIC 34). Overall, however the data in this table suggest that
fraud is not specific to any particular industry.
16
We excluded banks and savings and loans from our sample because an important control
variable – the proxy for the desire for external financing - was not available on Compustat for
these firms. However, this restriction only excluded three firms, suggesting that unlike the
alleged accounting frauds of the late 1980s (see Erickson, Mayhew, and Felix, 2000), the alleged
frauds of the 1990s and early 2000s do not appear to be concentrated in banks and savings and
loans.
Panel B of table 2 presents the breakdown of SEC fraud allegations by year, where year
represents the first year the alleged fraud took place (not the year in which the SEC made the
allegation). The alleged frauds begin as early as 1992 and as late as 2001. The number of frauds
beginning in a given year range from a low of one in 1993 to a high of ten in 1997. Overall,
there is no discernable trend over time and the alleged frauds are not overly clustered in any
given year.
For each of the fraud firms, we collected the disclosure of the method of earnings
overstatement as documented by the SEC (while in theory the SEC could issue and AAER for
understating earnings, all of the AAERs that we observed were for overstating earnings). In
table 3, we summarize the types of accounting manipulations used by sample firms to overstate
earnings by frequency. As this table indicates, 60.9 percent of the firms were accused of
overstating their revenue. Specific SEC accusations include: reporting “false revenues,”
“improperly recognizing” revenue, “channel stuffing,” “prematurely recognizing revenue,”
“inflating” revenue, “recording revenue from the sale … prior to shipment,” and recognizing
revenue on “invalid or nonexistent sales.” The second most common accusation consisted of
various types of cost or expense understatement, applying to 37 percent of the firms. Examples
of such expense understatement accusations contained in SEC AAERs include: “created
17
fictitious assets,” “overstating inventory,” “improperly capitalizing expenses,” “improper
capitalization of millions of dollars of company expenses,” and ”including fake items in
inventory.” Other more specific sources of overstatement include purchase accounting or
merger related accounting entries (e.g., “cookie jar reserves”), barter transactions, lease
accounting manipulation, and overstatement of inventory.
We also examine the level of management accused in the AAER. In untabulated results,
we find that the highest levels of management are most often accused of involvement in the
accounting fraud. In more than 50% of the cases, the CEO or the CFO was accused of
perpetrating the accounting fraud that led to the AAER.
4. Tests of the re lation between executive compensation and alleged accounting fraud and estimates of managerial benefits from accounting fraud
4.1. Variable measurement – relation between executive compensation and accounting fraud
For the firms accused of fraud, all variables are measured in the year immediately
preceding the first alleged fraud year. For some firms, the fraud years started prior to 1992
however and thus, data on Execucomp is not available for these firm-years. In those cases and
where the fraud started no more than two years earlier, we substitute the year 1992 for the year
prior to fraud in order to keep the firm in the sample. All compensation variables are aggregated
over the entire management team listed in the proxy statement for the fiscal year. Generally, this
is the five most highly compensated executives. The variables are defined as follows:
FRAUD = indicator variable set equal to one if the firm is accused of fraud and zero otherwise.
SALARY = dollar value of base salary earned by the top five executives during the
fiscal year (Execucomp variable Salary).
18
BONUS = the dollar value of a bonus earned by the top five executives during the
fiscal year (Execucomp variable Bonus). STOCK- BASED COMP = the sum of the value of the current year stock option grants (valued using
the Black-Scholes method12) and the market value of restricted stock granted during the fiscal year (Execucomp variables Blk_value and Rstkgrnt).
STOCK-BASED MIX = the ratio of STOCK-BASED COMP to the total of current year
compensation (SALARY, BONUS, STOCK-BASED COMP). In other words the proportion of total current compensation that comes from stock based compensation.
SENSITIVITY = the sensitivity of the top five managers’ stock, restricted stock, and stock
option portfolio values to a one percent change in the stock price. (We discuss this measure further below.)
CEO=CHAIR = indicator variable that is set to one if the Chairman of the Board is also the
chief executive officer (CEO). NUMMTGS = the number of board meetings held during the fiscal year (Execucomp
variable Nummtgs). FINANCING = An ex ante measure of a firm’s desire for external financing. It is an
indicator variable coded 1 if the firm’s variable FREECASH is less than -0.5 and 0 otherwise. (We discuss this measure further below.)
LEVERAGE = total debt (Compustat data item #34+#9) scaled by total assets (data item
#6). MVE = the market value of equity of the firm (Compustat data item #199 times
#25). ALTMAN Z SCORE = proxy for risk of financial distress calculated based on Altman (1968) as
updated by Begley, Ming and Watts (1996)13 12 For more information on how Execucomp calculates the Black-Scholes value of stock option grants see
http://umi.compustat.com/docs -mi/help/execdefs_alpha.htm under Black-Scholes Methodology. The firms for which we had to hand-collect the data have a value calculated using this methodology as closely as possible.
13 We also estimated the regressions using the proxy for distress as developed by Shumway (2001) and our inferences are unchanged. In addition, in sensitivity analyses we include other variables that control for firm performance and likely capture a significant portion of distress risk—return on assets, return on equity, book-to-market, and earnings-to-price. Again, after including these controls our results are essentially unchanged. See
19
4.1.1. Sensitivity
We define SENSITIVITY as the expected change in the top five executives’ wealth from a
one percent change in stock price. This change in wealth consists of the sum of the change in the
value of the executives’ employee stock option portfolios, restricted stock holdings, and stock
holdings. We aggregate across the three to derive a total dollar measure of the sensitivity (slope)
for each executive. We aggregate across the firm’s top five executives to get a total dollar
measure for the top management team of the firm. The wealth changes from stock and restricted
stock are estimated by multiplying the market value of the stock holdings at year-end (the year
prior to the alleged accounting fraud for the alleged fraud firms) by one percent.
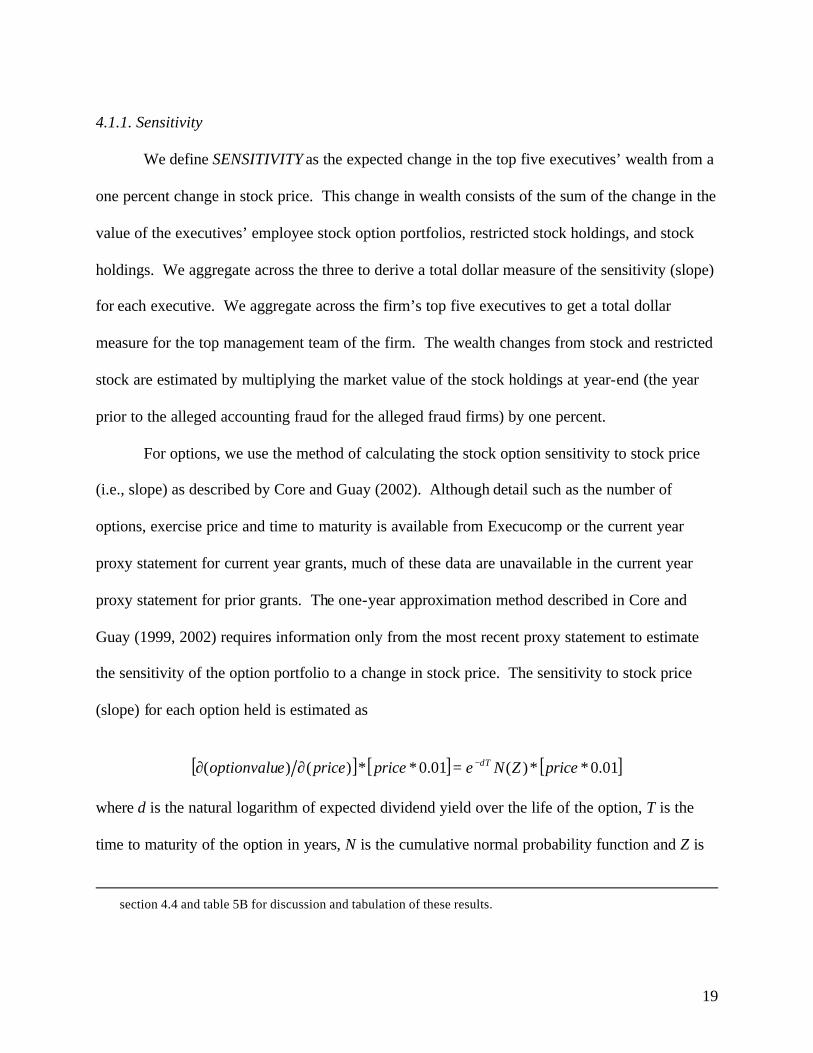
For options, we use the method of calculating the stock option sensitivity to stock price
(i.e., slope) as described by Core and Guay (2002). Although detail such as the number of
options, exercise price and time to maturity is available from Execucomp or the current year
proxy statement for current year grants, much of these data are unavailable in the current year
proxy statement for prior grants. The one-year approximation method described in Core and
Guay (1999, 2002) requires information only from the most recent proxy statement to estimate
the sensitivity of the option portfolio to a change in stock price. The sensitivity to stock price
(slope) for each option held is estimated as
[ ] [ ] [ ]01.0**)(01.0**)()( priceZNepricepriceeoptionvalu dT−=∂∂
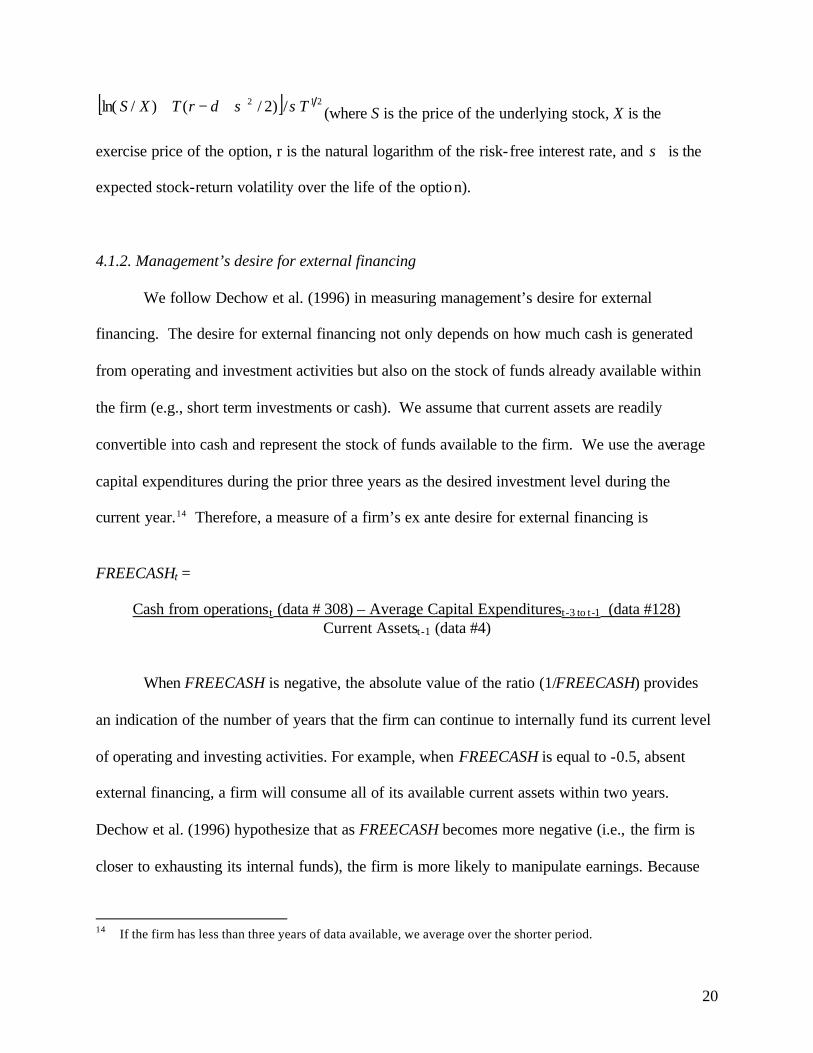
where d is the natural logarithm of expected dividend yield over the life of the option, T is the
time to maturity of the option in years, N is the cumulative normal probability function and Z is
section 4.4 and table 5B for discussion and tabulation of these results.
20
[ ] 212 /)2/()/ln( TdrTXS σσ+−+ (where S is the price of the underlying stock, X is the
exercise price of the option, r is the natural logarithm of the risk-free interest rate, and σ is the
expected stock-return volatility over the life of the option).
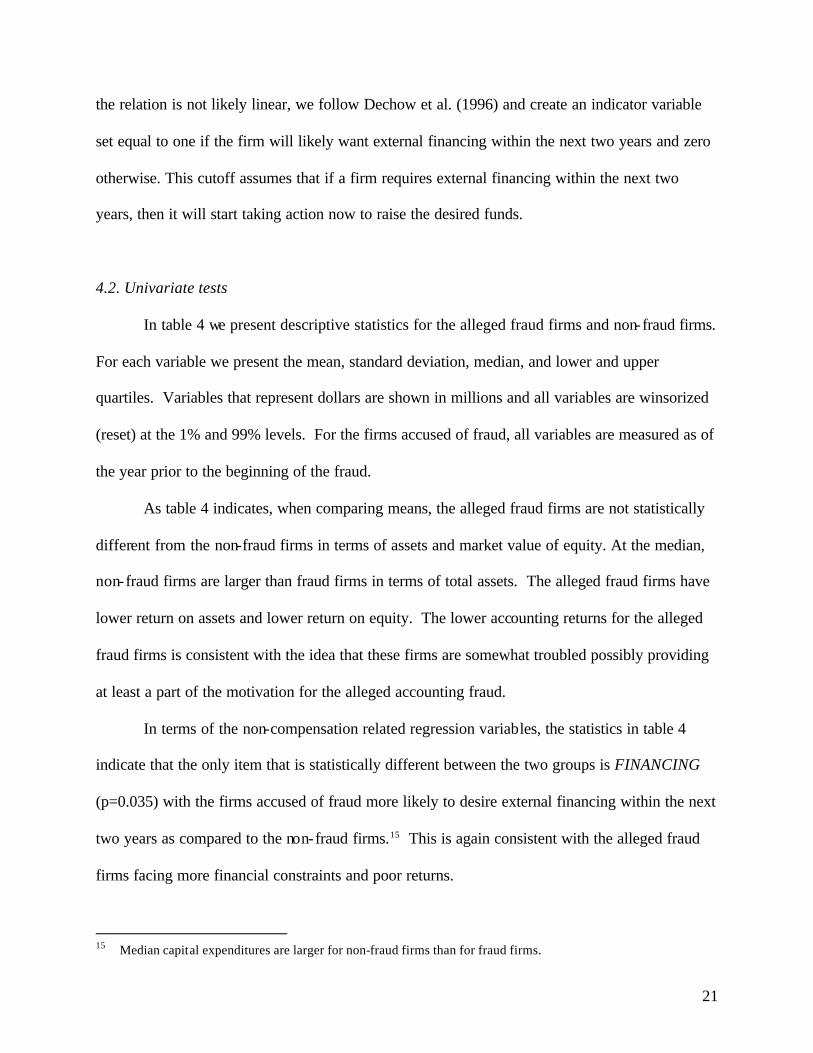
4.1.2. Management’s desire for external financing We follow Dechow et al. (1996) in measuring management’s desire for external
financing. The desire for external financing not only depends on how much cash is generated
from operating and investment activities but also on the stock of funds already available within
the firm (e.g., short term investments or cash). We assume that current assets are readily
convertible into cash and represent the stock of funds available to the firm. We use the average
capital expenditures during the prior three years as the desired investment level during the
current year.14 Therefore, a measure of a firm’s ex ante desire for external financing is
FREECASHt =
Cash from operationst (data # 308) – Average Capital Expenditurest-3 to t-1 (data #128) Current Assetst-1 (data #4)
When FREECASH is negative, the absolute value of the ratio (1/FREECASH) provides
an indication of the number of years that the firm can continue to internally fund its current level
of operating and investing activities. For example, when FREECASH is equal to -0.5, absent
external financing, a firm will consume all of its available current assets within two years.
Dechow et al. (1996) hypothesize that as FREECASH becomes more negative (i.e., the firm is
closer to exhausting its internal funds), the firm is more likely to manipulate earnings. Because
14 If the firm has less than three years of data available, we average over the shorter period.
21
the relation is not likely linear, we follow Dechow et al. (1996) and create an indicator variable
set equal to one if the firm will likely want external financing within the next two years and zero
otherwise. This cutoff assumes that if a firm requires external financing within the next two
years, then it will start taking action now to raise the desired funds.
4.2. Univariate tests
In table 4 we present descriptive statistics for the alleged fraud firms and non-fraud firms.
For each variable we present the mean, standard deviation, median, and lower and upper
quartiles. Variables that represent dollars are shown in millions and all variables are winsorized
(reset) at the 1% and 99% levels. For the firms accused of fraud, all variables are measured as of
the year prior to the beginning of the fraud.
As table 4 indicates, when comparing means, the alleged fraud firms are not statistically
different from the non-fraud firms in terms of assets and market value of equity. At the median,
non-fraud firms are larger than fraud firms in terms of total assets. The alleged fraud firms have
lower return on assets and lower return on equity. The lower accounting returns for the alleged
fraud firms is consistent with the idea that these firms are somewhat troubled possibly providing
at least a part of the motivation for the alleged accounting fraud.
In terms of the non-compensation related regression variables, the statistics in table 4
indicate that the only item that is statistically different between the two groups is FINANCING
(p=0.035) with the firms accused of fraud more likely to desire external financing within the next
two years as compared to the non-fraud firms.15 This is again consistent with the alleged fraud
firms facing more financial constraints and poor returns.
15 Median capital expenditures are larger for non-fraud firms than for fraud firms.
22
With regard to the compensation variables, the data in table 4 indicate that executives at
the alleged fraud firms receive salaries and bonuses that are not significantly different than
executives at non-fraud firms.16
The executives at the alleged fraud firms receive greater compensation in terms of stock
based compensation (measured as the sum of the Black-Scholes value of stock option grants and
the market value of restricted stock grants) (p=0.013). We also find that executives at the alleged
fraud firms receive a higher percentage of current year compensation on average from stock
based pay (57%) as compared to the non-fraud firm executives (40.7%) (p=0.0001). However,
when we compare the sensitivity of the executives’ wealth from their stock option, restricted
stock and stock portfolios to a 1% change in stock price the data reveal that there is not a
significant difference (p>.10) between the average sensitivities of the two groups.
Finally, when we compare the market values of the holdings of stock and restricted stock
by the executives at the two sets of firms we find there is no statistical difference between stock
holdings and restricted stock holdings. However, the alleged fraud firm executives have a
marginally higher average intrinsic value (market price less exercise price as of the end of the
fiscal year) of stock option holdings as compared to executives at non-fraud firms (p=0.026).17
However, the difference in this variable is not significant at the median.
16 As a sensitivity test, we also estimate scaled compensation measures and use these variables in the regression
tests in table 5. When scaled, the denominator is the executives’ firm specific wealth (the sum of the market value of stock and restricted stock held, the intrinsic value of all the in the money stock options held, and three times the amount of salary and bonus received in the current year). The scaled measure normalizes the variable relative to an estimate of the executive’s wealth. The scaling is intended to make the numbers comparable between executives of large firms that are likely more wealthy (e.g., Bill Gates, Jack Welch) to executives at small firms to whom an identical amount of compensation may represent a much larger proportion of wealth and thus provide very different incentives. The regression results analogous to those in table 5 are qualitatively the same with the scaled as compared to the unscaled measures.
17 One potential criticism of the metrics in table 4 and tests in table 5 is that they do not take into account industry differences in compensation practices. For example, software and biotech firms typically make heavy use of performance-based compensation relative to firms in other industries. It is possible that the likelihood of an executive committing accounting fraud is not so much a function of his compensation package relative to that of the average package of the entire market, but the degree to which his compensation package differs from
23
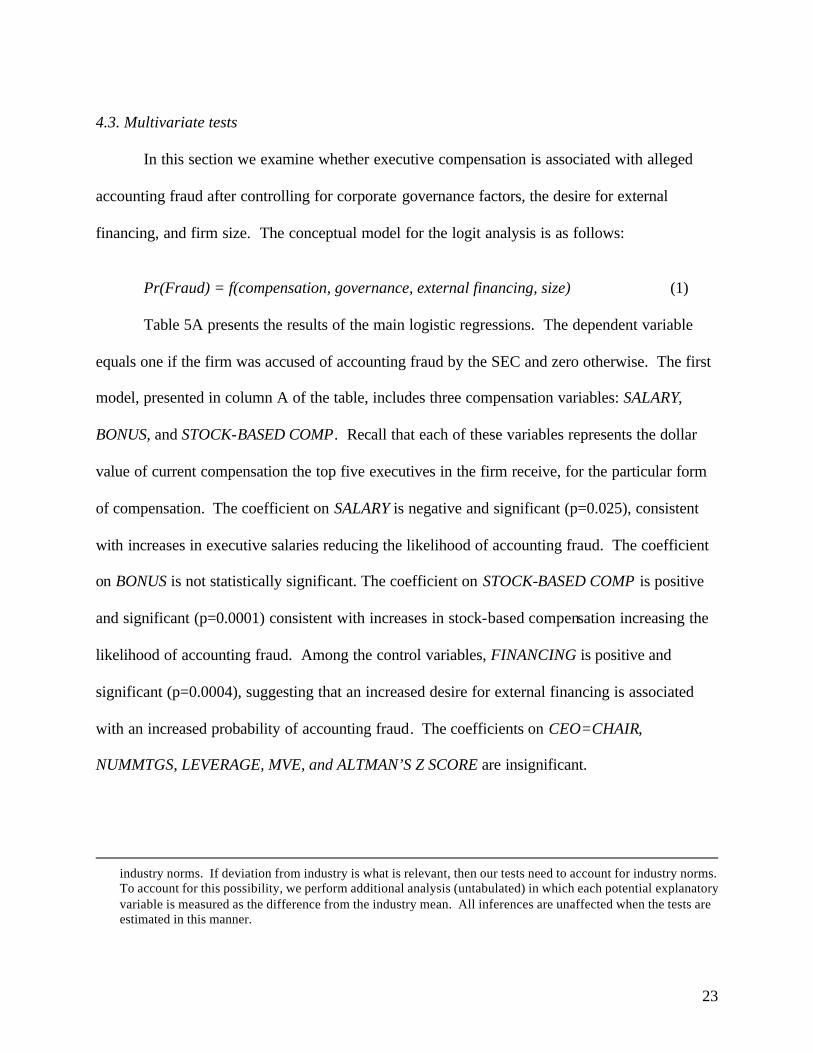
4.3. Multivariate tests
In this section we examine whether executive compensation is associated with alleged
accounting fraud after controlling for corporate governance factors, the desire for external
financing, and firm size. The conceptual model for the logit analysis is as follows:
Pr(Fraud) = f(compensation, governance, external financing, size) (1)
Table 5A presents the results of the main logistic regressions. The dependent variable
equals one if the firm was accused of accounting fraud by the SEC and zero otherwise. The first
model, presented in column A of the table, includes three compensation variables: SALARY,
BONUS, and STOCK-BASED COMP. Recall that each of these variables represents the dollar
value of current compensation the top five executives in the firm receive, for the particular form
of compensation. The coefficient on SALARY is negative and significant (p=0.025), consistent
with increases in executive salaries reducing the likelihood of accounting fraud. The coefficient
on BONUS is not statistically significant. The coefficient on STOCK-BASED COMP is positive
and significant (p=0.0001) consistent with increases in stock-based compensation increasing the
likelihood of accounting fraud. Among the control variables, FINANCING is positive and
significant (p=0.0004), suggesting that an increased desire for external financing is associated
with an increased probability of accounting fraud. The coefficients on CEO=CHAIR,
NUMMTGS, LEVERAGE, MVE, and ALTMAN’S Z SCORE are insignificant.
industry norms. If deviation from industry is what is relevant, then our tests need to account for industry norms. To account for this possibility, we perform additional analysis (untabulated) in which each potential explanatory variable is measured as the difference from the industry mean. All inferences are unaffected when the tests are estimated in this manner.
24
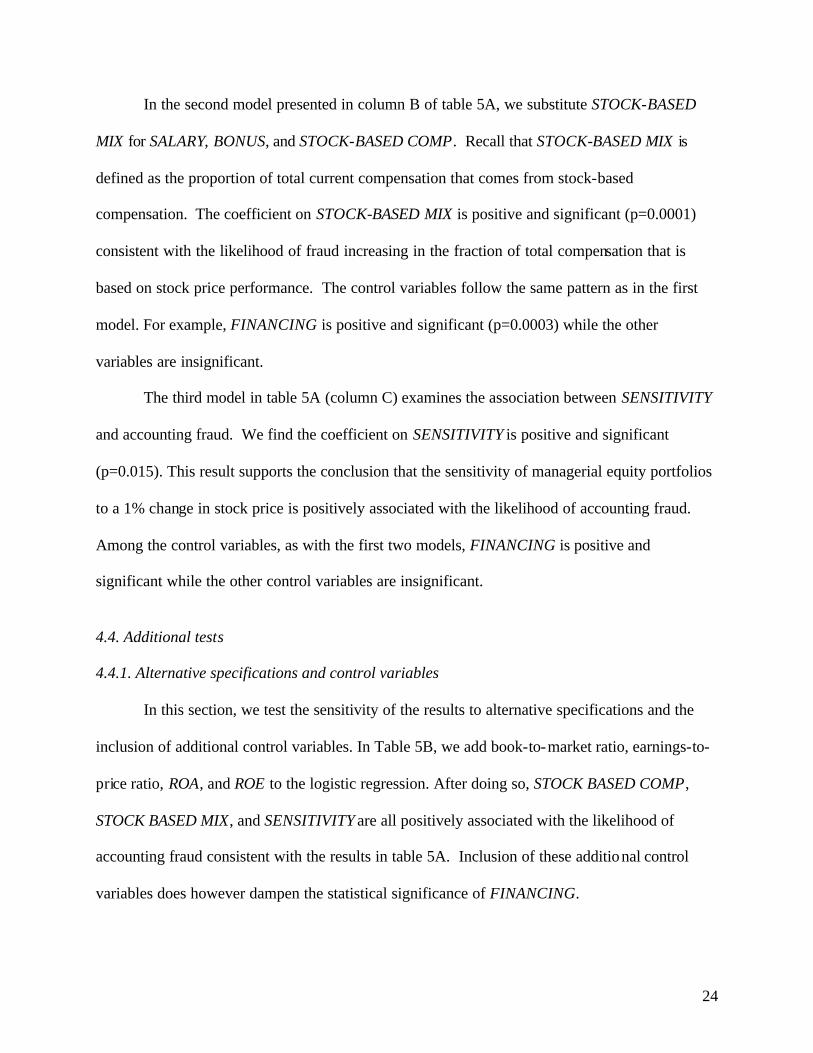
In the second model presented in column B of table 5A, we substitute STOCK-BASED
MIX for SALARY, BONUS, and STOCK-BASED COMP. Recall that STOCK-BASED MIX is
defined as the proportion of total current compensation that comes from stock-based
compensation. The coefficient on STOCK-BASED MIX is positive and significant (p=0.0001)
consistent with the likelihood of fraud increasing in the fraction of total compensation that is
based on stock price performance. The control variables follow the same pattern as in the first
model. For example, FINANCING is positive and significant (p=0.0003) while the other
variables are insignificant.
The third model in table 5A (column C) examines the association between SENSITIVITY
and accounting fraud. We find the coefficient on SENSITIVITY is positive and significant
(p=0.015). This result supports the conclusion that the sensitivity of managerial equity portfolios
to a 1% change in stock price is positively associated with the likelihood of accounting fraud.
Among the control variables, as with the first two models, FINANCING is positive and
significant while the other control variables are insignificant.
4.4. Additional tests 4.4.1. Alternative specifications and control variables In this section, we test the sensitivity of the results to alternative specifications and the
inclusion of additional control variables. In Table 5B, we add book-to-market ratio, earnings-to-
price ratio, ROA, and ROE to the logistic regression. After doing so, STOCK BASED COMP,
STOCK BASED MIX, and SENSITIVITY are all positively associated with the likelihood of
accounting fraud consistent with the results in table 5A. Inclusion of these additional control
variables does however dampen the statistical significance of FINANCING.
25
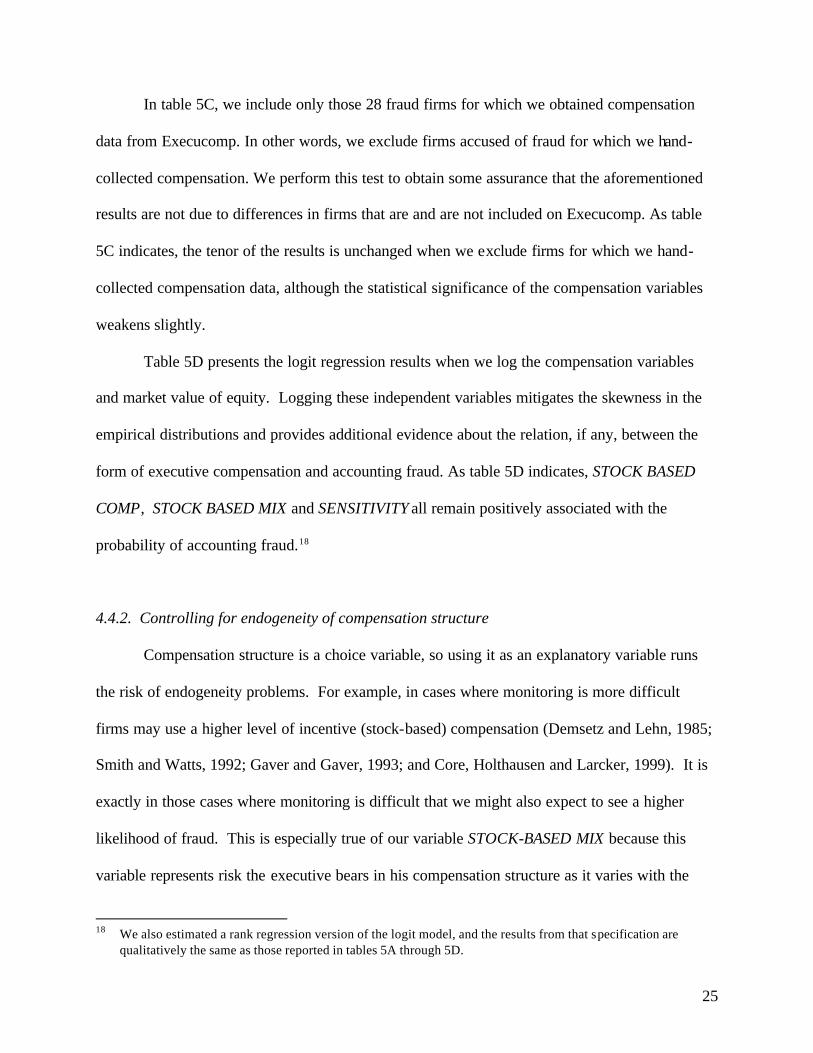
In table 5C, we include only those 28 fraud firms for which we obtained compensation
data from Execucomp. In other words, we exclude firms accused of fraud for which we hand-
collected compensation. We perform this test to obtain some assurance that the aforementioned
results are not due to differences in firms that are and are not included on Execucomp. As table
5C indicates, the tenor of the results is unchanged when we exclude firms for which we hand-
collected compensation data, although the statistical significance of the compensation variables
weakens slightly.
Table 5D presents the logit regression results when we log the compensation variables
and market value of equity. Logging these independent variables mitigates the skewness in the
empirical distributions and provides additional evidence about the relation, if any, between the
form of executive compensation and accounting fraud. As table 5D indicates, STOCK BASED
COMP, STOCK BASED MIX and SENSITIVITY all remain positively associated with the
probability of accounting fraud.18
4.4.2. Controlling for endogeneity of compensation structure Compensation structure is a choice variable, so using it as an explanatory variable runs
the risk of endogeneity problems. For example, in cases where monitoring is more difficult
firms may use a higher level of incentive (stock-based) compensation (Demsetz and Lehn, 1985;
Smith and Watts, 1992; Gaver and Gaver, 1993; and Core, Holthausen and Larcker, 1999). It is
exactly in those cases where monitoring is difficult that we might also expect to see a higher
likelihood of fraud. This is especially true of our variable STOCK-BASED MIX because this
variable represents risk the executive bears in his compensation structure as it varies with the
18 We also estimated a rank regression version of the logit model, and the results from that specification are
qualitatively the same as those reported in tables 5A through 5D.
26
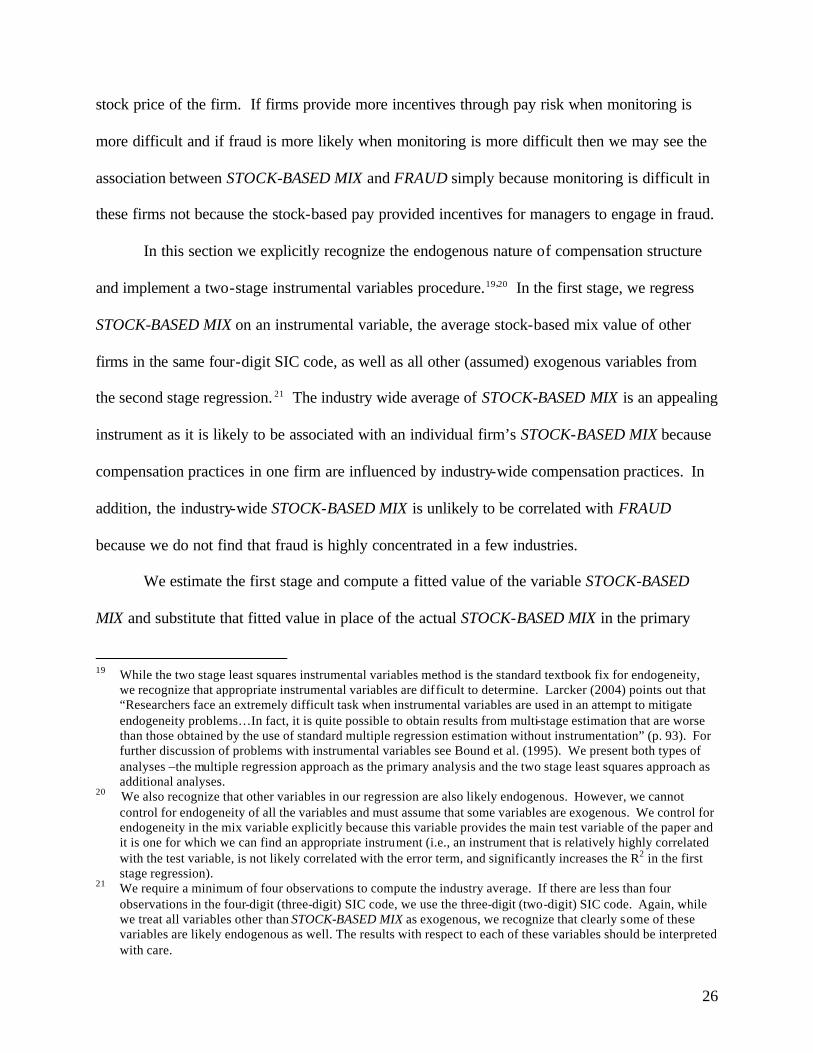
stock price of the firm. If firms provide more incentives through pay risk when monitoring is
more difficult and if fraud is more likely when monitoring is more difficult then we may see the
association between STOCK-BASED MIX and FRAUD simply because monitoring is difficult in
these firms not because the stock-based pay provided incentives for managers to engage in fraud.
In this section we explicitly recognize the endogenous nature of compensation structure
and implement a two-stage instrumental variables procedure.19,20 In the first stage, we regress
STOCK-BASED MIX on an instrumental variable, the average stock-based mix value of other
firms in the same four-digit SIC code, as well as all other (assumed) exogenous variables from
the second stage regression. 21 The industry wide average of STOCK-BASED MIX is an appealing
instrument as it is likely to be associated with an individual firm’s STOCK-BASED MIX because
compensation practices in one firm are influenced by industry-wide compensation practices. In
addition, the industry-wide STOCK-BASED MIX is unlikely to be correlated with FRAUD
because we do not find that fraud is highly concentrated in a few industries.
We estimate the first stage and compute a fitted value of the variable STOCK-BASED
MIX and substitute that fitted value in place of the actual STOCK-BASED MIX in the primary
19 While the two stage least squares instrumental variables method is the standard textbook fix for endogeneity,
we recognize that appropriate instrumental variables are difficult to determine. Larcker (2004) points out that “Researchers face an extremely difficult task when instrumental variables are used in an attempt to mitigate endogeneity problems…In fact, it is quite possible to obtain results from multi-stage estimation that are worse than those obtained by the use of standard multiple regression estimation without instrumentation” (p. 93). For further discussion of problems with instrumental variables see Bound et al. (1995). We present both types of analyses –the multiple regression approach as the primary analysis and the two stage least squares approach as additional analyses.
20 We also recognize that other variables in our regression are also likely endogenous. However, we cannot control for endogeneity of all the variables and must assume that some variables are exogenous. We control for endogeneity in the mix variable explicitly because this variable provides the main test variable of the paper and it is one for which we can find an appropriate instrument (i.e., an instrument that is relatively highly correlated with the test variable, is not likely correlated with the error term, and significantly increases the R2 in the first stage regression).
21 We require a minimum of four observations to compute the industry average. If there are less than four observations in the four-digit (three-digit) SIC code, we use the three-digit (two-digit) SIC code. Again, while we treat all variables other than STOCK-BASED MIX as exogenous, we recognize that clearly some of these variables are likely endogenous as well. The results with respect to each of these variables should be interpreted with care.
27
regression. We present the results from the first stage regression in panel A of table 6. The first
stage regression shows that the relation between the industry-wide STOCK-BASED MIX and
STOCK-BASED MIX is positive and significant and that the incremental R-squared from
including the instrument in the regression is 0.1119, which represents more than a doubling of
the R-squared. In addition, in unreported results, we find that the correlation between the
instrument and STOCK-BASED MIX is 0.38.22
We then estimate the second stage regression by substituting the predicted mix value
from the first stage in for STOCK-BASED MIX in the second stage regression. These results are
presented in panel B of table 6. The coefficient on the predicted STOCK-BASED MIX is 6.55 (p
= 0.0001) after controlling for other factors that may be associated with FRAUD. Thus, after
controlling for endogeneity, we find that the probability of fraud is positively associated with
STOCK-BASED MIX.
4.4.3. Estimates of economic significance
In this section we give a sense of the economic importance of compensation structure in
the probability of accounting fraud. At the outset it is important to note that the unconditional
probability of accounting fraud by any given firm in any given year is quite low, at least as
measured by SEC enforcement actions. Our sample contains 50 firms accused of fraud by the
SEC and over 13,000 firm-years not accused, giving an unconditional probability of being
accused of fraud by the SEC of around 0.38% per year.23 Despite its rare occurrence, accounting
22 There is a loss of twelve observations from requiring four observations per industry to calculate an industry
average. To ensure that these twelve observations do not affect the results reported in table 5, we re -estimate those tests excluding these twelve observations and find nearly identical results.
23 More precisely this is the unconditional probability of being both accused of fraud by the SEC and having sufficient proxy statements and/or Execucomp data available to compute our metrics.
28
fraud is important to understand because being accused of fraud by the SEC has severe adverse
effects on the market value of the firm involved (Dechow, Sloan and Sweeny, 1996). Further, it
only took a handful of very large alleged frauds to bring down Arthur Andersen and lead to the
Sarbanes-Oxley Act. Thus, even what might appear to be a small increase in the probability of
fraud can be economically significant.
To assess the marginal effects of an increase in the portion of STOCK-BASED MIX, we
first set all of the explanatory variables, including the STOCK-BASED MIX, to their sample
means (or modal value for indicator variables) (using the regression B in Table 5A). Then we
increase the STOCK-BASED MIX by one standard deviation. We find that a one standard
deviation increase in the portion of STOCK-BASED MIX increases the probability of being
accused of fraud by the SEC by approximately 0.26%, which is a 68% increase in the likelihood
of fraud.24
In terms of the control variables, one variable stands out from the rest – FINANCING –
the indicator variable reflecting the likelihood of management seeking external financing.
Moving from a zero value for FINANCING to a one (indicating a greater likelihood of
management seeking external financing) increases the probability of fraud by 1.1%, a more than
three-fold increase in the probability of fraud. This is consistent with Dechow, Sloan and
Sweeney (1996) and others who have found that desire to access the capital markets can induce
managers to manipulate earnings.
24 By way of comparison, in the table 6 specification that uses the instrumental variables approach to control for
endogeneity, we find that a one standard deviation in the predicted value of STOCK-BASED MIX increases the probability of being accused by fraud by the SEC by approximately 0.47%, more than doubling the likelihood of fraud.
29
We assess the marginal effects of an increase in SENSITIVITY in regression (C ) of Table
5A in a similar manner. We find that a one standard deviation increase in SENSITVITY increases
the probability of being accused of fraud by the SEC by approximately 0.09%, which is a 25%
increase in the likelihood of fraud. While this is economically smaller than the marginal effect
of STOCK-BASED MIX, we consider a 25% increase in the probability of being accused of fraud
by the SEC economically meaningful.
4.5 Managerial Benefits Derived from the Accounting Fraud
The fundamental link between executive compensation and accounting fraud is the
premise that firm management engages in accounting fraud with the expectation that the
fraudulent activities will increase the firm’s stock price or prevent a decline that would otherwise
occur. In order to more directly examine this link and ascertain whether fraud actually leads to
positive net benefits for managers we investigate changes in the firm’s stock prices and changes
in managerial wealth surrounding the alleged frauds. Figure 1 presents cumulative average
abnormal returns for the 50 sample firms for the 120 trading days prior and subsequent to public
announcement of the accounting fraud.25 As Figure 1 indicates, news of the accounting fraud led
to a precipitous decline in the stock prices of sample firms. In sum, Figure 1 indicates that news
of the accounting fraud led to an economically significant decline in fraud firms’ market values.
25 Figure 1 includes the abnormal returns of Microstrategy, which is a potential outlier in the analysis of wealth
loss. If we exclude Microstrategy from this figure the decline in the sample firms’ market values for the days surrounding the revelation of the accounting fraud is approximately 20% rather than the slightly more than 30% decline shown in the figure.
30
Next, we estimate the value of the top five managers’ equity holdings in the firm prior to
the announcement of the accounting fraud and at various dates subsequent to the announcement
of the accounting fraud. The relative and absolute changes in the value of managers’ equity
holdings provides a measure of the degree to which they benefited from any inflation in stock
price resulting from the accounting fraud. If there were no inflation in stock price and no
inflation in managerial wealth as a result of the accounting fraud, there would be no incentive for
managers to inflate accounting earnings and expose themselves to the risks associated with the
fraud.26
For each of the 50 sample firms, we identify the date that news of the alleged accounting
fraud first reached the market through a search of Lexis-Nexis. We then compute the value of
managerial equity holdings of the top five executives on the day prior to the announcement of the
accounting fraud. The total value of managerial equity holdings is comprised of stock options,
stock, and restricted stock. We then compute the value of these same managerial holdings one
week after the announcement of the fraud, six months after the announcement of the fraud, and
one year after the announcement of the fraud.
In Table 7, we present the change in the value of equity holdings of the management
team at our sample firms around announcement of the accounting fraud. We use the decline in
value of managerial equity holdings after the announcement of the alleged fraud as an estimate
of the amount of inflation in managerial equity holdings resulting from the accounting fraud.
Table 7 reports the percentage change in value of equity holdings over the various time periods.
26 In this case it is management’s expectation of an increase in wealth that influences their decision about whether
or not to commit the accounting fraud. However, because actual expectations cannot be measured we use ex post realizations as a proxy for average expectations.
31
We find that the value of the equity holdings of managers at sample firms declines by an average
(median) of 18.4% (17.2%) during the week after announcement of the accounting fraud, both of
which are significant at less than the 1% level. Moreover, 81% of sample firm managers
experience a decline in the value of their holdings of firm equities (p<.01). The median value of
managerial holdings declined by about $2 million during the week following announcement of
the fraud. During the six months after the announcement of the accounting fraud, the value of
managerial holdings declined by about 49% at the median (p < 0.01), which is equivalent to
about $19 million. Results are similar for the year subsequent to the announcement of the
accounting fraud. In sum, the results in table 7 indicate that the value of managerial holdings of
firms accused of accounting fraud declined significantly in response to public disclosure of the
accounting fraud. Thus, it appears that the value of managerial stock holdings was inflated
substantially as a result of the accounting fraud and managers obtained net benefits in terms of an
increase in personal wealth.
We note a caveat to our interpretation of these data. The decrease in market value upon
revelation of the fraud is likely the upper bound of how much the firm was overvalued as a result
of the fraud. Suppose the market would have valued the firm’s stock at Pnofraud if no fraud had
taken place, i.e., all information had been truthfully revealed. But instead the manager commits
fraud, inflating the stock price to Pfraud, where Pfraud = Pnofraud. When the fraud is discovered, the
market loses confidence in the firm and the stock drops to Pknownfraud, where it is probable that
Pknownfraud = Pnofraud. It is unlikely that Pknownfraud = Pnofraud because the very act of fraud likely
destroys value, for example, by leading to litigation, a loss of confidence in the accuracy of the
financial statements and the firm’s governance, increased input costs, and increased costs of
capital.
32
Thus there are three stock prices that we are interested in when trying to determine
manager’s private benefits: Pfraud = Pnofraud = Pknownfraud. However, because we can only observe
Pfraud and Pknownfraud and cannot observe what Pnofraud would have been in the absence of fraud,
there is an unavoidable limitation in our analysis of wealth changes. The manager’s private
benefits had his fraud not been discovered is really a function of Pfraud – Pnofraud, but we can only
measure Pfraud – Pknownfraud , the decrease in stock price following the revelation of fraud. As a
result, the decrease in stock price following the revelation of the fraud is likely an upper bound
of the extent to which the fraud inflated stock price.
5. Conclusion
This paper examines whether the incidence of alleged accounting fraud is associated with
executive stock-based compensation and executive pay-for performance sensitivity. The results
are consistent with the likelihood of accounting fraud increasing in the percent of total executive
compensation that is stock-based. This result is robust to controls for the likelihood of the firm
obtaining external financing, governance characteristics, financial performance, industry
controls, and alternative specifications. Of the control variables, one that is consistently
significant is a variable that proxies for the likelihood of management wanting to obtain external
financing in the next two years, with the probability of fraud increasing in this proxy, consistent
with Dechow et al. (1996).
One difficulty faced by most studies of compensation, including this study, is that
compensation is endogenously determined. Accordingly, we implement a two-stage least
squares procedure using the industry wide average of stock-based mix of compensation as the
instrumental variable. We find results consistent with the main logistic regression analysis.
Thus, although both methodologies (multiple regression and two-stage least squares) have
33
limitations, the results using either method yield similar results. We consistently find that a
higher stock-based mix of pay is positively associated with the likelihood of fraud.
We do not conclude from this evidence that stock based compensation is inefficient on
the whole. Rather the evidence suggests that compensation committees face a trade-off between
the positive incentive effects afforded by performance-based compensation and the negative side
effects, such as increasing the probability of accounting fraud.
34
References
Aboody, D. and R. Kasznik. 2000. CEO Stock Option Awards and the Timing of Corporate
Voluntary Disclosures. Journal of Accounting and Economics 29: 73-100. Adams, R.B. 2000. What do Boards do? Evidence from Committee Meeting and Director
Compensation. Working paper, Federal Reserve Bank of New York. Agrawal, A. and S. Chadha. 2002. Corporate Governance and Accounting Scandals. University
of Alabama working paper. Altman, E. 1968. Financial Ratios, Discriminant Analysis and the Prediction of Corporate
Bankruptcy. Journal of Finance 23 (September): 589-609. Beasley, M. 1996. An Empirical Analysis of the Relation Between Board of Director
Compensation and Financial Statement Fraud. The Accounting Review 71 (3):443-465. Bebchuk, L., J. Fried, and D. Walker. 2002. Managerial Power and Rent Extraction in the
Design of Executive Compensation. The University of Chicago Law Review 69: 751-846. Begley, J., J. Ming, and S. Watts. 1996. Bankruptcy Classification Errors in the 1980s: An
Empirical analysis of Altman’s and Ohlson’s Models. Review of Accounting Studies 1: 267-284.
Beneish, M. 1999. Incentives and Penalties Related to Earnings Overstatements that Violate
GAAP. The Accounting Review 74 (4): 425-457. Bizjak, J., J. Brickley, and J. Coles. 1993. Stock-Based Incentive Compensation and Investment
Behavior. Journal of Accounting and Economics 16 (Jan/April/July): 349-372. Bound, J., D. Jaeger, and R. Baker. 1995. Problems with Instrumental Variables Estimation
When the Correlation Between the Instruments and the Endogenous Explanatory Variable is Weak. Journal of the American Statistical Association 70 No. 430: 443-450.
Bradshaw, M., S. Richardson, and R. Sloan. Do Analysts and Auditors Use Information in
Accruals? Journal of Accounting Research 39 (1): 45-74. Brickley, J., S. Bhagat, and R. Lease. 1985. The Impact of Long-Range Managerial
Compensation Plans on Shareholder Wealth. Journal of Accounting and Economics 7 (April): 115-130.
Bryan, S., L. Hwang, and S. Lilien. 2000. CEO Stock-Based Compensation: An Empirical
Analysis of Incentive-Intensity, Relative Mix, and Economic Determinants. Journal of Business 73: 661-693.
35
Bushman, R. and A. Smith. 2001. Financial Accounting Information and Corporate Governance. Journal of Accounting and Economics 32 (1-3): 237-334.
Cheng, Q. and T. Warfield. 2002. Stock-Based Compensation, Earnings Management and the
Informativeness of Earnings. University of Washington and University of Wisconsin working paper.
Core, J. and W. Guay. 1999. The Use of Equity Grants to Manage Optimal Equity Incentive
Levels. Journal of Accounting and Economics 28: 151-184. Core, J. and W. Guay. 2002. Estimating the Value of Employee Stock Option Portfolios and
Their Sensitivities to Price and Volatility. Journal of Accounting Research 40:613-630. Core, J., W. Guay, and D. Larcker. 2003. Executive Equity Compensation and Incentives: A
Survey. Federal Reserve Bank of New York Economic Policy Review (April): 27-50. Core, J., R. Holthausen, and D. Larcker. 1999. Corporate Governance, Chief Executive Officer
Compensation, and Firm Performance. Journal of Financial Economics 51: 371-406. Dechow, P., R. Sloan, and A. Sweeney, 1995. Detecting Earnings Management. The Accounting
Review 70 (2): 193-225. Dechow, P, R. Sloan and A. Sweeney. 1996. Causes and Consequences of Earnings
Manipulations: An Analysis of Firms Subject to Enforcement Actions by the SEC. Contemporary Accounting Research 13 (1): 1-36.
Demsetz, H. and K. Lehn 1985. The Structure of Corporate Ownership: Causes and
Consequences. Journal of Political Economy, 1155-1177. Erickson, M., B. Mayhew and W. Felix. 2000. Why Do Audits Fail: Evidence from Lincoln
Savings and Loan. Journal of Accounting Research 38 (1):165-194. Feroz, E. H., K. Park and V.S. Pastena. 1991. The Financial and market Effects of the SEC’s
Accounting and Auditing Enforcement Releases. Journal of Accounting Research 29 (Supplement): 107-142.
Gao, P. and R. Shrieves. 2002. Earnings Management and Executive Compensation: A Case of
Overdose of Option and Underdose of Salary? Northwestern University and University of Tennessee at Knoxville working paper.
Gaver J. and K. Gaver. 1993. Additional Evidence on the Association between the Investment
Opportunity Set and Corporate Financing, Dividend, and Compensation Policies. Journal of Accounting and Economics 16: 125-160.
Goldman, E. and S. Slezak. 2003. The Economics of Fraudulent Misreporting, working paper,
The University of North Carolina-Chapel Hill.
36
Greenspan, A. 2002. Testimony before the Committee on Banking, Housing and Urban Affairs, U.S. Senate, July 16.
Hall, B.J. and K. Murphy. 2002. Stock Options for Undiversified Executives, Journal of
Accounting and Economics (33)1: 3-42. Hallock, K.F. 1997. Reciprocally Interlocking Boards of Directors and Executive Compensation.
Journal of Financial and Quantitative Analysis 32(3): 331-44. Hanlon, M. S. Rajgopal and T. Shevlin. 2004. Are Executive Stock Options Associated with
Future Earnings? Journal of Accounting and Economics 36: 3-43. Healy, P. 1985. The Effect of Bonus Schemes on Accounting Decisions. Journal of Accounting
and Economics 7: 85-107. Hermalin, B.E. and M.S.Weisbach. 1998. Endogenously Chosen Boards of Directors and Their
Monitoring of the CEO. American Economic Review 88: 96-118. Himmelberg, C. G. Hubbard and D. Palia. 1999. Understanding the Determinants of Managerial
Ownership and the Link Between Ownership and Performance. Journal of Financial Economics 53: 353-384.
Ittner, C., R. Lambert and D. Larcker. 2003. The Structure and Performance Consequences of
Equity Grants to Employees of New Economy Firms. Journal of Accounting and Economics 34 (1-3): 89-127.
Jensen, M. and W. Meckling. 1976. Theory of the Firm: Managerial Behavior, Agency Costs and
Ownership Structure. Journal of Financial Economics 3: 305-60. Jensen, M. 2001. Paying People to Lie: The Trust About the Budgeting Process. Harvard
Business School working paper. Jenter, D. 2001. Understanding High-Powered Incentives. Working paper, Harvard Business
School. Johnson, S., H. Ryan, and Y. Tian, 2003. Executive Compensation and Corporate Fraud.
Louisiana State University working paper. Ke, B. 2002. Why Do CEOs of Publicly Traded Firms Prefer Reporting Small Increases in
Earnings and Long Duration of Consecutive Earnings Increases? Pennsylvania State University working paper.
Kedia, S. 2003. Do Executive Stock Options Generate Incentives for Earnings Management?
Evidence from Accounting Restatements. Working paper, Harvard Business School.
37
Lambert, R. and D. Larcker. 2003. Stock Options, Restricted Stock, and Incentives. University of Pennsylvania working paper. April.
Larcker, D. 2004. Discussion of “Are Executive Stock Options Associated with Future
Earnings?” Journal of Accounting and Economics 36: (91-103). Lewellen, W., C. Loderer, and A. Rosenfeld. 1985. Merger Decisions and Executive Stock
Ownership in Acquiring Firms. Journal of Accounting and Economics 7 (April): 209-231.
Meulbroek, L. 2001. The Efficiency of Equity-Linked Compensation: Understanding the Full
Cost of Awarding Executive Stock Options. Financial Management 30(2):5-30. Murphy, K.J. 1999. Executive Compensation, in Handbook of Labor Economics (Orley
Ashenfleter and David Card eds.) North Holland: Amsterdam. Palepu, K. 1986. Predicting Takeover Targets: A Methodological and Empirical Analysis.
Journal of Accounting and Economics 8: 3-35. Palmrose, Z. and S. Scholz. 2002. The Accounting Causes and Legal Consequences of Non-
GAAP Reporting: Evidence from Restatements. University of Southern California and University of Kansas working paper.
Pavlik, E.L., T.W. Scott and P.Tiessen. 1993. Executive Compensation: Issues and Research.
Journal of Accounting Literature 12: 131-189. Peng, L. and a. Roell. 2003. Executive Pay, Earnings Manipulation and Shareholder Litigation.
Working paper, Baruch College/CUNY and Princeton University. Pincus, K., W. Holder, and T. Mock 1988. Reducing the Incidence of Fraudulent Financial
Reporting: The Role of the Securities and Exchange Commission. Los Angeles, CA: SEC Financial Reporting Institute of the University of California.
Rajgopal, S. and T. Shevlin. 2002. Empirical Evidence on the Relation Between Stock Option
Compensation and Risk Taking. Journal of Accounting and Economics (33)2: 145-171. Richardson, S., I. Tuna, and M. Wu. 2002. Predicting Earnings Management: The Case of
Earnings Restatements. University of Pennsylvania and Hong Kong University of Science and Technology working paper.
Shumway, T. 2001. Forecasting Bankruptcy More Accurately: A Simple Hazard Model. The
Journal of Business 74 (January): 101-124. Sloan, R. 2001. Financial Accounting and Corporate Governance: A Discussion. Journal of
Accounting and Economics 32 (3): 335-347.
38
Smith, C., and R. Watts. 1992. The Investment Opportunity Set and Corporate Financing, Dividend, and Compensation Policies. Journal of Financial Economics 7: 117-61.
Summers, S. and J. Sweeney, 1988. Fraudulently Misstated Financial Statements and Insider
Trading: An Empirical Analysis. The Accounting Review 73 (1): 131-146. Vafeas, N. 1999. Board Meeting Frequency and Firm Performance. Journal of Financial
Economics 53: 113-142. Watts, R. and J. Zimmerman. 1986. Positive Accounting Theory. Prentice Hall, Englewood
Cliffs, NJ. Wu, Min. 2002. Earnings Restatements: A Capital Market Perspective. Working paper, New
York University Stern School of Business.
Yermack, D. 1995. Do Corporations Award CEO Stock Options Effectively? Journal of Financial Economics 39: 237-269.
Yermack, D. 1997. Good Timing: CEO Stock Option Awards and Company News
Announcements. Journal of Finance 52: 449-477. Zmijewski, M. 1984. Methodological Issues Related to the Estimation of Financial Distress
Prediction Models. Journal of Accounting Research 22 (Supplement): 59-82.
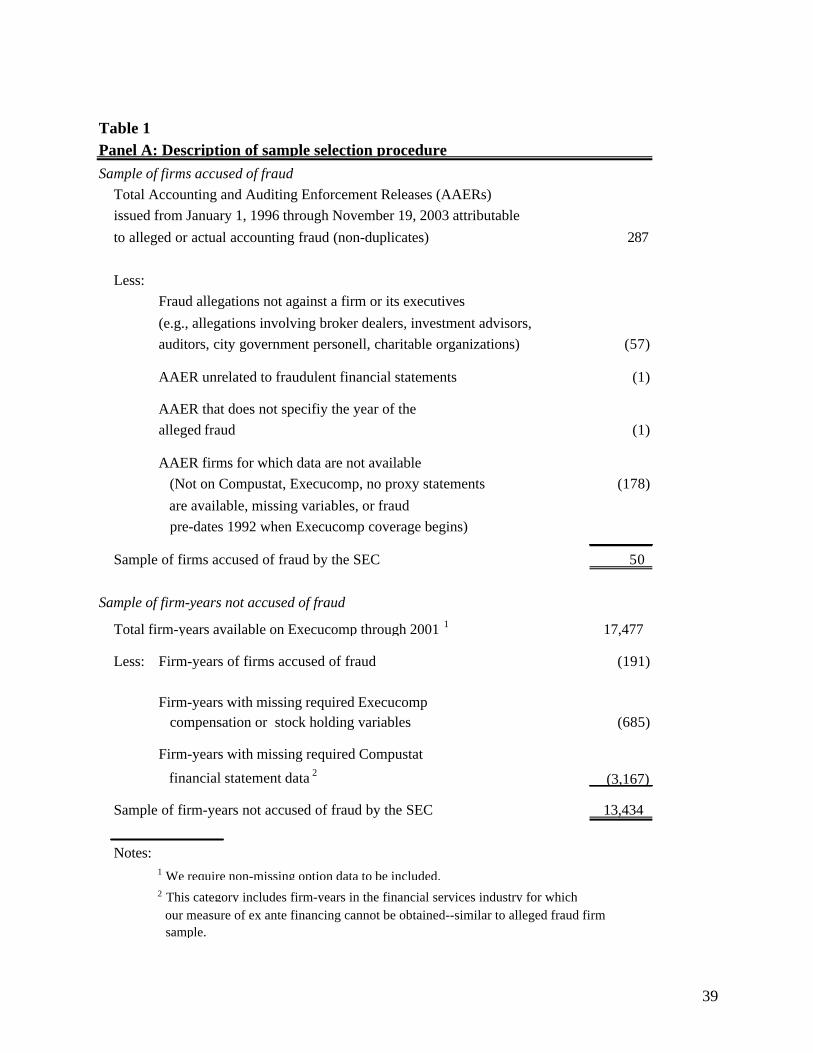
39
Sample of firms accused of fraudTotal Accounting and Auditing Enforcement Releases (AAERs) issued from January 1, 1996 through November 19, 2003 attributableto alleged or actual accounting fraud (non-duplicates) 287
Less:Fraud allegations not against a firm or its executives(e.g., allegations involving broker dealers, investment advisors,auditors, city government personell, charitable organizations) (57)
AAER unrelated to fraudulent financial statements (1)
AAER that does not specifiy the year of the alleged fraud (1)
AAER firms for which data are not available (Not on Compustat, Execucomp, no proxy statements (178) are available, missing variables, or fraud pre-dates 1992 when Execucomp coverage begins)
Sample of firms accused of fraud by the SEC 50
Sample of firm-years not accused of fraud
Total firm-years available on Execucomp through 2001 1 17,477
Less: Firm-years of firms accused of fraud (191)
Firm-years with missing required Execucomp compensation or stock holding variables (685)
Firm-years with missing required Compustat
financial statement data 2 (3,167)
Sample of firm-years not accused of fraud by the SEC 13,434
Notes:1 We require non-missing option data to be included.2 This category includes firm-years in the financial services industry for which our measure of ex ante financing cannot be obtained--similar to alleged fraud firm sample.
Table 1Panel A: Description of sample selection procedure
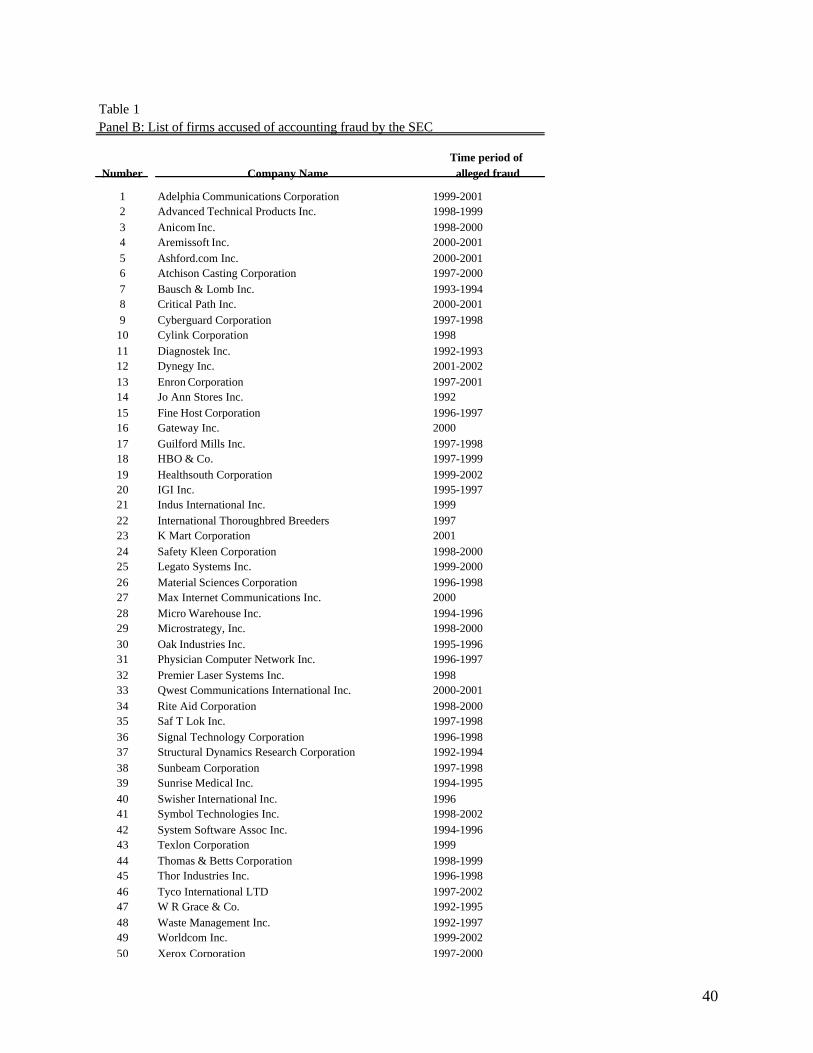
40
Table 1Panel B: List of firms accused of accounting fraud by the SEC
Time period of Number Company Name alleged fraud
1 Adelphia Communications Corporation 1999-20012 Advanced Technical Products Inc. 1998-19993 Anicom Inc. 1998-20004 Aremissoft Inc. 2000-20015 Ashford.com Inc. 2000-20016 Atchison Casting Corporation 1997-20007 Bausch & Lomb Inc. 1993-19948 Critical Path Inc. 2000-20019 Cyberguard Corporation 1997-1998
10 Cylink Corporation 199811 Diagnostek Inc. 1992-199312 Dynegy Inc. 2001-200213 Enron Corporation 1997-200114 Jo Ann Stores Inc. 199215 Fine Host Corporation 1996-199716 Gateway Inc. 200017 Guilford Mills Inc. 1997-199818 HBO & Co. 1997-199919 Healthsouth Corporation 1999-200220 IGI Inc. 1995-199721 Indus International Inc. 199922 International Thoroughbred Breeders 199723 K Mart Corporation 200124 Safety Kleen Corporation 1998-200025 Legato Systems Inc. 1999-200026 Material Sciences Corporation 1996-199827 Max Internet Communications Inc. 200028 Micro Warehouse Inc. 1994-199629 Microstrategy, Inc. 1998-200030 Oak Industries Inc. 1995-199631 Physician Computer Network Inc. 1996-199732 Premier Laser Systems Inc. 199833 Qwest Communications International Inc. 2000-200134 Rite Aid Corporation 1998-200035 Saf T Lok Inc. 1997-199836 Signal Technology Corporation 1996-199837 Structural Dynamics Research Corporation 1992-199438 Sunbeam Corporation 1997-199839 Sunrise Medical Inc. 1994-199540 Swisher International Inc. 199641 Symbol Technologies Inc. 1998-200242 System Software Assoc Inc. 1994-199643 Texlon Corporation 199944 Thomas & Betts Corporation 1998-199945 Thor Industries Inc. 1996-199846 Tyco International LTD 1997-200247 W R Grace & Co. 1992-199548 Waste Management Inc. 1992-199749 Worldcom Inc. 1999-200250 Xerox Corporation 1997-2000
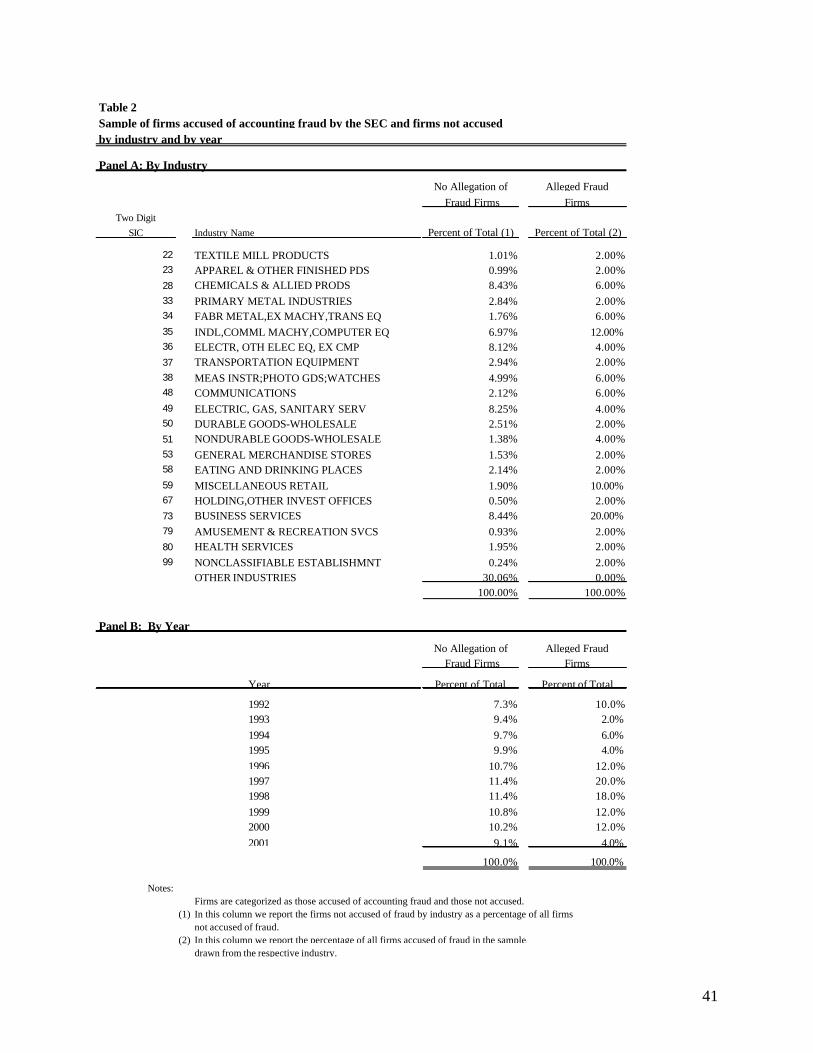
41
Panel A: By Industry
No Allegation ofFraud Firms
Two DigitSIC Industry Name Percent of Total (1) Percent of Total (2)
22 TEXTILE MILL PRODUCTS 1.01% 2.00%23 APPAREL & OTHER FINISHED PDS 0.99% 2.00%28 CHEMICALS & ALLIED PRODS 8.43% 6.00%33 PRIMARY METAL INDUSTRIES 2.84% 2.00%34 FABR METAL,EX MACHY,TRANS EQ 1.76% 6.00%35 INDL,COMML MACHY,COMPUTER EQ 6.97% 12.00%36 ELECTR, OTH ELEC EQ, EX CMP 8.12% 4.00%37 TRANSPORTATION EQUIPMENT 2.94% 2.00%38 MEAS INSTR;PHOTO GDS;WATCHES 4.99% 6.00%48 COMMUNICATIONS 2.12% 6.00%49 ELECTRIC, GAS, SANITARY SERV 8.25% 4.00%50 DURABLE GOODS-WHOLESALE 2.51% 2.00%51 NONDURABLE GOODS-WHOLESALE 1.38% 4.00%53 GENERAL MERCHANDISE STORES 1.53% 2.00%58 EATING AND DRINKING PLACES 2.14% 2.00%59 MISCELLANEOUS RETAIL 1.90% 10.00%67 HOLDING,OTHER INVEST OFFICES 0.50% 2.00%73 BUSINESS SERVICES 8.44% 20.00%79 AMUSEMENT & RECREATION SVCS 0.93% 2.00%80 HEALTH SERVICES 1.95% 2.00%99 NONCLASSIFIABLE ESTABLISHMNT 0.24% 2.00%
OTHER INDUSTRIES 30.06% 0.00%100.00% 100.00%
Panel B: By Year
No Allegation ofFraud Firms
Percent of Total Percent of Total
7.3% 10.0%9.4% 2.0%9.7% 6.0%9.9% 4.0%
10.7% 12.0%11.4% 20.0%11.4% 18.0%10.8% 12.0%10.2% 12.0%9.1% 4.0%
100.0% 100.0%
Notes:Firms are categorized as those accused of accounting fraud and those not accused.
(1) In this column we report the firms not accused of fraud by industry as a percentage of all firms not accused of fraud.
(2) In this column we report the percentage of all firms accused of fraud in the sample,drawn from the respective industry.
FirmsAlleged Fraud
Table 2
199719981999
Alleged FraudFirms
20002001
by industry and by year Sample of firms accused of accounting fraud by the SEC and firms not accused
Year
19921993199419951996
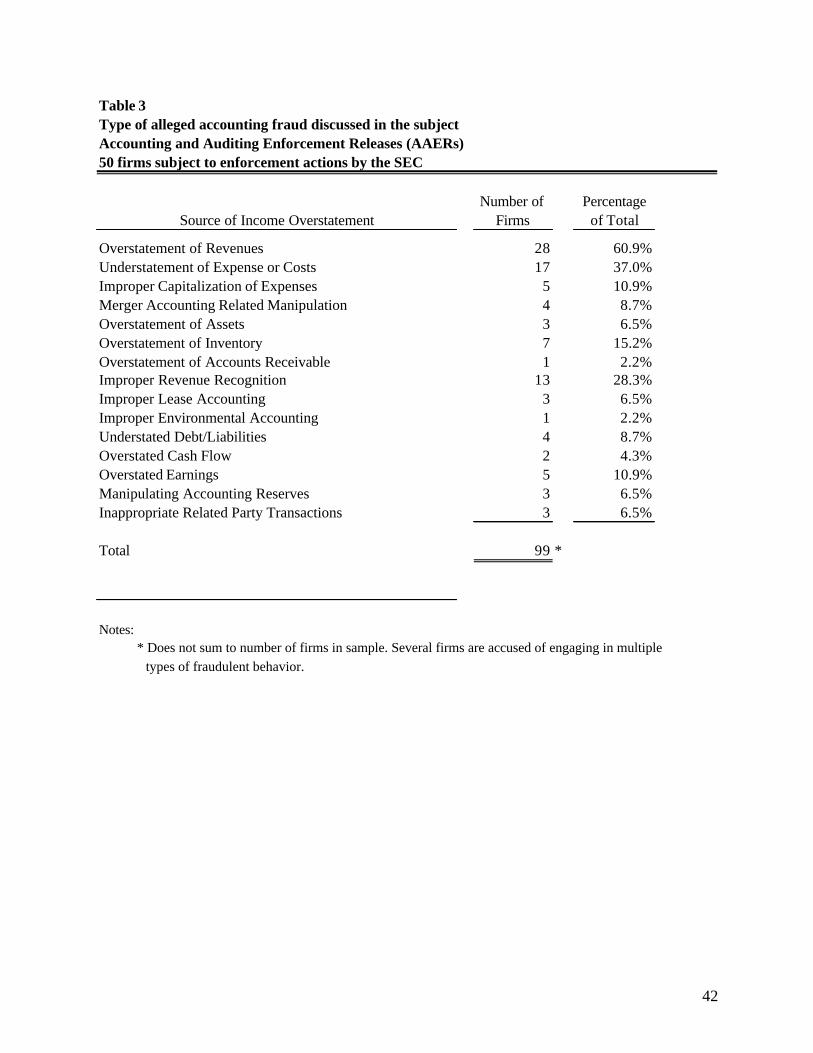
42
Number of PercentageSource of Income Overstatement Firms of Total
Overstatement of Revenues 28 60.9%Understatement of Expense or Costs 17 37.0%Improper Capitalization of Expenses 5 10.9%Merger Accounting Related Manipulation 4 8.7%Overstatement of Assets 3 6.5%Overstatement of Inventory 7 15.2%Overstatement of Accounts Receivable 1 2.2%Improper Revenue Recognition 13 28.3%Improper Lease Accounting 3 6.5%Improper Environmental Accounting 1 2.2%Understated Debt/Liabilities 4 8.7%Overstated Cash Flow 2 4.3%Overstated Earnings 5 10.9%Manipulating Accounting Reserves 3 6.5%Inappropriate Related Party Transactions 3 6.5%
Total 99 *
Notes: * Does not sum to number of firms in sample. Several firms are accused of engaging in multiple types of fraudulent behavior.
Table 3Type of alleged accounting fraud discussed in the subjectAccounting and Auditing Enforcement Releases (AAERs)50 firms subject to enforcement actions by the SEC
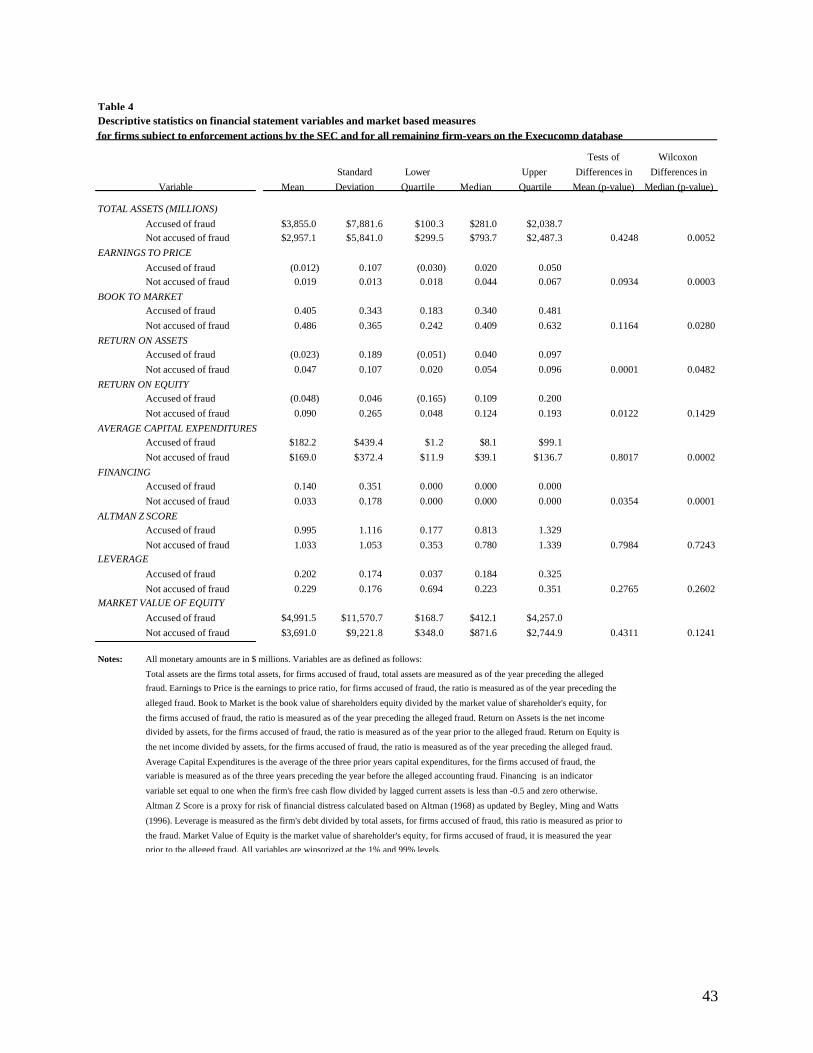
43
Tests of Wilcoxon Standard Lower Upper Differences in Differences in
Mean Deviation Quartile Median Quartile Mean (p-value) Median (p-value)
TOTAL ASSETS (MILLIONS)Accused of fraud $3,855.0 $7,881.6 $100.3 $281.0 $2,038.7Not accused of fraud $2,957.1 $5,841.0 $299.5 $793.7 $2,487.3 0.4248 0.0052
EARNINGS TO PRICEAccused of fraud (0.012) 0.107 (0.030) 0.020 0.050Not accused of fraud 0.019 0.013 0.018 0.044 0.067 0.0934 0.0003
BOOK TO MARKETAccused of fraud 0.405 0.343 0.183 0.340 0.481Not accused of fraud 0.486 0.365 0.242 0.409 0.632 0.1164 0.0280
RETURN ON ASSETSAccused of fraud (0.023) 0.189 (0.051) 0.040 0.097Not accused of fraud 0.047 0.107 0.020 0.054 0.096 0.0001 0.0482
RETURN ON EQUITYAccused of fraud (0.048) 0.046 (0.165) 0.109 0.200Not accused of fraud 0.090 0.265 0.048 0.124 0.193 0.0122 0.1429
AVERAGE CAPITAL EXPENDITURES Accused of fraud $182.2 $439.4 $1.2 $8.1 $99.1Not accused of fraud $169.0 $372.4 $11.9 $39.1 $136.7 0.8017 0.0002
FINANCING Accused of fraud 0.140 0.351 0.000 0.000 0.000Not accused of fraud 0.033 0.178 0.000 0.000 0.000 0.0354 0.0001
ALTMAN Z SCOREAccused of fraud 0.995 1.116 0.177 0.813 1.329Not accused of fraud 1.033 1.053 0.353 0.780 1.339 0.7984 0.7243
LEVERAGEAccused of fraud 0.202 0.174 0.037 0.184 0.325Not accused of fraud 0.229 0.176 0.694 0.223 0.351 0.2765 0.2602
MARKET VALUE OF EQUITYAccused of fraud $4,991.5 $11,570.7 $168.7 $412.1 $4,257.0Not accused of fraud $3,691.0 $9,221.8 $348.0 $871.6 $2,744.9 0.4311 0.1241
Notes: All monetary amounts are in $ millions. Variables are as defined as follows:
Total assets are the firms total assets, for firms accused of fraud, total assets are measured as of the year preceding the alleged
fraud. Earnings to Price is the earnings to price ratio, for firms accused of fraud, the ratio is measured as of the year preceding the
alleged fraud. Book to Market is the book value of shareholders equity divided by the market value of shareholder's equity, for
the firms accused of fraud, the ratio is measured as of the year preceding the alleged fraud. Return on Assets is the net income
divided by assets, for the firms accused of fraud, the ratio is measured as of the year prior to the alleged fraud. Return on Equity is
the net income divided by assets, for the firms accused of fraud, the ratio is measured as of the year preceding the alleged fraud.
Average Capital Expenditures is the average of the three prior years capital expenditures, for the firms accused of fraud, the
variable is measured as of the three years preceding the year before the alleged accounting fraud. Financing is an indicator
variable set equal to one when the firm's free cash flow divided by lagged current assets is less than -0.5 and zero otherwise.
Altman Z Score is a proxy for risk of financial distress calculated based on Altman (1968) as updated by Begley, Ming and Watts
(1996). Leverage is measured as the firm's debt divided by total assets, for firms accused of fraud, this ratio is measured as prior to
the fraud. Market Value of Equity is the market value of shareholder's equity, for firms accused of fraud, it is measured the year
prior to the alleged fraud. All variables are winsorized at the 1% and 99% levels.
Table 4Descriptive statistics on financial statement variables and market based measuresfor firms subject to enforcement actions by the SEC and for all remaining firm-years on the Execucomp database
Variable
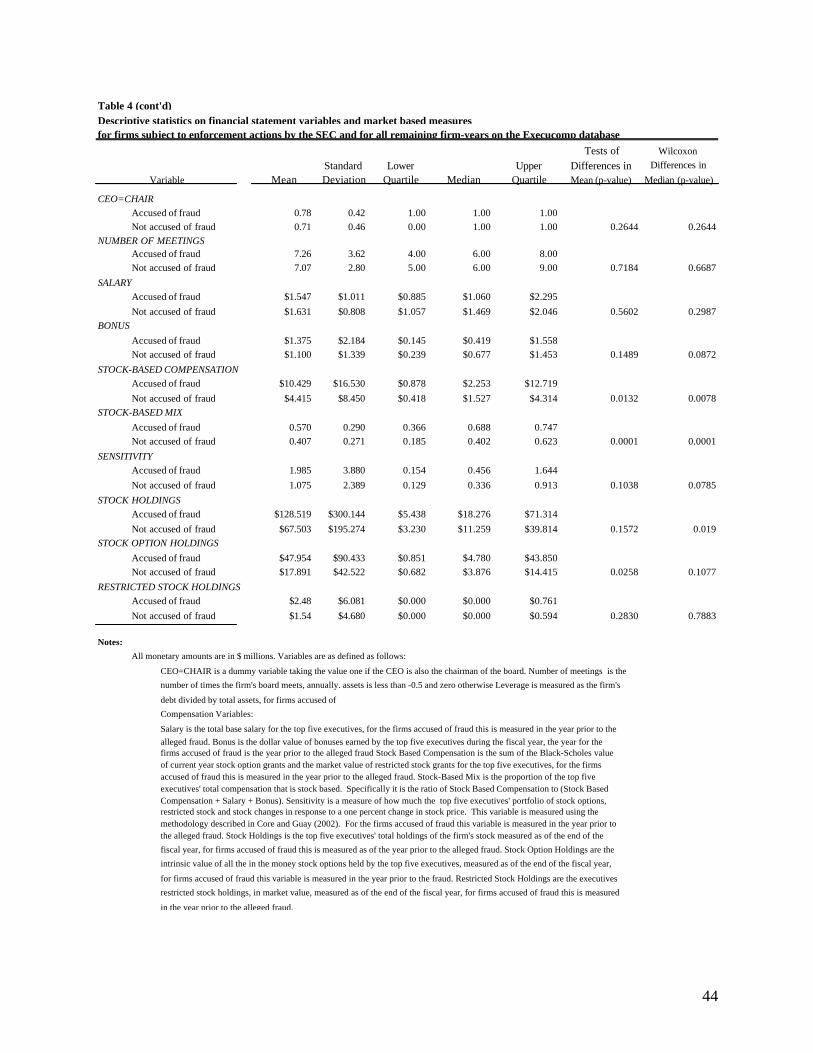
44
Tests of Wilcoxon Standard Lower Upper Differences in Differences in
Mean Deviation Quartile Median Quartile Mean (p-value) Median (p-value)
CEO=CHAIRAccused of fraud 0.78 0.42 1.00 1.00 1.00Not accused of fraud 0.71 0.46 0.00 1.00 1.00 0.2644 0.2644
NUMBER OF MEETINGS Accused of fraud 7.26 3.62 4.00 6.00 8.00Not accused of fraud 7.07 2.80 5.00 6.00 9.00 0.7184 0.6687
SALARYAccused of fraud $1.547 $1.011 $0.885 $1.060 $2.295Not accused of fraud $1.631 $0.808 $1.057 $1.469 $2.046 0.5602 0.2987
BONUSAccused of fraud $1.375 $2.184 $0.145 $0.419 $1.558Not accused of fraud $1.100 $1.339 $0.239 $0.677 $1.453 0.1489 0.0872
STOCK-BASED COMPENSATIONAccused of fraud $10.429 $16.530 $0.878 $2.253 $12.719Not accused of fraud $4.415 $8.450 $0.418 $1.527 $4.314 0.0132 0.0078
STOCK-BASED MIXAccused of fraud 0.570 0.290 0.366 0.688 0.747Not accused of fraud 0.407 0.271 0.185 0.402 0.623 0.0001 0.0001
SENSITIVITYAccused of fraud 1.985 3.880 0.154 0.456 1.644Not accused of fraud 1.075 2.389 0.129 0.336 0.913 0.1038 0.0785
STOCK HOLDINGSAccused of fraud $128.519 $300.144 $5.438 $18.276 $71.314Not accused of fraud $67.503 $195.274 $3.230 $11.259 $39.814 0.1572 0.019
STOCK OPTION HOLDINGSAccused of fraud $47.954 $90.433 $0.851 $4.780 $43.850Not accused of fraud $17.891 $42.522 $0.682 $3.876 $14.415 0.0258 0.1077
RESTRICTED STOCK HOLDINGSAccused of fraud $2.48 $6.081 $0.000 $0.000 $0.761Not accused of fraud $1.54 $4.680 $0.000 $0.000 $0.594 0.2830 0.7883
Notes:
All monetary amounts are in $ millions. Variables are as defined as follows:
CEO=CHAIR is a dummy variable taking the value one if the CEO is also the chairman of the board. Number of meetings is the
number of times the firm's board meets, annually. assets is less than -0.5 and zero otherwise Leverage is measured as the firm's
debt divided by total assets, for firms accused of
Compensation Variables:
Salary is the total base salary for the top five executives, for the firms accused of fraud this is measured in the year prior to thealleged fraud. Bonus is the dollar value of bonuses earned by the top five executives during the fiscal year, the year for thefirms accused of fraud is the year prior to the alleged fraud Stock Based Compensation is the sum of the Black-Scholes valueof current year stock option grants and the market value of restricted stock grants for the top five executives, for the firmsaccused of fraud this is measured in the year prior to the alleged fraud. Stock-Based Mix is the proportion of the top fiveexecutives' total compensation that is stock based. Specifically it is the ratio of Stock Based Compensation to (Stock BasedCompensation + Salary + Bonus). Sensitivity is a measure of how much the top five executives' portfolio of stock options,restricted stock and stock changes in response to a one percent change in stock price. This variable is measured using themethodology described in Core and Guay (2002). For the firms accused of fraud this variable is measured in the year prior tothe alleged fraud. Stock Holdings is the top five executives' total holdings of the firm's stock measured as of the end of the
fiscal year, for firms accused of fraud this is measured as of the year prior to the alleged fraud. Stock Option Holdings are the
intrinsic value of all the in the money stock options held by the top five executives, measured as of the end of the fiscal year,
for firms accused of fraud this variable is measured in the year prior to the fraud. Restricted Stock Holdings are the executives
restricted stock holdings, in market value, measured as of the end of the fiscal year, for firms accused of fraud this is measured
in the year prior to the alleged fraud.
Table 4 (cont'd)
Variable
Descriptive statistics on financial statement variables and market based measuresfor firms subject to enforcement actions by the SEC and for all remaining firm-years on the Execucomp database
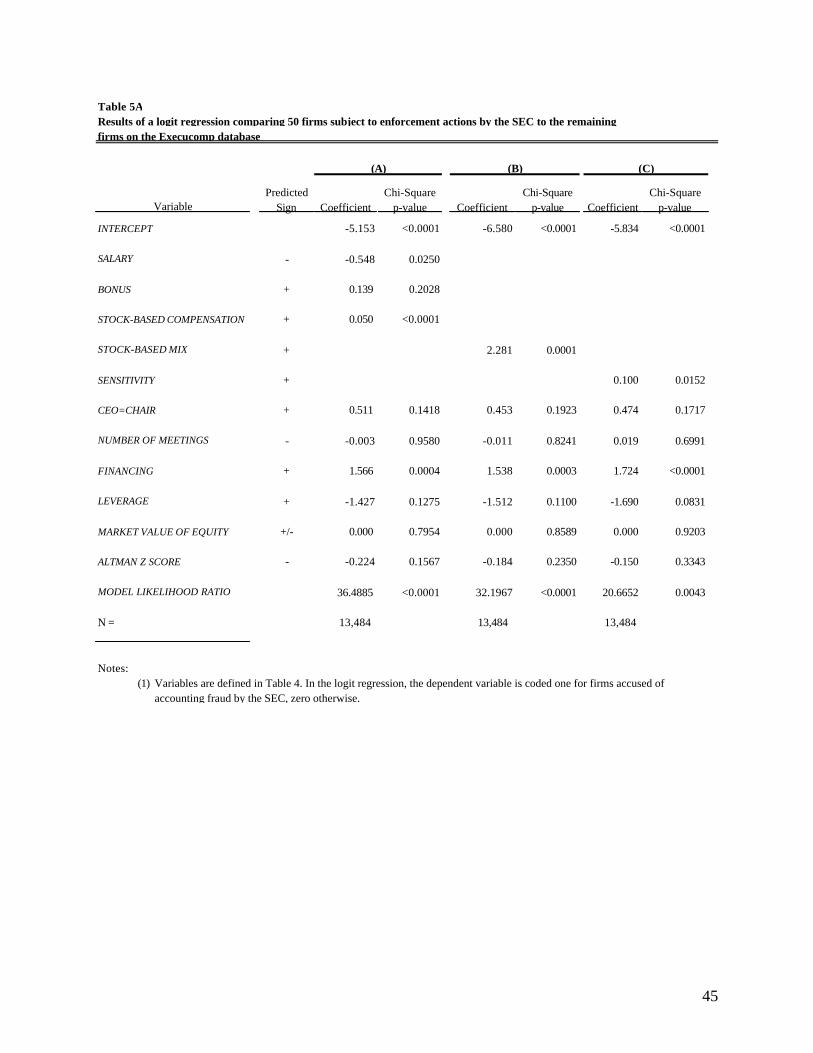
45
Predicted Chi-Square Chi-Square Chi-SquareSign Coefficient p-value Coefficient p-value Coefficient p-value
INTERCEPT -5.153 <0.0001 -6.580 <0.0001 -5.834 <0.0001
SALARY - -0.548 0.0250
BONUS + 0.139 0.2028
STOCK-BASED COMPENSATION + 0.050 <0.0001
STOCK-BASED MIX + 2.281 0.0001
SENSITIVITY + 0.100 0.0152
CEO=CHAIR + 0.511 0.1418 0.453 0.1923 0.474 0.1717
NUMBER OF MEETINGS - -0.003 0.9580 -0.011 0.8241 0.019 0.6991
FINANCING + 1.566 0.0004 1.538 0.0003 1.724 <0.0001
LEVERAGE + -1.427 0.1275 -1.512 0.1100 -1.690 0.0831
MARKET VALUE OF EQUITY +/- 0.000 0.7954 0.000 0.8589 0.000 0.9203
ALTMAN Z SCORE - -0.224 0.1567 -0.184 0.2350 -0.150 0.3343
MODEL LIKELIHOOD RATIO 36.4885 <0.0001 32.1967 <0.0001 20.6652 0.0043
N = 13,484 13,484 13,484
Notes:(1) Variables are defined in Table 4. In the logit regression, the dependent variable is coded one for firms accused of
accounting fraud by the SEC, zero otherwise.
Variable
Results of a logit regression comparing 50 firms subject to enforcement actions by the SEC to the remainingfirms on the Execucomp database
Table 5A
(A) (B) (C)
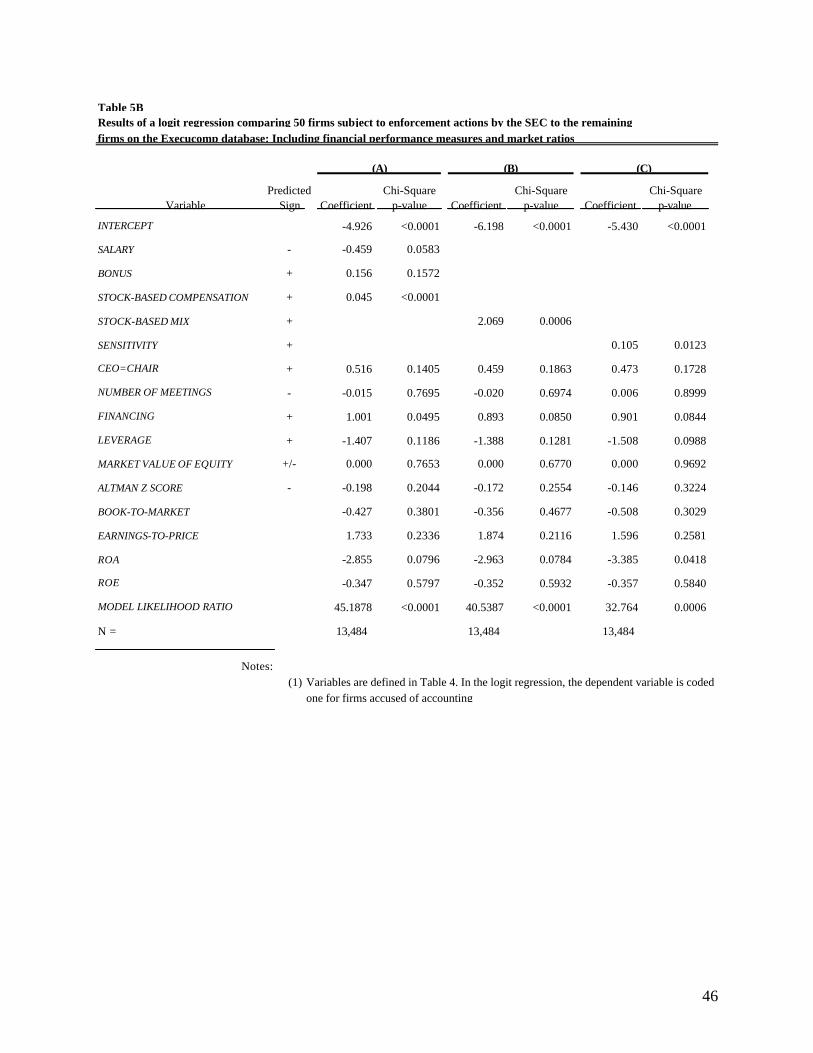
46
Predicted Chi-Square Chi-Square Chi-SquareVariable Sign Coefficient p-value Coefficient p-value Coefficient p-value
INTERCEPT -4.926 <0.0001 -6.198 <0.0001 -5.430 <0.0001
SALARY - -0.459 0.0583
BONUS + 0.156 0.1572
STOCK-BASED COMPENSATION + 0.045 <0.0001
STOCK-BASED MIX + 2.069 0.0006
SENSITIVITY + 0.105 0.0123
CEO=CHAIR + 0.516 0.1405 0.459 0.1863 0.473 0.1728
NUMBER OF MEETINGS - -0.015 0.7695 -0.020 0.6974 0.006 0.8999
FINANCING + 1.001 0.0495 0.893 0.0850 0.901 0.0844
LEVERAGE + -1.407 0.1186 -1.388 0.1281 -1.508 0.0988
MARKET VALUE OF EQUITY +/- 0.000 0.7653 0.000 0.6770 0.000 0.9692
ALTMAN Z SCORE - -0.198 0.2044 -0.172 0.2554 -0.146 0.3224
BOOK-TO-MARKET -0.427 0.3801 -0.356 0.4677 -0.508 0.3029
EARNINGS-TO-PRICE 1.733 0.2336 1.874 0.2116 1.596 0.2581
ROA -2.855 0.0796 -2.963 0.0784 -3.385 0.0418
ROE -0.347 0.5797 -0.352 0.5932 -0.357 0.5840
MODEL LIKELIHOOD RATIO 45.1878 <0.0001 40.5387 <0.0001 32.764 0.0006
N = 13,484 13,484 13,484
Notes:(1) Variables are defined in Table 4. In the logit regression, the dependent variable is coded
one for firms accused of accounting
Table 5BResults of a logit regression comparing 50 firms subject to enforcement actions by the SEC to the remainingfirms on the Execucomp database: Including financial performance measures and market ratios
(A) (B) (C)
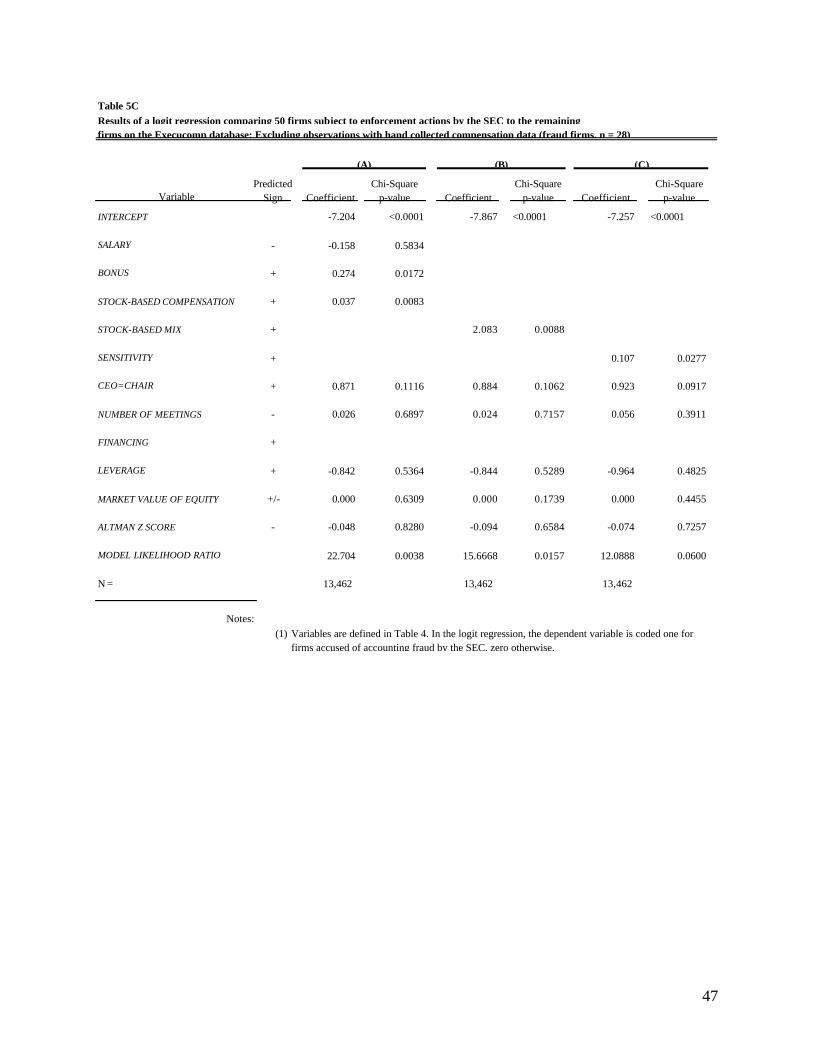
47
Predicted Chi-Square Chi-Square Chi-SquareSign Coefficient p-value Coefficient p-value Coefficient p-value
INTERCEPT -7.204 <0.0001 -7.867 <0.0001 -7.257 <0.0001
SALARY - -0.158 0.5834
BONUS + 0.274 0.0172
STOCK-BASED COMPENSATION + 0.037 0.0083
STOCK-BASED MIX + 2.083 0.0088
SENSITIVITY + 0.107 0.0277
CEO=CHAIR + 0.871 0.1116 0.884 0.1062 0.923 0.0917
NUMBER OF MEETINGS - 0.026 0.6897 0.024 0.7157 0.056 0.3911
FINANCING +
LEVERAGE + -0.842 0.5364 -0.844 0.5289 -0.964 0.4825
MARKET VALUE OF EQUITY +/- 0.000 0.6309 0.000 0.1739 0.000 0.4455
ALTMAN Z SCORE - -0.048 0.8280 -0.094 0.6584 -0.074 0.7257
MODEL LIKELIHOOD RATIO 22.704 0.0038 15.6668 0.0157 12.0888 0.0600
N = 13,462 13,462 13,462
Notes:(1) Variables are defined in Table 4. In the logit regression, the dependent variable is coded one for
firms accused of accounting fraud by the SEC, zero otherwise.
Table 5CResults of a logit regression comparing 50 firms subject to enforcement actions by the SEC to the remainingfirms on the Execucomp database: Excluding observations with hand collected compensation data (fraud firms, n = 28)
Variable
(A) (B) (C)
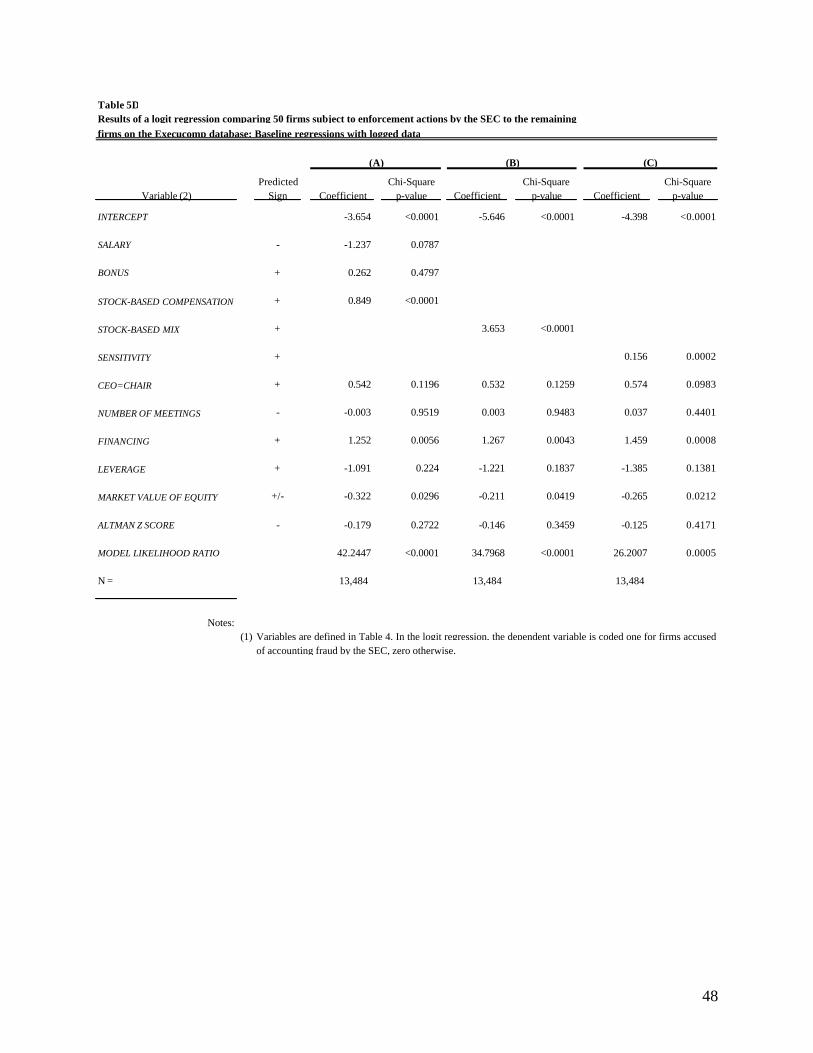
48
Predicted Chi-Square Chi-Square Chi-SquareVariable (2) Sign Coefficient p-value Coefficient p-value Coefficient p-value
INTERCEPT -3.654 <0.0001 -5.646 <0.0001 -4.398 <0.0001
SALARY - -1.237 0.0787
BONUS + 0.262 0.4797
STOCK-BASED COMPENSATION + 0.849 <0.0001
STOCK-BASED MIX + 3.653 <0.0001
SENSITIVITY + 0.156 0.0002
CEO=CHAIR + 0.542 0.1196 0.532 0.1259 0.574 0.0983
NUMBER OF MEETINGS - -0.003 0.9519 0.003 0.9483 0.037 0.4401
FINANCING + 1.252 0.0056 1.267 0.0043 1.459 0.0008
LEVERAGE + -1.091 0.224 -1.221 0.1837 -1.385 0.1381
MARKET VALUE OF EQUITY +/- -0.322 0.0296 -0.211 0.0419 -0.265 0.0212
ALTMAN Z SCORE - -0.179 0.2722 -0.146 0.3459 -0.125 0.4171
MODEL LIKELIHOOD RATIO 42.2447 <0.0001 34.7968 <0.0001 26.2007 0.0005
N = 13,484 13,484 13,484
Notes:(1) Variables are defined in Table 4. In the logit regression, the dependent variable is coded one for firms accused
of accounting fraud by the SEC, zero otherwise.
Table 5D
(A) (B) (C)
Results of a logit regression comparing 50 firms subject to enforcement actions by the SEC to the remainingfirms on the Execucomp database: Baseline regressions with logged data
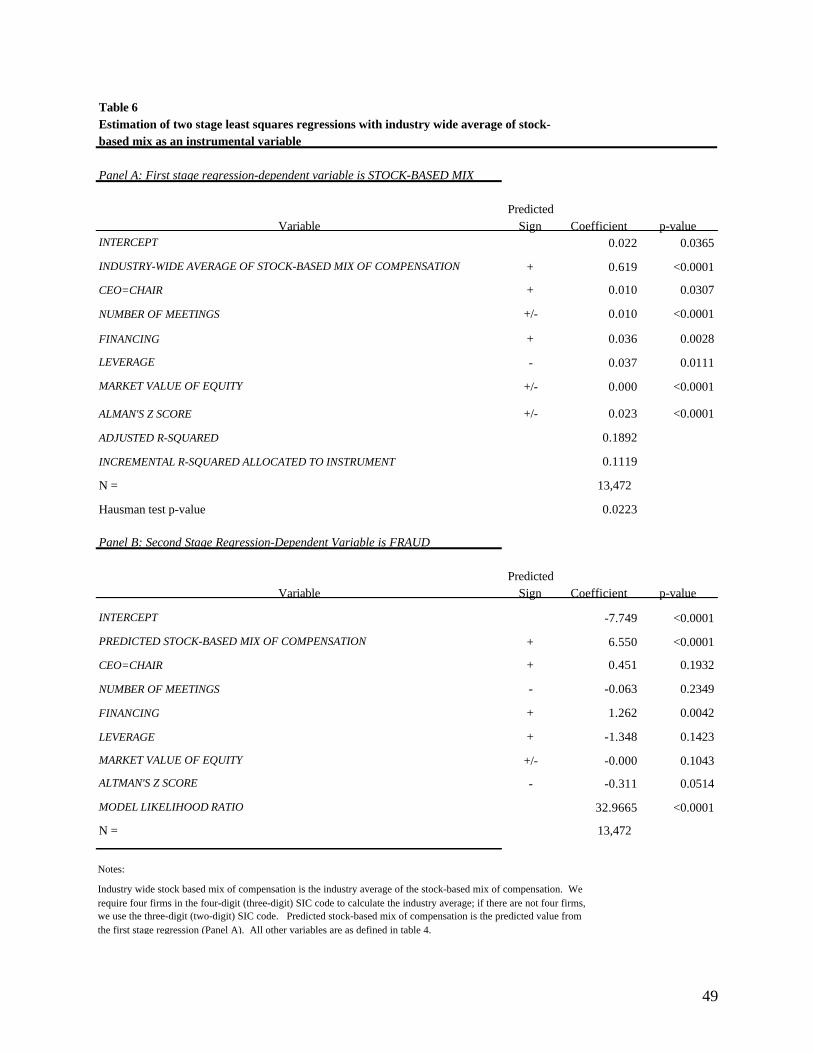
49
Estimation of two stage least squares regressions with industry wide average of stock-
Panel A: First stage regression-dependent variable is STOCK-BASED MIX
PredictedVariable Sign Coefficient p-value
INTERCEPT 0.022 0.0365
INDUSTRY-WIDE AVERAGE OF STOCK-BASED MIX OF COMPENSATION + 0.619 <0.0001
CEO=CHAIR + 0.010 0.0307
NUMBER OF MEETINGS +/- 0.010 <0.0001
FINANCING + 0.036 0.0028
LEVERAGE - 0.037 0.0111
MARKET VALUE OF EQUITY +/- 0.000 <0.0001
ALMAN'S Z SCORE +/- 0.023 <0.0001
ADJUSTED R-SQUARED 0.1892
INCREMENTAL R-SQUARED ALLOCATED TO INSTRUMENT 0.1119
N = 13,472
Hausman test p-value 0.0223
Panel B: Second Stage Regression-Dependent Variable is FRAUD
PredictedVariable Sign Coefficient p-value
INTERCEPT -7.749 <0.0001
PREDICTED STOCK-BASED MIX OF COMPENSATION + 6.550 <0.0001
CEO=CHAIR + 0.451 0.1932
NUMBER OF MEETINGS - -0.063 0.2349
FINANCING + 1.262 0.0042
LEVERAGE + -1.348 0.1423
MARKET VALUE OF EQUITY +/- -0.000 0.1043
ALTMAN'S Z SCORE - -0.311 0.0514
MODEL LIKELIHOOD RATIO 32.9665 <0.0001
N = 13,472
Notes:
Industry wide stock based mix of compensation is the industry average of the stock-based mix of compensation. Werequire four firms in the four-digit (three-digit) SIC code to calculate the industry average; if there are not four firms,we use the three-digit (two-digit) SIC code. Predicted stock-based mix of compensation is the predicted value fromthe first stage regression (Panel A). All other variables are as defined in table 4.
Table 6
based mix as an instrumental variable
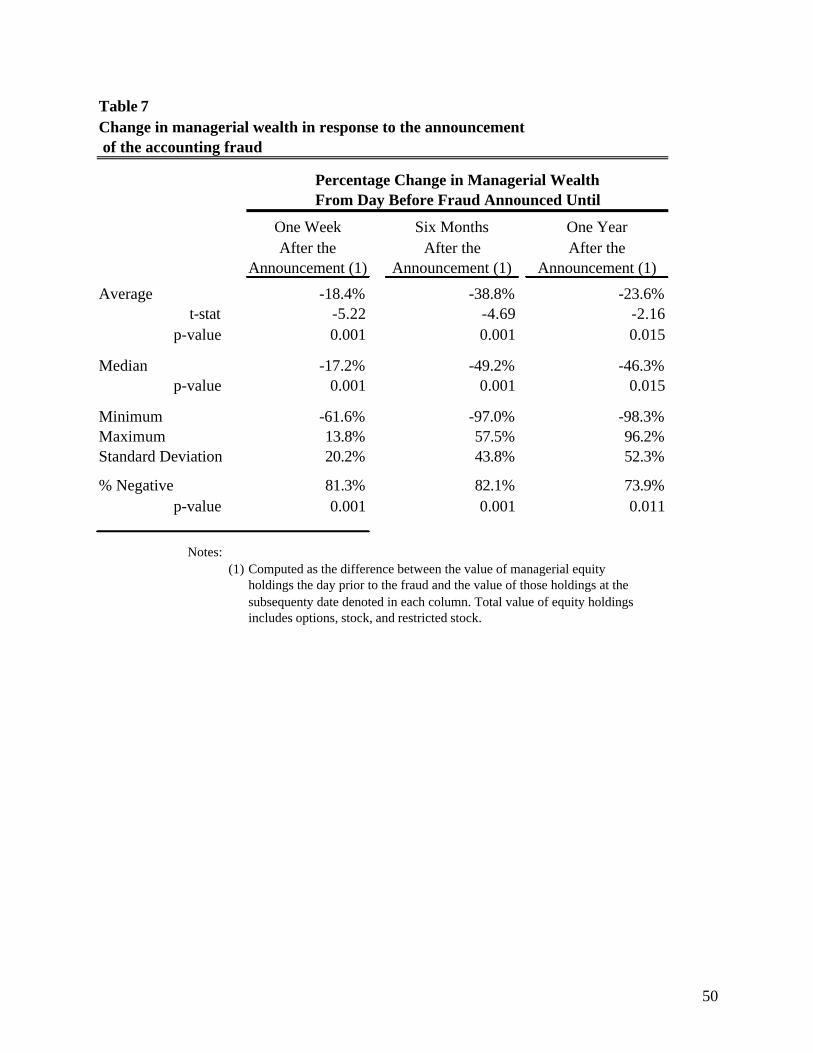
50
One Week Six Months One YearAfter the After the After the
Announcement (1) Announcement (1) Announcement (1)
Average -18.4% -38.8% -23.6%t-stat -5.22 -4.69 -2.16
p-value 0.001 0.001 0.015
Median -17.2% -49.2% -46.3%p-value 0.001 0.001 0.015
Minimum -61.6% -97.0% -98.3%Maximum 13.8% 57.5% 96.2%Standard Deviation 20.2% 43.8% 52.3%
% Negative 81.3% 82.1% 73.9%p-value 0.001 0.001 0.011
Notes:(1) Computed as the difference between the value of managerial equity
holdings the day prior to the fraud and the value of those holdings at thesubsequenty date denoted in each column. Total value of equity holdingsincludes options, stock, and restricted stock.
Change in managerial wealth in response to the announcement of the accounting fraud
From Day Before Fraud Announced Until
Table 7
Percentage Change in Managerial Wealth
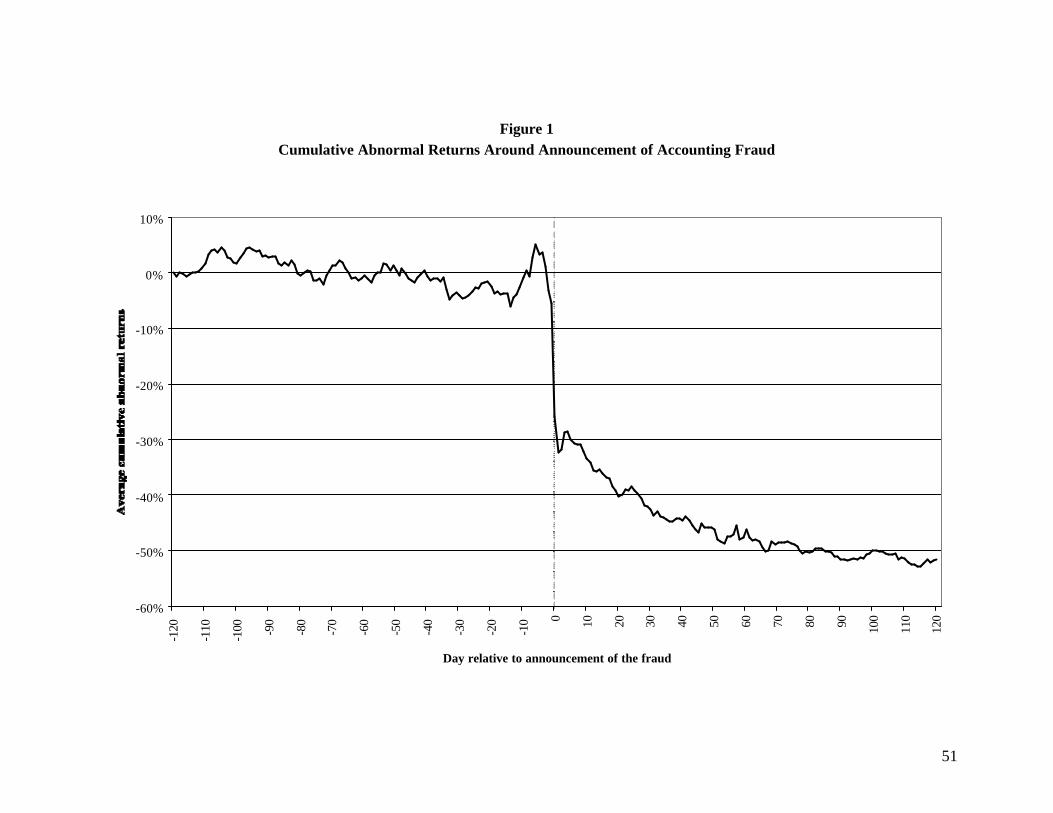
51
Figure 1Cumulative Abnormal Returns Around Announcement of Accounting Fraud
-60%
-50%
-40%
-30%
-20%
-10%
0%
10%
-120
-110
-100 -90
-80
-70
-60
-50
-40
-30
-20
-10 0 10 20 30 40 50 60 70 80 90 100
110
120
Day relative to announcement of the fraud