Embed Size (px)
Citation preview
CE
UeT
DC
olle
ctio
n
Is there potential for trade growth?
A gravity approach in the case of Serbia
By
Snezana Ilic
Submitted to
Central European University
Department of Economics
In partial fulfillment of the requirements for the degree of Master of Arts
Economic Policy in Global Markets
Supervisor: Professor László Mátyás
Budapest, Hungary
2012

CE
UeT
DC
olle
ctio
n
i
To my parents for supporting my intellectual pursuits
CE
UeT
DC
olle
ctio
n
ii
Gravity is not easy, but it is the law.
Author Unknown
Abstract
Following the political change in 2000 Serbia has started to participate in the international
markets flows, to liberalize its economy and to pursue the way toward the European integration.
The main characteristic of the economy are chronic high fiscal and trade deficits threatening
sustainable growth even more in the light of the financial crisis. The present research investigates
potential for trade enlargement, in particular exports increase with the EU and CEFTA2006
members using a gravity approach. In order to develop the model with included fixed effects the
panel data are used for the period 2004-2007. The results suggest that neighboring countries,
with which Serbia has traditionally common economic, political and cultural ties, are particularly
open for trade. Furthermore, the most open European countries are those geographically close in
the Central and Eastern Europe. This study does not limit here but proposes policies for export
diversification and a wider base of exportables with a higher value added.
CE
UeT
DC
olle
ctio
n
iii
Table of Contents
Introduction ...................................................................................................................................... 1
Chapter 1: An overview of trade openness and patterns of trade in Serbia .................................... 5
1.1 Trade openness ....................................................................................................................... 5
1.2 Patterns of trade: data and statistics ........................................................................................ 9
Chapter 2. Literature review: The Gravity model .......................................................................... 11
2.1. Economic theory behind the gravity equation ..................................................................... 11
2.2. The Gravity model in Central and Eastern European countries and Western Balkan ......... 14
Chapter 3. Gravity model for Serbia .............................................................................................. 20
3.1 Methodology and data .......................................................................................................... 20
3.2 Data description and sources ................................................................................................ 21
3.3 Consequences of a single country gravity models ................................................................ 23
3.4 The Gravity model for exports ............................................................................................. 24
3.5 The Gravity model for imports ............................................................................................. 27
Chapter 4. Relationship between trade and export diversification and economic growth ............. 30
4.1 Export-led growth in Serbia ................................................................................................. 34
4.2 Reasons for unsatisfactory foreign trade performance in Serbia .......................................... 36
Chapter 5. Policy recommendations and conclusions .................................................................... 38
References ...................................................................................................................................... 43
CE
UeT
DC
olle
ctio
n
iv
List of figures
Figure 1 Exports of goods and services as percent of GDP– Comparison of Serbia and Croatia
(1990-2010) ...................................................................................................................................... 8
Figure 2: Trade balance with the EU.............................................................................................. 10
Figure 3: External trade balance as % of GDP (constant 2000 US$) ............................................ 36
List of tables
Table 1: Basic macroeconomic indicators growth rates (1991-2001) .............................................. 6
Table 2: Trade openness ratios ......................................................................................................... 7
Table 3: Estimated results for exports including specific fixed effects (within) regression .......... 25
Table 4: Estimated results for imports including specific fixed effects (within) regression .......... 28
Table 5: External trade of goods and current account deficit......................................................... 35
CE
UeT
DC
olle
ctio
n
1
Introduction
The desire of Serbia to join the European Union (EU) has been evident since the
establishment of new regime in 2000 after the end of Milosevic’s era. A country that lost one
decade did not have any more time to lose in the transition period, therefore it was firmly
determined to accept European values. However, reaching this goal was and still is a problematic
path to follow with many objectives to be achieved. The most recent step was that Serbia was
granted official candidate status for EU membership on 1 March 2012 (European Commission).
The intention of the EU toward the Western Balkan region1 was logical: to create an
environment which encourages economic growth and keeps peace in this region prone to constant
tensions in the last two decades. The EU confirmed its dedication in 2006 by stating that "the
future of the Western Balkans lies in the European Union" (European Commission 2011). The
creation of the Stabilization and Association Process (SAP) in 2000 was a step toward the
Western Balkan integration with the aspiration to prepare those countries for the accession to the
EU (Montanari 2005). One of the tools to achieve this aim is to promote regional trade in this
area, as well as trade between the EU and future member countries. The level of trade integration
is even used as one of the indicators of the country’s capacity to follow further integration into
the EU and is evaluated as a part of the second economic criterion by the European Commission
(EC). Furthermore, it represents the extent to which countries are able to deal with competitive
pressure from the EU environment (Sosic, Vujcic 2005).
The Western Balkan region, and thus Serbia as part of it, shares common characteristics,
such as small population, low income per capita and high and increasing unemployment
1 Western Balkan region includes Albania, Croatia, Bosnia-Herzegovina, the Former Yugoslav Republic (FYR) of
Macedonia, Montenegro and Serbia.
CE
UeT
DC
olle
ctio
n
2
(Montanari 2005), especially in the light of the economic downturn which suggests even more
problematic economic integration into the EU environment. In this setting, trade policy is
generally seen as a tool to enhance this process which was implemented in the form of the
Stabilization and Association Agreement (SAA) for the region. Agreement between the European
Communities and their member states and the Republic of Serbia was signed in April 20082. The
Agreement entails, inter alia, commitment toward the development of further economic relations
between the parties, including development of trade and investments, as these are perceived being
crucial factors for successful restructuring of the economy. The agreement aims at gradual
development of free bilateral trade area that should be created in the period of a maximum six
years. A characteristic of SAA is that it offers asymmetric trade liberalization when countries are
given a few years transition period while, on the other hand, the EU opens its markets more
quickly allowing free access to almost all products without quantitative restrictions (Montanari
2005).
Serbia is a member of yet another trade agreement that was signed in 2006, the Central
European Free Trade Agreement (CEFTA-2006)3 which was originally created in 1992 as
CEFTA. After the original CEFTA members4 joined the EU, they left this organization.
However, the CEFTA-2006 has the same aim as its predecessor - to promote regional trade and
prepare countries for exposure to severe competition forces present in the EU market. As stated
by Petreski (2011), it was not only the geographical proximity that determined the willingness to
be a part of this organization but the motivation to join the EU as soon as possible. In the same
study, it is estimated that the effect on trade of CEFTA-2006 is greater than the effect of SAA.
2 Internet, European Commission, http://ec.europa.eu/enlargement/pdf/serbia/key_document/saa_en.pdf
3 CEFTA2006 has 7 members: Albania, Bosnia-Herzegovina, Croatia, the United Nations Interim Administration Mission (UNMIK)
in Kosovo, FYR of Macedonia, Moldova and Serbia. 4 Original CEFTA Agreement was established in 1992 by the Visegrad Group countries (Poland, Hungary, Slovak Republic and
Czech Republic)
CE
UeT
DC
olle
ctio
n
3
At the moment, Serbia is facing negative trends for almost all macroeconomic indicators
threatening to endanger its further economic development. Fiscal deficit is close to the threshold
while the public debt is already above the limit predicted by the law and exhibits increasing trend.
The Fiscal Council of Serbia warned that the country is on the way toward debt crisis that will
have adverse consequences for the Serbian economy such as severe devaluation of Serbian
currency and increased inflation.5 This is one of the reasons why the issue of exports enlargement
needs to be tackled.
Twin deficits show that Serbia was spending more than it was producing, and this gap was
financed by international loans. Current patterns of consumption which were financed by loans
instead of directing them into production and investments are threatened in the light of the global
economic downturn when investors became more reluctant to invest. Having in mind all those
limitations, it is very important to address the problem of sustained economic development. One
of the most common proposals is to concentrate on the export enlargement through either finding
new trading partners or increasing volumes of exports to the already existing markets. The
Strategy on Republic of Serbia Exports Increase for period 2008-2011 already exists. However,
further commitment is needed in order to achieve satisfactory performance in this field.
The objective of this paper is to explore the potential for Serbia’s further trade expansion,
particularly with the EU countries. The same question is relevant for the trade with the CEFTA-
2006 member states. Given the high concentration of Serbian trade policy, both in trading
partners and products, the aim of this paper is to propose policies toward increased diversification
that will enable higher and less volatile exports earnings. Policies will concentrate both on
volumes of trade, a topic that will be discussed in the framework of the gravity model and on the
5 Internet, The Fiscal Council of Serbia, www.fiskalnisavet.rs
CE
UeT
DC
olle
ctio
n
4
structure of export products where there is a need to increase the share of exporting products with
higher value added at the expense of low processed products.
This issue has been very often discussed in the framework of the gravity model, which has
been used to assess international trade patterns and volumes of trade. The wide usage of this
model is a consequence of its relatively simple form and the fact that data needed for the
estimation are easily accessible. According to Paas (2000), this is even more important in the case
of transition economies, since the provision of reliable and easily available statistical data are
rather exception than a rule. Moreover, the Balkan countries, Serbia in particular, were in the
recent past excluded from international flows in general due to political events in the region.
After liberalization when political and economic opening of the economy has started, those
countries had to go through a transition period. This precludes the possibility to use the
extrapolation method to predict future trade flows based on passed data. This is why a gravity
model presents a good option to overcome the problem of non-comparable data (Ferragina 2005).
The paper is organized as follows. The first chapter will provide insight into the trade
policy and its tendencies in the last two decades emphasizing the main problems that are high
concentration in both partners and products. The second chapter gives the theoretical background
for the utilization of the gravity approach as well as literature review in the context of Central
Eastern and Balkan countries. Details and estimated models for export and import are given in
chapter 3. The following chapter provides support for the policies proposed in the last chapter
namely, the nexus between the exports enlargement and diversification on the one hand and
economic growth on the other. Finally, the last chapter will propose policies toward increased
and more stable exports earnings.
CE
UeT
DC
olle
ctio
n
5
Chapter 1: An overview of trade openness and patterns of trade
in Serbia
Before considering the gravity model, it is important to identify more general indicators
of the trade policy and their tendencies in the last two decades. Following a popular approach,
openness ratio6 and geographical distribution of trade flows are often useful starting points in this
analysis (Gros 1996, Sosic and Vujcic 2005). Hence, this section provides a short historical
overview of trade openness and patterns in Serbia during the 1990s and after liberalization of the
economy during 2000s. This analysis will show high trade concentration in terms of partners and
narrow base of exportables which is the main reason for implementation of more sustainable
trade policies.
1.1 Trade openness
The period from 1990-2000 was characterized by the closing of the domestic economy to
the foreign markets due to sanctions and the exclusion of the Federal Republic of Yugoslavia7
(FRY) from all international financial and trade institutions. This had as a consequence a
reduction in domestic production and GDP, a tendency toward lower exports, imports and
investments. Yet another characteristic is a relatively high trade deficit through the whole period.
After the introduction of sanctions by the EU and the Security Council in 1992, FRY lost the
most important markets which were those in the former Yugoslav Republics8 accounting for
6 Openness ratio is defined as (imports + exports)/ GDP
7 Federal Republic of Yugoslavia was established in 1992, after the breakup of the Social Federal Republic of Yugoslavia (SFRY).
From 2003-2006, FRY is reconstituted into the State Union of Serbia and Montenegro. After the referendum in Montenegro, where the majority was for secession, the republic of Serbia was established. 8 Former Yugoslav Republics are: Slovenia, Croatia, FYR of Macedonia, Bosnia and Herzegovina
CE
UeT
DC
olle
ctio
n
6
more than twice as much in comparison to the rest of the world (Kovacevic 2005). All indicators
showed negative tendencies at the beginning of the decade for this reason.
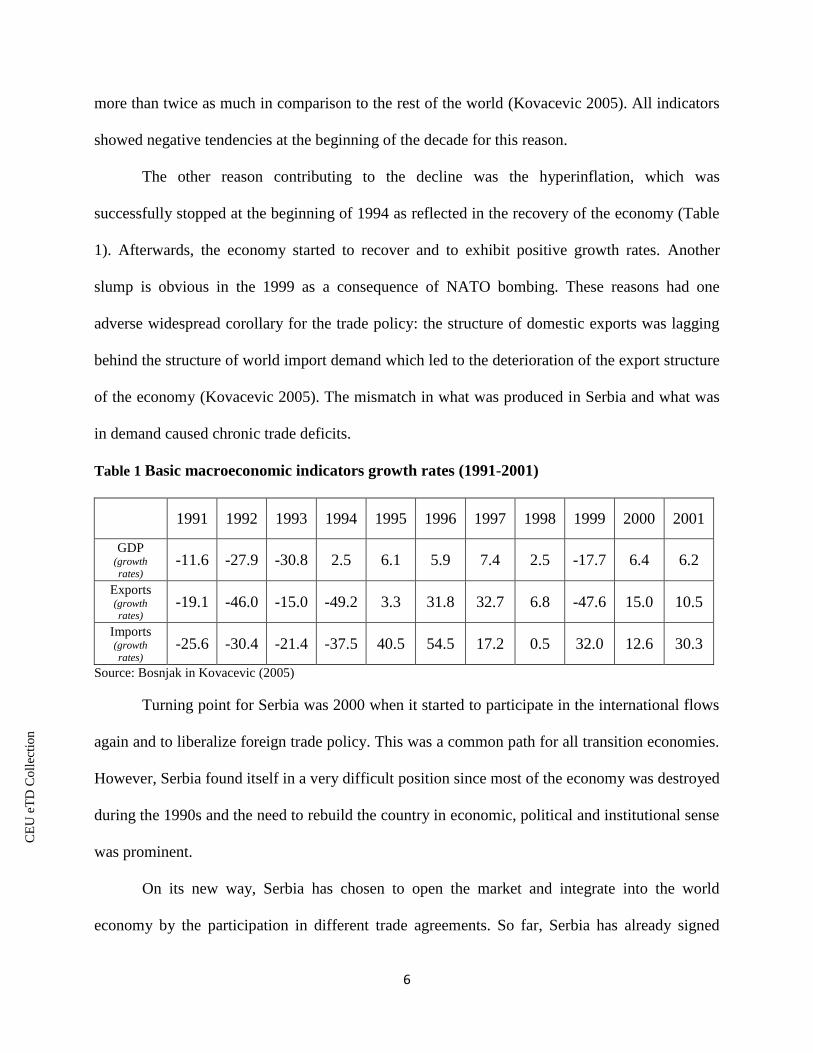
The other reason contributing to the decline was the hyperinflation, which was
successfully stopped at the beginning of 1994 as reflected in the recovery of the economy (Table
1). Afterwards, the economy started to recover and to exhibit positive growth rates. Another
slump is obvious in the 1999 as a consequence of NATO bombing. These reasons had one
adverse widespread corollary for the trade policy: the structure of domestic exports was lagging
behind the structure of world import demand which led to the deterioration of the export structure
of the economy (Kovacevic 2005). The mismatch in what was produced in Serbia and what was
in demand caused chronic trade deficits.
Table 1 Basic macroeconomic indicators growth rates (1991-2001)
1991 1992 1993 1994 1995 1996 1997 1998 1999 2000 2001
GDP (growth
rates) -11.6 -27.9 -30.8 2.5 6.1 5.9 7.4 2.5 -17.7 6.4 6.2
Exports (growth rates)
-19.1 -46.0 -15.0 -49.2 3.3 31.8 32.7 6.8 -47.6 15.0 10.5
Imports (growth
rates) -25.6 -30.4 -21.4 -37.5 40.5 54.5 17.2 0.5 32.0 12.6 30.3
Source: Bosnjak in Kovacevic (2005)
Turning point for Serbia was 2000 when it started to participate in the international flows
again and to liberalize foreign trade policy. This was a common path for all transition economies.
However, Serbia found itself in a very difficult position since most of the economy was destroyed
during the 1990s and the need to rebuild the country in economic, political and institutional sense
was prominent.
On its new way, Serbia has chosen to open the market and integrate into the world
economy by the participation in different trade agreements. So far, Serbia has already signed
CE
UeT
DC
olle
ctio
n
7
bilateral trade agreements with the Russian Federation,9 Belorussia,
10 Turkey,
11 Kazakhstan
12 and
the United States13
as well as multilateral agreements with the EU. Furthermore, Serbia is a
CEFTA-2006 member, and has a preferential trade agreement with the European Free Trade
Association (EFTA).14
The signed agreements allow duty-free access to the markets of more than
800 million people,15
which represents a huge opportunity for Serbian exports whose importance
is even more emphasized in the case of an increased need for foreign exchange.
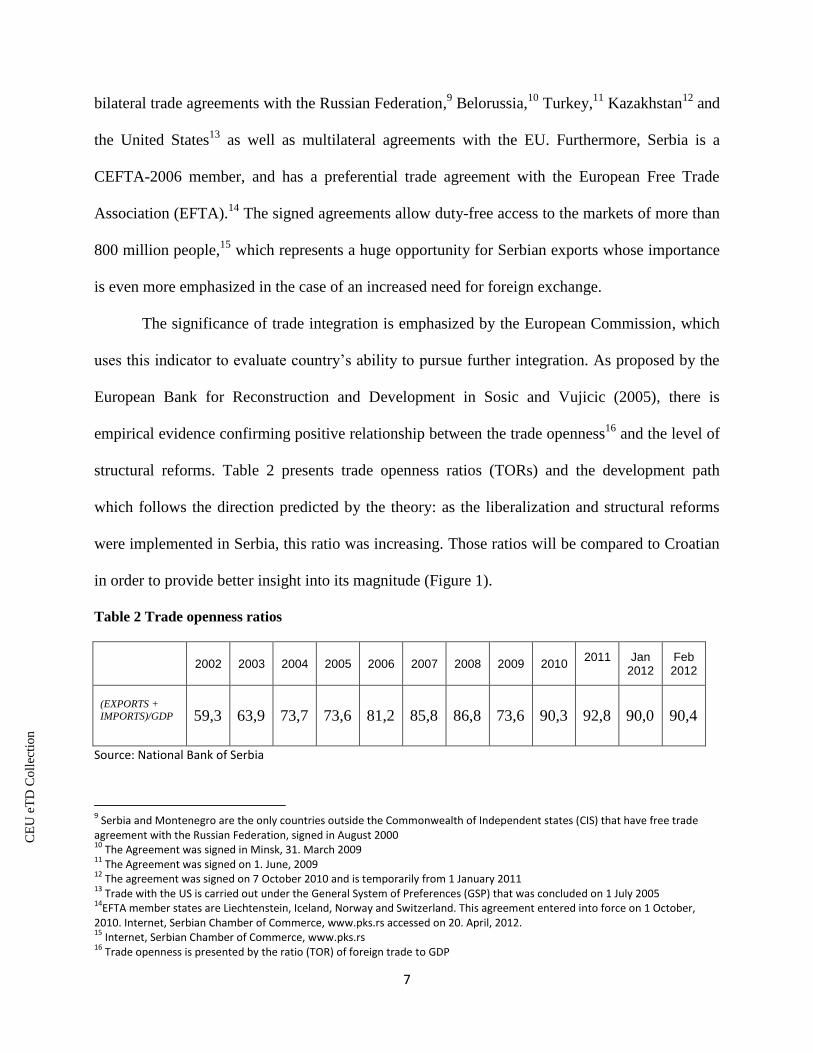
The significance of trade integration is emphasized by the European Commission, which
uses this indicator to evaluate country’s ability to pursue further integration. As proposed by the
European Bank for Reconstruction and Development in Sosic and Vujicic (2005), there is
empirical evidence confirming positive relationship between the trade openness16
and the level of
structural reforms. Table 2 presents trade openness ratios (TORs) and the development path
which follows the direction predicted by the theory: as the liberalization and structural reforms
were implemented in Serbia, this ratio was increasing. Those ratios will be compared to Croatian
in order to provide better insight into its magnitude (Figure 1).
Table 2 Trade openness ratios
2002 2003 2004 2005 2006 2007 2008 2009 2010 2011
Jan
2012 Feb 2012
(EXPORTS +
IMPORTS)/GDP 59,3 63,9 73,7 73,6 81,2 85,8 86,8 73,6 90,3 92,8 90,0 90,4
Source: National Bank of Serbia
9 Serbia and Montenegro are the only countries outside the Commonwealth of Independent states (CIS) that have free trade
agreement with the Russian Federation, signed in August 2000 10
The Agreement was signed in Minsk, 31. March 2009 11
The Agreement was signed on 1. June, 2009 12
The agreement was signed on 7 October 2010 and is temporarily from 1 January 2011 13
Trade with the US is carried out under the General System of Preferences (GSP) that was concluded on 1 July 2005 14
EFTA member states are Liechtenstein, Iceland, Norway and Switzerland. This agreement entered into force on 1 October, 2010. Internet, Serbian Chamber of Commerce, www.pks.rs accessed on 20. April, 2012. 15
Internet, Serbian Chamber of Commerce, www.pks.rs 16
Trade openness is presented by the ratio (TOR) of foreign trade to GDP
CE
UeT
DC
olle
ctio
n
8
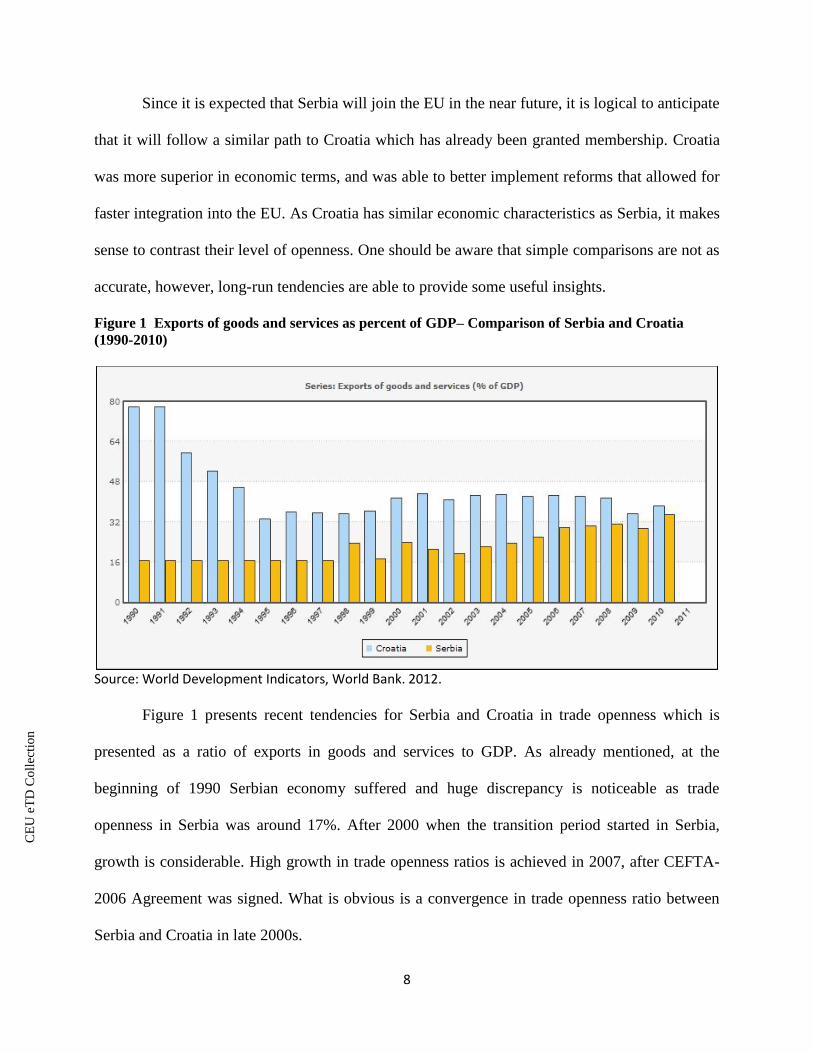
Since it is expected that Serbia will join the EU in the near future, it is logical to anticipate
that it will follow a similar path to Croatia which has already been granted membership. Croatia
was more superior in economic terms, and was able to better implement reforms that allowed for
faster integration into the EU. As Croatia has similar economic characteristics as Serbia, it makes
sense to contrast their level of openness. One should be aware that simple comparisons are not as
accurate, however, long-run tendencies are able to provide some useful insights.
Figure 1 Exports of goods and services as percent of GDP– Comparison of Serbia and Croatia
(1990-2010)
Source: World Development Indicators, World Bank. 2012.
Figure 1 presents recent tendencies for Serbia and Croatia in trade openness which is
presented as a ratio of exports in goods and services to GDP. As already mentioned, at the
beginning of 1990 Serbian economy suffered and huge discrepancy is noticeable as trade
openness in Serbia was around 17%. After 2000 when the transition period started in Serbia,
growth is considerable. High growth in trade openness ratios is achieved in 2007, after CEFTA-
2006 Agreement was signed. What is obvious is a convergence in trade openness ratio between
Serbia and Croatia in late 2000s.
CE
UeT
DC
olle
ctio
n
9
1.2 Patterns of trade: data and statistics
Serbian trade policy is very much concentrated, both in terms of partners and in terms of
products and thus, unfavorable. The idea behind export diversification is the same as the idea of
portfolio diversification which is to decrease risk.
The main trading partners did not change significantly in the last decade, principally the
most important 20 partners. In 2010, the most important export receiving countries are Italy,
Bosnia and Herzegovina and Germany, with share in total exports 11.4, 11.1 and 10.3 percent
respectively. The biggest share of imports is from the Russian Federation (12.9%), Germany
(10.6%) and Italy (8.5%). If calculated as a whole, the EU is by far the most important trading
partner for all Western Balkan countries including Serbia. Trade with the EU accounts for around
65% of total trade in the last few years.17
The second major partner are CEFTA2006 countries with whom Serbia have a surplus in
trade, resulting mainly from exports of agricultural products (cereals and similar products and
various drinks), and iron and steel exports. Regarding imports - mostly imported is coal, coke and
briquettes, iron and steel, electricity, as well as vegetables and fruits.18
A surplus with CEFTA
members is very important as it helps to some extent, to finance the trade deficit with the EU
countries.
The largest single country surpluses in trade in 2011 have been made with Montenegro,
Bosnia and Herzegovina and Macedonia. The highest deficit has been recorded in trade with the
Russian Federation because of energy imports, mainly oil and gas, followed by deficits with
China, Hungary and Germany.19
17
IMF, DoTS 18
Internet, Statistical Office of the Republic of Serbia, www.stat.gov.rs 19
Internet, Statistical Office of the Republic of Serbia, www.stat.gov.rs
CE
UeT
DC
olle
ctio
n
10
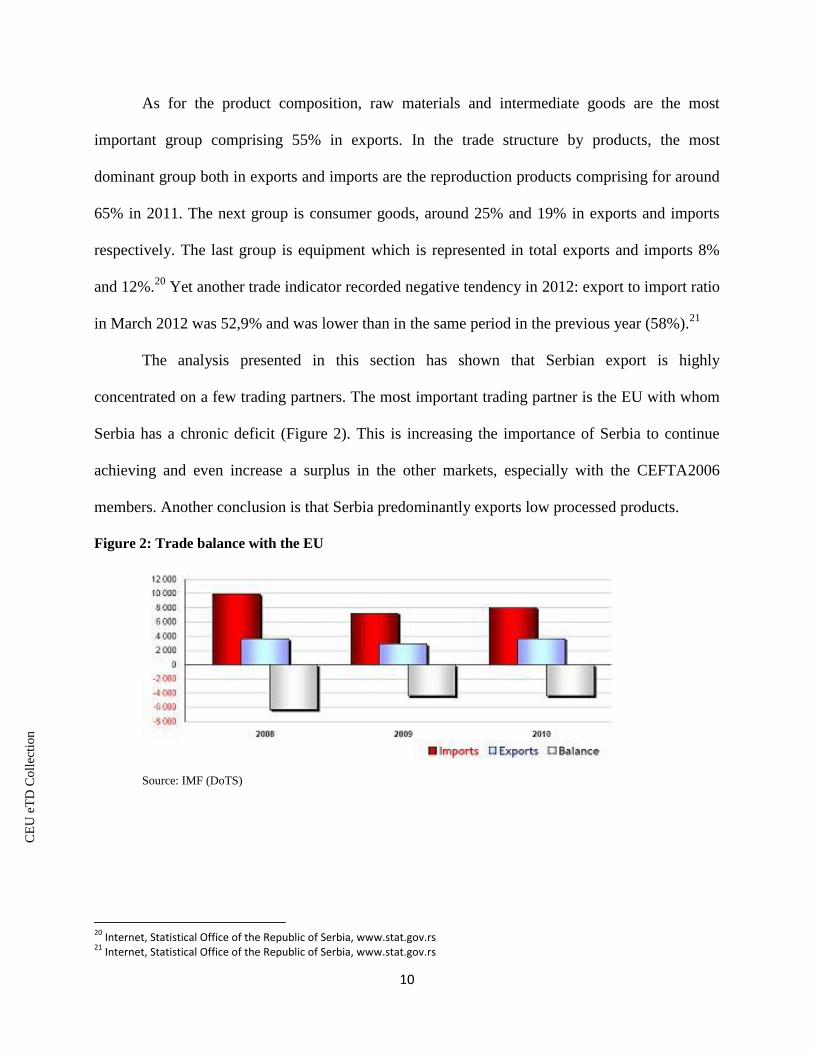
As for the product composition, raw materials and intermediate goods are the most
important group comprising 55% in exports. In the trade structure by products, the most
dominant group both in exports and imports are the reproduction products comprising for around
65% in 2011. The next group is consumer goods, around 25% and 19% in exports and imports
respectively. The last group is equipment which is represented in total exports and imports 8%
and 12%.20
Yet another trade indicator recorded negative tendency in 2012: export to import ratio
in March 2012 was 52,9% and was lower than in the same period in the previous year (58%).21
The analysis presented in this section has shown that Serbian export is highly
concentrated on a few trading partners. The most important trading partner is the EU with whom
Serbia has a chronic deficit (Figure 2). This is increasing the importance of Serbia to continue
achieving and even increase a surplus in the other markets, especially with the CEFTA2006
members. Another conclusion is that Serbia predominantly exports low processed products.
Figure 2: Trade balance with the EU
Source: IMF (DoTS)
20
Internet, Statistical Office of the Republic of Serbia, www.stat.gov.rs 21
Internet, Statistical Office of the Republic of Serbia, www.stat.gov.rs
CE
UeT
DC
olle
ctio
n
11
Chapter 2. Literature review: The Gravity model
The idea of the gravity model was taken from Newton’s law of Gravitation describing the
gravity force between the two entities, stating that the force is positively correlated with their
masses and negatively correlated with their distance. The same notion is adopted in the field of
economics and applied on different situations. This section will look back on the economic theory
behind the demand-supply gravity equation. Following this, a selective review of the model used
to predict trade in the Central and Eastern European and in Balkan countries will be presented.
2.1. Economic theory behind the gravity equation
The gravity models have been used relatively successfully in the past several decades to
predict the levels of trade. Besides this, it has long been used to model factor movements such as
migration decisions, the flow of Foreign Direct Investments (FDI) and recently, to model
international portfolio investments (Anderson 2010).
In its simplest form the model propose that bilateral trade is directly proportional to the
size of the economies which is frequently approximated by the Gross Domestic Product (GDP)
and negatively correlated with the distance. In other words, the trade between two countries may
be explained in the supply-demand manner: trade depends on the supply conditions of the
exporting country and demand conditions in the importing country. Second basic variable is the
distance between trading partners that accounts for trade costs which may be measured in
different ways. One possibility is to use the distance between the capitals or between trade
centers. Another alternative is to use the “great circle” formula for which the longitude and
CE
UeT
DC
olle
ctio
n
12
latitude data on the economic centers are needed. Those data are then applied into the formula to
gain the distance in miles:
Dij = 3962.6 arccos [sin(Yi) x sin(Yj)] + [cos(Yi) x cos(Yj) x cos(Xi – Xj)],
where X stands for longitude in degrees multiplied by 57.3 to express it in radians. Y stands for
latitude multiplied by -57.3 (Head 2003). It would be even more accurate to use road distances
rather than air distances. However, for the case of Serbia, this distinction will not make a big
difference.
The equation including basic explanatory variables is presented below:
TTij = A ,
where
TTij stands for total trade between countries i and j;
Yi, Yj – size of the economies i and j;
Dij – the distance between countries i and j that approximates trade costs;
A is a constant gravity parameter.
After taking natural log, the gravity equation may present linear relationship between the
economy sizes and distance:
lnTTij = ln A + α ln Yi + β ln Yj – φ ln Dij.
The gravity model may be further augmented with other explanatory variables such as
income per capita, adjacency or common border, common language etc. (Nilsson 2000) that
usually account for historical and cultural nearness such as common border and language.
Moreover, trade is expected to increase as a consequence of signed Preferential and Free Trade
Agreements, like in the case of trade liberalization in the European common market. This model
CE
UeT
DC
olle
ctio
n
13
may include the effect of exchange rate policies and the adoption of common currency. However,
findings of exchange rate variable influence are mixed (Nilsson 2000, Head 2003).
International trade is yet another field in the economics where the gravity model has been
successfully applied since 1962. Tinbergen and Lineman were among the first who applied this
model. Later, the model was improved by many authors (e.g. Anderson 1979, Bergstrand 1985).
The utilization of this model has been criticized for the lack of theory in spite of its widely usage.
Anderson was among the first economists to provide the theoretical base for the gravity model
using preferences that exhibit constant elasticities of substitution (CES). One of the assumptions
is the hypothesis of the “identical homothetic preferences across regions” (p. 106) i.e. identical
Cobb-Douglas preferences which together with the availability of the constant prices at the
equilibrium value leads to the perfect specialization when only one product is produced in one
country (in compliance with Keynesian trade model). In its simplest form, the pure expenditure
system proposes that the demand for good i in country j is defined by
M ij = bi Yi
where bi stands for the share of income spent by the country j on the good i and is the
same for all countries as a consequence of the Cobb-Douglas preferences; Yi presents income in
country j. Moreover, income must equal consumption:
Yi = bi (Σj Yj).
Further transformation and substitution leads to the simplest form of gravity model:
Mij = Yi Yj / Σ Yj (Anderson 1979).
The theory behind the gravity equation was analyzed by Evenett and Keller (1998) who
were interested into two main international trade theories, the Heckscher-Ohlin (H-O) theory and
the Increasing Returns (IRS) theory. In the Heckscher-Ohlin setting, the main assumption is that
countries are identical besides the different factor endowment which is the driving force for the
CE
UeT
DC
olle
ctio
n
14
trade. Trade in H-O setting is completely inter-industry trade. Moreover, constant returns to scale
(CRS) are assumed. The authors provide the evidence that perfect product specialization based on
the different factor endowments is not enough to explain the gravity behavior. On the other hand,
the presence of the IRS allows for trade even when there are no factor endowments differences. A
consequence of this is an inter-industry trade, which definitely describes better real trade flows.
According to authors, IRS theory is the major reason in explaining trade flows (Evenett 1998).
2.2. The Gravity model in Central and Eastern European countries and Western
Balkan
The notion of the international trade and its potential was again in the centre of discussion
during the 1990s, since during that period Central Eastern European Countries (CEECs) were on
their way toward the EU experiencing fast trade integration. Researchers (Baldwin 1994, Nilsson
2000, Bussiere et al 2008, Gros 1996) were interested in similar questions that are now relevant
for Balkan countries: how much has the trade potential been exploited so far and whether there is
a room for its enlargement? If the answer to the latter question is positive, it is important to
consider which trade policies may be proposed to fully utilize the potential. Policies proposed
certainly play an important role in the future shaping of the trade patterns.
A research question of the above cited articles was shaped by the proposition of the
European Commission that the level of trade integration between the EU and CEECs present
their ability to cope with pressures from the open European market. Hence, the higher level of
trade meant the better possibilities for the integration into the EU (Nilsson 2000). Besides
standard explanatory variables in the gravity model, Nilsson included a few dummy variables of
which language and border were statistically significant. As the point of reference in this study
CE
UeT
DC
olle
ctio
n
15
was the level of trade integration in OECD countries, it is concluded that CEECs are integrated in
the EU as OECD countries are integrated on average. The author compares the ratios of potential
trade based on the gravity model to actual trade for CEECs: the results are lower ratios than in the
Baldwin’s study (1994) meaning that some of the potential was already used in a meanwhile.
However, he concluded that there is still unused trade potential for CEECs. The opposite
conclusion was derived by Gros and Gonciarz (1996) as the GDP data before 1989 are over
valuated creating inaccurate results. They argue that level of GDP in 1989 was at much higher
level than in 1992 and that contributed to inaccurate over-estimation of real trade potential.
Nilsson (2000) uses a gravity model extended for the influence of the exchange rate changes in
CEECs and its impact on the levels of trade. Changes in the exchange rate in CEECs are mixed,
since some countries experienced appreciation while the other experienced devaluation to USD
and it does not explain why some countries had trade above and some below their potential level.
A similar subject is addressed by Busierre et al. (2008). The transition related factors such
as lacking transport infrastructure, low level of experience for dealing business in those countries,
institutional uncertainties –that may be described as obstacles to trade, made the difference
between the actual and potential trade, especially in the early phase of transition. The authors
include additional variables such as country pairs individual effects to account for unobservable
factors that cannot be contained in the dummies (such as non-tariff barriers, openness to trade
etc). Furthermore, the time specific effects are included to control for widespread shocks like
globalization. Their conclusion is that for CEECs trade potential is almost fully used, there is
only little room for improvement.
At this moment, Western Balkan countries are in the analogous phase of the EU
integration as the CEECs were during the 90s. Even though there is no wide literature dealing
with this issue in the context of Western Balkan countries there are some studies addressing this
CE
UeT
DC
olle
ctio
n
16
subject (Christie 2002, Kaminski 2003). Grupe and Kusic (2005) address the question whether it
is reasonable to expect that enhanced regional integration, mainly in terms of free trade, will have
positive effects on the small economies comprising Western Balkan countries. Most of the trade
barriers between this region and the EU have already been eliminated, with only some non-tariff
barriers left. In this setting, the main obstacle for further trade enlargement appears to be similar
trade structure of those economies and little complementarities. They conclude that due to
comparable trade interests and a dominant labor intensive production, there is no much space for
regional trade enlargement. In the same work, they emphasize yet another conclusion: incoherent
approach implemented by the EU. There is a contradictory tendency of the EU making local
integration a condition for the EU accession and, on the other hand, fostering integration with the
West at the expense of the regional integration. Furthermore, the EU has kept an individual
country approach, offering support in return for implementing reforms aimed at the restructuring
of the economy (Grupe and Kusic 2005). The same problem, “an eternal conflict of bilateralism
and multilateralism in the EU trade relations with the Western Balkans” (p.10), is addressed by
Bjelic (2005) where he suggests that the EU should support regional integration by providing
trade concessions to the whole region instead of implementing an individual country approach.
This will have a positive incentive on the countries in the region to increase collaboration.
Two studies address trade in the Western Balkan region using estimated gravity equations
and both derive a similar conclusion (Christie 2002, Kaminski 2003). According to Christie
(2002), there are deviations from potential level of trade, for instance, the trade between Bosnia
and Herzegovina and Serbia and Croatia is much lower than its potential. Kaminski (2003)
concludes that there is more potential for trade growth among countries in this region. Moreover,
there is space for trade enlargement with the EU countries as well.
CE
UeT
DC
olle
ctio
n
17
The same problem is addressed by Montanari (2005) who concentrates on the Western
Balkan region and applies often used two step gravity model, separately for imports and exports
in order to examine potential for increase in trade between Western Balkans and the EU. Firstly,
he estimates the gravity equation coefficients for countries with a functioning market economy.
Afterwards, he applies estimated coefficients to data to get potential trade (PT) and compare it
with the actual trade (AT) data to get information on the achieved level of trade. Montinari
(2005) concludes that Agreements with the EU, as a part of SAA, and WB countries had
affirmative effects on trade, especially in the case of Romania and Bulgaria emphasizing the
influence of the asymmetric approach. One more time the analogy with the CEEC may be made:
at the beginning of transition process a large potential for trade enlargement exists (Baldwin
1994). However, later studies show less room for trade increase between the EU and CEEC.
Similar founding may be expected for Western Balkan countries. A policy proposed by the author
is that EU should immediately liberalize its trade, including agricultural and textile products
coming from Balkans which is by and large the policy path already taken (Montanari 2005).
A comparable analysis for Croatia is done by Sosic and Vujcic (2005) in order to assess
the extent to which Croatia has fulfilled the economic criteria to join the EU. A single country
gravity equation is estimated and potential trade flows based on it. They note one of the
drawbacks of this approach is the inability to predict trade structure. It is argued that there is a
home country bias toward the former Yugoslav Republics which is a consequence of numerous
Preferential Trade Agreements, that have additionally lessen trade diversification and caused
slower trade integration of Croatian economy with other CEECs.
CE
UeT
DC
olle
ctio
n
18
A study relevant for the presented research, aimed at evaluating trade potential of Serbia
with the North African region,22
using the gravity approach was conducted in 2009 (Stanojevic
2010). In the light of the increasing trade deficit, the interest to discover new trade markets or
already existing ones with unused trade potential especially exports have increased. A gravity
equation for exports is estimated using the panel data analysis for 2005-2008 period, and bilateral
trade flows with 42 countries. Besides basic variables (GDP of Serbia, GDP of a trading partner
and distance) model includes a variable on the political-economic distance between Serbia and a
trading partner. This term is defined through economic ties, preferential trade agreements,
investments in the Serbian economy, company presence etc. Moreover, this feature proved to be
significant in the exports model (Stanojevic 2010).
However, the year dummies to account for business cycle variations were not included
neither country specific variables. This is the gap this research will build on, in particular
including fixed effects.
Stanojevic (2010) emphasized that essential long-term factor of trade is the
complementary economies. In other words, Northern African countries are interested in Serbian
goods such as agricultural products. Because of the climatic conditions, countries in the North
Africa could not develop crop growing to the desired level. On the contrary, conditions in Serbia
are favorable to agriculture which represents a chance for Serbian exports. Furthermore, markets
in this region are open and there is no limitation to imports from Serbia. However, the result of a
study was that potential to export to this region is largely not used. The study empirically proved
by comparing potential to actual exports that there is 5-10 times more free “space” in this region
to absorb exports from Serbia. Among those countries, potential is best exploited with Egypt.
22
North African region comprises of 5 countries: Algeria, Libya, Egypt, Morocco and Tunisia

CE
UeT
DC
olle
ctio
n
19
What may be concluded from this section following the integration path of Central and
Eastern European countries, is that trade potential in the Balkan counties has been partially used
from 2000s onwards especially after the policies implemented by the EU. However, it is expected
that the level of trade is still below potential.
CE
UeT
DC
olle
ctio
n
20
Chapter 3. Gravity model for Serbia
In this chapter a gravity model including fixed effects for Serbian trade flows will be
estimated using panel data for the period 2004-2007. The evolution of trade patterns and
indicators from 2000s onward including trade openness ratios, the geographic patterns and the
structure of trade have already been presented in the Chapter 2. Findings of trade blocks effects
from this chapter will be incorporated in the policies toward trade enlargement.
3.1 Methodology and data
In order to estimate a gravity equation, several methods are proposed in the literature.
Ordinary Least Squares (OLS) are used to estimate logarithmic form of the equation by Christie
(2002), Nilsson (2000), Matyas (1997), Busierre et al. (2008) and is the most often employed in
the gravity literature.
In this work, separated gravity models for imports and exports will be estimated using
OLS method to calculate single country equations for the case of Serbia. Sosic and Vujicic
(2005) use the same approach, and state that a single country equation prevent problems coming
from pooled data estimations. It is possible to avoid the problem of heterogeneity of countries.
The other problem noted by Brenton and Di Mauro (in Sosic and Vujcic 2005) , is that different
remoteness factor (Rj) among countries may have biased results. Remoteness is important in a
sense it provides information about country’s alternatives. Hence, countries with lower level of
Rj, i.e. those countries with many opportunities will import less from each particular country
(Head 2003). However, this issue is circumvented as the estimation is done for only one country.
CE
UeT
DC
olle
ctio
n
21
Another advantage of a single country approach is the possibility to distinguish between exports
and imports since it is expected that those will respond differently to important factors such as
changes in the real exchange rates (Földvári 2006).
3.2 Data description and sources
It has been practice to use cross-section data to estimate the gravity equations. Recently,
the panel data proved to provide more accurate results than cross-section data which are likely to
experience omitted variable bias because of the unobserved country specific effects (Földvári
2006). Matyas (1997) is arguing that in order to specify a proper gravity model the fixed effects
should be included, in particular effects for import and export countries as well as time specific
effects (“triple-way model”). However, it makes sense to state here that including fixed effects
does not permit to include into estimation time invariant variables such as border, language and
distance (Serlenga 2004, Foldvari 2008). The reason for the inclusion of the fixed effects was
given by Hsiao which are the omitted variables specific to different time periods and cross-
sectional elements (in Egger 2000). Egger (2000) emphasizes the difference in interpreting the
coefficients in cross-section and panel analysis. While in case of panel analysis data may be
interpreted as elasticities of “the influence of the independent variables on the dependent one
(within interpretation)”, in cross section this interpretation would be conceptually wrong (Egger
2002, p.26).
This research will employ, as proposed by Harris and Matyas (1998), a pooled time-series
of cross-sections - panel data approach including time and target country effects. This excludes
all time invariant variables from the model. Data used in this model will cover the period 2004-
2007 and will include yearly bilateral trade flows between Serbia and 40 most important trading
CE
UeT
DC
olle
ctio
n
22
partners23
which altogether account for around 95% and 85% of total Serbian exports and imports
respectively, which means that only a minor part of the total trade is not encompassed in this
sample. Data for exports and imports are collected by the Statistical Office of the Republic of
Serbia24
and are expressed in thousands USD. In accordance with its practice, the value of goods
in the external trade is expressed in prices based on contracts agreed between the companies. All
values are calculated based on existing exchange rates. For imports the CIF method is used and
for exports FOB, as is common practice. Data about real GDP are taken from the World’s Bank
database, World Development Indicators (WDI) and Global Development Finance (GDF). GDP
is measured in constant 2000 US$ and is expressed in thousands. Data on populations are taken
from the same database for the perspective years.
Thus, the total number of observations is 160, with some missing data. In particular, since
the sample includes the data from 2004, the trade with Montenegro is not captured individually,
since Montenegro separated from the State Union of Serbia and Montenegro in 2006.
In this research, two models of Serbian trade will be estimated: models for exports and
imports using OLS method. The analysis including fixed effects does not allow for calculating
counterfactual scenarios and data on the potential trade. On the contrary, checking for the trading
block effects should be done with the analysis of the target specific parameters from the
estimated models that explain part of behavior not explained by variables included in the model
(Matyas 1997). Country specific parameters provide information on the openness of the particular
economy for Serbian exports and imports. Hence, those numbers may be understood as obstacles
to trade due to administrative procedures and financial barriers (Matyas 1997) while time specific
effects capture the influence of variable that vary over the time and are not encompassed by
23
Details about countries are presented in Appendix 24
Internet, Statistical Office of the Republic of Serbia, http://webrzs.stat.gov.rs/WebSite/
CE
UeT
DC
olle
ctio
n
23
explanatory variables such as transports and communication costs (Busierre et al. 2008). Chapter
5 will built on those findings and provide policies how to improve trade.
3.3 Consequences of a single country gravity models
Gravity models may be used to model trade for a group of countries or to model trade
between a single country and its trading partners. A multi-country approach is characterized by
the symmetry of trade flows, because the exports from country j to country i equals the imports
from country i to country j. Thus, in multi country approach, one estimates either imports or
exports but not both (Foldvari 2008).
In case of a single country approach, there is no symmetry in trade flows and one has to
estimate models for both exports and imports. When estimating single country equations, there
are two potential problems. The first problem that may arise is steaming form the assumption of
the time-variant unobserved effects which makes it impossible to determine the real effect of
domestic income and population on exports and imports. Time variant explanatory variables are
GDPsr
t and popsr
t which stands for domestic income and population. A solution is either to
include year dummies and do not interpret those coefficients or to omit the year dummies.
The second problem arises due to time-invariant variables such as distance, border,
language etc. It may happen that some of the country specific dummies are perfectly collinear
with time-invariant variables. This will cause the problem of perfect multicollinearity when
country specific variables are explicitly included in the model (Foldvari 2008).
CE
UeT
DC
olle
ctio
n
24
3.4 The Gravity model for exports
Exports present one of the most important sources of the foreign exchange in the
economy that may be later used for different purposes. It is essentially important in the case of a
large and increasing debt. Hence, the consideration of the exports comes first on the agenda. In
order to estimate export flows of Serbia the following model including fixed effects was applied:
Ln Exportsit = γj + λt + β1 ln (GDPit ) + β2 ln (popit) + εit
Where
Exportsit is the volume of trade (exports) from Serbia to a trading partner in a year t;
GDPit,is the GDP of a trading partner in a year t;
popit is the population of a trading partner in a year t;
γj is the target country effect;
λt is the time (business cycle effect) for years 2005, 2006 and 2007;
εit is the error term.
The model includes the target country effects only, because it is a case of a single country
equation and does not contain the local country effects. Broadly speaking, target country effects
account for the demand for Serbian exports (Harris and Matyas 1998). Relatively large target
country effects imply the openness of the economy suggesting that there are no administrative
and financial obstacles to trade (Matyas 1997). It should be noted that those effects (for all 40
countries) are not presented in the table below. Furthermore, time fixed effects are presented in
the table and were estimated in a way that one year was excluded, as proposed by Harris and
Matyas (1998) and thus, the model includes time effects for only three years.
CE
UeT
DC
olle
ctio
n
25
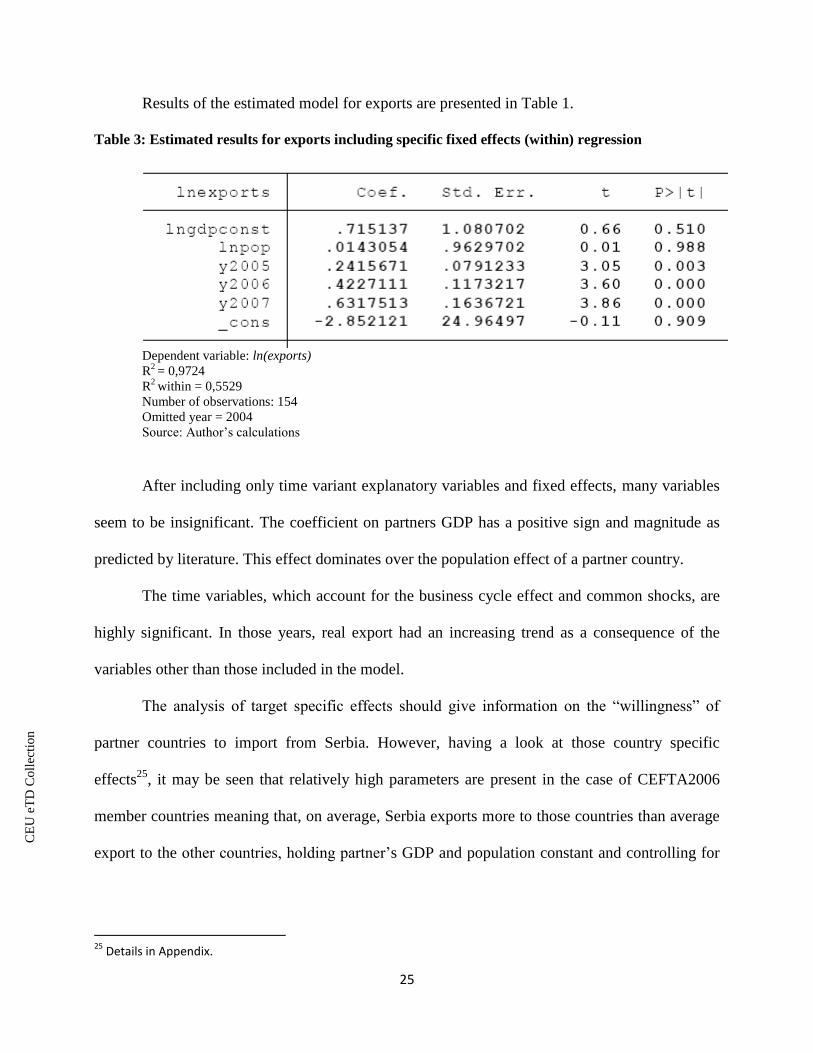
Results of the estimated model for exports are presented in Table 1.
Table 3: Estimated results for exports including specific fixed effects (within) regression
Dependent variable: ln(exports)
R2 = 0,9724
R2
within = 0,5529
Number of observations: 154
Omitted year = 2004
Source: Author’s calculations
After including only time variant explanatory variables and fixed effects, many variables
seem to be insignificant. The coefficient on partners GDP has a positive sign and magnitude as
predicted by literature. This effect dominates over the population effect of a partner country.
The time variables, which account for the business cycle effect and common shocks, are
highly significant. In those years, real export had an increasing trend as a consequence of the
variables other than those included in the model.
The analysis of target specific effects should give information on the “willingness” of
partner countries to import from Serbia. However, having a look at those country specific
effects25
, it may be seen that relatively high parameters are present in the case of CEFTA2006
member countries meaning that, on average, Serbia exports more to those countries than average
export to the other countries, holding partner’s GDP and population constant and controlling for
25
Details in Appendix.
CE
UeT
DC
olle
ctio
n
26
business cycle effects. In other words, those markets are more open to Serbian exports than an
average market in this sample.
Even though the data encompass only one year after the CEFTA Agreement started to
operate, already high trade among those countries and Serbia existed even before which is
obvious having in mind that those countries are among the most important trading partners for
Serbia. A reason behind this is the idea that CEFTA2006 was formed as a “waiting room” in
front of the EU with the aim to increase trade integration in Balkans and not only that, but to have
a positive impact on the political stability in this region, more equal development, infrastructure
building, promoting and attracting investments to this region. Offering cheaper and higher quality
products and services to the consumers is yet another advantage of this agreement. Definitely the
most important implication of trade liberalization within member states is the enlargement of
trade flows. The CEFTA2006 presents the second most important trading partner, after the EU,
and is a source of trade surpluses.
Having in mind that Serbia has signed the Stabilization and Association Agreement with
the EU only in 2008, the effects of the more liberal access to this market are not captured by this
model. However, as empirically proved by Egger (2004) often derived conclusion in panel data
approach is that there is no short-term impact of joining the EU. On the other hand, there is a
significant positive effect in the long run which may be expected in the upcoming years as a
consequence of the signed Agreement which allows for free access to the European market. This
will have a positive impact for the positioning of domestic products with a condition that those
products fulfill particular standards. This task should be addressed by the exporters. However, a
high inclination toward the EU import is already present in Serbia (Ehrke 2010). This is not
necessarily bad when it pushes for higher exports and exports with higher value added.
CE
UeT
DC
olle
ctio
n
27
Looking at the country specific coefficients on the EU countries, the most open for
Serbian exports are Slovenia, Bulgaria, Romania and Hungary which are all the bordering
countries besides Slovenia. However, there are historical ties with Slovenia since both countries
were part of the Socialist Federal Republic of Yugoslavia in the past.
Data on the structure of exports reveal that Serbia, during the period 2004-2010 was
predominantly exporting to the already mentioned EU countries live cattle (heifers and calves)
and agricultural products, corn in particular, which supports the statement that Serbian exports is
mostly based on the low processed products and products with low values added.
A conclusion to be derived from the presented results is that most of the EU countries by
the end of 2007 had relatively high administrative barriers for the Serbian imports. However,
after the ratification of the Interim Agreement on Trade and Trade-related issues26
in 2008, those
barriers are lower more proportionally for Serbian exports than imports, an increase in trade
flows was recorded. Serbian products that fulfill the EU standards have easier access to the EU
market. Another traditionally important market is those of neighboring countries with whom
Serbia shares similar political and historical background. The focus of further policies in the short
to medium term should be toward those markets where Serbian products are present for longer
period of time as this strategy brings less risk than penetration to the completely new markets.
However, in a long run entry into the new markets with new products may be a good policy.
3.5 The Gravity model for imports
Similar steps as for the previous estimation have been applied in estimating equation for
Serbian imports which has the following form:
26
European Commission, www.ec.europa.eu
CE
UeT
DC
olle
ctio
n
28
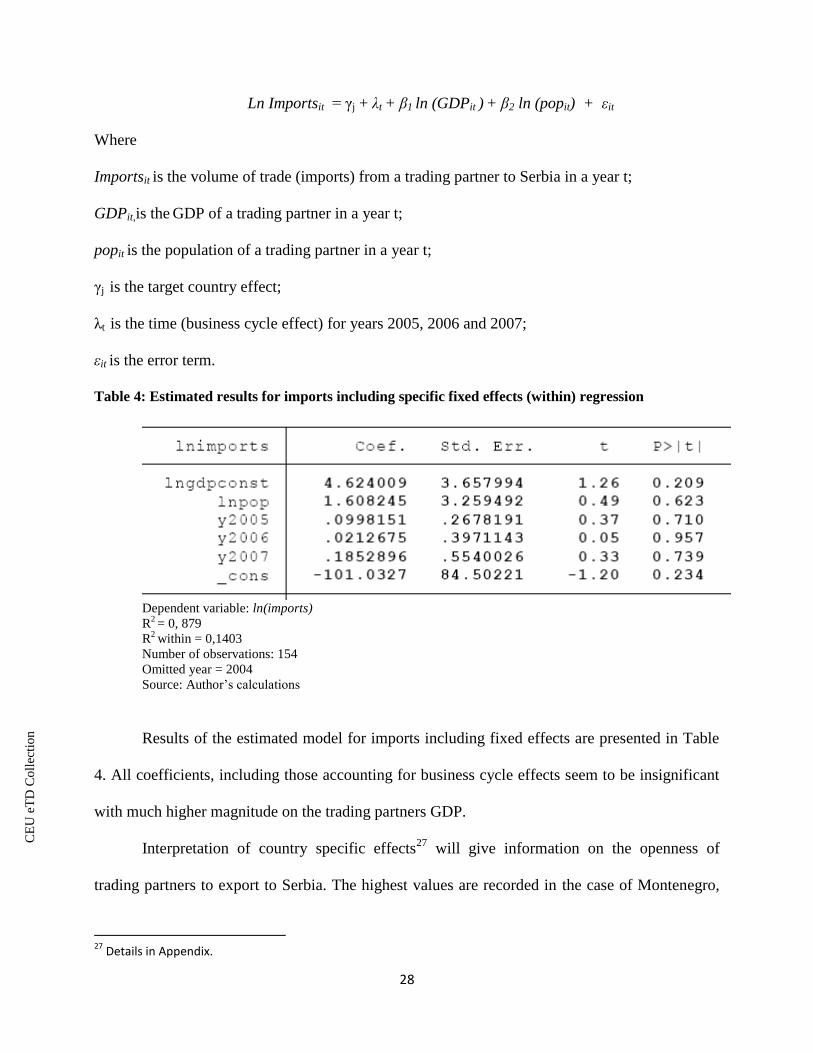
Ln Importsit = γj + λt + β1 ln (GDPit ) + β2 ln (popit) + εit
Where
Importsit is the volume of trade (imports) from a trading partner to Serbia in a year t;
GDPit,is the GDP of a trading partner in a year t;
popit is the population of a trading partner in a year t;
γj is the target country effect;
λt is the time (business cycle effect) for years 2005, 2006 and 2007;
εit is the error term.
Table 4: Estimated results for imports including specific fixed effects (within) regression
Dependent variable: ln(imports)
R2 = 0, 879
R2
within = 0,1403
Number of observations: 154
Omitted year = 2004
Source: Author’s calculations
Results of the estimated model for imports including fixed effects are presented in Table
4. All coefficients, including those accounting for business cycle effects seem to be insignificant
with much higher magnitude on the trading partners GDP.
Interpretation of country specific effects27
will give information on the openness of
trading partners to export to Serbia. The highest values are recorded in the case of Montenegro,
27
Details in Appendix.
CE
UeT
DC
olle
ctio
n
29
FYR Macedonia and Bosnia and Herzegovina which is expected given the geographic proximity
and political, economic and cultural relationships in the past.
As for the structure of imports, based on the value, from Bosnia and Herzegovina one of
the dominant groups of products are coke and semi-coke made of coal during the whole period
2004-2011. Serbia also imports woods and steel from Bosnia and Herzegovina. In the same
period the most common imported products from Macedonia were wine, iron and steel cubes, and
medicines in the last few years.28
However, imports from those countries are lower that exports.
A reason for this may be that countries exports rather similar products as produced in Serbia
indicating the low level of complementarities between economies.
Based on the volumes of imports, even more important is the EU market. According to
country specific parameters, relatively large openness is recorded in Slovenia, Hungary, Romania
and Bulgaria. Interestingly, a high value is recorded in case of Cyprus and Lithuania. Looking at
the structure of imports from Slovenia in the period 2004-2011, the most important group is the
household appliances and recently the medicines. From Bulgaria and Cyprus, the dominant
importing products are refined copper while from Romania and Hungary Serbia predominantly
imports gas oils and electricity.29
The structure of Serbian imports reviled its high energy
dependence due to low energy inefficiency. However, this topic is outside of the scope of this
work.
Results in this chapter suggest that the most open economies for exports and imports from
and to Serbia are the traditional markets of neighboring countries. As for the EU economies, the
most open for trade cooperation are geographically close Central and Eastern European
economies.
28
Internet, Statistical office of the Republic of Serbia 29
Internet, Statistical office of the Republic of Serbia
CE
UeT
DC
olle
ctio
n
30
Chapter 4. Relationship between trade and export diversification
and economic growth
“Countries are what they export”
Unknown author
The importance of exports for economic growth and their relationship looks rather simple.
This section will elaborate more on the conditionality between the two and provide background
knowledge and theory behind it. Not only will the role of exports be examined, but the function
of export diversification as a step toward economic progress. Finally, this chapter provides
interesting evidence on the allegedly called “export-led growth” and provides yet another
possible sphere of interest for policy makers: the non tradable sector.
The export driven model was found in the centre of attention after the successful episode
of economies in Asia and their remarkable performance under this strategy. Afterward, many
countries were trying to successfully implement similar strategies named “export-led growth”
(Yang 2008).
There is extensive literature addressing the questions such as “Does trade cause growth?”
(e.g. Hesse 2006, Lee 2011, Frankel 1999). Frankel (1999) examines the effect of trade on
growth and how trade influences standards of living (income) focusing on the part of trade caused
by the geographic factors which is in compliance with the gravity framework. He concluded that
trade raises income. In particular, Frankel (1999) estimated that an increase of 1 percentage point
in the trade openness ratio increases income per person by 0,5 percent. The main channel for this
impact is the accumulation of physical and human capital. The other conclusion from this study is
CE
UeT
DC
olle
ctio
n
31
that not only the international trade has a positive effect on the level of income, but the domestic
trade as well through the same channels.
In the context of less developed countries the literature tends to emphasize that trade
liberalization has an important role in enhancing economic growth and decreasing the poverty.
Lee (2011) provides a short review of the economic development and growth relationship. One of
the starting points in this analysis is the Solow model where resources available in a country
determine output growth while technology is determined exogenously. A consequence of this
structure is that trade policy does not play an important role. On the other hand, the new-growth
theory emphasizes the endogenous nature of technology allowing for an active role of trade. A
driving force in those models is that new markets allow for specialization leading to higher
productivity growth as a consequence of learning by doing. Melitz (in Lee 2011) provides
evidence that export oriented firms are on average more productive than those producing only for
domestic market. This is a reason why the overall productivity is higher with a raise in export
activity.
Lee (2011) notes that micro-foundations of production structure are gaining importance
over the factor endowments. In the same work the idea of Hausmann et al. is given as an
explanation for the relationship between high-productivity goods and faster economic growth:
shifting resources from less to more productive activities will lead to economic growth. Lee
(2011) concludes that trade openness might have a positive effect on the economic performance.
However, equally important are “the particular structural characteristics of exporting industries”
(p.59). The author finds that the higher the share of technologically advanced goods in total
exports, the fastest economic growth. As proposed by Krueger and Bhagwgati ( in Lee 2011) the
factors that are of crucial importance are market institutions presented by the level of
competition, government as main institutional factor and the social environment. What is an
CE
UeT
DC
olle
ctio
n
32
important conclusion is that trade openness may have a positive impact on growth under some
conditions that are not necessarily related to trade policies but more to the overall
macroeconomic health of the economy.
Building on the previous conclusion, another question arise “What is the reason behind
the export diversification?” Hesse (2006) classifies theoretical reasons to answer this question
into several groups. One of the explanations relates particularly to the countries exporting
primarily commodity products whose prices are highly volatile. Put differently, exports instability
is a reason for its diversification. The other reason is learning-by-doing gains and knowledge
spillovers in the manufacturing sector.
However, Hesse (2006) emphasizes results from Imbis and Waczizrg who noted the U
shaped relationship between sectoral concentration and income level. The consequence of this U
curve is that at the beginning countries diversify production and as they are becoming richer this
feature changes to specialization. In the same working paper, he underlines the new literature
concentrating more on diversification with entrepreneurial motives rather than on the
comparative advantages. Background explanation for this phenomenon may be provided in the
context of negative externalities. In other words, due to a positive spillover from developing new
goods, social benefits will be higher than social costs leading to an underinvestment. On the other
hand, potential loss of failure has to be borne by entrepreneurs. This is a reason why the
government should be actively involved in the industrial growth and promoting entrepreneurship.
With a help of empirical research Hesse (2006) concludes that that diversification on average
leads to a higher per capita income growth and moreover, export diversification demonstrates non
linear relationship with income: the less developed countries benefit from diversification in
exports more.
CE
UeT
DC
olle
ctio
n
33
One interesting point with potential consequences for policy proposals about the “export-
led growth” is noted by Yang (2008) who finds empirical support that in fact not all the so called
“export-led growth” episodes are really what their name says to be. In particular, in the case of
“export-led growth” one would expect to see appreciation of the exchange rate as a consequence
of the influx of the foreign exchange which is very often not the case. Moreover, there are many
countries experiencing depreciation. The relevant policy question is what was causing the
economic growth if the “export-led growth” is excluded based on the above mentioned criteria?
What was the main engine for growth is the productivity improvement in non-tradable
sector which has an impact on GDP growth, and in the next instance an increase in demand. Part
of this increase, depending on the demand elasticity for imported goods, will flow to the imports
causing the real exchange rate depreciation. A consequence of depreciation will be an increased
competitiveness and a raise in exports. Yang (2008) uses a term “growth driving exports” for this
phenomenon when non-tradable sector has the crucial role. It is not only the increased
productivity in tradables that matter, but in non-tradable sector as well. Those conclusions bear
significant implications for policymakers especially in developing countries. In the past two
decades, based on the successful growth in Asian countries, many governments dedicated a lot of
resources to replicate the so called “export-led growth”. Yang emphasizes that non-tradable
sector is as important as tradable and may serve as a growth engine. Hence, policies for
improvement of the non-tradable sector are equally important.
Countries should note and examine the trade-off between supporting exports sector only.
What is proposed by Yang are policies concentrating on the technological improvement as main
driving force. The objective should be to invest in human capital as it is the most important factor
(Rajan 2010, Yang 2008). Policies should be aimed at lessening barriers and allowing resources
to move more liberally to the sectors with a higher productivity and improving the institutional
CE
UeT
DC
olle
ctio
n
34
structure in a country. Similar proposal is found in Rajan (2010) who notes that the most
important obstacle to the growth is the lack of organizational structure.
This section provided evidence on the positive relationship between the trade openness
and economic growth. Moreover, the reasons behind diversification in developing countries are
emphasized. Finally, the phenomenon of “growth driving exports” is underlined and the potential
consequences of unconditional support toward exports.
4.1 Export-led growth in Serbia
After the opening up of the economy in 2000s, Serbia continued to record trade and
current account deficits and not only that but the trade deficit was increasing as a consequence of
insufficient exports (Uvalic 2010). The growth pattern was highly unfavorable, promoting private
consumption particularly of imported goods. At the beginning of the decade, this pattern of
consumption was financed by foreign loans leading to an increased debt position. However, in
the light of the global financial crisis hitting the region of the Balkans in the late 2008, this source
of finance was not as available and there was even a possibility that it may dry out (Ehrke 2010).
This is a reason why Serbia should without delay find a way for more sustainable growth and one
of the policies toward this aim is a higher export growth than import. The relevant question is to
discover potential opportunities for exports enlargement, create and implement policies that will
achieve this goal.
The idea of “export-led growth” in Serbia is certainly not new. What have attracted more
attention lately, after more than one decade from political regime change, are the reasons for the
failure of the “export-led” strategy.
CE
UeT
DC
olle
ctio
n
35
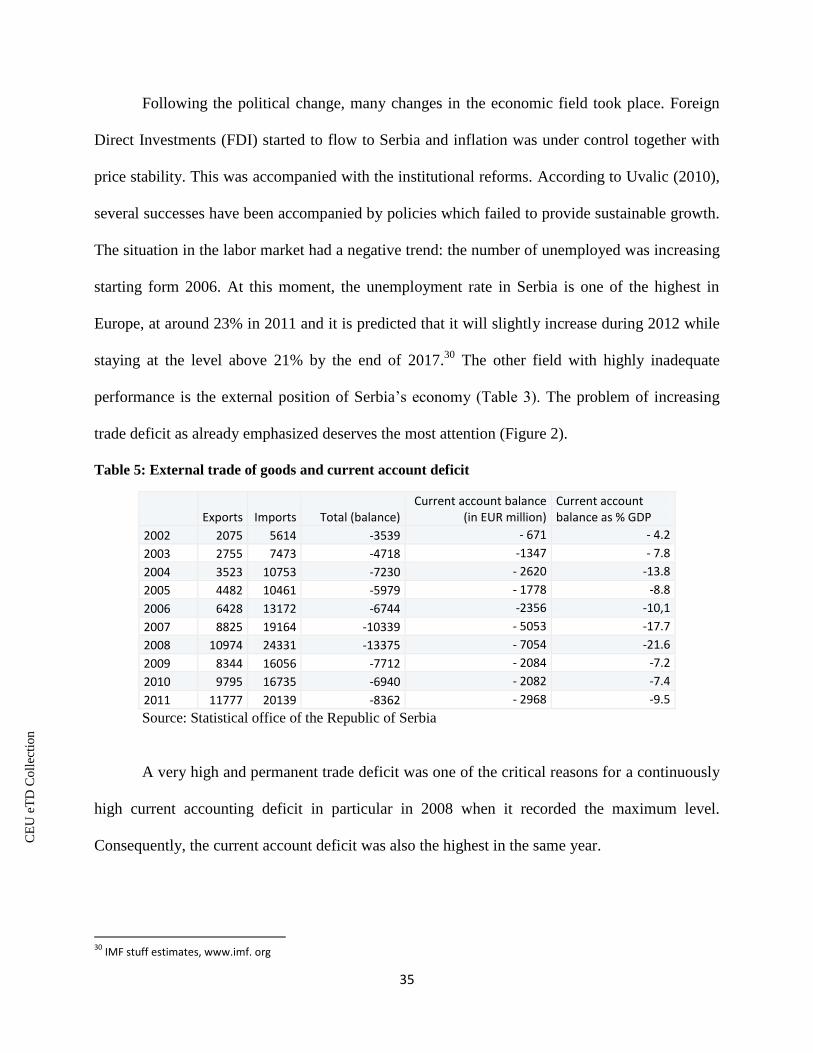
Following the political change, many changes in the economic field took place. Foreign
Direct Investments (FDI) started to flow to Serbia and inflation was under control together with
price stability. This was accompanied with the institutional reforms. According to Uvalic (2010),
several successes have been accompanied by policies which failed to provide sustainable growth.
The situation in the labor market had a negative trend: the number of unemployed was increasing
starting form 2006. At this moment, the unemployment rate in Serbia is one of the highest in
Europe, at around 23% in 2011 and it is predicted that it will slightly increase during 2012 while
staying at the level above 21% by the end of 2017.30
The other field with highly inadequate
performance is the external position of Serbia’s economy (Table 3). The problem of increasing
trade deficit as already emphasized deserves the most attention (Figure 2).
Table 5: External trade of goods and current account deficit
Exports Imports Total (balance) Current account balance
(in EUR million) Current account balance as % GDP
2002 2075 5614 -3539 - 671 - 4.2
2003 2755 7473 -4718 -1347 - 7.8
2004 3523 10753 -7230 - 2620 -13.8
2005 4482 10461 -5979 - 1778 -8.8
2006 6428 13172 -6744 -2356 -10,1
2007 8825 19164 -10339 - 5053 -17.7
2008 10974 24331 -13375 - 7054 -21.6
2009 8344 16056 -7712 - 2084 -7.2
2010 9795 16735 -6940 - 2082 -7.4
2011 11777 20139 -8362 - 2968 -9.5
Source: Statistical office of the Republic of Serbia
A very high and permanent trade deficit was one of the critical reasons for a continuously
high current accounting deficit in particular in 2008 when it recorded the maximum level.
Consequently, the current account deficit was also the highest in the same year.
30
IMF stuff estimates, www.imf. org
CE
UeT
DC
olle
ctio
n
36
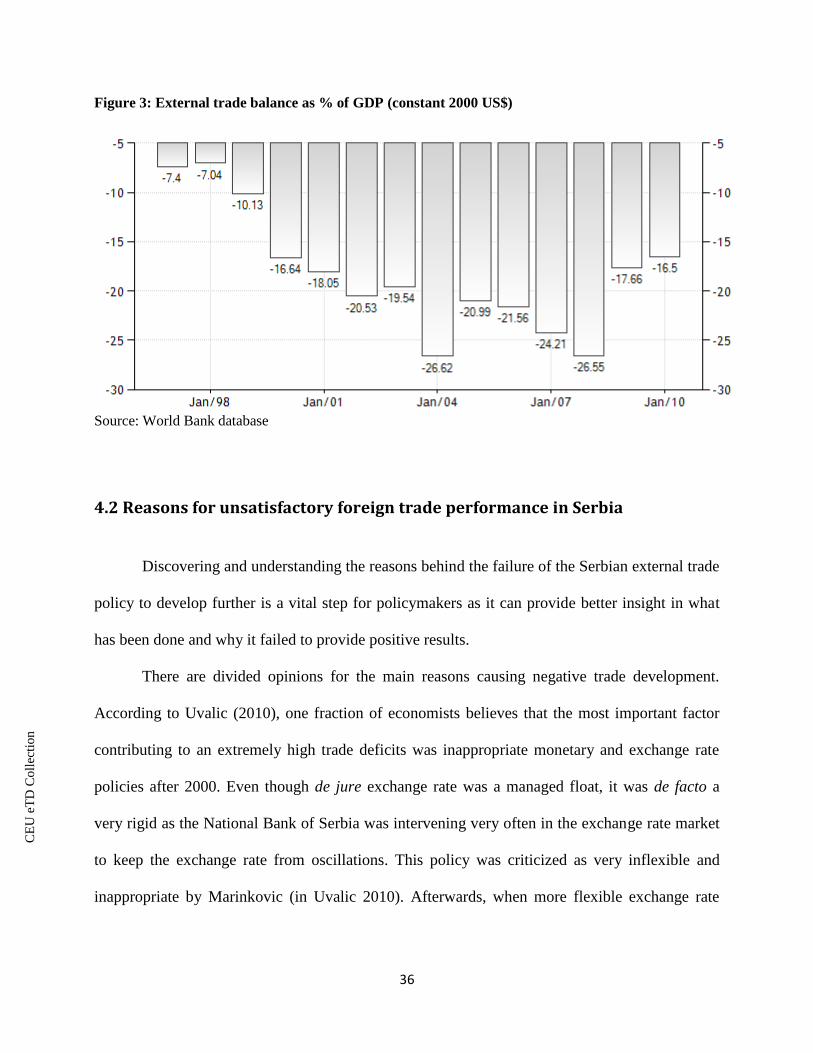
Figure 3: External trade balance as % of GDP (constant 2000 US$)
Source: World Bank database
4.2 Reasons for unsatisfactory foreign trade performance in Serbia
Discovering and understanding the reasons behind the failure of the Serbian external trade
policy to develop further is a vital step for policymakers as it can provide better insight in what
has been done and why it failed to provide positive results.
There are divided opinions for the main reasons causing negative trade development.
According to Uvalic (2010), one fraction of economists believes that the most important factor
contributing to an extremely high trade deficits was inappropriate monetary and exchange rate
policies after 2000. Even though de jure exchange rate was a managed float, it was de facto a
very rigid as the National Bank of Serbia was intervening very often in the exchange rate market
to keep the exchange rate from oscillations. This policy was criticized as very inflexible and
inappropriate by Marinkovic (in Uvalic 2010). Afterwards, when more flexible exchange rate
CE
UeT
DC
olle
ctio
n
37
was implemented, the impact on the export growth was obvious. Moreover, flexible exchange
rate policy allowed adjustments that alleviated adverse influence of the crisis.
According to the other group of economists a leading reason for the poor external trade
performance is the inadequate and unbalanced structure of export. In other words, export relies
on limited range of products usually with low value added. The export structure has not changed
significantly in the last decade which is precluding price competitiveness and calling for a
significant restructuring of the economy (Petrovic 2005). What is the closest to the truth is that
both reasons were contributing to the unsatisfactory trade performance and fulfillment of only
one of them will not lead to a successful export strategy. The level of competitiveness of Serbian
exports is very low, not only to the EU countries but to the countries from the region as well.
As noted by Uvalic (2010), there were several inappropriate decisions made during the
transition period in relation to the privatization together with delayed and not adequate reforms
that sill have adverse effects for the economy. However, this is not the focus of this work.
Besides providing theory behind the link between exports augmentation and economic
growth, this chapter provided review of the macroeconomic policies in the last decade leading to
the unsatisfactory performance in the external trade field. It may be concluded that stable
macroeconomic environment is a first precondition for achieving this goal.
CE
UeT
DC
olle
ctio
n
38
Chapter 5. Policy recommendations and conclusions
The needs for increased volumes and change in the structure of exports have been
emphasized several times in this study. Policy makers should bear in mind the important question
of under what conditions diversification is desirable. One of the potential caveats of export-led
growth promotion is the dominance of only one country as a major trading partner, which is
exactly the opposite of the desirable direction. When making policy proposals, the influence of
the current crisis should be taken into consideration especially since it has changed the attitude of
the EU toward the further enlargement. The other important consequence of the crisis is the
unwillingness of the investors to pursue investments in the same quantity as before. On the other
hand, according to Bastian (2010) due to the crisis imports in Serbia were declining at a faster
rate than exports which had a positive effect on the trade deficit.
There are two possible paths toward the diversification and both of them should be
pursued parallel in order to achieve satisfying results in the long-run. One is identifying the new
markets for penetration and already existing markets with potential for export growth. The
second strategy that should accompany this “search” for potential is the orientation of the export
structure toward products with the higher value added.
The gravity approach applied in this work has suggested that there is unused potential
with neighboring countries mostly. Not only Serbian products are already present in those
markets but there are high political, economic and cultural ties facilitating the exports. By the
same token, the volume of intra-regional trade surplus should be increased as this is the main
source financing chronic deficit with the EU countries.

CE
UeT
DC
olle
ctio
n
39
When it comes to the leaders of the change, it is clear that all stakeholders should be
involved for the best results. The government is definitely one of the most important figures in
implementing reforms but the business sector should take part as well. The role of the
government is even more important when markets proved to be unable to deliver satisfactory
results. A practical notion by Hare (2008) is that some of the policies are very often not
connected with the diversification per se which may be seen in the following paragraphs.
Moreover, policies are related to strengthening institutions that should facilitate and enable
diversification.
Create favorable environment encouraging the FDI inflow
One of the most challenging tasks is to attract the new FDI and transnational corporations
to invest in Serbia. In order to achieve this aim, it is necessary to create favorable investment
environment and conditions. Low wages in comparison to other countries in the region and
relatively educated working force already present a significant advantage, but in a short term.
However, further investment in the quality of human capital is needed not only at the level of
universities but education of employees as well. It is inevitable that in the long run the demand
for workforce will shift toward the labor force with higher skills and education (Hare 2008).
Hence, educational reform is needed to fill in this gap. However, this topic is beyond the scope of
this work.
According to the indices measuring the business climate31
, Serbia ranks very poorly.
Political instability is not the biggest problem anymore, but the corruption and oversized
bureaucratic sector which should be reduced (Trbovic 2010) allowing for more business
conducive environment. Adopting simple and clear regulatory framework and tax system will
31
World Economic Forum (WEF) Global Competitiveness Index, World Bank Doing Business Report, EBRD Transition Report
CE
UeT
DC
olle
ctio
n
40
lead to a lower level of corruption (Hare 2008). Another issues in Serbia are monopolistic and
oligopolistic behaviors in many fields (railways, processing of petroleum products, land line
telecommunications) demanding more efficient antitrust policies that will create a real market-
type economy.
Stable exchange rate
The exchange rate pass-through channel is very important in the case of Serbia. Monetary
policy, influencing the interest rate is indirectly having an impact on the exchange rate which is
transmitted to the volumes of exports and imports. Changes in the exchange rate will alter the
prices of exported and imported goods and services. Depreciation of the national currency will
lower the price of Serbian exports expressed in foreign currency. On the other hand, the imported
components will become more expensive. Stable monetary policy and exchange rates are of
crucial importance as they provide security in long term and influence on the price
competitiveness of exportables.
Create competitive markets
The Government of Serbia should abandon the practice of supporting loss-making
national champions and concentrate on measures promoting the diversification of the industrial
base (Uvalic, 2010) because a consequence of such a governmental policy are uncompetitive
markets where it was difficult for small and medium enterprises (SMEs) to survive. Yet another
reason for abandoning this strategy is an often pursued practice in the past to finance those
enterprises in spite of losses they make just in order to keep jobs. Supporting the development of
small and medium enterprises (SMEs) is important as those are perceived to be the driving force
toward higher employment. The role of transnational companies in leading economic growth is
also important because of technology transfer. The developmental policy of the state should be to
support the implementation of local companies into the global chains.
CE
UeT
DC
olle
ctio
n
41
Enhance access to markets
Already established trade agreements between Serbia and various countries32
provide
access to markets and a good strategic position for exports enlargement. However, further
integration in the international market, principally the accession to the World Trade Organization
(WTO) should be one of the objectives. The positive side is that Serbia is at the end of this
process and membership may be expected the near future.
Actively include business sector in reforms
The practice of passive business sector should be changed into their active involvement. It
is of crucial importance to introduce international quality standards since in many sectors it is not
possible to export to the international markets without a strict quality control. In addition,
companies should organize into exports clusters which proved to be a successful strategy toward
higher competitiveness in a very few cases in Serbia. The export promotion is essentially
important to accompany liberalized imports as a failure to do this may lead to a faster increase in
imports relative to exports which will only widen already existing trade deficit. Participation in
international trade fairs will allow for better strategic position in the markets, higher quality
products etc. The level of technical equipment and the application of the modern information
technology are very low and it presents one of the issues to be addressed first in the near future
because this is constraining competitiveness of Serbian products on the international markets.
Do not neglect the non-tradable sector
In pursuing those policies, the importance of non-tradable sector should not be neglected
as it has been proven that it may also have a positive impact on GDP and growth and in final
instance on the export enlargement.
32
The Russian Federation, CEFTA2006, EFTA, Belarus, Turkey, Kazakhstan, USA and the EU
CE
UeT
DC
olle
ctio
n
42
All the difficulties facing the economy of Serbia require a higher commitment toward the
sustainable growth. Exports enlargement with positive influence on the growth is seen as a tool to
alleviate negative macroeconomic trends. Thus, this work concentrates on the markets with
unused trade potential according to the gravity model. What has been shown is that neighboring
countries are the most open for trade with Serbia promoting regional trade, exports in particular.
Policies toward export diversification are proposed. However, it should be emphasized that they
should be put into the wider context of macroeconomic stabilization since this is a precondition
for success together with commitment of all stakeholders, government in particular.
CE
UeT
DC
olle
ctio
n
43
References
Anderson, J.E. 2010, "The gravity model", National Bureau of Economic Research, Working
Paper 16576 .
Anderson, J.E. 1979, "A theoretical foundation for the gravity equation", The American
Economic Review, vol. 69, no. 1, pp. 106-116.
Baldwin, R.E. & Centre for Economic Policy Research (Great Britain). 1994, Towards an
integrated Europe, Citeseer.
Bastian, J. "Opportunities in and Obstacles for the Western Balkans", Export-led Growth, pp.
147.
Bergstrand, J.H. 1985, "The gravity equation in international trade: some microeconomic
foundations and empirical evidence", The review of economics and statistics, , pp. 474-481.
Bjelic, P. 2005, "Trade policy of the European Union as a factor of regional trade in Southeast
Europe",
Bussière, M., Fidrmuc, J. & Schnatz, B. 2008, "EU enlargement and trade integration: Lessons
from a gravity model", Review of Development Economics, vol. 12, no. 3, pp. 562-576.
Christie, E. 2002, Potential trade in Southeast Europe: a gravity model approach, .
Egger, P. 2004, "Estimating regional trading bloc effects with panel data", Review of World
Economics, vol. 140, no. 1, pp. 151-166.
Egger, P. 2000, "A note on the proper econometric specification of the gravity equation",
Economics Letters, vol. 66, no. 1, pp. 25-31.
Ehrke, M "Introduction: Export-led growth in Central Europe and the Western Balkans", Export-
led Growth, , pp. 5.
European Comission 2011, Commission Opinion on Serbia's application for membership of the
European Union , Brussels.
Evenett, S.J. & Keller, W. 1998, On theories explaining the success of the gravity equation, .
Ferragina, A., Giovannetti, G. & Pastore, F. 2005, "Forecasting Eu-Romania Trade By Gravity
Analysis", Journal for Economic Forecasting, vol. 2, no. 4, pp. 83-93.
Földvári, P., 2006. The Economic Impact of the European Integration on the Netherlands. A
Quantitative Analysis of Foreign Trade and Foreign Direct Investments.
CE
UeT
DC
olle
ctio
n
44
Frankel, J.A. and Romer, D., 1999. Does trade cause growth? American Economic Review, , pp.
379-399.
Gros, D. & Gonciarz, A. 1996, "A note on the trade potential of Central and Eastern Europe",
European journal of political economy, vol. 12, no. 4, pp. 709-721.
Grupe, C. & Kušić, S. 2005, "Intra-regional cooperation in the Western Balkans: Under which
conditions does it foster economic progress?", .
Harris, M.N., Mátyás, L. & Melbourne Institute of Applied Economic and Social Research 1998,
The econometrics of gravity models, Melbourne Institute of Applied Economic and Social
Research.
Hare, P.G. 2008, "Institutions and Diversification of the Economies in Transition: Policy
Challenges", CERT Discussion Papers, .
Hesse, H., 2006. Export diversification and economic growth. World Bank, Washington, DC, .
Head, K. 2003, "Gravity for beginners", University of British Columbia, vol. 2053.
Kaminski, B. 2003, "Stabilization and association process in the Balkans: integration options and
their assessment", World Bank Policy Research Working Paper No.3108, .
Kovacevic, R. 2005, Ekonomski odnosi Srbije sa inostranstvom, 2nd edn, CIF, Belgrade.
Lee, J., 2011. Export specialization and economic growth around the world. Economic Systems,
35(1), pp. 45-63.
Mátyás, L. 1997, "Proper econometric specification of the gravity model", The world economy,
vol. 20, no. 3, pp. 363-368.
Montanari, M. 2005, "EU trade with the Balkans: Large room for growth?", Eastern European
Economics, vol. 43, no. 1, pp. 59-81.
Nilsson, L. 2000, "Trade integration and the EU economic membership criteria", European
Journal of Political Economy, vol. 16, no. 4, pp. 807-827.
Paas, T. 2000, "The gravity approach for modeling international trade patterns for economies in
transition", International Advances in Economic Research, vol. 6, no. 4, pp. 633-648.
Petreski, M. 2011, "No Nation Was Ever Runined by Trade: South-Eastern European Trade
Analysis", .
Petrovic, P., 2005. Strukturne karakteristike robne razmene Srbije i Evropske unije. Ekonomski
anali, 50(166), pp. 109-128.
CE
UeT
DC
olle
ctio
n
45
Rajan, R., 2010. Fault lines: How hidden fractures still threaten the world economy. Princeton
Univ Pr.
Serlenga, L. & Shin, Y. 2007, "Gravity models of intra‐EU trade: application of the CCEP‐HT
estimation in heterogeneous panels with unobserved common time‐specific factors",
Journal of Applied Econometrics, vol. 22, no. 2, pp. 361-381.
Sosic, V. & Vujcic, B. 2005, "Trade integration and Croatian accession to the European Union",
Chapters in books, vol. 3, pp. 61-84.
Stanojević, N. & Batić, J. 2010, "Quantitative analysis of Serbia's export potential to north
African countries", Megatrend revija, vol. 7, no. 1, pp. 129-146.
Trbovic, A. "How Can an Improved Business Environment Contribute to Export-led Growth in
Serbia?", Export-led Growth, , pp. 91.
Uvalic, M. 2010, "Serbia's Transition Flaws: Why has export-led growth not been achieved?",
Export-led Growth, , pp. 77.
Yang, J. 2008, "An analysis of so-called export-led growth", IMF Working Paper No.08/220, .
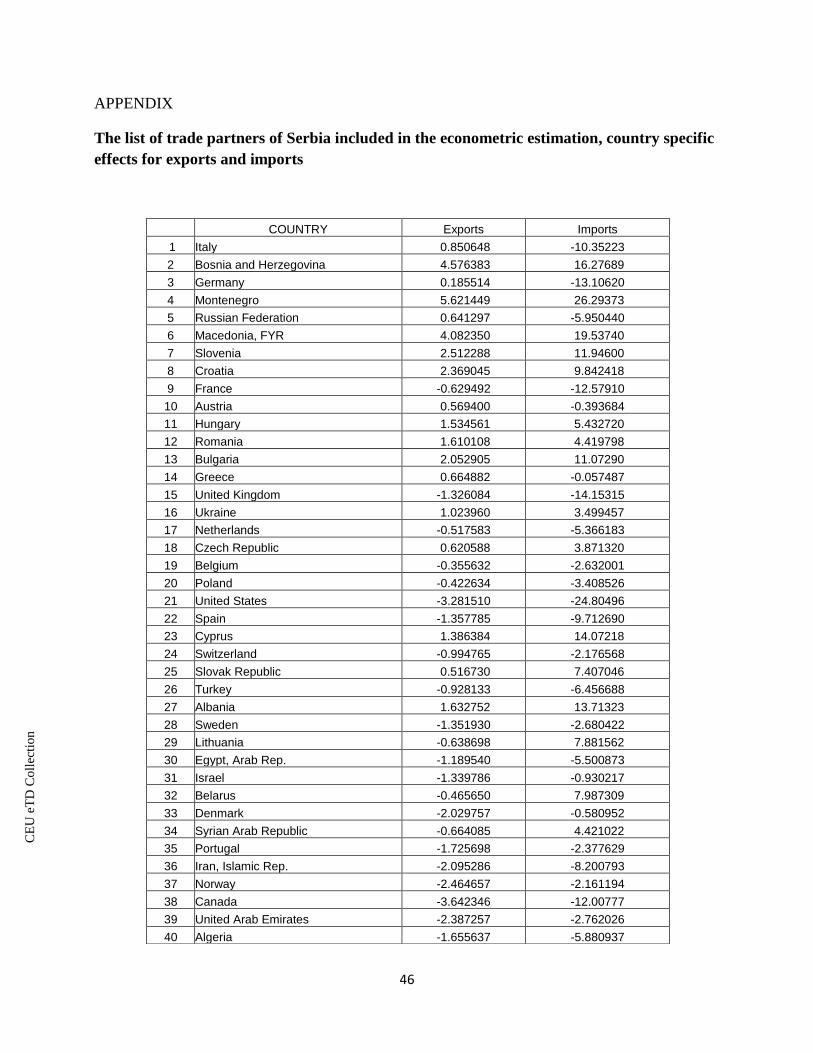
CE
UeT
DC
olle
ctio
n
46
APPENDIX
The list of trade partners of Serbia included in the econometric estimation, country specific
effects for exports and imports
COUNTRY Exports Imports
1 Italy 0.850648 -10.35223
2 Bosnia and Herzegovina 4.576383 16.27689
3 Germany 0.185514 -13.10620
4 Montenegro 5.621449 26.29373
5 Russian Federation 0.641297 -5.950440
6 Macedonia, FYR 4.082350 19.53740
7 Slovenia 2.512288 11.94600
8 Croatia 2.369045 9.842418
9 France -0.629492 -12.57910
10 Austria 0.569400 -0.393684
11 Hungary 1.534561 5.432720
12 Romania 1.610108 4.419798
13 Bulgaria 2.052905 11.07290
14 Greece 0.664882 -0.057487
15 United Kingdom -1.326084 -14.15315
16 Ukraine 1.023960 3.499457
17 Netherlands -0.517583 -5.366183
18 Czech Republic 0.620588 3.871320
19 Belgium -0.355632 -2.632001
20 Poland -0.422634 -3.408526
21 United States -3.281510 -24.80496
22 Spain -1.357785 -9.712690
23 Cyprus 1.386384 14.07218
24 Switzerland -0.994765 -2.176568
25 Slovak Republic 0.516730 7.407046
26 Turkey -0.928133 -6.456688
27 Albania 1.632752 13.71323
28 Sweden -1.351930 -2.680422
29 Lithuania -0.638698 7.881562
30 Egypt, Arab Rep. -1.189540 -5.500873
31 Israel -1.339786 -0.930217
32 Belarus -0.465650 7.987309
33 Denmark -2.029757 -0.580952
34 Syrian Arab Republic -0.664085 4.421022
35 Portugal -1.725698 -2.377629
36 Iran, Islamic Rep. -2.095286 -8.200793
37 Norway -2.464657 -2.161194
38 Canada -3.642346 -12.00777
39 United Arab Emirates -2.387257 -2.762026
40 Algeria -1.655637 -5.880937