Embed Size (px)
Citation preview
OCTOBER 2012 1ADVANCING INSIGHTS ADVANCING COMMERCE.
Global Insights
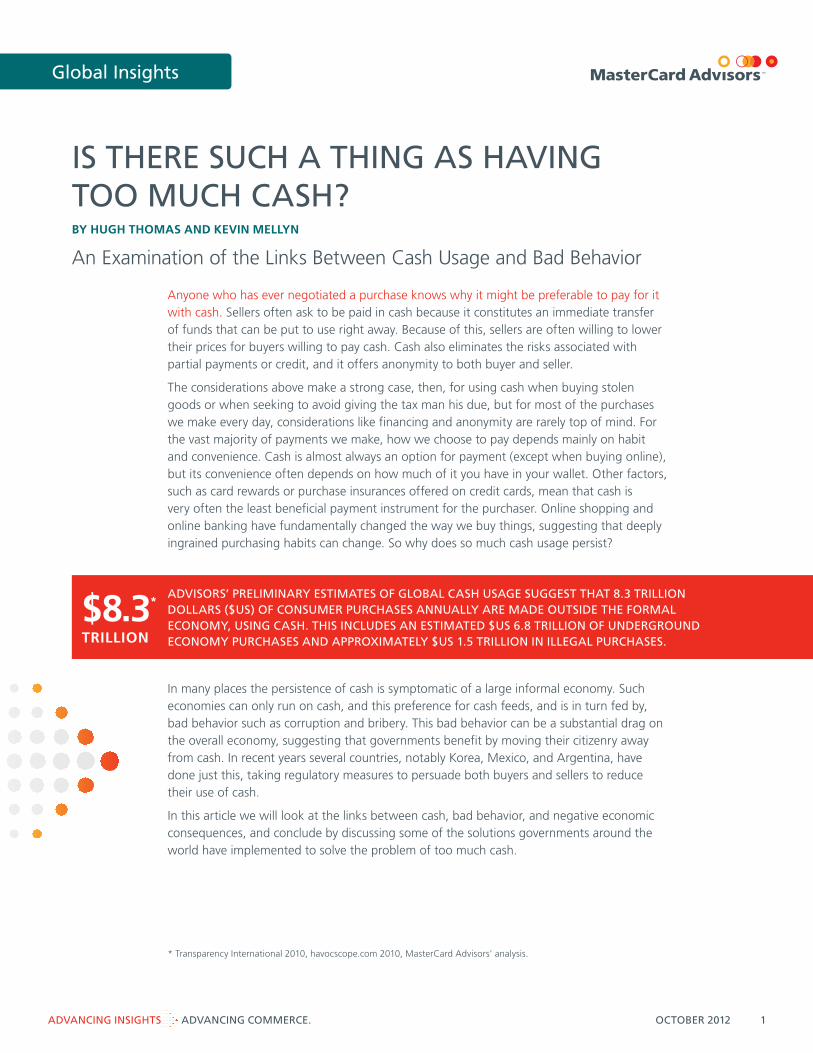
IS THERE SUCH A THING AS HAVING TOO MUCH CASH?
In many places the persistence of cash is symptomatic of a large informal economy. Such economies can only run on cash, and this preference for cash feeds, and is in turn fed by, bad behavior such as corruption and bribery. This bad behavior can be a substantial drag on the overall economy, suggesting that governments benefit by moving their citizenry away from cash. In recent years several countries, notably Korea, Mexico, and Argentina, have done just this, taking regulatory measures to persuade both buyers and sellers to reduce their use of cash.
In this article we will look at the links between cash, bad behavior, and negative economic consequences, and conclude by discussing some of the solutions governments around the world have implemented to solve the problem of too much cash.
Anyone who has ever negotiated a purchase knows why it might be preferable to pay for it with cash. Sellers often ask to be paid in cash because it constitutes an immediate transfer of funds that can be put to use right away. Because of this, sellers are often willing to lower their prices for buyers willing to pay cash. Cash also eliminates the risks associated with partial payments or credit, and it offers anonymity to both buyer and seller.
The considerations above make a strong case, then, for using cash when buying stolen goods or when seeking to avoid giving the tax man his due, but for most of the purchases we make every day, considerations like financing and anonymity are rarely top of mind. For the vast majority of payments we make, how we choose to pay depends mainly on habit and convenience. Cash is almost always an option for payment (except when buying online), but its convenience often depends on how much of it you have in your wallet. Other factors, such as card rewards or purchase insurances offered on credit cards, mean that cash is very often the least beneficial payment instrument for the purchaser. Online shopping and online banking have fundamentally changed the way we buy things, suggesting that deeply ingrained purchasing habits can change. So why does so much cash usage persist?
BY HUGH THOMAS AND KEVIN MELLYN
An Examination of the Links Between Cash Usage and Bad Behavior
ADVISORS’ PRELIMINARY ESTIMATES OF GLOBAL CASH USAGE SUGGEST THAT 8.3 TRILLION DOLLARS ($US) OF CONSUMER PURCHASES ANNUALLY ARE MADE OUTSIDE THE FORMAL ECONOMY, USING CASH. THIS INCLUDES AN ESTIMATED $US 6.8 TRILLION OF UNDERGROUND ECONOMY PURCHASES AND APPROXIMATELY $US 1.5 TRILLION IN ILLEGAL PURCHASES.
$8.3*
TRILLION
* Transparency International 2010, havocscope.com 2010, MasterCard Advisors’ analysis.
Global Insights
2ADVANCING INSIGHTS ADVANCING COMMERCE.
Developed Markets with Low Cash Usage*
Developed Markets with High Cash Usage*
Developing Markets with High Cash Usage*
Markets in Transition*
Canada Sweden Germany Japan Brazil India Australia Kenya Turkey
France U.K. Italy U.S.A. China Russia Korea South Africa
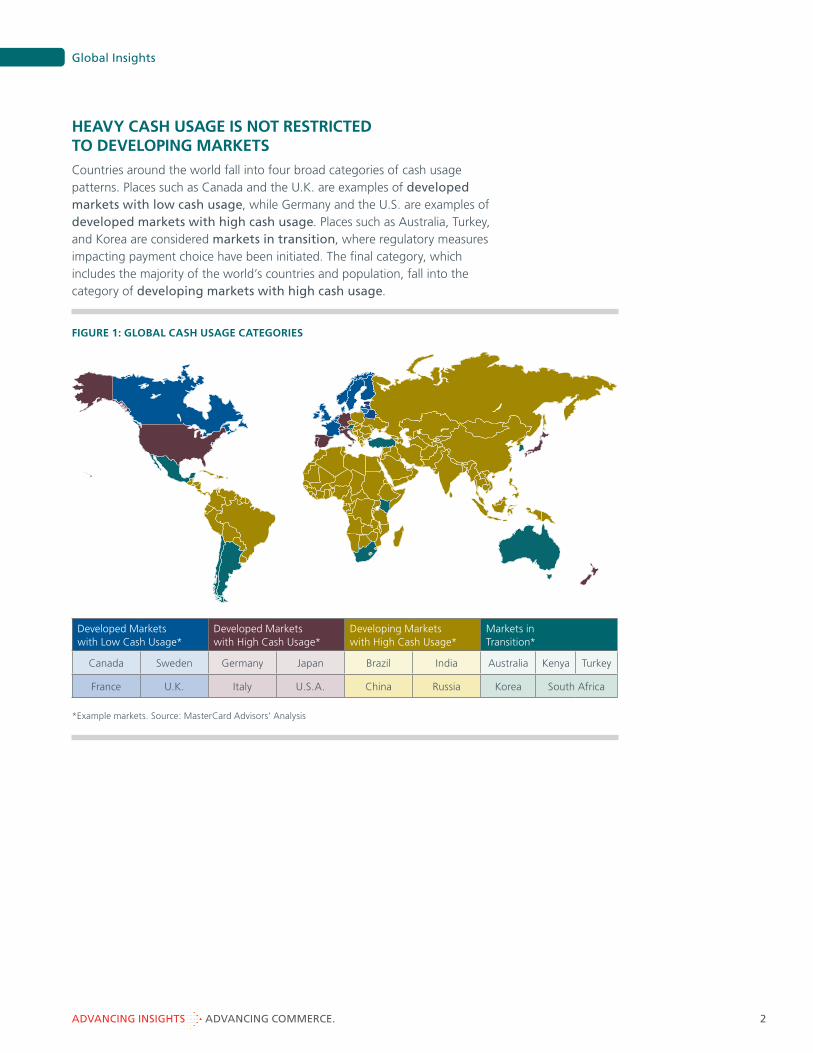
HEAVY CASH USAGE IS NOT RESTRICTED TO DEVELOPING MARKETS
Countries around the world fall into four broad categories of cash usage patterns. Places such as Canada and the U.K. are examples of developed markets with low cash usage, while Germany and the U.S. are examples of developed markets with high cash usage. Places such as Australia, Turkey, and Korea are considered markets in transition, where regulatory measures impacting payment choice have been initiated. The final category, which includes the majority of the world’s countries and population, fall into the category of developing markets with high cash usage.
FIGURE 1: GLOBAL CASH USAGE CATEGORIES
*Example markets. Source: MasterCard Advisors’ Analysis
Global Insights
3ADVANCING INSIGHTS ADVANCING COMMERCE.
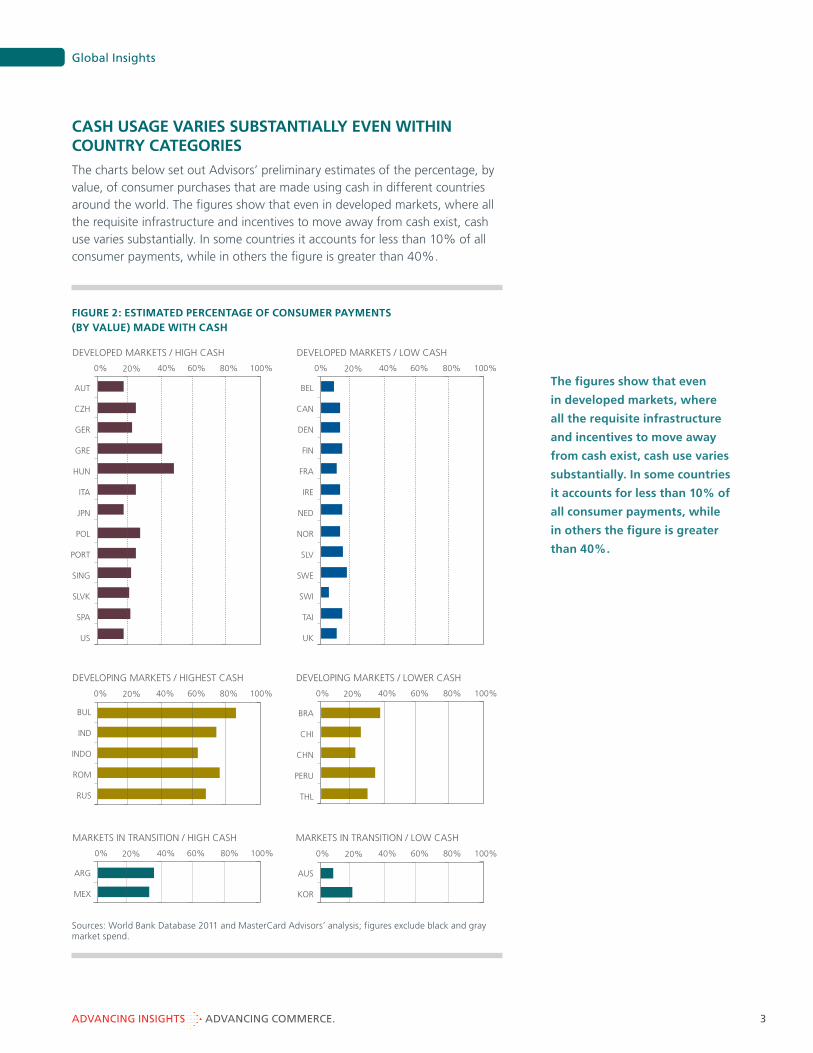
FIGURE 2: ESTIMATED PERCENTAGE OF CONSUMER PAYMENTS (BY VALUE) MADE WITH CASH
Sources: World Bank Database 2011 and MasterCard Advisors’ analysis; figures exclude black and gray market spend.
100%80%60%
MARKETS IN TRANSITION / HIGH CASH
40%20%0%
ARG
MEX
100%80%60%
MARKETS IN TRANSITION / LOW CASH
40%20%0%
AUS
KOR
100%80%60%
DEVELOPING MARKETS / LOWER CASH
40%20%0%
BRA
CHI
CHN
PERU
THL
100%80%60%
DEVELOPING MARKETS / HIGHEST CASH
40%20%0%
BUL
IND
INDO
ROM
RUS
100%80%60%
DEVELOPED MARKETS / LOW CASH
40%20%0%
BEL
CAN
DEN
FIN
FRA
IRE
NED
NOR
SLV
SWE
SWI
TAI
UK
100%80%60%
DEVELOPED MARKETS / HIGH CASH
40%20%0%
AUT
CZH
GER
GRE
HUN
ITA
JPN
POL
PORT
SING
SLVK
SPA
US
CASH USAGE VARIES SUBSTANTIALLY EVEN WITHIN COUNTRY CATEGORIES
The charts below set out Advisors’ preliminary estimates of the percentage, by value, of consumer purchases that are made using cash in different countries around the world. The figures show that even in developed markets, where all the requisite infrastructure and incentives to move away from cash exist, cash use varies substantially. In some countries it accounts for less than 10% of all consumer payments, while in others the figure is greater than 40%.
The figures show that even
in developed markets, where
all the requisite infrastructure
and incentives to move away
from cash exist, cash use varies
substantially. In some countries
it accounts for less than 10% of
all consumer payments, while
in others the figure is greater
than 40%.
Global Insights
4ADVANCING INSIGHTS ADVANCING COMMERCE.
CASH AND CORRUPTION TRAVEL TOGETHER
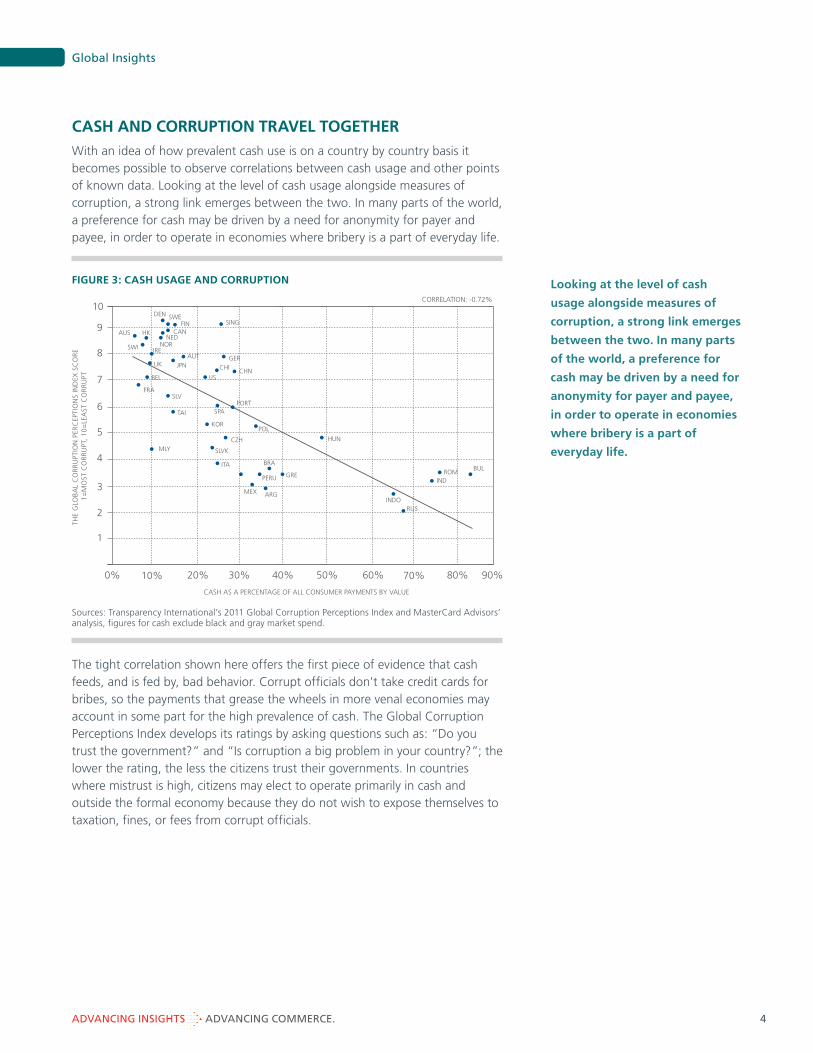
With an idea of how prevalent cash use is on a country by country basis it becomes possible to observe correlations between cash usage and other points of known data. Looking at the level of cash usage alongside measures of corruption, a strong link emerges between the two. In many parts of the world, a preference for cash may be driven by a need for anonymity for payer and payee, in order to operate in economies where bribery is a part of everyday life.
FIGURE 3: CASH USAGE AND CORRUPTION
Sources: Transparency International’s 2011 Global Corruption Perceptions Index and MasterCard Advisors’ analysis, figures for cash exclude black and gray market spend.
The tight correlation shown here offers the first piece of evidence that cash feeds, and is fed by, bad behavior. Corrupt officials don’t take credit cards for bribes, so the payments that grease the wheels in more venal economies may account in some part for the high prevalence of cash. The Global Corruption Perceptions Index develops its ratings by asking questions such as: “Do you trust the government?” and “Is corruption a big problem in your country?”; the lower the rating, the less the citizens trust their governments. In countries where mistrust is high, citizens may elect to operate primarily in cash and outside the formal economy because they do not wish to expose themselves to taxation, fines, or fees from corrupt officials.
Looking at the level of cash
usage alongside measures of
corruption, a strong link emerges
between the two. In many parts
of the world, a preference for
cash may be driven by a need for
anonymity for payer and payee,
in order to operate in economies
where bribery is a part of
everyday life.
50%40%30%
CASH AS A PERCENTAGE OF ALL CONSUMER PAYMENTS BY VALUE
THE
GLO
BA
L C
OR
RU
PTIO
N P
ERC
EPTI
ON
S IN
DEX
SC
OR
E 1
=M
OST
CO
RR
UPT
, 1
0=
LEA
ST C
OR
RU
PT
CORRELATION: -0.72%
20%10%0% 90%80%70%60%
10
9
8
7
6
5
4
3
2
1
DEN
HKAUS
SWI
FRA
BEL
UK
IRE
NEDCAN
FINSWE
NOR
JPN
AUT
SING
GER
CHI
USCHN
MLY
TAI
SLV
SPAPORT
KOR
CZH
SLVK
ITA
POL
MEX
PERU
ARG
BRA
GRE
HUN
INDORUS
INDROM
BUL
Global Insights
5ADVANCING INSIGHTS ADVANCING COMMERCE.
CASH-HEAVY ECONOMIES ARE HARDER PLACES TO DO BUSINESS
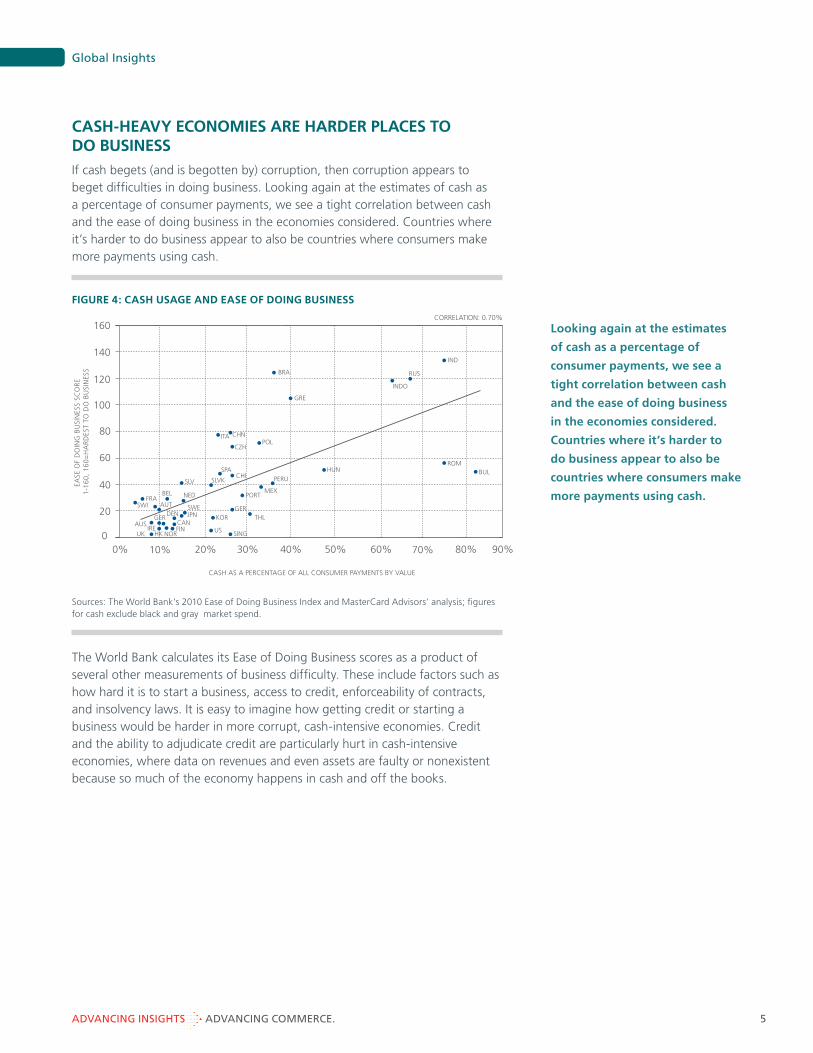
If cash begets (and is begotten by) corruption, then corruption appears to beget difficulties in doing business. Looking again at the estimates of cash as a percentage of consumer payments, we see a tight correlation between cash and the ease of doing business in the economies considered. Countries where it’s harder to do business appear to also be countries where consumers make more payments using cash.
FIGURE 4: CASH USAGE AND EASE OF DOING BUSINESS
Sources: The World Bank’s 2010 Ease of Doing Business Index and MasterCard Advisors’ analysis; figures for cash exclude black and gray market spend.
The World Bank calculates its Ease of Doing Business scores as a product of several other measurements of business difficulty. These include factors such as how hard it is to start a business, access to credit, enforceability of contracts, and insolvency laws. It is easy to imagine how getting credit or starting a business would be harder in more corrupt, cash-intensive economies. Credit and the ability to adjudicate credit are particularly hurt in cash-intensive economies, where data on revenues and even assets are faulty or nonexistent because so much of the economy happens in cash and off the books.
Looking again at the estimates
of cash as a percentage of
consumer payments, we see a
tight correlation between cash
and the ease of doing business
in the economies considered.
Countries where it’s harder to
do business appear to also be
countries where consumers make
more payments using cash.
50%40%30%
CORRELATION: 0.70%
20%10%0% 90%80%70%60%
BULROM
IND
RUS
INDO
BRA
GRE
HUN
PERU
MEXPORT
THLGER
KOR
SINGUS
SWEJPN
CANFIN
NORHKUK
GERAUS
DEN
IRE
NED
AUT
SLV
BELFRA
SWI
SLVK
SPACHI
ITA CHN
CZHPOL
160
140
120
100
80
60
40
20
0
CASH AS A PERCENTAGE OF ALL CONSUMER PAYMENTS BY VALUE
EASE
OF
DO
ING
BU
SIN
ESS
SCO
RE
1-1
60
, 1
60
=H
AR
DES
T TO
DO
BU
SIN
ESS
Global Insights
6ADVANCING INSIGHTS ADVANCING COMMERCE.
USING CASH ISN’T NECESSARILY ABOUT AVOIDING TAX
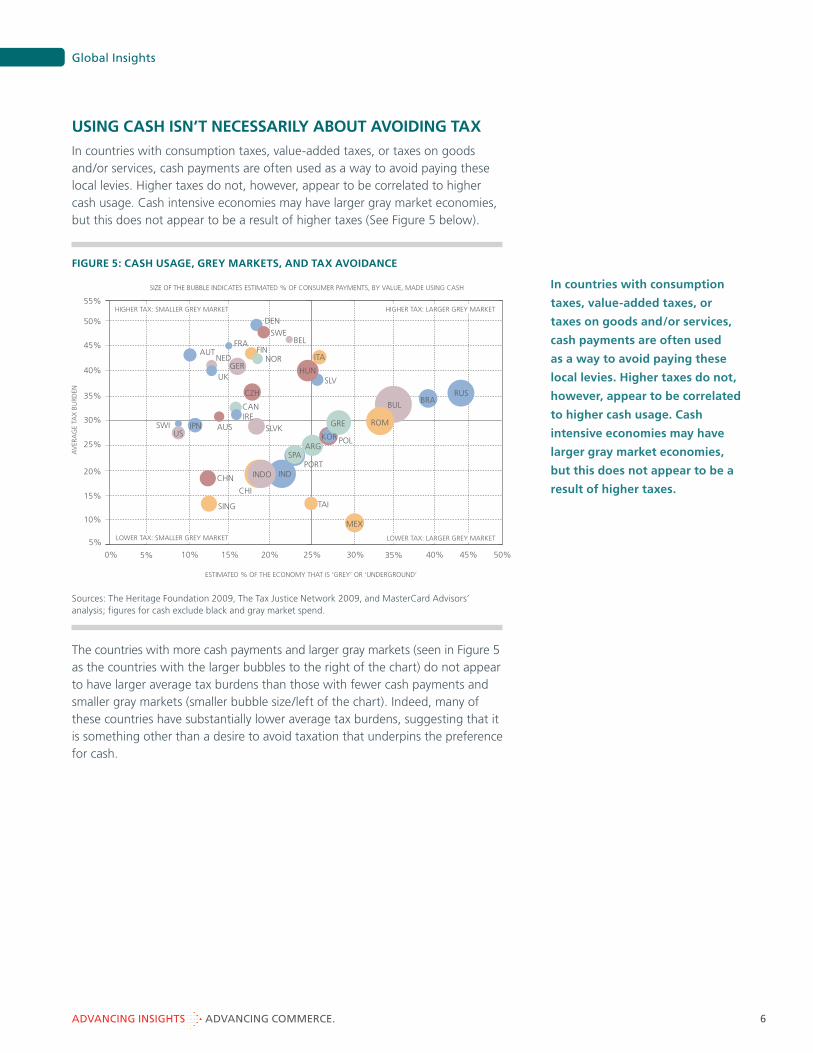
In countries with consumption taxes, value-added taxes, or taxes on goods and/or services, cash payments are often used as a way to avoid paying these local levies. Higher taxes do not, however, appear to be correlated to higher cash usage. Cash intensive economies may have larger gray market economies, but this does not appear to be a result of higher taxes (See Figure 5 below).
FIGURE 5: CASH USAGE, GREY MARKETS, AND TAX AVOIDANCE
Sources: The Heritage Foundation 2009, The Tax Justice Network 2009, and MasterCard Advisors’ analysis; figures for cash exclude black and gray market spend.
The countries with more cash payments and larger gray markets (seen in Figure 5 as the countries with the larger bubbles to the right of the chart) do not appear to have larger average tax burdens than those with fewer cash payments and smaller gray markets (smaller bubble size/left of the chart). Indeed, many of these countries have substantially lower average tax burdens, suggesting that it is something other than a desire to avoid taxation that underpins the preference for cash.
In countries with consumption
taxes, value-added taxes, or
taxes on goods and/or services,
cash payments are often used
as a way to avoid paying these
local levies. Higher taxes do not,
however, appear to be correlated
to higher cash usage. Cash
intensive economies may have
larger gray market economies,
but this does not appear to be a
result of higher taxes.
25%20%15%
ESTIMATED % OF THE ECONOMY THAT IS ‘GREY’ OR ‘UNDERGROUND’
SIZE OF THE BUBBLE INDICATES ESTIMATED % OF CONSUMER PAYMENTS, BY VALUE, MADE USING CASH
AV
ERA
GE
TAX
BU
RDEN
10%5%0% 45% 50%40%35%30%
55%
50%
45%
40%
35%
30%
25%
20%
15%
10%
5%
RUSBRA
BUL
ROMGRE
POLARG
SING
SWIUS
JPN AUS
CANIRE
SLVK
PORTSPA
TAI
MEX
IND
CHI
CHN
ITA
HUNSLV
DEN
SWEBEL
FINNOR
FRA
GER
CZH
NED
UK
AUT
KOR
INDO
HIGHER TAX: SMALLER GREY MARKET
LOWER TAX: SMALLER GREY MARKET LOWER TAX: LARGER GREY MARKET
HIGHER TAX: LARGER GREY MARKET
Global Insights
7ADVANCING INSIGHTS ADVANCING COMMERCE.
CASH-INTENSIVE ECONOMIES ARE LESS PRODUCTIVE PER CAPITA
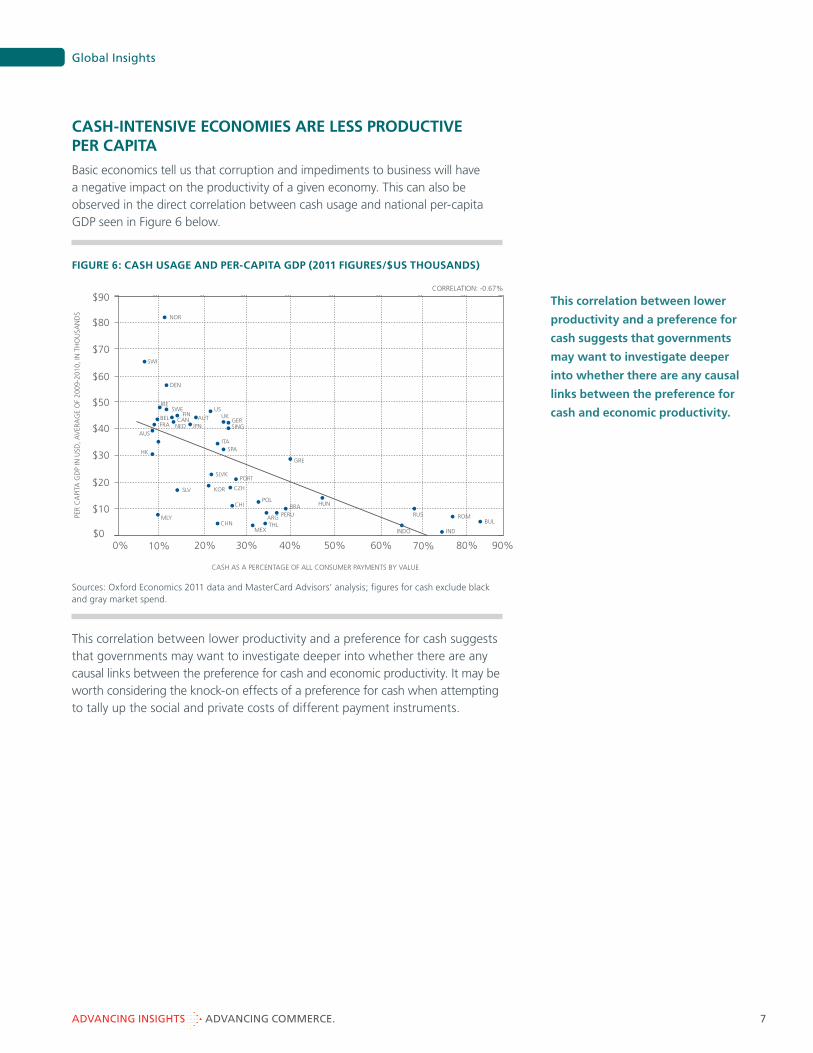
Basic economics tell us that corruption and impediments to business will have a negative impact on the productivity of a given economy. This can also be observed in the direct correlation between cash usage and national per-capita GDP seen in Figure 6 below.
FIGURE 6: CASH USAGE AND PER-CAPITA GDP (2011 FIGURES/$US THOUSANDS)
Sources: Oxford Economics 2011 data and MasterCard Advisors’ analysis; figures for cash exclude black and gray market spend.
This correlation between lower productivity and a preference for cash suggests that governments may want to investigate deeper into whether there are any causal links between the preference for cash and economic productivity. It may be worth considering the knock-on effects of a preference for cash when attempting to tally up the social and private costs of different payment instruments.
This correlation between lower
productivity and a preference for
cash suggests that governments
may want to investigate deeper
into whether there are any causal
links between the preference for
cash and economic productivity.
50%40%30%
CORRELATION: -0.67%
20%10%0% 90%80%70%60%
NOR
SWI
DEN
IRE
KOR CZH
PORT
GRE
AUS
SWE
BEL CAN
POL
MEX
ARG PERU
FINAUT
FRA NED
BRA HUN
RUS
INDO
JPN
USUK
GER
ROM
IND
BULTHL
SING
ITASPA
SLVK
HK
SLV
MLYCHN
CHI
$80
$90
$70
$60
$50
$40
$30
$20
$10
$0
CASH AS A PERCENTAGE OF ALL CONSUMER PAYMENTS BY VALUE
PER
CA
PITA
GD
P IN
USD
, AV
ERA
GE
OF
2009
-201
0, IN
TH
OU
SAN
DS
Global Insights
8ADVANCING INSIGHTS ADVANCING COMMERCE.
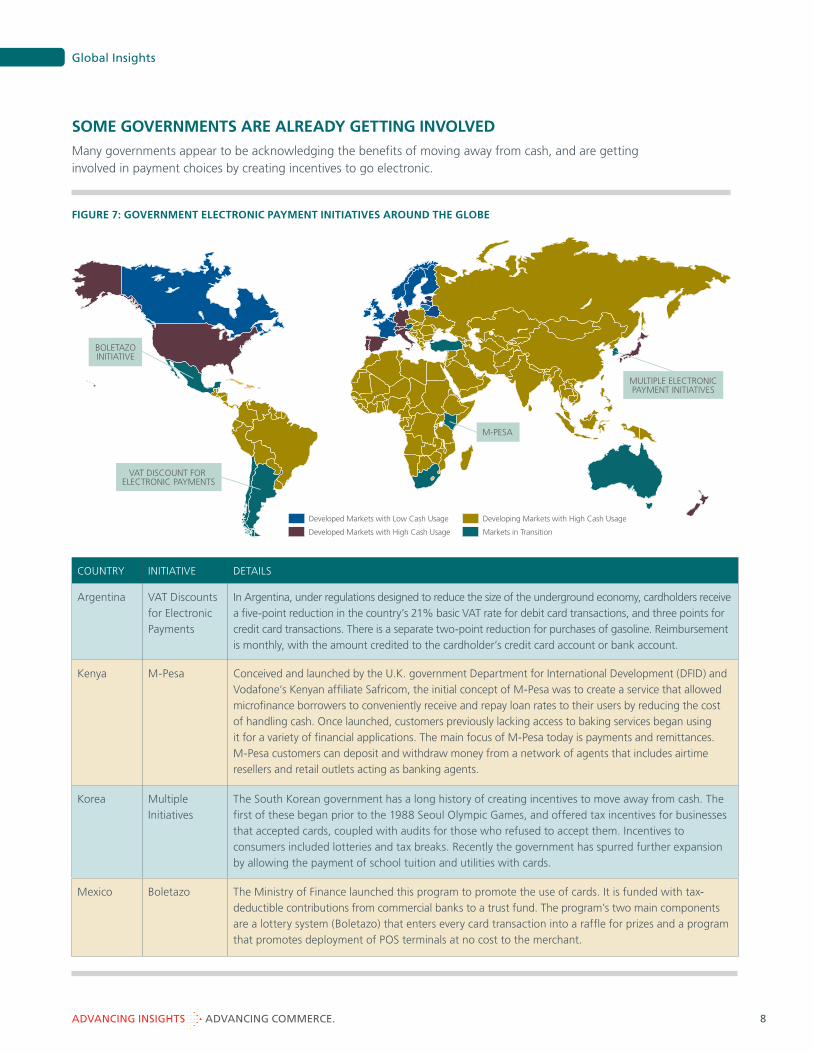
FIGURE 7: GOVERNMENT ELECTRONIC PAYMENT INITIATIVES AROUND THE GLOBE
MULTIPLE ELECTRONICPAYMENT INITIATIVES
M-PESA
VAT DISCOUNT FOR ELECTRONIC PAYMENTS
BOLETAZOINITIATIVE
Developed Markets with Low Cash Usage
Developed Markets with High Cash Usage
Developing Markets with High Cash Usage
Markets in Transition
SOME GOVERNMENTS ARE ALREADY GETTING INVOLVED
Many governments appear to be acknowledging the benefits of moving away from cash, and are getting involved in payment choices by creating incentives to go electronic.
COUNTRY INITIATIVE DETAILS
Argentina VAT Discounts
for Electronic
Payments
In Argentina, under regulations designed to reduce the size of the underground economy, cardholders receive
a five-point reduction in the country’s 21% basic VAT rate for debit card transactions, and three points for
credit card transactions. There is a separate two-point reduction for purchases of gasoline. Reimbursement
is monthly, with the amount credited to the cardholder’s credit card account or bank account.
Kenya M-Pesa Conceived and launched by the U.K. government Department for International Development (DFID) and
Vodafone’s Kenyan affiliate Safricom, the initial concept of M-Pesa was to create a service that allowed
microfinance borrowers to conveniently receive and repay loan rates to their users by reducing the cost
of handling cash. Once launched, customers previously lacking access to baking services began using
it for a variety of financial applications. The main focus of M-Pesa today is payments and remittances.
M-Pesa customers can deposit and withdraw money from a network of agents that includes airtime
resellers and retail outlets acting as banking agents.
Korea Multiple
Initiatives
The South Korean government has a long history of creating incentives to move away from cash. The
first of these began prior to the 1988 Seoul Olympic Games, and offered tax incentives for businesses
that accepted cards, coupled with audits for those who refused to accept them. Incentives to
consumers included lotteries and tax breaks. Recently the government has spurred further expansion
by allowing the payment of school tuition and utilities with cards.
Mexico Boletazo The Ministry of Finance launched this program to promote the use of cards. It is funded with tax-
deductible contributions from commercial banks to a trust fund. The program’s two main components
are a lottery system (Boletazo) that enters every card transaction into a raffle for prizes and a program
that promotes deployment of POS terminals at no cost to the merchant.
Global Insights
9ADVANCING INSIGHTS ADVANCING COMMERCE.
SUBJECT SUMMARY
The World Beyond Cash: Cash Transaction Pools
Delving still deeper into the pools of cash transactions identified in “Is There Such a Thing As Having Too Much Cash?” this short paper will provide estimates of the size of cash pools around the globe by payment locale (country and expenditure type) and offer ideas as to why these volumes persist as cash.
Factors Affecting Payment Choice
Cash is still used in a variety of situations where pure rational micro-economic considerations among stakeholders would suggest that other solutions would be preferred. This short paper offers a framework by which to think about all the considerations that go into stakeholder payment preference.
Merchant Considerations For Cash Usage
Cash is often perceived as the cheapest means by which to receive payment because it lacks any ad valorem element of cost (elements present in other methods of payment, such as credit and debit). This point of view only considers payment vehicles from a cost perspective, whereas a more balanced, P&L-type perspective is required. This study will flesh out the full list of factors to be considered as merchants seek to qualify the cost associated with different payment instruments.
CONCLUSIONS
There will always be a need for cash in some form. In places where infrastructures do not exist, or have been compromised, its portability and stored value can mean that cash is the only way to pay. Cash in some form is here to stay, whether we like it or not.
So while there may be good reasons to ensure that we are always able to use cash, its predominance in some economies suggests that cash usage feeds, and is being fed by, bad behavior. The estimates of cash usage prepared for this paper suggest that cash usage in many economies far outstrips what would be expected of consumers making rational micro-economic choices, and inasmuch as cash seems to be facilitating bad behavior, this preference for cash is not a good thing.
The information presented here can in no way be seen as implying any causation between cash usage and bad behavior. To blame bad behavior like corruption on a preference for cash would be like blaming high unemployment on too many job seekers. It would be blaming the symptoms for the disease. The most we can imply from the data reviewed is that a preference for cash appears, in many cases, to be symptomatic of broader economic problems and bad behavior. Data on the effect that reducing cash (i.e., through incentives such as M-Pesa or Boletazo) has had on this bad behavior are difficult to interpret and cannot be seen to imply a causal relationship between the two. This said, few governments that have undertaken initiatives to reduce the use of cash would question that they had had a positive overall effect on their economy.
NEXT STEPS
This is the first in a series of articles on the cost and consequences of cash. Planned future topics include:
The estimates of cash usage
prepared for this paper suggest
that cash usage in many
economies far outstrips what
would be expected of consumers
making rational micro-economic
choices, and inasmuch as cash
seems to be facilitating bad
behavior, this preference for cash
is not a good thing.
ADVANCING INSIGHTS ADVANCING COMMERCE.
For additional insights, please visit www.mastercardadvisors.com and insights.mastercard.com.
Global Insights
©2012 MasterCard. All rights reserved. Proprietary and Confidential.
Insights and recommendations are based on proprietary and third-party research, as well as MasterCard’s analysis and opinions, and are presented for your information only.
ABOUT THE AUTHORS
Hugh ThomasSenior Managing Consultant, MasterCard Advisors [email protected]
Kevin MellynPrincipal, MasterCard Advisors [email protected]