Embed Size (px)
Citation preview

IS TRADE PESSIMISM JUSTIFIED? OPENING THE “BLACK BOX” OF TRADE MODELING
by
Antoine Bouët and Valdete Berisha Krasniqi
Paper prepared for the Joint International Institute for Sustainable Development (IISD) and the World Trade Organization (WTO) Seminar on Modeling the Gains from Trade
Liberalization
Geneva, Switzerland, 22-23 June 2006
International Food Policy Research Institute
2033 K Street, NW
Washington, DC 20006
i

TABLE OF CONTENTS
GLOSSARY OF ABBREVIATIONS ....................................................................................................... iv 1. INTRODUCTION .................................................................................................................................... 1 2. MODELING TRADE LIBERALIZATION AND DEVELOPMENT UNDER CGEM .................... 3
2.1 Different experiments....................................................................................................................... 7 2.2 Different data ................................................................................................................................... 8 2.3 Different behavioral parameters....................................................................................................... 9 2.4 Different theoretical assumptions................................................................................................... 10
2.4.1 Pefect vs. imperfect competition ...................................................................................... 12 2.4.2 Modeling the factor market .............................................................................................. 12 2.4.3 Static vs. dynamic modeling.............................................................................................. 12
3. SENSITIVITY ANALYSIS .................................................................................................................. 13 4. CONCLUSION ...................................................................................................................................... 14 REFERENCES ........................................................................................................................................... 18 APPENDIX ................................................................................................................................................. 23
ii
ACKNOWLEDGEMENTS
This paper, which is a summary of a study by Bouët (2006), was commissioned by the Global Subsidies Initiative of the International Institute for Sustainable Development. The authors wish to thank Ronald Steenblik for his helpful comments on this draft. They remain grateful to Caesar Cororaton, Ashok Gulati, Alex Mc Calla, Simon Mevel, David Orden, Alberto Valdes and participants to a seminar at IFPRI on 16 September 2005 for their valuable observations and suggestions during preparation of the discussion paper on which this paper is based. Special thanks are owed to Alex Mc Calla for very helpful and interesting discussions. The usual disclaimer applies.
iii

GLOSSARY OF ABBREVIATIONS
AGOA African Growth Opportunity Act CEPII Centre d’Etudes Prospectives et d’Informations Internationales CGE Computable General Equilibrium EFTA European Free Trade Area EU European Union GDP Gross Domestic Product GEP Global Economic Prospects GTAP Global Trade Analysis Project HRT Harrison, Rutherford, Tarr HS Harmonized Commodity Description and Coding System LDC Least Developed Countries MENA Middle East and North Africa MIRAGE Modeling International Relations under Applied General Equilibrium NAFTA North America Free Trade Agreement OECD Organization for Economic Cooperation and Development RD Research and Development SACU Southern Africa Custom Union TRQ Tariff Rate Quota UN United Nations USA United States of America WTO World Trade Organization
iv

1. INTRODUCTION
Development and poverty alleviation have become a high priority for the international
community. Among many proposed remedies to these problems, trade liberalization is
expected to play a positive role both in reducing poverty and generating economic
growth in developing countries. This explains why numerous analysts have attempted to
assess the expected benefits of trade liberalization. The main empirical tool for these
assessments has been the use of multi-country Computable General Equilibrium (CGE)
models. These models, however, have produced divergent results. According to the
recent studies, the associated increase in world welfare from full trade liberalization
may range anywhere from 0.2% to 3.1% — results that differ by a factor of 15 to 1! The
impact on poverty headcount also varies widely, with the number of people that would
be lifted out of poverty projected anywhere from 72 million to 446 million.
Taken together, therefore, the models present a rather contrasting picture of the
effects of trade liberalization on poverty. They give the impression that with global
trade modeling, lack of agreement is the rule. Moreover, as a sophisticated and complex
tool of analysis, a CGE model often seems to be a “black box”, the results of which are
difficult to understand.
There are several reasons for these differences, many of which have to do with
the CGE model’s capacity to account for essential information in a way that was not
possible previously. The objective of this paper, which draws on a more in-depth
analysis (Bouët, 2006), is to explain how the main global trade models currently in use
capture the benefits from trade liberalization. In doing so, a new study was carried out
using the MIRAGE1 model — a CGE model capable of testing different scenarios and
assumptions — and the results compared with those obtained in other studies.
1 The MIRAGE model was developed at the Centre d’Etudes Prospectives et d’Informations Internationales (CEPII)
in Paris. A full description of the model is available at the CEPII’s web site (www.cepii.fr).
1

The paper also provides four key explanations as to why CGE-based studies
have produced such great diverging results, as well as discusses important convergent
conclusions. Finally, the study provides results from a sensitivity analysis which was
carried out to determine the relative importance of the four explanations.
2. HOW TRADE IS MODELED
Single and multi-country CGE models are complex as they have to take into account the
fundamental effects of policy change, such as income effects and interdependencies
among various sectors. The key difference between a single-country and multi-country
CGE model is that the former is unable to measure bilateral trade flows and cannot
capture discriminatory trade policies, such as those associated with regional agreements
or preferential schemes, whereas the latter is able to do so. For this reason, the multi-
country CGE model has become the instrument of choice for assessing the impact of
multilateral trade liberalization.
A multi-country CGE model is founded on a theoretical representation of the
world economy. Computable means that the model is calibrated so that it represents the
world economy at the initial period of time. General equilibrium means that the demand
and supply inall markets is ballanced. Models based on general equilibrium treat all
markets as interdependent; they account for real income effects. For example, in a
partial equilibrium model, the impact of liberalizing the domestic market of textile and
apparels will be studied only by looking at the direct effect that removing trade barriers
to these goods will have on the demand and supply in this particular sector. On the other
hand, a general equilibrium analysis would consider the impact of reduced consumer
prices on consumers’ real income and their demand for each product, the impact of
expanded activity in this sector on intermediate and capital consumption, the impact of
diminished public receipts on the fiscal deficit, and so forth.
In CGE modeling, the modeler must mathematically describe the behavioral
representations of consumers, producers, governments, and other related factors. One of
the major drawbacks of CGE models, however, is that they require a considerable
amount of information on economic variables, which greatly reduces their tractability.
2

For assessing the impact of trade liberalization, a multi-country CGE model is
the most comprehensive, but not the only, analytical tool available. Spatial and non-
spatial partial-equilibrium models and gravity models sometimes yield sufficiently
robust results. However, in general, partial equilibrium models are suitable only when
analyzing small sectors of single economies. They do not account for the
interdependence of markets. Therefore, instead of considering equilibrium across all
markets, as CGE models do, they model equilibrium in only one market. In short, partial
equilibrium models do not seek to describe the entire economic system, but focus on
modeling a particular sector or commodity. Nevertheless, this kind of analysis gives the
modeler more freedom to study a specific aspect of trade liberalization and is quite
relevant for incorporating richer and more realistic details than a CGE model.
Models using a gravity equation are based on econometrics (i.e., statistical
techniques applied to economics) and founded on multi-country general equilibrium.
They can be employed to evaluate the effects on trade flows caused by changes in
border measures, such as tariffs or quotas, either at the multilateral or regional level.
The advantage of the gravity equation is its extreme tractability. Furthermore, it yields
very robust econometric results. But, it can model only changes in exports and not in
gross domestic product, welfare, or the remuneration of productive factors.
Though these models may not be perfect, they represent important analytical
tools for the assessment of trade impacts. They are complementary tools, not substitutes:
for example, multi-country trade models can evaluate the impact of regional agreements
at a macroeconomic level, while a single-country trade model, with greater detail on
household incomes, can use this macro-economic shock (specifically, a change in world
commodity prices following liberalization) to evaluate the distributional impacts.
3. MODELING TRADE LIBERALIZATION AND DEVELOPMENT UNDER CGE MODELS: A SURVEY
The advanced capacity of CGE models to assess the impact of trade liberalization is a
result of several developments: increases in the availability and quality of economic
data, improvements in the calculation speed of computers, and the development of the
3

GTAP (Global Trade Analysis Project) network, among others. What is most surprising,
however, is the degree to which the quantitative results of CGE models differ. This
section of the paper provides a review of the divergent as well as convergent
conclusions from studies of impact of trade liberalization.
At last count, more than 20 CGE model assessments of the impact of full trade
liberalization on the world have been produced since the beginning of 20002, and nine
assessments of the impact of a potential Doha Round multilateral trade agreement.
These models suggest that, with full trade liberalization, the increase in world welfare
could range from 0.2 to 3.1%, depending on the model and assumptions used. The
number of people that would be lifted out from poverty ranges from 72 million to 440
million, with an average of 219 mln.3 These widely contrasting results paint a rather
jumbled picture of the effects of trade liberalization.
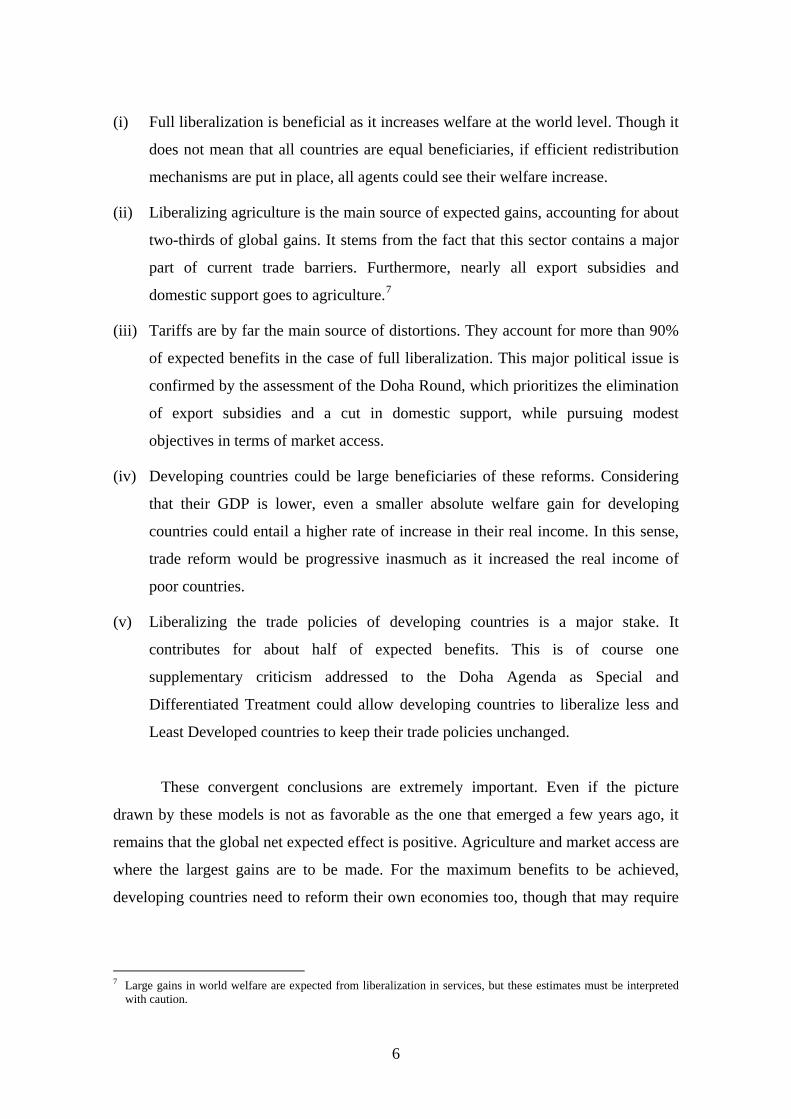
Figure 1 ranks the estimations of world benefits from full trade liberalization in
chronological order.4 Though results from recent CGE models differ, they reveal a
continuous downward revision in the expected world welfare gains from full trade
liberalization. For example, from an average world welfare increase of 1.7% in 1999,
the average estimate is 1.5% in 2002, 1.3% in 2004, and 0.5% in 2005. This trend in
results has been interpreted by some NGOs, and by some reports in the press, as
indicative of an increasing pessimism regarding the expected benefits from trade
liberalization. The assessments of impact on poverty headcount (with the exception of
Cline’s optimistic estimation in 2004) have reinforced the impression of trade
pessimism.
2 The Appendix contains the results from one such assessment of full trade liberalization, using the MIRAGE model. 3 In 2003, the number of people in poverty (US$ 2 per day definition) is estimated at 2.8 billion (World Development
Indicators, 2004). It means that full trade liberalization could decrease world poverty by between 2.9% and 19.1%, with an average [of 9.4%.
4 This graph does not include the study by the USDA’s Economic Research Service entitled “Agricultural Policy Reform in the WTO: The Road Ahead”, 2001, which only focused on the liberalization of agricultural trade.
4

Figure 1. Trade pessimism? The impact of full trade liberalization on world welfare (Percentage increase in real GDP)
0%
1%
2%
3%
4%D
essu
s et a
l., 1
999
Des
sus e
t al.,
199
9
Dee
and
Han
slow
, Mar
ch 2
000
And
erso
n et
al.,
June
200
0
The
Wor
ld B
ank,
GEP
200
2 (a
)
The
Wor
ld B
ank,
GEP
200
2 (b
)
The
Wor
ld B
ank,
GEP
200
4 (a
)
The
Wor
ld B
ank,
GEP
200
4 (b
)
Clin
e, 2
004
(a)
Clin
e, 2
004
(b)
Beg
hin
and
Van
der
Men
sbru
gghe
, 200
4
And
erso
n et
al.,
200
5
Fran
cois
, Von
Mei
jl an
d To
nger
en, 2
005
Her
tel a
nd K
eene
y, 2
005
Bou
et e
t al.,
200
5
Bou
et, 2
006
Car
negi
e, 2
006
Source: Bouët, 2006.
Until 2000, most studies concluded that there would be no losers from trade
liberalization, at least not at the national level — a vision of the world that one French
newspaper reporter dubbed “Mondialisation heureuse”.5 Starting with the study by
Philippa Dee and Kevin Hanslow (2000), however, more and more analysts have found
that full trade liberalization would lead to welfare losses for some countries.
Worryingly, the losers would nearly all be developing countries.6
The range of welfare gains resulting from a likely new agricultural agreement
under the Doha Round varies from 0.08% (Bouet, Bureau, Decreux and Jean, 2005) to
0.18% (Anderson, Martin and Van der Mensbrugghe, 2005a) and from 0.17% (Bouet,
Mevel and Orden, 2005) to 0.51% for the complete Round (Fontagne, Guerin and Jean,
2005).
Nevertheless, these studies have also led to similar conclusions about the impact
of trade liberalization. They agree on the following important aspects: 5 This French expression means “fortunate globalization”; the term became famous in France with the publication of
an article by Alain Minc in the Le Monde in August 2001. It was a tentative description of globalization as a wonderful process giving benefits to everybody in all countries throughout the world.
6 The sole exception, in one assessment conducted in 2000, would be Canada.
5
(i) Full liberalization is beneficial as it increases welfare at the world level. Though it
does not mean that all countries are equal beneficiaries, if efficient redistribution
mechanisms are put in place, all agents could see their welfare increase.
(ii) Liberalizing agriculture is the main source of expected gains, accounting for about
two-thirds of global gains. It stems from the fact that this sector contains a major
part of current trade barriers. Furthermore, nearly all export subsidies and
domestic support goes to agriculture.7
(iii) Tariffs are by far the main source of distortions. They account for more than 90%
of expected benefits in the case of full liberalization. This major political issue is
confirmed by the assessment of the Doha Round, which prioritizes the elimination
of export subsidies and a cut in domestic support, while pursuing modest
objectives in terms of market access.
(iv) Developing countries could be large beneficiaries of these reforms. Considering
that their GDP is lower, even a smaller absolute welfare gain for developing
countries could entail a higher rate of increase in their real income. In this sense,
trade reform would be progressive inasmuch as it increased the real income of
poor countries.
(v) Liberalizing the trade policies of developing countries is a major stake. It
contributes for about half of expected benefits. This is of course one
supplementary criticism addressed to the Doha Agenda as Special and
Differentiated Treatment could allow developing countries to liberalize less and
Least Developed countries to keep their trade policies unchanged.
These convergent conclusions are extremely important. Even if the picture
drawn by these models is not as favorable as the one that emerged a few years ago, it
remains that the global net expected effect is positive. Agriculture and market access are
where the largest gains are to be made. For the maximum benefits to be achieved,
developing countries need to reform their own economies too, though that may require
7 Large gains in world welfare are expected from liberalization in services, but these estimates must be interpreted
with caution.
6

that parallel policies, such as structural-adjustment programs, be already in place or
implemented simultaneously.
Nevertheless, divergences among these assessments and increased trade
pessimism require further examination. Four explanations that address the sources of
diverging results from CGEM studies are: (i) the experiments differ; (ii) the economic
data differ; (iii) the behavioral parameters differ; and (iv) the theoretical features of the
models differ.
3.1. Different experiments
Almost all studies use the GTAP database. When studying trade liberalization,
the reviewed studies usually suppose that it takes place in 2005 or 2006, implying an 8
to 9-year delay under GTAP-5 version (for 1997) and a 4 to 5-year delay in GTAP-6
(for 2001). Whatever the effective date of liberalization, it is undeniable that trade
barriers have been reduced since 1997 and 2000. Signal events have been the implemen-
tation of the Uruguay Round, the accession of China to the WTO, and the enforcement
of some preferential schemes, such as Europe’s “Everything but Arms” initiative and
the United States’ African Growth Opportunity Act (AGOA). Thus, applying a trade
shock on a dataset that does not include all this information overstates the impact of
further trade liberalization on trade flows, economic activity, and welfare.
This is the reason why most — but not all — studies (e.g., Beghin and Van der
Mensbrugghe, 2004; Bchir, Fontagne and Jean, 2005; and Anderson, Martin and Van
der Mensbrugghe, 2005; Hertel and Keeney, 2005) conduct a “pre-experiment”. This
involves simulating the implementation of those trade agreements that will go into force
during the period under analysis, and applying the results to the initial database. Trade
liberalization (complete, or a likely Doha Round outcome) is then simulated using the
modified database. In effect, what the models measure, therefore, are the additional
welfare gains that can be expected from trade liberalization, assuming that all the trade-
liberalization initiatives already agreed to are also fully implemented.
In addition to trade reforms, the assessment of liberalization needs to include
fiscal reforms, as the fiscal issue is a major concern in developing countries, where
corruption and tax evasion are often present. As income and sale taxes do not yield
sufficient public receipts, taxing imports has become a key source of revenues for the
7
public sector in developing countries, representing a range from 0.4% of the domestic
GDP in Botswana up to 4.3% in Tunisia. As a result, liberalizing trade may reduce
fiscal receipts in developing countries, which in turn, would affect the fiscal deficit of
such countries.
3.2. Different data
The utilization of different data leads logically to different assessments. Nearly
all assessments nowadays use the GTAP database for consumption, production, and
international trade. But divergences still arise from modelers using different databases
for information on tariffs and domestic support.
Data relating to market access have greatly evolved over the past few years. This
development may be one of the main sources of declining optimism about the expected
benefits from further trade liberalization. Three improvements in recent assessments are
significant: (i) the main databases take into account trade preferences and regional
agreements; (ii) ad valorem equivalents of specific tariffs and tariff rate quotas are
calculated; and (iii) the simulation of multilateral trade negotiation can now account for
the interaction of bound and applied duties.
The MacMap_HS6 database8 has become the main reference for measuring
market access in general equilibrium analysis. The use of this database has resulted in a
downwards assessment of the current levels of protection throughout the world as it
includes all preferential schemes and regional agreements, instead of basing border
protection uniquely on MFN (most-favored nation) tariffs. Such use has been subject to
criticism, as it implies that preferential schemes are being fully utilized. However,
contrary to previous empirical assessments, new methodologies and studies have
recently demonstrated that these preferences are, in fact, rather well utilized by
exporters from developing countries, especially in agriculture (Wainio and Gibson,
2003; Candau, Fontagne and Jean, 2004; Candau and Jean, 2005).
The primary objective of market-access negotiations at the multilateral level are
the reduction of bound duties. Thus, an accurate assessment of the impact of a
multilateral trade reform must take into account the interplay between bound, MFN 8 For a complete presentation of the MacMap-HS6 database, see Bouet, Decreux, Fontagne, Jean, and Laborde,
2005a and 2005b.
8

applied, and preferential duties. This consideration results in a downwards estimation of
the expected benefits of liberalization. Jean, Laborde, and Martin (2005) calculate that
taking into account applied tariffs instead of MFN tariffs in agriculture lowers border
protection by 30% (= [24%-17%]/24%), while at the world level and in agriculture also
the binding overhang—the amount by which maximum tariffs under WTO law are
greater than MFN applied tariffs—is greater than 13 percentage points (37% and 24%).
On the other hand, data on domestic support can also greatly differ across
studies. This support can act on production for intermediate consumption; it can be
bound or not. Almost all modelers use the GTAP-6 database for domestic support data.
These data have been calculated from the OECD Producer Support Estimate (PSE),
which consists of market price support arising largely from border measures and
budgetary payments. The former represents indirect transfers to producers and is not
included in the GTAP-6 database, whereas the latter are grouped in the GTAP-6
database according to four classifications: output payments, intermediate input
payments, land-based payments, and capital-based payments. Data on domestic support
can be improved further and certain studies have made progress in that aspect. For
example, Bouët, Bureau, Decreux, and Jean (2005) integrate fully decoupled payments
— treated as the return to self-employed labor — as well as land set-aside programs,
which are modeled as a reduction in the productivity of farmland.
Finally, CGE modeling of consumption, production, and trade of several
products in several trading zones requires solving a very large system of equations.
Thus, it is necessary to identify a limited number of sectors and trading zones. It means
that two studies assessing the impact of the same trade reform with the same model and
the same data, but with different product and geographic decomposition, will produce
different estimates of changes in welfare.
3.3. Different behavioral parameters
Welfare effects created by liberalization depend crucially on trade elasticities, or
more precisely the price elasticities of exports. The Armington9 hypothesis precisely
means that products are differentiated by their country of origin. Determining the level
of Armington elasticities (i.e., the degree of substitution between domestically produced 9 See Armington, 1969.
9

and imported goods as their relative prices diverge10) is a key parametrical choice of a
modeler as it determines how much imports will increase when tariffs are eliminated.
With higher Armington elasticities, liberalization creates more trade and higher real
incomes, as a result.
Unfortunately, there is no consensus on the value of Armington elasticities; they
vary with the level of product disaggregation. On average, the GTAP network provides
relatively low trade elasticities, even though recent developments have provided higher
estimation of these parameters (see Hertel, Hummels, Ivanic and Keeney, 2004). On the
contrary, Harrison, Rutherford and Tarr (henceforth the HRT model, see for example
Harrison, Rutherford and Tarr, 1997 and 2001) utilize much higher trade elasticities
than the GTAP (see for example Tarr et al. 2001) while the World Bank’s LINKAGE
elasticities are intermediate: on average they are 35% higher than the GTAP ones, but
75% higher in agriculture. This point is a direct and important explanation for the
divergences of assessments of trade liberalization.
One of the reasons, for example, why Cline’s study is more optimistic about the
impact of liberalization is its usage of the HRT model, which leads to higher welfare
effects from full trade liberalization. Anderson, Martin and Van der Mensbrugghe
(2005a and 2005b) obtain intermediate results; using elasticities contained in the GTAP
database, they even demonstrate that this is the main explanation for differences in
assessing welfare effects.
3.4. Different theoretical assumptions
The final source of divergence concerns theoretical features of models. It is
nearly impossible to be exhaustive on this topic as modelers have to make numerous
theoretical choices. Some of the most important theoretical assumptions in assessing the
impact of trade liberalization have to do with whether the modeler assumes perfect or
imperfect competition, whether the modeling is static or dynamic, and assumptions
made on factor markets. 10 A few years ago, Gallaway, McDaniel and Rivera (2003) derived a comprehensive and detailed sets of Armington
elasticity estimates, providing them for 309 industries (at the 4-digit SIC level) over the period 1989 to 1995. Their significant long-run estimates ranged from 0.52 to 4.83. The higher figure means that a 1% increase in the relative price of a good produced in a country compared with the price of imported goods will decrease the ratio of consumed domestic goods on imported goods by 5%. Armington elasticities are sensitive to the level of commodity aggregation at which the estimates were derived. Generally, the more precisely the commodity described, the greater its substitutability (Reinert and Roland-Holst, 2002).
10

Adopting specific theoretical assumptions can lead to very specific results. The
Carnegie model (Polaski, 2006) assumes that in developing countries' industrial
sectors, real unskilled labor remuneration is fixed (due to unemployment) while the
agricultural wage is perfectly flexible and assures full employment. A migration
function describes rural and urban reallocation of this productive factor and its intensity
depends on the difference between agricultural and urban wages.
For example, when a developing country enters a liberalization agreement its
industry can be negatively shocked due to increased openness. Less demand for
domestic industrial products leads to less demand for labor in this sector. This causes
labor migration to rural areas, therefore, increasing labor supply in agriculture, which
means — all things held equal — a reduction in the equilibrium wage. Thus, in a case
like this, trade liberalization would lead to lower employment in the industrial sector
and lower wages in agriculture.
On the other hand, in the case that the industrial sector expands due to an
increase in exports, demand for labor in this sector increases, resulting in labor
migration from rural to urban areas; this means a decrease in the labor supply in
agriculture and, consequently, an increase in agricultural wages. Therefore, for a
country undergoing a similar experience, trade liberalization would entail more
industrial employment and higher agricultural wages.
This causes very contrasting outcomes for developing countries, depending on
whether the impact of trade reform is positive or negative on their industrial sector.
Furthermore, there is no equilibrating force as the model is calibrated in order to
maintain fixed real wages in industry. In a flexible wage model, however,
competitiveness in the industrial sector is progressively eroded as industrial wages are
increased.
3.4.1. Perfect vs. imperfect competition
An analyst using a CGE model can adopt either a perfect or imperfect
competition framework for all productive sectors, or vary the assumptions among the
different sectors. In the latter case, industry and services are very often characterized by
imperfect competition while the agricultural market is characterized as perfect.
In perfect competition there is no fixed cost and, as all producers are price-takers
(i.e., no individual seller can significantly influence the market price), the equilibrium
11

price is equal to the marginal cost of production. When competition is imperfect, there
is a fixed cost so that average costs fall with increased output. In most models under
imperfect competition, products are differentiated into “varieties”. Imperfect
competition brings new sources of welfare: economies of scale, which decreases prices
when output expands, and horizontal differentiation. It is generally supposed that
consumers love variety, and that expanding the size of the market implies they will have
more varieties to choose from. Though it is clearly more realistic than perfect
competition, this feature is not systematically adopted in all CGE model assessments as
it requires a lot of detailed information about the economic structure in a multi-country
multi-product model. Thus, results obtained from studies that incorporate this feature
depend on the assumption choices that the modeler makes.
3.4.2. Modeling the factor market
A key feature of CGE models are the assumptions about the productive factor
markets. For example, it can be supposed that labor is either perfectly mobile (labor
receives only one wage across the entire economy) or perfectly immobile (wages differ
across sectors in the economy), or that there is an imperfect mobility of labor between
agricultural and non-agricultural activities11 but that mobility is perfect within each of
these activities. Some primary factors (e.g., land, or water for irrigation) are naturally
less mobile than others, but even in this respect assumptions can differ across studies as
one can assume, at one extreme, that land in agriculture cannot be shifted from one
product to another, or at the other, that land is fully mobile across all agricultural
activities. So, studies with different assumptions on productive factor markets offer
different results on welfare and real income.
3.4.3. Static vs. dynamic modeling
CGE models are typically distinguished by whether they are static or dynamic in
nature. Static modeling explains economic change at a single interval of time; it does
not describe the process of change. On the other hand, dynamic modeling attempts to
explain the process in which change occurs. For example, trade liberalization might
affect simultaneously income, saving and investment, and capital (or other primary
11 In order to represent this imperfect immobility, a constant elasticity of transformation is often assumed between
these different types of activities. This means that labor is allocated among the different activities according to the ratio of remunerations.
12
factors, such as skilled labor and land), all of which are accounted for by dynamic
models. Elements of the MIRAGE model that reflect its dynamic modeling capacity, for
example, include: investment, land supply, share of skilled and unskilled labor,
economies of scale, and the emergence or closure of firms in certain sectors.
Another key assumption explaining the divergence across studies certainly
comes from the relationship between total factor productivity and trade openness. For
example, when the World Bank produced its 2004 Global Economic Prospects report, it
assumed that trade openness explains 40% of the growth in total factor productivity
growth within countries, on average. The reasoning behind this assumption is that, as
firms export more, they are supposed to learn about new technologies, to compete [?]
with foreign producers and bring their production process up to international standards.
Moreover, firms can react to more competition by increasing investment in research and
development (RD), which affects positively all factor productivity.
Trade openness should, therefore, increase factor productivity. But, the way in
which this relation has been introduced in CGE models may be criticized for several
reasons. First, the equation describing a positive relationship between trade openness
and a sector’s productivity can be considered as an ad hoc element introduced into CGE
models used to study the impact of trade liberalization; it has no microeconomic
foundation. Obviously, introducing such a function amplifies the positive effects on
efficiency associated with opening up trade. Second, this ad hoc relationship provides
no clue as to which countries, sectors or productive factors would be the first
beneficiaries, as its influence is not equally strong in all countries, across all sectors and
for all factors.
4. SENSITIVITY ANALYSIS
In order to test these explanations for the diverging results, a sensitivity analysis was
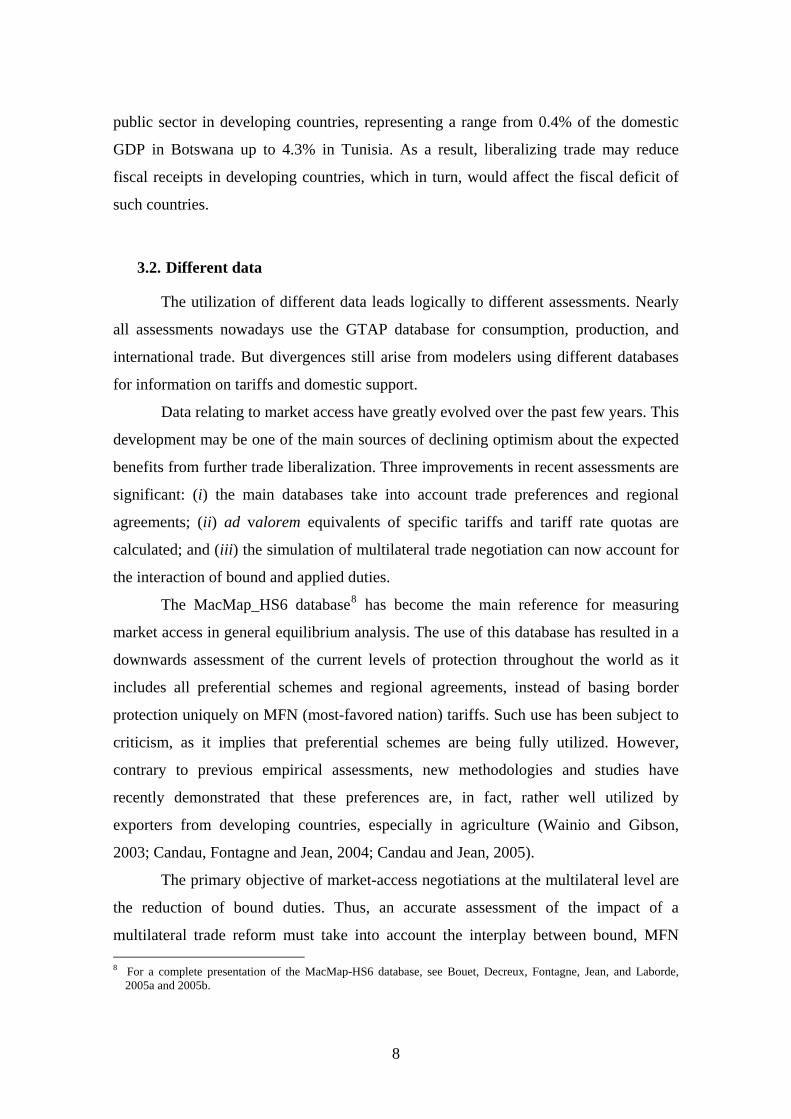
carried out using the CGE modeling framework described in the Appendix. Figure 2
provides the main conclusion of this sensitivity analysis. The assessment carried out
under the MIRAGE model (see Appendix) concluded that full trade liberalization would
entail a 0.33% increase in world real income. If the pre–experiment had not been
13

accounted for (that is, if the trade liberalization that occurred from 2001 to 2005 had not
been taken into account before testing the impact of full trade liberalization), this rate of
change would have been raised by 36%, to 0.45%.
The utilization of trade elasticities from the World Banks’ LINKAGE model
would have yielded approximately the same results (33% increase). If the simulations
were based on a database with no preferential schemes, the result would have suggested
a 24% higher increase in the world welfare. Finally, including a positive relationship
between trade openness and total factor productivity would have given a rate of change
in the world welfare 79% higher. Though other theoretical features (exogenous or
endogenous land supply, imperfect or perfect competition) or empirical choices
(different database on distortions, different product and sector disaggregations) may
also have an impact, these four explanations obviously play a major role.
Figure 2— Why do global trade models differ so much? The rate of change in world welfare compared with the central experiment
0%
25%
50%
75%
100%
No pre-experiment
Nopreferential
duties
Linkage tradeelasticities
Tradeopenness -
TFP relation
Source: Bouët, 2006.
5. CONCLUSION
This paper sets out to explain the reasons for divergent results among studies of the
welfare effects of trade liberalization. The first explanation comes from different
assessments of the current level of trade distortions: it is now widely recognized that
these assessments have to take into account preferential schemes and regional
agreements. This implies that assessments have now converged, but not fully.
14

Today, the main source of divergences is the modeler’s choice of the level of
trade elasticities and the implementation of dynamic relations. There is no consensus yet
on the impact of behavioral parameters. Moreover, the link between openness and factor
productivity might be strong, but it is not fully understood and precisely estimated.
When considering divergences in CGE model assessments, it could be argued
that all CGE models are structurally identical (all are so-called Walrassian models12),
and that therefore their duplication is wasteful and confusing. However, from the
methodological conclusions outlined here (convergence on market access data and
divergence on trade elasticities, dynamic relations, understanding of trade in services,
and non-tariff barriers), it appears that, on the contrary, there remains some value in
CGE models continuing to compete. If the data characterizing actual market access have
recently been improved, it is largely thanks to competition among research teams. In
this respect, one can expect future progress in the understanding of dynamic relations,
trade in services, the impact of non-tariff barriers, and so forth.
Recent studies have lowered expectations regarding the potential impact of trade
liberalization on poverty reduction. This is due to improved assessments of existing
trade distortions. Previous assessments provided a more optimistic view of trade
liberalization’s impact on poverty, primarily because they were not able to account for
regional agreements, preferential schemes and recent policy changes in trade and
agricultural policies, all of which make for a more globalized world than it was
previously thought. Furthermore, lesser benefits stemming from a potential Doha Round
multilateral trade agreement are expected, as the assessments take into account the
interplay between distortions associated with bound and applied tariffs and domestic
support.
Nevertheless, most trade modelers expect that the effects from further trade
liberalization are likely to be positive. There is agreement that world welfare would
increase, mainly as a result of elimination of agricultural distortions. This welfare gain
could be amplified by up to 80% if openness increases factor productivity. At the same
time, liberalization should generally contribute to poverty alleviation as remuneration of
unskilled labor is expected to rise in numerous developing countries, especially in South
12 Named after the French economist, Marie-Ésprit Léon Walras (1834-1910), widely regarded as the father of
general-equilibrium theory.
15

America, Sub-Saharan Africa, and Developing Asia. However, liberalization could only
marginally reduce world inequality.
There are always winners and losers from trade liberalization. In some countries
(Mexico, Zambia), poverty may increase as liberalization leads to decreased
remuneration of unskilled labor. This is not an uncommon impact as several studies (see
Hertel, Ivanic, Preckel, and Cranfield, 2000) have already obtained such results. Model-
based assessments, however, may underestimate the positive impacts of trade
liberalization on world welfare for two reasons: (i) most of them do not include
liberalization in services, and (ii) they do not include trade facilitation and elimination
of some non-tariff barriers (technical, sanitary and phyto-sanitary norms).
The Doha Agenda will not entail an implementation of full trade liberalization.
On the contrary, it will lead to a more or less ambitious package; recent assessments of
trade liberalization scenarios by CGE models have been successful in showing that “the
devil could be in the details”, implying that CGE models have been able to account for
more information and details that may be crucial in determining the impact of trade
liberalization than they have in the past.
Several policy recommendations emerge clearly from the literature:
Tariff cuts have to be large and “progressive” (higher rates of reduction on
higher tariffs). On the tariff issue, a sensitive products clause could have very
negative consequences on the extent of liberalization even if it concerns a
limited number of products. Furthermore, implementing a cap on tariffs, even at
a relatively high level (200%) could be a measure fostering liberalization.
Agriculture is the main area where distortions are greatest and need to be
reduced.
Developing countries have would benefit from liberalizing their own economies.
On this topic, the Special and Differentiated Treatment that the WTO offers
gives them flexibility, but it may have negative consequences on these countries.
From recent modeling exercises, and studies in the literature, expected benefits
from trade liberalization are surprisingly low. The Asian miracle, Chile’s experience,
Chinese and Indian liberalization all brought high annual growth rates, yet the CGE
16
models show a less than 3% increase in total real income. It could mean either that
dynamic gains are not well captured by the global trade models or that these gains come
from the domestic reform accompanying trade liberalization. Nevertheless, it implies
that the relationship between trade and domestic reforms is not well understood.
CGE models nonetheless can help in understanding the economic impacts of
trade liberalization. To make them more useful, research needs to be focused on four
priorities:
A better understanding and inclusion of non-tariff barriers, administrative
controls, and lack of infrastructure.
A better understanding of dynamic relations and the way in which trade
liberalization affects factor productivity and capital accumulation.
Knowledge of the nature and the exact content of domestic reforms that could
amplify expected benefits from trade liberalization.
A detailed examination of the link between trade and poverty.
The fourth priority has been the object of important progress in the recent years. This is
all the more positive as poverty alleviation remains the ultimate objective of this debate.
17
REFERENCES
Anderson K., Martin W., & Van der Mensbrugghe D. (2005a). Market and welfare
implications of Doha reform scenarios. In K. Anderson & W. Martin (eds), Trade reform and the Doha Agenda. Washington DC: The World Bank.
Anderson K., Martin W., & Van der Mensbrugghe D. (2005b). Doha Merchandise trade
reform: what’s at stake for developing countries?, Plenary paper for the 8th Annual Conference on Global Trade Analysis, Lubeck, 9-11 June 2005. Washington DC: The World Bank.
Armington P. (1969). A theory of demand for products distinguished by place of origin,
IMF Staff Papers, 16: 159-178. Bchir M.H., Fontagne L., & Jean S. (2005). From bound duties to actual protection:
industrial protection in the Doha Round, CEPII Working Papers, no. 2005 – 12, July.
Beghin J.C. & Van der Mensbrugghe D. (2003). Global agricultural reform: what is at
stake? in M.A. Aksoy and J.C. Beghin, (eds.), Global agricultural trade and developing countries. Washington DC: The World Bank.
Bouët A. (2001). Research and development, voluntary export restriction and tariffs,
European Economic Review, 45: 323-336. Bouët A., Bureau J. C., Decreux Y. & Jean S. (2005). Multilateral Agricultural Trade
Liberalization: The Contrasting Fortunes of Developing Countries in the Doha Round. The World Economy, 28-9: 1329-1354.
Bouët A., Decreux Y., Fontagné L., Jean S. & Laborde D. (2005a). Tariff duties in
GTAP6: the MacMap-HS6 database, sources and methodology. In B. V. Dimaranan & R. A. McDougall (eds.), Global Trade, Assistance, and Production: The GTAP 6 Data Base. West Lafayette, Indiana: Center for Global Trade Analysis, Purdue University, forthcoming.
Bouët A., Decreux Y., Fontagné L., Jean S. & Laborde D. (2005b). A consistent ad
valorem equivalent measure of applied protection across the world: the MacMap-HS6 database, CEPII Working Paper. Paris: CEPII
Bouët A., Mevel S. & Orden D. (2005). More or less ambition? Modeling the
development impact of US-EU Agricultural Proposals in the Doha Round. IFPRI Policy Brief, December 2006. Washington DC: IFPRI
Bouët A. (2006). What can the Poor expect from Trade Liberalization? Opening the
“Black Box” of Trade Modeling. MTID Discussion Paper, no. 93. Washington DC: IFPRI
18

Candau F., Fontagné L. & Jean S. (2004). The Utilization Rate of Preferences in the EU. 7th Global Economic Analysis Conference, Washington DC, 17-19 June.
Candau F., & Jean S. (2005). What Are EU Trade Preferences Worth for Sub-Saharan
Africa and Other Developing Countries?, CEPII Working Paper, 2005-19, December.
Cline W. R. (2004). Trade policy and global poverty, Washington DC: Institute for
International Economics. Dee P. & Hanslow K. (2000). Multilateral liberalisation of services trade. Staff Research
Paper, Australia: Productivity Commission, March. Diao X., Somwaru A.& Roe T. (2001). A global analysis of agricultural reform in WTO
member countries, in Agricultural Policy Reform – The Road Ahead, AER, 802, 25-42.
Fontagne L., Guerin J.L. & Jean S. (2005). Market access liberalization in the Doha
Round: scenarios and assessment, The World Economy, 28, 8, 1073-1094. Francois J., Van Meijl H. & Van Tongeren F. (2005). Trade liberalization in the Doha
development Round, Economic Policy, vol, 20, Issue 42: 349-391. Gallaway, M. P., McDaniel C. A. & Rivera S. A. (2003). Short-Run and Long-Run
Industry-Level Estimates of U.S. Armington Elasticities. North American Journal of Economics and Finance, Vol. 14, Issue 1: 49-68.
Harrison G.W., Rutherford T.F. & Tarr D.G. (1997). Quantifying the Uruguay Round,
Economic Journal, 107:1405-30. Harrison G.W., Rutherford T.F. & Tarr D.G. (2001). Trade liberalization, poverty and
efficient equity, Journal of Development Economics, 71-1: 97-128. Hertel T.W., Ivanic M., Preckel P.V., & Cranfield J.A.L.. (2000). The earning effects
of multilateral trade liberalization: implications for poverty. The World Bank Economic Review, vol. 18, n.2: 205-236.
Hertel T.W., Hummels D., Ivanic M., & Keeney R. (2003). How confident can we be in
CGE – based assessments of free trade agreements?, GTAO Working Paper n. 26, West Lafayette, Indiana: Center for Global Trade Analysis, Purdue University.
Hertel T.W. & Keeney R. (2005). What’s at stake: the relative importance of import barriers, export subsidies and domestic support. In Hertel T., and Winters L.A., (eds.), Putting Development Back into the Doha Agenda: Poverty Impacts of a WTO Agreement, Washington DC: The World Bank.
Hertel T., & Winters L.A. (2005). Putting Development Back into the Doha Agenda:
Poverty Impacts of a WTO Agreement, Washington DC: The World Bank.
19

Jean S., Laborde D. & Martin W. (2005). Consequences of alternative formulas for
agricultural tariff cuts. In K. Anderson and W. Martin (eds.), Trade reform and the Doha Agenda, Washington DC: The World Bank,
Organization for Economic Co-operation and Development. (2006). Agricultural Policy
and Trade Reform: Potential Effects at Global, National and Household Levels. Paris: OECD Publications.
Reinert, K. A. & Roland-Holst D. W. (1992). Armington Elasticities for United States
Manufacturing Sectors. Journal of Policy Modeling, Vol. 14, No. 5, pp. 631-39. Reitzes J.D. (1991). The impact of quotas and tariffs on strategic R&D behaviour,
International Economic Review, 32(4), 985-1007. Tarr D., Harrison G.W., Rutherford T.F. & Gurgel A. (2002). How are globalization
and poverty interacting and what can governments do about it? OECD Headquarters Seminar, December 9th-10th 2004.
Wainio, J. & Gibson J. (2003). The Significance of Nonreciprocal Trade Preferences
for Developing Countries. Paper presented at the International Conference ‘Agricultural Reform and the WTO: Where Are We Heading?’, Capri, June.
World Bank, The. (2002). Global Economic Prospects and the Developing Countries:
Making World Trade for the World’s Poor, The World Bank, GEP, 2002, Washington DC.
World Bank, The. (2004). Global Economic Prospects: Realizing the Development
Promise of the Doha Agenda, The World Bank, GEP 2004, Washington DC. World Bank, The. (2005). Global Economic Prospects: Agricultural growth for the poor
- an agenda for development, The World Bank, GEP 2005, Washington DC.
20

Burfisher, M. E. and others. (2001). Agricultural Policy Reform in the WTO: The Road Ahead. Agricultural Economic Report No. 802, ERS, USDA
Polaski, S. 2006. Winners and Losers: Impact of the Doha Development Round on
Developing Countries, Washington DC: Carnegie Endowment for International Peace.
21

22
APPENDIX
A new assessment of the impact of trade liberalization using MIRAGE
This appendix presents the results obtained from a recent study of trade
liberalization using the the MIRAGE model (Bouët, 2006). Before considering the
results, however, it is important to understand the key technical features of the model.
MIRAGE (Modeling International Relationships in Applied General Equilibrium) is a
multi-sector, multi-region CGEM devoted to trade policy analysis. It is a very tractable
model as sensitivity analysis is easy to implement; it proposes original features like
vertical differentiation of products and foreign direct investment; it is founded on
econometrically justified levels of Armington elasticities and micro-economically based
relations. Consequently, it provides realistic assessments of benefits from trade
liberalization.
In MIRAGE, substitutability between two intermediate goods exists, depending
on the relative prices of these goods. Factor endowments are fully employed. The only
factor for which the supply is constant is natural resources. Skilled labor is the only factor
perfectly mobile. There is full employment of labor, and both perfect and imperfect
competition are considered.
The MIRAGE model has two features that influence geographical decomposition.
First, it distinguishes countries with an abundant supply of land from those for which
land is scarce. Second, it differentiates products according to whether they have been
produced in northern or tropical climates. The geographical decomposition presented in
Table 1 reflects specific characteristics of various countries and regions. It emphasizes
the heterogeneity of developing countries according to forces that could contribute to
successful stories for some countries (Brazil, China, India), but also to great loses for
others (Bangladesh, Mexico, Tunisia, Zambia). Four developing zones have been
distinguished due to the specificity of their geographic trade composition: the “Rest of
Developing Asia”, the “Rest of Middle East and North Africa (MENA)”, the “Rest of
America (excluding OECD countries)”, and the “Rest of Sub–Saharan Africa”.
23

Table 1— Geographical decomposition
# Abbrev Zone Nor
th/S
outh
Land
= sc
arce
fact
or
1 AUNZ Australia/New Zealan d North No2 Cana Can ada North No3 DvdA Dev eloped Asia North Yes4 EU25 European Un ion - 25 North Yes5 USAm USA North No6 Roec Rest o f OECD North Yes7 Arge Argen tin a South No8 Bgld Ban g ladesh South Yes9 Braz Brazil South No
10 Chin Chin a South Yes11 DvgA Dev elopin g Asia South Yes12 Indi In dia South Yes13 Mexi Mexico South Yes14 SACU Southern Africa Custom Un ion South Yes15 Tuni Tun isia South Yes16 Zamb Zam bia South Yes17 Rame Rest o f Am erica South Yes18 Rmen Rest o f Middle East an d North Africa South Yes19 RSSA Rest o f SubSaharan Africa South Yes20 RofW Rest o f the World South Yes
Source: Bouët, 2006.
Similar to this study’s geographic decomposition, product decomposition
represents specific characteristics of various products. It emphasizes the existence of key
sectors where distortions are high and numerous; which means that the impact of liberali-
zation is likely to be greater in such sectors. Distortions are particularly high in the
agricultural sector, where tariffs above 15% are commonplace for wheat, sugar, meat,
rice, and milk. (In the case of sugar, rice and milk, the model treats processed goods
separately, as only small quantities of paddy rice, raw milk, sugar cane, and sugar beet
are traded internationally). Vegetables and fruits are also treated separately by MIRAGE
and are characterized in detail as they constitute a key agricultural output for numerous
developing countries. Finally, product decomposition reflects that textile and clothing
sectors are still highly protected compared with other industrial goods produced in
developed countries.
24

Expected benefits from trade liberalization
In order to account for trade reforms that occurred between 2001 and 2005, a pre-
experiment is conducted: data on market access are changed in order to include the last
implementation of the Uruguay Round, the elimination of the Multi-Fibre Arrangement,
enlargement of the European Union, implementation of the “Everything But Arms”
initiative, the African Growth Opportunity Act, and finally, the accession of China to the
WTO. For a better understanding of the MIRAGE study, the results obtained here will be
explored by looking at liberalization impact at the world level, country level, impact on
income distribution, and decomposition by region (North and South), activity (agriculture
and industry), and instrument of intervention (tariffs, domestic support, and export
subsidies).
Impact of full liberalization at the world level
Compared with the baseline situation, full trade liberalization increases world
welfare (real income) by 0.33%, or just under USD 100 billion13 (Table 2). When focus-
ing on the rate of increase in real income, if the reference for comparison is the last group
of assessments based on recent data on market access and domestic support, this result is
close to those obtained by Hertel and Keeney (2005), and Francois, Von Meijl and
Tongeren (2005). But it is smaller than the figure obtained by Anderson, Martin and Van
der Mensbrugghe (2005). The differences are much larger in comparison with Cline’s
results (2003) or with the Global Economic Prospects’ assessment (2002 and 2004).
Table 2. Impact of full trade liberalization: world indicators for 2015 (Rate of change in %)
World agr icu ltural trade 33.67
World Merchan dise Trade 5.25World Welfare 0.33
Source: Bouët, 2006.
13 This version of MIRAGE does not include exogenous change in factor productivity. Thus, when looking at the
assessment results, it is better to adopt reasoning in relative terms.
25

This welfare increase is associated with a world trade growth of 5.25%. As trade
barriers are numerous in the agricultural sector, world agricultural trade increases by 6.5
times more. With regard to world prices, their increase is uneven: while they are only
minor in industry and services, they are large in agriculture, especially for wheat, plant-
based fibers, and other agricultural products. These increases in agricultural world prices
are quite similar to those obtained by other studies.14
Impact of full liberalization at the country level
The impact of the trade reform on the country level is progressive: the increase in
welfare is proportionally higher for developing countries, and especially for LDCs (Table
3), although their share of the overall world welfare increase might be smaller. The rate
of change in welfare is two times greater for LDCs than for middle income countries and
more than two times greater than for rich countries. In this sense, full liberalization is
development friendly.
The welfare gains, however, are unequally distributed among developing
countries. There are several sources of welfare variations. First, distortions are reduced
and productive factors are re-allocated in sectors where they are more efficient.
Table 3. Distribution of welfare gains among beneficiary zones and the rate of change in welfare
Share of total welfare gain Increase in welfare Rich countries 73.8% +0.3% Middle income countries 24.1% +0.4% LDCs 2.2% +0.8%
Source: Bouët, 2006.
14 See, for example, Diao, Somwaru, and Roe, (2001).
26
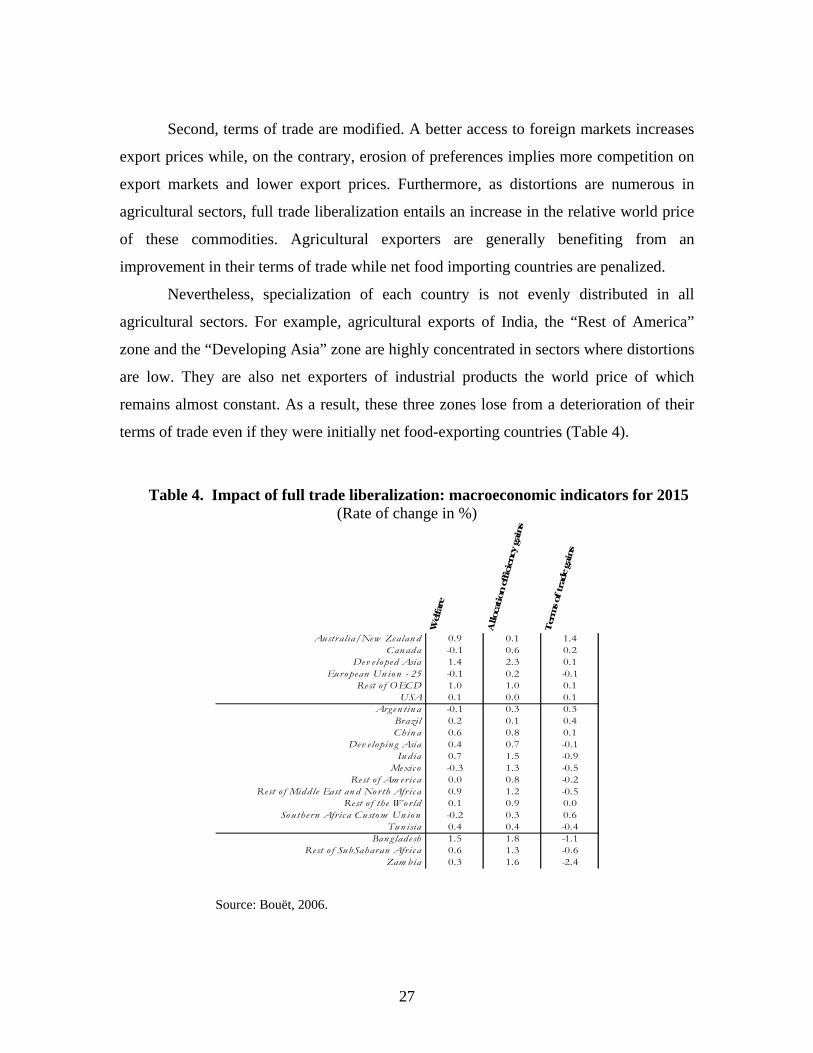
Second, terms of trade are modified. A better access to foreign markets increases
export prices while, on the contrary, erosion of preferences implies more competition on
export markets and lower export prices. Furthermore, as distortions are numerous in
agricultural sectors, full trade liberalization entails an increase in the relative world price
of these commodities. Agricultural exporters are generally benefiting from an
improvement in their terms of trade while net food importing countries are penalized.
Nevertheless, specialization of each country is not evenly distributed in all
agricultural sectors. For example, agricultural exports of India, the “Rest of America”
zone and the “Developing Asia” zone are highly concentrated in sectors where distortions
are low. They are also net exporters of industrial products the world price of which
remains almost constant. As a result, these three zones lose from a deterioration of their
terms of trade even if they were initially net food-exporting countries (Table 4).
Table 4. Impact of full trade liberalization: macroeconomic indicators for 2015 (Rate of change in %)
Wel
fare
Alloc
atio
n e
ffic
iency
gai
ns
Ter
ms of
tra
de g
ains
Australia/New Zealan d 0.9 0.1 1.4Canada -0.1 0.6 0.2
Dev eloped Asia 1.4 2.3 0.1European Un ion - 25 -0.1 0.2 -0.1
Rest o f OECD 1.0 1.0 0.1USA 0.1 0.0 0.1
Argen tin a -0.1 0.3 0.3Brazil 0.2 0.1 0.4Chin a 0.6 0.8 0.1
Dev elopin g Asia 0.4 0.7 -0.1In dia 0.7 1.5 -0.9
Mexico -0.3 1.3 -0.5Rest o f Am erica 0.0 0.8 -0.2
Rest o f Middle East an d North Africa 0.9 1.2 -0.5Rest o f the World 0.1 0.9 0.0
Southern Africa Custom Un ion -0.2 0.3 0.6Tun isia 0.4 0.4 -0.4
Ban g ladesh 1.5 1.8 -1.1Rest o f SubSaharan Africa 0.6 1.3 -0.6
Zam bia 0.3 1.6 -2.4 Source: Bouët, 2006.
27

In rich countries, the impact of full liberalization is positive, except in the case of
Europe and Canada, where it is negative, even if this welfare loss is marginal. In
developing countries, efficiency gains are large where distortions are initially high: India,
Bangladesh, and Sub-Saharan Africa. As Brazil, Argentina, and SACU are large net food
exporters, the rise in agricultural world prices implies an improvement in their terms of
trade. The zone “Rest of Sub-Saharan Africa” is initially a net food exporter,
nevertheless, its terms of trade are worsened as its EU preferential access is eroded: its
export prices decrease. Furthermore, in the cases of Bangladesh and “Rest of MENA”,
preferences are eroded and prices of imported goods are raised: these two negative effects
are cumulative.
The adverse effect of agricultural specialization on welfare gains which comes
from economies of scale and product differentiation, explains global welfare losses of
Argentina, Canada and SACU.15 Allocating more productive factors in sectors under
perfect competition reduces the gain from multilateral liberalization in the case of
Australia-New Zealand, Brazil, and “Rest of America”. Conversely, full trade
liberalization expands the industrial sector and increases associated welfare gains in
Bangladesh, Tunisia, and Zambia.
What is the potential impact of trade liberalization on poverty? While this work is
primarily focused on the issue of poverty, it does not provide an estimation of the extent
to which full trade liberalization could alleviate poverty. Such an assessment would
require utilization of numerous household surveys in developing countries, which goes
beyond the technical feasibilities of this study. But this assessment points out that full
trade liberalization could have a very positive impact on poverty through an increase of
the unskilled labor remuneration in South America, SACU, Bangladesh, “Developing
Asia”, Tunisia and “Rest of Sub-Saharan Africa”. It has clearly a contrasting effect on
urban and rural poverty in China, India, Mexico, “Rest of Middle East” and North Africa,
15 In the sensitivity analysis it can be seen that if the same model is conducted under perfect competition in all sectors,
Argentina, for example, gets a large increase in welfare.
28

where it increases remuneration of urban households and decreases that of rural
households. Finally, it has an unambiguously negative effect in the case of Zambia.
As far as income distribution is concerned, the Gini coefficient is reduced slightly,
from 0.73993 to 0.73981.16 Globally, free trade means less inequality in the world (with
the above limitations) but the impact is minor: this trade reform does not change the fact
that 63% of the world’s population gets only 8% of the world income. Trade reform
implies a redistribution of the world agricultural production. The USA, Brazil, Australia,
New Zealand, “Developing Asia”, Argentina, and SACU increase their net trade balance
in these commodities while the trade deficit in agricultural and food products of
“Developed Asia”, the European Union, North Africa and Middle East, India and the
EFTA worsens.
Decomposing trade reform
Decomposing trade reform by (i) liberalizing region (North and South),
(ii) liberalized activities (agriculture and industry), and (iii) instruments (tariffs, domestic
support and export subsidies) allows for a better understanding of the underlying
mechanisms in trade liberalization. In doing so, conclusions that emerge from the
literature are confirmed. First, developing countries’ own trade reform matters a lot;
second, agriculture provides the greatest welfare gains; third, tariffs, by far, are the main
source of distortions.
When looking at the liberalizing region, in general trade reforms in both North
and South matter for developing countries, but while on average Northern trade reform
implies improvement of foreign market access and increased export prices, Southern
trade reform is beneficial as it entails a reallocation of productive factors to competitive
sectors. Nevertheless, Northern trade liberalization can generate welfare losses for
developing countries due to deterioration of terms of trade where some countries
experience erosion of their preferential access (e.g. Tunisia and Mexico), and others (net
food importing countries) are affected by increased world agricultural prices. 16 These Gini coefficients were obtained using the results on real income from the above modeling exercise calculating
real income per capita, with and without full trade liberalization, using population data from the World Development Indicators.
29

In terms of liberalized activity, in general, welfare of developing countries
increases with full agricultural-trade liberalization, whereas liberalized trade in industry
has much more contrasting effects. Decomposing trade reform by instrument of
intervention reveals that tariffs are by far the main sources of distortions. Complete
elimination of tariffs increases world welfare by 0.23%. Elimination of domestic support
and export subsidies has a small negative effect on world welfare.17 Eliminating tariffs
creates positive efficiency gains in countries where protection is initially high (India,
Bangladesh, “Rest of Sub-Saharan Africa”) or exhibits peaks (“Developed Asia", rest of
OECD).
In a nutshell, the results from the MIRAGE assessment conclude that full trade
liberalization is welfare–improving and development–friendly as welfare augmentations
are greater for developing countries and especially for Least Developed Countries.
Nevertheless, some topics require further consideration: (i) full liberalization can have
adverse effects on individual countries because of terms-of-trade losses; (ii) agricultural
specialization entails a smaller expansion of industrial activity, which means less
economies of scale and fewer varieties.
This study might have led to a slight underestimation of expected benefits. At
least three reasons justify this statement. First, it is founded on a database on market
access that fully includes regional agreements and preferential schemes. This assumes a
full utilization of preferential access, which in reality may not always be the case. This
means that expected benefits for countries receiving preferences, which are mostly
developing countries, may be underestimated. Second, simulation is based on low trade
elasticities. This choice can be justified. Recent econometric work by Hertel, Ivanic,
Preckel, and Cranfield (2000), gives a scientific basis for using these behavioral
parameters. But this element must be kept in mind.
Third, the estimation here is based on 17 sectors in 20 geographic zones. This is a
quite representative choice compared with the previous literature and is also justified by
theoretical features. The model used here accounts for imperfect competition, horizontal
17 This conclusion resonates with a similar issue raised by Panagarya (2005).
30

and vertical differentiation, imperfect mobility of unskilled labor between agricultural
and non–agricultural activities, and it is dynamic. Thus, increasing the number of
products and regions would have also increased the number of equations and the
calculation time. Finally, this disaggregation inevitably underestimates the distortions
created by protection as tariffs are unevenly distributed across products and regions.
31


![[Arthur Schopenhauer] Studies in Pessimism(BookZZ.org)](https://img.pdfslide.net/doc/110x75/563dbbb7550346aa9aafa66f/arthur-schopenhauer-studies-in-pessimismbookzzorg.jpg)