Embed Size (px)
Citation preview

13AFGHANISTAN ALBANIA ALGERIA AMERICAN SAMOA ANDORRA ANGOLA ANTIGUA AND BARBUDA ARGENTINA ARMENIA ARUBA AUSTRALIA AUSTRIA AZERBAIJAN THE BAHAMAS BAHRAIN BANGLADESH BARBADOS BELARUS BELGIUM BELIZE BENIN BERMUDA BHUTAN BOLIVIA BOSNIA AND HERZEGOVINA BOTSWANA BRAZIL BRUNEI DARUSSALAM BULGARIA BURKINA FASO BURUNDI CAMBODIA CAMEROON CANADA CAPE VERDE CAYMAN ISLANDS CENTRAL AFRICAN REPUBLIC CHAD CHANNEL ISLANDS CHILE CHINA COLOMBIA COMOROS DEMOCRATIC REPUBLIC OF CONGO REPUBLIC OF CONGO COSTA RICA CÔTE D’IVOIRE CROATIA CUBA CURACAO CYPRUS CZECH REPUBLIC DENMARK DJIBOUTI DOMINICA DOMINICAN REPUBLIC ECUADOR ARAB REPUBLIC OF EGYPT EL SALVADOR EQUATORIAL GUINEA ERITREA ESTONIA ETHIOPIA FAEROE ISLANDS FIJI FINLAND FRANCE FRENCH POLYNESIA GABON THE GAMBIA GEORGIA GERMANY GHANA GREECE GREENLAND GRENADA GUAM GUATEMALA GUINEA GUINEA-BISSAU GUYANA HAITI HONDURAS HONG KONG SAR, CHINA HUNGARY ICELAND INDIA INDONESIA ISLAMIC REPUBLIC OF IRAN IRAQ IRELAND ISLE OF MAN ISRAEL ITALY JAMAICA JAPAN JORDAN KAZAKHSTAN KENYA KIRIBATI DEMOCRATIC PEOPLE’S REPUBLIC OF KOREA REPUBLIC OF KOREA KOSOVO KUWAIT KYRGYZ REPUBLIC LAO PEOPLE’S DEMOCRATIC REPUBLIC LATVIA LEBANON LESOTHO LIBERIA LIBYA LIECHTENSTEIN LITHUANIA LUXEMBOURG MACAO SAR, CHINA FORMER YUGOSLAV REPUBLIC OF MACEDONIA MADAGASCAR MALAWI MALAYSIA MALDIVES MALI MALTA MARSHALL ISLANDS MAURITANIA MAURITIUS MEXICO FEDERATED STATES OF MICRONESIA MOLDOVA MONACO MONGOLIA MONTENEGRO MOROCCO MOZAMBIQUE MYANMAR NAMIBIA NEPAL NETHERLANDS NEW CALEDONIA NEW ZEALAND NICARAGUA NIGER NIGERIA NORTHERN MARIANA ISLANDS NORWAY OMAN PAKISTAN PALAU PANAMA PAPUA NEW GUINEA PARAGUAY PERU PHILIPPINES POLAND PORTUGAL PUERTO RICO QATAR ROMANIA RUSSIAN FEDERATION RWANDA SAMOA SAN MARINO SÃO TOMÉ AND PRÍNCIPE SAUDI ARABIA SENEGAL SERBIA SEYCHELLES SIERRA LEONE SINGAPORE SINT MAARTEN SLOVAK REPUBLIC SLOVENIA SOLOMON ISLANDS SOMALIA SOUTH AFRICA SOUTH SUDAN SPAIN SRI LANKA ST. KITTS AND NEVIS ST. LUCIA ST. MARTIN ST. VINCENT AND GRENADINES SUDAN SURINAME SWAZILAND SWEDEN SWITZERLAND SYRIAN ARAB REPUBLIC TAJIKISTAN TANZANIA THAILAND TIMOR-LESTE TOGO TONGA TRINIDAD AND TOBAGO TUNISIA TURKEY TURKMENISTAN TURKS AND CAICOS ISLANDS TUVALU UGANDA UKRAINE UNITED ARAB EMIRATES UNITED KINGDOM UNITED STATES URUGUAY UZBEKISTAN VANUATU REPÚBLICA BOLIVARIANA DE VENEZUELA VIETNAM U.S. VIRGIN ISLANDS WEST BANK AND GAZA REPUBLIC OF YEMEN ZAMBIA ZIMBABWE
From World Development Indicators
The Little Green Data Book
The Little Green Data Book
1818 H Street N.W.
Washington, D.C. 20433 USA
Telephone: 202 473 1000
Fax: 202 477 6391
Web site: data.worldbank.org
Email: [email protected]
Agriculture
Forests and biodiversity
Oceans
Energy and emissions
Water and sanitation
Environment and health
National accounting aggregates
SKU 19814
ISBN 978-0-8213-9814-2
13

2013 THE LITTLE GREENDATA BOOK

© 2013 International Bank for Reconstruction and Development / The World Bank1818 H Street NW, Washington DC 20433Telephone: 202-473-1000; Internet: www.worldbank.org
Some rights reserved1 2 3 4 16 15 14 13
This work is a product of the staff of The World Bank with external contributions. Note that The World Bank does not necessarily own each component of the content included in the work. The World Bank therefore does not warrant that the use of the content contained in the work will not infringe on the rights of third parties. The risk of claims resulting from such infringement rests solely with you.
The findings, interpretations, and conclusions expressed in this work do not necessarily reflect the views of The World Bank, its Board of Executive Directors, or the govern-ments they represent. The World Bank does not guarantee the accuracy of the data included in this work. The boundaries, colors, denominations, and other information shown on any map in this work do not imply any judgment on the part of The World Bank concerning the legal status of any territory or the endorsement or acceptance of such boundaries.
Nothing herein shall constitute or be considered to be a limitation upon or waiver of the privileges and immunities of The World Bank, all of which are specifically reserved.
Rights and Permissions
This work is available under the Creative Commons Attribution 3.0 Unported license (CC BY 3.0) http://creativecommons.org/licenses/by/3.0. Under the Creative Commons Attribution license, you are free to copy, distribute, transmit, and adapt this work, including for commercial purposes, under the following conditions:
Attribution—Please cite the work as follows: World Bank. 2013. The Little Green Data Book 2013. Washington, DC: World Bank. doi: 10.1596/978-0-8213-9814-2. License: Creative Commons Attribution CC BY 3.0
Translations—If you create a translation of this work, please add the following dis-claimer along with the attribution: This translation was not created by The World Bank and should not be considered an official World Bank translation. The World Bank shall not be liable for any content or error in this translation.
All queries on rights and licenses should be addressed to the Office of the Publisher, The World Bank, 1818 H Street NW, Washington, DC 20433, USA; fax: 202-522-2625; e-mail: [email protected].
ISBN (paper): 978-0-8213-9814-2ISBN (electronic): 978-0-8213-9815-9DOI: 10.1596/978-0-8213-9814-2
The Little Green Data Book 2013 is a product of the Development Data Group of the Development Economics Vice Presidency and the Environment Department of the World Bank.
Design by Communications Development Incorporated, Washington, DC.

iiiThe Little Green Data Book 2013
Acknowledgments . . . . . . . . . . . . . . . . . . . . . . . . . . . . . . . . . . . . . . . . . iv
Foreword . . . . . . . . . . . . . . . . . . . . . . . . . . . . . . . . . . . . . . . . . . . . . . . . .v
Data notes . . . . . . . . . . . . . . . . . . . . . . . . . . . . . . . . . . . . . . . . . . . . . .vii
Regional tables . . . . . . . . . . . . . . . . . . . . . . . . . . . . . . . . . . . . . . . . . . . 1
World . . . . . . . . . . . . . . . . . . . . . . . . . . . . . . . . . . . . . . . . . . . . . . . 2
East Asia and Pacific . . . . . . . . . . . . . . . . . . . . . . . . . . . . . . . . . . . . 3
Europe and Central Asia . . . . . . . . . . . . . . . . . . . . . . . . . . . . . . . . . . 4
Latin America and the Caribbean . . . . . . . . . . . . . . . . . . . . . . . . . . . 5
Middle East and North Africa . . . . . . . . . . . . . . . . . . . . . . . . . . . . . . 6
South Asia . . . . . . . . . . . . . . . . . . . . . . . . . . . . . . . . . . . . . . . . . . . 7
Sub-Saharan Africa . . . . . . . . . . . . . . . . . . . . . . . . . . . . . . . . . . . . . 8
Income group tables . . . . . . . . . . . . . . . . . . . . . . . . . . . . . . . . . . . . . . . 9
Low income . . . . . . . . . . . . . . . . . . . . . . . . . . . . . . . . . . . . . . . . . . 10
Middle income . . . . . . . . . . . . . . . . . . . . . . . . . . . . . . . . . . . . . . . . 11
Lower middle income . . . . . . . . . . . . . . . . . . . . . . . . . . . . . . . . . . . 12
Upper middle income . . . . . . . . . . . . . . . . . . . . . . . . . . . . . . . . . . . 13
Low and middle income . . . . . . . . . . . . . . . . . . . . . . . . . . . . . . . . . 14
High income . . . . . . . . . . . . . . . . . . . . . . . . . . . . . . . . . . . . . . . . . 15
Euro area . . . . . . . . . . . . . . . . . . . . . . . . . . . . . . . . . . . . . . . . . . . 16
Country tables (in alphabetical order) . . . . . . . . . . . . . . . . . . . . . . . . . . 17
Notes . . . . . . . . . . . . . . . . . . . . . . . . . . . . . . . . . . . . . . . . . . . . . . . . 232
Glossary . . . . . . . . . . . . . . . . . . . . . . . . . . . . . . . . . . . . . . . . . . . . . . 233
References . . . . . . . . . . . . . . . . . . . . . . . . . . . . . . . . . . . . . . . . . . . . 239
Contents

iv 2013 The Little Green Data Book
The Little Green Data Book 2013 is based on World Development Indicators
2013 and its online database . Defining, gathering, and disseminating international statistics is a collective effort of many people and organizations . The indicators presented in World Development Indicators are the fruit of decades of work at many levels, from the field workers who administer censuses and household surveys to the committees and working parties of the national and international statistical agencies that develop the nomenclature, classifications, and standards fundamental to the international statistical system . Nongovernmental organizations have also made important contributions . We are indebted to the World Development Indicators partners, as detailed in World Development Indicators 2013.
The Little Green Data Book 2013 is the result of close collaboration between the staff of the Development Data Group of the Development Economics Vice Presidency and the Agriculture and Environmental Services Department of the Sustainable Development Vice Presidency . Liu Cui, Mahyar Eshragh-Tabary, Sonu Jain, Glenn-Marie Lange, Esther Naikal, Urvashi Narain, William Prince, and Jomo Tariku contributed to its preparation . Azita Amjadi and Alison Kwong coordinated the production of the book . Barton Matheson Willse & Worthington typeset the book . The work was carried out under the direction of Shaida Badiee and Juergen Voegele . Staff from The World Bank’s Office of the Publisher oversaw publication and dissemination of the book .
Acknowledgments

vThe Little Green Data Book 2013
ForewordWelcome to the Little Green Data Book 2013. For 13 years, we have been taking the pulse of development and environment using more than 50 indicators for more than 200 countries . Today, we believe that one of the indicators—Adjusted Net Savings—is critical to the post-2015 development dialogue .
When leaders from around the world gathered in Rio de Janeiro in June 2012 for the United Nations Conference on Environment and Development (Rio +20), one of the main outcomes was to launch a process to develop Sustainable Development Goals (SDGs) . These goals could define the post-2015 agenda, building on the Millennium Development Goals . Issues currently being discussed for SDGs cover the three pillars of sustainability—economic, social, and environmental .
Yet, many countries do not have the information they need on the state of their environment and natural resources—whether in terms of GDP or from other conventional indicators . Increasingly, they need a new generation of metrics to monitor sustainable development at the macroeconomic level .
One of the key indicators in the Little Green Data Book, Adjusted Net Savings (ANS), allows countries to do just that . Also known as genuine savings, ANS shows whether a country is on the path to sustainable development (see
box on regional Adjusted Net Saving Rate on page vi) . It monitors whether depletion of natural capital, such as minerals or forests, is compensated for by investment in other assets, such as human capital or infrastructure . A positive ANS indicates that a country is adding to its overall wealth and that economic growth is on a sustainable path . In resource-rich countries in particular, macroeconomic indicators such as ANS can be a useful complement to GDP, providing a more comprehensive lens on the long-term sustainability of economic growth .
The World Bank has linked this approach to our core mission—ending poverty and boosting shared prosperity . It also allows us to monitor our commitment to intergenerational equity so that we are not using our resources today in a way that compromises the quality of life and aspirations of our children tomorrow .
The Development Committee, a Joint Ministerial Committee of the Boards of Governors of the World Bank and the International Monetary Fund, at its April 2013 meeting discussed a new paper that defines the direction of the World Bank Group . “We have committed, working closely with our development partners, to moving beyond a reliance on GDP and promoting wealth and natural capital accounting and making progress in the development of measures of genuine savings . . .” says the Development Committee paper, A Common Vision for the World Bank Group.
As we move toward 2015 and the deadline for the implementation of the UN’s Millennium Development Goals approaches, we hope policy makers will find indicators like the ANS useful for development and implementation of their post-2015 development agendas .

vi 2013 The Little Green Data Book
Foreword
The Little Green Data Book is a result of close collaboration between the World Bank’s Development Data Group within the Development Economics Vice Presidency and the Agriculture and Environmental Services Department of the Sustainable Development Vice Presidency . We welcome suggestions on how to improve future editions and make them even more useful .
Juergen Voegle Shaida BadieeDirector DirectorAgriculture and Environmental Services Development Data Group
Box 1. Adjusted net savings paths diverge
1980
35
30
25
20
15
10
5
0
–5
–0
1990
East Asia & Paci cLatin America & Caribbean
South AsiaEurope & Central Asia
Sub-Saharan Africa
perc
ent o
f GNI
2000 2010
Adjusted Net Saving Rate (share of GNI, %)
Source: World Bank, World Development Indicators 2013.
Savings lay the basis for building wealth and future growth . Adjusted net savings (ANS) measures the real difference between production and consump-tion, taking into account investments in human capital, depreciation of fixed capital, depletion of natural resources, and damages caused by pollution . The East Asia and Pacific region has maintained the highest savings rate among developing regions since 1980, driven largely by China . South Asia has displayed consistently strong savings rates, fluctuating between 10 and 20 percent since 1985, with India dominating the aggregate figure . Over the past decades, Latin America’s rates have remained fairly constant, while Eastern Europe and Central Asia are more variable . In Sub-Saharan Africa, ANS has not only declined in recent years but dipped below zero, suggesting unsustainable development and declining wealth .

viiThe Little Green Data Book 2013
The data in this book are for the most recent year available as noted in the glossary .
• Growth rates are calculated as annual averages and represented as percentages .
• Regional aggregates include data for low- and middle-income economies only .
• Figures in italics indicate data for years or periods other than those specified in the glossary.
Symbols used:
.. indicates that data are not available or that aggregates cannot
be calculated because of missing data .
0 or 0 .0 indicates zero or small enough that the number would round
to zero at the displayed number of decimal places .
$ indicates current U .S . dollars .
Lettered notes on country tables can be found in the notes page . Data are shown for economies with populations greater than 30,000 or for smaller economies if they are members of the World Bank . The term country (used interchangeably with economy) does not imply political independence or official recognition by the World Bank but refers to any economy for which the authorities report separate social or economic statistics .
The selection of indicators in these pages includes some of those being used to monitor progress toward the Millennium Development Goals . For more information about the eight goals—halving poverty and increasing well-being by 2015—please see the other books in the World Development Indicators 2013 family of products at data .worldbank .org/products/data-books .
Data notes


1The Little Green Data Book 2013
Regional tablesThe country composition of regions is based on the World Bank’s analytical
regions and may differ from common geographic usage .
East Asia and Pacific
American Samoa, Cambodia, China, Fiji, Indonesia, Kiribati, Democratic
People’s Republic of Korea, Lao People’s Democratic Republic, Malaysia,
Marshall Islands, Federated States of Micronesia, Mongolia, Myanmar,
Palau, Papua New Guinea, the Philippines, Samoa, Solomon Islands,
Thailand, Timor-Leste, Tonga, Tuvalu, Vanuatu, Vietnam .
Europe and Central Asia
Albania, Armenia, Azerbaijan, Belarus, Bosnia and Herzegovina, Bulgaria,
Georgia, Kazakhstan, Kosovo, Kyrgyz Republic, Latvia, Lithuania, Former
Yugoslav Republic of Macedonia, Moldova, Montenegro, Romania,
Russian Federation, Serbia, Tajikistan, Turkey, Turkmenistan, Ukraine,
Uzbekistan .
Latin America and the Caribbean
Antigua and Barbuda, Argentina, Belize, Bolivia, Brazil, Chile, Colombia,
Costa Rica, Cuba, Dominica, Dominican Republic, Ecuador, El Salvador,
Grenada, Guatemala, Guyana, Haiti, Honduras, Jamaica, Mexico,
Nicaragua, Panama, Paraguay, Peru, St . Lucia, St . Vincent and the
Grenadines, Suriname, Uruguay, República Bolivariana de Venezuela .
Middle East and North Africa
Algeria, Djibouti, Arab Republic of Egypt, Islamic Republic of Iran, Iraq,
Jordan, Lebanon, Libya, Morocco, Syrian Arab Republic, Tunisia, West
Bank and Gaza, Republic of Yemen .
South Asia
Afghanistan, Bangladesh, Bhutan, India, Maldives, Nepal, Pakistan, Sri
Lanka .
Sub-Saharan Africa
Angola, Benin, Botswana, Burkina Faso, Burundi, Cameroon, Cape Verde,
Central African Republic, Chad, Comoros, the Democratic Republic
of Congo, Republic of Congo, Côte d’Ivoire, Eritrea, Ethiopia, Gabon,
The Gambia, Ghana, Guinea, Guinea-Bissau, Kenya, Lesotho, Liberia,
Madagascar, Malawi, Mali, Mauritania, Mauritius, Mozambique, Namibia,
Niger, Nigeria, Rwanda, São Tomé and Príncipe, Senegal, Seychelles,
Sierra Leone, Somalia, South Africa, South Sudan, Sudan, Swaziland,
Tanzania, Togo, Uganda, Zambia, Zimbabwe .

GNI per capita, World Bank Atlas method ($)Adjusted net national income per capita ($)Urban population (% of total)Urban population growth (avg. annual %, 1990–2011) AgricultureAgricultural land (% land area)Agricultural irrigated land (% of total agricultural land)Agricultural productivity, value added per worker (2000 $)Cereal yield (kg per hectare) Forests and biodiversityForest area (% land area)Deforestation (avg. annual %, 2000–2010)Terrestrial protected areas (% of total land area)Threatened species, mammalsThreatened species, birdsThreatened species, fishThreatened species, higher plants OceansTotal fisheries production (thousand metric tons)
Capture fisheries growth (avg. annual %, 1990–2011)Aquaculture growth (avg. annual %, 1990–2011)
Marine protected areas (% of territorial waters)Coral reef area (sq. km)Mangroves area (sq. km) Energy and emissionsEnergy use per capita (kg oil equivalent)Energy from biomass products and waste (% of total)Electric power consumption per capita (kWh)Electricity generated using fossil fuel (% of total)Electricity generated by hydropower (% of total)CO2 emissions per capita (metric tons) Water and sanitationInternal freshwater resources per capita (cu. m)Total freshwater withdrawal (% of internal resources)
Agriculture (% of total freshwater withdrawal)Access to improved water source (% of total population)
Rural (% of rural population)Urban (% of urban population)
Access to improved sanitation (% of total population)Rural (% of rural population)Urban (% of urban population)
Environment and healthParticulate matter (urban-pop.-weighted avg., µg/cu. m)Acute resp. infection prevalence (% of children under five)Diarrhea prevalence (% of children under five)Under-five mortality rate (per 1,000 live births) National accounting aggregates—savings, depletion and degradationGross savings (% of GNI)Consumption of fixed capital (% of GNI)Education expenditure (% of GNI)Energy depletion (% of GNI)Mineral depletion (% of GNI)Net forest depletion (% of GNI)CO2 damage (% of GNI)Particulate emissions damage (% of GNI)Adjusted net savings (% of GNI)
9,5148,340
52.02.2
37..
7653,708
31.00.1
12.33,0863,7766,286
11,275
178,3230.57.9
10.0284,300150,398
1,8519.9
2,97567.015.9
4.7
6,1159.270888096634679
41....
51
23.113.14.22.80.60.00.40.3
10.0
2 2013 The Little Green Data Book
WorldPopulation (millions) 6,974.2 Land area (1,000 sq. km) 129,710 GDP ($ billions) 70,020.4

GNI per capita, World Bank Atlas method ($)Adjusted net national income per capita ($)Urban population (% of total)Urban population growth (avg. annual %, 1990–2011) AgricultureAgricultural land (% land area)Agricultural irrigated land (% of total agricultural land)Agricultural productivity, value added per worker (2000 $)Cereal yield (kg per hectare) Forests and biodiversityForest area (% land area)Deforestation (avg. annual %, 2000–2010)Terrestrial protected areas (% of total land area)Threatened species, mammalsThreatened species, birdsThreatened species, fishThreatened species, higher plants OceansTotal fisheries production (thousand metric tons)
Capture fisheries growth (avg. annual %, 1990–2011)Aquaculture growth (avg. annual %, 1990–2011)
Marine protected areas (% of territorial waters)Coral reef area (sq. km)Mangroves area (sq. km) Energy and emissionsEnergy use per capita (kg oil equivalent)Energy from biomass products and waste (% of total)Electric power consumption per capita (kWh)Electricity generated using fossil fuel (% of total)Electricity generated by hydropower (% of total)CO2 emissions per capita (metric tons) Water and sanitationInternal freshwater resources per capita (cu. m)Total freshwater withdrawal (% of internal resources)
Agriculture (% of total freshwater withdrawal)Access to improved water source (% of total population)
Rural (% of rural population)Urban (% of urban population)
Access to improved sanitation (% of total population)Rural (% of rural population)Urban (% of urban population)
Environment and healthParticulate matter (urban-pop.-weighted avg., µg/cu. m)Acute resp. infection prevalence (% of children under five)Diarrhea prevalence (% of children under five)Under-five mortality rate (per 1,000 live births) National accounting aggregates—savings, depletion and degradationGross savings (% of GNI)Consumption of fixed capital (% of GNI)Education expenditure (% of GNI)Energy depletion (% of GNI)Mineral depletion (% of GNI)Net forest depletion (% of GNI)CO2 damage (% of GNI)Particulate emissions damage (% of GNI)Adjusted net savings (% of GNI)
4,2483,884
48.63.6
48..
6105,050
29.7-0.415.0
101,2993.49.11.4
137,69056,537
1,52010.9
2,33779.816.5
4.6
4,44610.9
73908497665876
55....
21
49.311.0
2.14.31.70.00.91.1
32.2
3The Little Green Data Book 2013
Population (millions) 1,974.2 Land area (1,000 sq. km) 15,853 GDP ($ billions) 9,313.0
East Asia & Pacific

GNI per capita, World Bank Atlas method ($)Adjusted net national income per capita ($)Urban population (% of total)Urban population growth (avg. annual %, 1990–2011) AgricultureAgricultural land (% land area)Agricultural irrigated land (% of total agricultural land)Agricultural productivity, value added per worker (2000 $)Cereal yield (kg per hectare) Forests and biodiversityForest area (% land area)Deforestation (avg. annual %, 2000–2010)Terrestrial protected areas (% of total land area)Threatened species, mammalsThreatened species, birdsThreatened species, fishThreatened species, higher plants OceansTotal fisheries production (thousand metric tons)
Capture fisheries growth (avg. annual %, 1990–2011)Aquaculture growth (avg. annual %, 1990–2011)
Marine protected areas (% of territorial waters)Coral reef area (sq. km)Mangroves area (sq. km) Energy and emissionsEnergy use per capita (kg oil equivalent)Energy from biomass products and waste (% of total)Electric power consumption per capita (kWh)Electricity generated using fossil fuel (% of total)Electricity generated by hydropower (% of total)CO2 emissions per capita (metric tons) Water and sanitationInternal freshwater resources per capita (cu. m)Total freshwater withdrawal (% of internal resources)
Agriculture (% of total freshwater withdrawal)Access to improved water source (% of total population)
Rural (% of rural population)Urban (% of urban population)
Access to improved sanitation (% of total population)Rural (% of rural population)Urban (% of urban population)
Environment and healthParticulate matter (urban-pop.-weighted avg., µg/cu. m)Acute resp. infection prevalence (% of children under five)Diarrhea prevalence (% of children under five)Under-five mortality rate (per 1,000 live births) National accounting aggregates—savings, depletion and degradationGross savings (% of GNI)Consumption of fixed capital (% of GNI)Education expenditure (% of GNI)Energy depletion (% of GNI)Mineral depletion (% of GNI)Net forest depletion (% of GNI)CO2 damage (% of GNI)Particulate emissions damage (% of GNI)Adjusted net savings (% of GNI)
7,7346,652
64.70.3
28..
3,3742,740
38.70.07.5
5,790-2.9-0.510.4
..
..
3,0152.0
4,05965.418.8
7.1
12,4986.360969199848187
21....
21
26.112.3
3.69.30.80.00.70.36.2
4 2013 The Little Green Data Book
Population (millions) 408.1 Land area (1,000 sq. km) 22,748 GDP ($ billions) 3,634.9
Europe & Central Asia

GNI per capita, World Bank Atlas method ($)Adjusted net national income per capita ($)Urban population (% of total)Urban population growth (avg. annual %, 1990–2011) AgricultureAgricultural land (% land area)Agricultural irrigated land (% of total agricultural land)Agricultural productivity, value added per worker (2000 $)Cereal yield (kg per hectare) Forests and biodiversityForest area (% land area)Deforestation (avg. annual %, 2000–2010)Terrestrial protected areas (% of total land area)Threatened species, mammalsThreatened species, birdsThreatened species, fishThreatened species, higher plants OceansTotal fisheries production (thousand metric tons)
Capture fisheries growth (avg. annual %, 1990–2011)Aquaculture growth (avg. annual %, 1990–2011)
Marine protected areas (% of territorial waters)Coral reef area (sq. km)Mangroves area (sq. km) Energy and emissionsEnergy use per capita (kg oil equivalent)Energy from biomass products and waste (% of total)Electric power consumption per capita (kWh)Electricity generated using fossil fuel (% of total)Electricity generated by hydropower (% of total)CO2 emissions per capita (metric tons) Water and sanitationInternal freshwater resources per capita (cu. m)Total freshwater withdrawal (% of internal resources)
Agriculture (% of total freshwater withdrawal)Access to improved water source (% of total population)
Rural (% of rural population)Urban (% of urban population)
Access to improved sanitation (% of total population)Rural (% of rural population)Urban (% of urban population)
Environment and healthParticulate matter (urban-pop.-weighted avg., µg/cu. m)Acute resp. infection prevalence (% of children under five)Diarrhea prevalence (% of children under five)Under-five mortality rate (per 1,000 live births) National accounting aggregates—savings, depletion and degradationGross savings (% of GNI)Consumption of fixed capital (% of GNI)Education expenditure (% of GNI)Energy depletion (% of GNI)Mineral depletion (% of GNI)Net forest depletion (% of GNI)CO2 damage (% of GNI)Particulate emissions damage (% of GNI)Adjusted net savings (% of GNI)
8,5747,648
79.12.0
37..
3,4483,838
46.80.4
20.2
19,0090.1
11.813.1
15,10039,997
1,31216.7
1,97339.053.7
2.7
22,8102.068948198795984
28....
19
21.112.2
5.04.51.90.00.20.36.8
5The Little Green Data Book 2013
Population (millions) 589.0 Land area (1,000 sq. km) 20,116 GDP ($ billions) 5,645.5
Latin America & Caribbean

GNI per capita, World Bank Atlas method ($)Adjusted net national income per capita ($)Urban population (% of total)Urban population growth (avg. annual %, 1990–2011) AgricultureAgricultural land (% land area)Agricultural irrigated land (% of total agricultural land)Agricultural productivity, value added per worker (2000 $)Cereal yield (kg per hectare) Forests and biodiversityForest area (% land area)Deforestation (avg. annual %, 2000–2010)Terrestrial protected areas (% of total land area)Threatened species, mammalsThreatened species, birdsThreatened species, fishThreatened species, higher plants OceansTotal fisheries production (thousand metric tons)
Capture fisheries growth (avg. annual %, 1990–2011)Aquaculture growth (avg. annual %, 1990–2011)
Marine protected areas (% of territorial waters)Coral reef area (sq. km)Mangroves area (sq. km) Energy and emissionsEnergy use per capita (kg oil equivalent)Energy from biomass products and waste (% of total)Electric power consumption per capita (kWh)Electricity generated using fossil fuel (% of total)Electricity generated by hydropower (% of total)CO2 emissions per capita (metric tons) Water and sanitationInternal freshwater resources per capita (cu. m)Total freshwater withdrawal (% of internal resources)
Agriculture (% of total freshwater withdrawal)Access to improved water source (% of total population)
Rural (% of rural population)Urban (% of urban population)
Access to improved sanitation (% of total population)Rural (% of rural population)Urban (% of urban population)
Environment and healthParticulate matter (urban-pop.-weighted avg., µg/cu. m)Acute resp. infection prevalence (% of children under five)Diarrhea prevalence (% of children under five)Under-five mortality rate (per 1,000 live births) National accounting aggregates—savings, depletion and degradationGross savings (% of GNI)Consumption of fixed capital (% of GNI)Education expenditure (% of GNI)Energy depletion (% of GNI)Mineral depletion (% of GNI)Net forest depletion (% of GNI)CO2 damage (% of GNI)Particulate emissions damage (% of GNI)Adjusted net savings (% of GNI)
3,8663,285
58.92.5
23..
2,6272,475
2.4–0.13.9
3,5382.4
13.12.0
5,700217
1,3720.9
1,65892.9
5.44.1
673122.1
86898194888094
59....
32
27.010.84.5
15.20.60.10.60.96.1
6 2013 The Little Green Data Book
Population (millions) 336.5 Land area (1,000 sq. km) 8,641 GDP ($ billions) 1,201.9
Middle East & North Africa

GNI per capita, World Bank Atlas method ($)Adjusted net national income per capita ($)Urban population (% of total)Urban population growth (avg. annual %, 1990–2011) AgricultureAgricultural land (% land area)Agricultural irrigated land (% of total agricultural land)Agricultural productivity, value added per worker (2000 $)Cereal yield (kg per hectare) Forests and biodiversityForest area (% land area)Deforestation (avg. annual %, 2000–2010)Terrestrial protected areas (% of total land area)Threatened species, mammalsThreatened species, birdsThreatened species, fishThreatened species, higher plants OceansTotal fisheries production (thousand metric tons)
Capture fisheries growth (avg. annual %, 1990–2011)Aquaculture growth (avg. annual %, 1990–2011)
Marine protected areas (% of territorial waters)Coral reef area (sq. km)Mangroves area (sq. km) Energy and emissionsEnergy use per capita (kg oil equivalent)Energy from biomass products and waste (% of total)Electric power consumption per capita (kWh)Electricity generated using fossil fuel (% of total)Electricity generated by hydropower (% of total)CO2 emissions per capita (metric tons) Water and sanitationInternal freshwater resources per capita (cu. m)Total freshwater withdrawal (% of internal resources)
Agriculture (% of total freshwater withdrawal)Access to improved water source (% of total population)
Rural (% of rural population)Urban (% of urban population)
Access to improved sanitation (% of total population)Rural (% of rural population)Urban (% of urban population)
Environment and healthParticulate matter (urban-pop.-weighted avg., µg/cu. m)Acute resp. infection prevalence (% of children under five)Diarrhea prevalence (% of children under five)Under-five mortality rate (per 1,000 live births) National accounting aggregates—savings, depletion and degradationGross savings (% of GNI)Consumption of fixed capital (% of GNI)Education expenditure (% of GNI)Energy depletion (% of GNI)Mineral depletion (% of GNI)Net forest depletion (% of GNI)CO2 damage (% of GNI)Particulate emissions damage (% of GNI)Adjusted net savings (% of GNI)
1,3131,20130.9
2.8
55..
5502,959
17.1–0.35.9
13,2192.38.11.7
15,44010,343
51926.755580.614.01.4
1,19751.6
91908896382860
62....
62
33.59.22.82.81.00.60.80.6
21.6
7The Little Green Data Book 2013
Population (millions) 1,656.5 Land area (1,000 sq. km) 4,771 GDP ($ billions) 2,296.0
South Asia

GNI per capita, World Bank Atlas method ($)Adjusted net national income per capita ($)Urban population (% of total)Urban population growth (avg. annual %, 1990–2011) AgricultureAgricultural land (% land area)Agricultural irrigated land (% of total agricultural land)Agricultural productivity, value added per worker (2000 $)Cereal yield (kg per hectare) Forests and biodiversityForest area (% land area)Deforestation (avg. annual %, 2000–2010)Terrestrial protected areas (% of total land area)Threatened species, mammalsThreatened species, birdsThreatened species, fishThreatened species, higher plants OceansTotal fisheries production (thousand metric tons)
Capture fisheries growth (avg. annual %, 1990–2011)Aquaculture growth (avg. annual %, 1990–2011)
Marine protected areas (% of territorial waters)Coral reef area (sq. km)Mangroves area (sq. km) Energy and emissionsEnergy use per capita (kg oil equivalent)Energy from biomass products and waste (% of total)Electric power consumption per capita (kWh)Electricity generated using fossil fuel (% of total)Electricity generated by hydropower (% of total)CO2 emissions per capita (metric tons) Water and sanitationInternal freshwater resources per capita (cu. m)Total freshwater withdrawal (% of internal resources)
Agriculture (% of total freshwater withdrawal)Access to improved water source (% of total population)
Rural (% of rural population)Urban (% of urban population)
Access to improved sanitation (% of total population)Rural (% of rural population)Urban (% of urban population)
Environment and healthParticulate matter (urban-pop.-weighted avg., µg/cu. m)Acute resp. infection prevalence (% of children under five)Diarrhea prevalence (% of children under five)Under-five mortality rate (per 1,000 live births) National accounting aggregates—savings, depletion and degradationGross savings (% of GNI)Consumption of fixed capital (% of GNI)Education expenditure (% of GNI)Energy depletion (% of GNI)Mineral depletion (% of GNI)Net forest depletion (% of GNI)CO2 damage (% of GNI)Particulate emissions damage (% of GNI)Adjusted net savings (% of GNI)
1,2581,02236.5
3.8
44..
3341,361
27.80.5
11.7
6,3831.8
16.05.8
17,98027,808
68358.2553
65.218.70.9
4,4553.284614883312342
41....
109
18.410.9
3.710.42.20.50.50.4
–1.2
8 2013 The Little Green Data Book
Population (millions) 874.8 Land area (1,000 sq. km) 23,589 GDP ($ billions) 1,266.0
Sub-Saharan Africa

9The Little Green Data Book 2013
For operational and analytical purposes the World Bank’s main criterion for classifying economies is gross national income (GNI) per capita . Each economy in The Little Data Book is classified as low income, middle income, or high income . Low- and middle-income economies are sometimes referred to as developing economies . The use of the term is convenient; it is not intended to imply that all economies in the group are experiencing similar development or that other economies have reached a preferred or final stage of development . Classification by income does not necessarily reflect development status . Note: Classifications are fixed during the World Bank’s fiscal year (ending on June 30), thus countries remain in the categories in which they are classified irrespective of any revisions to their per capita income data .
Low-income economies are those with a GNI per capita of $1,025 or less in 2011 .
Middle-income economies are those with a GNI per capita of more than $1,025 but less than $12,476 . Lower-middle-income and upper-middle-income economies are separated at a GNI per capita of $4,036 .
High-income economies are those with a GNI per capita of $12,476 or more .
Euro area includes the member states of the Economic and Monetary Union of the European Union that have adopted the euro as their currency: Austria, Belgium, Cyprus, Estonia, Finland, France, Germany, Greece, Ireland, Italy, Luxembourg, Malta, Netherlands, Portugal, Slovak Republic, Slovenia, and Spain .
Income group tables

GNI per capita, World Bank Atlas method ($)Adjusted net national income per capita ($)Urban population (% of total)Urban population growth (avg. annual %, 1990–2011) AgricultureAgricultural land (% land area)Agricultural irrigated land (% of total agricultural land)Agricultural productivity, value added per worker (2000 $)Cereal yield (kg per hectare) Forests and biodiversityForest area (% land area)Deforestation (avg. annual %, 2000–2010)Terrestrial protected areas (% of total land area)Threatened species, mammalsThreatened species, birdsThreatened species, fishThreatened species, higher plants OceansTotal fisheries production (thousand metric tons)
Capture fisheries growth (avg. annual %, 1990–2011)Aquaculture growth (avg. annual %, 1990–2011)
Marine protected areas (% of territorial waters)Coral reef area (sq. km)Mangroves area (sq. km) Energy and emissionsEnergy use per capita (kg oil equivalent)Energy from biomass products and waste (% of total)Electric power consumption per capita (kWh)Electricity generated using fossil fuel (% of total)Electricity generated by hydropower (% of total)CO2 emissions per capita (metric tons) Water and sanitationInternal freshwater resources per capita (cu. m)Total freshwater withdrawal (% of internal resources)
Agriculture (% of total freshwater withdrawal)Access to improved water source (% of total population)
Rural (% of rural population)Urban (% of urban population)
Access to improved sanitation (% of total population)Rural (% of rural population)Urban (% of urban population)
Environment and healthParticulate matter (urban-pop.-weighted avg., µg/cu. m)Acute resp. infection prevalence (% of children under five)Diarrhea prevalence (% of children under five)Under-five mortality rate (per 1,000 live births) National accounting aggregates—savings, depletion and degradationGross savings (% of GNI)Consumption of fixed capital (% of GNI)Education expenditure (% of GNI)Energy depletion (% of GNI)Mineral depletion (% of GNI)Net forest depletion (% of GNI)CO2 damage (% of GNI)Particulate emissions damage (% of GNI)Adjusted net savings (% of GNI)
571521
28.03.5
39..
3082,034
25.70.6
10.0
11,5634.04.9
..15,12025,818
36366.2242
32.045.3
0.3
5,1254.590655786373247
54....
95
25.27.73.01.42.01.20.30.5
15.2
10 2013 The Little Green Data Book
Population (millions) 816.8 Land area (1,000 sq. km) 16,079 GDP ($ billions) 475.8
Low income

GNI per capita, World Bank Atlas method ($)Adjusted net national income per capita ($)Urban population (% of total)Urban population growth (avg. annual %, 1990–2011) AgricultureAgricultural land (% land area)Agricultural irrigated land (% of total agricultural land)Agricultural productivity, value added per worker (2000 $)Cereal yield (kg per hectare) Forests and biodiversityForest area (% land area)Deforestation (avg. annual %, 2000–2010)Terrestrial protected areas (% of total land area)Threatened species, mammalsThreatened species, birdsThreatened species, fishThreatened species, higher plants OceansTotal fisheries production (thousand metric tons)
Capture fisheries growth (avg. annual %, 1990–2011)Aquaculture growth (avg. annual %, 1990–2011)
Marine protected areas (% of territorial waters)Coral reef area (sq. km)Mangroves area (sq. km) Energy and emissionsEnergy use per capita (kg oil equivalent)Energy from biomass products and waste (% of total)Electric power consumption per capita (kWh)Electricity generated using fossil fuel (% of total)Electricity generated by hydropower (% of total)CO2 emissions per capita (metric tons) Water and sanitationInternal freshwater resources per capita (cu. m)Total freshwater withdrawal (% of internal resources)
Agriculture (% of total freshwater withdrawal)Access to improved water source (% of total population)
Rural (% of rural population)Urban (% of urban population)
Access to improved sanitation (% of total population)Rural (% of rural population)Urban (% of urban population)
Environment and healthParticulate matter (urban-pop.-weighted avg., µg/cu. m)Acute resp. infection prevalence (% of children under five)Diarrhea prevalence (% of children under five)Under-five mortality rate (per 1,000 live births) National accounting aggregates—savings, depletion and degradationGross savings (% of GNI)Consumption of fixed capital (% of GNI)Education expenditure (% of GNI)Energy depletion (% of GNI)Mineral depletion (% of GNI)Net forest depletion (% of GNI)CO2 damage (% of GNI)Particulate emissions damage (% of GNI)Adjusted net savings (% of GNI)
4,1483,692
49.62.6
38..
8023,549
33.30.1
12.5
137,6751.29.37.2
176,790109,084
1,31012.7
1,82372.920.5
3.5
5,8199.578908496594575
46....
46
35.111.43.35.81.50.10.70.7
18.2
11The Little Green Data Book 2013
Population (millions) 5,022.4 Land area (1,000 sq. km) 79,639 GDP ($ billions) 23,040.8
Middle income

GNI per capita, World Bank Atlas method ($)Adjusted net national income per capita ($)Urban population (% of total)Urban population growth (avg. annual %, 1990–2011) AgricultureAgricultural land (% land area)Agricultural irrigated land (% of total agricultural land)Agricultural productivity, value added per worker (2000 $)Cereal yield (kg per hectare) Forests and biodiversityForest area (% land area)Deforestation (avg. annual %, 2000–2010)Terrestrial protected areas (% of total land area)Threatened species, mammalsThreatened species, birdsThreatened species, fishThreatened species, higher plants OceansTotal fisheries production (thousand metric tons)
Capture fisheries growth (avg. annual %, 1990–2011)Aquaculture growth (avg. annual %, 1990–2011)
Marine protected areas (% of territorial waters)Coral reef area (sq. km)Mangroves area (sq. km) Energy and emissionsEnergy use per capita (kg oil equivalent)Energy from biomass products and waste (% of total)Electric power consumption per capita (kWh)Electricity generated using fossil fuel (% of total)Electricity generated by hydropower (% of total)CO2 emissions per capita (metric tons) Water and sanitationInternal freshwater resources per capita (cu. m)Total freshwater withdrawal (% of internal resources)
Agriculture (% of total freshwater withdrawal)Access to improved water source (% of total population)
Rural (% of rural population)Urban (% of urban population)
Access to improved sanitation (% of total population)Rural (% of rural population)Urban (% of urban population)
Environment and healthParticulate matter (urban-pop.-weighted avg., µg/cu. m)Acute resp. infection prevalence (% of children under five)Diarrhea prevalence (% of children under five)Under-five mortality rate (per 1,000 live births) National accounting aggregates—savings, depletion and degradationGross savings (% of GNI)Consumption of fixed capital (% of GNI)Education expenditure (% of GNI)Energy depletion (% of GNI)Mineral depletion (% of GNI)Net forest depletion (% of GNI)CO2 damage (% of GNI)Particulate emissions damage (% of GNI)Adjusted net savings (% of GNI)
1,7721,595
38.72.7
46..
7163,065
28.40.39.9
40,2382.4
10.02.9
143,44060,301
66726.269873.017.41.6
3,12120.2
88878493473566
53....
62
29.79.93.16.31.20.30.70.6
14.7
12 2013 The Little Green Data Book
Population (millions) 2,532.7 Land area (1,000 sq. km) 20,067 GDP ($ billions) 4,792.8
Lower middle income

GNI per capita, World Bank Atlas method ($)Adjusted net national income per capita ($)Urban population (% of total)Urban population growth (avg. annual %, 1990–2011) AgricultureAgricultural land (% land area)Agricultural irrigated land (% of total agricultural land)Agricultural productivity, value added per worker (2000 $)Cereal yield (kg per hectare) Forests and biodiversityForest area (% land area)Deforestation (avg. annual %, 2000–2010)Terrestrial protected areas (% of total land area)Threatened species, mammalsThreatened species, birdsThreatened species, fishThreatened species, higher plants OceansTotal fisheries production (thousand metric tons)
Capture fisheries growth (avg. annual %, 1990–2011)Aquaculture growth (avg. annual %, 1990–2011)
Marine protected areas (% of territorial waters)Coral reef area (sq. km)Mangroves area (sq. km) Energy and emissionsEnergy use per capita (kg oil equivalent)Energy from biomass products and waste (% of total)Electric power consumption per capita (kWh)Electricity generated using fossil fuel (% of total)Electricity generated by hydropower (% of total)CO2 emissions per capita (metric tons) Water and sanitationInternal freshwater resources per capita (cu. m)Total freshwater withdrawal (% of internal resources)
Agriculture (% of total freshwater withdrawal)Access to improved water source (% of total population)
Rural (% of rural population)Urban (% of urban population)
Access to improved sanitation (% of total population)Rural (% of rural population)Urban (% of urban population)
Environment and healthParticulate matter (urban-pop.-weighted avg., µg/cu. m)Acute resp. infection prevalence (% of children under five)Diarrhea prevalence (% of children under five)Under-five mortality rate (per 1,000 live births) National accounting aggregates—savings, depletion and degradationGross savings (% of GNI)Consumption of fixed capital (% of GNI)Education expenditure (% of GNI)Energy depletion (% of GNI)Mineral depletion (% of GNI)Net forest depletion (% of GNI)CO2 damage (% of GNI)Particulate emissions damage (% of GNI)Adjusted net savings (% of GNI)
6,5635,821
60.62.5
35..
8693,944
34.80.0
13.3
97,4370.79.08.4
33,35048,783
1,9488.1
2,94272.921.35.5
8,5505.666938698736281
42....
20
36.411.83.35.71.60.00.70.7
19.2
13The Little Green Data Book 2013
Population (millions) 2,489.7 Land area (1,000 sq. km) 59,573 GDP ($ billions) 18,245.5
Upper middle income

GNI per capita, World Bank Atlas method ($)Adjusted net national income per capita ($)Urban population (% of total)Urban population growth (avg. annual %, 1990–2011) AgricultureAgricultural land (% land area)Agricultural irrigated land (% of total agricultural land)Agricultural productivity, value added per worker (2000 $)Cereal yield (kg per hectare) Forests and biodiversityForest area (% land area)Deforestation (avg. annual %, 2000–2010)Terrestrial protected areas (% of total land area)Threatened species, mammalsThreatened species, birdsThreatened species, fishThreatened species, higher plants OceansTotal fisheries production (thousand metric tons)
Capture fisheries growth (avg. annual %, 1990–2011)Aquaculture growth (avg. annual %, 1990–2011)
Marine protected areas (% of territorial waters)Coral reef area (sq. km)Mangroves area (sq. km) Energy and emissionsEnergy use per capita (kg oil equivalent)Energy from biomass products and waste (% of total)Electric power consumption per capita (kWh)Electricity generated using fossil fuel (% of total)Electricity generated by hydropower (% of total)CO2 emissions per capita (metric tons) Water and sanitationInternal freshwater resources per capita (cu. m)Total freshwater withdrawal (% of internal resources)
Agriculture (% of total freshwater withdrawal)Access to improved water source (% of total population)
Rural (% of rural population)Urban (% of urban population)
Access to improved sanitation (% of total population)Rural (% of rural population)Urban (% of urban population)
Environment and healthParticulate matter (urban-pop.-weighted avg., µg/cu. m)Acute resp. infection prevalence (% of children under five)Diarrhea prevalence (% of children under five)Under-five mortality rate (per 1,000 live births) National accounting aggregates—savings, depletion and degradationGross savings (% of GNI)Consumption of fixed capital (% of GNI)Education expenditure (% of GNI)Energy depletion (% of GNI)Mineral depletion (% of GNI)Net forest depletion (% of GNI)CO2 damage (% of GNI)Particulate emissions damage (% of GNI)Adjusted net savings (% of GNI)
3,6523,25146.6
2.7
38..
7313,291
32.00.2
12.0
149,2381.59.07.2
191,910134,902
1,21014.4
1,66172.020.9
3.1
5,7228.979867995564373
47....
56
34.911.33.35.71.50.10.70.7
18.2
14 2013 The Little Green Data Book
Population (millions) 5,839.2 Land area (1,000 sq. km) 95,718 GDP ($ billions) 23,543.3
Low and middle income

GNI per capita, World Bank Atlas method ($)Adjusted net national income per capita ($)Urban population (% of total)Urban population growth (avg. annual %, 1990–2011) AgricultureAgricultural land (% land area)Agricultural irrigated land (% of total agricultural land)Agricultural productivity, value added per worker (2000 $)Cereal yield (kg per hectare) Forests and biodiversityForest area (% land area)Deforestation (avg. annual %, 2000–2010)Terrestrial protected areas (% of total land area)Threatened species, mammalsThreatened species, birdsThreatened species, fishThreatened species, higher plants OceansTotal fisheries production (thousand metric tons)
Capture fisheries growth (avg. annual %, 1990–2011)Aquaculture growth (avg. annual %, 1990–2011)
Marine protected areas (% of territorial waters)Coral reef area (sq. km)Mangroves area (sq. km) Energy and emissionsEnergy use per capita (kg oil equivalent)Energy from biomass products and waste (% of total)Electric power consumption per capita (kWh)Electricity generated using fossil fuel (% of total)Electricity generated by hydropower (% of total)CO2 emissions per capita (metric tons) Water and sanitationInternal freshwater resources per capita (cu. m)Total freshwater withdrawal (% of internal resources)
Agriculture (% of total freshwater withdrawal)Access to improved water source (% of total population)
Rural (% of rural population)Urban (% of urban population)
Access to improved sanitation (% of total population)Rural (% of rural population)Urban (% of urban population)
Environment and healthParticulate matter (urban-pop.-weighted avg., µg/cu. m)Acute resp. infection prevalence (% of children under five)Diarrhea prevalence (% of children under five)Under-five mortality rate (per 1,000 live births) National accounting aggregates—savings, depletion and degradationGross savings (% of GNI)Consumption of fixed capital (% of GNI)Education expenditure (% of GNI)Energy depletion (% of GNI)Mineral depletion (% of GNI)Net forest depletion (% of GNI)CO2 damage (% of GNI)Particulate emissions damage (% of GNI)Adjusted net savings (% of GNI)
39,86034,611
80.51.1
37 . .
26,5155,349
28.40.0
12.9
28,774–1.71.8
16.581,97015,496
5,0004.4
9,41562.011.211.4
8,19510.3
41100
9810010099
100
22....6
17.913.9
4.61.40.20.00.20.16.6
15The Little Green Data Book 2013
Population (millions) 1,135.0 Land area (1,000 sq. km) 33,991 GDP ($ billions) 46,606.1
High income

GNI per capita, World Bank Atlas method ($)Adjusted net national income per capita ($)Urban population (% of total)Urban population growth (avg. annual %, 1990–2011) AgricultureAgricultural land (% land area)Agricultural irrigated land (% of total agricultural land)Agricultural productivity, value added per worker (2000 $)Cereal yield (kg per hectare) Forests and biodiversityForest area (% land area)Deforestation (avg. annual %, 2000–2010)Terrestrial protected areas (% of total land area)Threatened species, mammalsThreatened species, birdsThreatened species, fishThreatened species, higher plants OceansTotal fisheries production (thousand metric tons)
Capture fisheries growth (avg. annual %, 1990–2011)Aquaculture growth (avg. annual %, 1990–2011)
Marine protected areas (% of territorial waters)Coral reef area (sq. km)Mangroves area (sq. km) Energy and emissionsEnergy use per capita (kg oil equivalent)Energy from biomass products and waste (% of total)Electric power consumption per capita (kWh)Electricity generated using fossil fuel (% of total)Electricity generated by hydropower (% of total)CO2 emissions per capita (metric tons) Water and sanitationInternal freshwater resources per capita (cu. m)Total freshwater withdrawal (% of internal resources)
Agriculture (% of total freshwater withdrawal)Access to improved water source (% of total population)
Rural (% of rural population)Urban (% of urban population)
Access to improved sanitation (% of total population)Rural (% of rural population)Urban (% of urban population)
Environment and healthParticulate matter (urban-pop.-weighted avg., µg/cu. m)Acute resp. infection prevalence (% of children under five)Diarrhea prevalence (% of children under five)Under-five mortality rate (per 1,000 live births) National accounting aggregates—savings, depletion and degradationGross savings (% of GNI)Consumption of fixed capital (% of GNI)Education expenditure (% of GNI)Energy depletion (% of GNI)Mineral depletion (% of GNI)Net forest depletion (% of GNI)CO2 damage (% of GNI)Particulate emissions damage (% of GNI)Adjusted net savings (% of GNI)
38,66133,727
75.50.7
45..
25,4155,784
37.4–0.317.0
4,023–1.50.6
15.1....
3,6337.4
6,84746.811.1
7.4
2,93319.1
32100100100100100100
18....4
19.914.04.80.10.00.00.20.1
10.3
16 2013 The Little Green Data Book
Population (millions) 332.9 Land area (1,000 sq. km) 2,552 GDP ($ billions) 13,079.9
Euro area

17The Little Green Data Book 2013
China
Unless otherwise noted, data for China do not include data for Hong Kong
SAR, China; Macao SAR, China; or Taiwan, China .
Cyprus
GNI and GDP data and data calculated using GNI and GDP refer to the area
controlled by the government of the Republic of Cyprus .
France
Data for Mayotte, to which a reference appeared in previous editions, are
included in data for France .
Georgia
GNI, GDP and population data and data calculated using GNI, GDP and
population exclude Abkhazia and South Ossetia .
Kosovo, Montenegro, and Serbia
Data for each country are shown separately where available . However, some
indicators for Serbia prior to 2006 include data for Montenegro; these data
are noted in the tables . Moreover, data for most indicators for Serbia from
1999 onward exclude data for Kosovo, which in 1999 became a territory
under international administration pursuant to UN Security Council Resolution
1244 (1999) . Kosovo became a member of the World Bank on June 29,
2009, and its data are shown where available .
Moldova
GNI, GDP and population data and data calculated using GNI, GDP and
population exclude Transnistria .
Morocco
GNI and GDP data and data calculated using GNI and GDP include Former
Spanish Sahara .
South Sudan and Sudan
South Sudan declared its independence on July 9, 2011 . Data are shown
separately for South Sudan where available . However, data reported for
Sudan include South Sudan unless otherwise noted .
Tanzania
GNI and GDP data and data calculated using GNI and GDP refer to mainland
Tanzania only .
For more information, see World Development Indicators 2013 or data .
worldbank .org .
Country tables

GNI per capita, World Bank Atlas method ($)Adjusted net national income per capita ($)Urban population (% of total)Urban population growth (avg. annual %, 1990–2011) AgricultureAgricultural land (% land area)Agricultural irrigated land (% of total agricultural land)Agricultural productivity, value added per worker (2000 $)Cereal yield (kg per hectare) Forests and biodiversityForest area (% land area)Deforestation (avg. annual %, 2000–2010)Terrestrial protected areas (% of total land area)Threatened species, mammalsThreatened species, birdsThreatened species, fishThreatened species, higher plants OceansTotal fisheries production (thousand metric tons)
Capture fisheries growth (avg. annual %, 1990–2011)Aquaculture growth (avg. annual %, 1990–2011)
Marine protected areas (% of territorial waters)Coral reef area (sq. km)Mangroves area (sq. km) Energy and emissionsEnergy use per capita (kg oil equivalent)Energy from biomass products and waste (% of total)Electric power consumption per capita (kWh)Electricity generated using fossil fuel (% of total)Electricity generated by hydropower (% of total)CO2 emissions per capita (metric tons) Water and sanitationInternal freshwater resources per capita (cu. m)Total freshwater withdrawal (% of internal resources)
Agriculture (% of total freshwater withdrawal)Access to improved water source (% of total population)
Rural (% of rural population)Urban (% of urban population)
Access to improved sanitation (% of total population)Rural (% of rural population)Urban (% of urban population)
Environment and healthParticulate matter (urban-pop.-weighted avg., µg/cu. m)Acute resp. infection prevalence (% of children under five)Diarrhea prevalence (% of children under five)Under-five mortality rate (per 1,000 live births) National accounting aggregates—savings, depletion and degradationGross savings (% of GNI)Consumption of fixed capital (% of GNI)Education expenditure (% of GNI)Energy depletion (% of GNI)Mineral depletion (% of GNI)Net forest depletion (% of GNI)CO2 damage (% of GNI)Particulate emissions damage (% of GNI)Adjusted net savings (% of GNI)
470 1,313 571490 1,201 52123.5 30.9 28.0
4.2 2.8 3.5
58 55 395.4 .. ..
.. 550 3081,660 2,959 2,034
2.1 17.1 25.70.0 -0.3 0.60.4 5.9 10.0111452
1.0 13,219 11,563-0.5 2.3 4.0
.. 8.1 4.9
.. 1.7 ..
.. 15,440 15,120
.. 10,343 25,818
.. 519 363
.. 26.7 66.2
.. 555 242
.. 80.6 32.0
.. 14.0 45.30.2 1.4 0.3
1,335 1,197 5,12543.0 51.6 4.5
99 91 9050 90 6542 88 5778 96 8637 38 3730 28 3260 60 47
30 62 54.. .. .... .. ..
101 62 95
.. 33.5 25.27.8 9.2 7.7
.. 2.8 3.00.0 2.8 1.40.0 1.0 2.02.1 0.6 1.20.2 0.8 0.30.5 0.6 0.5
.. 21.6 15.2
18 2013 The Little Green Data Book
Country data
South Asia
group
Low-income group
Population (millions) 35.3 Land area (1,000 sq. km) 652 GDP ($ billions) 19.2
Afghanistan
GNI per capita, World Bank Atlas method ($)Adjusted net national income per capita ($)Urban population (% of total)Urban population growth (avg. annual %, 1990–2011) AgricultureAgricultural land (% land area)Agricultural irrigated land (% of total agricultural land)Agricultural productivity, value added per worker (2000 $)Cereal yield (kg per hectare) Forests and biodiversityForest area (% land area)Deforestation (avg. annual %, 2000–2010)Terrestrial protected areas (% of total land area)Threatened species, mammalsThreatened species, birdsThreatened species, fishThreatened species, higher plants OceansTotal fisheries production (thousand metric tons)
Capture fisheries growth (avg. annual %, 1990–2011)Aquaculture growth (avg. annual %, 1990–2011)
Marine protected areas (% of territorial waters)Coral reef area (sq. km)Mangroves area (sq. km) Energy and emissionsEnergy use per capita (kg oil equivalent)Energy from biomass products and waste (% of total)Electric power consumption per capita (kWh)Electricity generated using fossil fuel (% of total)Electricity generated by hydropower (% of total)CO2 emissions per capita (metric tons) Water and sanitationInternal freshwater resources per capita (cu. m)Total freshwater withdrawal (% of internal resources)
Agriculture (% of total freshwater withdrawal)Access to improved water source (% of total population)
Rural (% of rural population)Urban (% of urban population)
Access to improved sanitation (% of total population)Rural (% of rural population)Urban (% of urban population)
Environment and healthParticulate matter (urban-pop.-weighted avg., µg/cu. m)Acute resp. infection prevalence (% of children under five)Diarrhea prevalence (% of children under five)Under-five mortality rate (per 1,000 live births) National accounting aggregates—savings, depletion and degradationGross savings (% of GNI)Consumption of fixed capital (% of GNI)Education expenditure (% of GNI)Energy depletion (% of GNI)Mineral depletion (% of GNI)Net forest depletion (% of GNI)CO2 damage (% of GNI)Particulate emissions damage (% of GNI)Adjusted net savings (% of GNI)
3,980 7,734 1,7723,431 6,652 1,59553.4 64.7 38.7
1.7 0.3 2.7
44 28 4617.0 .. ..
2,144 3,374 7164,459 2,740 3,065
28.3 38.7 28.4-0.1 0.0 0.39.8 7.5 9.9
36
390
7.3 5,790 40,238-3.0 -2.9 2.4-4.2 -0.5 10.01.6 10.4 2.9
.. .. 143,440
.. .. 60,301
648 3,015 6679.9 2.0 26.2
1,770 4,059 6980.0 65.4 73.0
100.0 18.8 17.40.9 7.1 1.6
8,364 12,498 3,1216.8 6.3 20.258 60 8895 96 8794 91 8496 99 9394 84 4793 81 3595 87 66
38 21 53.. .. .... .. ..
14 21 62
12.8 26.1 29.710.7 12.3 9.92.8 3.6 3.13.4 9.3 6.30.3 0.8 1.20.0 0.0 0.30.3 0.7 0.70.3 0.3 0.60.7 6.2 14.7
19The Little Green Data Book 2013
Country data
Europe & Central
Asia group
Lower middle-income group
Population (millions) 3.2 Land area (1,000 sq. km) 27 GDP ($ billions) 13.0
Albania

GNI per capita, World Bank Atlas method ($)Adjusted net national income per capita ($)Urban population (% of total)Urban population growth (avg. annual %, 1990–2011) AgricultureAgricultural land (% land area)Agricultural irrigated land (% of total agricultural land)Agricultural productivity, value added per worker (2000 $)Cereal yield (kg per hectare) Forests and biodiversityForest area (% land area)Deforestation (avg. annual %, 2000–2010)Terrestrial protected areas (% of total land area)Threatened species, mammalsThreatened species, birdsThreatened species, fishThreatened species, higher plants OceansTotal fisheries production (thousand metric tons)
Capture fisheries growth (avg. annual %, 1990–2011)Aquaculture growth (avg. annual %, 1990–2011)
Marine protected areas (% of territorial waters)Coral reef area (sq. km)Mangroves area (sq. km) Energy and emissionsEnergy use per capita (kg oil equivalent)Energy from biomass products and waste (% of total)Electric power consumption per capita (kWh)Electricity generated using fossil fuel (% of total)Electricity generated by hydropower (% of total)CO2 emissions per capita (metric tons) Water and sanitationInternal freshwater resources per capita (cu. m)Total freshwater withdrawal (% of internal resources)
Agriculture (% of total freshwater withdrawal)Access to improved water source (% of total population)
Rural (% of rural population)Urban (% of urban population)
Access to improved sanitation (% of total population)Rural (% of rural population)Urban (% of urban population)
Environment and healthParticulate matter (urban-pop.-weighted avg., µg/cu. m)Acute resp. infection prevalence (% of children under five)Diarrhea prevalence (% of children under five)Under-five mortality rate (per 1,000 live births) National accounting aggregates—savings, depletion and degradationGross savings (% of GNI)Consumption of fixed capital (% of GNI)Education expenditure (% of GNI)Energy depletion (% of GNI)Mineral depletion (% of GNI)Net forest depletion (% of GNI)CO2 damage (% of GNI)Particulate emissions damage (% of GNI)Adjusted net savings (% of GNI)
4,470 3,866 6,5633,531 3,285 5,821
72.9 58.9 60.63.3 2.5 2.5
17 23 352.1 .. ..
2,254 2,627 8691,515 2,475 3,944
0.6 2.4 34.80.6 -0.1 0.06.3 3.9 13.314113613
104 3,538 97,4370.6 2.4 0.78.5 13.1 9.0
0.29 2.0 8.4.. 5,700 33,350.. 217 48,783
1,138 1,372 1,9480.2 0.9 8.1
1,026 1,658 2,94299.6 92.9 72.9
0.4 5.4 21.33.5 4.1 5.5
313 673 8,55054.8 122.1 5.6
64 86 6683 89 9379 81 8685 94 9895 88 7388 80 6298 94 81
69 59 42.. .. .... .. ..
30 32 20
50.4 27.0 36.411.5 10.8 11.84.5 4.5 3.3
18.2 15.2 5.70.2 0.6 1.60.1 0.1 0.00.5 0.6 0.70.3 0.9 0.7
25.3 6.1 19.2
20 2013 The Little Green Data Book
Country data
Middle East &
N. Africa group
Upper middle-income group
Population (millions) 36.0 Land area (1,000 sq. km) 2,382 GDP ($ billions) 188.7
Algeria

GNI per capita, World Bank Atlas method ($)Adjusted net national income per capita ($)Urban population (% of total)Urban population growth (avg. annual %, 1990–2011) AgricultureAgricultural land (% land area)Agricultural irrigated land (% of total agricultural land)Agricultural productivity, value added per worker (2000 $)Cereal yield (kg per hectare) Forests and biodiversityForest area (% land area)Deforestation (avg. annual %, 2000–2010)Terrestrial protected areas (% of total land area)Threatened species, mammalsThreatened species, birdsThreatened species, fishThreatened species, higher plants OceansTotal fisheries production (thousand metric tons)
Capture fisheries growth (avg. annual %, 1990–2011)Aquaculture growth (avg. annual %, 1990–2011)
Marine protected areas (% of territorial waters)Coral reef area (sq. km)Mangroves area (sq. km) Energy and emissionsEnergy use per capita (kg oil equivalent)Energy from biomass products and waste (% of total)Electric power consumption per capita (kWh)Electricity generated using fossil fuel (% of total)Electricity generated by hydropower (% of total)CO2 emissions per capita (metric tons) Water and sanitationInternal freshwater resources per capita (cu. m)Total freshwater withdrawal (% of internal resources)
Agriculture (% of total freshwater withdrawal)Access to improved water source (% of total population)
Rural (% of rural population)Urban (% of urban population)
Access to improved sanitation (% of total population)Rural (% of rural population)Urban (% of urban population)
Environment and healthParticulate matter (urban-pop.-weighted avg., µg/cu. m)Acute resp. infection prevalence (% of children under five)Diarrhea prevalence (% of children under five)Under-five mortality rate (per 1,000 live births) National accounting aggregates—savings, depletion and degradationGross savings (% of GNI)Consumption of fixed capital (% of GNI)Education expenditure (% of GNI)Energy depletion (% of GNI)Mineral depletion (% of GNI)Net forest depletion (% of GNI)CO2 damage (% of GNI)Particulate emissions damage (% of GNI)Adjusted net savings (% of GNI)
.. 4,248 6,563
.. 3,884 5,82193.2 48.6 60.6
2.5 3.6 2.5
25 48 35.. .. .... 610 869.. 5,050 3,944
88.4 29.7 34.80.2 –0.4 0.00.3 15.0 13.3
1891
4.8 101,299 97,43725.3 3.4 0.7
.. 9.1 9.017.0 1.4 8.4220 137,690 33,3500.52 56,537 48,783
.. 1,520 1,948
.. 10.9 8.1
.. 2,337 2,942
.. 79.8 72.9
.. 16.5 21.3
.. 4.6 5.5
.. 4,446 8,550
.. 10.9 5.6
.. 73 66
.. 90 93
.. 84 86
.. 97 98
.. 66 73
.. 58 62
.. 76 81
.. 55 42
.. .. ..
.. .. ..
.. 21 20
.. 49.3 36.4
.. 11.0 11.8
.. 2.1 3.3
.. 4.3 5.7
.. 1.7 1.6
.. 0.0 0.0
.. 0.9 0.7
.. 1.1 0.7
.. 32.2 19.2
21The Little Green Data Book 2013
Country data
East Asia & Pacific
group
Upper middle-income group
Population (thousands) 70 Land area (sq. km) 200 GDP ($ millions) ..
American Samoa
GNI per capita, World Bank Atlas method ($)Adjusted net national income per capita ($)Urban population (% of total)Urban population growth (avg. annual %, 1990–2011) AgricultureAgricultural land (% land area)Agricultural irrigated land (% of total agricultural land)Agricultural productivity, value added per worker (2000 $)Cereal yield (kg per hectare) Forests and biodiversityForest area (% land area)Deforestation (avg. annual %, 2000–2010)Terrestrial protected areas (% of total land area)Threatened species, mammalsThreatened species, birdsThreatened species, fishThreatened species, higher plants OceansTotal fisheries production (thousand metric tons)
Capture fisheries growth (avg. annual %, 1990–2011)Aquaculture growth (avg. annual %, 1990–2011)
Marine protected areas (% of territorial waters)Coral reef area (sq. km)Mangroves area (sq. km) Energy and emissionsEnergy use per capita (kg oil equivalent)Energy from biomass products and waste (% of total)Electric power consumption per capita (kWh)Electricity generated using fossil fuel (% of total)Electricity generated by hydropower (% of total)CO2 emissions per capita (metric tons) Water and sanitationInternal freshwater resources per capita (cu. m)Total freshwater withdrawal (% of internal resources)
Agriculture (% of total freshwater withdrawal)Access to improved water source (% of total population)
Rural (% of rural population)Urban (% of urban population)
Access to improved sanitation (% of total population)Rural (% of rural population)Urban (% of urban population)
Environment and healthParticulate matter (urban-pop.-weighted avg., µg/cu. m)Acute resp. infection prevalence (% of children under five)Diarrhea prevalence (% of children under five)Under-five mortality rate (per 1,000 live births) National accounting aggregates—savings, depletion and degradationGross savings (% of GNI)Consumption of fixed capital (% of GNI)Education expenditure (% of GNI)Energy depletion (% of GNI)Mineral depletion (% of GNI)Net forest depletion (% of GNI)CO2 damage (% of GNI)Particulate emissions damage (% of GNI)Adjusted net savings (% of GNI)
41,750 39,860.. 34,611
87.3 80.51.9 1.1
43 37.. .... 26,515.. 5,349
34.0 28.40.0 0.06.1 12.9
2100
.. 28,774
.. –1.7
.. 1.8
.. 16.5
.. 81,970
.. 15,496
.. 5,000
.. 4.4
.. 9,415
.. 62.0
.. 11.26.2 11.4
3,663 8,195.. 10.3.. 41
100 100100 98100 100100 100100 99100 100
18 22.. .... ..3 6
.. 17.913.2 13.9
2.9 4.60.0 1.40.0 0.2
.. 0.00.1 0.2
.. 0.1
.. 6.6
22 2013 The Little Green Data Book
Country data
High-income group
Population (thousands) 86 Land area (sq. km) 470 GDP ($ billions) 3.7
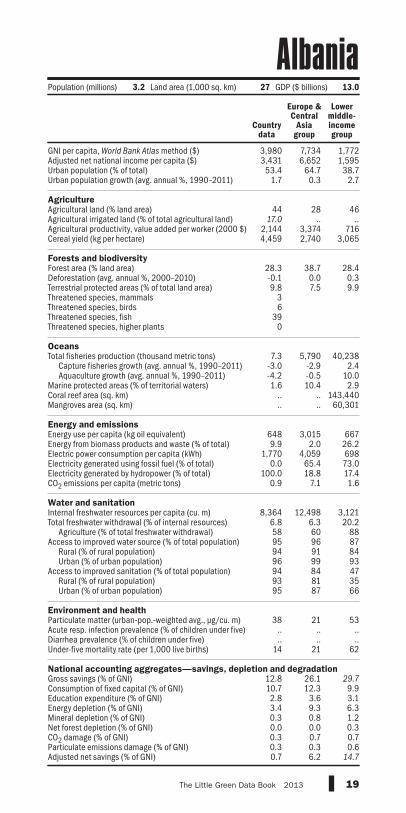
Andorra

GNI per capita, World Bank Atlas method ($)Adjusted net national income per capita ($)Urban population (% of total)Urban population growth (avg. annual %, 1990–2011) AgricultureAgricultural land (% land area)Agricultural irrigated land (% of total agricultural land)Agricultural productivity, value added per worker (2000 $)Cereal yield (kg per hectare) Forests and biodiversityForest area (% land area)Deforestation (avg. annual %, 2000–2010)Terrestrial protected areas (% of total land area)Threatened species, mammalsThreatened species, birdsThreatened species, fishThreatened species, higher plants OceansTotal fisheries production (thousand metric tons)
Capture fisheries growth (avg. annual %, 1990–2011)Aquaculture growth (avg. annual %, 1990–2011)
Marine protected areas (% of territorial waters)Coral reef area (sq. km)Mangroves area (sq. km) Energy and emissionsEnergy use per capita (kg oil equivalent)Energy from biomass products and waste (% of total)Electric power consumption per capita (kWh)Electricity generated using fossil fuel (% of total)Electricity generated by hydropower (% of total)CO2 emissions per capita (metric tons) Water and sanitationInternal freshwater resources per capita (cu. m)Total freshwater withdrawal (% of internal resources)
Agriculture (% of total freshwater withdrawal)Access to improved water source (% of total population)
Rural (% of rural population)Urban (% of urban population)
Access to improved sanitation (% of total population)Rural (% of rural population)Urban (% of urban population)
Environment and healthParticulate matter (urban-pop.-weighted avg., µg/cu. m)Acute resp. infection prevalence (% of children under five)Diarrhea prevalence (% of children under five)Under-five mortality rate (per 1,000 live births) National accounting aggregates—savings, depletion and degradationGross savings (% of GNI)Consumption of fixed capital (% of GNI)Education expenditure (% of GNI)Energy depletion (% of GNI)Mineral depletion (% of GNI)Net forest depletion (% of GNI)CO2 damage (% of GNI)Particulate emissions damage (% of GNI)Adjusted net savings (% of GNI)
3,830 1,258 6,5632,471 1,022 5,82159.1 36.5 60.65.3 3.8 2.5
47 44 35.. .. ..
162 334 869694 1,361 3,944
46.8 27.8 34.80.2 0.5 0.0
12.4 11.7 13.315253933
263 6,383 97,4373.3 1.8 0.7
.. 16.0 9.00.07 5.8 8.4
.. 17,980 33,350312 27,808 48,783
716 683 1,94856.2 58.2 8.1248 553 2,94232.7 65.2 72.967.3 18.7 21.31.4 0.9 5.5
7,544 4,455 8,5500.4 3.2 5.633 84 6651 61 9338 48 8660 83 9858 31 7319 23 6285 42 81
58 41 42.. .. .... .. ..
158 109 20
22.8 18.4 36.412.5 10.9 11.8
3.5 3.7 3.335.0 10.4 5.7
0.0 2.2 1.60.0 0.5 0.00.2 0.5 0.71.8 0.4 0.7
–23.2 –1.2 19.2
23The Little Green Data Book 2013
Country data
Sub-Saharan Africa group
Upper middle-income group
Population (millions) 19.6 Land area (1,000 sq. km) 1,247 GDP ($ billions) 104.3
Angola

GNI per capita, World Bank Atlas method ($)Adjusted net national income per capita ($)Urban population (% of total)Urban population growth (avg. annual %, 1990–2011) AgricultureAgricultural land (% land area)Agricultural irrigated land (% of total agricultural land)Agricultural productivity, value added per worker (2000 $)Cereal yield (kg per hectare) Forests and biodiversityForest area (% land area)Deforestation (avg. annual %, 2000–2010)Terrestrial protected areas (% of total land area)Threatened species, mammalsThreatened species, birdsThreatened species, fishThreatened species, higher plants OceansTotal fisheries production (thousand metric tons)
Capture fisheries growth (avg. annual %, 1990–2011)Aquaculture growth (avg. annual %, 1990–2011)
Marine protected areas (% of territorial waters)Coral reef area (sq. km)Mangroves area (sq. km) Energy and emissionsEnergy use per capita (kg oil equivalent)Energy from biomass products and waste (% of total)Electric power consumption per capita (kWh)Electricity generated using fossil fuel (% of total)Electricity generated by hydropower (% of total)CO2 emissions per capita (metric tons) Water and sanitationInternal freshwater resources per capita (cu. m)Total freshwater withdrawal (% of internal resources)
Agriculture (% of total freshwater withdrawal)Access to improved water source (% of total population)
Rural (% of rural population)Urban (% of urban population)
Access to improved sanitation (% of total population)Rural (% of rural population)Urban (% of urban population)
Environment and healthParticulate matter (urban-pop.-weighted avg., µg/cu. m)Acute resp. infection prevalence (% of children under five)Diarrhea prevalence (% of children under five)Under-five mortality rate (per 1,000 live births) National accounting aggregates—savings, depletion and degradationGross savings (% of GNI)Consumption of fixed capital (% of GNI)Education expenditure (% of GNI)Energy depletion (% of GNI)Mineral depletion (% of GNI)Net forest depletion (% of GNI)CO2 damage (% of GNI)Particulate emissions damage (% of GNI)Adjusted net savings (% of GNI)
11,940 8,574 6,563.. 7,648 5,821
29.9 79.1 60.60.9 2.0 2.5
20 37 35.. .. ..
2,850 3,448 8692,000 3,838 3,944
22.3 46.8 34.80.2 0.4 0.07.0 20.2 13.3
21
184
2.3 19,009 97,4374.7 0.1 0.7
.. 11.8 9.00.70 13.1 8.4240 15,100 33,3508.4 39,997 48,783
1,699 1,312 1,948.. 16.7 8.1.. 1,973 2,942.. 39.0 72.9.. 53.7 21.3
5.3 2.7 5.5
580 22,810 8,5509.6 2.0 5.620 68 66
.. 94 93
.. 81 8695 98 98
.. 79 73
.. 59 6298 84 81
13 28 42.. .. .... .. ..8 19 20
28.0 21.1 36.412.6 12.2 11.82.2 5.0 3.30.0 4.5 5.70.0 1.9 1.6
.. 0.0 0.00.3 0.2 0.7
.. 0.3 0.7
.. 6.8 19.2
24 2013 The Little Green Data Book
Country data
Latin America & Caribbean
group
Upper middle-income group
Population (thousands) 90 Land area (sq. km) 440 GDP ($ billions) 1.1
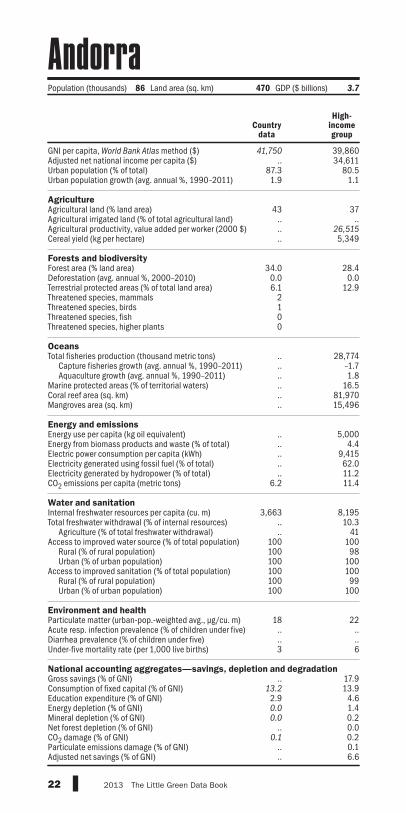
Antigua and Barbuda

GNI per capita, World Bank Atlas method ($)Adjusted net national income per capita ($)Urban population (% of total)Urban population growth (avg. annual %, 1990–2011) AgricultureAgricultural land (% land area)Agricultural irrigated land (% of total agricultural land)Agricultural productivity, value added per worker (2000 $)Cereal yield (kg per hectare) Forests and biodiversityForest area (% land area)Deforestation (avg. annual %, 2000–2010)Terrestrial protected areas (% of total land area)Threatened species, mammalsThreatened species, birdsThreatened species, fishThreatened species, higher plants OceansTotal fisheries production (thousand metric tons)
Capture fisheries growth (avg. annual %, 1990–2011)Aquaculture growth (avg. annual %, 1990–2011)
Marine protected areas (% of territorial waters)Coral reef area (sq. km)Mangroves area (sq. km) Energy and emissionsEnergy use per capita (kg oil equivalent)Energy from biomass products and waste (% of total)Electric power consumption per capita (kWh)Electricity generated using fossil fuel (% of total)Electricity generated by hydropower (% of total)CO2 emissions per capita (metric tons) Water and sanitationInternal freshwater resources per capita (cu. m)Total freshwater withdrawal (% of internal resources)
Agriculture (% of total freshwater withdrawal)Access to improved water source (% of total population)
Rural (% of rural population)Urban (% of urban population)
Access to improved sanitation (% of total population)Rural (% of rural population)Urban (% of urban population)
Environment and healthParticulate matter (urban-pop.-weighted avg., µg/cu. m)Acute resp. infection prevalence (% of children under five)Diarrhea prevalence (% of children under five)Under-five mortality rate (per 1,000 live births) National accounting aggregates—savings, depletion and degradationGross savings (% of GNI)Consumption of fixed capital (% of GNI)Education expenditure (% of GNI)Energy depletion (% of GNI)Mineral depletion (% of GNI)Net forest depletion (% of GNI)CO2 damage (% of GNI)Particulate emissions damage (% of GNI)Adjusted net savings (% of GNI)
9,740 8,574 6,5638,836 7,648 5,821
92.5 79.1 60.61.4 2.0 2.5
54 37 35.. .. ..
10,959 3,448 8694,672 3,838 3,944
10.7 46.8 34.80.8 0.4 0.05.5 20.2 13.338503736
796 19,009 97,4371.7 0.1 0.7
11.9 11.8 9.01.1 13.1 8.4
.. 15,100 33,350
.. 39,997 48,783
1,847 1,312 1,9483.3 16.7 8.1
2,904 1,973 2,94265.7 39.0 72.926.8 53.7 21.3
4.4 2.7 5.5
6,771 22,810 8,55011.8 2.0 5.6
66 68 6697 94 9380 81 8698 98 9890 79 7377 59 6291 84 81
57 28 42.. .. .... .. ..
14 19 20
22.9 21.1 36.412.4 12.2 11.86.0 5.0 3.34.3 4.5 5.70.5 1.9 1.60.0 0.0 0.00.4 0.2 0.71.5 0.3 0.79.8 6.8 19.2
25The Little Green Data Book 2013
Country data
Latin America & Caribbean
group
Upper middle-income group
Population (millions) 40.8 Land area (1,000 sq. km) 2,737 GDP ($ billions) 446.0
Argentina

GNI per capita, World Bank Atlas method ($)Adjusted net national income per capita ($)Urban population (% of total)Urban population growth (avg. annual %, 1990–2011) AgricultureAgricultural land (% land area)Agricultural irrigated land (% of total agricultural land)Agricultural productivity, value added per worker (2000 $)Cereal yield (kg per hectare) Forests and biodiversityForest area (% land area)Deforestation (avg. annual %, 2000–2010)Terrestrial protected areas (% of total land area)Threatened species, mammalsThreatened species, birdsThreatened species, fishThreatened species, higher plants OceansTotal fisheries production (thousand metric tons)
Capture fisheries growth (avg. annual %, 1990–2011)Aquaculture growth (avg. annual %, 1990–2011)
Marine protected areas (% of territorial waters)Coral reef area (sq. km)Mangroves area (sq. km) Energy and emissionsEnergy use per capita (kg oil equivalent)Energy from biomass products and waste (% of total)Electric power consumption per capita (kWh)Electricity generated using fossil fuel (% of total)Electricity generated by hydropower (% of total)CO2 emissions per capita (metric tons) Water and sanitationInternal freshwater resources per capita (cu. m)Total freshwater withdrawal (% of internal resources)
Agriculture (% of total freshwater withdrawal)Access to improved water source (% of total population)
Rural (% of rural population)Urban (% of urban population)
Access to improved sanitation (% of total population)Rural (% of rural population)Urban (% of urban population)
Environment and healthParticulate matter (urban-pop.-weighted avg., µg/cu. m)Acute resp. infection prevalence (% of children under five)Diarrhea prevalence (% of children under five)Under-five mortality rate (per 1,000 live births) National accounting aggregates—savings, depletion and degradationGross savings (% of GNI)Consumption of fixed capital (% of GNI)Education expenditure (% of GNI)Energy depletion (% of GNI)Mineral depletion (% of GNI)Net forest depletion (% of GNI)CO2 damage (% of GNI)Particulate emissions damage (% of GNI)Adjusted net savings (% of GNI)
3,360 7,734 1,7723,083 6,652 1,595
64.1 64.7 38.7–0.9 0.3 2.7
60 28 468.9 .. ..
5,093 3,374 7162,742 2,740 3,065
9.1 38.7 28.41.5 0.0 0.38.0 7.5 9.9
913
31
7.1 5,790 40,238–5.7 –2.9 2.41.1 –0.5 10.0
.. 10.4 2.9
.. .. 143,440
.. .. 60,301
791 3,015 6670.0 2.0 26.2
1,606 4,059 69822.2 65.4 73.039.4 18.8 17.4
1.5 7.1 1.6
2,212 12,498 3,12141.2 6.3 20.2
66 60 8898 96 8797 91 8499 99 9390 84 4780 81 3595 87 66
45 21 538 .. ..
17 .. ..18 21 62
18.3 26.1 29.79.8 12.3 9.92.2 3.6 3.10.0 9.3 6.31.7 0.8 1.20.0 0.0 0.30.3 0.7 0.71.4 0.3 0.67.3 6.2 14.7
26 2013 The Little Green Data Book
Country data
Europe & Central
Asia group
Lower middle-income group
Population (millions) 3.1 Land area (1,000 sq. km) 28 GDP ($ billions) 10.2
Armenia
GNI per capita, World Bank Atlas method ($)Adjusted net national income per capita ($)Urban population (% of total)Urban population growth (avg. annual %, 1990–2011) AgricultureAgricultural land (% land area)Agricultural irrigated land (% of total agricultural land)Agricultural productivity, value added per worker (2000 $)Cereal yield (kg per hectare) Forests and biodiversityForest area (% land area)Deforestation (avg. annual %, 2000–2010)Terrestrial protected areas (% of total land area)Threatened species, mammalsThreatened species, birdsThreatened species, fishThreatened species, higher plants OceansTotal fisheries production (thousand metric tons)
Capture fisheries growth (avg. annual %, 1990–2011)Aquaculture growth (avg. annual %, 1990–2011)
Marine protected areas (% of territorial waters)Coral reef area (sq. km)Mangroves area (sq. km) Energy and emissionsEnergy use per capita (kg oil equivalent)Energy from biomass products and waste (% of total)Electric power consumption per capita (kWh)Electricity generated using fossil fuel (% of total)Electricity generated by hydropower (% of total)CO2 emissions per capita (metric tons) Water and sanitationInternal freshwater resources per capita (cu. m)Total freshwater withdrawal (% of internal resources)
Agriculture (% of total freshwater withdrawal)Access to improved water source (% of total population)
Rural (% of rural population)Urban (% of urban population)
Access to improved sanitation (% of total population)Rural (% of rural population)Urban (% of urban population)
Environment and healthParticulate matter (urban-pop.-weighted avg., µg/cu. m)Acute resp. infection prevalence (% of children under five)Diarrhea prevalence (% of children under five)Under-five mortality rate (per 1,000 live births) National accounting aggregates—savings, depletion and degradationGross savings (% of GNI)Consumption of fixed capital (% of GNI)Education expenditure (% of GNI)Energy depletion (% of GNI)Mineral depletion (% of GNI)Net forest depletion (% of GNI)CO2 damage (% of GNI)Particulate emissions damage (% of GNI)Adjusted net savings (% of GNI)
.. 39,860
.. 34,61146.9 80.5
2.3 1.1
11 37.. .... 26,515.. 5,349
2.3 28.40.0 0.00.1 12.9
21
151
0.17 28,774–4.3 –1.7
.. 1.80.0 16.5
<50 81,9700.71 15,496
.. 5,000
.. 4.4
.. 9,415
.. 62.0
.. 11.221.5 11.4
.. 8,195
.. 10.3
.. 41100 100100 98100 100
.. 100
.. 99
.. 100
.. 22
.. ..
.. ..
.. 6
.. 17.9
.. 13.95.5 4.6
.. 1.4
.. 0.2
.. 0.0
.. 0.2
.. 0.1
.. 6.6
27The Little Green Data Book 2013
Country data
High-income group
Population (thousands) 108 Land area (sq. km) 180 GDP ($ millions) ..
Aruba

GNI per capita, World Bank Atlas method ($)Adjusted net national income per capita ($)Urban population (% of total)Urban population growth (avg. annual %, 1990–2011) AgricultureAgricultural land (% land area)Agricultural irrigated land (% of total agricultural land)Agricultural productivity, value added per worker (2000 $)Cereal yield (kg per hectare) Forests and biodiversityForest area (% land area)Deforestation (avg. annual %, 2000–2010)Terrestrial protected areas (% of total land area)Threatened species, mammalsThreatened species, birdsThreatened species, fishThreatened species, higher plants OceansTotal fisheries production (thousand metric tons)
Capture fisheries growth (avg. annual %, 1990–2011)Aquaculture growth (avg. annual %, 1990–2011)
Marine protected areas (% of territorial waters)Coral reef area (sq. km)Mangroves area (sq. km) Energy and emissionsEnergy use per capita (kg oil equivalent)Energy from biomass products and waste (% of total)Electric power consumption per capita (kWh)Electricity generated using fossil fuel (% of total)Electricity generated by hydropower (% of total)CO2 emissions per capita (metric tons) Water and sanitationInternal freshwater resources per capita (cu. m)Total freshwater withdrawal (% of internal resources)
Agriculture (% of total freshwater withdrawal)Access to improved water source (% of total population)
Rural (% of rural population)Urban (% of urban population)
Access to improved sanitation (% of total population)Rural (% of rural population)Urban (% of urban population)
Environment and healthParticulate matter (urban-pop.-weighted avg., µg/cu. m)Acute resp. infection prevalence (% of children under five)Diarrhea prevalence (% of children under five)Under-five mortality rate (per 1,000 live births) National accounting aggregates—savings, depletion and degradationGross savings (% of GNI)Consumption of fixed capital (% of GNI)Education expenditure (% of GNI)Energy depletion (% of GNI)Mineral depletion (% of GNI)Net forest depletion (% of GNI)CO2 damage (% of GNI)Particulate emissions damage (% of GNI)Adjusted net savings (% of GNI)
49,790 39,86046,204 34,611
89.2 80.51.5 1.1
53 370.5 ..
35,165 26,5152,097 5,349
19.3 28.40.4 0.0
10.6 12.95551
10246
237 28,774–1.6 –1.78.7 1.8
28.3 16.548,960 81,970
9,910 15,496
5,653 5,0004.2 4.4
10,286 9,41591.1 62.05.2 11.2
18.4 11.4
22,039 8,1954.6 10.374 41
100 100100 98100 100100 100100 99100 100
13 22.. .... ..5 6
23.8 17.915.1 13.94.8 4.62.3 1.44.7 0.20.0 0.00.2 0.20.0 0.16.8 6.6
28 2013 The Little Green Data Book
Country data
High-income group
Population (millions) 22.3 Land area (1,000 sq. km) 7,682 GDP ($ billions) 1,379.4
Australia

GNI per capita, World Bank Atlas method ($)Adjusted net national income per capita ($)Urban population (% of total)Urban population growth (avg. annual %, 1990–2011) AgricultureAgricultural land (% land area)Agricultural irrigated land (% of total agricultural land)Agricultural productivity, value added per worker (2000 $)Cereal yield (kg per hectare) Forests and biodiversityForest area (% land area)Deforestation (avg. annual %, 2000–2010)Terrestrial protected areas (% of total land area)Threatened species, mammalsThreatened species, birdsThreatened species, fishThreatened species, higher plants OceansTotal fisheries production (thousand metric tons)
Capture fisheries growth (avg. annual %, 1990–2011)Aquaculture growth (avg. annual %, 1990–2011)
Marine protected areas (% of territorial waters)Coral reef area (sq. km)Mangroves area (sq. km) Energy and emissionsEnergy use per capita (kg oil equivalent)Energy from biomass products and waste (% of total)Electric power consumption per capita (kWh)Electricity generated using fossil fuel (% of total)Electricity generated by hydropower (% of total)CO2 emissions per capita (metric tons) Water and sanitationInternal freshwater resources per capita (cu. m)Total freshwater withdrawal (% of internal resources)
Agriculture (% of total freshwater withdrawal)Access to improved water source (% of total population)
Rural (% of rural population)Urban (% of urban population)
Access to improved sanitation (% of total population)Rural (% of rural population)Urban (% of urban population)
Environment and healthParticulate matter (urban-pop.-weighted avg., µg/cu. m)Acute resp. infection prevalence (% of children under five)Diarrhea prevalence (% of children under five)Under-five mortality rate (per 1,000 live births) National accounting aggregates—savings, depletion and degradationGross savings (% of GNI)Consumption of fixed capital (% of GNI)Education expenditure (% of GNI)Energy depletion (% of GNI)Mineral depletion (% of GNI)Net forest depletion (% of GNI)CO2 damage (% of GNI)Particulate emissions damage (% of GNI)Adjusted net savings (% of GNI)
48,170 39,86042,291 34,611
67.7 80.50.6 1.1
35 371.4 ..
25,771 26,5157,873 5,349
47.2 28.4–0.1 0.022.9 12.9
39
1110
2.5 28,774–2.0 –1.7–1.7 1.8
.. 16.5
.. 81,970
.. 15,496
4,034 5,00017.8 4.4
8,356 9,41532.9 62.056.5 11.2
7.4 11.4
6,529 8,1956.6 10.3
3 41100 100100 98100 100100 100100 99100 100
27 22.. .... ..4 6
25.6 17.914.2 13.95.3 4.60.1 1.40.0 0.20.0 0.00.1 0.20.2 0.1
16.2 6.6
29The Little Green Data Book 2013
Country data
High-income group
Population (millions) 8.4 Land area (1,000 sq. km) 82 GDP ($ billions) 417.7
Austria

GNI per capita, World Bank Atlas method ($)Adjusted net national income per capita ($)Urban population (% of total)Urban population growth (avg. annual %, 1990–2011) AgricultureAgricultural land (% land area)Agricultural irrigated land (% of total agricultural land)Agricultural productivity, value added per worker (2000 $)Cereal yield (kg per hectare) Forests and biodiversityForest area (% land area)Deforestation (avg. annual %, 2000–2010)Terrestrial protected areas (% of total land area)Threatened species, mammalsThreatened species, birdsThreatened species, fishThreatened species, higher plants OceansTotal fisheries production (thousand metric tons)
Capture fisheries growth (avg. annual %, 1990–2011)Aquaculture growth (avg. annual %, 1990–2011)
Marine protected areas (% of territorial waters)Coral reef area (sq. km)Mangroves area (sq. km) Energy and emissionsEnergy use per capita (kg oil equivalent)Energy from biomass products and waste (% of total)Electric power consumption per capita (kWh)Electricity generated using fossil fuel (% of total)Electricity generated by hydropower (% of total)CO2 emissions per capita (metric tons) Water and sanitationInternal freshwater resources per capita (cu. m)Total freshwater withdrawal (% of internal resources)
Agriculture (% of total freshwater withdrawal)Access to improved water source (% of total population)
Rural (% of rural population)Urban (% of urban population)
Access to improved sanitation (% of total population)Rural (% of rural population)Urban (% of urban population)
Environment and healthParticulate matter (urban-pop.-weighted avg., µg/cu. m)Acute resp. infection prevalence (% of children under five)Diarrhea prevalence (% of children under five)Under-five mortality rate (per 1,000 live births) National accounting aggregates—savings, depletion and degradationGross savings (% of GNI)Consumption of fixed capital (% of GNI)Education expenditure (% of GNI)Energy depletion (% of GNI)Mineral depletion (% of GNI)Net forest depletion (% of GNI)CO2 damage (% of GNI)Particulate emissions damage (% of GNI)Adjusted net savings (% of GNI)
5,290 7,734 6,5633,275 6,652 5,82153.6 64.7 60.6
1.2 0.3 2.5
58 28 3529.5 .. ..
1,360 3,374 8692,484 2,740 3,944
11.3 38.7 34.80.0 0.0 0.07.1 7.5 13.3
715100
1.6 5,790 97,437–15.9 –2.9 0.7–4.0 –0.5 9.0
.. 10.4 8.4
.. .. 33,350
.. .. 48,783
1,307 3,015 1,9480.0 2.0 8.1
1,603 4,059 2,94281.6 65.4 72.918.4 18.8 21.3
5.5 7.1 5.5
885 12,498 8,550150.5 6.3 5.6
76 60 6680 96 9371 91 8688 99 9882 84 7378 81 6286 87 81
27 21 423 .. ..
11 .. ..45 21 20
51.6 26.1 36.412.8 12.3 11.8
3.4 3.6 3.333.8 9.3 5.7
0.1 0.8 1.60.0 0.0 0.00.8 0.7 0.70.4 0.3 0.77.1 6.2 19.2
30 2013 The Little Green Data Book
Country data
Europe & Central
Asia group
Upper middle-income group
Population (millions) 9.2 Land area (1,000 sq. km) 83 GDP ($ billions) 63.4
Azerbaijan

GNI per capita, World Bank Atlas method ($)Adjusted net national income per capita ($)Urban population (% of total)Urban population growth (avg. annual %, 1990–2011) AgricultureAgricultural land (% land area)Agricultural irrigated land (% of total agricultural land)Agricultural productivity, value added per worker (2000 $)Cereal yield (kg per hectare) Forests and biodiversityForest area (% land area)Deforestation (avg. annual %, 2000–2010)Terrestrial protected areas (% of total land area)Threatened species, mammalsThreatened species, birdsThreatened species, fishThreatened species, higher plants OceansTotal fisheries production (thousand metric tons)
Capture fisheries growth (avg. annual %, 1990–2011)Aquaculture growth (avg. annual %, 1990–2011)
Marine protected areas (% of territorial waters)Coral reef area (sq. km)Mangroves area (sq. km) Energy and emissionsEnergy use per capita (kg oil equivalent)Energy from biomass products and waste (% of total)Electric power consumption per capita (kWh)Electricity generated using fossil fuel (% of total)Electricity generated by hydropower (% of total)CO2 emissions per capita (metric tons) Water and sanitationInternal freshwater resources per capita (cu. m)Total freshwater withdrawal (% of internal resources)
Agriculture (% of total freshwater withdrawal)Access to improved water source (% of total population)
Rural (% of rural population)Urban (% of urban population)
Access to improved sanitation (% of total population)Rural (% of rural population)Urban (% of urban population)
Environment and healthParticulate matter (urban-pop.-weighted avg., µg/cu. m)Acute resp. infection prevalence (% of children under five)Diarrhea prevalence (% of children under five)Under-five mortality rate (per 1,000 live births) National accounting aggregates—savings, depletion and degradationGross savings (% of GNI)Consumption of fixed capital (% of GNI)Education expenditure (% of GNI)Energy depletion (% of GNI)Mineral depletion (% of GNI)Net forest depletion (% of GNI)CO2 damage (% of GNI)Particulate emissions damage (% of GNI)Adjusted net savings (% of GNI)
21,970 39,86018,695 34,611
84.3 80.51.7 1.1
1 37.. ..
44,812 26,5154,410 5,349
51.4 28.40.0 0.0
13.7 12.966
295
10.4 28,7741.5 –1.7
.. 1.80.41 16.5
3,150 81,970875 15,496
2,156 5,000.. 4.4.. 9,415.. 62.0.. 11.2
7.6 11.4
58 8,195.. 10.3.. 41.. 100.. 98
98 100100 100100 99100 100
.. 22
.. ..
.. ..16 6
12.1 17.913.7 13.93.8 4.60.0 1.40.0 0.20.0 0.00.2 0.2
.. 0.1
.. 6.6
31The Little Green Data Book 2013
Country data
High-income group
Population (thousands) 347 Land area (1,000 sq. km) 10 GDP ($ billions) 7.8
Bahamas, The

GNI per capita, World Bank Atlas method ($)Adjusted net national income per capita ($)Urban population (% of total)Urban population growth (avg. annual %, 1990–2011) AgricultureAgricultural land (% land area)Agricultural irrigated land (% of total agricultural land)Agricultural productivity, value added per worker (2000 $)Cereal yield (kg per hectare) Forests and biodiversityForest area (% land area)Deforestation (avg. annual %, 2000–2010)Terrestrial protected areas (% of total land area)Threatened species, mammalsThreatened species, birdsThreatened species, fishThreatened species, higher plants OceansTotal fisheries production (thousand metric tons)
Capture fisheries growth (avg. annual %, 1990–2011)Aquaculture growth (avg. annual %, 1990–2011)
Marine protected areas (% of territorial waters)Coral reef area (sq. km)Mangroves area (sq. km) Energy and emissionsEnergy use per capita (kg oil equivalent)Energy from biomass products and waste (% of total)Electric power consumption per capita (kWh)Electricity generated using fossil fuel (% of total)Electricity generated by hydropower (% of total)CO2 emissions per capita (metric tons) Water and sanitationInternal freshwater resources per capita (cu. m)Total freshwater withdrawal (% of internal resources)
Agriculture (% of total freshwater withdrawal)Access to improved water source (% of total population)
Rural (% of rural population)Urban (% of urban population)
Access to improved sanitation (% of total population)Rural (% of rural population)Urban (% of urban population)
Environment and healthParticulate matter (urban-pop.-weighted avg., µg/cu. m)Acute resp. infection prevalence (% of children under five)Diarrhea prevalence (% of children under five)Under-five mortality rate (per 1,000 live births) National accounting aggregates—savings, depletion and degradationGross savings (% of GNI)Consumption of fixed capital (% of GNI)Education expenditure (% of GNI)Energy depletion (% of GNI)Mineral depletion (% of GNI)Net forest depletion (% of GNI)CO2 damage (% of GNI)Particulate emissions damage (% of GNI)Adjusted net savings (% of GNI)
15,920 39,86011,033 34,611
88.7 80.54.7 1.1
11 37.. .... 26,515.. 5,349
0.7 28.4–3.6 0.01.3 12.9
3380
9.9 28,7741.0 –1.7
.. 1.80.65 16.5570 81,970
0.65 15,496
7,754 5,0000.0 4.4
9,814 9,415100.0 62.0
0.0 11.220.7 11.4
3 8,1958,935.0 10.3
45 41.. 100.. 98
100 100.. 100.. 99
100 100
44 22.. .... ..
10 6
34.4 17.914.2 13.9
3.0 4.618.1 1.4
0.0 0.20.0 0.00.9 0.20.1 0.19.6 6.6
32 2013 The Little Green Data Book
Country data
High-income group
Population (millions) 1.3 Land area (sq. km) 760 GDP ($ billions) 22.9
Bahrain

GNI per capita, World Bank Atlas method ($)Adjusted net national income per capita ($)Urban population (% of total)Urban population growth (avg. annual %, 1990–2011) AgricultureAgricultural land (% land area)Agricultural irrigated land (% of total agricultural land)Agricultural productivity, value added per worker (2000 $)Cereal yield (kg per hectare) Forests and biodiversityForest area (% land area)Deforestation (avg. annual %, 2000–2010)Terrestrial protected areas (% of total land area)Threatened species, mammalsThreatened species, birdsThreatened species, fishThreatened species, higher plants OceansTotal fisheries production (thousand metric tons)
Capture fisheries growth (avg. annual %, 1990–2011)Aquaculture growth (avg. annual %, 1990–2011)
Marine protected areas (% of territorial waters)Coral reef area (sq. km)Mangroves area (sq. km) Energy and emissionsEnergy use per capita (kg oil equivalent)Energy from biomass products and waste (% of total)Electric power consumption per capita (kWh)Electricity generated using fossil fuel (% of total)Electricity generated by hydropower (% of total)CO2 emissions per capita (metric tons) Water and sanitationInternal freshwater resources per capita (cu. m)Total freshwater withdrawal (% of internal resources)
Agriculture (% of total freshwater withdrawal)Access to improved water source (% of total population)
Rural (% of rural population)Urban (% of urban population)
Access to improved sanitation (% of total population)Rural (% of rural population)Urban (% of urban population)
Environment and healthParticulate matter (urban-pop.-weighted avg., µg/cu. m)Acute resp. infection prevalence (% of children under five)Diarrhea prevalence (% of children under five)Under-five mortality rate (per 1,000 live births) National accounting aggregates—savings, depletion and degradationGross savings (% of GNI)Consumption of fixed capital (% of GNI)Education expenditure (% of GNI)Energy depletion (% of GNI)Mineral depletion (% of GNI)Net forest depletion (% of GNI)CO2 damage (% of GNI)Particulate emissions damage (% of GNI)Adjusted net savings (% of GNI)
780 1,313 571731 1,201 521
28.4 30.9 28.03.4 2.8 3.5
70 55 3952.6 .. ..535 550 308
4,191 2,959 2,034
11.1 17.1 25.70.2 –0.3 0.61.8 5.9 10.034311716
3,125 13,219 11,5634.4 2.3 4.0
10.4 8.1 4.90.81 1.7 ..<50 15,440 15,120
4,951 10,343 25,818
209 519 36328.1 26.7 66.2279 555 242
96.1 80.6 32.03.9 14.0 45.30.3 1.4 0.3
698 1,197 5,12534.2 51.6 4.5
88 91 9081 90 6580 88 5785 96 8656 38 3755 28 3257 60 47
115 62 545 .. ..
10 .. ..46 62 95
33.5 33.5 25.27.6 9.2 7.71.8 2.8 3.01.9 2.8 1.40.0 1.0 2.00.4 0.6 1.20.4 0.8 0.30.7 0.6 0.5
24.4 21.6 15.2
33The Little Green Data Book 2013
Country data
South Asia
group
Low-income group
Population (millions) 150.5 Land area (1,000 sq. km) 130 GDP ($ billions) 111.9
Bangladesh

GNI per capita, World Bank Atlas method ($)Adjusted net national income per capita ($)Urban population (% of total)Urban population growth (avg. annual %, 1990–2011) AgricultureAgricultural land (% land area)Agricultural irrigated land (% of total agricultural land)Agricultural productivity, value added per worker (2000 $)Cereal yield (kg per hectare) Forests and biodiversityForest area (% land area)Deforestation (avg. annual %, 2000–2010)Terrestrial protected areas (% of total land area)Threatened species, mammalsThreatened species, birdsThreatened species, fishThreatened species, higher plants OceansTotal fisheries production (thousand metric tons)
Capture fisheries growth (avg. annual %, 1990–2011)Aquaculture growth (avg. annual %, 1990–2011)
Marine protected areas (% of territorial waters)Coral reef area (sq. km)Mangroves area (sq. km) Energy and emissionsEnergy use per capita (kg oil equivalent)Energy from biomass products and waste (% of total)Electric power consumption per capita (kWh)Electricity generated using fossil fuel (% of total)Electricity generated by hydropower (% of total)CO2 emissions per capita (metric tons) Water and sanitationInternal freshwater resources per capita (cu. m)Total freshwater withdrawal (% of internal resources)
Agriculture (% of total freshwater withdrawal)Access to improved water source (% of total population)
Rural (% of rural population)Urban (% of urban population)
Access to improved sanitation (% of total population)Rural (% of rural population)Urban (% of urban population)
Environment and healthParticulate matter (urban-pop.-weighted avg., µg/cu. m)Acute resp. infection prevalence (% of children under five)Diarrhea prevalence (% of children under five)Under-five mortality rate (per 1,000 live births) National accounting aggregates—savings, depletion and degradationGross savings (% of GNI)Consumption of fixed capital (% of GNI)Education expenditure (% of GNI)Energy depletion (% of GNI)Mineral depletion (% of GNI)Net forest depletion (% of GNI)CO2 damage (% of GNI)Particulate emissions damage (% of GNI)Adjusted net savings (% of GNI)
12,660 39,860.. 34,611
44.4 80.51.7 1.1
35 37.. .... 26,515
3,444 5,349
19.4 28.40.0 0.00.1 12.9
32
202
1.8 28,774–2.4 –1.7
.. 1.80.07 16.5
<100 81,9700.04 15,496
1,476 5,000.. 4.4.. 9,415.. 62.0.. 11.2
5.8 11.4
292 8,19576.1 10.3
33 41100 100100 98100 100100 100100 99100 100
35 22.. .... ..
20 6
17.2 17.912.4 13.9
7.4 4.60.0 1.40.0 0.2
.. 0.00.3 0.20.0 0.1
.. 6.6
34 2013 The Little Green Data Book
Country data
High-income group
Population (thousands) 274 Land area (sq. km) 430 GDP ($ billions) 3.7
Barbados

GNI per capita, World Bank Atlas method ($)Adjusted net national income per capita ($)Urban population (% of total)Urban population growth (avg. annual %, 1990–2011) AgricultureAgricultural land (% land area)Agricultural irrigated land (% of total agricultural land)Agricultural productivity, value added per worker (2000 $)Cereal yield (kg per hectare) Forests and biodiversityForest area (% land area)Deforestation (avg. annual %, 2000–2010)Terrestrial protected areas (% of total land area)Threatened species, mammalsThreatened species, birdsThreatened species, fishThreatened species, higher plants OceansTotal fisheries production (thousand metric tons)
Capture fisheries growth (avg. annual %, 1990–2011)Aquaculture growth (avg. annual %, 1990–2011)
Marine protected areas (% of territorial waters)Coral reef area (sq. km)Mangroves area (sq. km) Energy and emissionsEnergy use per capita (kg oil equivalent)Energy from biomass products and waste (% of total)Electric power consumption per capita (kWh)Electricity generated using fossil fuel (% of total)Electricity generated by hydropower (% of total)CO2 emissions per capita (metric tons) Water and sanitationInternal freshwater resources per capita (cu. m)Total freshwater withdrawal (% of internal resources)
Agriculture (% of total freshwater withdrawal)Access to improved water source (% of total population)
Rural (% of rural population)Urban (% of urban population)
Access to improved sanitation (% of total population)Rural (% of rural population)Urban (% of urban population)
Environment and healthParticulate matter (urban-pop.-weighted avg., µg/cu. m)Acute resp. infection prevalence (% of children under five)Diarrhea prevalence (% of children under five)Under-five mortality rate (per 1,000 live births) National accounting aggregates—savings, depletion and degradationGross savings (% of GNI)Consumption of fixed capital (% of GNI)Education expenditure (% of GNI)Energy depletion (% of GNI)Mineral depletion (% of GNI)Net forest depletion (% of GNI)CO2 damage (% of GNI)Particulate emissions damage (% of GNI)Adjusted net savings (% of GNI)
5,830 7,734 6,5634,906 6,652 5,821
75.0 64.7 60.60.3 0.3 2.5
44 28 350.3 .. ..
6,247 3,374 8693,250 2,740 3,944
42.7 38.7 34.8–0.4 0.0 0.07.2 7.5 13.3
4621
17.4 5,790 97,437–4.6 –2.9 0.7–0.1 –0.5 9.0
.. 10.4 8.4
.. .. 33,350
.. .. 48,783
2,922 3,015 1,9486.2 2.0 8.1
3,564 4,059 2,94299.2 65.4 72.9
0.1 18.8 21.36.3 7.1 5.5
3,927 12,498 8,55011.7 6.3 5.6
19 60 66100 96 9399 91 86
100 99 9893 84 7397 81 6291 87 81
6 21 42.. .. .... .. ..6 21 20
27.2 26.1 36.411.5 12.3 11.84.4 3.6 3.31.4 9.3 5.70.0 0.8 1.60.0 0.0 0.01.1 0.7 0.70.0 0.3 0.7
17.6 6.2 19.2
35The Little Green Data Book 2013
Country data
Europe & Central
Asia group
Upper middle-income group
Population (millions) 9.5 Land area (1,000 sq. km) 203 GDP ($ billions) 55.1
Belarus

GNI per capita, World Bank Atlas method ($)Adjusted net national income per capita ($)Urban population (% of total)Urban population growth (avg. annual %, 1990–2011) AgricultureAgricultural land (% land area)Agricultural irrigated land (% of total agricultural land)Agricultural productivity, value added per worker (2000 $)Cereal yield (kg per hectare) Forests and biodiversityForest area (% land area)Deforestation (avg. annual %, 2000–2010)Terrestrial protected areas (% of total land area)Threatened species, mammalsThreatened species, birdsThreatened species, fishThreatened species, higher plants OceansTotal fisheries production (thousand metric tons)
Capture fisheries growth (avg. annual %, 1990–2011)Aquaculture growth (avg. annual %, 1990–2011)
Marine protected areas (% of territorial waters)Coral reef area (sq. km)Mangroves area (sq. km) Energy and emissionsEnergy use per capita (kg oil equivalent)Energy from biomass products and waste (% of total)Electric power consumption per capita (kWh)Electricity generated using fossil fuel (% of total)Electricity generated by hydropower (% of total)CO2 emissions per capita (metric tons) Water and sanitationInternal freshwater resources per capita (cu. m)Total freshwater withdrawal (% of internal resources)
Agriculture (% of total freshwater withdrawal)Access to improved water source (% of total population)
Rural (% of rural population)Urban (% of urban population)
Access to improved sanitation (% of total population)Rural (% of rural population)Urban (% of urban population)
Environment and healthParticulate matter (urban-pop.-weighted avg., µg/cu. m)Acute resp. infection prevalence (% of children under five)Diarrhea prevalence (% of children under five)Under-five mortality rate (per 1,000 live births) National accounting aggregates—savings, depletion and degradationGross savings (% of GNI)Consumption of fixed capital (% of GNI)Education expenditure (% of GNI)Energy depletion (% of GNI)Mineral depletion (% of GNI)Net forest depletion (% of GNI)CO2 damage (% of GNI)Particulate emissions damage (% of GNI)Adjusted net savings (% of GNI)
45,930 39,86040,544 34,611
97.5 80.50.5 1.1
44 370.4 ..
.. 26,5159,004 5,349
22.4 28.4–0.2 0.013.8 12.9
24
110
22.5 28,774–2.9 –1.7
–11.7 1.80.04 16.5
.. 81,970
.. 15,496
5,586 5,0005.1 4.4
8,388 9,41540.3 62.0
0.3 11.29.6 11.4
1,089 8,19551.8 10.3
1 41100 100100 98100 100100 100100 99100 100
21 22.. .... ..4 6
22.1 17.913.9 13.9
6.1 4.60.0 1.40.0 0.20.0 0.00.2 0.20.2 0.1
13.9 6.6
36 2013 The Little Green Data Book
Country data
High-income group
Population (millions) 11.0 Land area (1,000 sq. km) 30 GDP ($ billions) 513.7
Belgium

GNI per capita, World Bank Atlas method ($)Adjusted net national income per capita ($)Urban population (% of total)Urban population growth (avg. annual %, 1990–2011) AgricultureAgricultural land (% land area)Agricultural irrigated land (% of total agricultural land)Agricultural productivity, value added per worker (2000 $)Cereal yield (kg per hectare) Forests and biodiversityForest area (% land area)Deforestation (avg. annual %, 2000–2010)Terrestrial protected areas (% of total land area)Threatened species, mammalsThreatened species, birdsThreatened species, fishThreatened species, higher plants OceansTotal fisheries production (thousand metric tons)
Capture fisheries growth (avg. annual %, 1990–2011)Aquaculture growth (avg. annual %, 1990–2011)
Marine protected areas (% of territorial waters)Coral reef area (sq. km)Mangroves area (sq. km) Energy and emissionsEnergy use per capita (kg oil equivalent)Energy from biomass products and waste (% of total)Electric power consumption per capita (kWh)Electricity generated using fossil fuel (% of total)Electricity generated by hydropower (% of total)CO2 emissions per capita (metric tons) Water and sanitationInternal freshwater resources per capita (cu. m)Total freshwater withdrawal (% of internal resources)
Agriculture (% of total freshwater withdrawal)Access to improved water source (% of total population)
Rural (% of rural population)Urban (% of urban population)
Access to improved sanitation (% of total population)Rural (% of rural population)Urban (% of urban population)
Environment and healthParticulate matter (urban-pop.-weighted avg., µg/cu. m)Acute resp. infection prevalence (% of children under five)Diarrhea prevalence (% of children under five)Under-five mortality rate (per 1,000 live births) National accounting aggregates—savings, depletion and degradationGross savings (% of GNI)Consumption of fixed capital (% of GNI)Education expenditure (% of GNI)Energy depletion (% of GNI)Mineral depletion (% of GNI)Net forest depletion (% of GNI)CO2 damage (% of GNI)Particulate emissions damage (% of GNI)Adjusted net savings (% of GNI)
3,710 8,574 1,7723,275 7,648 1,59544.8 79.1 38.7
2.7 2.0 2.7
7 37 46.. .. ..
4,258 3,448 7162,817 3,838 3,065
60.6 46.8 28.40.7 0.4 0.3
27.9 20.2 9.985
3027
268 19,009 40,23826.1 0.1 2.420.3 11.8 10.011.9 13.1 2.9
1,330 15,100 143,440958 39,997 60,301
571 1,312 667.. 16.7 26.2.. 1,973 698.. 39.0 73.0.. 53.7 17.4
1.2 2.7 1.6
44,868 22,810 3,1210.9 2.0 20.220 68 8898 94 8799 81 8498 98 9390 79 4787 59 3593 84 66
12 28 53.. .. .... .. ..
17 19 62
17.4 21.1 29.711.7 12.2 9.96.9 5.0 3.10.0 4.5 6.30.0 1.9 1.20.0 0.0 0.30.3 0.2 0.70.0 0.3 0.6
10.5 6.8 14.7
37The Little Green Data Book 2013
Country data
Latin America & Caribbean
group
Lower middle-income group
Population (thousands) 357 Land area (1,000 sq. km) 23 GDP ($ billions) 1.4
Belize
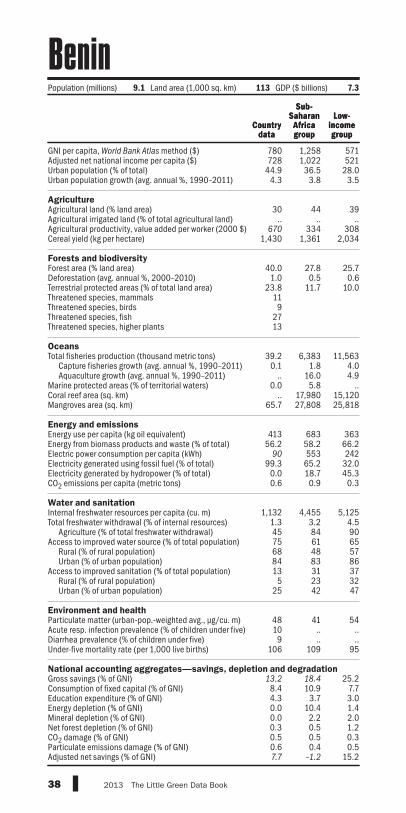
GNI per capita, World Bank Atlas method ($)Adjusted net national income per capita ($)Urban population (% of total)Urban population growth (avg. annual %, 1990–2011) AgricultureAgricultural land (% land area)Agricultural irrigated land (% of total agricultural land)Agricultural productivity, value added per worker (2000 $)Cereal yield (kg per hectare) Forests and biodiversityForest area (% land area)Deforestation (avg. annual %, 2000–2010)Terrestrial protected areas (% of total land area)Threatened species, mammalsThreatened species, birdsThreatened species, fishThreatened species, higher plants OceansTotal fisheries production (thousand metric tons)
Capture fisheries growth (avg. annual %, 1990–2011)Aquaculture growth (avg. annual %, 1990–2011)
Marine protected areas (% of territorial waters)Coral reef area (sq. km)Mangroves area (sq. km) Energy and emissionsEnergy use per capita (kg oil equivalent)Energy from biomass products and waste (% of total)Electric power consumption per capita (kWh)Electricity generated using fossil fuel (% of total)Electricity generated by hydropower (% of total)CO2 emissions per capita (metric tons) Water and sanitationInternal freshwater resources per capita (cu. m)Total freshwater withdrawal (% of internal resources)
Agriculture (% of total freshwater withdrawal)Access to improved water source (% of total population)
Rural (% of rural population)Urban (% of urban population)
Access to improved sanitation (% of total population)Rural (% of rural population)Urban (% of urban population)
Environment and healthParticulate matter (urban-pop.-weighted avg., µg/cu. m)Acute resp. infection prevalence (% of children under five)Diarrhea prevalence (% of children under five)Under-five mortality rate (per 1,000 live births) National accounting aggregates—savings, depletion and degradationGross savings (% of GNI)Consumption of fixed capital (% of GNI)Education expenditure (% of GNI)Energy depletion (% of GNI)Mineral depletion (% of GNI)Net forest depletion (% of GNI)CO2 damage (% of GNI)Particulate emissions damage (% of GNI)Adjusted net savings (% of GNI)
780 1,258 571728 1,022 521
44.9 36.5 28.04.3 3.8 3.5
30 44 39.. .. ..
670 334 3081,430 1,361 2,034
40.0 27.8 25.71.0 0.5 0.6
23.8 11.7 10.0119
2713
39.2 6,383 11,5630.1 1.8 4.0
.. 16.0 4.90.0 5.8 ..
.. 17,980 15,12065.7 27,808 25,818
413 683 36356.2 58.2 66.2
90 553 24299.3 65.2 32.0
0.0 18.7 45.30.6 0.9 0.3
1,132 4,455 5,1251.3 3.2 4.545 84 9075 61 6568 48 5784 83 8613 31 37
5 23 3225 42 47
48 41 5410 .. ..9 .. ..
106 109 95
13.2 18.4 25.28.4 10.9 7.74.3 3.7 3.00.0 10.4 1.40.0 2.2 2.00.3 0.5 1.20.5 0.5 0.30.6 0.4 0.57.7 –1.2 15.2
38 2013 The Little Green Data Book
Country data
Sub-Saharan Africa group
Low-income group
Population (millions) 9.1 Land area (1,000 sq. km) 113 GDP ($ billions) 7.3
Country data
Sub-Saharan Africa group
Low-income group
Benin

GNI per capita, World Bank Atlas method ($)Adjusted net national income per capita ($)Urban population (% of total)Urban population growth (avg. annual %, 1990–2011) AgricultureAgricultural land (% land area)Agricultural irrigated land (% of total agricultural land)Agricultural productivity, value added per worker (2000 $)Cereal yield (kg per hectare) Forests and biodiversityForest area (% land area)Deforestation (avg. annual %, 2000–2010)Terrestrial protected areas (% of total land area)Threatened species, mammalsThreatened species, birdsThreatened species, fishThreatened species, higher plants OceansTotal fisheries production (thousand metric tons)
Capture fisheries growth (avg. annual %, 1990–2011)Aquaculture growth (avg. annual %, 1990–2011)
Marine protected areas (% of territorial waters)Coral reef area (sq. km)Mangroves area (sq. km) Energy and emissionsEnergy use per capita (kg oil equivalent)Energy from biomass products and waste (% of total)Electric power consumption per capita (kWh)Electricity generated using fossil fuel (% of total)Electricity generated by hydropower (% of total)CO2 emissions per capita (metric tons) Water and sanitationInternal freshwater resources per capita (cu. m)Total freshwater withdrawal (% of internal resources)
Agriculture (% of total freshwater withdrawal)Access to improved water source (% of total population)
Rural (% of rural population)Urban (% of urban population)
Access to improved sanitation (% of total population)Rural (% of rural population)Urban (% of urban population)
Environment and healthParticulate matter (urban-pop.-weighted avg., µg/cu. m)Acute resp. infection prevalence (% of children under five)Diarrhea prevalence (% of children under five)Under-five mortality rate (per 1,000 live births) National accounting aggregates—savings, depletion and degradationGross savings (% of GNI)Consumption of fixed capital (% of GNI)Education expenditure (% of GNI)Energy depletion (% of GNI)Mineral depletion (% of GNI)Net forest depletion (% of GNI)CO2 damage (% of GNI)Particulate emissions damage (% of GNI)Adjusted net savings (% of GNI)
.. 39,860
.. 34,611100.0 80.5
0.3 1.1
15 37.. ..
32,356 26,515.. 5,349
20.0 28.40.0 0.05.6 12.9
41
163
0.48 28,7740.2 –1.7
.. 1.85.0 16.5370 81,9700.18 15,496
.. 5,000
.. 4.4
.. 9,415
.. 62.0
.. 11.27.2 11.4
.. 8,195
.. 10.3
.. 41
.. 100
.. 98
.. 100
.. 100
.. 99
.. 100
.. 22
.. ..
.. ..
.. 6
.. 17.9
.. 13.92.1 4.6
.. 1.4
.. 0.2
.. 0.0
.. 0.2
.. 0.1
.. 6.6
39The Little Green Data Book 2013
Country data
High-income group
Population (thousands) 65 Land area (sq. km) 50 GDP ($ billions) 5.8
Bermuda

GNI per capita, World Bank Atlas method ($)Adjusted net national income per capita ($)Urban population (% of total)Urban population growth (avg. annual %, 1990–2011) AgricultureAgricultural land (% land area)Agricultural irrigated land (% of total agricultural land)Agricultural productivity, value added per worker (2000 $)Cereal yield (kg per hectare) Forests and biodiversityForest area (% land area)Deforestation (avg. annual %, 2000–2010)Terrestrial protected areas (% of total land area)Threatened species, mammalsThreatened species, birdsThreatened species, fishThreatened species, higher plants OceansTotal fisheries production (thousand metric tons)
Capture fisheries growth (avg. annual %, 1990–2011)Aquaculture growth (avg. annual %, 1990–2011)
Marine protected areas (% of territorial waters)Coral reef area (sq. km)Mangroves area (sq. km) Energy and emissionsEnergy use per capita (kg oil equivalent)Energy from biomass products and waste (% of total)Electric power consumption per capita (kWh)Electricity generated using fossil fuel (% of total)Electricity generated by hydropower (% of total)CO2 emissions per capita (metric tons) Water and sanitationInternal freshwater resources per capita (cu. m)Total freshwater withdrawal (% of internal resources)
Agriculture (% of total freshwater withdrawal)Access to improved water source (% of total population)
Rural (% of rural population)Urban (% of urban population)
Access to improved sanitation (% of total population)Rural (% of rural population)Urban (% of urban population)
Environment and healthParticulate matter (urban-pop.-weighted avg., µg/cu. m)Acute resp. infection prevalence (% of children under five)Diarrhea prevalence (% of children under five)Under-five mortality rate (per 1,000 live births) National accounting aggregates—savings, depletion and degradationGross savings (% of GNI)Consumption of fixed capital (% of GNI)Education expenditure (% of GNI)Energy depletion (% of GNI)Mineral depletion (% of GNI)Net forest depletion (% of GNI)CO2 damage (% of GNI)Particulate emissions damage (% of GNI)Adjusted net savings (% of GNI)
2,130 1,313 1,7721,928 1,201 1,595
35.6 30.9 38.75.0 2.8 2.7
14 55 466.7 .. ..
463 550 7162,705 2,959 3,065
84.9 17.1 28.4–0.3 –0.3 0.328.3 5.9 9.9
2718
32
0.24 13,219 40,238–2.9 2.3 2.44.3 8.1 10.0
.. 1.7 2.9
.. 15,440 143,440
.. 10,343 60,301
354 519 667.. 26.7 26.2.. 555 698.. 80.6 73.0.. 14.0 17.4
0.6 1.4 1.6
105,653 1,197 3,1210.4 51.6 20.294 91 8896 90 8794 88 84
100 96 9344 38 4729 28 3573 60 66
20 62 53.. .. .... .. ..
54 62 62
.. 33.5 29.710.4 9.2 9.93.2 2.8 3.10.0 2.8 6.30.0 1.0 1.23.4 0.6 0.30.2 0.8 0.70.0 0.6 0.6
.. 21.6 14.7
40 2013 The Little Green Data Book
Country data
South Asia
group
Lower middle-income group
Population (thousands) 738 Land area (1,000 sq. km) 38 GDP ($ billions) 1.7
Bhutan

GNI per capita, World Bank Atlas method ($)Adjusted net national income per capita ($)Urban population (% of total)Urban population growth (avg. annual %, 1990–2011) AgricultureAgricultural land (% land area)Agricultural irrigated land (% of total agricultural land)Agricultural productivity, value added per worker (2000 $)Cereal yield (kg per hectare) Forests and biodiversityForest area (% land area)Deforestation (avg. annual %, 2000–2010)Terrestrial protected areas (% of total land area)Threatened species, mammalsThreatened species, birdsThreatened species, fishThreatened species, higher plants OceansTotal fisheries production (thousand metric tons)
Capture fisheries growth (avg. annual %, 1990–2011)Aquaculture growth (avg. annual %, 1990–2011)
Marine protected areas (% of territorial waters)Coral reef area (sq. km)Mangroves area (sq. km) Energy and emissionsEnergy use per capita (kg oil equivalent)Energy from biomass products and waste (% of total)Electric power consumption per capita (kWh)Electricity generated using fossil fuel (% of total)Electricity generated by hydropower (% of total)CO2 emissions per capita (metric tons) Water and sanitationInternal freshwater resources per capita (cu. m)Total freshwater withdrawal (% of internal resources)
Agriculture (% of total freshwater withdrawal)Access to improved water source (% of total population)
Rural (% of rural population)Urban (% of urban population)
Access to improved sanitation (% of total population)Rural (% of rural population)Urban (% of urban population)
Environment and healthParticulate matter (urban-pop.-weighted avg., µg/cu. m)Acute resp. infection prevalence (% of children under five)Diarrhea prevalence (% of children under five)Under-five mortality rate (per 1,000 live births) National accounting aggregates—savings, depletion and degradationGross savings (% of GNI)Consumption of fixed capital (% of GNI)Education expenditure (% of GNI)Energy depletion (% of GNI)Mineral depletion (% of GNI)Net forest depletion (% of GNI)CO2 damage (% of GNI)Particulate emissions damage (% of GNI)Adjusted net savings (% of GNI)
2,020 8,574 1,7721,707 7,648 1,59566.8 79.1 38.7
2.9 2.0 2.7
34 37 46.. .. ..
723 3,448 7162,365 3,838 3,065
52.5 46.8 28.40.5 0.4 0.3
18.5 20.2 9.92053
073
7.6 19,009 40,238–0.2 0.1 2.43.0 11.8 10.0
.. 13.1 2.9
.. 15,100 143,440
.. 39,997 60,301
737 1,312 66724.4 16.7 26.2616 1,973 698
66.0 39.0 73.031.7 53.7 17.41.5 2.7 1.6
30,085 22,810 3,1210.7 2.0 20.257 68 8888 94 8771 81 8496 98 9327 79 4710 59 3535 84 66
57 28 5320 .. ..26 .. ..51 19 62
27.2 21.1 29.710.3 12.2 9.95.2 5.0 3.1
10.0 4.5 6.34.7 1.9 1.20.0 0.0 0.30.5 0.2 0.71.0 0.3 0.65.9 6.8 14.7
41The Little Green Data Book 2013
Country data
Latin America & Caribbean
group
Lower middle-income group
Population (millions) 10.1 Land area (1,000 sq. km) 1,083 GDP ($ billions) 23.9
Bolivia

GNI per capita, World Bank Atlas method ($)Adjusted net national income per capita ($)Urban population (% of total)Urban population growth (avg. annual %, 1990–2011) AgricultureAgricultural land (% land area)Agricultural irrigated land (% of total agricultural land)Agricultural productivity, value added per worker (2000 $)Cereal yield (kg per hectare) Forests and biodiversityForest area (% land area)Deforestation (avg. annual %, 2000–2010)Terrestrial protected areas (% of total land area)Threatened species, mammalsThreatened species, birdsThreatened species, fishThreatened species, higher plants OceansTotal fisheries production (thousand metric tons)
Capture fisheries growth (avg. annual %, 1990–2011)Aquaculture growth (avg. annual %, 1990–2011)
Marine protected areas (% of territorial waters)Coral reef area (sq. km)Mangroves area (sq. km) Energy and emissionsEnergy use per capita (kg oil equivalent)Energy from biomass products and waste (% of total)Electric power consumption per capita (kWh)Electricity generated using fossil fuel (% of total)Electricity generated by hydropower (% of total)CO2 emissions per capita (metric tons) Water and sanitationInternal freshwater resources per capita (cu. m)Total freshwater withdrawal (% of internal resources)
Agriculture (% of total freshwater withdrawal)Access to improved water source (% of total population)
Rural (% of rural population)Urban (% of urban population)
Access to improved sanitation (% of total population)Rural (% of rural population)Urban (% of urban population)
Environment and healthParticulate matter (urban-pop.-weighted avg., µg/cu. m)Acute resp. infection prevalence (% of children under five)Diarrhea prevalence (% of children under five)Under-five mortality rate (per 1,000 live births) National accounting aggregates—savings, depletion and degradationGross savings (% of GNI)Consumption of fixed capital (% of GNI)Education expenditure (% of GNI)Energy depletion (% of GNI)Mineral depletion (% of GNI)Net forest depletion (% of GNI)CO2 damage (% of GNI)Particulate emissions damage (% of GNI)Adjusted net savings (% of GNI)
4,780 7,734 6,563.. 6,652 5,821
48.3 64.7 60.60.3 0.3 2.5
42 28 35.. .. ..
16,209 3,374 8693,725 2,740 3,944
42.8 38.7 34.80.0 0.0 0.00.6 7.5 13.3
46
310
10.0 5,790 97,437.. –2.9 0.7.. –0.5 9.0
0.71 10.4 8.4.. .. 33,350.. .. 48,783
1,703 3,015 1,9482.9 2.0 8.1
3,110 4,059 2,94253.1 65.4 72.946.9 18.8 21.3
8.0 7.1 5.5
9,461 12,498 8,5501.0 6.3 5.6
.. 60 6699 96 9398 91 86
100 99 9895 84 7392 81 6299 87 81
21 21 42.. .. .... .. ..8 21 20
12.9 26.1 36.410.8 12.3 11.8
.. 3.6 3.31.9 9.3 5.70.5 0.8 1.6
.. 0.0 0.01.3 0.7 0.70.2 0.3 0.7
.. 6.2 19.2
42 2013 The Little Green Data Book
Country data
Europe & Central
Asia group
Upper middle-income group
Population (millions) 3.8 Land area (1,000 sq. km) 51 GDP ($ billions) 18.1
Bosnia and Herzegovina

GNI per capita, World Bank Atlas method ($)Adjusted net national income per capita ($)Urban population (% of total)Urban population growth (avg. annual %, 1990–2011) AgricultureAgricultural land (% land area)Agricultural irrigated land (% of total agricultural land)Agricultural productivity, value added per worker (2000 $)Cereal yield (kg per hectare) Forests and biodiversityForest area (% land area)Deforestation (avg. annual %, 2000–2010)Terrestrial protected areas (% of total land area)Threatened species, mammalsThreatened species, birdsThreatened species, fishThreatened species, higher plants OceansTotal fisheries production (thousand metric tons)
Capture fisheries growth (avg. annual %, 1990–2011)Aquaculture growth (avg. annual %, 1990–2011)
Marine protected areas (% of territorial waters)Coral reef area (sq. km)Mangroves area (sq. km) Energy and emissionsEnergy use per capita (kg oil equivalent)Energy from biomass products and waste (% of total)Electric power consumption per capita (kWh)Electricity generated using fossil fuel (% of total)Electricity generated by hydropower (% of total)CO2 emissions per capita (metric tons) Water and sanitationInternal freshwater resources per capita (cu. m)Total freshwater withdrawal (% of internal resources)
Agriculture (% of total freshwater withdrawal)Access to improved water source (% of total population)
Rural (% of rural population)Urban (% of urban population)
Access to improved sanitation (% of total population)Rural (% of rural population)Urban (% of urban population)
Environment and healthParticulate matter (urban-pop.-weighted avg., µg/cu. m)Acute resp. infection prevalence (% of children under five)Diarrhea prevalence (% of children under five)Under-five mortality rate (per 1,000 live births) National accounting aggregates—savings, depletion and degradationGross savings (% of GNI)Consumption of fixed capital (% of GNI)Education expenditure (% of GNI)Energy depletion (% of GNI)Mineral depletion (% of GNI)Net forest depletion (% of GNI)CO2 damage (% of GNI)Particulate emissions damage (% of GNI)Adjusted net savings (% of GNI)
7,470 1,258 6,5637,157 1,022 5,82161.6 36.5 60.6
3.7 3.8 2.5
46 44 350.0 .. ..
567 334 869393 1,361 3,944
19.8 27.8 34.81.0 0.5 0.0
30.9 11.7 13.37
1021
0.23 6,383 97,437–7.8 1.8 0.7
.. 16.0 9.0
.. 5.8 8.4
.. 17,980 33,350
.. 27,808 48,783
1,128 683 1,94821.5 58.2 8.1
1,586 553 2,942100.0 65.2 72.9
0.0 18.7 21.32.2 0.9 5.5
1,182 4,455 8,5508.1 3.2 5.641 84 6696 61 9392 48 8699 83 9862 31 7341 23 6275 42 81
64 41 42.. .. .... .. ..
26 109 20
28.1 18.4 36.411.9 10.9 11.8
7.6 3.7 3.30.2 10.4 5.72.9 2.2 1.60.0 0.5 0.00.2 0.5 0.70.3 0.4 0.7
20.4 –1.2 19.2
43The Little Green Data Book 2013
Country data
Sub-Saharan Africa group
Upper middle-income group
Population (millions) 2.0 Land area (1,000 sq. km) 567 GDP ($ billions) 17.3
Botswana

GNI per capita, World Bank Atlas method ($)Adjusted net national income per capita ($)Urban population (% of total)Urban population growth (avg. annual %, 1990–2011) AgricultureAgricultural land (% land area)Agricultural irrigated land (% of total agricultural land)Agricultural productivity, value added per worker (2000 $)Cereal yield (kg per hectare) Forests and biodiversityForest area (% land area)Deforestation (avg. annual %, 2000–2010)Terrestrial protected areas (% of total land area)Threatened species, mammalsThreatened species, birdsThreatened species, fishThreatened species, higher plants OceansTotal fisheries production (thousand metric tons)
Capture fisheries growth (avg. annual %, 1990–2011)Aquaculture growth (avg. annual %, 1990–2011)
Marine protected areas (% of territorial waters)Coral reef area (sq. km)Mangroves area (sq. km) Energy and emissionsEnergy use per capita (kg oil equivalent)Energy from biomass products and waste (% of total)Electric power consumption per capita (kWh)Electricity generated using fossil fuel (% of total)Electricity generated by hydropower (% of total)CO2 emissions per capita (metric tons) Water and sanitationInternal freshwater resources per capita (cu. m)Total freshwater withdrawal (% of internal resources)
Agriculture (% of total freshwater withdrawal)Access to improved water source (% of total population)
Rural (% of rural population)Urban (% of urban population)
Access to improved sanitation (% of total population)Rural (% of rural population)Urban (% of urban population)
Environment and healthParticulate matter (urban-pop.-weighted avg., µg/cu. m)Acute resp. infection prevalence (% of children under five)Diarrhea prevalence (% of children under five)Under-five mortality rate (per 1,000 live births) National accounting aggregates—savings, depletion and degradationGross savings (% of GNI)Consumption of fixed capital (% of GNI)Education expenditure (% of GNI)Energy depletion (% of GNI)Mineral depletion (% of GNI)Net forest depletion (% of GNI)CO2 damage (% of GNI)Particulate emissions damage (% of GNI)Adjusted net savings (% of GNI)
10,720 8,574 6,56310,363 7,648 5,821
84.6 79.1 60.61.9 2.0 2.5
33 37 351.6 .. ..
4,461 3,448 8694,038 3,838 3,944
61.2 46.8 34.80.5 0.4 0.0
26.3 20.2 13.381
15283
400
1,433 19,009 97,4371.2 0.1 0.7
17.7 11.8 9.016.5 13.1 8.4
1,200 15,100 33,35012,999 39,997 48,783
1,363 1,312 1,94830.6 16.7 8.1
2,384 1,973 2,94212.4 39.0 72.978.2 53.7 21.3
1.9 2.7 5.5
27,551 22,810 8,5501.1 2.0 5.655 68 6698 94 9385 81 86
100 98 9879 79 7344 59 6285 84 81
18 28 42.. .. .... .. ..
16 19 20
17.6 21.1 36.412.5 12.2 11.8
5.5 5.0 3.31.9 4.5 5.71.8 1.9 1.60.0 0.0 0.00.1 0.2 0.70.2 0.3 0.76.6 6.8 19.2
44 2013 The Little Green Data Book
Country data
Latin America & Caribbean
group
Upper middle-income group
Population (millions) 196.7 Land area (1,000 sq. km) 8,459 GDP ($ billions) 2,476.7
Brazil

GNI per capita, World Bank Atlas method ($)Adjusted net national income per capita ($)Urban population (% of total)Urban population growth (avg. annual %, 1990–2011) AgricultureAgricultural land (% land area)Agricultural irrigated land (% of total agricultural land)Agricultural productivity, value added per worker (2000 $)Cereal yield (kg per hectare) Forests and biodiversityForest area (% land area)Deforestation (avg. annual %, 2000–2010)Terrestrial protected areas (% of total land area)Threatened species, mammalsThreatened species, birdsThreatened species, fishThreatened species, higher plants OceansTotal fisheries production (thousand metric tons)
Capture fisheries growth (avg. annual %, 1990–2011)Aquaculture growth (avg. annual %, 1990–2011)
Marine protected areas (% of territorial waters)Coral reef area (sq. km)Mangroves area (sq. km) Energy and emissionsEnergy use per capita (kg oil equivalent)Energy from biomass products and waste (% of total)Electric power consumption per capita (kWh)Electricity generated using fossil fuel (% of total)Electricity generated by hydropower (% of total)CO2 emissions per capita (metric tons) Water and sanitationInternal freshwater resources per capita (cu. m)Total freshwater withdrawal (% of internal resources)
Agriculture (% of total freshwater withdrawal)Access to improved water source (% of total population)
Rural (% of rural population)Urban (% of urban population)
Access to improved sanitation (% of total population)Rural (% of rural population)Urban (% of urban population)
Environment and healthParticulate matter (urban-pop.-weighted avg., µg/cu. m)Acute resp. infection prevalence (% of children under five)Diarrhea prevalence (% of children under five)Under-five mortality rate (per 1,000 live births) National accounting aggregates—savings, depletion and degradationGross savings (% of GNI)Consumption of fixed capital (% of GNI)Education expenditure (% of GNI)Energy depletion (% of GNI)Mineral depletion (% of GNI)Net forest depletion (% of GNI)CO2 damage (% of GNI)Particulate emissions damage (% of GNI)Adjusted net savings (% of GNI)
31,800 39,86015,781 34,611
76.0 80.52.9 1.1
2 370.9 ..
80,337 26,515591 5,349
71.8 28.40.4 0.0
44.0 12.934247
98
2.6 28,774–0.5 –1.723.8 1.8
1.4 16.5210 81,970173 15,496
8,308 5,0000.0 4.4
8,759 9,415100.0 62.0
0.0 11.223.7 11.4
20,939 8,1951.1 10.3
.. 41
.. 100
.. 98
.. 100
.. 100
.. 99
.. 100
44 22.. .... ..7 6
50.7 17.912.7 13.92.0 4.6
29.9 1.40.0 0.20.0 0.00.6 0.20.1 0.1
10.1 6.6
45The Little Green Data Book 2013
Country data
High-income group
Population (thousands) 406 Land area (1,000 sq. km) 5.3 GDP ($ billions) 16.4
Brunei Darussalam

GNI per capita, World Bank Atlas method ($)Adjusted net national income per capita ($)Urban population (% of total)Urban population growth (avg. annual %, 1990–2011) AgricultureAgricultural land (% land area)Agricultural irrigated land (% of total agricultural land)Agricultural productivity, value added per worker (2000 $)Cereal yield (kg per hectare) Forests and biodiversityForest area (% land area)Deforestation (avg. annual %, 2000–2010)Terrestrial protected areas (% of total land area)Threatened species, mammalsThreatened species, birdsThreatened species, fishThreatened species, higher plants OceansTotal fisheries production (thousand metric tons)
Capture fisheries growth (avg. annual %, 1990–2011)Aquaculture growth (avg. annual %, 1990–2011)
Marine protected areas (% of territorial waters)Coral reef area (sq. km)Mangroves area (sq. km) Energy and emissionsEnergy use per capita (kg oil equivalent)Energy from biomass products and waste (% of total)Electric power consumption per capita (kWh)Electricity generated using fossil fuel (% of total)Electricity generated by hydropower (% of total)CO2 emissions per capita (metric tons) Water and sanitationInternal freshwater resources per capita (cu. m)Total freshwater withdrawal (% of internal resources)
Agriculture (% of total freshwater withdrawal)Access to improved water source (% of total population)
Rural (% of rural population)Urban (% of urban population)
Access to improved sanitation (% of total population)Rural (% of rural population)Urban (% of urban population)
Environment and healthParticulate matter (urban-pop.-weighted avg., µg/cu. m)Acute resp. infection prevalence (% of children under five)Diarrhea prevalence (% of children under five)Under-five mortality rate (per 1,000 live births) National accounting aggregates—savings, depletion and degradationGross savings (% of GNI)Consumption of fixed capital (% of GNI)Education expenditure (% of GNI)Energy depletion (% of GNI)Mineral depletion (% of GNI)Net forest depletion (% of GNI)CO2 damage (% of GNI)Particulate emissions damage (% of GNI)Adjusted net savings (% of GNI)
6,640 7,734 6,5635,949 6,652 5,821
73.1 64.7 60.6–0.4 0.3 2.5
47 28 351.8 .. ..
9,739 3,374 8693,910 2,740 3,944
36.7 38.7 34.8–1.5 0.0 0.09.2 7.5 13.3
71419
6
15.2 5,790 97,437–7.5 –2.9 0.7–1.7 –0.5 9.03.2 10.4 8.4
.. .. 33,350
.. .. 48,783
2,370 3,015 1,9485.1 2.0 8.1
4,476 4,059 2,94254.3 65.4 72.911.0 18.8 21.35.6 7.1 5.5
2,858 12,498 8,55029.1 6.3 5.6
16 60 66100 96 93100 91 86100 99 98100 84 73100 81 62100 87 81
40 21 42.. .. .... .. ..
12 21 20
24.8 26.1 36.412.0 12.3 11.8
4.1 3.6 3.31.1 9.3 5.71.3 0.8 1.60.0 0.0 0.00.7 0.7 0.71.0 0.3 0.7
12.7 6.2 19.2
46 2013 The Little Green Data Book
Country data
Europe & Central
Asia group
Upper middle-income group
Population (millions) 7.3 Land area (1,000 sq. km) 109 GDP ($ billions) 53.5
Bulgaria

GNI per capita, World Bank Atlas method ($)Adjusted net national income per capita ($)Urban population (% of total)Urban population growth (avg. annual %, 1990–2011) AgricultureAgricultural land (% land area)Agricultural irrigated land (% of total agricultural land)Agricultural productivity, value added per worker (2000 $)Cereal yield (kg per hectare) Forests and biodiversityForest area (% land area)Deforestation (avg. annual %, 2000–2010)Terrestrial protected areas (% of total land area)Threatened species, mammalsThreatened species, birdsThreatened species, fishThreatened species, higher plants OceansTotal fisheries production (thousand metric tons)
Capture fisheries growth (avg. annual %, 1990–2011)Aquaculture growth (avg. annual %, 1990–2011)
Marine protected areas (% of territorial waters)Coral reef area (sq. km)Mangroves area (sq. km) Energy and emissionsEnergy use per capita (kg oil equivalent)Energy from biomass products and waste (% of total)Electric power consumption per capita (kWh)Electricity generated using fossil fuel (% of total)Electricity generated by hydropower (% of total)CO2 emissions per capita (metric tons) Water and sanitationInternal freshwater resources per capita (cu. m)Total freshwater withdrawal (% of internal resources)
Agriculture (% of total freshwater withdrawal)Access to improved water source (% of total population)
Rural (% of rural population)Urban (% of urban population)
Access to improved sanitation (% of total population)Rural (% of rural population)Urban (% of urban population)
Environment and healthParticulate matter (urban-pop.-weighted avg., µg/cu. m)Acute resp. infection prevalence (% of children under five)Diarrhea prevalence (% of children under five)Under-five mortality rate (per 1,000 live births) National accounting aggregates—savings, depletion and degradationGross savings (% of GNI)Consumption of fixed capital (% of GNI)Education expenditure (% of GNI)Energy depletion (% of GNI)Mineral depletion (% of GNI)Net forest depletion (% of GNI)CO2 damage (% of GNI)Particulate emissions damage (% of GNI)Adjusted net savings (% of GNI)
580 1,258 571516 1,022 521
26.5 36.5 28.06.0 3.8 3.5
43 44 39.. .. .... 334 308
995 1,361 2,034
20.4 27.8 25.71.0 0.5 0.6
14.2 11.7 10.09943
15.3 6,383 11,5633.7 1.8 4.0
20.0 16.0 4.9.. 5.8 .... 17,980 15,120.. 27,808 25,818
.. 683 363
.. 58.2 66.2
.. 553 242
.. 65.2 32.0
.. 18.7 45.30.1 0.9 0.3
737 4,455 5,1257.9 3.2 4.570 84 9079 61 6573 48 5795 83 8617 31 376 23 32
50 42 47
65 41 54.. .. .... .. ..
146 109 95
15.6 18.4 25.28.0 10.9 7.73.4 3.7 3.00.0 10.4 1.46.4 2.2 2.01.4 0.5 1.20.1 0.5 0.30.8 0.4 0.55.5 –1.2 15.2
47The Little Green Data Book 2013
Country data
Sub-Saharan Africa group
Low-income group
Population (millions) 17.0 Land area (1,000 sq. km) 274 GDP ($ billions) 10.4
Country data
Sub-Saharan Africa group
Low-income group
Burkina Faso

GNI per capita, World Bank Atlas method ($)Adjusted net national income per capita ($)Urban population (% of total)Urban population growth (avg. annual %, 1990–2011) AgricultureAgricultural land (% land area)Agricultural irrigated land (% of total agricultural land)Agricultural productivity, value added per worker (2000 $)Cereal yield (kg per hectare) Forests and biodiversityForest area (% land area)Deforestation (avg. annual %, 2000–2010)Terrestrial protected areas (% of total land area)Threatened species, mammalsThreatened species, birdsThreatened species, fishThreatened species, higher plants OceansTotal fisheries production (thousand metric tons)
Capture fisheries growth (avg. annual %, 1990–2011)Aquaculture growth (avg. annual %, 1990–2011)
Marine protected areas (% of territorial waters)Coral reef area (sq. km)Mangroves area (sq. km) Energy and emissionsEnergy use per capita (kg oil equivalent)Energy from biomass products and waste (% of total)Electric power consumption per capita (kWh)Electricity generated using fossil fuel (% of total)Electricity generated by hydropower (% of total)CO2 emissions per capita (metric tons) Water and sanitationInternal freshwater resources per capita (cu. m)Total freshwater withdrawal (% of internal resources)
Agriculture (% of total freshwater withdrawal)Access to improved water source (% of total population)
Rural (% of rural population)Urban (% of urban population)
Access to improved sanitation (% of total population)Rural (% of rural population)Urban (% of urban population)
Environment and healthParticulate matter (urban-pop.-weighted avg., µg/cu. m)Acute resp. infection prevalence (% of children under five)Diarrhea prevalence (% of children under five)Under-five mortality rate (per 1,000 live births) National accounting aggregates—savings, depletion and degradationGross savings (% of GNI)Consumption of fixed capital (% of GNI)Education expenditure (% of GNI)Energy depletion (% of GNI)Mineral depletion (% of GNI)Net forest depletion (% of GNI)CO2 damage (% of GNI)Particulate emissions damage (% of GNI)Adjusted net savings (% of GNI)
250 1,258 571227 1,022 52110.9 36.5 28.0
4.7 3.8 3.5
86 44 39.. .. ..
86 334 3081,326 1,361 2,034
6.6 27.8 25.71.4 0.5 0.64.8 11.7 10.01112173
10.7 6,383 11,563–2.3 1.8 4.02.5 16.0 4.9
.. 5.8 ..
.. 17,980 15,120
.. 27,808 25,818
.. 683 363
.. 58.2 66.2
.. 553 242
.. 65.2 32.0
.. 18.7 45.30.0 0.9 0.3
1,173 4,455 5,1252.9 3.2 4.577 84 9072 61 6571 48 5783 83 8646 31 3746 23 3249 42 47
24 41 54.. .. .... .. ..
139 109 95
1.7 18.4 25.26.8 10.9 7.78.7 3.7 3.00.0 10.4 1.40.9 2.2 2.08.8 0.5 1.20.1 0.5 0.30.1 0.4 0.5
–6.2 –1.2 15.2
48 2013 The Little Green Data Book
Country data
Sub-Saharan Africa group
Low-income group
Population (millions) 8.6 Land area (1,000 sq. km) 26 GDP ($ billions) 2.3
Country data
Sub-Saharan Africa group
Low-income group
Burundi

GNI per capita, World Bank Atlas method ($)Adjusted net national income per capita ($)Urban population (% of total)Urban population growth (avg. annual %, 1990–2011) AgricultureAgricultural land (% land area)Agricultural irrigated land (% of total agricultural land)Agricultural productivity, value added per worker (2000 $)Cereal yield (kg per hectare) Forests and biodiversityForest area (% land area)Deforestation (avg. annual %, 2000–2010)Terrestrial protected areas (% of total land area)Threatened species, mammalsThreatened species, birdsThreatened species, fishThreatened species, higher plants OceansTotal fisheries production (thousand metric tons)
Capture fisheries growth (avg. annual %, 1990–2011)Aquaculture growth (avg. annual %, 1990–2011)
Marine protected areas (% of territorial waters)Coral reef area (sq. km)Mangroves area (sq. km) Energy and emissionsEnergy use per capita (kg oil equivalent)Energy from biomass products and waste (% of total)Electric power consumption per capita (kWh)Electricity generated using fossil fuel (% of total)Electricity generated by hydropower (% of total)CO2 emissions per capita (metric tons) Water and sanitationInternal freshwater resources per capita (cu. m)Total freshwater withdrawal (% of internal resources)
Agriculture (% of total freshwater withdrawal)Access to improved water source (% of total population)
Rural (% of rural population)Urban (% of urban population)
Access to improved sanitation (% of total population)Rural (% of rural population)Urban (% of urban population)
Environment and healthParticulate matter (urban-pop.-weighted avg., µg/cu. m)Acute resp. infection prevalence (% of children under five)Diarrhea prevalence (% of children under five)Under-five mortality rate (per 1,000 live births) National accounting aggregates—savings, depletion and degradationGross savings (% of GNI)Consumption of fixed capital (% of GNI)Education expenditure (% of GNI)Energy depletion (% of GNI)Mineral depletion (% of GNI)Net forest depletion (% of GNI)CO2 damage (% of GNI)Particulate emissions damage (% of GNI)Adjusted net savings (% of GNI)
820 4,248 571769 3,884 52120.0 48.6 28.0
3.1 3.6 3.5
32 48 39.. .. ..
442 610 3082,925 5,050 2,034
56.5 29.7 25.71.3 –0.4 0.6
25.8 15.0 10.037264032
562 101,299 11,5637.6 3.4 4.0
12.2 9.1 4.90.44 1.4 ..<50 137,690 15,120728 56,537 25,818
355 1,520 36372.0 10.9 66.2146 2,337 24295.1 79.8 32.0
2.6 16.5 45.30.3 4.6 0.3
8,431 4,446 5,1251.8 10.9 4.594 73 9064 90 6558 84 5787 97 8631 66 3720 58 3273 76 47
42 55 5415 .. ..20 .. ..43 21 95
11.2 49.3 25.29.0 11.0 7.71.6 2.1 3.00.0 4.3 1.40.0 1.7 2.00.1 0.0 1.20.3 0.9 0.30.5 1.1 0.53.0 32.2 15.2
49The Little Green Data Book 2013
Country data
East Asia & Pacific
group
Low-income group
Population (millions) 14.3 Land area (1,000 sq. km) 177 GDP ($ billions) 12.8
Cambodia

GNI per capita, World Bank Atlas method ($)Adjusted net national income per capita ($)Urban population (% of total)Urban population growth (avg. annual %, 1990–2011) AgricultureAgricultural land (% land area)Agricultural irrigated land (% of total agricultural land)Agricultural productivity, value added per worker (2000 $)Cereal yield (kg per hectare) Forests and biodiversityForest area (% land area)Deforestation (avg. annual %, 2000–2010)Terrestrial protected areas (% of total land area)Threatened species, mammalsThreatened species, birdsThreatened species, fishThreatened species, higher plants OceansTotal fisheries production (thousand metric tons)
Capture fisheries growth (avg. annual %, 1990–2011)Aquaculture growth (avg. annual %, 1990–2011)
Marine protected areas (% of territorial waters)Coral reef area (sq. km)Mangroves area (sq. km) Energy and emissionsEnergy use per capita (kg oil equivalent)Energy from biomass products and waste (% of total)Electric power consumption per capita (kWh)Electricity generated using fossil fuel (% of total)Electricity generated by hydropower (% of total)CO2 emissions per capita (metric tons) Water and sanitationInternal freshwater resources per capita (cu. m)Total freshwater withdrawal (% of internal resources)
Agriculture (% of total freshwater withdrawal)Access to improved water source (% of total population)
Rural (% of rural population)Urban (% of urban population)
Access to improved sanitation (% of total population)Rural (% of rural population)Urban (% of urban population)
Environment and healthParticulate matter (urban-pop.-weighted avg., µg/cu. m)Acute resp. infection prevalence (% of children under five)Diarrhea prevalence (% of children under five)Under-five mortality rate (per 1,000 live births) National accounting aggregates—savings, depletion and degradationGross savings (% of GNI)Consumption of fixed capital (% of GNI)Education expenditure (% of GNI)Energy depletion (% of GNI)Mineral depletion (% of GNI)Net forest depletion (% of GNI)CO2 damage (% of GNI)Particulate emissions damage (% of GNI)Adjusted net savings (% of GNI)
1,210 1,258 1,7721,065 1,022 1,595
52.1 36.5 38.73.7 3.8 2.7
20 44 46.. .. ..
685 334 7161,768 1,361 3,065
41.7 27.8 28.41.0 0.5 0.39.2 11.7 9.93824
111376
141 6,383 40,2383.3 1.8 2.4
10.3 16.0 10.00.39 5.8 2.9
.. 17,980 143,4401,962 27,808 60,301
363 683 66762.3 58.2 26.2271 553 698
26.8 65.2 73.072.2 18.7 17.4
0.3 0.9 1.6
13,629 4,455 3,1210.4 3.2 20.276 84 8877 61 8752 48 8495 83 9349 31 4736 23 3558 42 66
59 41 53.. .. .... .. ..
127 109 62
12.4 18.4 29.79.1 10.9 9.93.1 3.7 3.15.2 10.4 6.30.2 2.2 1.20.0 0.5 0.30.2 0.5 0.70.7 0.4 0.60.8 –1.2 14.7
50 2013 The Little Green Data Book
Country data
Sub-Saharan Africa group
Lower middle-income group
Population (millions) 20.0 Land area (1,000 sq. km) 473 GDP ($ billions) 25.2
Cameroon

GNI per capita, World Bank Atlas method ($)Adjusted net national income per capita ($)Urban population (% of total)Urban population growth (avg. annual %, 1990–2011) AgricultureAgricultural land (% land area)Agricultural irrigated land (% of total agricultural land)Agricultural productivity, value added per worker (2000 $)Cereal yield (kg per hectare) Forests and biodiversityForest area (% land area)Deforestation (avg. annual %, 2000–2010)Terrestrial protected areas (% of total land area)Threatened species, mammalsThreatened species, birdsThreatened species, fishThreatened species, higher plants OceansTotal fisheries production (thousand metric tons)
Capture fisheries growth (avg. annual %, 1990–2011)Aquaculture growth (avg. annual %, 1990–2011)
Marine protected areas (% of territorial waters)Coral reef area (sq. km)Mangroves area (sq. km) Energy and emissionsEnergy use per capita (kg oil equivalent)Energy from biomass products and waste (% of total)Electric power consumption per capita (kWh)Electricity generated using fossil fuel (% of total)Electricity generated by hydropower (% of total)CO2 emissions per capita (metric tons) Water and sanitationInternal freshwater resources per capita (cu. m)Total freshwater withdrawal (% of internal resources)
Agriculture (% of total freshwater withdrawal)Access to improved water source (% of total population)
Rural (% of rural population)Urban (% of urban population)
Access to improved sanitation (% of total population)Rural (% of rural population)Urban (% of urban population)
Environment and healthParticulate matter (urban-pop.-weighted avg., µg/cu. m)Acute resp. infection prevalence (% of children under five)Diarrhea prevalence (% of children under five)Under-five mortality rate (per 1,000 live births) National accounting aggregates—savings, depletion and degradationGross savings (% of GNI)Consumption of fixed capital (% of GNI)Education expenditure (% of GNI)Energy depletion (% of GNI)Mineral depletion (% of GNI)Net forest depletion (% of GNI)CO2 damage (% of GNI)Particulate emissions damage (% of GNI)Adjusted net savings (% of GNI)
45,550 39,86040,811 34,611
80.7 80.51.3 1.1
7 371.2 ..
50,579 26,5153,527 5,349
34.1 28.40.0 0.07.5 12.9111635
1
1,039 28,774–3.1 –1.76.7 1.81.2 16.5
.. 81,970
.. 15,496
7,380 5,0004.8 4.4
15,137 9,41524.2 62.057.8 11.215.2 11.4
82,647 8,1951.6 10.312 41
100 10099 98
100 100100 10099 99
100 100
15 22.. .... ..6 6
20.0 17.914.5 13.94.5 4.62.3 1.40.7 0.20.0 0.00.3 0.20.0 0.16.7 6.6
51The Little Green Data Book 2013
Country data
High-income group
Population (millions) 34.5 Land area (1,000 sq. km) 9,094 GDP ($ billions) 1,736.1
Canada

GNI per capita, World Bank Atlas method ($)Adjusted net national income per capita ($)Urban population (% of total)Urban population growth (avg. annual %, 1990–2011) AgricultureAgricultural land (% land area)Agricultural irrigated land (% of total agricultural land)Agricultural productivity, value added per worker (2000 $)Cereal yield (kg per hectare) Forests and biodiversityForest area (% land area)Deforestation (avg. annual %, 2000–2010)Terrestrial protected areas (% of total land area)Threatened species, mammalsThreatened species, birdsThreatened species, fishThreatened species, higher plants OceansTotal fisheries production (thousand metric tons)
Capture fisheries growth (avg. annual %, 1990–2011)Aquaculture growth (avg. annual %, 1990–2011)
Marine protected areas (% of territorial waters)Coral reef area (sq. km)Mangroves area (sq. km) Energy and emissionsEnergy use per capita (kg oil equivalent)Energy from biomass products and waste (% of total)Electric power consumption per capita (kWh)Electricity generated using fossil fuel (% of total)Electricity generated by hydropower (% of total)CO2 emissions per capita (metric tons) Water and sanitationInternal freshwater resources per capita (cu. m)Total freshwater withdrawal (% of internal resources)
Agriculture (% of total freshwater withdrawal)Access to improved water source (% of total population)
Rural (% of rural population)Urban (% of urban population)
Access to improved sanitation (% of total population)Rural (% of rural population)Urban (% of urban population)
Environment and healthParticulate matter (urban-pop.-weighted avg., µg/cu. m)Acute resp. infection prevalence (% of children under five)Diarrhea prevalence (% of children under five)Under-five mortality rate (per 1,000 live births) National accounting aggregates—savings, depletion and degradationGross savings (% of GNI)Consumption of fixed capital (% of GNI)Education expenditure (% of GNI)Energy depletion (% of GNI)Mineral depletion (% of GNI)Net forest depletion (% of GNI)CO2 damage (% of GNI)Particulate emissions damage (% of GNI)Adjusted net savings (% of GNI)
3,540 1,258 1,7723,284 1,022 1,595
62.6 36.5 38.73.4 3.8 2.7
19 44 46.. .. ..
3,335 334 716178 1,361 3,065
21.0 27.8 28.4–0.4 0.5 0.32.5 11.7 9.9
34
243
22.5 6,383 40,2386.0 1.8 2.4
.. 16.0 10.00.0 5.8 2.9
.. 17,980 143,440
.. 27,808 60,301
213 683 667.. 58.2 26.2.. 553 698.. 65.2 73.0.. 18.7 17.4
0.6 0.9 1.6
599 4,455 3,1217.3 3.2 20.291 84 8888 61 8785 48 8490 83 9361 31 4743 23 3573 42 66
.. 41 53
.. .. ..
.. .. ..21 109 62
22.8 18.4 29.710.9 10.9 9.94.9 3.7 3.10.0 10.4 6.30.0 2.2 1.20.1 0.5 0.30.2 0.5 0.7
.. 0.4 0.616.7 –1.2 14.7
52 2013 The Little Green Data Book
Country data
Sub-Saharan Africa group
Lower middle-income group
Population (thousands) 501 Land area (1,000 sq. km) 4.0 GDP ($ billions) 1.9
Cape Verde

GNI per capita, World Bank Atlas method ($)Adjusted net national income per capita ($)Urban population (% of total)Urban population growth (avg. annual %, 1990–2011) AgricultureAgricultural land (% land area)Agricultural irrigated land (% of total agricultural land)Agricultural productivity, value added per worker (2000 $)Cereal yield (kg per hectare) Forests and biodiversityForest area (% land area)Deforestation (avg. annual %, 2000–2010)Terrestrial protected areas (% of total land area)Threatened species, mammalsThreatened species, birdsThreatened species, fishThreatened species, higher plants OceansTotal fisheries production (thousand metric tons)
Capture fisheries growth (avg. annual %, 1990–2011)Aquaculture growth (avg. annual %, 1990–2011)
Marine protected areas (% of territorial waters)Coral reef area (sq. km)Mangroves area (sq. km) Energy and emissionsEnergy use per capita (kg oil equivalent)Energy from biomass products and waste (% of total)Electric power consumption per capita (kWh)Electricity generated using fossil fuel (% of total)Electricity generated by hydropower (% of total)CO2 emissions per capita (metric tons) Water and sanitationInternal freshwater resources per capita (cu. m)Total freshwater withdrawal (% of internal resources)
Agriculture (% of total freshwater withdrawal)Access to improved water source (% of total population)
Rural (% of rural population)Urban (% of urban population)
Access to improved sanitation (% of total population)Rural (% of rural population)Urban (% of urban population)
Environment and healthParticulate matter (urban-pop.-weighted avg., µg/cu. m)Acute resp. infection prevalence (% of children under five)Diarrhea prevalence (% of children under five)Under-five mortality rate (per 1,000 live births) National accounting aggregates—savings, depletion and degradationGross savings (% of GNI)Consumption of fixed capital (% of GNI)Education expenditure (% of GNI)Energy depletion (% of GNI)Mineral depletion (% of GNI)Net forest depletion (% of GNI)CO2 damage (% of GNI)Particulate emissions damage (% of GNI)Adjusted net savings (% of GNI)
.. 39,860
.. 34,611100.0 80.5
3.7 1.1
11 37.. .... 26,515.. 5,349
52.9 28.40.0 0.08.7 12.9
11
192
0.13 28,774–8.7 –1.7
.. 1.81.2 16.5
230 81,97078.3 15,496
.. 5,000
.. 4.4
.. 9,415
.. 62.0
.. 11.29.2 11.4
.. 8,195
.. 10.3
.. 4196 100
.. 9896 10096 100
.. 9996 100
.. 22
.. ..
.. ..
.. 6
.. 17.9
.. 13.9
.. 4.6
.. 1.4
.. 0.2
.. 0.0
.. 0.2
.. 0.1
.. 6.6
53The Little Green Data Book 2013
Country data
High-income group
Population (thousands) 57 Land area (sq. km) 240 GDP ($ millions) ..
Cayman Islands

GNI per capita, World Bank Atlas method ($)Adjusted net national income per capita ($)Urban population (% of total)Urban population growth (avg. annual %, 1990–2011) AgricultureAgricultural land (% land area)Agricultural irrigated land (% of total agricultural land)Agricultural productivity, value added per worker (2000 $)Cereal yield (kg per hectare) Forests and biodiversityForest area (% land area)Deforestation (avg. annual %, 2000–2010)Terrestrial protected areas (% of total land area)Threatened species, mammalsThreatened species, birdsThreatened species, fishThreatened species, higher plants OceansTotal fisheries production (thousand metric tons)
Capture fisheries growth (avg. annual %, 1990–2011)Aquaculture growth (avg. annual %, 1990–2011)
Marine protected areas (% of territorial waters)Coral reef area (sq. km)Mangroves area (sq. km) Energy and emissionsEnergy use per capita (kg oil equivalent)Energy from biomass products and waste (% of total)Electric power consumption per capita (kWh)Electricity generated using fossil fuel (% of total)Electricity generated by hydropower (% of total)CO2 emissions per capita (metric tons) Water and sanitationInternal freshwater resources per capita (cu. m)Total freshwater withdrawal (% of internal resources)
Agriculture (% of total freshwater withdrawal)Access to improved water source (% of total population)
Rural (% of rural population)Urban (% of urban population)
Access to improved sanitation (% of total population)Rural (% of rural population)Urban (% of urban population)
Environment and healthParticulate matter (urban-pop.-weighted avg., µg/cu. m)Acute resp. infection prevalence (% of children under five)Diarrhea prevalence (% of children under five)Under-five mortality rate (per 1,000 live births) National accounting aggregates—savings, depletion and degradationGross savings (% of GNI)Consumption of fixed capital (% of GNI)Education expenditure (% of GNI)Energy depletion (% of GNI)Mineral depletion (% of GNI)Net forest depletion (% of GNI)CO2 damage (% of GNI)Particulate emissions damage (% of GNI)Adjusted net savings (% of GNI)
480 1,258 571450 1,022 52139.1 36.5 28.02.3 3.8 3.5
8 44 39.. .. ..
418 334 3081,522 1,361 2,034
36.2 27.8 25.70.1 0.5 0.6
17.7 11.7 10.08
133
17
35.2 6,383 11,5634.8 1.8 4.02.3 16.0 4.9
.. 5.8 ..
.. 17,980 15,120
.. 27,808 25,818
.. 683 363
.. 58.2 66.2
.. 553 242
.. 65.2 32.0
.. 18.7 45.30.1 0.9 0.3
31,425 4,455 5,1250.0 3.2 4.5
1 84 9067 61 6551 48 5792 83 8634 31 3728 23 3243 42 47
35 41 54.. .. .... .. ..
164 109 95
.. 18.4 25.27.7 10.9 7.71.1 3.7 3.00.0 10.4 1.40.1 2.2 2.00.0 0.5 1.20.1 0.5 0.30.2 0.4 0.5
.. –1.2 15.2
54 2013 The Little Green Data Book
Country data
Sub-Saharan Africa group
Low-income group
Population (millions) 4.5 Land area (1,000 sq. km) 623 GDP ($ billions) 2.2
Central African Republic

GNI per capita, World Bank Atlas method ($)Adjusted net national income per capita ($)Urban population (% of total)Urban population growth (avg. annual %, 1990–2011) AgricultureAgricultural land (% land area)Agricultural irrigated land (% of total agricultural land)Agricultural productivity, value added per worker (2000 $)Cereal yield (kg per hectare) Forests and biodiversityForest area (% land area)Deforestation (avg. annual %, 2000–2010)Terrestrial protected areas (% of total land area)Threatened species, mammalsThreatened species, birdsThreatened species, fishThreatened species, higher plants OceansTotal fisheries production (thousand metric tons)
Capture fisheries growth (avg. annual %, 1990–2011)Aquaculture growth (avg. annual %, 1990–2011)
Marine protected areas (% of territorial waters)Coral reef area (sq. km)Mangroves area (sq. km) Energy and emissionsEnergy use per capita (kg oil equivalent)Energy from biomass products and waste (% of total)Electric power consumption per capita (kWh)Electricity generated using fossil fuel (% of total)Electricity generated by hydropower (% of total)CO2 emissions per capita (metric tons) Water and sanitationInternal freshwater resources per capita (cu. m)Total freshwater withdrawal (% of internal resources)
Agriculture (% of total freshwater withdrawal)Access to improved water source (% of total population)
Rural (% of rural population)Urban (% of urban population)
Access to improved sanitation (% of total population)Rural (% of rural population)Urban (% of urban population)
Environment and healthParticulate matter (urban-pop.-weighted avg., µg/cu. m)Acute resp. infection prevalence (% of children under five)Diarrhea prevalence (% of children under five)Under-five mortality rate (per 1,000 live births) National accounting aggregates—savings, depletion and degradationGross savings (% of GNI)Consumption of fixed capital (% of GNI)Education expenditure (% of GNI)Energy depletion (% of GNI)Mineral depletion (% of GNI)Net forest depletion (% of GNI)CO2 damage (% of GNI)Particulate emissions damage (% of GNI)Adjusted net savings (% of GNI)
720 1,258 571543 1,022 52121.8 36.5 28.03.3 3.8 3.5
40 44 39.. .. .... 334 308
888 1,361 2,034
9.1 27.8 25.70.7 0.5 0.69.4 11.7 10.0131113
60.0 6,383 11,563–0.7 1.8 4.0
.. 16.0 4.9
.. 5.8 ..
.. 17,980 15,120
.. 27,808 25,818
.. 683 363
.. 58.2 66.2
.. 553 242
.. 65.2 32.0
.. 18.7 45.30.0 0.9 0.3
1,301 4,455 5,1252.4 3.2 4.552 84 9051 61 6544 48 5770 83 8613 31 37
6 23 3230 42 47
83 41 54.. .. .... .. ..
169 109 95
.. 18.4 25.29.4 10.9 7.72.3 3.7 3.0
25.3 10.4 1.40.0 2.2 2.00.0 0.5 1.20.0 0.5 0.31.2 0.4 0.5
.. –1.2 15.2
55The Little Green Data Book 2013
Country data
Sub-Saharan Africa group
Low-income group
Population (millions) 11.5 Land area (1,000 sq. km) 1,259 GDP ($ billions) 10.6
Chad

GNI per capita, World Bank Atlas method ($)Adjusted net national income per capita ($)Urban population (% of total)Urban population growth (avg. annual %, 1990–2011) AgricultureAgricultural land (% land area)Agricultural irrigated land (% of total agricultural land)Agricultural productivity, value added per worker (2000 $)Cereal yield (kg per hectare) Forests and biodiversityForest area (% land area)Deforestation (avg. annual %, 2000–2010)Terrestrial protected areas (% of total land area)Threatened species, mammalsThreatened species, birdsThreatened species, fishThreatened species, higher plants OceansTotal fisheries production (thousand metric tons)
Capture fisheries growth (avg. annual %, 1990–2011)Aquaculture growth (avg. annual %, 1990–2011)
Marine protected areas (% of territorial waters)Coral reef area (sq. km)Mangroves area (sq. km) Energy and emissionsEnergy use per capita (kg oil equivalent)Energy from biomass products and waste (% of total)Electric power consumption per capita (kWh)Electricity generated using fossil fuel (% of total)Electricity generated by hydropower (% of total)CO2 emissions per capita (metric tons) Water and sanitationInternal freshwater resources per capita (cu. m)Total freshwater withdrawal (% of internal resources)
Agriculture (% of total freshwater withdrawal)Access to improved water source (% of total population)
Rural (% of rural population)Urban (% of urban population)
Access to improved sanitation (% of total population)Rural (% of rural population)Urban (% of urban population)
Environment and healthParticulate matter (urban-pop.-weighted avg., µg/cu. m)Acute resp. infection prevalence (% of children under five)Diarrhea prevalence (% of children under five)Under-five mortality rate (per 1,000 live births) National accounting aggregates—savings, depletion and degradationGross savings (% of GNI)Consumption of fixed capital (% of GNI)Education expenditure (% of GNI)Energy depletion (% of GNI)Mineral depletion (% of GNI)Net forest depletion (% of GNI)CO2 damage (% of GNI)Particulate emissions damage (% of GNI)Adjusted net savings (% of GNI)
67,960 39,860.. 34,611
31.2 80.50.4 1.1
51 374.3 ..
.. 26,515
.. 5,349
4.2 28.4.. 0.0
9.3 12.9........
4.0 28,774–0.2 –1.714.2 1.80.02 16.5
.. 81,970
.. 15,496
.. 5,000
.. 4.4
.. 9,415
.. 62.0
.. 11.2
.. 11.4
.. 8,195
.. 10.3
.. 41
.. 100
.. 98
.. 100
.. 100
.. 99
.. 100
.. 22
.. ..
.. ..
.. 6
.. 17.914.5 13.9
.. 4.60.0 1.40.0 0.2
.. 0.0
.. 0.2
.. 0.1
.. 6.6
56 2013 The Little Green Data Book
Country data
High-income group
Population (thousands) 154 Land area (sq. km) 190 GDP ($ billions) 11.5
Channel Islands

GNI per capita, World Bank Atlas method ($)Adjusted net national income per capita ($)Urban population (% of total)Urban population growth (avg. annual %, 1990–2011) AgricultureAgricultural land (% land area)Agricultural irrigated land (% of total agricultural land)Agricultural productivity, value added per worker (2000 $)Cereal yield (kg per hectare) Forests and biodiversityForest area (% land area)Deforestation (avg. annual %, 2000–2010)Terrestrial protected areas (% of total land area)Threatened species, mammalsThreatened species, birdsThreatened species, fishThreatened species, higher plants OceansTotal fisheries production (thousand metric tons)
Capture fisheries growth (avg. annual %, 1990–2011)Aquaculture growth (avg. annual %, 1990–2011)
Marine protected areas (% of territorial waters)Coral reef area (sq. km)Mangroves area (sq. km) Energy and emissionsEnergy use per capita (kg oil equivalent)Energy from biomass products and waste (% of total)Electric power consumption per capita (kWh)Electricity generated using fossil fuel (% of total)Electricity generated by hydropower (% of total)CO2 emissions per capita (metric tons) Water and sanitationInternal freshwater resources per capita (cu. m)Total freshwater withdrawal (% of internal resources)
Agriculture (% of total freshwater withdrawal)Access to improved water source (% of total population)
Rural (% of rural population)Urban (% of urban population)
Access to improved sanitation (% of total population)Rural (% of rural population)Urban (% of urban population)
Environment and healthParticulate matter (urban-pop.-weighted avg., µg/cu. m)Acute resp. infection prevalence (% of children under five)Diarrhea prevalence (% of children under five)Under-five mortality rate (per 1,000 live births) National accounting aggregates—savings, depletion and degradationGross savings (% of GNI)Consumption of fixed capital (% of GNI)Education expenditure (% of GNI)Energy depletion (% of GNI)Mineral depletion (% of GNI)Net forest depletion (% of GNI)CO2 damage (% of GNI)Particulate emissions damage (% of GNI)Adjusted net savings (% of GNI)
12,280 8,574 6,56310,103 7,648 5,821
89.1 79.1 60.61.6 2.0 2.5
21 37 355.6 .. ..
6,882 3,448 8696,934 3,838 3,944
21.9 46.8 34.8–0.2 0.4 0.016.6 20.2 13.3
20332034
4,436 19,009 97,437–2.0 0.1 0.713.3 11.8 9.0
3.7 13.1 8.4.. 15,100 33,350.. 39,997 48,783
1,807 1,312 1,94815.9 16.7 8.1
3,297 1,973 2,94259.6 39.0 72.935.9 53.7 21.3
3.9 2.7 5.5
51,188 22,810 8,5501.3 2.0 5.670 68 6696 94 9375 81 8699 98 9896 79 7383 59 6298 84 81
46 28 42.. .. .... .. ..9 19 20
26.8 21.1 36.413.2 12.2 11.8
4.6 5.0 3.30.1 4.5 5.7
12.3 1.9 1.60.0 0.0 0.00.2 0.2 0.70.5 0.3 0.75.4 6.8 19.2
57The Little Green Data Book 2013
Country data
Latin America & Caribbean
group
Upper middle-income group
Population (millions) 17.3 Land area (1,000 sq. km) 744 GDP ($ billions) 248.6
Chile

GNI per capita, World Bank Atlas method ($)Adjusted net national income per capita ($)Urban population (% of total)Urban population growth (avg. annual %, 1990–2011) AgricultureAgricultural land (% land area)Agricultural irrigated land (% of total agricultural land)Agricultural productivity, value added per worker (2000 $)Cereal yield (kg per hectare) Forests and biodiversityForest area (% land area)Deforestation (avg. annual %, 2000–2010)Terrestrial protected areas (% of total land area)Threatened species, mammalsThreatened species, birdsThreatened species, fishThreatened species, higher plants OceansTotal fisheries production (thousand metric tons)
Capture fisheries growth (avg. annual %, 1990–2011)Aquaculture growth (avg. annual %, 1990–2011)
Marine protected areas (% of territorial waters)Coral reef area (sq. km)Mangroves area (sq. km) Energy and emissionsEnergy use per capita (kg oil equivalent)Energy from biomass products and waste (% of total)Electric power consumption per capita (kWh)Electricity generated using fossil fuel (% of total)Electricity generated by hydropower (% of total)CO2 emissions per capita (metric tons) Water and sanitationInternal freshwater resources per capita (cu. m)Total freshwater withdrawal (% of internal resources)
Agriculture (% of total freshwater withdrawal)Access to improved water source (% of total population)
Rural (% of rural population)Urban (% of urban population)
Access to improved sanitation (% of total population)Rural (% of rural population)Urban (% of urban population)
Environment and healthParticulate matter (urban-pop.-weighted avg., µg/cu. m)Acute resp. infection prevalence (% of children under five)Diarrhea prevalence (% of children under five)Under-five mortality rate (per 1,000 live births) National accounting aggregates—savings, depletion and degradationGross savings (% of GNI)Consumption of fixed capital (% of GNI)Education expenditure (% of GNI)Energy depletion (% of GNI)Mineral depletion (% of GNI)Net forest depletion (% of GNI)CO2 damage (% of GNI)Particulate emissions damage (% of GNI)Adjusted net savings (% of GNI)
4,940 4,248 6,5634,503 3,884 5,821
50.5 48.6 60.63.9 3.6 2.5
56 48 3510.3 .. ..571 610 869
5,706 5,050 3,944
22.5 29.7 34.8–1.6 –0.4 0.016.6 15.0 13.3
7587
120382
66,219 101,299 97,4374.2 3.4 0.79.2 9.1 9.01.3 1.4 8.4
1,510 137,690 33,350208 56,537 48,783
1,807 1,520 1,9488.5 10.9 8.1
2,944 2,337 2,94279.7 79.8 72.917.2 16.5 21.35.8 4.6 5.5
2,093 4,446 8,55019.7 10.9 5.6
65 73 6691 90 9385 84 8698 97 9864 66 7356 58 6274 76 81
59 55 42.. .. .... .. ..
15 21 20
52.8 49.3 36.411.1 11.0 11.81.8 2.1 3.34.2 4.3 5.71.9 1.7 1.60.0 0.0 0.01.0 0.9 0.71.3 1.1 0.7
35.1 32.2 19.2
58 2013 The Little Green Data Book
Country data
East Asia & Pacific
group
Upper middle-income group
Population (millions) 1,344.1 Land area (1,000 sq. km) 9,327 GDP ($ billions) 7,318.5
China

GNI per capita, World Bank Atlas method ($)Adjusted net national income per capita ($)Urban population (% of total)Urban population growth (avg. annual %, 1990–2011) AgricultureAgricultural land (% land area)Agricultural irrigated land (% of total agricultural land)Agricultural productivity, value added per worker (2000 $)Cereal yield (kg per hectare) Forests and biodiversityForest area (% land area)Deforestation (avg. annual %, 2000–2010)Terrestrial protected areas (% of total land area)Threatened species, mammalsThreatened species, birdsThreatened species, fishThreatened species, higher plants OceansTotal fisheries production (thousand metric tons)
Capture fisheries growth (avg. annual %, 1990–2011)Aquaculture growth (avg. annual %, 1990–2011)
Marine protected areas (% of territorial waters)Coral reef area (sq. km)Mangroves area (sq. km) Energy and emissionsEnergy use per capita (kg oil equivalent)Energy from biomass products and waste (% of total)Electric power consumption per capita (kWh)Electricity generated using fossil fuel (% of total)Electricity generated by hydropower (% of total)CO2 emissions per capita (metric tons) Water and sanitationInternal freshwater resources per capita (cu. m)Total freshwater withdrawal (% of internal resources)
Agriculture (% of total freshwater withdrawal)Access to improved water source (% of total population)
Rural (% of rural population)Urban (% of urban population)
Access to improved sanitation (% of total population)Rural (% of rural population)Urban (% of urban population)
Environment and healthParticulate matter (urban-pop.-weighted avg., µg/cu. m)Acute resp. infection prevalence (% of children under five)Diarrhea prevalence (% of children under five)Under-five mortality rate (per 1,000 live births) National accounting aggregates—savings, depletion and degradationGross savings (% of GNI)Consumption of fixed capital (% of GNI)Education expenditure (% of GNI)Energy depletion (% of GNI)Mineral depletion (% of GNI)Net forest depletion (% of GNI)CO2 damage (% of GNI)Particulate emissions damage (% of GNI)Adjusted net savings (% of GNI)
6,070 8,574 6,5635,251 7,648 5,82175.3 79.1 60.6
2.1 2.0 2.5
39 37 35.. .. ..
2,979 3,448 8694,033 3,838 3,944
54.4 46.8 34.80.2 0.4 0.0
20.9 20.2 13.353
11254
215
169 19,009 97,437–1.6 0.1 0.710.4 11.8 9.015.5 13.1 8.4940 15,100 33,350
4,079 39,997 48,783
696 1,312 1,94810.3 16.7 8.1
1,012 1,973 2,94227.9 39.0 72.971.1 53.7 21.31.6 2.7 5.5
45,006 22,810 8,5500.6 2.0 5.639 68 6692 94 9372 81 8699 98 9877 79 7363 59 6282 84 81
19 28 426 .. ..
13 .. ..18 19 20
20.0 21.1 36.412.0 12.2 11.83.9 5.0 3.39.7 4.5 5.70.8 1.9 1.60.0 0.0 0.00.2 0.2 0.70.1 0.3 0.71.2 6.8 19.2
59The Little Green Data Book 2013
Country data
Latin America & Caribbean
group
Upper middle-income group
Population (millions) 46.9 Land area (1,000 sq. km) 1,110 GDP ($ billions) 333.4
Colombia

GNI per capita, World Bank Atlas method ($)Adjusted net national income per capita ($)Urban population (% of total)Urban population growth (avg. annual %, 1990–2011) AgricultureAgricultural land (% land area)Agricultural irrigated land (% of total agricultural land)Agricultural productivity, value added per worker (2000 $)Cereal yield (kg per hectare) Forests and biodiversityForest area (% land area)Deforestation (avg. annual %, 2000–2010)Terrestrial protected areas (% of total land area)Threatened species, mammalsThreatened species, birdsThreatened species, fishThreatened species, higher plants OceansTotal fisheries production (thousand metric tons)
Capture fisheries growth (avg. annual %, 1990–2011)Aquaculture growth (avg. annual %, 1990–2011)
Marine protected areas (% of territorial waters)Coral reef area (sq. km)Mangroves area (sq. km) Energy and emissionsEnergy use per capita (kg oil equivalent)Energy from biomass products and waste (% of total)Electric power consumption per capita (kWh)Electricity generated using fossil fuel (% of total)Electricity generated by hydropower (% of total)CO2 emissions per capita (metric tons) Water and sanitationInternal freshwater resources per capita (cu. m)Total freshwater withdrawal (% of internal resources)
Agriculture (% of total freshwater withdrawal)Access to improved water source (% of total population)
Rural (% of rural population)Urban (% of urban population)
Access to improved sanitation (% of total population)Rural (% of rural population)Urban (% of urban population)
Environment and healthParticulate matter (urban-pop.-weighted avg., µg/cu. m)Acute resp. infection prevalence (% of children under five)Diarrhea prevalence (% of children under five)Under-five mortality rate (per 1,000 live births) National accounting aggregates—savings, depletion and degradationGross savings (% of GNI)Consumption of fixed capital (% of GNI)Education expenditure (% of GNI)Energy depletion (% of GNI)Mineral depletion (% of GNI)Net forest depletion (% of GNI)CO2 damage (% of GNI)Particulate emissions damage (% of GNI)Adjusted net savings (% of GNI)
770 1,258 571732 1,022 52128.1 36.5 28.0
2.6 3.8 3.5
83 44 39.. .. ..
551 334 3081,411 1,361 2,034
1.4 27.8 25.79.3 0.5 0.60.0 11.7 10.0
5964
25.1 6,383 11,5633.5 1.8 4.0
.. 16.0 4.93.2 5.8 ..
430 17,980 15,1201.2 27,808 25,818
60 683 363.. 58.2 66.2.. 553 242.. 65.2 32.0.. 18.7 45.3
0.2 0.9 0.3
1,592 4,455 5,1250.8 3.2 4.547 84 9095 61 6597 48 5791 83 8636 31 3730 23 3250 42 47
30 41 54.. .. .... .. ..
79 109 95
.. 18.4 25.28.4 10.9 7.74.2 3.7 3.00.0 10.4 1.40.0 2.2 2.01.1 0.5 1.20.2 0.5 0.30.0 0.4 0.5
.. –1.2 15.2
60 2013 The Little Green Data Book
Country data
Sub-Saharan Africa group
Low-income group
Population (thousands) 754 Land area (1,000 sq. km) 1.9 GDP ($ millions) 610.4
Comoros

GNI per capita, World Bank Atlas method ($)Adjusted net national income per capita ($)Urban population (% of total)Urban population growth (avg. annual %, 1990–2011) AgricultureAgricultural land (% land area)Agricultural irrigated land (% of total agricultural land)Agricultural productivity, value added per worker (2000 $)Cereal yield (kg per hectare) Forests and biodiversityForest area (% land area)Deforestation (avg. annual %, 2000–2010)Terrestrial protected areas (% of total land area)Threatened species, mammalsThreatened species, birdsThreatened species, fishThreatened species, higher plants OceansTotal fisheries production (thousand metric tons)
Capture fisheries growth (avg. annual %, 1990–2011)Aquaculture growth (avg. annual %, 1990–2011)
Marine protected areas (% of territorial waters)Coral reef area (sq. km)Mangroves area (sq. km) Energy and emissionsEnergy use per capita (kg oil equivalent)Energy from biomass products and waste (% of total)Electric power consumption per capita (kWh)Electricity generated using fossil fuel (% of total)Electricity generated by hydropower (% of total)CO2 emissions per capita (metric tons) Water and sanitationInternal freshwater resources per capita (cu. m)Total freshwater withdrawal (% of internal resources)
Agriculture (% of total freshwater withdrawal)Access to improved water source (% of total population)
Rural (% of rural population)Urban (% of urban population)
Access to improved sanitation (% of total population)Rural (% of rural population)Urban (% of urban population)
Environment and healthParticulate matter (urban-pop.-weighted avg., µg/cu. m)Acute resp. infection prevalence (% of children under five)Diarrhea prevalence (% of children under five)Under-five mortality rate (per 1,000 live births) National accounting aggregates—savings, depletion and degradationGross savings (% of GNI)Consumption of fixed capital (% of GNI)Education expenditure (% of GNI)Energy depletion (% of GNI)Mineral depletion (% of GNI)Net forest depletion (% of GNI)CO2 damage (% of GNI)Particulate emissions damage (% of GNI)Adjusted net savings (% of GNI)
190 1,258 571159 1,022 521
34.3 36.5 28.04.0 3.8 3.5
11 44 39.. .. ..
179 334 308766 1,361 2,034
67.9 27.8 25.70.2 0.5 0.6
10.0 11.7 10.030358385
239 6,383 11,5631.8 1.8 4.07.1 16.0 4.94.4 5.8 ..
.. 17,980 15,120193 27,808 25,818
360 683 36393.4 58.2 66.2
95 553 2420.4 65.2 32.0
99.6 18.7 45.30.0 0.9 0.3
13,283 4,455 5,1250.1 3.2 4.518 84 9045 61 6527 48 5779 83 8624 31 3724 23 3224 42 47
35 41 54.. .. ..
16 .. ..168 109 95
.. 18.4 25.27.2 10.9 7.72.4 3.7 3.03.0 10.4 1.4
15.0 2.2 2.00.0 0.5 1.20.2 0.5 0.30.6 0.4 0.5
.. –1.2 15.2
61The Little Green Data Book 2013
Country data
Sub-Saharan Africa group
Low-income group
Population (millions) 67.8 Land area (1,000 sq. km) 2,267 GDP ($ billions) 15.7
Congo, Dem. Rep.

GNI per capita, World Bank Atlas method ($)Adjusted net national income per capita ($)Urban population (% of total)Urban population growth (avg. annual %, 1990–2011) AgricultureAgricultural land (% land area)Agricultural irrigated land (% of total agricultural land)Agricultural productivity, value added per worker (2000 $)Cereal yield (kg per hectare) Forests and biodiversityForest area (% land area)Deforestation (avg. annual %, 2000–2010)Terrestrial protected areas (% of total land area)Threatened species, mammalsThreatened species, birdsThreatened species, fishThreatened species, higher plants OceansTotal fisheries production (thousand metric tons)
Capture fisheries growth (avg. annual %, 1990–2011)Aquaculture growth (avg. annual %, 1990–2011)
Marine protected areas (% of territorial waters)Coral reef area (sq. km)Mangroves area (sq. km) Energy and emissionsEnergy use per capita (kg oil equivalent)Energy from biomass products and waste (% of total)Electric power consumption per capita (kWh)Electricity generated using fossil fuel (% of total)Electricity generated by hydropower (% of total)CO2 emissions per capita (metric tons) Water and sanitationInternal freshwater resources per capita (cu. m)Total freshwater withdrawal (% of internal resources)
Agriculture (% of total freshwater withdrawal)Access to improved water source (% of total population)
Rural (% of rural population)Urban (% of urban population)
Access to improved sanitation (% of total population)Rural (% of rural population)Urban (% of urban population)
Environment and healthParticulate matter (urban-pop.-weighted avg., µg/cu. m)Acute resp. infection prevalence (% of children under five)Diarrhea prevalence (% of children under five)Under-five mortality rate (per 1,000 live births) National accounting aggregates—savings, depletion and degradationGross savings (% of GNI)Consumption of fixed capital (% of GNI)Education expenditure (% of GNI)Energy depletion (% of GNI)Mineral depletion (% of GNI)Net forest depletion (% of GNI)CO2 damage (% of GNI)Particulate emissions damage (% of GNI)Adjusted net savings (% of GNI)
2,250 1,258 1,772469 1,022 1,59563.6 36.5 38.7
3.4 3.8 2.7
31 44 46.. .. ..
577 334 716814 1,361 3,065
65.6 27.8 28.40.1 0.5 0.39.4 11.7 9.9114
4537
73.3 6,383 40,2382.0 1.8 2.4
–5.8 16.0 10.032.8 5.8 2.9
.. 17,980 143,44016.7 27,808 60,301
363 683 66751.7 58.2 26.2145 553 69823.1 65.2 73.076.9 18.7 17.4
0.5 0.9 1.6
53,626 4,455 3,1210.0 3.2 20.2
9 84 8871 61 8732 48 8495 83 9318 31 4715 23 3520 42 66
57 41 538 .. ..
14 .. ..99 109 62
22.0 18.4 29.714.1 10.9 9.92.5 3.7 3.1
67.8 10.4 6.30.0 2.2 1.20.0 0.5 0.30.1 0.5 0.70.7 0.4 0.6
–50.1 –1.2 14.7
62 2013 The Little Green Data Book
Country data
Sub-Saharan Africa group
Lower middle-income group
Population (millions) 4.1 Land area (1,000 sq. km) 342 GDP ($ billions) 14.4
Congo, Rep.

GNI per capita, World Bank Atlas method ($)Adjusted net national income per capita ($)Urban population (% of total)Urban population growth (avg. annual %, 1990–2011) AgricultureAgricultural land (% land area)Agricultural irrigated land (% of total agricultural land)Agricultural productivity, value added per worker (2000 $)Cereal yield (kg per hectare) Forests and biodiversityForest area (% land area)Deforestation (avg. annual %, 2000–2010)Terrestrial protected areas (% of total land area)Threatened species, mammalsThreatened species, birdsThreatened species, fishThreatened species, higher plants OceansTotal fisheries production (thousand metric tons)
Capture fisheries growth (avg. annual %, 1990–2011)Aquaculture growth (avg. annual %, 1990–2011)
Marine protected areas (% of territorial waters)Coral reef area (sq. km)Mangroves area (sq. km) Energy and emissionsEnergy use per capita (kg oil equivalent)Energy from biomass products and waste (% of total)Electric power consumption per capita (kWh)Electricity generated using fossil fuel (% of total)Electricity generated by hydropower (% of total)CO2 emissions per capita (metric tons) Water and sanitationInternal freshwater resources per capita (cu. m)Total freshwater withdrawal (% of internal resources)
Agriculture (% of total freshwater withdrawal)Access to improved water source (% of total population)
Rural (% of rural population)Urban (% of urban population)
Access to improved sanitation (% of total population)Rural (% of rural population)Urban (% of urban population)
Environment and healthParticulate matter (urban-pop.-weighted avg., µg/cu. m)Acute resp. infection prevalence (% of children under five)Diarrhea prevalence (% of children under five)Under-five mortality rate (per 1,000 live births) National accounting aggregates—savings, depletion and degradationGross savings (% of GNI)Consumption of fixed capital (% of GNI)Education expenditure (% of GNI)Energy depletion (% of GNI)Mineral depletion (% of GNI)Net forest depletion (% of GNI)CO2 damage (% of GNI)Particulate emissions damage (% of GNI)Adjusted net savings (% of GNI)
7,640 8,574 6,5637,413 7,648 5,82164.6 79.1 60.6
3.2 2.0 2.5
37 37 351.5 .. ..
5,738 3,448 8693,376 3,838 3,944
51.5 46.8 34.8–0.9 0.4 0.020.9 20.2 13.3
92250
113
48.3 19,009 97,4370.5 0.1 0.7
20.3 11.8 9.012.2 13.1 8.4970 15,100 33,350418 39,997 48,783
998 1,312 1,94817.3 16.7 8.1
1,855 1,973 2,9426.7 39.0 72.9
75.8 53.7 21.31.8 2.7 5.5
23,780 22,810 8,5502.4 2.0 5.653 68 6697 94 9391 81 86
100 98 9895 79 7396 59 6295 84 81
27 28 42.. .. .... .. ..
10 19 20
15.1 21.1 36.412.0 12.2 11.86.2 5.0 3.30.0 4.5 5.70.0 1.9 1.60.1 0.0 0.00.2 0.2 0.70.1 0.3 0.79.0 6.8 19.2
63The Little Green Data Book 2013
Country data
Latin America & Caribbean
group
Upper middle-income group
Population (millions) 4.7 Land area (1,000 sq. km) 51 GDP ($ billions) 40.9
Costa Rica

GNI per capita, World Bank Atlas method ($)Adjusted net national income per capita ($)Urban population (% of total)Urban population growth (avg. annual %, 1990–2011) AgricultureAgricultural land (% land area)Agricultural irrigated land (% of total agricultural land)Agricultural productivity, value added per worker (2000 $)Cereal yield (kg per hectare) Forests and biodiversityForest area (% land area)Deforestation (avg. annual %, 2000–2010)Terrestrial protected areas (% of total land area)Threatened species, mammalsThreatened species, birdsThreatened species, fishThreatened species, higher plants OceansTotal fisheries production (thousand metric tons)
Capture fisheries growth (avg. annual %, 1990–2011)Aquaculture growth (avg. annual %, 1990–2011)
Marine protected areas (% of territorial waters)Coral reef area (sq. km)Mangroves area (sq. km) Energy and emissionsEnergy use per capita (kg oil equivalent)Energy from biomass products and waste (% of total)Electric power consumption per capita (kWh)Electricity generated using fossil fuel (% of total)Electricity generated by hydropower (% of total)CO2 emissions per capita (metric tons) Water and sanitationInternal freshwater resources per capita (cu. m)Total freshwater withdrawal (% of internal resources)
Agriculture (% of total freshwater withdrawal)Access to improved water source (% of total population)
Rural (% of rural population)Urban (% of urban population)
Access to improved sanitation (% of total population)Rural (% of rural population)Urban (% of urban population)
Environment and healthParticulate matter (urban-pop.-weighted avg., µg/cu. m)Acute resp. infection prevalence (% of children under five)Diarrhea prevalence (% of children under five)Under-five mortality rate (per 1,000 live births) National accounting aggregates—savings, depletion and degradationGross savings (% of GNI)Consumption of fixed capital (% of GNI)Education expenditure (% of GNI)Energy depletion (% of GNI)Mineral depletion (% of GNI)Net forest depletion (% of GNI)CO2 damage (% of GNI)Particulate emissions damage (% of GNI)Adjusted net savings (% of GNI)
1,090 1,258 1,772986 1,022 1,59551.3 36.5 38.73.5 3.8 2.7
64 44 46.. .. ..
1,104 334 7161,682 1,361 3,065
32.7 27.8 28.4–0.2 0.5 0.322.6 11.7 9.9
232045
104
75.1 6,383 40,238–1.3 1.8 2.418.3 16.0 10.00.07 5.8 2.9
.. 17,980 143,44099.6 27,808 60,301
485 683 66775.7 58.2 26.2210 553 698
71.2 65.2 73.027.0 18.7 17.40.3 0.9 1.6
3,813 4,455 3,1211.8 3.2 20.243 84 8880 61 8768 48 8491 83 9324 31 4711 23 3536 42 66
30 41 53.. .. .... .. ..
115 109 62
13.3 18.4 29.79.3 10.9 9.94.3 3.7 3.13.6 10.4 6.30.9 2.2 1.20.0 0.5 0.30.2 0.5 0.70.4 0.4 0.64.1 –1.2 14.7
64 2013 The Little Green Data Book
Country data
Sub-Saharan Africa group
Lower middle-income group
Population (millions) 20.2 Land area (1,000 sq. km) 318 GDP ($ billions) 24.1
Côte d’Ivoire

GNI per capita, World Bank Atlas method ($)Adjusted net national income per capita ($)Urban population (% of total)Urban population growth (avg. annual %, 1990–2011) AgricultureAgricultural land (% land area)Agricultural irrigated land (% of total agricultural land)Agricultural productivity, value added per worker (2000 $)Cereal yield (kg per hectare) Forests and biodiversityForest area (% land area)Deforestation (avg. annual %, 2000–2010)Terrestrial protected areas (% of total land area)Threatened species, mammalsThreatened species, birdsThreatened species, fishThreatened species, higher plants OceansTotal fisheries production (thousand metric tons)
Capture fisheries growth (avg. annual %, 1990–2011)Aquaculture growth (avg. annual %, 1990–2011)
Marine protected areas (% of territorial waters)Coral reef area (sq. km)Mangroves area (sq. km) Energy and emissionsEnergy use per capita (kg oil equivalent)Energy from biomass products and waste (% of total)Electric power consumption per capita (kWh)Electricity generated using fossil fuel (% of total)Electricity generated by hydropower (% of total)CO2 emissions per capita (metric tons) Water and sanitationInternal freshwater resources per capita (cu. m)Total freshwater withdrawal (% of internal resources)
Agriculture (% of total freshwater withdrawal)Access to improved water source (% of total population)
Rural (% of rural population)Urban (% of urban population)
Access to improved sanitation (% of total population)Rural (% of rural population)Urban (% of urban population)
Environment and healthParticulate matter (urban-pop.-weighted avg., µg/cu. m)Acute resp. infection prevalence (% of children under five)Diarrhea prevalence (% of children under five)Under-five mortality rate (per 1,000 live births) National accounting aggregates—savings, depletion and degradationGross savings (% of GNI)Consumption of fixed capital (% of GNI)Education expenditure (% of GNI)Energy depletion (% of GNI)Mineral depletion (% of GNI)Net forest depletion (% of GNI)CO2 damage (% of GNI)Particulate emissions damage (% of GNI)Adjusted net savings (% of GNI)
13,540 39,86011,785 34,611
57.8 80.5–0.1 1.1
24 371.1 ..
16,096 26,5155,228 5,349
34.4 28.4–0.2 0.013.0 12.9
71260
6
83.8 28,774.. –1.7.. 1.8
3.4 16.5.. 81,970.. 15,496
1,932 5,0004.7 4.4
3,813 9,41539.3 62.059.5 11.2
4.9 11.4
8,562 8,1951.7 10.3
2 4199 10097 98
100 10099 10098 9999 100
22 22.. .... ..5 6
20.7 17.912.9 13.9
4.1 4.60.7 1.40.0 0.20.2 0.00.3 0.20.2 0.1
10.5 6.6
65The Little Green Data Book 2013
Country data
High-income group
Population (millions) 4.4 Land area (1,000 sq. km) 56 GDP ($ billions) 62.5
Croatia

GNI per capita, World Bank Atlas method ($)Adjusted net national income per capita ($)Urban population (% of total)Urban population growth (avg. annual %, 1990–2011) AgricultureAgricultural land (% land area)Agricultural irrigated land (% of total agricultural land)Agricultural productivity, value added per worker (2000 $)Cereal yield (kg per hectare) Forests and biodiversityForest area (% land area)Deforestation (avg. annual %, 2000–2010)Terrestrial protected areas (% of total land area)Threatened species, mammalsThreatened species, birdsThreatened species, fishThreatened species, higher plants OceansTotal fisheries production (thousand metric tons)
Capture fisheries growth (avg. annual %, 1990–2011)Aquaculture growth (avg. annual %, 1990–2011)
Marine protected areas (% of territorial waters)Coral reef area (sq. km)Mangroves area (sq. km) Energy and emissionsEnergy use per capita (kg oil equivalent)Energy from biomass products and waste (% of total)Electric power consumption per capita (kWh)Electricity generated using fossil fuel (% of total)Electricity generated by hydropower (% of total)CO2 emissions per capita (metric tons) Water and sanitationInternal freshwater resources per capita (cu. m)Total freshwater withdrawal (% of internal resources)
Agriculture (% of total freshwater withdrawal)Access to improved water source (% of total population)
Rural (% of rural population)Urban (% of urban population)
Access to improved sanitation (% of total population)Rural (% of rural population)Urban (% of urban population)
Environment and healthParticulate matter (urban-pop.-weighted avg., µg/cu. m)Acute resp. infection prevalence (% of children under five)Diarrhea prevalence (% of children under five)Under-five mortality rate (per 1,000 live births) National accounting aggregates—savings, depletion and degradationGross savings (% of GNI)Consumption of fixed capital (% of GNI)Education expenditure (% of GNI)Energy depletion (% of GNI)Mineral depletion (% of GNI)Net forest depletion (% of GNI)CO2 damage (% of GNI)Particulate emissions damage (% of GNI)Adjusted net savings (% of GNI)
5,460 8,574 6,5634,526 7,648 5,821
75.2 79.1 60.60.4 2.0 2.5
62 37 35.. .. ..
3,903 3,448 8692,619 3,838 3,944
27.3 46.8 34.8–1.7 0.4 0.06.4 20.2 13.3141735
155
48.6 19,009 97,437–9.1 0.1 0.75.4 11.8 9.04.4 13.1 8.4
3,020 15,100 33,3504,944 39,997 48,783
975 1,312 1,94811.6 16.7 8.1
1,299 1,973 2,94252.6 39.0 72.9
0.6 53.7 21.32.8 2.7 5.5
3,387 22,810 8,55019.8 2.0 5.6
75 68 6694 94 9389 81 8696 98 9891 79 7381 59 6294 84 81
15 28 42.. .. .... .. ..6 19 20
.. 21.1 36.411.5 12.2 11.812.9 5.0 3.3
2.4 4.5 5.71.0 1.9 1.60.0 0.0 0.00.4 0.2 0.70.0 0.3 0.7
.. 6.8 19.2
66 2013 The Little Green Data Book
Country data
Latin America & Caribbean
group
Upper middle-income group
Population (millions) 11.3 Land area (1,000 sq. km) 106 GDP ($ billions) 60.8
Cuba
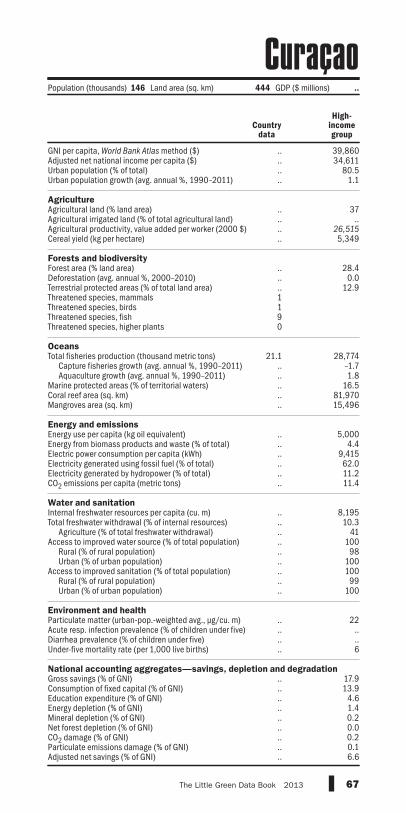
GNI per capita, World Bank Atlas method ($)Adjusted net national income per capita ($)Urban population (% of total)Urban population growth (avg. annual %, 1990–2011) AgricultureAgricultural land (% land area)Agricultural irrigated land (% of total agricultural land)Agricultural productivity, value added per worker (2000 $)Cereal yield (kg per hectare) Forests and biodiversityForest area (% land area)Deforestation (avg. annual %, 2000–2010)Terrestrial protected areas (% of total land area)Threatened species, mammalsThreatened species, birdsThreatened species, fishThreatened species, higher plants OceansTotal fisheries production (thousand metric tons)
Capture fisheries growth (avg. annual %, 1990–2011)Aquaculture growth (avg. annual %, 1990–2011)
Marine protected areas (% of territorial waters)Coral reef area (sq. km)Mangroves area (sq. km) Energy and emissionsEnergy use per capita (kg oil equivalent)Energy from biomass products and waste (% of total)Electric power consumption per capita (kWh)Electricity generated using fossil fuel (% of total)Electricity generated by hydropower (% of total)CO2 emissions per capita (metric tons) Water and sanitationInternal freshwater resources per capita (cu. m)Total freshwater withdrawal (% of internal resources)
Agriculture (% of total freshwater withdrawal)Access to improved water source (% of total population)
Rural (% of rural population)Urban (% of urban population)
Access to improved sanitation (% of total population)Rural (% of rural population)Urban (% of urban population)
Environment and healthParticulate matter (urban-pop.-weighted avg., µg/cu. m)Acute resp. infection prevalence (% of children under five)Diarrhea prevalence (% of children under five)Under-five mortality rate (per 1,000 live births) National accounting aggregates—savings, depletion and degradationGross savings (% of GNI)Consumption of fixed capital (% of GNI)Education expenditure (% of GNI)Energy depletion (% of GNI)Mineral depletion (% of GNI)Net forest depletion (% of GNI)CO2 damage (% of GNI)Particulate emissions damage (% of GNI)Adjusted net savings (% of GNI)
.. 39,860
.. 34,611
.. 80.5
.. 1.1
.. 37
.. ..
.. 26,515
.. 5,349
.. 28.4
.. 0.0
.. 12.91190
21.1 28,774.. –1.7.. 1.8.. 16.5.. 81,970.. 15,496
.. 5,000
.. 4.4
.. 9,415
.. 62.0
.. 11.2
.. 11.4
.. 8,195
.. 10.3
.. 41
.. 100
.. 98
.. 100
.. 100
.. 99
.. 100
.. 22
.. ..
.. ..
.. 6
.. 17.9
.. 13.9
.. 4.6
.. 1.4
.. 0.2
.. 0.0
.. 0.2
.. 0.1
.. 6.6
67The Little Green Data Book 2013
Country data
High-income group
CuraçaoPopulation (thousands) 146 Land area (sq. km) 444 GDP ($ millions) ..

GNI per capita, World Bank Atlas method ($)Adjusted net national income per capita ($)Urban population (% of total)Urban population growth (avg. annual %, 1990–2011) AgricultureAgricultural land (% land area)Agricultural irrigated land (% of total agricultural land)Agricultural productivity, value added per worker (2000 $)Cereal yield (kg per hectare) Forests and biodiversityForest area (% land area)Deforestation (avg. annual %, 2000–2010)Terrestrial protected areas (% of total land area)Threatened species, mammalsThreatened species, birdsThreatened species, fishThreatened species, higher plants OceansTotal fisheries production (thousand metric tons)
Capture fisheries growth (avg. annual %, 1990–2011)Aquaculture growth (avg. annual %, 1990–2011)
Marine protected areas (% of territorial waters)Coral reef area (sq. km)Mangroves area (sq. km) Energy and emissionsEnergy use per capita (kg oil equivalent)Energy from biomass products and waste (% of total)Electric power consumption per capita (kWh)Electricity generated using fossil fuel (% of total)Electricity generated by hydropower (% of total)CO2 emissions per capita (metric tons) Water and sanitationInternal freshwater resources per capita (cu. m)Total freshwater withdrawal (% of internal resources)
Agriculture (% of total freshwater withdrawal)Access to improved water source (% of total population)
Rural (% of rural population)Urban (% of urban population)
Access to improved sanitation (% of total population)Rural (% of rural population)Urban (% of urban population)
Environment and healthParticulate matter (urban-pop.-weighted avg., µg/cu. m)Acute resp. infection prevalence (% of children under five)Diarrhea prevalence (% of children under five)Under-five mortality rate (per 1,000 live births) National accounting aggregates—savings, depletion and degradationGross savings (% of GNI)Consumption of fixed capital (% of GNI)Education expenditure (% of GNI)Energy depletion (% of GNI)Mineral depletion (% of GNI)Net forest depletion (% of GNI)CO2 damage (% of GNI)Particulate emissions damage (% of GNI)Adjusted net savings (% of GNI)
29,450 39,86025,009 34,611
70.5 80.52.0 1.1
13 3721.9 ..
7,927 26,5151,887 5,349
18.8 28.4–0.1 0.010.5 12.9
55
1916
5.9 28,774–3.6 –1.718.9 1.80.56 16.5
.. 81,970
.. 15,496
2,215 5,0001.8 4.4
4,675 9,41597.6 62.00.0 11.27.5 11.4
699 8,19523.6 10.3
86 41100 100100 98100 100100 100100 99100 100
27 22.. .... ..3 6
9.0 17.910.8 13.96.9 4.60.0 1.40.0 0.20.0 0.00.3 0.20.2 0.14.6 6.6
Country data
High-income group
Population (millions) 1.1 Land area (1,000 sq. km) 9.2 GDP ($ billions) 24.7
Cyprus
68 2013 The Little Green Data Book

GNI per capita, World Bank Atlas method ($)Adjusted net national income per capita ($)Urban population (% of total)Urban population growth (avg. annual %, 1990–2011) AgricultureAgricultural land (% land area)Agricultural irrigated land (% of total agricultural land)Agricultural productivity, value added per worker (2000 $)Cereal yield (kg per hectare) Forests and biodiversityForest area (% land area)Deforestation (avg. annual %, 2000–2010)Terrestrial protected areas (% of total land area)Threatened species, mammalsThreatened species, birdsThreatened species, fishThreatened species, higher plants OceansTotal fisheries production (thousand metric tons)
Capture fisheries growth (avg. annual %, 1990–2011)Aquaculture growth (avg. annual %, 1990–2011)
Marine protected areas (% of territorial waters)Coral reef area (sq. km)Mangroves area (sq. km) Energy and emissionsEnergy use per capita (kg oil equivalent)Energy from biomass products and waste (% of total)Electric power consumption per capita (kWh)Electricity generated using fossil fuel (% of total)Electricity generated by hydropower (% of total)CO2 emissions per capita (metric tons) Water and sanitationInternal freshwater resources per capita (cu. m)Total freshwater withdrawal (% of internal resources)
Agriculture (% of total freshwater withdrawal)Access to improved water source (% of total population)
Rural (% of rural population)Urban (% of urban population)
Access to improved sanitation (% of total population)Rural (% of rural population)Urban (% of urban population)
Environment and healthParticulate matter (urban-pop.-weighted avg., µg/cu. m)Acute resp. infection prevalence (% of children under five)Diarrhea prevalence (% of children under five)Under-five mortality rate (per 1,000 live births) National accounting aggregates—savings, depletion and degradationGross savings (% of GNI)Consumption of fixed capital (% of GNI)Education expenditure (% of GNI)Energy depletion (% of GNI)Mineral depletion (% of GNI)Net forest depletion (% of GNI)CO2 damage (% of GNI)Particulate emissions damage (% of GNI)Adjusted net savings (% of GNI)
18,700 39,86016,437 34,611
73.4 80.50.0 1.1
55 370.4 ..
6,423 26,5155,422 5,349
34.4 28.4–0.1 0.015.1 12.9
2729
24.9 28,774.. –1.7.. 1.8.. 16.5.. 81,970.. 15,496
4,193 5,0006.0 4.4
6,321 9,41560.2 62.0
3.3 11.210.3 11.4
1,253 8,19512.9 10.3
2 41100 100100 98100 100
98 10097 9999 100
16 22.. .... ..4 6
23.3 17.913.9 13.9
4.2 4.60.6 1.40.0 0.20.0 0.00.5 0.20.0 0.1
12.5 6.6
Country data
High-income group
Population (millions) 10.5 Land area (1,000 sq. km) 77 GDP ($ billions) 217.0
Czech Republic
69The Little Green Data Book 2013

GNI per capita, World Bank Atlas method ($)Adjusted net national income per capita ($)Urban population (% of total)Urban population growth (avg. annual %, 1990–2011) AgricultureAgricultural land (% land area)Agricultural irrigated land (% of total agricultural land)Agricultural productivity, value added per worker (2000 $)Cereal yield (kg per hectare) Forests and biodiversityForest area (% land area)Deforestation (avg. annual %, 2000–2010)Terrestrial protected areas (% of total land area)Threatened species, mammalsThreatened species, birdsThreatened species, fishThreatened species, higher plants OceansTotal fisheries production (thousand metric tons)
Capture fisheries growth (avg. annual %, 1990–2011)Aquaculture growth (avg. annual %, 1990–2011)
Marine protected areas (% of territorial waters)Coral reef area (sq. km)Mangroves area (sq. km) Energy and emissionsEnergy use per capita (kg oil equivalent)Energy from biomass products and waste (% of total)Electric power consumption per capita (kWh)Electricity generated using fossil fuel (% of total)Electricity generated by hydropower (% of total)CO2 emissions per capita (metric tons) Water and sanitationInternal freshwater resources per capita (cu. m)Total freshwater withdrawal (% of internal resources)
Agriculture (% of total freshwater withdrawal)Access to improved water source (% of total population)
Rural (% of rural population)Urban (% of urban population)
Access to improved sanitation (% of total population)Rural (% of rural population)Urban (% of urban population)
Environment and healthParticulate matter (urban-pop.-weighted avg., µg/cu. m)Acute resp. infection prevalence (% of children under five)Diarrhea prevalence (% of children under five)Under-five mortality rate (per 1,000 live births) National accounting aggregates—savings, depletion and degradationGross savings (% of GNI)Consumption of fixed capital (% of GNI)Education expenditure (% of GNI)Energy depletion (% of GNI)Mineral depletion (% of GNI)Net forest depletion (% of GNI)CO2 damage (% of GNI)Particulate emissions damage (% of GNI)Adjusted net savings (% of GNI)
60,160 39,86051,527 34,611
86.9 80.50.5 1.1
63 3712.1 ..
53,407 26,5155,907 5,349
12.9 28.4–1.1 0.04.9 12.9
24
151
751 28,774–3.4 –1.7–0.9 1.83.2 16.5
.. 81,970
.. 15,496
3,470 5,00018.6 4.4
6,327 9,41566.1 62.0
0.1 11.28.3 11.4
1,077 8,19511.0 10.3
36 41100 100100 98100 100100 100100 99100 100
15 22.. .... ..4 6
22.9 17.914.1 13.98.1 4.61.9 1.40.0 0.20.0 0.00.1 0.20.0 0.1
14.9 6.6
70 2013 The Little Green Data Book
Country data
High-income group
Population (millions) 5.6 Land area (1,000 sq. km) 42 GDP ($ billions) 333.6
Denmark

GNI per capita, World Bank Atlas method ($)Adjusted net national income per capita ($)Urban population (% of total)Urban population growth (avg. annual %, 1990–2011) AgricultureAgricultural land (% land area)Agricultural irrigated land (% of total agricultural land)Agricultural productivity, value added per worker (2000 $)Cereal yield (kg per hectare) Forests and biodiversityForest area (% land area)Deforestation (avg. annual %, 2000–2010)Terrestrial protected areas (% of total land area)Threatened species, mammalsThreatened species, birdsThreatened species, fishThreatened species, higher plants OceansTotal fisheries production (thousand metric tons)
Capture fisheries growth (avg. annual %, 1990–2011)Aquaculture growth (avg. annual %, 1990–2011)
Marine protected areas (% of territorial waters)Coral reef area (sq. km)Mangroves area (sq. km) Energy and emissionsEnergy use per capita (kg oil equivalent)Energy from biomass products and waste (% of total)Electric power consumption per capita (kWh)Electricity generated using fossil fuel (% of total)Electricity generated by hydropower (% of total)CO2 emissions per capita (metric tons) Water and sanitationInternal freshwater resources per capita (cu. m)Total freshwater withdrawal (% of internal resources)
Agriculture (% of total freshwater withdrawal)Access to improved water source (% of total population)
Rural (% of rural population)Urban (% of urban population)
Access to improved sanitation (% of total population)Rural (% of rural population)Urban (% of urban population)
Environment and healthParticulate matter (urban-pop.-weighted avg., µg/cu. m)Acute resp. infection prevalence (% of children under five)Diarrhea prevalence (% of children under five)Under-five mortality rate (per 1,000 live births) National accounting aggregates—savings, depletion and degradationGross savings (% of GNI)Consumption of fixed capital (% of GNI)Education expenditure (% of GNI)Energy depletion (% of GNI)Mineral depletion (% of GNI)Net forest depletion (% of GNI)CO2 damage (% of GNI)Particulate emissions damage (% of GNI)Adjusted net savings (% of GNI)
1,270 3,866 1,7721,160 3,285 1,595
77.1 58.9 38.72.4 2.5 2.7
73 23 46.. .. ..
80 2,627 7162,000 2,475 3,065
0.2 2.4 28.40.0 –0.1 0.30.0 3.9 9.9
89
172
1.7 3,538 40,2387.6 2.4 2.4
.. 13.1 10.00.24 2.0 2.9450 5,700 143,44010.0 217 60,301
170 1,372 667.. 0.9 26.2.. 1,658 698.. 92.9 73.0.. 5.4 17.4
0.6 4.1 1.6
331 673 3,1216.3 122.1 20.216 86 8888 89 8754 81 8499 94 9350 88 4710 80 3563 94 66
28 59 53.. .. .... .. ..
90 32 62
33.7 27.0 29.79.4 10.8 9.9
.. 4.5 3.10.0 15.2 6.30.0 0.6 1.20.3 0.1 0.30.3 0.6 0.70.6 0.9 0.6
.. 6.1 14.7
71The Little Green Data Book 2013
Country data
Middle East &
N. Africa group
Lower middle-income group
Population (thousands) 906 Land area (1,000 sq. km) 23 GDP ($ billions) 1.0
Djibouti

GNI per capita, World Bank Atlas method ($)Adjusted net national income per capita ($)Urban population (% of total)Urban population growth (avg. annual %, 1990–2011) AgricultureAgricultural land (% land area)Agricultural irrigated land (% of total agricultural land)Agricultural productivity, value added per worker (2000 $)Cereal yield (kg per hectare) Forests and biodiversityForest area (% land area)Deforestation (avg. annual %, 2000–2010)Terrestrial protected areas (% of total land area)Threatened species, mammalsThreatened species, birdsThreatened species, fishThreatened species, higher plants OceansTotal fisheries production (thousand metric tons)
Capture fisheries growth (avg. annual %, 1990–2011)Aquaculture growth (avg. annual %, 1990–2011)
Marine protected areas (% of territorial waters)Coral reef area (sq. km)Mangroves area (sq. km) Energy and emissionsEnergy use per capita (kg oil equivalent)Energy from biomass products and waste (% of total)Electric power consumption per capita (kWh)Electricity generated using fossil fuel (% of total)Electricity generated by hydropower (% of total)CO2 emissions per capita (metric tons) Water and sanitationInternal freshwater resources per capita (cu. m)Total freshwater withdrawal (% of internal resources)
Agriculture (% of total freshwater withdrawal)Access to improved water source (% of total population)
Rural (% of rural population)Urban (% of urban population)
Access to improved sanitation (% of total population)Rural (% of rural population)Urban (% of urban population)
Environment and healthParticulate matter (urban-pop.-weighted avg., µg/cu. m)Acute resp. infection prevalence (% of children under five)Diarrhea prevalence (% of children under five)Under-five mortality rate (per 1,000 live births) National accounting aggregates—savings, depletion and degradationGross savings (% of GNI)Consumption of fixed capital (% of GNI)Education expenditure (% of GNI)Energy depletion (% of GNI)Mineral depletion (% of GNI)Net forest depletion (% of GNI)CO2 damage (% of GNI)Particulate emissions damage (% of GNI)Adjusted net savings (% of GNI)
7,030 8,574 6,5636,179 7,648 5,82167.2 79.1 60.6–0.3 2.0 2.5
35 37 35.. .. ..
5,913 3,448 8692,288 3,838 3,944
59.2 46.8 34.80.6 0.4 0.0
21.7 20.2 13.333
199
0.70 19,009 97,4371.8 0.1 0.7
.. 11.8 9.00.13 13.1 8.4
<100 15,100 33,3500.10 39,997 48,783
628 1,312 1,948.. 16.7 8.1.. 1,973 2,942.. 39.0 72.9.. 53.7 21.3
1.9 2.7 5.5
.. 22,810 8,550
.. 2.0 5.6
.. 68 6695 94 9392 81 8696 98 9881 79 7384 59 6280 84 81
20 28 42.. .. .... .. ..
12 19 20
5.1 21.1 36.411.7 12.2 11.83.1 5.0 3.30.0 4.5 5.70.0 1.9 1.60.0 0.0 0.00.2 0.2 0.7
.. 0.3 0.7–3.7 6.8 19.2
72 2013 The Little Green Data Book
Country data
Latin America & Caribbean
group
Upper middle-income group
Population (thousands) 68 Land area (sq. km) 750 GDP ($ millions) 484.1
Dominica

GNI per capita, World Bank Atlas method ($)Adjusted net national income per capita ($)Urban population (% of total)Urban population growth (avg. annual %, 1990–2011) AgricultureAgricultural land (% land area)Agricultural irrigated land (% of total agricultural land)Agricultural productivity, value added per worker (2000 $)Cereal yield (kg per hectare) Forests and biodiversityForest area (% land area)Deforestation (avg. annual %, 2000–2010)Terrestrial protected areas (% of total land area)Threatened species, mammalsThreatened species, birdsThreatened species, fishThreatened species, higher plants OceansTotal fisheries production (thousand metric tons)
Capture fisheries growth (avg. annual %, 1990–2011)Aquaculture growth (avg. annual %, 1990–2011)
Marine protected areas (% of territorial waters)Coral reef area (sq. km)Mangroves area (sq. km) Energy and emissionsEnergy use per capita (kg oil equivalent)Energy from biomass products and waste (% of total)Electric power consumption per capita (kWh)Electricity generated using fossil fuel (% of total)Electricity generated by hydropower (% of total)CO2 emissions per capita (metric tons) Water and sanitationInternal freshwater resources per capita (cu. m)Total freshwater withdrawal (% of internal resources)
Agriculture (% of total freshwater withdrawal)Access to improved water source (% of total population)
Rural (% of rural population)Urban (% of urban population)
Access to improved sanitation (% of total population)Rural (% of rural population)Urban (% of urban population)
Environment and healthParticulate matter (urban-pop.-weighted avg., µg/cu. m)Acute resp. infection prevalence (% of children under five)Diarrhea prevalence (% of children under five)Under-five mortality rate (per 1,000 live births) National accounting aggregates—savings, depletion and degradationGross savings (% of GNI)Consumption of fixed capital (% of GNI)Education expenditure (% of GNI)Energy depletion (% of GNI)Mineral depletion (% of GNI)Net forest depletion (% of GNI)CO2 damage (% of GNI)Particulate emissions damage (% of GNI)Adjusted net savings (% of GNI)
5,240 8,574 6,5634,683 7,648 5,821
69.6 79.1 60.62.7 2.0 2.5
51 37 35.. .. ..
5,480 3,448 8692,972 3,838 3,944
40.8 46.8 34.80.0 0.4 0.0
22.2 20.2 13.36
142229
15.9 19,009 97,437–1.6 0.1 0.79.7 11.8 9.0
30.4 13.1 8.4610 15,100 33,350212 39,997 48,783
840 1,312 1,94821.4 16.7 8.1
1,442 1,973 2,94288.6 39.0 72.911.3 53.7 21.3
2.1 2.7 5.5
2,088 22,810 8,55016.6 2.0 5.6
64 68 6686 94 9384 81 8687 98 9883 79 7375 59 6287 84 81
14 28 427 .. ..
15 .. ..25 19 20
8.7 21.1 36.411.5 12.2 11.81.9 5.0 3.30.0 4.5 5.70.4 1.9 1.60.0 0.0 0.00.4 0.2 0.70.0 0.3 0.7
–1.7 6.8 19.2
73The Little Green Data Book 2013
Country data
Latin America & Caribbean
group
Upper middle-income group
Population (millions) 10.1 Land area (1,000 sq. km) 48 GDP ($ billions) 55.6
Dominican Republic

GNI per capita, World Bank Atlas method ($)Adjusted net national income per capita ($)Urban population (% of total)Urban population growth (avg. annual %, 1990–2011) AgricultureAgricultural land (% land area)Agricultural irrigated land (% of total agricultural land)Agricultural productivity, value added per worker (2000 $)Cereal yield (kg per hectare) Forests and biodiversityForest area (% land area)Deforestation (avg. annual %, 2000–2010)Terrestrial protected areas (% of total land area)Threatened species, mammalsThreatened species, birdsThreatened species, fishThreatened species, higher plants OceansTotal fisheries production (thousand metric tons)
Capture fisheries growth (avg. annual %, 1990–2011)Aquaculture growth (avg. annual %, 1990–2011)
Marine protected areas (% of territorial waters)Coral reef area (sq. km)Mangroves area (sq. km) Energy and emissionsEnergy use per capita (kg oil equivalent)Energy from biomass products and waste (% of total)Electric power consumption per capita (kWh)Electricity generated using fossil fuel (% of total)Electricity generated by hydropower (% of total)CO2 emissions per capita (metric tons) Water and sanitationInternal freshwater resources per capita (cu. m)Total freshwater withdrawal (% of internal resources)
Agriculture (% of total freshwater withdrawal)Access to improved water source (% of total population)
Rural (% of rural population)Urban (% of urban population)
Access to improved sanitation (% of total population)Rural (% of rural population)Urban (% of urban population)
Environment and healthParticulate matter (urban-pop.-weighted avg., µg/cu. m)Acute resp. infection prevalence (% of children under five)Diarrhea prevalence (% of children under five)Under-five mortality rate (per 1,000 live births) National accounting aggregates—savings, depletion and degradationGross savings (% of GNI)Consumption of fixed capital (% of GNI)Education expenditure (% of GNI)Energy depletion (% of GNI)Mineral depletion (% of GNI)Net forest depletion (% of GNI)CO2 damage (% of GNI)Particulate emissions damage (% of GNI)Adjusted net savings (% of GNI)
4,200 8,574 6,5633,203 7,648 5,821
67.4 79.1 60.62.7 2.0 2.5
30 37 3512.6 .. ..
2,178 3,448 8692,604 3,838 3,944
38.9 46.8 34.81.8 0.4 0.0
25.1 20.2 13.3439350
1,714
817 19,009 97,4372.7 0.1 0.76.8 11.8 9.0
75.4 13.1 8.4<50 15,100 33,350
1,583 39,997 48,783
836 1,312 1,9485.3 16.7 8.1
1,055 1,973 2,94248.4 39.0 72.948.8 53.7 21.3
2.1 2.7 5.5
29,456 22,810 8,5503.5 2.0 5.692 68 6694 94 9389 81 8696 98 9892 79 7384 59 6296 84 81
19 28 42.. .. .... .. ..
23 19 20
23.2 21.1 36.411.0 12.2 11.81.4 5.0 3.3
16.4 4.5 5.70.0 1.9 1.60.0 0.0 0.00.4 0.2 0.70.0 0.3 0.7
–3.3 6.8 19.2
74 2013 The Little Green Data Book
Country data
Latin America & Caribbean
group
Upper middle-income group
Population (millions) 14.7 Land area (1,000 sq. km) 248 GDP ($ billions) 65.9
Ecuador

GNI per capita, World Bank Atlas method ($)Adjusted net national income per capita ($)Urban population (% of total)Urban population growth (avg. annual %, 1990–2011) AgricultureAgricultural land (% land area)Agricultural irrigated land (% of total agricultural land)Agricultural productivity, value added per worker (2000 $)Cereal yield (kg per hectare) Forests and biodiversityForest area (% land area)Deforestation (avg. annual %, 2000–2010)Terrestrial protected areas (% of total land area)Threatened species, mammalsThreatened species, birdsThreatened species, fishThreatened species, higher plants OceansTotal fisheries production (thousand metric tons)
Capture fisheries growth (avg. annual %, 1990–2011)Aquaculture growth (avg. annual %, 1990–2011)
Marine protected areas (% of territorial waters)Coral reef area (sq. km)Mangroves area (sq. km) Energy and emissionsEnergy use per capita (kg oil equivalent)Energy from biomass products and waste (% of total)Electric power consumption per capita (kWh)Electricity generated using fossil fuel (% of total)Electricity generated by hydropower (% of total)CO2 emissions per capita (metric tons) Water and sanitationInternal freshwater resources per capita (cu. m)Total freshwater withdrawal (% of internal resources)
Agriculture (% of total freshwater withdrawal)Access to improved water source (% of total population)
Rural (% of rural population)Urban (% of urban population)
Access to improved sanitation (% of total population)Rural (% of rural population)Urban (% of urban population)
Environment and healthParticulate matter (urban-pop.-weighted avg., µg/cu. m)Acute resp. infection prevalence (% of children under five)Diarrhea prevalence (% of children under five)Under-five mortality rate (per 1,000 live births) National accounting aggregates—savings, depletion and degradationGross savings (% of GNI)Consumption of fixed capital (% of GNI)Education expenditure (% of GNI)Energy depletion (% of GNI)Mineral depletion (% of GNI)Net forest depletion (% of GNI)CO2 damage (% of GNI)Particulate emissions damage (% of GNI)Adjusted net savings (% of GNI)
2,600 3,866 1,7722,180 3,285 1,59543.5 58.9 38.7
1.8 2.5 2.7
4 23 46.. .. ..
3,364 2,627 7167,247 2,475 3,065
0.1 2.4 28.4–1.7 –0.1 0.35.9 3.9 9.9181040
2
1,362 3,538 40,2381.9 2.4 2.4
14.1 13.1 10.09.3 2.0 2.9
3,800 5,700 143,4405.1 217 60,301
903 1,372 6672.1 0.9 26.2
1,608 1,658 69890.1 92.9 73.08.9 5.4 17.42.7 4.1 1.6
22 673 3,1213,794.4 122.1 20.2
86 86 8899 89 8799 81 84
100 94 9395 88 4793 80 3597 94 66
78 59 538 .. ..9 .. ..
21 32 62
17.3 27.0 29.710.4 10.8 9.94.4 4.5 3.18.7 15.2 6.30.3 0.6 1.20.1 0.1 0.30.8 0.6 0.70.7 0.9 0.60.7 6.1 14.7
75The Little Green Data Book 2013
Country data
Middle East &
N. Africa group
Lower middle-income group
Population (millions) 82.5 Land area (1,000 sq. km) 995 GDP ($ billions) 229.5
Egypt, Arab Rep.

GNI per capita, World Bank Atlas method ($)Adjusted net national income per capita ($)Urban population (% of total)Urban population growth (avg. annual %, 1990–2011) AgricultureAgricultural land (% land area)Agricultural irrigated land (% of total agricultural land)Agricultural productivity, value added per worker (2000 $)Cereal yield (kg per hectare) Forests and biodiversityForest area (% land area)Deforestation (avg. annual %, 2000–2010)Terrestrial protected areas (% of total land area)Threatened species, mammalsThreatened species, birdsThreatened species, fishThreatened species, higher plants OceansTotal fisheries production (thousand metric tons)
Capture fisheries growth (avg. annual %, 1990–2011)Aquaculture growth (avg. annual %, 1990–2011)
Marine protected areas (% of territorial waters)Coral reef area (sq. km)Mangroves area (sq. km) Energy and emissionsEnergy use per capita (kg oil equivalent)Energy from biomass products and waste (% of total)Electric power consumption per capita (kWh)Electricity generated using fossil fuel (% of total)Electricity generated by hydropower (% of total)CO2 emissions per capita (metric tons) Water and sanitationInternal freshwater resources per capita (cu. m)Total freshwater withdrawal (% of internal resources)
Agriculture (% of total freshwater withdrawal)Access to improved water source (% of total population)
Rural (% of rural population)Urban (% of urban population)
Access to improved sanitation (% of total population)Rural (% of rural population)Urban (% of urban population)
Environment and healthParticulate matter (urban-pop.-weighted avg., µg/cu. m)Acute resp. infection prevalence (% of children under five)Diarrhea prevalence (% of children under five)Under-five mortality rate (per 1,000 live births) National accounting aggregates—savings, depletion and degradationGross savings (% of GNI)Consumption of fixed capital (% of GNI)Education expenditure (% of GNI)Energy depletion (% of GNI)Mineral depletion (% of GNI)Net forest depletion (% of GNI)CO2 damage (% of GNI)Particulate emissions damage (% of GNI)Adjusted net savings (% of GNI)
3,480 8,574 1,7723,194 7,648 1,59564.8 79.1 38.7
2.0 2.0 2.7
74 37 462.1 .. ..
2,674 3,448 7162,492 3,838 3,065
13.6 46.8 28.41.5 0.4 0.30.8 20.2 9.9
56
1423
59.2 19,009 40,2389.2 0.1 2.4
10.2 11.8 10.03.1 13.1 2.9
.. 15,100 143,440252 39,997 60,301
677 1,312 66718.4 16.7 26.2855 1,973 69834.9 39.0 73.034.8 53.7 17.4
1.0 2.7 1.6
2,850 22,810 3,1217.8 2.0 20.255 68 8888 94 8776 81 8494 98 9387 79 4783 59 3589 84 66
28 28 53.. .. .... .. ..
15 19 62
9.2 21.1 29.710.8 12.2 9.9
3.0 5.0 3.10.0 4.5 6.30.0 1.9 1.20.5 0.0 0.30.2 0.2 0.70.2 0.3 0.60.5 6.8 14.7
76 2013 The Little Green Data Book
Country data
Latin America & Caribbean
group
Lower middle-income group
Population (millions) 6.2 Land area (1,000 sq. km) 21 GDP ($ billions) 23.1
El Salvador

GNI per capita, World Bank Atlas method ($)Adjusted net national income per capita ($)Urban population (% of total)Urban population growth (avg. annual %, 1990–2011) AgricultureAgricultural land (% land area)Agricultural irrigated land (% of total agricultural land)Agricultural productivity, value added per worker (2000 $)Cereal yield (kg per hectare) Forests and biodiversityForest area (% land area)Deforestation (avg. annual %, 2000–2010)Terrestrial protected areas (% of total land area)Threatened species, mammalsThreatened species, birdsThreatened species, fishThreatened species, higher plants OceansTotal fisheries production (thousand metric tons)
Capture fisheries growth (avg. annual %, 1990–2011)Aquaculture growth (avg. annual %, 1990–2011)
Marine protected areas (% of territorial waters)Coral reef area (sq. km)Mangroves area (sq. km) Energy and emissionsEnergy use per capita (kg oil equivalent)Energy from biomass products and waste (% of total)Electric power consumption per capita (kWh)Electricity generated using fossil fuel (% of total)Electricity generated by hydropower (% of total)CO2 emissions per capita (metric tons) Water and sanitationInternal freshwater resources per capita (cu. m)Total freshwater withdrawal (% of internal resources)
Agriculture (% of total freshwater withdrawal)Access to improved water source (% of total population)
Rural (% of rural population)Urban (% of urban population)
Access to improved sanitation (% of total population)Rural (% of rural population)Urban (% of urban population)
Environment and healthParticulate matter (urban-pop.-weighted avg., µg/cu. m)Acute resp. infection prevalence (% of children under five)Diarrhea prevalence (% of children under five)Under-five mortality rate (per 1,000 live births) National accounting aggregates—savings, depletion and degradationGross savings (% of GNI)Consumption of fixed capital (% of GNI)Education expenditure (% of GNI)Energy depletion (% of GNI)Mineral depletion (% of GNI)Net forest depletion (% of GNI)CO2 damage (% of GNI)Particulate emissions damage (% of GNI)Adjusted net savings (% of GNI)
15,670 39,8607,915 34,61139.5 80.5
3.7 1.1
11 37.. ..
981 26,515.. 5,349
57.5 28.40.7 0.0
19.2 12.919
62867
7.1 28,7743.2 –1.7
.. 1.82.6 16.5
.. 81,970253 15,496
2,732 5,000.. 4.4.. 9,415.. 62.0.. 11.2
7.1 11.4
36,100 8,1950.1 10.3
6 4151 10042 9866 10089 10087 9992 100
6 22.. .... ..
118 6
.. 17.918.9 13.9
1.2 4.640.4 1.4
0.0 0.20.0 0.00.3 0.20.0 0.1
.. 6.6
77The Little Green Data Book 2013
Population (thousands) 720 Land area (1,000 sq. km) 28 GDP ($ billions) 19.8
Country data
High-income group
Equatorial Guinea
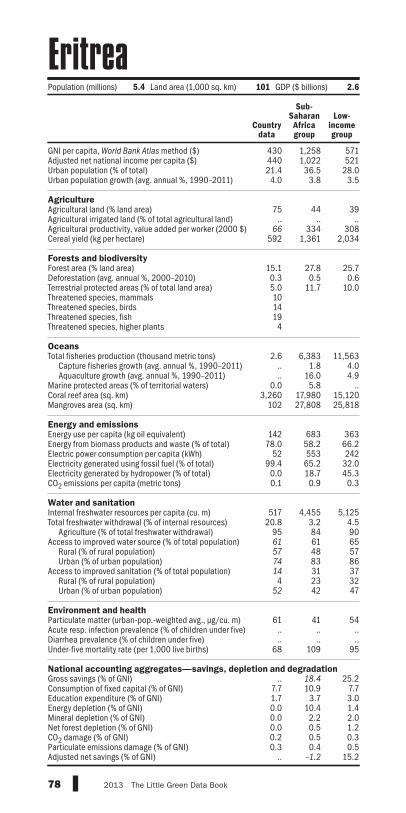
GNI per capita, World Bank Atlas method ($)Adjusted net national income per capita ($)Urban population (% of total)Urban population growth (avg. annual %, 1990–2011) AgricultureAgricultural land (% land area)Agricultural irrigated land (% of total agricultural land)Agricultural productivity, value added per worker (2000 $)Cereal yield (kg per hectare) Forests and biodiversityForest area (% land area)Deforestation (avg. annual %, 2000–2010)Terrestrial protected areas (% of total land area)Threatened species, mammalsThreatened species, birdsThreatened species, fishThreatened species, higher plants OceansTotal fisheries production (thousand metric tons)
Capture fisheries growth (avg. annual %, 1990–2011)Aquaculture growth (avg. annual %, 1990–2011)
Marine protected areas (% of territorial waters)Coral reef area (sq. km)Mangroves area (sq. km) Energy and emissionsEnergy use per capita (kg oil equivalent)Energy from biomass products and waste (% of total)Electric power consumption per capita (kWh)Electricity generated using fossil fuel (% of total)Electricity generated by hydropower (% of total)CO2 emissions per capita (metric tons) Water and sanitationInternal freshwater resources per capita (cu. m)Total freshwater withdrawal (% of internal resources)
Agriculture (% of total freshwater withdrawal)Access to improved water source (% of total population)
Rural (% of rural population)Urban (% of urban population)
Access to improved sanitation (% of total population)Rural (% of rural population)Urban (% of urban population)
Environment and healthParticulate matter (urban-pop.-weighted avg., µg/cu. m)Acute resp. infection prevalence (% of children under five)Diarrhea prevalence (% of children under five)Under-five mortality rate (per 1,000 live births) National accounting aggregates—savings, depletion and degradationGross savings (% of GNI)Consumption of fixed capital (% of GNI)Education expenditure (% of GNI)Energy depletion (% of GNI)Mineral depletion (% of GNI)Net forest depletion (% of GNI)CO2 damage (% of GNI)Particulate emissions damage (% of GNI)Adjusted net savings (% of GNI)
78 2013 The Little Green Data Book
Country data
Sub-Saharan Africa group
Low-income group
Population (millions) 5.4 Land area (1,000 sq. km) 101 GDP ($ billions) 2.6
Eritrea
430 1,258 571440 1,022 52121.4 36.5 28.04.0 3.8 3.5
75 44 39.. .. ..
66 334 308592 1,361 2,034
15.1 27.8 25.70.3 0.5 0.65.0 11.7 10.0101419
4
2.6 6,383 11,563.. 1.8 4.0.. 16.0 4.9
0.0 5.8 ..3,260 17,980 15,120
102 27,808 25,818
142 683 36378.0 58.2 66.2
52 553 24299.4 65.2 32.0
0.0 18.7 45.30.1 0.9 0.3
517 4,455 5,12520.8 3.2 4.5
95 84 9061 61 6557 48 5774 83 8614 31 374 23 32
52 42 47
61 41 54.. .. .... .. ..
68 109 95
.. 18.4 25.27.7 10.9 7.71.7 3.7 3.00.0 10.4 1.40.0 2.2 2.00.0 0.5 1.20.2 0.5 0.30.3 0.4 0.5
.. –1.2 15.2

GNI per capita, World Bank Atlas method ($)Adjusted net national income per capita ($)Urban population (% of total)Urban population growth (avg. annual %, 1990–2011) AgricultureAgricultural land (% land area)Agricultural irrigated land (% of total agricultural land)Agricultural productivity, value added per worker (2000 $)Cereal yield (kg per hectare) Forests and biodiversityForest area (% land area)Deforestation (avg. annual %, 2000–2010)Terrestrial protected areas (% of total land area)Threatened species, mammalsThreatened species, birdsThreatened species, fishThreatened species, higher plants OceansTotal fisheries production (thousand metric tons)
Capture fisheries growth (avg. annual %, 1990–2011)Aquaculture growth (avg. annual %, 1990–2011)
Marine protected areas (% of territorial waters)Coral reef area (sq. km)Mangroves area (sq. km) Energy and emissionsEnergy use per capita (kg oil equivalent)Energy from biomass products and waste (% of total)Electric power consumption per capita (kWh)Electricity generated using fossil fuel (% of total)Electricity generated by hydropower (% of total)CO2 emissions per capita (metric tons) Water and sanitationInternal freshwater resources per capita (cu. m)Total freshwater withdrawal (% of internal resources)
Agriculture (% of total freshwater withdrawal)Access to improved water source (% of total population)
Rural (% of rural population)Urban (% of urban population)
Access to improved sanitation (% of total population)Rural (% of rural population)Urban (% of urban population)
Environment and healthParticulate matter (urban-pop.-weighted avg., µg/cu. m)Acute resp. infection prevalence (% of children under five)Diarrhea prevalence (% of children under five)Under-five mortality rate (per 1,000 live births) National accounting aggregates—savings, depletion and degradationGross savings (% of GNI)Consumption of fixed capital (% of GNI)Education expenditure (% of GNI)Energy depletion (% of GNI)Mineral depletion (% of GNI)Net forest depletion (% of GNI)CO2 damage (% of GNI)Particulate emissions damage (% of GNI)Adjusted net savings (% of GNI)
15,260 39,86013,314 34,611
69.5 80.5–0.9 1.1
22 37.. ..
4,531 26,5152,596 5,349
52.1 28.40.1 0.0
20.4 12.91550
81.7 28,774–6.7 –1.7–4.1 1.826.5 16.5
.. 81,970
.. 15,496
4,155 5,00014.7 4.4
6,464 9,41591.0 62.00.2 11.2
11.9 11.4
9,486 8,19514.1 10.3
0 4198 10097 9899 10095 10094 9996 100
9 22.. .... ..4 6
26.4 17.913.3 13.9
5.5 4.61.4 1.40.0 0.20.3 0.00.6 0.20.0 0.1
16.3 6.6
79The Little Green Data Book 2013
Country data
High-income group
Population (millions) 1.3 Land area (1,000 sq. km) 42 GDP ($ billions) 22.2
Estonia

GNI per capita, World Bank Atlas method ($)Adjusted net national income per capita ($)Urban population (% of total)Urban population growth (avg. annual %, 1990–2011) AgricultureAgricultural land (% land area)Agricultural irrigated land (% of total agricultural land)Agricultural productivity, value added per worker (2000 $)Cereal yield (kg per hectare) Forests and biodiversityForest area (% land area)Deforestation (avg. annual %, 2000–2010)Terrestrial protected areas (% of total land area)Threatened species, mammalsThreatened species, birdsThreatened species, fishThreatened species, higher plants OceansTotal fisheries production (thousand metric tons)
Capture fisheries growth (avg. annual %, 1990–2011)Aquaculture growth (avg. annual %, 1990–2011)
Marine protected areas (% of territorial waters)Coral reef area (sq. km)Mangroves area (sq. km) Energy and emissionsEnergy use per capita (kg oil equivalent)Energy from biomass products and waste (% of total)Electric power consumption per capita (kWh)Electricity generated using fossil fuel (% of total)Electricity generated by hydropower (% of total)CO2 emissions per capita (metric tons) Water and sanitationInternal freshwater resources per capita (cu. m)Total freshwater withdrawal (% of internal resources)
Agriculture (% of total freshwater withdrawal)Access to improved water source (% of total population)
Rural (% of rural population)Urban (% of urban population)
Access to improved sanitation (% of total population)Rural (% of rural population)Urban (% of urban population)
Environment and healthParticulate matter (urban-pop.-weighted avg., µg/cu. m)Acute resp. infection prevalence (% of children under five)Diarrhea prevalence (% of children under five)Under-five mortality rate (per 1,000 live births) National accounting aggregates—savings, depletion and degradationGross savings (% of GNI)Consumption of fixed capital (% of GNI)Education expenditure (% of GNI)Energy depletion (% of GNI)Mineral depletion (% of GNI)Net forest depletion (% of GNI)CO2 damage (% of GNI)Particulate emissions damage (% of GNI)Adjusted net savings (% of GNI)
370 1,258 571312 1,022 52117.0 36.5 28.04.1 3.8 3.5
36 44 390.5 .. ..
229 334 3081,761 1,361 2,034
12.2 27.8 25.71.1 0.5 0.6
18.4 11.7 10.033261425
24.1 6,383 11,5637.8 1.8 4.0
–1.7 16.0 4.9.. 5.8 .... 17,980 15,120.. 27,808 25,818
400 683 36393.3 58.2 66.2
54 553 2420.6 65.2 32.0
99.0 18.7 45.30.1 0.9 0.3
1,440 4,455 5,1254.6 3.2 4.594 84 9044 61 6534 48 5797 83 8621 31 3719 23 3229 42 47
47 41 5413 .. ..18 .. ..77 109 95
27.3 18.4 25.27.2 10.9 7.72.9 3.7 3.00.0 10.4 1.40.8 2.2 2.04.4 0.5 1.20.2 0.5 0.30.2 0.4 0.5
17.4 –1.2 15.2
Country data
Sub-Saharan Africa group
Low-income group
Population (millions) 84.7 Land area (1,000 sq. km) 1,000 GDP ($ billions) 30.2
Ethiopia
80 2013 The Little Green Data Book
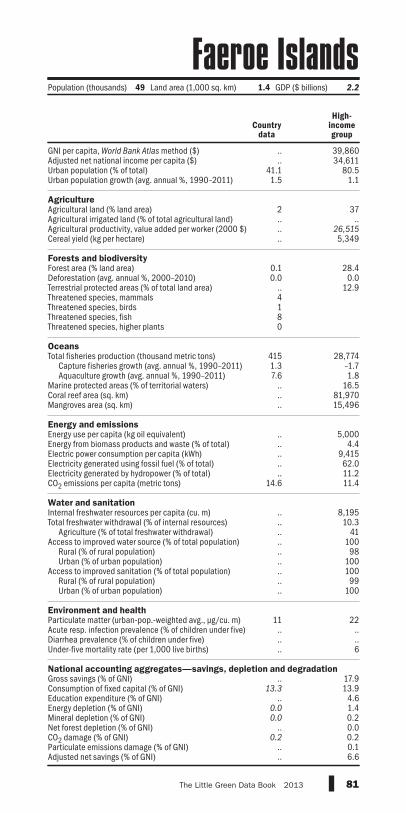
GNI per capita, World Bank Atlas method ($)Adjusted net national income per capita ($)Urban population (% of total)Urban population growth (avg. annual %, 1990–2011) AgricultureAgricultural land (% land area)Agricultural irrigated land (% of total agricultural land)Agricultural productivity, value added per worker (2000 $)Cereal yield (kg per hectare) Forests and biodiversityForest area (% land area)Deforestation (avg. annual %, 2000–2010)Terrestrial protected areas (% of total land area)Threatened species, mammalsThreatened species, birdsThreatened species, fishThreatened species, higher plants OceansTotal fisheries production (thousand metric tons)
Capture fisheries growth (avg. annual %, 1990–2011)Aquaculture growth (avg. annual %, 1990–2011)
Marine protected areas (% of territorial waters)Coral reef area (sq. km)Mangroves area (sq. km) Energy and emissionsEnergy use per capita (kg oil equivalent)Energy from biomass products and waste (% of total)Electric power consumption per capita (kWh)Electricity generated using fossil fuel (% of total)Electricity generated by hydropower (% of total)CO2 emissions per capita (metric tons) Water and sanitationInternal freshwater resources per capita (cu. m)Total freshwater withdrawal (% of internal resources)
Agriculture (% of total freshwater withdrawal)Access to improved water source (% of total population)
Rural (% of rural population)Urban (% of urban population)
Access to improved sanitation (% of total population)Rural (% of rural population)Urban (% of urban population)
Environment and healthParticulate matter (urban-pop.-weighted avg., µg/cu. m)Acute resp. infection prevalence (% of children under five)Diarrhea prevalence (% of children under five)Under-five mortality rate (per 1,000 live births) National accounting aggregates—savings, depletion and degradationGross savings (% of GNI)Consumption of fixed capital (% of GNI)Education expenditure (% of GNI)Energy depletion (% of GNI)Mineral depletion (% of GNI)Net forest depletion (% of GNI)CO2 damage (% of GNI)Particulate emissions damage (% of GNI)Adjusted net savings (% of GNI)
.. 39,860
.. 34,61141.1 80.51.5 1.1
2 37.. .... 26,515.. 5,349
0.1 28.40.0 0.0
.. 12.94180
415 28,7741.3 –1.77.6 1.8
.. 16.5
.. 81,970
.. 15,496
.. 5,000
.. 4.4
.. 9,415
.. 62.0
.. 11.214.6 11.4
.. 8,195
.. 10.3
.. 41
.. 100
.. 98
.. 100
.. 100
.. 99
.. 100
11 22.. .... .... 6
.. 17.913.3 13.9
.. 4.60.0 1.40.0 0.2
.. 0.00.2 0.2
.. 0.1
.. 6.6
Country data
High-income group
Population (thousands) 49 Land area (1,000 sq. km) 1.4 GDP ($ billions) 2.2
Faeroe Islands
81The Little Green Data Book 2013

GNI per capita, World Bank Atlas method ($)Adjusted net national income per capita ($)Urban population (% of total)Urban population growth (avg. annual %, 1990–2011) AgricultureAgricultural land (% land area)Agricultural irrigated land (% of total agricultural land)Agricultural productivity, value added per worker (2000 $)Cereal yield (kg per hectare) Forests and biodiversityForest area (% land area)Deforestation (avg. annual %, 2000–2010)Terrestrial protected areas (% of total land area)Threatened species, mammalsThreatened species, birdsThreatened species, fishThreatened species, higher plants OceansTotal fisheries production (thousand metric tons)
Capture fisheries growth (avg. annual %, 1990–2011)Aquaculture growth (avg. annual %, 1990–2011)
Marine protected areas (% of territorial waters)Coral reef area (sq. km)Mangroves area (sq. km) Energy and emissionsEnergy use per capita (kg oil equivalent)Energy from biomass products and waste (% of total)Electric power consumption per capita (kWh)Electricity generated using fossil fuel (% of total)Electricity generated by hydropower (% of total)CO2 emissions per capita (metric tons) Water and sanitationInternal freshwater resources per capita (cu. m)Total freshwater withdrawal (% of internal resources)
Agriculture (% of total freshwater withdrawal)Access to improved water source (% of total population)
Rural (% of rural population)Urban (% of urban population)
Access to improved sanitation (% of total population)Rural (% of rural population)Urban (% of urban population)
Environment and healthParticulate matter (urban-pop.-weighted avg., µg/cu. m)Acute resp. infection prevalence (% of children under five)Diarrhea prevalence (% of children under five)Under-five mortality rate (per 1,000 live births) National accounting aggregates—savings, depletion and degradationGross savings (% of GNI)Consumption of fixed capital (% of GNI)Education expenditure (% of GNI)Energy depletion (% of GNI)Mineral depletion (% of GNI)Net forest depletion (% of GNI)CO2 damage (% of GNI)Particulate emissions damage (% of GNI)Adjusted net savings (% of GNI)
3,720 4,248 1,7723,763 3,884 1,59552.2 48.6 38.7
1.9 3.6 2.7
23 48 46.. .. ..
1,864 610 7163,075 5,050 3,065
55.7 29.7 28.4–0.3 –0.4 0.31.3 15.0 9.9
6141361
42.1 101,299 40,2381.1 3.4 2.4
–10.3 9.1 10.00.06 1.4 2.9
10,020 137,690 143,440425 56,537 60,301
627 1,520 667.. 10.9 26.2.. 2,337 698.. 79.8 73.0.. 16.5 17.4
1.0 4.6 1.6
32,876 4,446 3,1210.3 10.9 20.261 73 8898 90 8795 84 84
100 97 9383 66 4771 58 3594 76 66
20 55 53.. .. .... .. ..
16 21 62
6.3 49.3 29.711.1 11.0 9.96.0 2.1 3.10.0 4.3 6.30.5 1.7 1.20.0 0.0 0.30.2 0.9 0.70.1 1.1 0.60.2 32.2 14.7
82 2013 The Little Green Data Book
Country data
East Asia & Pacific
group
Lower middle-income group
Population (thousands) 868 Land area (1,000 sq. km) 18 GDP ($ billions) 3.8
Fiji

GNI per capita, World Bank Atlas method ($)Adjusted net national income per capita ($)Urban population (% of total)Urban population growth (avg. annual %, 1990–2011) AgricultureAgricultural land (% land area)Agricultural irrigated land (% of total agricultural land)Agricultural productivity, value added per worker (2000 $)Cereal yield (kg per hectare) Forests and biodiversityForest area (% land area)Deforestation (avg. annual %, 2000–2010)Terrestrial protected areas (% of total land area)Threatened species, mammalsThreatened species, birdsThreatened species, fishThreatened species, higher plants OceansTotal fisheries production (thousand metric tons)
Capture fisheries growth (avg. annual %, 1990–2011)Aquaculture growth (avg. annual %, 1990–2011)
Marine protected areas (% of territorial waters)Coral reef area (sq. km)Mangroves area (sq. km) Energy and emissionsEnergy use per capita (kg oil equivalent)Energy from biomass products and waste (% of total)Electric power consumption per capita (kWh)Electricity generated using fossil fuel (% of total)Electricity generated by hydropower (% of total)CO2 emissions per capita (metric tons) Water and sanitationInternal freshwater resources per capita (cu. m)Total freshwater withdrawal (% of internal resources)
Agriculture (% of total freshwater withdrawal)Access to improved water source (% of total population)
Rural (% of rural population)Urban (% of urban population)
Access to improved sanitation (% of total population)Rural (% of rural population)Urban (% of urban population)
Environment and healthParticulate matter (urban-pop.-weighted avg., µg/cu. m)Acute resp. infection prevalence (% of children under five)Diarrhea prevalence (% of children under five)Under-five mortality rate (per 1,000 live births) National accounting aggregates—savings, depletion and degradationGross savings (% of GNI)Consumption of fixed capital (% of GNI)Education expenditure (% of GNI)Energy depletion (% of GNI)Mineral depletion (% of GNI)Net forest depletion (% of GNI)CO2 damage (% of GNI)Particulate emissions damage (% of GNI)Adjusted net savings (% of GNI)
47,760 39,86042,089 34,611
83.7 80.50.6 1.1
8 370.6 ..
47,514 26,5153,534 5,349
72.9 28.40.1 0.09.0 12.9
1661
165 28,7740.4 –1.7
–2.3 1.85.0 16.5
.. 81,970
.. 15,496
6,787 5,00022.6 4.4
16,483 9,41533.3 62.016.0 11.210.0 11.4
19,858 8,1951.5 10.3
3 41100 100100 98100 100100 100100 99100 100
15 22.. .... ..3 6
19.6 17.914.1 13.96.3 4.60.0 1.40.1 0.20.0 0.00.2 0.20.0 0.1
11.5 6.6
83The Little Green Data Book 2013
Country data
High-income group
Population (millions) 5.4 Land area (1,000 sq. km) 304 GDP ($ billions) 263.0
Finland

GNI per capita, World Bank Atlas method ($)Adjusted net national income per capita ($)Urban population (% of total)Urban population growth (avg. annual %, 1990–2011) AgricultureAgricultural land (% land area)Agricultural irrigated land (% of total agricultural land)Agricultural productivity, value added per worker (2000 $)Cereal yield (kg per hectare) Forests and biodiversityForest area (% land area)Deforestation (avg. annual %, 2000–2010)Terrestrial protected areas (% of total land area)Threatened species, mammalsThreatened species, birdsThreatened species, fishThreatened species, higher plants OceansTotal fisheries production (thousand metric tons)
Capture fisheries growth (avg. annual %, 1990–2011)Aquaculture growth (avg. annual %, 1990–2011)
Marine protected areas (% of territorial waters)Coral reef area (sq. km)Mangroves area (sq. km) Energy and emissionsEnergy use per capita (kg oil equivalent)Energy from biomass products and waste (% of total)Electric power consumption per capita (kWh)Electricity generated using fossil fuel (% of total)Electricity generated by hydropower (% of total)CO2 emissions per capita (metric tons) Water and sanitationInternal freshwater resources per capita (cu. m)Total freshwater withdrawal (% of internal resources)
Agriculture (% of total freshwater withdrawal)Access to improved water source (% of total population)
Rural (% of rural population)Urban (% of urban population)
Access to improved sanitation (% of total population)Rural (% of rural population)Urban (% of urban population)
Environment and healthParticulate matter (urban-pop.-weighted avg., µg/cu. m)Acute resp. infection prevalence (% of children under five)Diarrhea prevalence (% of children under five)Under-five mortality rate (per 1,000 live births) National accounting aggregates—savings, depletion and degradationGross savings (% of GNI)Consumption of fixed capital (% of GNI)Education expenditure (% of GNI)Energy depletion (% of GNI)Mineral depletion (% of GNI)Net forest depletion (% of GNI)CO2 damage (% of GNI)Particulate emissions damage (% of GNI)Adjusted net savings (% of GNI)
42,420 39,86037,251 34,611
85.7 80.51.2 1.1
53 375.1 ..
57,973 26,5156,859 5,349
29.2 28.4–0.4 0.016.5 12.9
89
4328
680 28,774–2.0 –1.7–0.6 1.821.3 16.5
.. 81,970
.. 15,496
4,031 5,0006.0 4.4
7,729 9,4159.9 62.0
11.0 11.25.6 11.4
3,057 8,19515.8 10.3
12 41100 100100 98100 100100 100100 99100 100
12 22.. .... ..4 6
17.5 17.913.7 13.95.3 4.60.0 1.40.0 0.20.0 0.00.1 0.20.0 0.19.0 6.6
84 2013 The Little Green Data Book
Country data
High-income group
Population (millions) 65.4 Land area (1,000 sq. km) 548 GDP ($ billions) 2,773.0
France

GNI per capita, World Bank Atlas method ($)Adjusted net national income per capita ($)Urban population (% of total)Urban population growth (avg. annual %, 1990–2011) AgricultureAgricultural land (% land area)Agricultural irrigated land (% of total agricultural land)Agricultural productivity, value added per worker (2000 $)Cereal yield (kg per hectare) Forests and biodiversityForest area (% land area)Deforestation (avg. annual %, 2000–2010)Terrestrial protected areas (% of total land area)Threatened species, mammalsThreatened species, birdsThreatened species, fishThreatened species, higher plants OceansTotal fisheries production (thousand metric tons)
Capture fisheries growth (avg. annual %, 1990–2011)Aquaculture growth (avg. annual %, 1990–2011)
Marine protected areas (% of territorial waters)Coral reef area (sq. km)Mangroves area (sq. km) Energy and emissionsEnergy use per capita (kg oil equivalent)Energy from biomass products and waste (% of total)Electric power consumption per capita (kWh)Electricity generated using fossil fuel (% of total)Electricity generated by hydropower (% of total)CO2 emissions per capita (metric tons) Water and sanitationInternal freshwater resources per capita (cu. m)Total freshwater withdrawal (% of internal resources)
Agriculture (% of total freshwater withdrawal)Access to improved water source (% of total population)
Rural (% of rural population)Urban (% of urban population)
Access to improved sanitation (% of total population)Rural (% of rural population)Urban (% of urban population)
Environment and healthParticulate matter (urban-pop.-weighted avg., µg/cu. m)Acute resp. infection prevalence (% of children under five)Diarrhea prevalence (% of children under five)Under-five mortality rate (per 1,000 live births) National accounting aggregates—savings, depletion and degradationGross savings (% of GNI)Consumption of fixed capital (% of GNI)Education expenditure (% of GNI)Energy depletion (% of GNI)Mineral depletion (% of GNI)Net forest depletion (% of GNI)CO2 damage (% of GNI)Particulate emissions damage (% of GNI)Adjusted net savings (% of GNI)
.. 39,860
.. 34,61151.4 80.51.2 1.1
12 37.. .... 26,515.. 5,349
43.7 28.4–4.0 0.00.4 12.9
1332747
15.8 28,7745.5 –1.7
18.1 1.80.06 16.5
6,000 81,970.. 15,496
.. 5,000
.. 4.4
.. 9,415
.. 62.0
.. 11.23.3 11.4
38,264 8,195.. 10.3.. 41
100 100100 98100 100
98 10097 9999 100
.. 22
.. ..
.. ..
.. 6
.. 17.9
.. 13.9
.. 4.6
.. 1.4
.. 0.2
.. 0.0
.. 0.2
.. 0.1
.. 6.6
85The Little Green Data Book 2013
Country data
High-income group
Population (thousands) 274 Land area (1,000 sq. km) 3.7 GDP ($ millions) ..
French Polynesia

GNI per capita, World Bank Atlas method ($)Adjusted net national income per capita ($)Urban population (% of total)Urban population growth (avg. annual %, 1990–2011) AgricultureAgricultural land (% land area)Agricultural irrigated land (% of total agricultural land)Agricultural productivity, value added per worker (2000 $)Cereal yield (kg per hectare) Forests and biodiversityForest area (% land area)Deforestation (avg. annual %, 2000–2010)Terrestrial protected areas (% of total land area)Threatened species, mammalsThreatened species, birdsThreatened species, fishThreatened species, higher plants OceansTotal fisheries production (thousand metric tons)
Capture fisheries growth (avg. annual %, 1990–2011)Aquaculture growth (avg. annual %, 1990–2011)
Marine protected areas (% of territorial waters)Coral reef area (sq. km)Mangroves area (sq. km) Energy and emissionsEnergy use per capita (kg oil equivalent)Energy from biomass products and waste (% of total)Electric power consumption per capita (kWh)Electricity generated using fossil fuel (% of total)Electricity generated by hydropower (% of total)CO2 emissions per capita (metric tons) Water and sanitationInternal freshwater resources per capita (cu. m)Total freshwater withdrawal (% of internal resources)
Agriculture (% of total freshwater withdrawal)Access to improved water source (% of total population)
Rural (% of rural population)Urban (% of urban population)
Access to improved sanitation (% of total population)Rural (% of rural population)Urban (% of urban population)
Environment and healthParticulate matter (urban-pop.-weighted avg., µg/cu. m)Acute resp. infection prevalence (% of children under five)Diarrhea prevalence (% of children under five)Under-five mortality rate (per 1,000 live births) National accounting aggregates—savings, depletion and degradationGross savings (% of GNI)Consumption of fixed capital (% of GNI)Education expenditure (% of GNI)Energy depletion (% of GNI)Mineral depletion (% of GNI)Net forest depletion (% of GNI)CO2 damage (% of GNI)Particulate emissions damage (% of GNI)Adjusted net savings (% of GNI)
8,080 1,258 6,5634,944 1,022 5,821
86.1 36.5 60.63.4 3.8 2.5
20 44 35.. .. ..
1,908 334 8691,698 1,361 3,944
85.4 27.8 34.80.0 0.5 0.0
15.1 11.7 13.3145
61119
32.2 6,383 97,4372.3 1.8 0.7
23.2 16.0 9.07.3 5.8 8.4
.. 17,980 33,3501,598 27,808 48,783
1,418 683 1,94852.9 58.2 8.1
1,004 553 2,94255.8 65.2 72.943.8 18.7 21.3
1.1 0.9 5.5
106,892 4,455 8,5500.1 3.2 5.638 84 6687 61 9341 48 8695 83 9833 31 7330 23 6233 42 81
7 41 42.. .. .... .. ..
66 109 20
.. 18.4 36.413.9 10.9 11.8
3.1 3.7 3.334.7 10.4 5.7
0.1 2.2 1.60.0 0.5 0.00.1 0.5 0.70.0 0.4 0.7
.. –1.2 19.2
86 2013 The Little Green Data Book
Country data
Sub-Saharan Africa group
Upper middle-income group
Population (millions) 1.5 Land area (1,000 sq. km) 258 GDP ($ billions) 17.1
Gabon

GNI per capita, World Bank Atlas method ($)Adjusted net national income per capita ($)Urban population (% of total)Urban population growth (avg. annual %, 1990–2011) AgricultureAgricultural land (% land area)Agricultural irrigated land (% of total agricultural land)Agricultural productivity, value added per worker (2000 $)Cereal yield (kg per hectare) Forests and biodiversityForest area (% land area)Deforestation (avg. annual %, 2000–2010)Terrestrial protected areas (% of total land area)Threatened species, mammalsThreatened species, birdsThreatened species, fishThreatened species, higher plants OceansTotal fisheries production (thousand metric tons)
Capture fisheries growth (avg. annual %, 1990–2011)Aquaculture growth (avg. annual %, 1990–2011)
Marine protected areas (% of territorial waters)Coral reef area (sq. km)Mangroves area (sq. km) Energy and emissionsEnergy use per capita (kg oil equivalent)Energy from biomass products and waste (% of total)Electric power consumption per capita (kWh)Electricity generated using fossil fuel (% of total)Electricity generated by hydropower (% of total)CO2 emissions per capita (metric tons) Water and sanitationInternal freshwater resources per capita (cu. m)Total freshwater withdrawal (% of internal resources)
Agriculture (% of total freshwater withdrawal)Access to improved water source (% of total population)
Rural (% of rural population)Urban (% of urban population)
Access to improved sanitation (% of total population)Rural (% of rural population)Urban (% of urban population)
Environment and healthParticulate matter (urban-pop.-weighted avg., µg/cu. m)Acute resp. infection prevalence (% of children under five)Diarrhea prevalence (% of children under five)Under-five mortality rate (per 1,000 live births) National accounting aggregates—savings, depletion and degradationGross savings (% of GNI)Consumption of fixed capital (% of GNI)Education expenditure (% of GNI)Energy depletion (% of GNI)Mineral depletion (% of GNI)Net forest depletion (% of GNI)CO2 damage (% of GNI)Particulate emissions damage (% of GNI)Adjusted net savings (% of GNI)
500 1,258 571446 1,022 52157.2 36.5 28.04.8 3.8 3.5
61 44 39.. .. ..
285 334 308869 1,361 2,034
47.6 27.8 25.7–0.4 0.5 0.61.5 11.7 10.0101023
4
45.0 6,383 11,5633.6 1.8 4.0
–4.1 16.0 4.90.06 5.8 ..
.. 17,980 15,120581 27,808 25,818
84 683 363.. 58.2 66.2.. 553 242.. 65.2 32.0.. 18.7 45.3
0.3 0.9 0.3
1,689 4,455 5,1252.4 3.2 4.528 84 9089 61 6585 48 5792 83 8668 31 3765 23 3270 42 47
60 41 54.. .. .... .. ..
101 109 95
12.6 18.4 25.28.0 10.9 7.73.1 3.7 3.00.0 10.4 1.40.0 2.2 2.00.7 0.5 1.20.4 0.5 0.30.5 0.4 0.56.1 –1.2 15.2
87The Little Green Data Book 2013
Country data
Sub-Saharan Africa group
Low-income group
Population (millions) 1.8 Land area (1,000 sq. km) 10 GDP ($ millions) 898.3
Gambia, TheCountry
data
Sub- Saharan Africa group
Low-income group
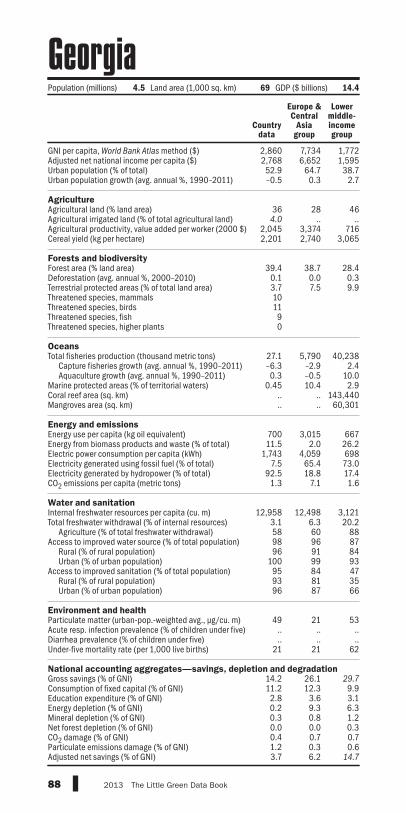
GNI per capita, World Bank Atlas method ($)Adjusted net national income per capita ($)Urban population (% of total)Urban population growth (avg. annual %, 1990–2011) AgricultureAgricultural land (% land area)Agricultural irrigated land (% of total agricultural land)Agricultural productivity, value added per worker (2000 $)Cereal yield (kg per hectare) Forests and biodiversityForest area (% land area)Deforestation (avg. annual %, 2000–2010)Terrestrial protected areas (% of total land area)Threatened species, mammalsThreatened species, birdsThreatened species, fishThreatened species, higher plants OceansTotal fisheries production (thousand metric tons)
Capture fisheries growth (avg. annual %, 1990–2011)Aquaculture growth (avg. annual %, 1990–2011)
Marine protected areas (% of territorial waters)Coral reef area (sq. km)Mangroves area (sq. km) Energy and emissionsEnergy use per capita (kg oil equivalent)Energy from biomass products and waste (% of total)Electric power consumption per capita (kWh)Electricity generated using fossil fuel (% of total)Electricity generated by hydropower (% of total)CO2 emissions per capita (metric tons) Water and sanitationInternal freshwater resources per capita (cu. m)Total freshwater withdrawal (% of internal resources)
Agriculture (% of total freshwater withdrawal)Access to improved water source (% of total population)
Rural (% of rural population)Urban (% of urban population)
Access to improved sanitation (% of total population)Rural (% of rural population)Urban (% of urban population)
Environment and healthParticulate matter (urban-pop.-weighted avg., µg/cu. m)Acute resp. infection prevalence (% of children under five)Diarrhea prevalence (% of children under five)Under-five mortality rate (per 1,000 live births) National accounting aggregates—savings, depletion and degradationGross savings (% of GNI)Consumption of fixed capital (% of GNI)Education expenditure (% of GNI)Energy depletion (% of GNI)Mineral depletion (% of GNI)Net forest depletion (% of GNI)CO2 damage (% of GNI)Particulate emissions damage (% of GNI)Adjusted net savings (% of GNI)
2,860 7,734 1,7722,768 6,652 1,59552.9 64.7 38.7–0.5 0.3 2.7
36 28 464.0 .. ..
2,045 3,374 7162,201 2,740 3,065
39.4 38.7 28.40.1 0.0 0.33.7 7.5 9.9101190
27.1 5,790 40,238–6.3 –2.9 2.40.3 –0.5 10.0
0.45 10.4 2.9.. .. 143,440.. .. 60,301
700 3,015 66711.5 2.0 26.2
1,743 4,059 6987.5 65.4 73.0
92.5 18.8 17.41.3 7.1 1.6
12,958 12,498 3,1213.1 6.3 20.258 60 8898 96 8796 91 84
100 99 9395 84 4793 81 3596 87 66
49 21 53.. .. .... .. ..
21 21 62
14.2 26.1 29.711.2 12.3 9.92.8 3.6 3.10.2 9.3 6.30.3 0.8 1.20.0 0.0 0.30.4 0.7 0.71.2 0.3 0.63.7 6.2 14.7
88 2013 The Little Green Data Book
Country data
Europe & Central
Asia group
Lower middle-income group
Population (millions) 4.5 Land area (1,000 sq. km) 69 GDP ($ billions) 14.4
Georgia

GNI per capita, World Bank Atlas method ($)Adjusted net national income per capita ($)Urban population (% of total)Urban population growth (avg. annual %, 1990–2011) AgricultureAgricultural land (% land area)Agricultural irrigated land (% of total agricultural land)Agricultural productivity, value added per worker (2000 $)Cereal yield (kg per hectare) Forests and biodiversityForest area (% land area)Deforestation (avg. annual %, 2000–2010)Terrestrial protected areas (% of total land area)Threatened species, mammalsThreatened species, birdsThreatened species, fishThreatened species, higher plants OceansTotal fisheries production (thousand metric tons)
Capture fisheries growth (avg. annual %, 1990–2011)Aquaculture growth (avg. annual %, 1990–2011)
Marine protected areas (% of territorial waters)Coral reef area (sq. km)Mangroves area (sq. km) Energy and emissionsEnergy use per capita (kg oil equivalent)Energy from biomass products and waste (% of total)Electric power consumption per capita (kWh)Electricity generated using fossil fuel (% of total)Electricity generated by hydropower (% of total)CO2 emissions per capita (metric tons) Water and sanitationInternal freshwater resources per capita (cu. m)Total freshwater withdrawal (% of internal resources)
Agriculture (% of total freshwater withdrawal)Access to improved water source (% of total population)
Rural (% of rural population)Urban (% of urban population)
Access to improved sanitation (% of total population)Rural (% of rural population)Urban (% of urban population)
Environment and healthParticulate matter (urban-pop.-weighted avg., µg/cu. m)Acute resp. infection prevalence (% of children under five)Diarrhea prevalence (% of children under five)Under-five mortality rate (per 1,000 live births) National accounting aggregates—savings, depletion and degradationGross savings (% of GNI)Consumption of fixed capital (% of GNI)Education expenditure (% of GNI)Energy depletion (% of GNI)Mineral depletion (% of GNI)Net forest depletion (% of GNI)CO2 damage (% of GNI)Particulate emissions damage (% of GNI)Adjusted net savings (% of GNI)
44,230 39,86038,601 34,611
73.9 80.50.2 1.1
48 372.2 ..
32,866 26,5156,461 5,349
31.8 28.40.0 0.0
42.4 12.957
2314
273 28,774–1.6 –1.7–2.3 1.840.3 16.5
.. 81,970
.. 15,496
4,003 5,0009.0 4.4
7,215 9,41559.3 62.0
3.3 11.29.0 11.4
1,308 8,19530.2 10.3
0 41100 100100 98100 100100 100100 99100 100
16 22.. .... ..4 6
23.5 17.913.8 13.9
4.4 4.60.2 1.40.0 0.20.0 0.00.2 0.20.0 0.1
13.8 6.6
89The Little Green Data Book 2013
Country data
High-income group
Population (millions) 81.8 Land area (1,000 sq. km) 349 GDP ($ billions) 3,600.8
Germany

GNI per capita, World Bank Atlas method ($)Adjusted net national income per capita ($)Urban population (% of total)Urban population growth (avg. annual %, 1990–2011) AgricultureAgricultural land (% land area)Agricultural irrigated land (% of total agricultural land)Agricultural productivity, value added per worker (2000 $)Cereal yield (kg per hectare) Forests and biodiversityForest area (% land area)Deforestation (avg. annual %, 2000–2010)Terrestrial protected areas (% of total land area)Threatened species, mammalsThreatened species, birdsThreatened species, fishThreatened species, higher plants OceansTotal fisheries production (thousand metric tons)
Capture fisheries growth (avg. annual %, 1990–2011)Aquaculture growth (avg. annual %, 1990–2011)
Marine protected areas (% of territorial waters)Coral reef area (sq. km)Mangroves area (sq. km) Energy and emissionsEnergy use per capita (kg oil equivalent)Energy from biomass products and waste (% of total)Electric power consumption per capita (kWh)Electricity generated using fossil fuel (% of total)Electricity generated by hydropower (% of total)CO2 emissions per capita (metric tons) Water and sanitationInternal freshwater resources per capita (cu. m)Total freshwater withdrawal (% of internal resources)
Agriculture (% of total freshwater withdrawal)Access to improved water source (% of total population)
Rural (% of rural population)Urban (% of urban population)
Access to improved sanitation (% of total population)Rural (% of rural population)Urban (% of urban population)
Environment and healthParticulate matter (urban-pop.-weighted avg., µg/cu. m)Acute resp. infection prevalence (% of children under five)Diarrhea prevalence (% of children under five)Under-five mortality rate (per 1,000 live births) National accounting aggregates—savings, depletion and degradationGross savings (% of GNI)Consumption of fixed capital (% of GNI)Education expenditure (% of GNI)Energy depletion (% of GNI)Mineral depletion (% of GNI)Net forest depletion (% of GNI)CO2 damage (% of GNI)Particulate emissions damage (% of GNI)Adjusted net savings (% of GNI)
1,410 1,258 1,7721,214 1,022 1,59551.9 36.5 38.74.2 3.8 2.7
70 44 460.2 .. ..
.. 334 7161,594 1,361 3,065
21.2 27.8 28.42.1 0.5 0.3
14.7 11.7 9.9161744
115
353 6,383 40,238–0.8 1.8 2.420.8 16.0 10.00.01 5.8 2.9
.. 17,980 143,440137 27,808 60,301
382 683 66763.8 58.2 26.2298 553 69816.4 65.2 73.083.6 18.7 17.4
0.3 0.9 1.6
1,214 4,455 3,1213.2 3.2 20.266 84 8886 61 8780 48 8491 83 9314 31 478 23 35
19 42 66
22 41 536 .. ..
20 .. ..78 109 62
9.1 18.4 29.79.6 10.9 9.94.7 3.7 3.12.1 10.4 6.37.1 2.2 1.21.3 0.5 0.30.2 0.5 0.70.0 0.4 0.6
–6.6 –1.2 14.7
90 2013 The Little Green Data Book
Country data
Sub-Saharan Africa group
Lower-income group
Population (millions) 25.0 Land area (1,000 sq. km) 228 GDP ($ billions) 39.2
Ghana

GNI per capita, World Bank Atlas method ($)Adjusted net national income per capita ($)Urban population (% of total)Urban population growth (avg. annual %, 1990–2011) AgricultureAgricultural land (% land area)Agricultural irrigated land (% of total agricultural land)Agricultural productivity, value added per worker (2000 $)Cereal yield (kg per hectare) Forests and biodiversityForest area (% land area)Deforestation (avg. annual %, 2000–2010)Terrestrial protected areas (% of total land area)Threatened species, mammalsThreatened species, birdsThreatened species, fishThreatened species, higher plants OceansTotal fisheries production (thousand metric tons)
Capture fisheries growth (avg. annual %, 1990–2011)Aquaculture growth (avg. annual %, 1990–2011)
Marine protected areas (% of territorial waters)Coral reef area (sq. km)Mangroves area (sq. km) Energy and emissionsEnergy use per capita (kg oil equivalent)Energy from biomass products and waste (% of total)Electric power consumption per capita (kWh)Electricity generated using fossil fuel (% of total)Electricity generated by hydropower (% of total)CO2 emissions per capita (metric tons) Water and sanitationInternal freshwater resources per capita (cu. m)Total freshwater withdrawal (% of internal resources)
Agriculture (% of total freshwater withdrawal)Access to improved water source (% of total population)
Rural (% of rural population)Urban (% of urban population)
Access to improved sanitation (% of total population)Rural (% of rural population)Urban (% of urban population)
Environment and healthParticulate matter (urban-pop.-weighted avg., µg/cu. m)Acute resp. infection prevalence (% of children under five)Diarrhea prevalence (% of children under five)Under-five mortality rate (per 1,000 live births) National accounting aggregates—savings, depletion and degradationGross savings (% of GNI)Consumption of fixed capital (% of GNI)Education expenditure (% of GNI)Energy depletion (% of GNI)Mineral depletion (% of GNI)Net forest depletion (% of GNI)CO2 damage (% of GNI)Particulate emissions damage (% of GNI)Adjusted net savings (% of GNI)
24,490 39,86021,389 34,611
61.5 80.50.7 1.1
63 3716.9 ..
.. 26,5154,851 5,349
30.5 28.4–0.8 0.016.2 12.9
10127455
214 28,774–2.9 –1.713.7 1.82.6 16.5
.. 81,970
.. 15,496
2,440 5,0003.9 4.4
5,242 9,41581.4 62.013.0 11.2
8.4 11.4
5,133 8,19516.3 10.3
89 41100 10099 98
100 10098 10097 9999 100
27 22.. .... ..4 6
5.5 17.913.7 13.93.2 4.60.3 1.40.1 0.20.0 0.00.2 0.20.4 0.1
–5.9 6.6
91The Little Green Data Book 2013
Country data
High-income group
GreecePopulation (millions) 11.3 Land area (1,000 sq. km) 129 GDP ($ billions) 289.6

GNI per capita, World Bank Atlas method ($)Adjusted net national income per capita ($)Urban population (% of total)Urban population growth (avg. annual %, 1990–2011) AgricultureAgricultural land (% land area)Agricultural irrigated land (% of total agricultural land)Agricultural productivity, value added per worker (2000 $)Cereal yield (kg per hectare) Forests and biodiversityForest area (% land area)Deforestation (avg. annual %, 2000–2010)Terrestrial protected areas (% of total land area)Threatened species, mammalsThreatened species, birdsThreatened species, fishThreatened species, higher plants OceansTotal fisheries production (thousand metric tons)
Capture fisheries growth (avg. annual %, 1990–2011)Aquaculture growth (avg. annual %, 1990–2011)
Marine protected areas (% of territorial waters)Coral reef area (sq. km)Mangroves area (sq. km) Energy and emissionsEnergy use per capita (kg oil equivalent)Energy from biomass products and waste (% of total)Electric power consumption per capita (kWh)Electricity generated using fossil fuel (% of total)Electricity generated by hydropower (% of total)CO2 emissions per capita (metric tons) Water and sanitationInternal freshwater resources per capita (cu. m)Total freshwater withdrawal (% of internal resources)
Agriculture (% of total freshwater withdrawal)Access to improved water source (% of total population)
Rural (% of rural population)Urban (% of urban population)
Access to improved sanitation (% of total population)Rural (% of rural population)Urban (% of urban population)
Environment and healthParticulate matter (urban-pop.-weighted avg., µg/cu. m)Acute resp. infection prevalence (% of children under five)Diarrhea prevalence (% of children under five)Under-five mortality rate (per 1,000 live births) National accounting aggregates—savings, depletion and degradationGross savings (% of GNI)Consumption of fixed capital (% of GNI)Education expenditure (% of GNI)Energy depletion (% of GNI)Mineral depletion (% of GNI)Net forest depletion (% of GNI)CO2 damage (% of GNI)Particulate emissions damage (% of GNI)Adjusted net savings (% of GNI)
26,020 39,860.. 34,611
84.7 80.50.4 1.1
1 37.. .... 26,515.. 5,349
0.0 28.40.0 0.0
40.5 12.97170
214 28,7741.9 –1.7
.. 1.836.3 16.5
.. 81,970
.. 15,496
.. 5,000
.. 4.4
.. 9,415
.. 62.0
.. 11.210.2 11.4
10,662,187 8,195.. 10.3.. 41
100 100100 98100 100100 100100 99100 100
.. 22
.. ..
.. ..
.. 6
.. 17.914.0 13.9
.. 4.60.0 1.40.0 0.2
.. 0.00.4 0.2
.. 0.1
.. 6.6
92 2013 The Little Green Data Book
Population (thousands) 57 Land area (1,000 sq. km) 410 GDP ($ billions) 1.3
Country data
High-income group
Greenland

GNI per capita, World Bank Atlas method ($)Adjusted net national income per capita ($)Urban population (% of total)Urban population growth (avg. annual %, 1990–2011) AgricultureAgricultural land (% land area)Agricultural irrigated land (% of total agricultural land)Agricultural productivity, value added per worker (2000 $)Cereal yield (kg per hectare) Forests and biodiversityForest area (% land area)Deforestation (avg. annual %, 2000–2010)Terrestrial protected areas (% of total land area)Threatened species, mammalsThreatened species, birdsThreatened species, fishThreatened species, higher plants OceansTotal fisheries production (thousand metric tons)
Capture fisheries growth (avg. annual %, 1990–2011)Aquaculture growth (avg. annual %, 1990–2011)
Marine protected areas (% of territorial waters)Coral reef area (sq. km)Mangroves area (sq. km) Energy and emissionsEnergy use per capita (kg oil equivalent)Energy from biomass products and waste (% of total)Electric power consumption per capita (kWh)Electricity generated using fossil fuel (% of total)Electricity generated by hydropower (% of total)CO2 emissions per capita (metric tons) Water and sanitationInternal freshwater resources per capita (cu. m)Total freshwater withdrawal (% of internal resources)
Agriculture (% of total freshwater withdrawal)Access to improved water source (% of total population)
Rural (% of rural population)Urban (% of urban population)
Access to improved sanitation (% of total population)Rural (% of rural population)Urban (% of urban population)
Environment and healthParticulate matter (urban-pop.-weighted avg., µg/cu. m)Acute resp. infection prevalence (% of children under five)Diarrhea prevalence (% of children under five)Under-five mortality rate (per 1,000 live births) National accounting aggregates—savings, depletion and degradationGross savings (% of GNI)Consumption of fixed capital (% of GNI)Education expenditure (% of GNI)Energy depletion (% of GNI)Mineral depletion (% of GNI)Net forest depletion (% of GNI)CO2 damage (% of GNI)Particulate emissions damage (% of GNI)Adjusted net savings (% of GNI)
7,350 8,574 6,563.. 7,648 5,821
39.2 79.1 60.61.2 2.0 2.5
32 37 352.0 .. ..
2,617 3,448 8691,032 3,838 3,944
50.0 46.8 34.80.0 0.4 0.01.7 20.2 13.3
31
193
2.3 19,009 97,4370.9 0.1 0.7
.. 11.8 9.00.02 13.1 8.4150 15,100 33,3501.4 39,997 48,783
784 1,312 1,948.. 16.7 8.1.. 1,973 2,942.. 39.0 72.9.. 53.7 21.3
2.4 2.7 5.5
.. 22,810 8,550
.. 2.0 5.6
.. 68 66
.. 94 93
.. 81 8697 98 9897 79 7397 59 6296 84 81
19 28 42.. .. .... .. ..
13 19 20
–5.9 21.1 36.412.1 12.2 11.83.8 5.0 3.30.0 4.5 5.70.0 1.9 1.6
.. 0.0 0.00.2 0.2 0.7
.. 0.3 0.7
.. 6.8 19.2
93The Little Green Data Book 2013
Country data
Latin America & Caribbean
group
Upper middle-income group
Population (thousands) 105 Land area (sq. km) 340 GDP ($ millions) 816.1
Grenada

GNI per capita, World Bank Atlas method ($)Adjusted net national income per capita ($)Urban population (% of total)Urban population growth (avg. annual %, 1990–2011) AgricultureAgricultural land (% land area)Agricultural irrigated land (% of total agricultural land)Agricultural productivity, value added per worker (2000 $)Cereal yield (kg per hectare) Forests and biodiversityForest area (% land area)Deforestation (avg. annual %, 2000–2010)Terrestrial protected areas (% of total land area)Threatened species, mammalsThreatened species, birdsThreatened species, fishThreatened species, higher plants OceansTotal fisheries production (thousand metric tons)
Capture fisheries growth (avg. annual %, 1990–2011)Aquaculture growth (avg. annual %, 1990–2011)
Marine protected areas (% of territorial waters)Coral reef area (sq. km)Mangroves area (sq. km) Energy and emissionsEnergy use per capita (kg oil equivalent)Energy from biomass products and waste (% of total)Electric power consumption per capita (kWh)Electricity generated using fossil fuel (% of total)Electricity generated by hydropower (% of total)CO2 emissions per capita (metric tons) Water and sanitationInternal freshwater resources per capita (cu. m)Total freshwater withdrawal (% of internal resources)
Agriculture (% of total freshwater withdrawal)Access to improved water source (% of total population)
Rural (% of rural population)Urban (% of urban population)
Access to improved sanitation (% of total population)Rural (% of rural population)Urban (% of urban population)
Environment and healthParticulate matter (urban-pop.-weighted avg., µg/cu. m)Acute resp. infection prevalence (% of children under five)Diarrhea prevalence (% of children under five)Under-five mortality rate (per 1,000 live births) National accounting aggregates—savings, depletion and degradationGross savings (% of GNI)Consumption of fixed capital (% of GNI)Education expenditure (% of GNI)Energy depletion (% of GNI)Mineral depletion (% of GNI)Net forest depletion (% of GNI)CO2 damage (% of GNI)Particulate emissions damage (% of GNI)Adjusted net savings (% of GNI)
.. 39,860
.. 34,61193.2 80.5
1.6 1.1
33 37.. .... 26,515
2,421 5,349
47.9 28.40.0 0.0
26.4 12.92
1493
0.42 28,774–2.1 –1.7–3.0 1.80.77 16.5220 81,9700.97 15,496
.. 5,000
.. 4.4
.. 9,415
.. 62.0
.. 11.2
.. 11.4
.. 8,195
.. 10.3
.. 41100 100100 98100 10099 10098 9999 100
.. 22
.. ..
.. ..
.. 6
.. 17.9
.. 13.9
.. 4.6
.. 1.4
.. 0.2
.. 0.0
.. 0.2
.. 0.1
.. 6.6
94 2013 The Little Green Data Book
Country data
High-income group
Population (thousands) 182 Land area (sq. km) 540 GDP ($ millions) ..
Guam

GNI per capita, World Bank Atlas method ($)Adjusted net national income per capita ($)Urban population (% of total)Urban population growth (avg. annual %, 1990–2011) AgricultureAgricultural land (% land area)Agricultural irrigated land (% of total agricultural land)Agricultural productivity, value added per worker (2000 $)Cereal yield (kg per hectare) Forests and biodiversityForest area (% land area)Deforestation (avg. annual %, 2000–2010)Terrestrial protected areas (% of total land area)Threatened species, mammalsThreatened species, birdsThreatened species, fishThreatened species, higher plants OceansTotal fisheries production (thousand metric tons)
Capture fisheries growth (avg. annual %, 1990–2011)Aquaculture growth (avg. annual %, 1990–2011)
Marine protected areas (% of territorial waters)Coral reef area (sq. km)Mangroves area (sq. km) Energy and emissionsEnergy use per capita (kg oil equivalent)Energy from biomass products and waste (% of total)Electric power consumption per capita (kWh)Electricity generated using fossil fuel (% of total)Electricity generated by hydropower (% of total)CO2 emissions per capita (metric tons) Water and sanitationInternal freshwater resources per capita (cu. m)Total freshwater withdrawal (% of internal resources)
Agriculture (% of total freshwater withdrawal)Access to improved water source (% of total population)
Rural (% of rural population)Urban (% of urban population)
Access to improved sanitation (% of total population)Rural (% of rural population)Urban (% of urban population)
Environment and healthParticulate matter (urban-pop.-weighted avg., µg/cu. m)Acute resp. infection prevalence (% of children under five)Diarrhea prevalence (% of children under five)Under-five mortality rate (per 1,000 live births) National accounting aggregates—savings, depletion and degradationGross savings (% of GNI)Consumption of fixed capital (% of GNI)Education expenditure (% of GNI)Energy depletion (% of GNI)Mineral depletion (% of GNI)Net forest depletion (% of GNI)CO2 damage (% of GNI)Particulate emissions damage (% of GNI)Adjusted net savings (% of GNI)
2,870 8,574 1,7722,681 7,648 1,59549.8 79.1 38.7
3.3 2.0 2.7
41 37 46.. .. ..
2,823 3,448 7161,987 3,838 3,065
33.6 46.8 28.41.4 0.4 0.3
30.6 20.2 9.916142573
41.2 19,009 40,2385.1 0.1 2.4
16.3 11.8 10.012.5 13.1 2.9
.. 15,100 143,440177 39,997 60,301
713 1,312 66762.0 16.7 26.2567 1,973 69833.1 39.0 73.037.3 53.7 17.41.1 2.7 1.6
7,400 22,810 3,1212.7 2.0 20.255 68 8892 94 8787 81 8498 98 9378 79 4770 59 3587 84 66
51 28 53.. .. .... .. ..
30 19 62
11.0 21.1 29.710.7 12.2 9.92.9 5.0 3.10.5 4.5 6.30.9 1.9 1.20.7 0.0 0.30.2 0.2 0.70.2 0.3 0.60.7 6.8 14.7
95The Little Green Data Book 2013
Population (millions) 14.8 Land area (1,000 sq. km) 107 GDP ($ billions) 46.9
Country data
Latin America & Caribbean
group
Lower middle-income group
Guatemala

GNI per capita, World Bank Atlas method ($)Adjusted net national income per capita ($)Urban population (% of total)Urban population growth (avg. annual %, 1990–2011) AgricultureAgricultural land (% land area)Agricultural irrigated land (% of total agricultural land)Agricultural productivity, value added per worker (2000 $)Cereal yield (kg per hectare) Forests and biodiversityForest area (% land area)Deforestation (avg. annual %, 2000–2010)Terrestrial protected areas (% of total land area)Threatened species, mammalsThreatened species, birdsThreatened species, fishThreatened species, higher plants OceansTotal fisheries production (thousand metric tons)
Capture fisheries growth (avg. annual %, 1990–2011)Aquaculture growth (avg. annual %, 1990–2011)
Marine protected areas (% of territorial waters)Coral reef area (sq. km)Mangroves area (sq. km) Energy and emissionsEnergy use per capita (kg oil equivalent)Energy from biomass products and waste (% of total)Electric power consumption per capita (kWh)Electricity generated using fossil fuel (% of total)Electricity generated by hydropower (% of total)CO2 emissions per capita (metric tons) Water and sanitationInternal freshwater resources per capita (cu. m)Total freshwater withdrawal (% of internal resources)
Agriculture (% of total freshwater withdrawal)Access to improved water source (% of total population)
Rural (% of rural population)Urban (% of urban population)
Access to improved sanitation (% of total population)Rural (% of rural population)Urban (% of urban population)
Environment and healthParticulate matter (urban-pop.-weighted avg., µg/cu. m)Acute resp. infection prevalence (% of children under five)Diarrhea prevalence (% of children under five)Under-five mortality rate (per 1,000 live births) National accounting aggregates—savings, depletion and degradationGross savings (% of GNI)Consumption of fixed capital (% of GNI)Education expenditure (% of GNI)Energy depletion (% of GNI)Mineral depletion (% of GNI)Net forest depletion (% of GNI)CO2 damage (% of GNI)Particulate emissions damage (% of GNI)Adjusted net savings (% of GNI)
430 1,258 571350 1,022 52135.5 36.5 28.0
3.9 3.8 3.5
58 44 39.. .. ..
237 334 3081,379 1,361 2,034
26.5 27.8 25.70.5 0.5 0.66.8 11.7 10.021176622
115 6,383 11,5634.7 1.8 4.0
15.3 16.0 4.90.0 5.8 ..
.. 17,980 15,1202,033 27,808 25,818
.. 683 363
.. 58.2 66.2
.. 553 242
.. 65.2 32.0
.. 18.7 45.30.1 0.9 0.3
22,110 4,455 5,1250.7 3.2 4.584 84 9074 61 6565 48 5790 83 8618 31 3711 23 3232 42 47
55 41 548 .. ..
16 .. ..126 109 95
–7.2 18.4 25.28.5 10.9 7.72.3 3.7 3.00.0 10.4 1.4
12.0 2.2 2.02.3 0.5 1.20.2 0.5 0.30.7 0.4 0.5
–28.4 –1.2 15.2
96 2013 The Little Green Data Book
Country data
Sub-Saharan Africa group
Low-income group
Population (millions) 10.2 Land area (1,000 sq. km) 246 GDP ($ billions) 5.1
Guinea

GNI per capita, World Bank Atlas method ($)Adjusted net national income per capita ($)Urban population (% of total)Urban population growth (avg. annual %, 1990–2011) AgricultureAgricultural land (% land area)Agricultural irrigated land (% of total agricultural land)Agricultural productivity, value added per worker (2000 $)Cereal yield (kg per hectare) Forests and biodiversityForest area (% land area)Deforestation (avg. annual %, 2000–2010)Terrestrial protected areas (% of total land area)Threatened species, mammalsThreatened species, birdsThreatened species, fishThreatened species, higher plants OceansTotal fisheries production (thousand metric tons)
Capture fisheries growth (avg. annual %, 1990–2011)Aquaculture growth (avg. annual %, 1990–2011)
Marine protected areas (% of territorial waters)Coral reef area (sq. km)Mangroves area (sq. km) Energy and emissionsEnergy use per capita (kg oil equivalent)Energy from biomass products and waste (% of total)Electric power consumption per capita (kWh)Electricity generated using fossil fuel (% of total)Electricity generated by hydropower (% of total)CO2 emissions per capita (metric tons) Water and sanitationInternal freshwater resources per capita (cu. m)Total freshwater withdrawal (% of internal resources)
Agriculture (% of total freshwater withdrawal)Access to improved water source (% of total population)
Rural (% of rural population)Urban (% of urban population)
Access to improved sanitation (% of total population)Rural (% of rural population)Urban (% of urban population)
Environment and healthParticulate matter (urban-pop.-weighted avg., µg/cu. m)Acute resp. infection prevalence (% of children under five)Diarrhea prevalence (% of children under five)Under-five mortality rate (per 1,000 live births) National accounting aggregates—savings, depletion and degradationGross savings (% of GNI)Consumption of fixed capital (% of GNI)Education expenditure (% of GNI)Energy depletion (% of GNI)Mineral depletion (% of GNI)Net forest depletion (% of GNI)CO2 damage (% of GNI)Particulate emissions damage (% of GNI)Adjusted net savings (% of GNI)
600 1,258 571572 1,022 521
43.9 36.5 28.04.1 3.8 3.5
58 44 39.. .. .... 334 308
1,340 1,361 2,034
71.6 27.8 25.70.5 0.5 0.6
16.1 11.7 10.012
9314
6.8 6,383 11,5631.1 1.8 4.0
.. 16.0 4.945.8 5.8 ..
.. 17,980 15,1202,982 27,808 25,818
67 683 363.. 58.2 66.2.. 553 242.. 65.2 32.0.. 18.7 45.3
0.2 0.9 0.3
10,342 4,455 5,1251.1 3.2 4.582 84 9064 61 6553 48 5791 83 8620 31 37
9 23 3244 42 47
48 41 54.. .. .... .. ..
161 109 95
.. 18.4 25.28.0 10.9 7.72.3 3.7 3.00.0 10.4 1.40.0 2.2 2.00.5 0.5 1.20.3 0.5 0.31.2 0.4 0.5
.. –1.2 15.2
97The Little Green Data Book 2013
Country data
Sub-Saharan Africa group
Low-income group
Population (millions) 1.5 Land area (1,000 sq. km) 28 GDP ($ millions) 967.8
Guinea-Bissau

GNI per capita, World Bank Atlas method ($)Adjusted net national income per capita ($)Urban population (% of total)Urban population growth (avg. annual %, 1990–2011) AgricultureAgricultural land (% land area)Agricultural irrigated land (% of total agricultural land)Agricultural productivity, value added per worker (2000 $)Cereal yield (kg per hectare) Forests and biodiversityForest area (% land area)Deforestation (avg. annual %, 2000–2010)Terrestrial protected areas (% of total land area)Threatened species, mammalsThreatened species, birdsThreatened species, fishThreatened species, higher plants OceansTotal fisheries production (thousand metric tons)
Capture fisheries growth (avg. annual %, 1990–2011)Aquaculture growth (avg. annual %, 1990–2011)
Marine protected areas (% of territorial waters)Coral reef area (sq. km)Mangroves area (sq. km) Energy and emissionsEnergy use per capita (kg oil equivalent)Energy from biomass products and waste (% of total)Electric power consumption per capita (kWh)Electricity generated using fossil fuel (% of total)Electricity generated by hydropower (% of total)CO2 emissions per capita (metric tons) Water and sanitationInternal freshwater resources per capita (cu. m)Total freshwater withdrawal (% of internal resources)
Agriculture (% of total freshwater withdrawal)Access to improved water source (% of total population)
Rural (% of rural population)Urban (% of urban population)
Access to improved sanitation (% of total population)Rural (% of rural population)Urban (% of urban population)
Environment and healthParticulate matter (urban-pop.-weighted avg., µg/cu. m)Acute resp. infection prevalence (% of children under five)Diarrhea prevalence (% of children under five)Under-five mortality rate (per 1,000 live births) National accounting aggregates—savings, depletion and degradationGross savings (% of GNI)Consumption of fixed capital (% of GNI)Education expenditure (% of GNI)Energy depletion (% of GNI)Mineral depletion (% of GNI)Net forest depletion (% of GNI)CO2 damage (% of GNI)Particulate emissions damage (% of GNI)Adjusted net savings (% of GNI)
2,900 8,574 1,7722,686 7,648 1,595
28.4 79.1 38.70.0 2.0 2.7
9 37 46.. .. ..
3,483 3,448 7164,741 3,838 3,065
77.2 46.8 28.40.0 0.4 0.35.0 20.2 9.910132821
43.4 19,009 40,2380.8 0.1 2.48.2 11.8 10.00.0 13.1 2.9
.. 15,100 143,440396 39,997 60,301
667 1,312 667.. 16.7 26.2.. 1,973 698.. 39.0 73.0.. 53.7 17.4
2.1 2.7 1.6
318,766 22,810 3,1210.7 2.0 20.298 68 8894 94 8793 81 8498 98 9384 79 4782 59 3588 84 66
20 28 53.. .. .... .. ..
36 19 62
14.4 21.1 29.710.4 12.2 9.93.4 5.0 3.10.0 4.5 6.3
10.5 1.9 1.20.0 0.0 0.30.5 0.2 0.70.1 0.3 0.6
–1.3 6.8 14.7
98 2013 The Little Green Data Book
Country data
Latin America & Caribbean
group
Lower middle-income group
Population (thousands) 756 Land area (1,000 sq. km) 197 GDP ($ billions) 2.6
Guyana
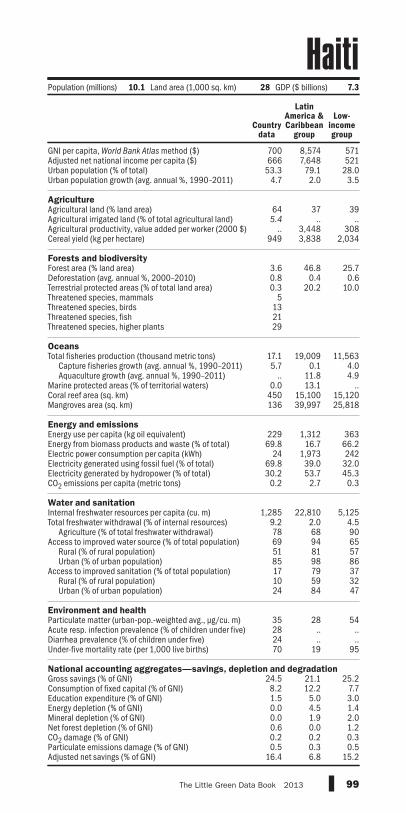
GNI per capita, World Bank Atlas method ($)Adjusted net national income per capita ($)Urban population (% of total)Urban population growth (avg. annual %, 1990–2011) AgricultureAgricultural land (% land area)Agricultural irrigated land (% of total agricultural land)Agricultural productivity, value added per worker (2000 $)Cereal yield (kg per hectare) Forests and biodiversityForest area (% land area)Deforestation (avg. annual %, 2000–2010)Terrestrial protected areas (% of total land area)Threatened species, mammalsThreatened species, birdsThreatened species, fishThreatened species, higher plants OceansTotal fisheries production (thousand metric tons)
Capture fisheries growth (avg. annual %, 1990–2011)Aquaculture growth (avg. annual %, 1990–2011)
Marine protected areas (% of territorial waters)Coral reef area (sq. km)Mangroves area (sq. km) Energy and emissionsEnergy use per capita (kg oil equivalent)Energy from biomass products and waste (% of total)Electric power consumption per capita (kWh)Electricity generated using fossil fuel (% of total)Electricity generated by hydropower (% of total)CO2 emissions per capita (metric tons) Water and sanitationInternal freshwater resources per capita (cu. m)Total freshwater withdrawal (% of internal resources)
Agriculture (% of total freshwater withdrawal)Access to improved water source (% of total population)
Rural (% of rural population)Urban (% of urban population)
Access to improved sanitation (% of total population)Rural (% of rural population)Urban (% of urban population)
Environment and healthParticulate matter (urban-pop.-weighted avg., µg/cu. m)Acute resp. infection prevalence (% of children under five)Diarrhea prevalence (% of children under five)Under-five mortality rate (per 1,000 live births) National accounting aggregates—savings, depletion and degradationGross savings (% of GNI)Consumption of fixed capital (% of GNI)Education expenditure (% of GNI)Energy depletion (% of GNI)Mineral depletion (% of GNI)Net forest depletion (% of GNI)CO2 damage (% of GNI)Particulate emissions damage (% of GNI)Adjusted net savings (% of GNI)
700 8,574 571666 7,648 521
53.3 79.1 28.04.7 2.0 3.5
64 37 395.4 .. ..
.. 3,448 308949 3,838 2,034
3.6 46.8 25.70.8 0.4 0.60.3 20.2 10.0
5132129
17.1 19,009 11,5635.7 0.1 4.0
.. 11.8 4.90.0 13.1 ..
450 15,100 15,120136 39,997 25,818
229 1,312 36369.8 16.7 66.2
24 1,973 24269.8 39.0 32.030.2 53.7 45.3
0.2 2.7 0.3
1,285 22,810 5,1259.2 2.0 4.578 68 9069 94 6551 81 5785 98 8617 79 3710 59 3224 84 47
35 28 5428 .. ..24 .. ..70 19 95
24.5 21.1 25.28.2 12.2 7.71.5 5.0 3.00.0 4.5 1.40.0 1.9 2.00.6 0.0 1.20.2 0.2 0.30.5 0.3 0.5
16.4 6.8 15.2
99The Little Green Data Book 2013
Country data
Latin America & Caribbean
group
Low-income group
Population (millions) 10.1 Land area (1,000 sq. km) 28 GDP ($ billions) 7.3
Haiti

GNI per capita, World Bank Atlas method ($)Adjusted net national income per capita ($)Urban population (% of total)Urban population growth (avg. annual %, 1990–2011) AgricultureAgricultural land (% land area)Agricultural irrigated land (% of total agricultural land)Agricultural productivity, value added per worker (2000 $)Cereal yield (kg per hectare) Forests and biodiversityForest area (% land area)Deforestation (avg. annual %, 2000–2010)Terrestrial protected areas (% of total land area)Threatened species, mammalsThreatened species, birdsThreatened species, fishThreatened species, higher plants OceansTotal fisheries production (thousand metric tons)
Capture fisheries growth (avg. annual %, 1990–2011)Aquaculture growth (avg. annual %, 1990–2011)
Marine protected areas (% of territorial waters)Coral reef area (sq. km)Mangroves area (sq. km) Energy and emissionsEnergy use per capita (kg oil equivalent)Energy from biomass products and waste (% of total)Electric power consumption per capita (kWh)Electricity generated using fossil fuel (% of total)Electricity generated by hydropower (% of total)CO2 emissions per capita (metric tons) Water and sanitationInternal freshwater resources per capita (cu. m)Total freshwater withdrawal (% of internal resources)
Agriculture (% of total freshwater withdrawal)Access to improved water source (% of total population)
Rural (% of rural population)Urban (% of urban population)
Access to improved sanitation (% of total population)Rural (% of rural population)Urban (% of urban population)
Environment and healthParticulate matter (urban-pop.-weighted avg., µg/cu. m)Acute resp. infection prevalence (% of children under five)Diarrhea prevalence (% of children under five)Under-five mortality rate (per 1,000 live births) National accounting aggregates—savings, depletion and degradationGross savings (% of GNI)Consumption of fixed capital (% of GNI)Education expenditure (% of GNI)Energy depletion (% of GNI)Mineral depletion (% of GNI)Net forest depletion (% of GNI)CO2 damage (% of GNI)Particulate emissions damage (% of GNI)Adjusted net savings (% of GNI)
1,980 8,574 1,7721,889 7,648 1,595
52.2 79.1 38.73.4 2.0 2.7
29 37 46.. .. ..
2,163 3,448 7161,233 3,838 3,065
45.3 46.8 28.42.1 0.4 0.3
18.2 20.2 9.97
1128
107
46.1 19,009 40,238–2.7 0.1 2.412.0 11.8 10.0
1.9 13.1 2.9810 15,100 143,440628 39,997 60,301
601 1,312 66743.0 16.7 26.2671 1,973 698
53.9 39.0 73.044.0 53.7 17.4
1.0 2.7 1.6
12,371 22,810 3,1211.2 2.0 20.258 68 8887 94 8779 81 8495 98 9377 79 4769 59 3585 84 66
34 28 5317 .. ..16 .. ..21 19 62
18.9 21.1 29.710.4 12.2 9.93.5 5.0 3.10.0 4.5 6.30.6 1.9 1.20.0 0.0 0.30.4 0.2 0.70.2 0.3 0.6
10.8 6.8 14.7
100 2013 The Little Green Data Book
Country data
Latin America & Caribbean
group
Lower middle-income group
Population (millions) 7.8 Land area (1,000 sq. km) 112 GDP ($ billions) 17.4
Honduras
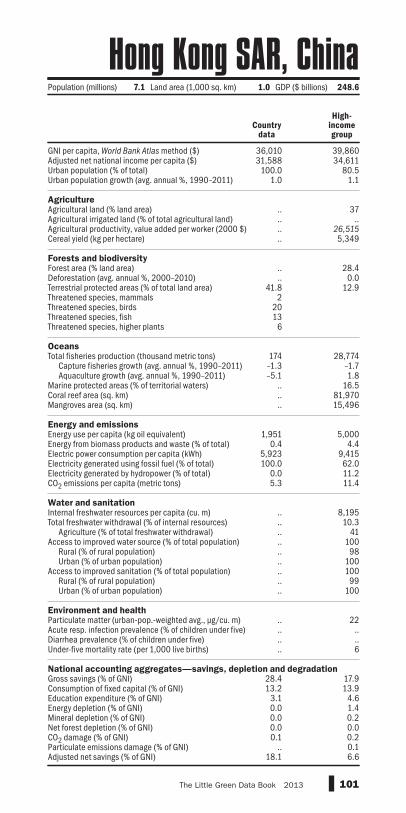
GNI per capita, World Bank Atlas method ($)Adjusted net national income per capita ($)Urban population (% of total)Urban population growth (avg. annual %, 1990–2011) AgricultureAgricultural land (% land area)Agricultural irrigated land (% of total agricultural land)Agricultural productivity, value added per worker (2000 $)Cereal yield (kg per hectare) Forests and biodiversityForest area (% land area)Deforestation (avg. annual %, 2000–2010)Terrestrial protected areas (% of total land area)Threatened species, mammalsThreatened species, birdsThreatened species, fishThreatened species, higher plants OceansTotal fisheries production (thousand metric tons)
Capture fisheries growth (avg. annual %, 1990–2011)Aquaculture growth (avg. annual %, 1990–2011)
Marine protected areas (% of territorial waters)Coral reef area (sq. km)Mangroves area (sq. km) Energy and emissionsEnergy use per capita (kg oil equivalent)Energy from biomass products and waste (% of total)Electric power consumption per capita (kWh)Electricity generated using fossil fuel (% of total)Electricity generated by hydropower (% of total)CO2 emissions per capita (metric tons) Water and sanitationInternal freshwater resources per capita (cu. m)Total freshwater withdrawal (% of internal resources)
Agriculture (% of total freshwater withdrawal)Access to improved water source (% of total population)
Rural (% of rural population)Urban (% of urban population)
Access to improved sanitation (% of total population)Rural (% of rural population)Urban (% of urban population)
Environment and healthParticulate matter (urban-pop.-weighted avg., µg/cu. m)Acute resp. infection prevalence (% of children under five)Diarrhea prevalence (% of children under five)Under-five mortality rate (per 1,000 live births) National accounting aggregates—savings, depletion and degradationGross savings (% of GNI)Consumption of fixed capital (% of GNI)Education expenditure (% of GNI)Energy depletion (% of GNI)Mineral depletion (% of GNI)Net forest depletion (% of GNI)CO2 damage (% of GNI)Particulate emissions damage (% of GNI)Adjusted net savings (% of GNI)
36,010 39,86031,588 34,611
100.0 80.51.0 1.1
.. 37
.. ..
.. 26,515
.. 5,349
.. 28.4
.. 0.041.8 12.9
22013
6
174 28,774–1.3 –1.7–5.1 1.8
.. 16.5
.. 81,970
.. 15,496
1,951 5,0000.4 4.4
5,923 9,415100.0 62.0
0.0 11.25.3 11.4
.. 8,195
.. 10.3
.. 41
.. 100
.. 98
.. 100
.. 100
.. 99
.. 100
.. 22
.. ..
.. ..
.. 6
28.4 17.913.2 13.9
3.1 4.60.0 1.40.0 0.20.0 0.00.1 0.2
.. 0.118.1 6.6
101The Little Green Data Book 2013
Country data
High-income group
Population (millions) 7.1 Land area (1,000 sq. km) 1.0 GDP ($ billions) 248.6
Hong Kong SAR, China

GNI per capita, World Bank Atlas method ($)Adjusted net national income per capita ($)Urban population (% of total)Urban population growth (avg. annual %, 1990–2011) AgricultureAgricultural land (% land area)Agricultural irrigated land (% of total agricultural land)Agricultural productivity, value added per worker (2000 $)Cereal yield (kg per hectare) Forests and biodiversityForest area (% land area)Deforestation (avg. annual %, 2000–2010)Terrestrial protected areas (% of total land area)Threatened species, mammalsThreatened species, birdsThreatened species, fishThreatened species, higher plants OceansTotal fisheries production (thousand metric tons)
Capture fisheries growth (avg. annual %, 1990–2011)Aquaculture growth (avg. annual %, 1990–2011)
Marine protected areas (% of territorial waters)Coral reef area (sq. km)Mangroves area (sq. km) Energy and emissionsEnergy use per capita (kg oil equivalent)Energy from biomass products and waste (% of total)Electric power consumption per capita (kWh)Electricity generated using fossil fuel (% of total)Electricity generated by hydropower (% of total)CO2 emissions per capita (metric tons) Water and sanitationInternal freshwater resources per capita (cu. m)Total freshwater withdrawal (% of internal resources)
Agriculture (% of total freshwater withdrawal)Access to improved water source (% of total population)
Rural (% of rural population)Urban (% of urban population)
Access to improved sanitation (% of total population)Rural (% of rural population)Urban (% of urban population)
Environment and healthParticulate matter (urban-pop.-weighted avg., µg/cu. m)Acute resp. infection prevalence (% of children under five)Diarrhea prevalence (% of children under five)Under-five mortality rate (per 1,000 live births) National accounting aggregates—savings, depletion and degradationGross savings (% of GNI)Consumption of fixed capital (% of GNI)Education expenditure (% of GNI)Energy depletion (% of GNI)Mineral depletion (% of GNI)Net forest depletion (% of GNI)CO2 damage (% of GNI)Particulate emissions damage (% of GNI)Adjusted net savings (% of GNI)
12,730 39,86011,364 34,611
69.4 80.50.1 1.1
59 371.8 ..
8,522 26,5155,099 5,349
22.5 28.4–0.6 0.05.1 12.9
21099
22.6 28,774–3.9 –1.7–0.6 1.8
.. 16.5
.. 81,970
.. 15,496
2,567 5,0007.3 4.4
3,876 9,41549.3 62.0
0.5 11.24.9 11.4
602 8,19593.2 10.3
6 41100 100100 98100 100100 100100 99100 100
15 22.. .... ..6 6
22.0 17.913.2 13.9
4.9 4.60.5 1.40.0 0.20.0 0.00.3 0.20.0 0.1
12.9 6.6
102 2013 The Little Green Data Book
Country data
High-income group
Population (millions) 10.0 Land area (1,000 sq. km) 91 GDP ($ billions) 140.0
Hungary

GNI per capita, World Bank Atlas method ($)Adjusted net national income per capita ($)Urban population (% of total)Urban population growth (avg. annual %, 1990–2011) AgricultureAgricultural land (% land area)Agricultural irrigated land (% of total agricultural land)Agricultural productivity, value added per worker (2000 $)Cereal yield (kg per hectare) Forests and biodiversityForest area (% land area)Deforestation (avg. annual %, 2000–2010)Terrestrial protected areas (% of total land area)Threatened species, mammalsThreatened species, birdsThreatened species, fishThreatened species, higher plants OceansTotal fisheries production (thousand metric tons)
Capture fisheries growth (avg. annual %, 1990–2011)Aquaculture growth (avg. annual %, 1990–2011)
Marine protected areas (% of territorial waters)Coral reef area (sq. km)Mangroves area (sq. km) Energy and emissionsEnergy use per capita (kg oil equivalent)Energy from biomass products and waste (% of total)Electric power consumption per capita (kWh)Electricity generated using fossil fuel (% of total)Electricity generated by hydropower (% of total)CO2 emissions per capita (metric tons) Water and sanitationInternal freshwater resources per capita (cu. m)Total freshwater withdrawal (% of internal resources)
Agriculture (% of total freshwater withdrawal)Access to improved water source (% of total population)
Rural (% of rural population)Urban (% of urban population)
Access to improved sanitation (% of total population)Rural (% of rural population)Urban (% of urban population)
Environment and healthParticulate matter (urban-pop.-weighted avg., µg/cu. m)Acute resp. infection prevalence (% of children under five)Diarrhea prevalence (% of children under five)Under-five mortality rate (per 1,000 live births) National accounting aggregates—savings, depletion and degradationGross savings (% of GNI)Consumption of fixed capital (% of GNI)Education expenditure (% of GNI)Energy depletion (% of GNI)Mineral depletion (% of GNI)Net forest depletion (% of GNI)CO2 damage (% of GNI)Particulate emissions damage (% of GNI)Adjusted net savings (% of GNI)
34,820 39,86031,219 34,611
93.7 80.51.2 1.1
16 37.. ..
56,880 26,515.. 5,349
0.3 28.4–5.0 0.019.7 12.9
61
120
1,160 28,774–1.3 –1.73.0 1.83.9 16.5
.. 81,970
.. 15,496
16,882 5,0000.0 4.4
51,440 9,4150.0 62.0
73.8 11.26.4 11.4
532,892 8,1950.1 10.342 41
100 100100 98100 100100 100100 99100 100
18 22.. .... ..3 6
8.6 17.916.5 13.9
9.0 4.60.0 1.40.0 0.20.0 0.00.1 0.20.1 0.10.8 6.6
103The Little Green Data Book 2013
Country data
High-income group
Population (thousands) 319 Land area (1,000 sq. km) 100a GDP ($ billions) 14.0
Iceland

GNI per capita, World Bank Atlas method ($)Adjusted net national income per capita ($)Urban population (% of total)Urban population growth (avg. annual %, 1990–2011) AgricultureAgricultural land (% land area)Agricultural irrigated land (% of total agricultural land)Agricultural productivity, value added per worker (2000 $)Cereal yield (kg per hectare) Forests and biodiversityForest area (% land area)Deforestation (avg. annual %, 2000–2010)Terrestrial protected areas (% of total land area)Threatened species, mammalsThreatened species, birdsThreatened species, fishThreatened species, higher plants OceansTotal fisheries production (thousand metric tons)
Capture fisheries growth (avg. annual %, 1990–2011)Aquaculture growth (avg. annual %, 1990–2011)
Marine protected areas (% of territorial waters)Coral reef area (sq. km)Mangroves area (sq. km) Energy and emissionsEnergy use per capita (kg oil equivalent)Energy from biomass products and waste (% of total)Electric power consumption per capita (kWh)Electricity generated using fossil fuel (% of total)Electricity generated by hydropower (% of total)CO2 emissions per capita (metric tons) Water and sanitationInternal freshwater resources per capita (cu. m)Total freshwater withdrawal (% of internal resources)
Agriculture (% of total freshwater withdrawal)Access to improved water source (% of total population)
Rural (% of rural population)Urban (% of urban population)
Access to improved sanitation (% of total population)Rural (% of rural population)Urban (% of urban population)
Environment and healthParticulate matter (urban-pop.-weighted avg., µg/cu. m)Acute resp. infection prevalence (% of children under five)Diarrhea prevalence (% of children under five)Under-five mortality rate (per 1,000 live births) National accounting aggregates—savings, depletion and degradationGross savings (% of GNI)Consumption of fixed capital (% of GNI)Education expenditure (% of GNI)Energy depletion (% of GNI)Mineral depletion (% of GNI)Net forest depletion (% of GNI)CO2 damage (% of GNI)Particulate emissions damage (% of GNI)Adjusted net savings (% of GNI)
1,420 1,313 1,7721,283 1,201 1,595
31.3 30.9 38.72.6 2.8 2.7
60 55 4635.2 .. ..523 550 716
2,883 2,959 3,065
23.1 17.1 28.4–0.5 –0.3 0.35.0 5.9 9.99480
212300
8,879 13,219 40,2382.0 2.3 2.47.4 8.1 10.01.7 1.7 2.9
5,790 15,440 143,4404,326 10,343 60,301
566 519 66724.6 26.7 26.2616 555 698
83.1 80.6 73.011.9 14.0 17.41.6 1.4 1.6
1,165 1,197 3,12152.6 51.6 20.2
90 91 8892 90 8790 88 8497 96 9334 38 4723 28 3558 60 66
52 62 539 .. ..9 .. ..
61 62 62
35.0 33.5 29.79.3 9.2 9.93.1 2.8 3.13.1 2.8 6.31.3 1.0 1.20.5 0.6 0.30.9 0.8 0.70.6 0.6 0.6
22.5 21.6 14.7
104 2013 The Little Green Data Book
Country data
South Asia
group
Lower middle-income group
Population (millions) 1,241.5 Land area (1,000 sq. km) 2,973 GDP ($ billions) 1,872.8
India

GNI per capita, World Bank Atlas method ($)Adjusted net national income per capita ($)Urban population (% of total)Urban population growth (avg. annual %, 1990–2011) AgricultureAgricultural land (% land area)Agricultural irrigated land (% of total agricultural land)Agricultural productivity, value added per worker (2000 $)Cereal yield (kg per hectare) Forests and biodiversityForest area (% land area)Deforestation (avg. annual %, 2000–2010)Terrestrial protected areas (% of total land area)Threatened species, mammalsThreatened species, birdsThreatened species, fishThreatened species, higher plants OceansTotal fisheries production (thousand metric tons)
Capture fisheries growth (avg. annual %, 1990–2011)Aquaculture growth (avg. annual %, 1990–2011)
Marine protected areas (% of territorial waters)Coral reef area (sq. km)Mangroves area (sq. km) Energy and emissionsEnergy use per capita (kg oil equivalent)Energy from biomass products and waste (% of total)Electric power consumption per capita (kWh)Electricity generated using fossil fuel (% of total)Electricity generated by hydropower (% of total)CO2 emissions per capita (metric tons) Water and sanitationInternal freshwater resources per capita (cu. m)Total freshwater withdrawal (% of internal resources)
Agriculture (% of total freshwater withdrawal)Access to improved water source (% of total population)
Rural (% of rural population)Urban (% of urban population)
Access to improved sanitation (% of total population)Rural (% of rural population)Urban (% of urban population)
Environment and healthParticulate matter (urban-pop.-weighted avg., µg/cu. m)Acute resp. infection prevalence (% of children under five)Diarrhea prevalence (% of children under five)Under-five mortality rate (per 1,000 live births) National accounting aggregates—savings, depletion and degradationGross savings (% of GNI)Consumption of fixed capital (% of GNI)Education expenditure (% of GNI)Energy depletion (% of GNI)Mineral depletion (% of GNI)Net forest depletion (% of GNI)CO2 damage (% of GNI)Particulate emissions damage (% of GNI)Adjusted net savings (% of GNI)
2,940 4,248 1,7722,784 3,884 1,595
50.7 48.6 38.73.7 3.6 2.7
30 48 46.. .. ..
753 610 7164,886 5,050 3,065
51.7 29.7 28.40.5 –0.4 0.3
14.1 15.0 9.9184122141385
13,651 101,299 40,2383.7 3.4 2.4
13.1 9.1 10.02.0 1.4 2.9
51,020 137,690 143,44031,894 56,537 60,301
867 1,520 66726.0 10.9 26.2641 2,337 698
84.0 79.8 73.010.4 16.5 17.41.9 4.6 1.6
8,332 4,446 3,1215.6 10.9 20.282 73 8882 90 8774 84 8492 97 9354 66 4739 58 3573 76 66
60 55 53.. .. ..
14 .. ..32 21 62
32.8 49.3 29.710.7 11.0 9.92.7 2.1 3.16.2 4.3 6.31.1 1.7 1.20.0 0.0 0.30.4 0.9 0.70.6 1.1 0.6
16.5 32.2 14.7
105The Little Green Data Book 2013
Country data
East Asia & Pacific
group
Lower middle-income group
Population (millions) 242.3 Land area (1,000 sq. km) 1,812 GDP ($ billions) 846.8
Indonesia

GNI per capita, World Bank Atlas method ($)Adjusted net national income per capita ($)Urban population (% of total)Urban population growth (avg. annual %, 1990–2011) AgricultureAgricultural land (% land area)Agricultural irrigated land (% of total agricultural land)Agricultural productivity, value added per worker (2000 $)Cereal yield (kg per hectare) Forests and biodiversityForest area (% land area)Deforestation (avg. annual %, 2000–2010)Terrestrial protected areas (% of total land area)Threatened species, mammalsThreatened species, birdsThreatened species, fishThreatened species, higher plants OceansTotal fisheries production (thousand metric tons)
Capture fisheries growth (avg. annual %, 1990–2011)Aquaculture growth (avg. annual %, 1990–2011)
Marine protected areas (% of territorial waters)Coral reef area (sq. km)Mangroves area (sq. km) Energy and emissionsEnergy use per capita (kg oil equivalent)Energy from biomass products and waste (% of total)Electric power consumption per capita (kWh)Electricity generated using fossil fuel (% of total)Electricity generated by hydropower (% of total)CO2 emissions per capita (metric tons) Water and sanitationInternal freshwater resources per capita (cu. m)Total freshwater withdrawal (% of internal resources)
Agriculture (% of total freshwater withdrawal)Access to improved water source (% of total population)
Rural (% of rural population)Urban (% of urban population)
Access to improved sanitation (% of total population)Rural (% of rural population)Urban (% of urban population)
Environment and healthParticulate matter (urban-pop.-weighted avg., µg/cu. m)Acute resp. infection prevalence (% of children under five)Diarrhea prevalence (% of children under five)Under-five mortality rate (per 1,000 live births) National accounting aggregates—savings, depletion and degradationGross savings (% of GNI)Consumption of fixed capital (% of GNI)Education expenditure (% of GNI)Energy depletion (% of GNI)Mineral depletion (% of GNI)Net forest depletion (% of GNI)CO2 damage (% of GNI)Particulate emissions damage (% of GNI)Adjusted net savings (% of GNI)
4,520 3,866 6,5633,106 3,285 5,82169.1 58.9 60.6
2.4 2.5 2.5
30 23 3519.0 .. ..
3,104 2,627 8692,469 2,475 3,944
6.8 2.4 34.80.0 –0.1 0.07.1 3.9 13.3162230
2
735 3,538 97,4373.4 2.4 0.7
11.1 13.1 9.01.7 2.0 8.4
700 5,700 33,350192 217 48,783
2,817 1,372 1,9480.1 0.9 8.1
2,652 1,658 2,94295.8 92.9 72.9
4.1 5.4 21.38.2 4.1 5.5
1,718 673 8,55072.6 122.1 5.6
92 86 6696 89 9392 81 8697 94 98
100 88 73100 80 62100 94 81
56 59 42.. .. .... .. ..
25 32 20
.. 27.0 36.411.3 10.8 11.8
4.1 4.5 3.319.1 15.2 5.70.6 0.6 1.60.0 0.1 0.01.3 0.6 0.70.8 0.9 0.7
.. 6.1 19.2
106 2013 The Little Green Data Book
Country data
Middle East &
N. Africa group
Upper middle-income group
Population (millions) 74.8 Land area (1,000 sq. km) 1,629 GDP ($ billions) 331.0
Iran, Islamic Rep.

GNI per capita, World Bank Atlas method ($)Adjusted net national income per capita ($)Urban population (% of total)Urban population growth (avg. annual %, 1990–2011) AgricultureAgricultural land (% land area)Agricultural irrigated land (% of total agricultural land)Agricultural productivity, value added per worker (2000 $)Cereal yield (kg per hectare) Forests and biodiversityForest area (% land area)Deforestation (avg. annual %, 2000–2010)Terrestrial protected areas (% of total land area)Threatened species, mammalsThreatened species, birdsThreatened species, fishThreatened species, higher plants OceansTotal fisheries production (thousand metric tons)
Capture fisheries growth (avg. annual %, 1990–2011)Aquaculture growth (avg. annual %, 1990–2011)
Marine protected areas (% of territorial waters)Coral reef area (sq. km)Mangroves area (sq. km) Energy and emissionsEnergy use per capita (kg oil equivalent)Energy from biomass products and waste (% of total)Electric power consumption per capita (kWh)Electricity generated using fossil fuel (% of total)Electricity generated by hydropower (% of total)CO2 emissions per capita (metric tons) Water and sanitationInternal freshwater resources per capita (cu. m)Total freshwater withdrawal (% of internal resources)
Agriculture (% of total freshwater withdrawal)Access to improved water source (% of total population)
Rural (% of rural population)Urban (% of urban population)
Access to improved sanitation (% of total population)Rural (% of rural population)Urban (% of urban population)
Environment and healthParticulate matter (urban-pop.-weighted avg., µg/cu. m)Acute resp. infection prevalence (% of children under five)Diarrhea prevalence (% of children under five)Under-five mortality rate (per 1,000 live births) National accounting aggregates—savings, depletion and degradationGross savings (% of GNI)Consumption of fixed capital (% of GNI)Education expenditure (% of GNI)Energy depletion (% of GNI)Mineral depletion (% of GNI)Net forest depletion (% of GNI)CO2 damage (% of GNI)Particulate emissions damage (% of GNI)Adjusted net savings (% of GNI)
2,640 3,866 1,7721,311 3,285 1,59566.5 58.9 38.7
2.6 2.5 2.7
19 23 46.. .. .... 2,627 716
1,799 2,475 3,065
1.9 2.4 28.4–0.1 –0.1 0.30.1 3.9 9.91316111
51.8 3,538 40,2381.6 2.4 2.4
12.9 13.1 10.00.0 2.0 2.9
.. 5,700 143,440
.. 217 60,301
1,180 1,372 6670.1 0.9 26.2
1,183 1,658 69890.5 92.9 73.0
9.5 5.4 17.43.5 4.1 1.6
1,068 673 3,121187.5 122.1 20.2
79 86 8879 89 8756 81 8491 94 9373 88 4767 80 3576 94 66
88 59 53.. .. .... .. ..
38 32 62
.. 27.0 29.710.8 10.8 9.9
.. 4.5 3.150.6 15.2 6.3
0.0 0.6 1.20.0 0.1 0.30.9 0.6 0.73.5 0.9 0.6
.. 6.1 14.7
107The Little Green Data Book 2013
Country data
Middle East &
N. Africa group
Lower middle-income group
Population (millions) 33.0 Land area (1,000 sq. km) 434 GDP ($ billions) 115.4
Iraq

GNI per capita, World Bank Atlas method ($)Adjusted net national income per capita ($)Urban population (% of total)Urban population growth (avg. annual %, 1990–2011) AgricultureAgricultural land (% land area)Agricultural irrigated land (% of total agricultural land)Agricultural productivity, value added per worker (2000 $)Cereal yield (kg per hectare) Forests and biodiversityForest area (% land area)Deforestation (avg. annual %, 2000–2010)Terrestrial protected areas (% of total land area)Threatened species, mammalsThreatened species, birdsThreatened species, fishThreatened species, higher plants OceansTotal fisheries production (thousand metric tons)
Capture fisheries growth (avg. annual %, 1990–2011)Aquaculture growth (avg. annual %, 1990–2011)
Marine protected areas (% of territorial waters)Coral reef area (sq. km)Mangroves area (sq. km) Energy and emissionsEnergy use per capita (kg oil equivalent)Energy from biomass products and waste (% of total)Electric power consumption per capita (kWh)Electricity generated using fossil fuel (% of total)Electricity generated by hydropower (% of total)CO2 emissions per capita (metric tons) Water and sanitationInternal freshwater resources per capita (cu. m)Total freshwater withdrawal (% of internal resources)
Agriculture (% of total freshwater withdrawal)Access to improved water source (% of total population)
Rural (% of rural population)Urban (% of urban population)
Access to improved sanitation (% of total population)Rural (% of rural population)Urban (% of urban population)
Environment and healthParticulate matter (urban-pop.-weighted avg., µg/cu. m)Acute resp. infection prevalence (% of children under five)Diarrhea prevalence (% of children under five)Under-five mortality rate (per 1,000 live births) National accounting aggregates—savings, depletion and degradationGross savings (% of GNI)Consumption of fixed capital (% of GNI)Education expenditure (% of GNI)Energy depletion (% of GNI)Mineral depletion (% of GNI)Net forest depletion (% of GNI)CO2 damage (% of GNI)Particulate emissions damage (% of GNI)Adjusted net savings (% of GNI)
39,150 39,86032,178 34,611
62.2 80.51.7 1.1
66 37.. ..
13,931 26,5158,440 5,349
10.9 28.4–1.5 0.01.8 12.9
53
211
288 28,774–0.1 –1.72.4 1.8
0.18 16.5.. 81,970.. 15,496
3,218 5,0002.6 4.4
6,025 9,41579.0 62.0
2.1 11.29.3 11.4
10,707 8,1951.6 10.310 41
100 100100 98100 10099 10098 99
100 100
13 22.. .... ..4 6
17.1 17.917.2 13.95.9 4.60.0 1.40.1 0.20.0 0.00.2 0.20.0 0.15.5 6.6
108 2013 The Little Green Data Book
Country data
High-income group
Population (millions) 4.6 Land area (1,000 sq. km) 69 GDP ($ billions) 217.3
Ireland

GNI per capita, World Bank Atlas method ($)Adjusted net national income per capita ($)Urban population (% of total)Urban population growth (avg. annual %, 1990–2011) AgricultureAgricultural land (% land area)Agricultural irrigated land (% of total agricultural land)Agricultural productivity, value added per worker (2000 $)Cereal yield (kg per hectare) Forests and biodiversityForest area (% land area)Deforestation (avg. annual %, 2000–2010)Terrestrial protected areas (% of total land area)Threatened species, mammalsThreatened species, birdsThreatened species, fishThreatened species, higher plants OceansTotal fisheries production (thousand metric tons)
Capture fisheries growth (avg. annual %, 1990–2011)Aquaculture growth (avg. annual %, 1990–2011)
Marine protected areas (% of territorial waters)Coral reef area (sq. km)Mangroves area (sq. km) Energy and emissionsEnergy use per capita (kg oil equivalent)Energy from biomass products and waste (% of total)Electric power consumption per capita (kWh)Electricity generated using fossil fuel (% of total)Electricity generated by hydropower (% of total)CO2 emissions per capita (metric tons) Water and sanitationInternal freshwater resources per capita (cu. m)Total freshwater withdrawal (% of internal resources)
Agriculture (% of total freshwater withdrawal)Access to improved water source (% of total population)
Rural (% of rural population)Urban (% of urban population)
Access to improved sanitation (% of total population)Rural (% of rural population)Urban (% of urban population)
Environment and healthParticulate matter (urban-pop.-weighted avg., µg/cu. m)Acute resp. infection prevalence (% of children under five)Diarrhea prevalence (% of children under five)Under-five mortality rate (per 1,000 live births) National accounting aggregates—savings, depletion and degradationGross savings (% of GNI)Consumption of fixed capital (% of GNI)Education expenditure (% of GNI)Energy depletion (% of GNI)Mineral depletion (% of GNI)Net forest depletion (% of GNI)CO2 damage (% of GNI)Particulate emissions damage (% of GNI)Adjusted net savings (% of GNI)
48,910 39,860.. 34,611
50.6 80.50.7 1.1
75 37.. .... 26,515.. 5,349
6.1 28.40.0 0.0
.. 12.90020
6.8 28,7742.5 –1.7
.. 1.8
.. 16.5
.. 81,970
.. 15,496
.. 5,000
.. 4.4
.. 9,415
.. 62.0
.. 11.2
.. 11.4
.. 8,195
.. 10.3
.. 41
.. 100
.. 98
.. 100
.. 100
.. 99
.. 100
.. 22
.. ..
.. ..
.. 6
.. 17.912.8 13.9
.. 4.60.0 1.40.0 0.2
.. 0.0
.. 0.2
.. 0.1
.. 6.6
109The Little Green Data Book 2013
Country data
High-income group
Population (thousands) 83 Land area (sq. km) 570 GDP ($ billions) 4.1
Isle of Man
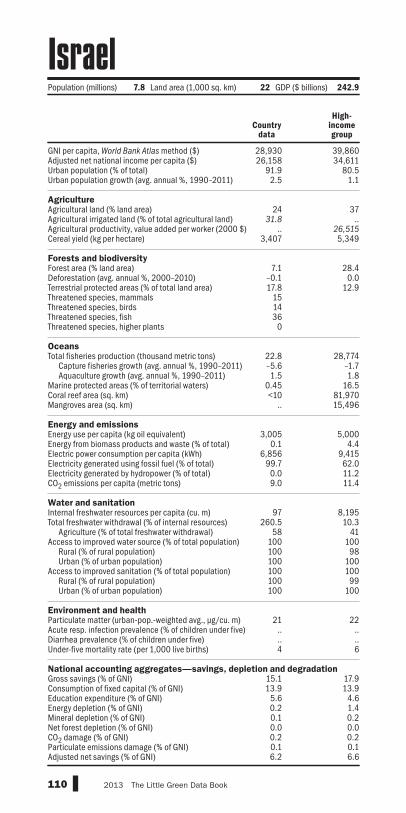
GNI per capita, World Bank Atlas method ($)Adjusted net national income per capita ($)Urban population (% of total)Urban population growth (avg. annual %, 1990–2011) AgricultureAgricultural land (% land area)Agricultural irrigated land (% of total agricultural land)Agricultural productivity, value added per worker (2000 $)Cereal yield (kg per hectare) Forests and biodiversityForest area (% land area)Deforestation (avg. annual %, 2000–2010)Terrestrial protected areas (% of total land area)Threatened species, mammalsThreatened species, birdsThreatened species, fishThreatened species, higher plants OceansTotal fisheries production (thousand metric tons)
Capture fisheries growth (avg. annual %, 1990–2011)Aquaculture growth (avg. annual %, 1990–2011)
Marine protected areas (% of territorial waters)Coral reef area (sq. km)Mangroves area (sq. km) Energy and emissionsEnergy use per capita (kg oil equivalent)Energy from biomass products and waste (% of total)Electric power consumption per capita (kWh)Electricity generated using fossil fuel (% of total)Electricity generated by hydropower (% of total)CO2 emissions per capita (metric tons) Water and sanitationInternal freshwater resources per capita (cu. m)Total freshwater withdrawal (% of internal resources)
Agriculture (% of total freshwater withdrawal)Access to improved water source (% of total population)
Rural (% of rural population)Urban (% of urban population)
Access to improved sanitation (% of total population)Rural (% of rural population)Urban (% of urban population)
Environment and healthParticulate matter (urban-pop.-weighted avg., µg/cu. m)Acute resp. infection prevalence (% of children under five)Diarrhea prevalence (% of children under five)Under-five mortality rate (per 1,000 live births) National accounting aggregates—savings, depletion and degradationGross savings (% of GNI)Consumption of fixed capital (% of GNI)Education expenditure (% of GNI)Energy depletion (% of GNI)Mineral depletion (% of GNI)Net forest depletion (% of GNI)CO2 damage (% of GNI)Particulate emissions damage (% of GNI)Adjusted net savings (% of GNI)
28,930 39,86026,158 34,611
91.9 80.52.5 1.1
24 3731.8 ..
.. 26,5153,407 5,349
7.1 28.4–0.1 0.017.8 12.9
151436
0
22.8 28,774–5.6 –1.71.5 1.8
0.45 16.5<10 81,970
.. 15,496
3,005 5,0000.1 4.4
6,856 9,41599.7 62.00.0 11.29.0 11.4
97 8,195260.5 10.3
58 41100 100100 98100 100100 100100 99100 100
21 22.. .... ..4 6
15.1 17.913.9 13.9
5.6 4.60.2 1.40.1 0.20.0 0.00.2 0.20.1 0.16.2 6.6
110 2013 The Little Green Data Book
Population (millions) 7.8 Land area (1,000 sq. km) 22 GDP ($ billions) 242.9
Country data
High-income group
Israel

GNI per capita, World Bank Atlas method ($)Adjusted net national income per capita ($)Urban population (% of total)Urban population growth (avg. annual %, 1990–2011) AgricultureAgricultural land (% land area)Agricultural irrigated land (% of total agricultural land)Agricultural productivity, value added per worker (2000 $)Cereal yield (kg per hectare) Forests and biodiversityForest area (% land area)Deforestation (avg. annual %, 2000–2010)Terrestrial protected areas (% of total land area)Threatened species, mammalsThreatened species, birdsThreatened species, fishThreatened species, higher plants OceansTotal fisheries production (thousand metric tons)
Capture fisheries growth (avg. annual %, 1990–2011)Aquaculture growth (avg. annual %, 1990–2011)
Marine protected areas (% of territorial waters)Coral reef area (sq. km)Mangroves area (sq. km) Energy and emissionsEnergy use per capita (kg oil equivalent)Energy from biomass products and waste (% of total)Electric power consumption per capita (kWh)Electricity generated using fossil fuel (% of total)Electricity generated by hydropower (% of total)CO2 emissions per capita (metric tons) Water and sanitationInternal freshwater resources per capita (cu. m)Total freshwater withdrawal (% of internal resources)
Agriculture (% of total freshwater withdrawal)Access to improved water source (% of total population)
Rural (% of rural population)Urban (% of urban population)
Access to improved sanitation (% of total population)Rural (% of rural population)Urban (% of urban population)
Environment and healthParticulate matter (urban-pop.-weighted avg., µg/cu. m)Acute resp. infection prevalence (% of children under five)Diarrhea prevalence (% of children under five)Under-five mortality rate (per 1,000 live births) National accounting aggregates—savings, depletion and degradationGross savings (% of GNI)Consumption of fixed capital (% of GNI)Education expenditure (% of GNI)Energy depletion (% of GNI)Mineral depletion (% of GNI)Net forest depletion (% of GNI)CO2 damage (% of GNI)Particulate emissions damage (% of GNI)Adjusted net savings (% of GNI)
35,320 39,86030,844 34,611
68.4 80.50.4 1.1
47 3716.9 ..
31,254 26,5155,682 5,349
31.4 28.4–0.9 0.015.1 12.9
7104662
378 28,774–2.5 –1.70.2 1.8
17.4 16.5.. 81,970.. 15,496
2,815 5,0005.1 4.4
5,384 9,41573.3 62.017.1 11.26.7 11.4
3,005 8,19524.9 10.3
44 41100 100100 98100 100
.. 100
.. 99
.. 100
21 22.. .... ..4 6
16.5 17.913.8 13.9
4.4 4.60.1 1.40.0 0.20.0 0.00.2 0.20.1 0.16.8 6.6
111The Little Green Data Book 2013
Population (millions) 60.7 Land area (1,000 sq. km) 294 GDP ($ billions) 2,194.0
Country data
High-income group
Italy

GNI per capita, World Bank Atlas method ($)Adjusted net national income per capita ($)Urban population (% of total)Urban population growth (avg. annual %, 1990–2011) AgricultureAgricultural land (% land area)Agricultural irrigated land (% of total agricultural land)Agricultural productivity, value added per worker (2000 $)Cereal yield (kg per hectare) Forests and biodiversityForest area (% land area)Deforestation (avg. annual %, 2000–2010)Terrestrial protected areas (% of total land area)Threatened species, mammalsThreatened species, birdsThreatened species, fishThreatened species, higher plants OceansTotal fisheries production (thousand metric tons)
Capture fisheries growth (avg. annual %, 1990–2011)Aquaculture growth (avg. annual %, 1990–2011)
Marine protected areas (% of territorial waters)Coral reef area (sq. km)Mangroves area (sq. km) Energy and emissionsEnergy use per capita (kg oil equivalent)Energy from biomass products and waste (% of total)Electric power consumption per capita (kWh)Electricity generated using fossil fuel (% of total)Electricity generated by hydropower (% of total)CO2 emissions per capita (metric tons) Water and sanitationInternal freshwater resources per capita (cu. m)Total freshwater withdrawal (% of internal resources)
Agriculture (% of total freshwater withdrawal)Access to improved water source (% of total population)
Rural (% of rural population)Urban (% of urban population)
Access to improved sanitation (% of total population)Rural (% of rural population)Urban (% of urban population)
Environment and healthParticulate matter (urban-pop.-weighted avg., µg/cu. m)Acute resp. infection prevalence (% of children under five)Diarrhea prevalence (% of children under five)Under-five mortality rate (per 1,000 live births) National accounting aggregates—savings, depletion and degradationGross savings (% of GNI)Consumption of fixed capital (% of GNI)Education expenditure (% of GNI)Energy depletion (% of GNI)Mineral depletion (% of GNI)Net forest depletion (% of GNI)CO2 damage (% of GNI)Particulate emissions damage (% of GNI)Adjusted net savings (% of GNI)
.. 8,574 6,5634,489 7,648 5,821
52.1 79.1 60.60.8 2.0 2.5
41 37 35.. .. ..
3,016 3,448 8691,270 3,838 3,944
31.1 46.8 34.80.1 0.4 0.0
18.9 20.2 13.35
1022
206
16.3 19,009 97,4370.5 0.1 0.7
–5.0 11.8 9.04.2 13.1 8.4
1,240 15,100 33,35097.5 39,997 48,783
1,131 1,312 1,94814.6 16.7 8.1
1,223 1,973 2,94293.6 39.0 72.9
3.6 53.7 21.33.2 2.7 5.5
3,475 22,810 8,5506.2 2.0 5.634 68 6693 94 9388 81 8698 98 9880 79 7382 59 6278 84 81
27 28 42.. .. .... .. ..
18 19 20
8.7 21.1 36.411.5 12.2 11.85.8 5.0 3.30.0 4.5 5.71.1 1.9 1.60.0 0.0 0.00.7 0.2 0.70.1 0.3 0.71.1 6.8 19.2
112 2013 The Little Green Data Book
Population (millions) 2.7 Land area (1,000 sq. km) 11 GDP ($ billions) 14.4
Country data
Latin America & Caribbean
group
Upper middle-income group
Jamaica
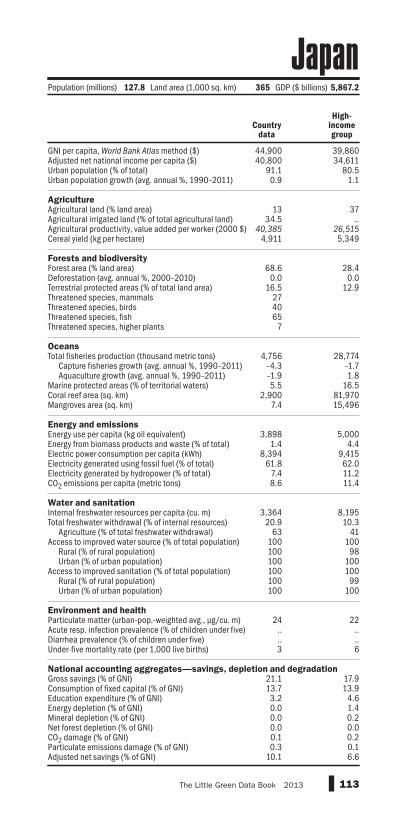
GNI per capita, World Bank Atlas method ($)Adjusted net national income per capita ($)Urban population (% of total)Urban population growth (avg. annual %, 1990–2011) AgricultureAgricultural land (% land area)Agricultural irrigated land (% of total agricultural land)Agricultural productivity, value added per worker (2000 $)Cereal yield (kg per hectare) Forests and biodiversityForest area (% land area)Deforestation (avg. annual %, 2000–2010)Terrestrial protected areas (% of total land area)Threatened species, mammalsThreatened species, birdsThreatened species, fishThreatened species, higher plants OceansTotal fisheries production (thousand metric tons)
Capture fisheries growth (avg. annual %, 1990–2011)Aquaculture growth (avg. annual %, 1990–2011)
Marine protected areas (% of territorial waters)Coral reef area (sq. km)Mangroves area (sq. km) Energy and emissionsEnergy use per capita (kg oil equivalent)Energy from biomass products and waste (% of total)Electric power consumption per capita (kWh)Electricity generated using fossil fuel (% of total)Electricity generated by hydropower (% of total)CO2 emissions per capita (metric tons) Water and sanitationInternal freshwater resources per capita (cu. m)Total freshwater withdrawal (% of internal resources)
Agriculture (% of total freshwater withdrawal)Access to improved water source (% of total population)
Rural (% of rural population)Urban (% of urban population)
Access to improved sanitation (% of total population)Rural (% of rural population)Urban (% of urban population)
Environment and healthParticulate matter (urban-pop.-weighted avg., µg/cu. m)Acute resp. infection prevalence (% of children under five)Diarrhea prevalence (% of children under five)Under-five mortality rate (per 1,000 live births) National accounting aggregates—savings, depletion and degradationGross savings (% of GNI)Consumption of fixed capital (% of GNI)Education expenditure (% of GNI)Energy depletion (% of GNI)Mineral depletion (% of GNI)Net forest depletion (% of GNI)CO2 damage (% of GNI)Particulate emissions damage (% of GNI)Adjusted net savings (% of GNI)
44,900 39,86040,800 34,611
91.1 80.50.9 1.1
13 3734.5 ..
40,385 26,5154,911 5,349
68.6 28.40.0 0.0
16.5 12.9274065
7
4,756 28,774–4.3 –1.7–1.9 1.85.5 16.5
2,900 81,9707.4 15,496
3,898 5,0001.4 4.4
8,394 9,41561.8 62.0
7.4 11.28.6 11.4
3,364 8,19520.9 10.3
63 41100 100100 98100 100100 100100 99100 100
24 22.. .... ..3 6
21.1 17.913.7 13.93.2 4.60.0 1.40.0 0.20.0 0.00.1 0.20.3 0.1
10.1 6.6
113The Little Green Data Book 2013
Population (millions) 127.8 Land area (1,000 sq. km) 365 GDP ($ billions) 5,867.2
Country data
High-income group
Japan

GNI per capita, World Bank Atlas method ($)Adjusted net national income per capita ($)Urban population (% of total)Urban population growth (avg. annual %, 1990–2011) AgricultureAgricultural land (% land area)Agricultural irrigated land (% of total agricultural land)Agricultural productivity, value added per worker (2000 $)Cereal yield (kg per hectare) Forests and biodiversityForest area (% land area)Deforestation (avg. annual %, 2000–2010)Terrestrial protected areas (% of total land area)Threatened species, mammalsThreatened species, birdsThreatened species, fishThreatened species, higher plants OceansTotal fisheries production (thousand metric tons)
Capture fisheries growth (avg. annual %, 1990–2011)Aquaculture growth (avg. annual %, 1990–2011)
Marine protected areas (% of territorial waters)Coral reef area (sq. km)Mangroves area (sq. km) Energy and emissionsEnergy use per capita (kg oil equivalent)Energy from biomass products and waste (% of total)Electric power consumption per capita (kWh)Electricity generated using fossil fuel (% of total)Electricity generated by hydropower (% of total)CO2 emissions per capita (metric tons) Water and sanitationInternal freshwater resources per capita (cu. m)Total freshwater withdrawal (% of internal resources)
Agriculture (% of total freshwater withdrawal)Access to improved water source (% of total population)
Rural (% of rural population)Urban (% of urban population)
Access to improved sanitation (% of total population)Rural (% of rural population)Urban (% of urban population)
Environment and healthParticulate matter (urban-pop.-weighted avg., µg/cu. m)Acute resp. infection prevalence (% of children under five)Diarrhea prevalence (% of children under five)Under-five mortality rate (per 1,000 live births) National accounting aggregates—savings, depletion and degradationGross savings (% of GNI)Consumption of fixed capital (% of GNI)Education expenditure (% of GNI)Energy depletion (% of GNI)Mineral depletion (% of GNI)Net forest depletion (% of GNI)CO2 damage (% of GNI)Particulate emissions damage (% of GNI)Adjusted net savings (% of GNI)
4,380 3,866 6,5634,050 3,285 5,821
82.7 58.9 60.63.8 2.5 2.5
11 23 359.6 .. ..
3,760 2,627 869812 2,475 3,944
1.1 2.4 34.80.0 –0.1 0.01.9 3.9 13.3131013
1
1.1 3,538 97,4371.7 2.4 0.7
11.4 13.1 9.030.0 2.0 8.4<50 5,700 33,350
.. 217 48,783
1,191 1,372 1,9480.1 0.9 8.1
2,226 1,658 2,94299.5 92.9 72.9
0.4 5.4 21.33.8 4.1 5.5
110 673 8,550138.0 122.1 5.6
65 86 6697 89 9392 81 8698 94 9898 88 7398 80 6298 94 81
30 59 421 .. ..
16 .. ..21 32 20
13.5 27.0 36.410.9 10.8 11.8
5.6 4.5 3.30.0 15.2 5.71.7 0.6 1.60.0 0.1 0.00.7 0.6 0.70.2 0.9 0.75.6 6.1 19.2
114 2013 The Little Green Data Book
Country data
Middle East &
N. Africa group
Upper middle-income group
Population (millions) 6.2 Land area (1,000 sq. km) 89 GDP ($ billions) 28.8
Jordan

GNI per capita, World Bank Atlas method ($)Adjusted net national income per capita ($)Urban population (% of total)Urban population growth (avg. annual %, 1990–2011) AgricultureAgricultural land (% land area)Agricultural irrigated land (% of total agricultural land)Agricultural productivity, value added per worker (2000 $)Cereal yield (kg per hectare) Forests and biodiversityForest area (% land area)Deforestation (avg. annual %, 2000–2010)Terrestrial protected areas (% of total land area)Threatened species, mammalsThreatened species, birdsThreatened species, fishThreatened species, higher plants OceansTotal fisheries production (thousand metric tons)
Capture fisheries growth (avg. annual %, 1990–2011)Aquaculture growth (avg. annual %, 1990–2011)
Marine protected areas (% of territorial waters)Coral reef area (sq. km)Mangroves area (sq. km) Energy and emissionsEnergy use per capita (kg oil equivalent)Energy from biomass products and waste (% of total)Electric power consumption per capita (kWh)Electricity generated using fossil fuel (% of total)Electricity generated by hydropower (% of total)CO2 emissions per capita (metric tons) Water and sanitationInternal freshwater resources per capita (cu. m)Total freshwater withdrawal (% of internal resources)
Agriculture (% of total freshwater withdrawal)Access to improved water source (% of total population)
Rural (% of rural population)Urban (% of urban population)
Access to improved sanitation (% of total population)Rural (% of rural population)Urban (% of urban population)
Environment and healthParticulate matter (urban-pop.-weighted avg., µg/cu. m)Acute resp. infection prevalence (% of children under five)Diarrhea prevalence (% of children under five)Under-five mortality rate (per 1,000 live births) National accounting aggregates—savings, depletion and degradationGross savings (% of GNI)Consumption of fixed capital (% of GNI)Education expenditure (% of GNI)Energy depletion (% of GNI)Mineral depletion (% of GNI)Net forest depletion (% of GNI)CO2 damage (% of GNI)Particulate emissions damage (% of GNI)Adjusted net savings (% of GNI)
8,260 7,734 6,5635,654 6,652 5,821
53.6 64.7 60.6–0.2 0.3 2.5
77 28 35.. .. ..
2,275 3,374 8691,687 2,740 3,944
1.2 38.7 34.80.2 0.0 0.02.5 7.5 13.316221517
43.3 5,790 97,437–2.8 –2.9 0.7
–15.9 –0.5 9.0.. 10.4 8.4.. .. 33,350.. .. 48,783
4,595 3,015 1,9480.1 2.0 8.1
4,728 4,059 2,94290.3 65.4 72.9
9.7 18.8 21.314.0 7.1 5.5
3,886 12,498 8,55032.9 6.3 5.6
66 60 6695 96 9390 91 8699 99 9897 84 7398 81 6297 87 81
18 21 42.. .. .... .. ..
28 21 20
34.6 26.1 36.414.1 12.3 11.84.4 3.6 3.3
26.0 9.3 5.72.0 0.8 1.60.0 0.0 0.01.2 0.7 0.70.3 0.3 0.7
–4.6 6.2 19.2
115The Little Green Data Book 2013
Country data
Europe & Central
Asia group
Upper middle-income group
Population (millions) 16.6 Land area (1,000 sq. km) 2,700 GDP ($ billions) 188.0
Kazakhstan

GNI per capita, World Bank Atlas method ($)Adjusted net national income per capita ($)Urban population (% of total)Urban population growth (avg. annual %, 1990–2011) AgricultureAgricultural land (% land area)Agricultural irrigated land (% of total agricultural land)Agricultural productivity, value added per worker (2000 $)Cereal yield (kg per hectare) Forests and biodiversityForest area (% land area)Deforestation (avg. annual %, 2000–2010)Terrestrial protected areas (% of total land area)Threatened species, mammalsThreatened species, birdsThreatened species, fishThreatened species, higher plants OceansTotal fisheries production (thousand metric tons)
Capture fisheries growth (avg. annual %, 1990–2011)Aquaculture growth (avg. annual %, 1990–2011)
Marine protected areas (% of territorial waters)Coral reef area (sq. km)Mangroves area (sq. km) Energy and emissionsEnergy use per capita (kg oil equivalent)Energy from biomass products and waste (% of total)Electric power consumption per capita (kWh)Electricity generated using fossil fuel (% of total)Electricity generated by hydropower (% of total)CO2 emissions per capita (metric tons) Water and sanitationInternal freshwater resources per capita (cu. m)Total freshwater withdrawal (% of internal resources)
Agriculture (% of total freshwater withdrawal)Access to improved water source (% of total population)
Rural (% of rural population)Urban (% of urban population)
Access to improved sanitation (% of total population)Rural (% of rural population)Urban (% of urban population)
Environment and healthParticulate matter (urban-pop.-weighted avg., µg/cu. m)Acute resp. infection prevalence (% of children under five)Diarrhea prevalence (% of children under five)Under-five mortality rate (per 1,000 live births) National accounting aggregates—savings, depletion and degradationGross savings (% of GNI)Consumption of fixed capital (% of GNI)Education expenditure (% of GNI)Energy depletion (% of GNI)Mineral depletion (% of GNI)Net forest depletion (% of GNI)CO2 damage (% of GNI)Particulate emissions damage (% of GNI)Adjusted net savings (% of GNI)
820 1,258 571745 1,022 521
24.0 36.5 28.04.4 3.8 3.5
48 44 390.0 .. ..
350 334 3081,514 1,361 2,034
6.1 27.8 25.70.3 0.5 0.6
11.8 11.7 10.0283468
128
204 6,383 11,563–0.5 1.8 4.014.7 16.0 4.910.5 5.8 ..630 17,980 15,120610 27,808 25,818
483 683 36372.8 58.2 66.2156 553 242
30.5 65.2 32.045.7 18.7 45.30.3 0.9 0.3
497 4,455 5,12513.2 3.2 4.5
79 84 9059 61 6552 48 5782 83 8632 31 3732 23 3232 42 47
30 41 548 .. ..
17 .. ..73 109 95
13.5 18.4 25.26.7 10.9 7.75.9 3.7 3.00.0 10.4 1.40.1 2.2 2.01.1 0.5 1.20.3 0.5 0.30.1 0.4 0.5
11.2 –1.2 15.2
116 2013 The Little Green Data Book
Population (millions) 41.6 Land area (1,000 sq. km) 569 GDP ($ billions) 33.6
Country data
Sub-Saharan Africa group
Low-income group
Kenya

GNI per capita, World Bank Atlas method ($)Adjusted net national income per capita ($)Urban population (% of total)Urban population growth (avg. annual %, 1990–2011) AgricultureAgricultural land (% land area)Agricultural irrigated land (% of total agricultural land)Agricultural productivity, value added per worker (2000 $)Cereal yield (kg per hectare) Forests and biodiversityForest area (% land area)Deforestation (avg. annual %, 2000–2010)Terrestrial protected areas (% of total land area)Threatened species, mammalsThreatened species, birdsThreatened species, fishThreatened species, higher plants OceansTotal fisheries production (thousand metric tons)
Capture fisheries growth (avg. annual %, 1990–2011)Aquaculture growth (avg. annual %, 1990–2011)
Marine protected areas (% of territorial waters)Coral reef area (sq. km)Mangroves area (sq. km) Energy and emissionsEnergy use per capita (kg oil equivalent)Energy from biomass products and waste (% of total)Electric power consumption per capita (kWh)Electricity generated using fossil fuel (% of total)Electricity generated by hydropower (% of total)CO2 emissions per capita (metric tons) Water and sanitationInternal freshwater resources per capita (cu. m)Total freshwater withdrawal (% of internal resources)
Agriculture (% of total freshwater withdrawal)Access to improved water source (% of total population)
Rural (% of rural population)Urban (% of urban population)
Access to improved sanitation (% of total population)Rural (% of rural population)Urban (% of urban population)
Environment and healthParticulate matter (urban-pop.-weighted avg., µg/cu. m)Acute resp. infection prevalence (% of children under five)Diarrhea prevalence (% of children under five)Under-five mortality rate (per 1,000 live births) National accounting aggregates—savings, depletion and degradationGross savings (% of GNI)Consumption of fixed capital (% of GNI)Education expenditure (% of GNI)Energy depletion (% of GNI)Mineral depletion (% of GNI)Net forest depletion (% of GNI)CO2 damage (% of GNI)Particulate emissions damage (% of GNI)Adjusted net savings (% of GNI)
2,030 4,248 1,772.. 3,884 1,595
43.9 48.6 38.72.7 3.6 2.7
42 48 46.. .. ..
1,327 610 716.. 5,050 3,065
15.0 29.7 28.40.0 –0.4 0.3
23.2 15.0 9.916
110
69.6 101,299 40,2384.3 3.4 2.4
–0.8 9.1 10.022.6 1.4 2.9
2,940 137,690 143,4402.6 56,537 60,301
116 1,520 667.. 10.9 26.2.. 2,337 698.. 79.8 73.0.. 16.5 17.4
0.5 4.6 1.6
.. 4,446 3,121
.. 10.9 20.2
.. 73 8863 90 8753 84 8477 97 9334 66 4722 58 3549 76 66
.. 55 53
.. .. ..
.. .. ..47 21 62
.. 49.3 29.76.6 11.0 9.9
.. 2.1 3.10.0 4.3 6.30.0 1.7 1.2
.. 0.0 0.30.1 0.9 0.7
.. 1.1 0.6
.. 32.2 14.7
117The Little Green Data Book 2013
Country data
East Asia & Pacific
group
Lower middle-income group
Population (thousands) 101 Land area (sq. km) 810 GDP ($ millions) 166.7
Kiribati

GNI per capita, World Bank Atlas method ($)Adjusted net national income per capita ($)Urban population (% of total)Urban population growth (avg. annual %, 1990–2011) AgricultureAgricultural land (% land area)Agricultural irrigated land (% of total agricultural land)Agricultural productivity, value added per worker (2000 $)Cereal yield (kg per hectare) Forests and biodiversityForest area (% land area)Deforestation (avg. annual %, 2000–2010)Terrestrial protected areas (% of total land area)Threatened species, mammalsThreatened species, birdsThreatened species, fishThreatened species, higher plants OceansTotal fisheries production (thousand metric tons)
Capture fisheries growth (avg. annual %, 1990–2011)Aquaculture growth (avg. annual %, 1990–2011)
Marine protected areas (% of territorial waters)Coral reef area (sq. km)Mangroves area (sq. km) Energy and emissionsEnergy use per capita (kg oil equivalent)Energy from biomass products and waste (% of total)Electric power consumption per capita (kWh)Electricity generated using fossil fuel (% of total)Electricity generated by hydropower (% of total)CO2 emissions per capita (metric tons) Water and sanitationInternal freshwater resources per capita (cu. m)Total freshwater withdrawal (% of internal resources)
Agriculture (% of total freshwater withdrawal)Access to improved water source (% of total population)
Rural (% of rural population)Urban (% of urban population)
Access to improved sanitation (% of total population)Rural (% of rural population)Urban (% of urban population)
Environment and healthParticulate matter (urban-pop.-weighted avg., µg/cu. m)Acute resp. infection prevalence (% of children under five)Diarrhea prevalence (% of children under five)Under-five mortality rate (per 1,000 live births) National accounting aggregates—savings, depletion and degradationGross savings (% of GNI)Consumption of fixed capital (% of GNI)Education expenditure (% of GNI)Energy depletion (% of GNI)Mineral depletion (% of GNI)Net forest depletion (% of GNI)CO2 damage (% of GNI)Particulate emissions damage (% of GNI)Adjusted net savings (% of GNI)
.. 4,248 571
.. 3,884 52160.3 48.6 28.0
1.1 3.6 3.5
21 48 39.. .. .... 610 308
3,749 5,050 2,034
46.0 29.7 25.72.0 –0.4 0.65.9 15.0 10.0
925146
713 101,299 11,563–4.0 3.4 4.0–2.7 9.1 4.90.11 1.4 ..
.. 137,690 15,120
.. 56,537 25,818
761 1,520 3635.7 10.9 66.2
749 2,337 24238.1 79.8 32.061.9 16.5 45.3
3.1 4.6 0.3
2,740 4,446 5,12512.9 10.9 4.5
76 73 9098 90 6597 84 5799 97 8680 66 3771 58 3286 76 47
52 55 54.. .. .... .. ..
33 21 95
.. 49.3 25.2
.. 11.0 7.7
.. 2.1 3.0
.. 4.3 1.4
.. 1.7 2.0
.. 0.0 1.2
.. 0.9 0.30.6 1.1 0.5
.. 32.2 15.2
118 2013 The Little Green Data Book
Country data
East Asia & Pacific
group
Low-income group
Population (millions) 24.5 Land area (1,000 sq. km) 120 GDP ($ millions) ..
Korea, Dem. People’s Rep.

GNI per capita, World Bank Atlas method ($)Adjusted net national income per capita ($)Urban population (% of total)Urban population growth (avg. annual %, 1990–2011) AgricultureAgricultural land (% land area)Agricultural irrigated land (% of total agricultural land)Agricultural productivity, value added per worker (2000 $)Cereal yield (kg per hectare) Forests and biodiversityForest area (% land area)Deforestation (avg. annual %, 2000–2010)Terrestrial protected areas (% of total land area)Threatened species, mammalsThreatened species, birdsThreatened species, fishThreatened species, higher plants OceansTotal fisheries production (thousand metric tons)
Capture fisheries growth (avg. annual %, 1990–2011)Aquaculture growth (avg. annual %, 1990–2011)
Marine protected areas (% of territorial waters)Coral reef area (sq. km)Mangroves area (sq. km) Energy and emissionsEnergy use per capita (kg oil equivalent)Energy from biomass products and waste (% of total)Electric power consumption per capita (kWh)Electricity generated using fossil fuel (% of total)Electricity generated by hydropower (% of total)CO2 emissions per capita (metric tons) Water and sanitationInternal freshwater resources per capita (cu. m)Total freshwater withdrawal (% of internal resources)
Agriculture (% of total freshwater withdrawal)Access to improved water source (% of total population)
Rural (% of rural population)Urban (% of urban population)
Access to improved sanitation (% of total population)Rural (% of rural population)Urban (% of urban population)
Environment and healthParticulate matter (urban-pop.-weighted avg., µg/cu. m)Acute resp. infection prevalence (% of children under five)Diarrhea prevalence (% of children under five)Under-five mortality rate (per 1,000 live births) National accounting aggregates—savings, depletion and degradationGross savings (% of GNI)Consumption of fixed capital (% of GNI)Education expenditure (% of GNI)Energy depletion (% of GNI)Mineral depletion (% of GNI)Net forest depletion (% of GNI)CO2 damage (% of GNI)Particulate emissions damage (% of GNI)Adjusted net savings (% of GNI)
20,870 39,86019,551 34,611
83.2 80.51.3 1.1
18 3751.6 ..
20,559 26,5157,038 5,349
64.0 28.40.1 0.02.4 12.9
92919
4
3,261 28,774–1.6 –1.73.1 1.83.9 16.5
.. 81,970
.. 15,496
5,060 5,0001.4 4.4
9,744 9,41568.7 62.0
0.7 11.210.4 11.4
1,303 8,19539.3 10.3
62 4198 10088 98
100 100100 100100 99100 100
30 22.. .... ..5 6
31.4 17.913.0 13.94.2 4.60.0 1.40.0 0.20.0 0.00.4 0.20.4 0.1
21.8 6.6
119The Little Green Data Book 2013
Country data
High-income group
Population (millions) 49.8 Land area (1,000 sq. km) 97 GDP ($ billions) 1,116.2
Korea, Rep.

GNI per capita, World Bank Atlas method ($)Adjusted net national income per capita ($)Urban population (% of total)Urban population growth (avg. annual %, 1990–2011) AgricultureAgricultural land (% land area)Agricultural irrigated land (% of total agricultural land)Agricultural productivity, value added per worker (2000 $)Cereal yield (kg per hectare) Forests and biodiversityForest area (% land area)Deforestation (avg. annual %, 2000–2010)Terrestrial protected areas (% of total land area)Threatened species, mammalsThreatened species, birdsThreatened species, fishThreatened species, higher plants OceansTotal fisheries production (thousand metric tons)
Capture fisheries growth (avg. annual %, 1990–2011)Aquaculture growth (avg. annual %, 1990–2011)
Marine protected areas (% of territorial waters)Coral reef area (sq. km)Mangroves area (sq. km) Energy and emissionsEnergy use per capita (kg oil equivalent)Energy from biomass products and waste (% of total)Electric power consumption per capita (kWh)Electricity generated using fossil fuel (% of total)Electricity generated by hydropower (% of total)CO2 emissions per capita (metric tons) Water and sanitationInternal freshwater resources per capita (cu. m)Total freshwater withdrawal (% of internal resources)
Agriculture (% of total freshwater withdrawal)Access to improved water source (% of total population)
Rural (% of rural population)Urban (% of urban population)
Access to improved sanitation (% of total population)Rural (% of rural population)Urban (% of urban population)
Environment and healthParticulate matter (urban-pop.-weighted avg., µg/cu. m)Acute resp. infection prevalence (% of children under five)Diarrhea prevalence (% of children under five)Under-five mortality rate (per 1,000 live births) National accounting aggregates—savings, depletion and degradationGross savings (% of GNI)Consumption of fixed capital (% of GNI)Education expenditure (% of GNI)Energy depletion (% of GNI)Mineral depletion (% of GNI)Net forest depletion (% of GNI)CO2 damage (% of GNI)Particulate emissions damage (% of GNI)Adjusted net savings (% of GNI)
3,510 7,734 1,772.. 6,652 1,595.. 64.7 38.7.. 0.3 2.7
52 28 46.. .. .... 3,374 716.. 2,740 3,065
.. 38.7 28.4
.. 0.0 0.3
.. 7.5 9.9
..
..
..
..
.. 5,790 40,238
.. –2.9 2.4
.. –0.5 10.0
.. 10.4 2.9
.. .. 143,440
.. .. 60,301
1,372 3,015 6679.7 2.0 26.2
2,650 4,059 69897.0 65.4 73.03.0 18.8 17.4
.. 7.1 1.6
.. 12,498 3,121
.. 6.3 20.2
.. 60 88
.. 96 87
.. 91 84
.. 99 93
.. 84 47
.. 81 35
.. 87 66
.. 21 53
.. .. ..
.. .. ..
.. 21 62
.. 26.1 29.710.2 12.3 9.9
.. 3.6 3.10.0 9.3 6.31.8 0.8 1.2
.. 0.0 0.3
.. 0.7 0.7
.. 0.3 0.6
.. 6.2 14.7
120 2013 The Little Green Data Book
Country data
Europe & Central
Asia group
Lower middle-income group
Population (millions) 1.8 Land area (1,000 sq. km) 11 GDP ($ billions) 6.5
Kosovo

GNI per capita, World Bank Atlas method ($)Adjusted net national income per capita ($)Urban population (% of total)Urban population growth (avg. annual %, 1990–2011) AgricultureAgricultural land (% land area)Agricultural irrigated land (% of total agricultural land)Agricultural productivity, value added per worker (2000 $)Cereal yield (kg per hectare) Forests and biodiversityForest area (% land area)Deforestation (avg. annual %, 2000–2010)Terrestrial protected areas (% of total land area)Threatened species, mammalsThreatened species, birdsThreatened species, fishThreatened species, higher plants OceansTotal fisheries production (thousand metric tons)
Capture fisheries growth (avg. annual %, 1990–2011)Aquaculture growth (avg. annual %, 1990–2011)
Marine protected areas (% of territorial waters)Coral reef area (sq. km)Mangroves area (sq. km) Energy and emissionsEnergy use per capita (kg oil equivalent)Energy from biomass products and waste (% of total)Electric power consumption per capita (kWh)Electricity generated using fossil fuel (% of total)Electricity generated by hydropower (% of total)CO2 emissions per capita (metric tons) Water and sanitationInternal freshwater resources per capita (cu. m)Total freshwater withdrawal (% of internal resources)
Agriculture (% of total freshwater withdrawal)Access to improved water source (% of total population)
Rural (% of rural population)Urban (% of urban population)
Access to improved sanitation (% of total population)Rural (% of rural population)Urban (% of urban population)
Environment and healthParticulate matter (urban-pop.-weighted avg., µg/cu. m)Acute resp. infection prevalence (% of children under five)Diarrhea prevalence (% of children under five)Under-five mortality rate (per 1,000 live births) National accounting aggregates—savings, depletion and degradationGross savings (% of GNI)Consumption of fixed capital (% of GNI)Education expenditure (% of GNI)Energy depletion (% of GNI)Mineral depletion (% of GNI)Net forest depletion (% of GNI)CO2 damage (% of GNI)Particulate emissions damage (% of GNI)Adjusted net savings (% of GNI)
48,900 39,86030,970 34,611
98.3 80.51.4 1.1
9 37.. .... 26,515
8,648 5,349
0.4 28.4–2.6 0.01.6 12.9
68
110
4.9 28,7740.0 –1.7
.. 1.80.01 16.5110 81,970
0.05 15,496
12,204 5,0000.0 4.4
18,320 9,415100.0 62.0
0.0 11.230.3 11.4
0 8,195.. 10.3
54 4199 10099 9899 100
100 100100 99100 100
91 22.. .... ..
11 6
45.8 17.96.5 13.93.2 4.6
29.3 1.40.0 0.20.0 0.00.4 0.20.5 0.1
12.2 6.6
121The Little Green Data Book 2013
KuwaitPopulation (millions) 2.8 Land area (1,000 sq. km) 18 GDP ($ billions) 176.6
Country data
High-income group

GNI per capita, World Bank Atlas method ($)Adjusted net national income per capita ($)Urban population (% of total)Urban population growth (avg. annual %, 1990–2011) AgricultureAgricultural land (% land area)Agricultural irrigated land (% of total agricultural land)Agricultural productivity, value added per worker (2000 $)Cereal yield (kg per hectare) Forests and biodiversityForest area (% land area)Deforestation (avg. annual %, 2000–2010)Terrestrial protected areas (% of total land area)Threatened species, mammalsThreatened species, birdsThreatened species, fishThreatened species, higher plants OceansTotal fisheries production (thousand metric tons)
Capture fisheries growth (avg. annual %, 1990–2011)Aquaculture growth (avg. annual %, 1990–2011)
Marine protected areas (% of territorial waters)Coral reef area (sq. km)Mangroves area (sq. km) Energy and emissionsEnergy use per capita (kg oil equivalent)Energy from biomass products and waste (% of total)Electric power consumption per capita (kWh)Electricity generated using fossil fuel (% of total)Electricity generated by hydropower (% of total)CO2 emissions per capita (metric tons) Water and sanitationInternal freshwater resources per capita (cu. m)Total freshwater withdrawal (% of internal resources)
Agriculture (% of total freshwater withdrawal)Access to improved water source (% of total population)
Rural (% of rural population)Urban (% of urban population)
Access to improved sanitation (% of total population)Rural (% of rural population)Urban (% of urban population)
Environment and healthParticulate matter (urban-pop.-weighted avg., µg/cu. m)Acute resp. infection prevalence (% of children under five)Diarrhea prevalence (% of children under five)Under-five mortality rate (per 1,000 live births) National accounting aggregates—savings, depletion and degradationGross savings (% of GNI)Consumption of fixed capital (% of GNI)Education expenditure (% of GNI)Energy depletion (% of GNI)Mineral depletion (% of GNI)Net forest depletion (% of GNI)CO2 damage (% of GNI)Particulate emissions damage (% of GNI)Adjusted net savings (% of GNI)
900 7,734 571829 6,652 52135.4 64.7 28.0
0.8 0.3 3.5
55 28 399.4 .. ..
1,022 3,374 3082,603 2,740 2,034
5.1 38.7 25.7–1.1 0.0 0.66.9 7.5 10.0
612
314
0.42 5,790 11,563–11.2 –2.9 4.0–4.2 –0.5 4.9
.. 10.4 ..
.. .. 15,120
.. .. 25,818
536 3,015 3630.1 2.0 66.2
1,375 4,059 2429.0 65.4 32.0
91.0 18.8 45.31.2 7.1 0.3
8,873 12,498 5,12520.6 6.3 4.5
94 60 9090 96 6585 91 5799 99 8693 84 3793 81 3294 87 47
35 21 54.. .. .... .. ..
31 21 95
19.9 26.1 25.29.7 12.3 7.76.0 3.6 3.00.7 9.3 1.49.0 0.8 2.00.0 0.0 1.20.9 0.7 0.30.4 0.3 0.55.1 6.2 15.2
122 2013 The Little Green Data Book
Population (millions) 5.5 Land area (1,000 sq. km) 192 GDP ($ billions) 6.2
Country data
Europe & Central
Asia group
Low-income group
Kyrgyz Republic

GNI per capita, World Bank Atlas method ($)Adjusted net national income per capita ($)Urban population (% of total)Urban population growth (avg. annual %, 1990–2011) AgricultureAgricultural land (% land area)Agricultural irrigated land (% of total agricultural land)Agricultural productivity, value added per worker (2000 $)Cereal yield (kg per hectare) Forests and biodiversityForest area (% land area)Deforestation (avg. annual %, 2000–2010)Terrestrial protected areas (% of total land area)Threatened species, mammalsThreatened species, birdsThreatened species, fishThreatened species, higher plants OceansTotal fisheries production (thousand metric tons)
Capture fisheries growth (avg. annual %, 1990–2011)Aquaculture growth (avg. annual %, 1990–2011)
Marine protected areas (% of territorial waters)Coral reef area (sq. km)Mangroves area (sq. km) Energy and emissionsEnergy use per capita (kg oil equivalent)Energy from biomass products and waste (% of total)Electric power consumption per capita (kWh)Electricity generated using fossil fuel (% of total)Electricity generated by hydropower (% of total)CO2 emissions per capita (metric tons) Water and sanitationInternal freshwater resources per capita (cu. m)Total freshwater withdrawal (% of internal resources)
Agriculture (% of total freshwater withdrawal)Access to improved water source (% of total population)
Rural (% of rural population)Urban (% of urban population)
Access to improved sanitation (% of total population)Rural (% of rural population)Urban (% of urban population)
Environment and healthParticulate matter (urban-pop.-weighted avg., µg/cu. m)Acute resp. infection prevalence (% of children under five)Diarrhea prevalence (% of children under five)Under-five mortality rate (per 1,000 live births) National accounting aggregates—savings, depletion and degradationGross savings (% of GNI)Consumption of fixed capital (% of GNI)Education expenditure (% of GNI)Energy depletion (% of GNI)Mineral depletion (% of GNI)Net forest depletion (% of GNI)CO2 damage (% of GNI)Particulate emissions damage (% of GNI)Adjusted net savings (% of GNI)
1,130 4,248 1,772973 3,884 1,595
34.2 48.6 38.75.7 3.6 2.7
10 48 46.. .. ..
456 610 7164,045 5,050 3,065
67.9 29.7 28.40.5 –0.4 0.3
16.6 15.0 9.945245424
117 101,299 40,2382.6 3.4 2.4
10.8 9.1 10.0.. 1.4 2.9.. 137,690 143,440.. 56,537 60,301
.. 1,520 667
.. 10.9 26.2
.. 2,337 698
.. 79.8 73.0
.. 16.5 17.40.3 4.6 1.6
30,280 4,446 3,1212.2 10.9 20.293 73 8867 90 8762 84 8477 97 9363 66 4750 58 3589 76 66
45 55 53.. .. .... .. ..
42 21 62
17.7 49.3 29.79.8 11.0 9.91.1 2.1 3.10.0 4.3 6.3
10.5 1.7 1.20.0 0.0 0.30.2 0.9 0.70.8 1.1 0.6
–2.6 32.2 14.7
123The Little Green Data Book 2013
Lao PDRCountry
data
East Asia & Pacific
group
Lower middle-incomegroup
Population (millions) 6.3 Land area (1,000 sq. km) 231 GDP ($ billions) 8.3

GNI per capita, World Bank Atlas method ($)Adjusted net national income per capita ($)Urban population (% of total)Urban population growth (avg. annual %, 1990–2011) AgricultureAgricultural land (% land area)Agricultural irrigated land (% of total agricultural land)Agricultural productivity, value added per worker (2000 $)Cereal yield (kg per hectare) Forests and biodiversityForest area (% land area)Deforestation (avg. annual %, 2000–2010)Terrestrial protected areas (% of total land area)Threatened species, mammalsThreatened species, birdsThreatened species, fishThreatened species, higher plants OceansTotal fisheries production (thousand metric tons)
Capture fisheries growth (avg. annual %, 1990–2011)Aquaculture growth (avg. annual %, 1990–2011)
Marine protected areas (% of territorial waters)Coral reef area (sq. km)Mangroves area (sq. km) Energy and emissionsEnergy use per capita (kg oil equivalent)Energy from biomass products and waste (% of total)Electric power consumption per capita (kWh)Electricity generated using fossil fuel (% of total)Electricity generated by hydropower (% of total)CO2 emissions per capita (metric tons) Water and sanitationInternal freshwater resources per capita (cu. m)Total freshwater withdrawal (% of internal resources)
Agriculture (% of total freshwater withdrawal)Access to improved water source (% of total population)
Rural (% of rural population)Urban (% of urban population)
Access to improved sanitation (% of total population)Rural (% of rural population)Urban (% of urban population)
Environment and healthParticulate matter (urban-pop.-weighted avg., µg/cu. m)Acute resp. infection prevalence (% of children under five)Diarrhea prevalence (% of children under five)Under-five mortality rate (per 1,000 live births) National accounting aggregates—savings, depletion and degradationGross savings (% of GNI)Consumption of fixed capital (% of GNI)Education expenditure (% of GNI)Energy depletion (% of GNI)Mineral depletion (% of GNI)Net forest depletion (% of GNI)CO2 damage (% of GNI)Particulate emissions damage (% of GNI)Adjusted net savings (% of GNI)
13,320 7,734 6,56312,053 6,652 5,821
67.7 64.7 60.6–1.3 0.3 2.5
29 28 350.1 .. ..
3,837 3,374 8692,748 2,740 3,944
54.1 38.7 34.8–0.3 0.0 0.018.0 7.5 13.3
1660
156 5,790 97,437–5.0 –2.9 0.7–6.5 –0.5 9.06.7 10.4 8.4
.. .. 33,350
.. .. 48,783
1,971 3,015 1,94829.3 2.0 8.1
3,026 4,059 2,94245.1 65.4 72.953.1 18.8 21.3
3.0 7.1 5.5
8,133 12,498 8,5502.5 6.3 5.612 60 6699 96 9396 91 86
100 99 9878 84 7371 81 6282 87 81
12 21 42.. .. .... .. ..8 21 20
25.9 26.1 36.412.3 12.3 11.8
5.6 3.6 3.30.0 9.3 5.70.0 0.8 1.60.5 0.0 0.00.2 0.7 0.70.0 0.3 0.7
18.5 6.2 19.2
124 2013 The Little Green Data Book
Country data
Europe & Central
Asia group
Upper middle-income group
Population (millions) 2.1 Land area (1,000 sq. km) 62 GDP ($ billions) 28.3
Latvia

GNI per capita, World Bank Atlas method ($)Adjusted net national income per capita ($)Urban population (% of total)Urban population growth (avg. annual %, 1990–2011) AgricultureAgricultural land (% land area)Agricultural irrigated land (% of total agricultural land)Agricultural productivity, value added per worker (2000 $)Cereal yield (kg per hectare) Forests and biodiversityForest area (% land area)Deforestation (avg. annual %, 2000–2010)Terrestrial protected areas (% of total land area)Threatened species, mammalsThreatened species, birdsThreatened species, fishThreatened species, higher plants OceansTotal fisheries production (thousand metric tons)
Capture fisheries growth (avg. annual %, 1990–2011)Aquaculture growth (avg. annual %, 1990–2011)
Marine protected areas (% of territorial waters)Coral reef area (sq. km)Mangroves area (sq. km) Energy and emissionsEnergy use per capita (kg oil equivalent)Energy from biomass products and waste (% of total)Electric power consumption per capita (kWh)Electricity generated using fossil fuel (% of total)Electricity generated by hydropower (% of total)CO2 emissions per capita (metric tons) Water and sanitationInternal freshwater resources per capita (cu. m)Total freshwater withdrawal (% of internal resources)
Agriculture (% of total freshwater withdrawal)Access to improved water source (% of total population)
Rural (% of rural population)Urban (% of urban population)
Access to improved sanitation (% of total population)Rural (% of rural population)Urban (% of urban population)
Environment and healthParticulate matter (urban-pop.-weighted avg., µg/cu. m)Acute resp. infection prevalence (% of children under five)Diarrhea prevalence (% of children under five)Under-five mortality rate (per 1,000 live births) National accounting aggregates—savings, depletion and degradationGross savings (% of GNI)Consumption of fixed capital (% of GNI)Education expenditure (% of GNI)Energy depletion (% of GNI)Mineral depletion (% of GNI)Net forest depletion (% of GNI)CO2 damage (% of GNI)Particulate emissions damage (% of GNI)Adjusted net savings (% of GNI)
9,140 3,866 6,5638,207 3,285 5,821
87.2 58.9 60.62.0 2.5 2.5
62 23 3520.2 .. ..
44,019 2,627 8692,802 2,475 3,944
13.4 2.4 34.8–0.4 –0.1 0.00.5 3.9 13.3109
221
5.1 3,538 97,4374.8 2.4 0.7
14.1 13.1 9.00.11 2.0 8.4
.. 5,700 33,350
.. 217 48,783
1,526 1,372 1,9481.9 0.9 8.1
3,569 1,658 2,94294.7 92.9 72.95.3 5.4 21.35.0 4.1 5.5
1,127 673 8,55027.3 122.1 5.6
60 86 66100 89 93100 81 86100 94 98
98 88 7387 80 62
100 94 81
25 59 42.. .. .... .. ..9 32 20
11.6 27.0 36.412.0 10.8 11.8
1.6 4.5 3.30.0 15.2 5.70.0 0.6 1.60.0 0.1 0.00.4 0.6 0.70.1 0.9 0.70.7 6.1 19.2
125The Little Green Data Book 2013
LebanonCountry
data
Middle East &
N. Africa group
Upper middle-income group
Population (millions) 4.3 Land area (1,000 sq. km) 10 GDP ($ billions) 40.1

GNI per capita, World Bank Atlas method ($)Adjusted net national income per capita ($)Urban population (% of total)Urban population growth (avg. annual %, 1990–2011) AgricultureAgricultural land (% land area)Agricultural irrigated land (% of total agricultural land)Agricultural productivity, value added per worker (2000 $)Cereal yield (kg per hectare) Forests and biodiversityForest area (% land area)Deforestation (avg. annual %, 2000–2010)Terrestrial protected areas (% of total land area)Threatened species, mammalsThreatened species, birdsThreatened species, fishThreatened species, higher plants OceansTotal fisheries production (thousand metric tons)
Capture fisheries growth (avg. annual %, 1990–2011)Aquaculture growth (avg. annual %, 1990–2011)
Marine protected areas (% of territorial waters)Coral reef area (sq. km)Mangroves area (sq. km) Energy and emissionsEnergy use per capita (kg oil equivalent)Energy from biomass products and waste (% of total)Electric power consumption per capita (kWh)Electricity generated using fossil fuel (% of total)Electricity generated by hydropower (% of total)CO2 emissions per capita (metric tons) Water and sanitationInternal freshwater resources per capita (cu. m)Total freshwater withdrawal (% of internal resources)
Agriculture (% of total freshwater withdrawal)Access to improved water source (% of total population)
Rural (% of rural population)Urban (% of urban population)
Access to improved sanitation (% of total population)Rural (% of rural population)Urban (% of urban population)
Environment and healthParticulate matter (urban-pop.-weighted avg., µg/cu. m)Acute resp. infection prevalence (% of children under five)Diarrhea prevalence (% of children under five)Under-five mortality rate (per 1,000 live births) National accounting aggregates—savings, depletion and degradationGross savings (% of GNI)Consumption of fixed capital (% of GNI)Education expenditure (% of GNI)Energy depletion (% of GNI)Mineral depletion (% of GNI)Net forest depletion (% of GNI)CO2 damage (% of GNI)Particulate emissions damage (% of GNI)Adjusted net savings (% of GNI)
1,210 1,258 1,7721,222 1,022 1,595
27.6 36.5 38.74.6 3.8 2.7
76 44 46.. .. ..
200 334 716664 1,361 3,065
1.5 27.8 28.4–0.5 0.5 0.30.5 11.7 9.9
2714
0.35 6,383 40,2387.4 1.8 2.4
13.8 16.0 10.0.. 5.8 2.9.. 17,980 143,440.. 27,808 60,301
9 683 667.. 58.2 26.2.. 553 698.. 65.2 73.0.. 18.7 17.4.. 0.9 1.6
2,384 4,455 3,1211.0 3.2 20.220 84 8878 61 8773 48 8491 83 9326 31 4724 23 3532 42 66
38 41 53.. .. .... .. ..
86 109 62
12.5 18.4 29.77.3 10.9 9.99.7 3.7 3.10.0 10.4 6.30.0 2.2 1.21.0 0.5 0.3
.. 0.5 0.70.1 0.4 0.6
.. –1.2 14.7
126 2013 The Little Green Data Book
Population (millions) 2.2 Land area (1,000 sq. km) 30 GDP ($ billions) 2.4
Country data
Sub-Saharan Africa group
Lower middle-income group
Lesotho
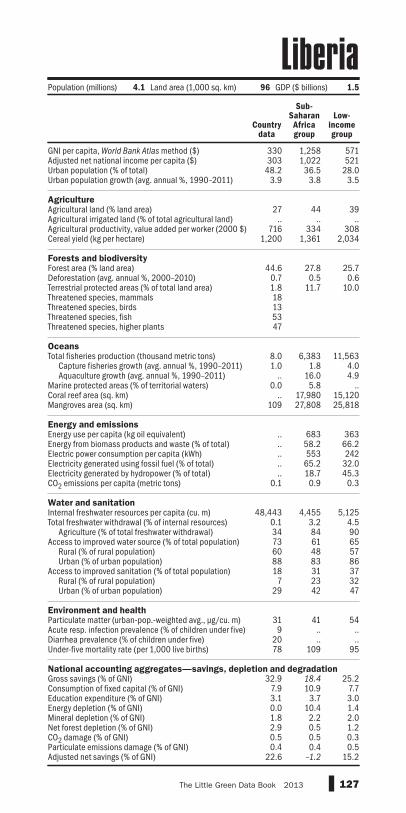
GNI per capita, World Bank Atlas method ($)Adjusted net national income per capita ($)Urban population (% of total)Urban population growth (avg. annual %, 1990–2011) AgricultureAgricultural land (% land area)Agricultural irrigated land (% of total agricultural land)Agricultural productivity, value added per worker (2000 $)Cereal yield (kg per hectare) Forests and biodiversityForest area (% land area)Deforestation (avg. annual %, 2000–2010)Terrestrial protected areas (% of total land area)Threatened species, mammalsThreatened species, birdsThreatened species, fishThreatened species, higher plants OceansTotal fisheries production (thousand metric tons)
Capture fisheries growth (avg. annual %, 1990–2011)Aquaculture growth (avg. annual %, 1990–2011)
Marine protected areas (% of territorial waters)Coral reef area (sq. km)Mangroves area (sq. km) Energy and emissionsEnergy use per capita (kg oil equivalent)Energy from biomass products and waste (% of total)Electric power consumption per capita (kWh)Electricity generated using fossil fuel (% of total)Electricity generated by hydropower (% of total)CO2 emissions per capita (metric tons) Water and sanitationInternal freshwater resources per capita (cu. m)Total freshwater withdrawal (% of internal resources)
Agriculture (% of total freshwater withdrawal)Access to improved water source (% of total population)
Rural (% of rural population)Urban (% of urban population)
Access to improved sanitation (% of total population)Rural (% of rural population)Urban (% of urban population)
Environment and healthParticulate matter (urban-pop.-weighted avg., µg/cu. m)Acute resp. infection prevalence (% of children under five)Diarrhea prevalence (% of children under five)Under-five mortality rate (per 1,000 live births) National accounting aggregates—savings, depletion and degradationGross savings (% of GNI)Consumption of fixed capital (% of GNI)Education expenditure (% of GNI)Energy depletion (% of GNI)Mineral depletion (% of GNI)Net forest depletion (% of GNI)CO2 damage (% of GNI)Particulate emissions damage (% of GNI)Adjusted net savings (% of GNI)
330 1,258 571303 1,022 521
48.2 36.5 28.03.9 3.8 3.5
27 44 39.. .. ..
716 334 3081,200 1,361 2,034
44.6 27.8 25.70.7 0.5 0.61.8 11.7 10.018135347
8.0 6,383 11,5631.0 1.8 4.0
.. 16.0 4.90.0 5.8 ..
.. 17,980 15,120109 27,808 25,818
.. 683 363
.. 58.2 66.2
.. 553 242
.. 65.2 32.0
.. 18.7 45.30.1 0.9 0.3
48,443 4,455 5,1250.1 3.2 4.534 84 9073 61 6560 48 5788 83 8618 31 37
7 23 3229 42 47
31 41 549 .. ..
20 .. ..78 109 95
32.9 18.4 25.27.9 10.9 7.73.1 3.7 3.00.0 10.4 1.41.8 2.2 2.02.9 0.5 1.20.5 0.5 0.30.4 0.4 0.5
22.6 –1.2 15.2
127The Little Green Data Book 2013
LiberiaCountry
data
Sub-Saharan Africa group
Low-income group
Population (millions) 4.1 Land area (1,000 sq. km) 96 GDP ($ billions) 1.5

GNI per capita, World Bank Atlas method ($)Adjusted net national income per capita ($)Urban population (% of total)Urban population growth (avg. annual %, 1990–2011) AgricultureAgricultural land (% land area)Agricultural irrigated land (% of total agricultural land)Agricultural productivity, value added per worker (2000 $)Cereal yield (kg per hectare) Forests and biodiversityForest area (% land area)Deforestation (avg. annual %, 2000–2010)Terrestrial protected areas (% of total land area)Threatened species, mammalsThreatened species, birdsThreatened species, fishThreatened species, higher plants OceansTotal fisheries production (thousand metric tons)
Capture fisheries growth (avg. annual %, 1990–2011)Aquaculture growth (avg. annual %, 1990–2011)
Marine protected areas (% of territorial waters)Coral reef area (sq. km)Mangroves area (sq. km) Energy and emissionsEnergy use per capita (kg oil equivalent)Energy from biomass products and waste (% of total)Electric power consumption per capita (kWh)Electricity generated using fossil fuel (% of total)Electricity generated by hydropower (% of total)CO2 emissions per capita (metric tons) Water and sanitationInternal freshwater resources per capita (cu. m)Total freshwater withdrawal (% of internal resources)
Agriculture (% of total freshwater withdrawal)Access to improved water source (% of total population)
Rural (% of rural population)Urban (% of urban population)
Access to improved sanitation (% of total population)Rural (% of rural population)Urban (% of urban population)
Environment and healthParticulate matter (urban-pop.-weighted avg., µg/cu. m)Acute resp. infection prevalence (% of children under five)Diarrhea prevalence (% of children under five)Under-five mortality rate (per 1,000 live births) National accounting aggregates—savings, depletion and degradationGross savings (% of GNI)Consumption of fixed capital (% of GNI)Education expenditure (% of GNI)Energy depletion (% of GNI)Mineral depletion (% of GNI)Net forest depletion (% of GNI)CO2 damage (% of GNI)Particulate emissions damage (% of GNI)Adjusted net savings (% of GNI)
12,320 3,866 6,5635,845 3,285 5,821
77.7 58.9 60.62.0 2.5 2.5
9 23 35.. .. .... 2,627 869
614 2,475 3,944
0.1 2.4 34.80.0 –0.1 0.00.1 3.9 13.312
4243
30.2 3,538 97,4370.9 2.4 0.76.0 13.1 9.0
0.05 2.0 8.4.. 5,700 33,350.. 217 48,783
3,013 1,372 1,9480.9 0.9 8.1
4,270 1,658 2,942100.0 92.9 72.9
0.0 5.4 21.310.0 4.1 5.5
109 673 8,550618.0 122.1 5.6
83 86 66.. 89 93.. 81 86.. 94 98
97 88 7396 80 6297 94 81
65 59 42.. .. .... .. ..
16 32 20
66.8 27.0 36.412.0 10.8 11.8
.. 4.5 3.329.0 15.2 5.7
0.0 0.6 1.60.0 0.1 0.00.7 0.6 0.71.4 0.9 0.7
.. 6.1 19.2
128 2013 The Little Green Data Book
Population (millions) 6.4 Land area (1,000 sq. km) 1,760 GDP ($ billions) 62.4
Country data
Middle East &
N. Africa group
Upper middle-income group
Libya

GNI per capita, World Bank Atlas method ($)Adjusted net national income per capita ($)Urban population (% of total)Urban population growth (avg. annual %, 1990–2011) AgricultureAgricultural land (% land area)Agricultural irrigated land (% of total agricultural land)Agricultural productivity, value added per worker (2000 $)Cereal yield (kg per hectare) Forests and biodiversityForest area (% land area)Deforestation (avg. annual %, 2000–2010)Terrestrial protected areas (% of total land area)Threatened species, mammalsThreatened species, birdsThreatened species, fishThreatened species, higher plants OceansTotal fisheries production (thousand metric tons)
Capture fisheries growth (avg. annual %, 1990–2011)Aquaculture growth (avg. annual %, 1990–2011)
Marine protected areas (% of territorial waters)Coral reef area (sq. km)Mangroves area (sq. km) Energy and emissionsEnergy use per capita (kg oil equivalent)Energy from biomass products and waste (% of total)Electric power consumption per capita (kWh)Electricity generated using fossil fuel (% of total)Electricity generated by hydropower (% of total)CO2 emissions per capita (metric tons) Water and sanitationInternal freshwater resources per capita (cu. m)Total freshwater withdrawal (% of internal resources)
Agriculture (% of total freshwater withdrawal)Access to improved water source (% of total population)
Rural (% of rural population)Urban (% of urban population)
Access to improved sanitation (% of total population)Rural (% of rural population)Urban (% of urban population)
Environment and healthParticulate matter (urban-pop.-weighted avg., µg/cu. m)Acute resp. infection prevalence (% of children under five)Diarrhea prevalence (% of children under five)Under-five mortality rate (per 1,000 live births) National accounting aggregates—savings, depletion and degradationGross savings (% of GNI)Consumption of fixed capital (% of GNI)Education expenditure (% of GNI)Energy depletion (% of GNI)Mineral depletion (% of GNI)Net forest depletion (% of GNI)CO2 damage (% of GNI)Particulate emissions damage (% of GNI)Adjusted net savings (% of GNI)
137,070 39,860.. 34,611
14.4 80.50.3 1.1
41 37.. .... 26,515.. 5,349
43.1 28.40.0 0.0
42.4 12.90000
.. 28,774
.. –1.7
.. 1.8
.. 16.5
.. 81,970
.. 15,496
.. 5,000
.. 4.4
.. 9,415
.. 62.0
.. 11.2
.. 11.4
.. 8,195
.. 10.3
.. 41
.. 100
.. 98
.. 100
.. 100
.. 99
.. 100
24 22.. .... ..2 6
.. 17.913.3 13.9
2.4 4.60.0 1.40.0 0.2
.. 0.0
.. 0.2
.. 0.1
.. 6.6
129The Little Green Data Book 2013
Population (thousands) 36 Land area (sq. km) 160 GDP ($ billions) 4.8
Country data
High-income group
Liechtenstein

GNI per capita, World Bank Atlas method ($)Adjusted net national income per capita ($)Urban population (% of total)Urban population growth (avg. annual %, 1990–2011) AgricultureAgricultural land (% land area)Agricultural irrigated land (% of total agricultural land)Agricultural productivity, value added per worker (2000 $)Cereal yield (kg per hectare) Forests and biodiversityForest area (% land area)Deforestation (avg. annual %, 2000–2010)Terrestrial protected areas (% of total land area)Threatened species, mammalsThreatened species, birdsThreatened species, fishThreatened species, higher plants OceansTotal fisheries production (thousand metric tons)
Capture fisheries growth (avg. annual %, 1990–2011)Aquaculture growth (avg. annual %, 1990–2011)
Marine protected areas (% of territorial waters)Coral reef area (sq. km)Mangroves area (sq. km) Energy and emissionsEnergy use per capita (kg oil equivalent)Energy from biomass products and waste (% of total)Electric power consumption per capita (kWh)Electricity generated using fossil fuel (% of total)Electricity generated by hydropower (% of total)CO2 emissions per capita (metric tons) Water and sanitationInternal freshwater resources per capita (cu. m)Total freshwater withdrawal (% of internal resources)
Agriculture (% of total freshwater withdrawal)Access to improved water source (% of total population)
Rural (% of rural population)Urban (% of urban population)
Access to improved sanitation (% of total population)Rural (% of rural population)Urban (% of urban population)
Environment and healthParticulate matter (urban-pop.-weighted avg., µg/cu. m)Acute resp. infection prevalence (% of children under five)Diarrhea prevalence (% of children under five)Under-five mortality rate (per 1,000 live births) National accounting aggregates—savings, depletion and degradationGross savings (% of GNI)Consumption of fixed capital (% of GNI)Education expenditure (% of GNI)Energy depletion (% of GNI)Mineral depletion (% of GNI)Net forest depletion (% of GNI)CO2 damage (% of GNI)Particulate emissions damage (% of GNI)Adjusted net savings (% of GNI)
12,980 7,734 6,56311,775 6,652 5,821
67.1 64.7 60.6–1.0 0.3 2.5
45 28 35.. .. ..
5,996 3,374 8693,030 2,740 3,944
34.6 38.7 34.8–0.7 0.0 0.014.5 7.5 13.3
3661
142 5,790 97,437–4.1 –2.9 0.7–1.7 –0.5 9.010.7 10.4 8.4
.. .. 33,350
.. .. 48,783
2,107 3,015 1,94814.3 2.0 8.1
3,271 4,059 2,94276.8 65.4 72.910.8 18.8 21.33.8 7.1 5.5
5,135 12,498 8,55015.3 6.3 5.6
3 60 6692 96 9381 91 8698 99 9886 84 7369 81 6295 87 81
16 21 42.. .. .... .. ..6 21 20
18.1 26.1 36.412.8 12.3 11.8
5.4 3.6 3.30.1 9.3 5.70.0 0.8 1.60.6 0.0 0.00.3 0.7 0.70.1 0.3 0.79.6 6.2 19.2
130 2013 The Little Green Data Book
Country data
Europe & Central
Asia group
Upper middle-income group
Population (millions) 3.0 Land area (1,000 sq. km) 63 GDP ($ billions) 42.7
Lithuania
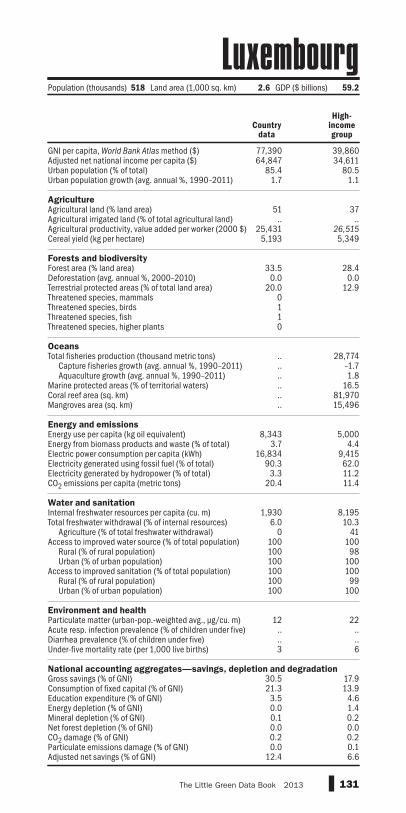
GNI per capita, World Bank Atlas method ($)Adjusted net national income per capita ($)Urban population (% of total)Urban population growth (avg. annual %, 1990–2011) AgricultureAgricultural land (% land area)Agricultural irrigated land (% of total agricultural land)Agricultural productivity, value added per worker (2000 $)Cereal yield (kg per hectare) Forests and biodiversityForest area (% land area)Deforestation (avg. annual %, 2000–2010)Terrestrial protected areas (% of total land area)Threatened species, mammalsThreatened species, birdsThreatened species, fishThreatened species, higher plants OceansTotal fisheries production (thousand metric tons)
Capture fisheries growth (avg. annual %, 1990–2011)Aquaculture growth (avg. annual %, 1990–2011)
Marine protected areas (% of territorial waters)Coral reef area (sq. km)Mangroves area (sq. km) Energy and emissionsEnergy use per capita (kg oil equivalent)Energy from biomass products and waste (% of total)Electric power consumption per capita (kWh)Electricity generated using fossil fuel (% of total)Electricity generated by hydropower (% of total)CO2 emissions per capita (metric tons) Water and sanitationInternal freshwater resources per capita (cu. m)Total freshwater withdrawal (% of internal resources)
Agriculture (% of total freshwater withdrawal)Access to improved water source (% of total population)
Rural (% of rural population)Urban (% of urban population)
Access to improved sanitation (% of total population)Rural (% of rural population)Urban (% of urban population)
Environment and healthParticulate matter (urban-pop.-weighted avg., µg/cu. m)Acute resp. infection prevalence (% of children under five)Diarrhea prevalence (% of children under five)Under-five mortality rate (per 1,000 live births) National accounting aggregates—savings, depletion and degradationGross savings (% of GNI)Consumption of fixed capital (% of GNI)Education expenditure (% of GNI)Energy depletion (% of GNI)Mineral depletion (% of GNI)Net forest depletion (% of GNI)CO2 damage (% of GNI)Particulate emissions damage (% of GNI)Adjusted net savings (% of GNI)
77,390 39,86064,847 34,611
85.4 80.51.7 1.1
51 37.. ..
25,431 26,5155,193 5,349
33.5 28.40.0 0.0
20.0 12.90110
.. 28,774
.. –1.7
.. 1.8
.. 16.5
.. 81,970
.. 15,496
8,343 5,0003.7 4.4
16,834 9,41590.3 62.0
3.3 11.220.4 11.4
1,930 8,1956.0 10.3
0 41100 100100 98100 100100 100100 99100 100
12 22.. .... ..3 6
30.5 17.921.3 13.93.5 4.60.0 1.40.1 0.20.0 0.00.2 0.20.0 0.1
12.4 6.6
131The Little Green Data Book 2013
Country data
High-income group
Population (thousands) 518 Land area (1,000 sq. km) 2.6 GDP ($ billions) 59.2
Luxembourg

GNI per capita, World Bank Atlas method ($)Adjusted net national income per capita ($)Urban population (% of total)Urban population growth (avg. annual %, 1990–2011) AgricultureAgricultural land (% land area)Agricultural irrigated land (% of total agricultural land)Agricultural productivity, value added per worker (2000 $)Cereal yield (kg per hectare) Forests and biodiversityForest area (% land area)Deforestation (avg. annual %, 2000–2010)Terrestrial protected areas (% of total land area)Threatened species, mammalsThreatened species, birdsThreatened species, fishThreatened species, higher plants OceansTotal fisheries production (thousand metric tons)
Capture fisheries growth (avg. annual %, 1990–2011)Aquaculture growth (avg. annual %, 1990–2011)
Marine protected areas (% of territorial waters)Coral reef area (sq. km)Mangroves area (sq. km) Energy and emissionsEnergy use per capita (kg oil equivalent)Energy from biomass products and waste (% of total)Electric power consumption per capita (kWh)Electricity generated using fossil fuel (% of total)Electricity generated by hydropower (% of total)CO2 emissions per capita (metric tons) Water and sanitationInternal freshwater resources per capita (cu. m)Total freshwater withdrawal (% of internal resources)
Agriculture (% of total freshwater withdrawal)Access to improved water source (% of total population)
Rural (% of rural population)Urban (% of urban population)
Access to improved sanitation (% of total population)Rural (% of rural population)Urban (% of urban population)
Environment and healthParticulate matter (urban-pop.-weighted avg., µg/cu. m)Acute resp. infection prevalence (% of children under five)Diarrhea prevalence (% of children under five)Under-five mortality rate (per 1,000 live births) National accounting aggregates—savings, depletion and degradationGross savings (% of GNI)Consumption of fixed capital (% of GNI)Education expenditure (% of GNI)Energy depletion (% of GNI)Mineral depletion (% of GNI)Net forest depletion (% of GNI)CO2 damage (% of GNI)Particulate emissions damage (% of GNI)Adjusted net savings (% of GNI)
45,460 39,860.. 34,611
100.0 80.52.1 1.1
.. 37
.. ..
.. 26,515
.. 5,349
.. 28.4
.. 0.0
.. 12.90450
1.5 28,774–2.6 –1.7
.. 1.8
.. 16.5
.. 81,970
.. 15,496
.. 5,000
.. 4.4
.. 9,415
.. 62.0
.. 11.22.8 11.4
.. 8,195
.. 10.3
.. 41
.. 100
.. 98
.. 100
.. 100
.. 99
.. 100
.. 22
.. ..
.. ..
.. 6
62.6 17.91.8 13.92.8 4.60.0 1.40.0 0.2
.. 0.00.1 0.2
.. 0.1
.. 6.6
132 2013 The Little Green Data Book
Country data
High-income group
Population (thousands) 556 Land area (sq. km) 28 GDP ($ billions) 36.4
Macao SAR, China
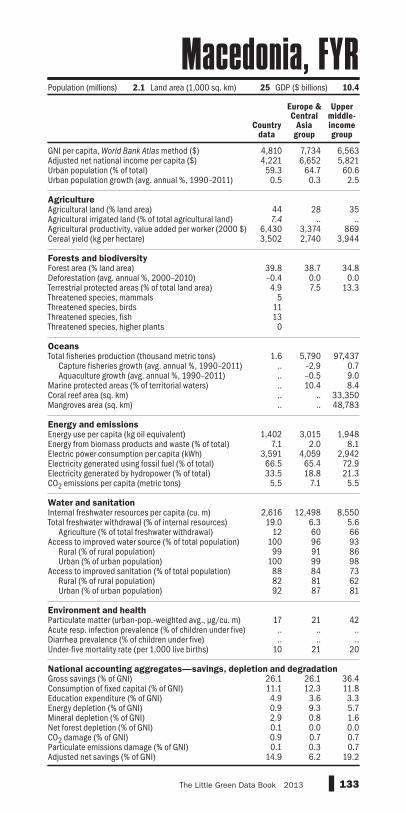
GNI per capita, World Bank Atlas method ($)Adjusted net national income per capita ($)Urban population (% of total)Urban population growth (avg. annual %, 1990–2011) AgricultureAgricultural land (% land area)Agricultural irrigated land (% of total agricultural land)Agricultural productivity, value added per worker (2000 $)Cereal yield (kg per hectare) Forests and biodiversityForest area (% land area)Deforestation (avg. annual %, 2000–2010)Terrestrial protected areas (% of total land area)Threatened species, mammalsThreatened species, birdsThreatened species, fishThreatened species, higher plants OceansTotal fisheries production (thousand metric tons)
Capture fisheries growth (avg. annual %, 1990–2011)Aquaculture growth (avg. annual %, 1990–2011)
Marine protected areas (% of territorial waters)Coral reef area (sq. km)Mangroves area (sq. km) Energy and emissionsEnergy use per capita (kg oil equivalent)Energy from biomass products and waste (% of total)Electric power consumption per capita (kWh)Electricity generated using fossil fuel (% of total)Electricity generated by hydropower (% of total)CO2 emissions per capita (metric tons) Water and sanitationInternal freshwater resources per capita (cu. m)Total freshwater withdrawal (% of internal resources)
Agriculture (% of total freshwater withdrawal)Access to improved water source (% of total population)
Rural (% of rural population)Urban (% of urban population)
Access to improved sanitation (% of total population)Rural (% of rural population)Urban (% of urban population)
Environment and healthParticulate matter (urban-pop.-weighted avg., µg/cu. m)Acute resp. infection prevalence (% of children under five)Diarrhea prevalence (% of children under five)Under-five mortality rate (per 1,000 live births) National accounting aggregates—savings, depletion and degradationGross savings (% of GNI)Consumption of fixed capital (% of GNI)Education expenditure (% of GNI)Energy depletion (% of GNI)Mineral depletion (% of GNI)Net forest depletion (% of GNI)CO2 damage (% of GNI)Particulate emissions damage (% of GNI)Adjusted net savings (% of GNI)
4,810 7,734 6,5634,221 6,652 5,821
59.3 64.7 60.60.5 0.3 2.5
44 28 357.4 .. ..
6,430 3,374 8693,502 2,740 3,944
39.8 38.7 34.8–0.4 0.0 0.04.9 7.5 13.3
51113
0
1.6 5,790 97,437.. –2.9 0.7.. –0.5 9.0.. 10.4 8.4.. .. 33,350.. .. 48,783
1,402 3,015 1,9487.1 2.0 8.1
3,591 4,059 2,94266.5 65.4 72.933.5 18.8 21.3
5.5 7.1 5.5
2,616 12,498 8,55019.0 6.3 5.6
12 60 66100 96 9399 91 86
100 99 9888 84 7382 81 6292 87 81
17 21 42.. .. .... .. ..
10 21 20
26.1 26.1 36.411.1 12.3 11.84.9 3.6 3.30.9 9.3 5.72.9 0.8 1.60.1 0.0 0.00.9 0.7 0.70.1 0.3 0.7
14.9 6.2 19.2
133The Little Green Data Book 2013
Population (millions) 2.1 Land area (1,000 sq. km) 25 GDP ($ billions) 10.4
Country data
Europe & Central
Asia group
Upper middle-income group
Macedonia, FYR

GNI per capita, World Bank Atlas method ($)Adjusted net national income per capita ($)Urban population (% of total)Urban population growth (avg. annual %, 1990–2011) AgricultureAgricultural land (% land area)Agricultural irrigated land (% of total agricultural land)Agricultural productivity, value added per worker (2000 $)Cereal yield (kg per hectare) Forests and biodiversityForest area (% land area)Deforestation (avg. annual %, 2000–2010)Terrestrial protected areas (% of total land area)Threatened species, mammalsThreatened species, birdsThreatened species, fishThreatened species, higher plants OceansTotal fisheries production (thousand metric tons)
Capture fisheries growth (avg. annual %, 1990–2011)Aquaculture growth (avg. annual %, 1990–2011)
Marine protected areas (% of territorial waters)Coral reef area (sq. km)Mangroves area (sq. km) Energy and emissionsEnergy use per capita (kg oil equivalent)Energy from biomass products and waste (% of total)Electric power consumption per capita (kWh)Electricity generated using fossil fuel (% of total)Electricity generated by hydropower (% of total)CO2 emissions per capita (metric tons) Water and sanitationInternal freshwater resources per capita (cu. m)Total freshwater withdrawal (% of internal resources)
Agriculture (% of total freshwater withdrawal)Access to improved water source (% of total population)
Rural (% of rural population)Urban (% of urban population)
Access to improved sanitation (% of total population)Rural (% of rural population)Urban (% of urban population)
Environment and healthParticulate matter (urban-pop.-weighted avg., µg/cu. m)Acute resp. infection prevalence (% of children under five)Diarrhea prevalence (% of children under five)Under-five mortality rate (per 1,000 live births) National accounting aggregates—savings, depletion and degradationGross savings (% of GNI)Consumption of fixed capital (% of GNI)Education expenditure (% of GNI)Energy depletion (% of GNI)Mineral depletion (% of GNI)Net forest depletion (% of GNI)CO2 damage (% of GNI)Particulate emissions damage (% of GNI)Adjusted net savings (% of GNI)
430 1,258 571409 1,022 52132.6 36.5 28.0
4.6 3.8 3.5
71 44 392.2 .. ..187 334 308
2,503 1,361 2,034
21.5 27.8 25.70.4 0.5 0.63.1 11.7 10.0653586
358
138 6,383 11,5631.0 1.8 4.0
18.9 16.0 4.90.12 5.8 ..
2,230 17,980 15,1202,991 27,808 25,818
.. 683 363
.. 58.2 66.2
.. 553 242
.. 65.2 32.0
.. 18.7 45.30.1 0.9 0.3
15,810 4,455 5,1254.4 3.2 4.597 84 9046 61 6534 48 5774 83 8615 31 3712 23 3221 42 47
28 41 543 .. ..8 .. ..
62 109 95
.. 18.4 25.27.7 10.9 7.72.7 3.7 3.00.0 10.4 1.42.5 2.2 2.00.2 0.5 1.20.1 0.5 0.30.1 0.4 0.5
.. –1.2 15.2
134 2013 The Little Green Data Book
Population (millions) 21.3 Land area (1,000 sq. km) 582 GDP ($ billions) 9.9
Country data
Sub-Saharan Africa group
Low-income group
Madagascar

GNI per capita, World Bank Atlas method ($)Adjusted net national income per capita ($)Urban population (% of total)Urban population growth (avg. annual %, 1990–2011) AgricultureAgricultural land (% land area)Agricultural irrigated land (% of total agricultural land)Agricultural productivity, value added per worker (2000 $)Cereal yield (kg per hectare) Forests and biodiversityForest area (% land area)Deforestation (avg. annual %, 2000–2010)Terrestrial protected areas (% of total land area)Threatened species, mammalsThreatened species, birdsThreatened species, fishThreatened species, higher plants OceansTotal fisheries production (thousand metric tons)
Capture fisheries growth (avg. annual %, 1990–2011)Aquaculture growth (avg. annual %, 1990–2011)
Marine protected areas (% of territorial waters)Coral reef area (sq. km)Mangroves area (sq. km) Energy and emissionsEnergy use per capita (kg oil equivalent)Energy from biomass products and waste (% of total)Electric power consumption per capita (kWh)Electricity generated using fossil fuel (% of total)Electricity generated by hydropower (% of total)CO2 emissions per capita (metric tons) Water and sanitationInternal freshwater resources per capita (cu. m)Total freshwater withdrawal (% of internal resources)
Agriculture (% of total freshwater withdrawal)Access to improved water source (% of total population)
Rural (% of rural population)Urban (% of urban population)
Access to improved sanitation (% of total population)Rural (% of rural population)Urban (% of urban population)
Environment and healthParticulate matter (urban-pop.-weighted avg., µg/cu. m)Acute resp. infection prevalence (% of children under five)Diarrhea prevalence (% of children under five)Under-five mortality rate (per 1,000 live births) National accounting aggregates—savings, depletion and degradationGross savings (% of GNI)Consumption of fixed capital (% of GNI)Education expenditure (% of GNI)Energy depletion (% of GNI)Mineral depletion (% of GNI)Net forest depletion (% of GNI)CO2 damage (% of GNI)Particulate emissions damage (% of GNI)Adjusted net savings (% of GNI)
360 1,258 571324 1,022 52115.7 36.5 28.03.8 3.8 3.5
59 44 390.5 .. ..172 334 308
2,094 1,361 2,034
34.0 27.8 25.71.0 0.5 0.6
15.0 11.7 10.07
15101
16
85.8 6,383 11,5630.5 1.8 4.0
14.6 16.0 4.9.. 5.8 .... 17,980 15,120.. 27,808 25,818
.. 683 363
.. 58.2 66.2
.. 553 242
.. 65.2 32.0
.. 18.7 45.30.1 0.9 0.3
1,049 4,455 5,1256.0 3.2 4.584 84 9083 61 6580 48 5795 83 8651 31 3751 23 3249 42 47
29 41 54.. .. .... .. ..
83 109 95
13.9 18.4 25.27.4 10.9 7.75.3 3.7 3.00.0 10.4 1.40.0 2.2 2.01.7 0.5 1.20.2 0.5 0.30.1 0.4 0.59.7 –1.2 15.2
135The Little Green Data Book 2013
Country data
Sub-Saharan Africa group
Low-income group
Population (millions) 15.4 Land area (1,000 sq. km) 94 GDP ($ billions) 5.6
Malawi

GNI per capita, World Bank Atlas method ($)Adjusted net national income per capita ($)Urban population (% of total)Urban population growth (avg. annual %, 1990–2011) AgricultureAgricultural land (% land area)Agricultural irrigated land (% of total agricultural land)Agricultural productivity, value added per worker (2000 $)Cereal yield (kg per hectare) Forests and biodiversityForest area (% land area)Deforestation (avg. annual %, 2000–2010)Terrestrial protected areas (% of total land area)Threatened species, mammalsThreatened species, birdsThreatened species, fishThreatened species, higher plants OceansTotal fisheries production (thousand metric tons)
Capture fisheries growth (avg. annual %, 1990–2011)Aquaculture growth (avg. annual %, 1990–2011)
Marine protected areas (% of territorial waters)Coral reef area (sq. km)Mangroves area (sq. km) Energy and emissionsEnergy use per capita (kg oil equivalent)Energy from biomass products and waste (% of total)Electric power consumption per capita (kWh)Electricity generated using fossil fuel (% of total)Electricity generated by hydropower (% of total)CO2 emissions per capita (metric tons) Water and sanitationInternal freshwater resources per capita (cu. m)Total freshwater withdrawal (% of internal resources)
Agriculture (% of total freshwater withdrawal)Access to improved water source (% of total population)
Rural (% of rural population)Urban (% of urban population)
Access to improved sanitation (% of total population)Rural (% of rural population)Urban (% of urban population)
Environment and healthParticulate matter (urban-pop.-weighted avg., µg/cu. m)Acute resp. infection prevalence (% of children under five)Diarrhea prevalence (% of children under five)Under-five mortality rate (per 1,000 live births) National accounting aggregates—savings, depletion and degradationGross savings (% of GNI)Consumption of fixed capital (% of GNI)Education expenditure (% of GNI)Energy depletion (% of GNI)Mineral depletion (% of GNI)Net forest depletion (% of GNI)CO2 damage (% of GNI)Particulate emissions damage (% of GNI)Adjusted net savings (% of GNI)
8,770 4,248 6,5637,932 3,884 5,821
72.7 48.6 60.64.0 3.6 2.5
24 48 35.. .. ..
7,170 610 8693,920 5,050 3,944
62.0 29.7 34.80.5 –0.4 0.0
18.1 15.0 13.3704568
676
1,909 101,299 97,4371.8 3.4 0.7
11.6 9.1 9.02.0 1.4 8.4
3,600 137,690 33,3507,097 56,537 48,783
2,558 1,520 1,9484.7 10.9 8.1
4,117 2,337 2,94293.8 79.8 72.9
5.2 16.5 21.37.1 4.6 5.5
20,098 4,446 8,5502.3 10.9 5.634 73 66
100 90 9399 84 86
100 97 9896 66 7395 58 6296 76 81
18 55 42.. .. .... .. ..7 21 20
35.5 49.3 36.412.2 11.0 11.8
4.1 2.1 3.36.1 4.3 5.70.1 1.7 1.60.0 0.0 0.00.6 0.9 0.70.0 1.1 0.7
20.5 32.2 19.2
136 2013 The Little Green Data Book
Country data
East Asia & Pacific
group
Upper middle-income group
Population (millions) 28.9 Land area (1,000 sq. km) 329 GDP ($ billions) 287.9
Malaysia

GNI per capita, World Bank Atlas method ($)Adjusted net national income per capita ($)Urban population (% of total)Urban population growth (avg. annual %, 1990–2011) AgricultureAgricultural land (% land area)Agricultural irrigated land (% of total agricultural land)Agricultural productivity, value added per worker (2000 $)Cereal yield (kg per hectare) Forests and biodiversityForest area (% land area)Deforestation (avg. annual %, 2000–2010)Terrestrial protected areas (% of total land area)Threatened species, mammalsThreatened species, birdsThreatened species, fishThreatened species, higher plants OceansTotal fisheries production (thousand metric tons)
Capture fisheries growth (avg. annual %, 1990–2011)Aquaculture growth (avg. annual %, 1990–2011)
Marine protected areas (% of territorial waters)Coral reef area (sq. km)Mangroves area (sq. km) Energy and emissionsEnergy use per capita (kg oil equivalent)Energy from biomass products and waste (% of total)Electric power consumption per capita (kWh)Electricity generated using fossil fuel (% of total)Electricity generated by hydropower (% of total)CO2 emissions per capita (metric tons) Water and sanitationInternal freshwater resources per capita (cu. m)Total freshwater withdrawal (% of internal resources)
Agriculture (% of total freshwater withdrawal)Access to improved water source (% of total population)
Rural (% of rural population)Urban (% of urban population)
Access to improved sanitation (% of total population)Rural (% of rural population)Urban (% of urban population)
Environment and healthParticulate matter (urban-pop.-weighted avg., µg/cu. m)Acute resp. infection prevalence (% of children under five)Diarrhea prevalence (% of children under five)Under-five mortality rate (per 1,000 live births) National accounting aggregates—savings, depletion and degradationGross savings (% of GNI)Consumption of fixed capital (% of GNI)Education expenditure (% of GNI)Energy depletion (% of GNI)Mineral depletion (% of GNI)Net forest depletion (% of GNI)CO2 damage (% of GNI)Particulate emissions damage (% of GNI)Adjusted net savings (% of GNI)
5,720 1,313 6,5634,640 1,201 5,821
41.1 30.9 60.64.0 2.8 2.5
23 55 35.. .. ..
2,490 550 8692,508 2,959 3,944
3.0 17.1 34.80.0 –0.3 0.0
.. 5.9 13.320
180
121 13,219 97,4372.0 2.3 0.7
.. 8.1 9.0
.. 1.7 8.48,920 15,440 33,350
.. 10,343 48,783
985 519 1,948.. 26.7 8.1.. 555 2,942.. 80.6 72.9.. 14.0 21.3
3.3 1.4 5.5
94 1,197 8,55019.7 51.6 5.6
0 91 6698 90 9397 88 86
100 96 9897 38 7397 28 6298 60 81
28 62 427 .. ..5 .. ..
11 62 20
.. 33.5 36.413.5 9.2 11.8
5.0 2.8 3.30.0 2.8 5.70.0 1.0 1.60.0 0.6 0.00.5 0.8 0.70.2 0.6 0.7
.. 21.6 19.2
137The Little Green Data Book 2013
Country data
South Asia
group
Upper middle-income group
Population (thousands) 320 Land area (sq. km) 300 GDP ($ billions) 2.1
Maldives
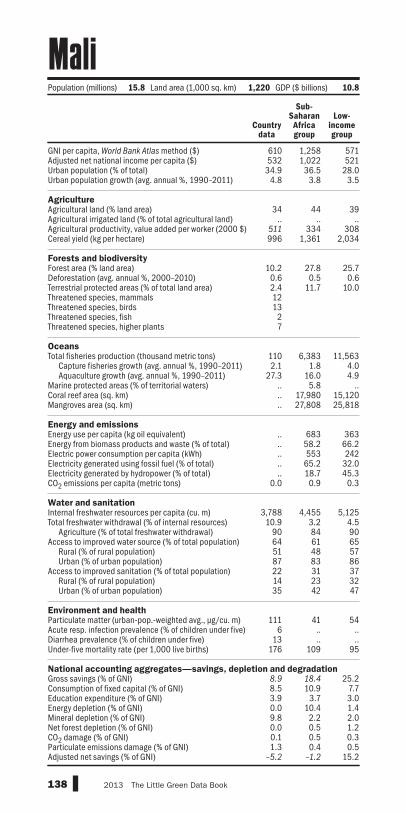
GNI per capita, World Bank Atlas method ($)Adjusted net national income per capita ($)Urban population (% of total)Urban population growth (avg. annual %, 1990–2011) AgricultureAgricultural land (% land area)Agricultural irrigated land (% of total agricultural land)Agricultural productivity, value added per worker (2000 $)Cereal yield (kg per hectare) Forests and biodiversityForest area (% land area)Deforestation (avg. annual %, 2000–2010)Terrestrial protected areas (% of total land area)Threatened species, mammalsThreatened species, birdsThreatened species, fishThreatened species, higher plants OceansTotal fisheries production (thousand metric tons)
Capture fisheries growth (avg. annual %, 1990–2011)Aquaculture growth (avg. annual %, 1990–2011)
Marine protected areas (% of territorial waters)Coral reef area (sq. km)Mangroves area (sq. km) Energy and emissionsEnergy use per capita (kg oil equivalent)Energy from biomass products and waste (% of total)Electric power consumption per capita (kWh)Electricity generated using fossil fuel (% of total)Electricity generated by hydropower (% of total)CO2 emissions per capita (metric tons) Water and sanitationInternal freshwater resources per capita (cu. m)Total freshwater withdrawal (% of internal resources)
Agriculture (% of total freshwater withdrawal)Access to improved water source (% of total population)
Rural (% of rural population)Urban (% of urban population)
Access to improved sanitation (% of total population)Rural (% of rural population)Urban (% of urban population)
Environment and healthParticulate matter (urban-pop.-weighted avg., µg/cu. m)Acute resp. infection prevalence (% of children under five)Diarrhea prevalence (% of children under five)Under-five mortality rate (per 1,000 live births) National accounting aggregates—savings, depletion and degradationGross savings (% of GNI)Consumption of fixed capital (% of GNI)Education expenditure (% of GNI)Energy depletion (% of GNI)Mineral depletion (% of GNI)Net forest depletion (% of GNI)CO2 damage (% of GNI)Particulate emissions damage (% of GNI)Adjusted net savings (% of GNI)
610 1,258 571532 1,022 52134.9 36.5 28.0
4.8 3.8 3.5
34 44 39.. .. ..
511 334 308996 1,361 2,034
10.2 27.8 25.70.6 0.5 0.62.4 11.7 10.01213
27
110 6,383 11,5632.1 1.8 4.0
27.3 16.0 4.9.. 5.8 .... 17,980 15,120.. 27,808 25,818
.. 683 363
.. 58.2 66.2
.. 553 242
.. 65.2 32.0
.. 18.7 45.30.0 0.9 0.3
3,788 4,455 5,12510.9 3.2 4.5
90 84 9064 61 6551 48 5787 83 8622 31 3714 23 3235 42 47
111 41 546 .. ..
13 .. ..176 109 95
8.9 18.4 25.28.5 10.9 7.73.9 3.7 3.00.0 10.4 1.49.8 2.2 2.00.0 0.5 1.20.1 0.5 0.31.3 0.4 0.5
–5.2 –1.2 15.2
138 2013 The Little Green Data Book
Population (millions) 15.8 Land area (1,000 sq. km) 1,220 GDP ($ billions) 10.8
Country data
Sub-Saharan Africa group
Low-income group
Mali

GNI per capita, World Bank Atlas method ($)Adjusted net national income per capita ($)Urban population (% of total)Urban population growth (avg. annual %, 1990–2011) AgricultureAgricultural land (% land area)Agricultural irrigated land (% of total agricultural land)Agricultural productivity, value added per worker (2000 $)Cereal yield (kg per hectare) Forests and biodiversityForest area (% land area)Deforestation (avg. annual %, 2000–2010)Terrestrial protected areas (% of total land area)Threatened species, mammalsThreatened species, birdsThreatened species, fishThreatened species, higher plants OceansTotal fisheries production (thousand metric tons)
Capture fisheries growth (avg. annual %, 1990–2011)Aquaculture growth (avg. annual %, 1990–2011)
Marine protected areas (% of territorial waters)Coral reef area (sq. km)Mangroves area (sq. km) Energy and emissionsEnergy use per capita (kg oil equivalent)Energy from biomass products and waste (% of total)Electric power consumption per capita (kWh)Electricity generated using fossil fuel (% of total)Electricity generated by hydropower (% of total)CO2 emissions per capita (metric tons) Water and sanitationInternal freshwater resources per capita (cu. m)Total freshwater withdrawal (% of internal resources)
Agriculture (% of total freshwater withdrawal)Access to improved water source (% of total population)
Rural (% of rural population)Urban (% of urban population)
Access to improved sanitation (% of total population)Rural (% of rural population)Urban (% of urban population)
Environment and healthParticulate matter (urban-pop.-weighted avg., µg/cu. m)Acute resp. infection prevalence (% of children under five)Diarrhea prevalence (% of children under five)Under-five mortality rate (per 1,000 live births) National accounting aggregates—savings, depletion and degradationGross savings (% of GNI)Consumption of fixed capital (% of GNI)Education expenditure (% of GNI)Energy depletion (% of GNI)Mineral depletion (% of GNI)Net forest depletion (% of GNI)CO2 damage (% of GNI)Particulate emissions damage (% of GNI)Adjusted net savings (% of GNI)
18,620 39,860.. 34,611
94.8 80.51.0 1.1
32 3734.0 ..
38,898 26,5155,302 5,349
0.9 28.40.0 0.0
17.3 12.933
174
4.1 28,7744.3 –1.7
36.8 1.80.40 16.5
.. 81,970
.. 15,496
2,013 5,0000.0 4.4
4,151 9,415100.0 62.0
0.0 11.26.0 11.4
121 8,195106.7 10.3
35 41100 100100 98100 100100 100100 99100 100
.. 22
.. ..
.. ..6 6
10.3 17.914.6 13.95.6 4.60.0 1.40.0 0.2
.. 0.00.3 0.2
.. 0.1
.. 6.6
139The Little Green Data Book 2013
Country data
High-income group
Population (thousands) 416 Land area (sq. km) 320 GDP ($ billions) 8.9
Malta

GNI per capita, World Bank Atlas method ($)Adjusted net national income per capita ($)Urban population (% of total)Urban population growth (avg. annual %, 1990–2011) AgricultureAgricultural land (% land area)Agricultural irrigated land (% of total agricultural land)Agricultural productivity, value added per worker (2000 $)Cereal yield (kg per hectare) Forests and biodiversityForest area (% land area)Deforestation (avg. annual %, 2000–2010)Terrestrial protected areas (% of total land area)Threatened species, mammalsThreatened species, birdsThreatened species, fishThreatened species, higher plants OceansTotal fisheries production (thousand metric tons)
Capture fisheries growth (avg. annual %, 1990–2011)Aquaculture growth (avg. annual %, 1990–2011)
Marine protected areas (% of territorial waters)Coral reef area (sq. km)Mangroves area (sq. km) Energy and emissionsEnergy use per capita (kg oil equivalent)Energy from biomass products and waste (% of total)Electric power consumption per capita (kWh)Electricity generated using fossil fuel (% of total)Electricity generated by hydropower (% of total)CO2 emissions per capita (metric tons) Water and sanitationInternal freshwater resources per capita (cu. m)Total freshwater withdrawal (% of internal resources)
Agriculture (% of total freshwater withdrawal)Access to improved water source (% of total population)
Rural (% of rural population)Urban (% of urban population)
Access to improved sanitation (% of total population)Rural (% of rural population)Urban (% of urban population)
Environment and healthParticulate matter (urban-pop.-weighted avg., µg/cu. m)Acute resp. infection prevalence (% of children under five)Diarrhea prevalence (% of children under five)Under-five mortality rate (per 1,000 live births) National accounting aggregates—savings, depletion and degradationGross savings (% of GNI)Consumption of fixed capital (% of GNI)Education expenditure (% of GNI)Energy depletion (% of GNI)Mineral depletion (% of GNI)Net forest depletion (% of GNI)CO2 damage (% of GNI)Particulate emissions damage (% of GNI)Adjusted net savings (% of GNI)
3,910 4,248 1,772.. 3,884 1,595
71.8 48.6 38.71.2 3.6 2.7
72 48 46.. .. .... 610 716.. 5,050 3,065
70.2 29.7 28.40.0 –0.4 0.33.1 15.0 9.9
24
120
93.2 101,299 40,23830.0 3.4 2.4
.. 9.1 10.00.61 1.4 2.9
6,110 137,690 143,440.. 56,537 60,301
610 1,520 667.. 10.9 26.2.. 2,337 698.. 79.8 73.0.. 16.5 17.4
1.9 4.6 1.6
.. 4,446 3,121
.. 10.9 20.2
.. 73 8894 90 8799 84 8492 97 9375 66 4753 58 3583 76 66
.. 55 53
.. .. ..
.. .. ..26 21 62
.. 49.3 29.78.3 11.0 9.96.5 2.1 3.10.0 4.3 6.30.0 1.7 1.2
.. 0.0 0.30.4 0.9 0.7
.. 1.1 0.6
.. 32.2 14.7
140 2013 The Little Green Data Book
Country data
East Asia & Pacific
group
Lower middle-income group
Population (thousands) 55 Land area (sq. km) 180 GDP ($ millions) 173.7
Marshall Islands
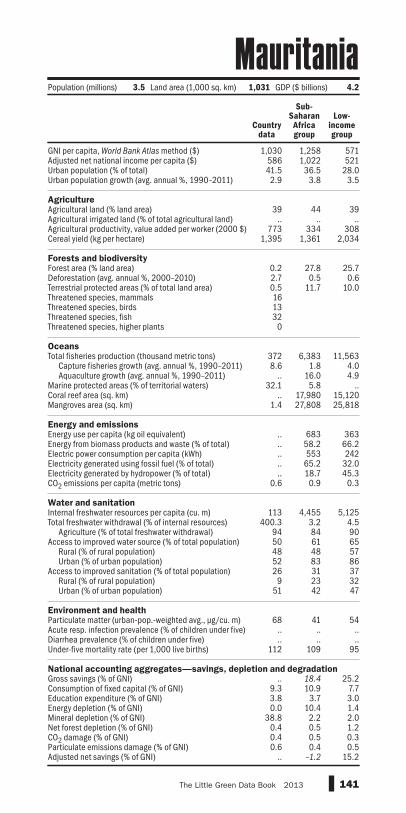
GNI per capita, World Bank Atlas method ($)Adjusted net national income per capita ($)Urban population (% of total)Urban population growth (avg. annual %, 1990–2011) AgricultureAgricultural land (% land area)Agricultural irrigated land (% of total agricultural land)Agricultural productivity, value added per worker (2000 $)Cereal yield (kg per hectare) Forests and biodiversityForest area (% land area)Deforestation (avg. annual %, 2000–2010)Terrestrial protected areas (% of total land area)Threatened species, mammalsThreatened species, birdsThreatened species, fishThreatened species, higher plants OceansTotal fisheries production (thousand metric tons)
Capture fisheries growth (avg. annual %, 1990–2011)Aquaculture growth (avg. annual %, 1990–2011)
Marine protected areas (% of territorial waters)Coral reef area (sq. km)Mangroves area (sq. km) Energy and emissionsEnergy use per capita (kg oil equivalent)Energy from biomass products and waste (% of total)Electric power consumption per capita (kWh)Electricity generated using fossil fuel (% of total)Electricity generated by hydropower (% of total)CO2 emissions per capita (metric tons) Water and sanitationInternal freshwater resources per capita (cu. m)Total freshwater withdrawal (% of internal resources)
Agriculture (% of total freshwater withdrawal)Access to improved water source (% of total population)
Rural (% of rural population)Urban (% of urban population)
Access to improved sanitation (% of total population)Rural (% of rural population)Urban (% of urban population)
Environment and healthParticulate matter (urban-pop.-weighted avg., µg/cu. m)Acute resp. infection prevalence (% of children under five)Diarrhea prevalence (% of children under five)Under-five mortality rate (per 1,000 live births) National accounting aggregates—savings, depletion and degradationGross savings (% of GNI)Consumption of fixed capital (% of GNI)Education expenditure (% of GNI)Energy depletion (% of GNI)Mineral depletion (% of GNI)Net forest depletion (% of GNI)CO2 damage (% of GNI)Particulate emissions damage (% of GNI)Adjusted net savings (% of GNI)
1,030 1,258 571586 1,022 52141.5 36.5 28.02.9 3.8 3.5
39 44 39.. .. ..
773 334 3081,395 1,361 2,034
0.2 27.8 25.72.7 0.5 0.60.5 11.7 10.0161332
0
372 6,383 11,5638.6 1.8 4.0
.. 16.0 4.932.1 5.8 ..
.. 17,980 15,1201.4 27,808 25,818
.. 683 363
.. 58.2 66.2
.. 553 242
.. 65.2 32.0
.. 18.7 45.30.6 0.9 0.3
113 4,455 5,125400.3 3.2 4.5
94 84 9050 61 6548 48 5752 83 8626 31 37
9 23 3251 42 47
68 41 54.. .. .... .. ..
112 109 95
.. 18.4 25.29.3 10.9 7.73.8 3.7 3.00.0 10.4 1.4
38.8 2.2 2.00.4 0.5 1.20.4 0.5 0.30.6 0.4 0.5
.. –1.2 15.2
141The Little Green Data Book 2013
Population (millions) 3.5 Land area (1,000 sq. km) 1,031 GDP ($ billions) 4.2
Country data
Sub-Saharan Africa group
Low-income group
Mauritania

GNI per capita, World Bank Atlas method ($)Adjusted net national income per capita ($)Urban population (% of total)Urban population growth (avg. annual %, 1990–2011) AgricultureAgricultural land (% land area)Agricultural irrigated land (% of total agricultural land)Agricultural productivity, value added per worker (2000 $)Cereal yield (kg per hectare) Forests and biodiversityForest area (% land area)Deforestation (avg. annual %, 2000–2010)Terrestrial protected areas (% of total land area)Threatened species, mammalsThreatened species, birdsThreatened species, fishThreatened species, higher plants OceansTotal fisheries production (thousand metric tons)
Capture fisheries growth (avg. annual %, 1990–2011)Aquaculture growth (avg. annual %, 1990–2011)
Marine protected areas (% of territorial waters)Coral reef area (sq. km)Mangroves area (sq. km) Energy and emissionsEnergy use per capita (kg oil equivalent)Energy from biomass products and waste (% of total)Electric power consumption per capita (kWh)Electricity generated using fossil fuel (% of total)Electricity generated by hydropower (% of total)CO2 emissions per capita (metric tons) Water and sanitationInternal freshwater resources per capita (cu. m)Total freshwater withdrawal (% of internal resources)
Agriculture (% of total freshwater withdrawal)Access to improved water source (% of total population)
Rural (% of rural population)Urban (% of urban population)
Access to improved sanitation (% of total population)Rural (% of rural population)Urban (% of urban population)
Environment and healthParticulate matter (urban-pop.-weighted avg., µg/cu. m)Acute resp. infection prevalence (% of children under five)Diarrhea prevalence (% of children under five)Under-five mortality rate (per 1,000 live births) National accounting aggregates—savings, depletion and degradationGross savings (% of GNI)Consumption of fixed capital (% of GNI)Education expenditure (% of GNI)Energy depletion (% of GNI)Mineral depletion (% of GNI)Net forest depletion (% of GNI)CO2 damage (% of GNI)Particulate emissions damage (% of GNI)Adjusted net savings (% of GNI)
8,040 1,258 6,5637,674 1,022 5,82141.8 36.5 60.6
0.7 3.8 2.5
44 44 3522.5 .. ..
6,013 334 8697,442 1,361 3,944
17.3 27.8 34.81.0 0.5 0.04.5 11.7 13.3
6111588
5.5 6,383 97,437–4.8 1.8 0.79.6 16.0 9.0
0.28 5.8 8.4870 17,980 33,3501.2 27,808 48,783
947 683 1,948.. 58.2 8.1.. 553 2,942.. 65.2 72.9.. 18.7 21.3
3.0 0.9 5.5
2,139 4,455 8,55026.4 3.2 5.6
68 84 6699 61 9399 48 86
100 83 9889 31 7388 23 6291 42 81
16 41 42.. .. .... .. ..
15 109 20
13.8 18.4 36.411.8 10.9 11.8
3.1 3.7 3.30.0 10.4 5.70.0 2.2 1.60.0 0.5 0.00.3 0.5 0.70.0 0.4 0.74.8 –1.2 19.2
142 2013 The Little Green Data Book
Population (millions) 1.3 Land area (1,000 sq. km) 2.0 GDP ($ billions) 11.3
Country data
Sub-Saharan Africa group
Upper middle-income group
Mauritius

GNI per capita, World Bank Atlas method ($)Adjusted net national income per capita ($)Urban population (% of total)Urban population growth (avg. annual %, 1990–2011) AgricultureAgricultural land (% land area)Agricultural irrigated land (% of total agricultural land)Agricultural productivity, value added per worker (2000 $)Cereal yield (kg per hectare) Forests and biodiversityForest area (% land area)Deforestation (avg. annual %, 2000–2010)Terrestrial protected areas (% of total land area)Threatened species, mammalsThreatened species, birdsThreatened species, fishThreatened species, higher plants OceansTotal fisheries production (thousand metric tons)
Capture fisheries growth (avg. annual %, 1990–2011)Aquaculture growth (avg. annual %, 1990–2011)
Marine protected areas (% of territorial waters)Coral reef area (sq. km)Mangroves area (sq. km) Energy and emissionsEnergy use per capita (kg oil equivalent)Energy from biomass products and waste (% of total)Electric power consumption per capita (kWh)Electricity generated using fossil fuel (% of total)Electricity generated by hydropower (% of total)CO2 emissions per capita (metric tons) Water and sanitationInternal freshwater resources per capita (cu. m)Total freshwater withdrawal (% of internal resources)
Agriculture (% of total freshwater withdrawal)Access to improved water source (% of total population)
Rural (% of rural population)Urban (% of urban population)
Access to improved sanitation (% of total population)Rural (% of rural population)Urban (% of urban population)
Environment and healthParticulate matter (urban-pop.-weighted avg., µg/cu. m)Acute resp. infection prevalence (% of children under five)Diarrhea prevalence (% of children under five)Under-five mortality rate (per 1,000 live births) National accounting aggregates—savings, depletion and degradationGross savings (% of GNI)Consumption of fixed capital (% of GNI)Education expenditure (% of GNI)Energy depletion (% of GNI)Mineral depletion (% of GNI)Net forest depletion (% of GNI)CO2 damage (% of GNI)Particulate emissions damage (% of GNI)Adjusted net savings (% of GNI)
9,420 8,574 6,5638,220 7,648 5,821
78.1 79.1 60.61.9 2.0 2.5
53 37 356.3 .. ..
3,196 3,448 8693,241 3,838 3,944
33.3 46.8 34.80.3 0.4 0.0
11.1 20.2 13.3100
61152196
1,709 19,009 97,4370.5 0.1 0.79.0 11.8 9.0
16.7 13.1 8.41,780 15,100 33,3506,557 39,997 48,783
1,570 1,312 1,9484.7 16.7 8.1
1,990 1,973 2,94280.2 39.0 72.913.7 53.7 21.34.0 2.7 5.5
3,563 22,810 8,55019.5 2.0 5.6
77 68 6696 94 9391 81 8697 98 9885 79 7379 59 6287 84 81
30 28 42.. .. .... .. ..
16 19 20
26.4 21.1 36.411.8 12.2 11.85.2 5.0 3.36.2 4.5 5.70.8 1.9 1.60.0 0.0 0.00.3 0.2 0.70.3 0.3 0.7
12.1 6.8 19.2
143The Little Green Data Book 2013
Country data
Latin America & Caribbean
group
Upper middle-income group
Population (millions) 114.8 Land area (1,000 sq. km) 1,944 GDP ($ billions) 1,153.3
Mexico

GNI per capita, World Bank Atlas method ($)Adjusted net national income per capita ($)Urban population (% of total)Urban population growth (avg. annual %, 1990–2011) AgricultureAgricultural land (% land area)Agricultural irrigated land (% of total agricultural land)Agricultural productivity, value added per worker (2000 $)Cereal yield (kg per hectare) Forests and biodiversityForest area (% land area)Deforestation (avg. annual %, 2000–2010)Terrestrial protected areas (% of total land area)Threatened species, mammalsThreatened species, birdsThreatened species, fishThreatened species, higher plants OceansTotal fisheries production (thousand metric tons)
Capture fisheries growth (avg. annual %, 1990–2011)Aquaculture growth (avg. annual %, 1990–2011)
Marine protected areas (% of territorial waters)Coral reef area (sq. km)Mangroves area (sq. km) Energy and emissionsEnergy use per capita (kg oil equivalent)Energy from biomass products and waste (% of total)Electric power consumption per capita (kWh)Electricity generated using fossil fuel (% of total)Electricity generated by hydropower (% of total)CO2 emissions per capita (metric tons) Water and sanitationInternal freshwater resources per capita (cu. m)Total freshwater withdrawal (% of internal resources)
Agriculture (% of total freshwater withdrawal)Access to improved water source (% of total population)
Rural (% of rural population)Urban (% of urban population)
Access to improved sanitation (% of total population)Rural (% of rural population)Urban (% of urban population)
Environment and healthParticulate matter (urban-pop.-weighted avg., µg/cu. m)Acute resp. infection prevalence (% of children under five)Diarrhea prevalence (% of children under five)Under-five mortality rate (per 1,000 live births) National accounting aggregates—savings, depletion and degradationGross savings (% of GNI)Consumption of fixed capital (% of GNI)Education expenditure (% of GNI)Energy depletion (% of GNI)Mineral depletion (% of GNI)Net forest depletion (% of GNI)CO2 damage (% of GNI)Particulate emissions damage (% of GNI)Adjusted net savings (% of GNI)
2,860 4,248 1,772.. 3,884 1,595
22.6 48.6 38.70.1 3.6 2.7
31 48 46.. .. .... 610 716
1,624 5,050 3,065
91.7 29.7 28.40.0 –0.4 0.34.0 15.0 9.9
71020
3
36.3 101,299 40,23813.9 3.4 2.4
.. 9.1 10.00.06 1.4 2.9
4,340 137,690 143,44087.0 56,537 60,301
.. 1,520 667
.. 10.9 26.2
.. 2,337 698
.. 79.8 73.0
.. 16.5 17.40.6 4.6 1.6
.. 4,446 3,121
.. 10.9 20.2
.. 73 8894 90 8794 84 8495 97 9325 66 4715 58 3561 76 66
.. 55 53
.. .. ..
.. .. ..42 21 62
.. 49.3 29.79.7 11.0 9.9
.. 2.1 3.10.0 4.3 6.30.0 1.7 1.2
.. 0.0 0.30.1 0.9 0.7
.. 1.1 0.6
.. 32.2 14.7
144 2013 The Little Green Data Book
Population (thousands) 112 Land area (sq. km) 700 GDP ($ millions) 310.3
Country data
East Asia & Pacific
group
Lower middle-income group
Micronesia, Fed. Sts.

GNI per capita, World Bank Atlas method ($)Adjusted net national income per capita ($)Urban population (% of total)Urban population growth (avg. annual %, 1990–2011) AgricultureAgricultural land (% land area)Agricultural irrigated land (% of total agricultural land)Agricultural productivity, value added per worker (2000 $)Cereal yield (kg per hectare) Forests and biodiversityForest area (% land area)Deforestation (avg. annual %, 2000–2010)Terrestrial protected areas (% of total land area)Threatened species, mammalsThreatened species, birdsThreatened species, fishThreatened species, higher plants OceansTotal fisheries production (thousand metric tons)
Capture fisheries growth (avg. annual %, 1990–2011)Aquaculture growth (avg. annual %, 1990–2011)
Marine protected areas (% of territorial waters)Coral reef area (sq. km)Mangroves area (sq. km) Energy and emissionsEnergy use per capita (kg oil equivalent)Energy from biomass products and waste (% of total)Electric power consumption per capita (kWh)Electricity generated using fossil fuel (% of total)Electricity generated by hydropower (% of total)CO2 emissions per capita (metric tons) Water and sanitationInternal freshwater resources per capita (cu. m)Total freshwater withdrawal (% of internal resources)
Agriculture (% of total freshwater withdrawal)Access to improved water source (% of total population)
Rural (% of rural population)Urban (% of urban population)
Access to improved sanitation (% of total population)Rural (% of rural population)Urban (% of urban population)
Environment and healthParticulate matter (urban-pop.-weighted avg., µg/cu. m)Acute resp. infection prevalence (% of children under five)Diarrhea prevalence (% of children under five)Under-five mortality rate (per 1,000 live births) National accounting aggregates—savings, depletion and degradationGross savings (% of GNI)Consumption of fixed capital (% of GNI)Education expenditure (% of GNI)Energy depletion (% of GNI)Mineral depletion (% of GNI)Net forest depletion (% of GNI)CO2 damage (% of GNI)Particulate emissions damage (% of GNI)Adjusted net savings (% of GNI)
1,980 7,734 1,7721,934 6,652 1,595
47.7 64.7 38.7–0.1 0.3 2.7
75 28 469.2 .. ..
1,791 3,374 7162,866 2,740 3,065
11.9 38.7 28.4–1.8 0.0 0.31.4 7.5 9.9
4882
9.4 5,790 40,238–16.7 –2.9 2.4
1.3 –0.5 10.0.. 10.4 2.9.. .. 143,440.. .. 60,301
731 3,015 6673.2 2.0 26.2
1,049 4,059 69897.8 65.4 73.02.2 18.8 17.41.3 7.1 1.6
281 12,498 3,121191.5 6.3 20.2
40 60 8896 96 8793 91 8499 99 9385 84 4782 81 3589 87 66
36 21 537 .. ..7 .. ..
16 21 62
12.1 26.1 29.78.9 12.3 9.97.7 3.6 3.10.1 9.3 6.30.0 0.8 1.20.1 0.0 0.30.5 0.7 0.71.1 0.3 0.69.1 6.2 14.7
145The Little Green Data Book 2013
Country data
Europe & Central
Asia group
Lower middle-income group
Population (millions) 3.6 Land area (1,000 sq. km) 33 GDP ($ billions) 7.0
Moldova

GNI per capita, World Bank Atlas method ($)Adjusted net national income per capita ($)Urban population (% of total)Urban population growth (avg. annual %, 1990–2011) AgricultureAgricultural land (% land area)Agricultural irrigated land (% of total agricultural land)Agricultural productivity, value added per worker (2000 $)Cereal yield (kg per hectare) Forests and biodiversityForest area (% land area)Deforestation (avg. annual %, 2000–2010)Terrestrial protected areas (% of total land area)Threatened species, mammalsThreatened species, birdsThreatened species, fishThreatened species, higher plants OceansTotal fisheries production (thousand metric tons)
Capture fisheries growth (avg. annual %, 1990–2011)Aquaculture growth (avg. annual %, 1990–2011)
Marine protected areas (% of territorial waters)Coral reef area (sq. km)Mangroves area (sq. km) Energy and emissionsEnergy use per capita (kg oil equivalent)Energy from biomass products and waste (% of total)Electric power consumption per capita (kWh)Electricity generated using fossil fuel (% of total)Electricity generated by hydropower (% of total)CO2 emissions per capita (metric tons) Water and sanitationInternal freshwater resources per capita (cu. m)Total freshwater withdrawal (% of internal resources)
Agriculture (% of total freshwater withdrawal)Access to improved water source (% of total population)
Rural (% of rural population)Urban (% of urban population)
Access to improved sanitation (% of total population)Rural (% of rural population)Urban (% of urban population)
Environment and healthParticulate matter (urban-pop.-weighted avg., µg/cu. m)Acute resp. infection prevalence (% of children under five)Diarrhea prevalence (% of children under five)Under-five mortality rate (per 1,000 live births) National accounting aggregates—savings, depletion and degradationGross savings (% of GNI)Consumption of fixed capital (% of GNI)Education expenditure (% of GNI)Energy depletion (% of GNI)Mineral depletion (% of GNI)Net forest depletion (% of GNI)CO2 damage (% of GNI)Particulate emissions damage (% of GNI)Adjusted net savings (% of GNI)
188,800 39,860.. 34,611
100.0 80.50.7 1.1
.. 37
.. ..
.. 26,515
.. 5,349
0.0 28.40.0 0.0
23.7 12.920
110
0.00 28,774–3.2 –1.7
.. 1.8100.0 16.5
.. 81,970
.. 15,496
.. 5,000
.. 4.4
.. 9,415
.. 62.0
.. 11.2
.. 11.4
.. 8,195
.. 10.30 41
100 100.. 98
100 100100 100
.. 99100 100
.. 22
.. ..
.. ..4 6
.. 17.914.4 13.91.2 4.60.0 1.40.0 0.2
.. 0.0
.. 0.2
.. 0.1
.. 6.6
146 2013 The Little Green Data Book
Country data
High-income group
Population (thousands) 35 Land area (sq. km) 2.0 GDP ($ billions) 6.1
Monaco
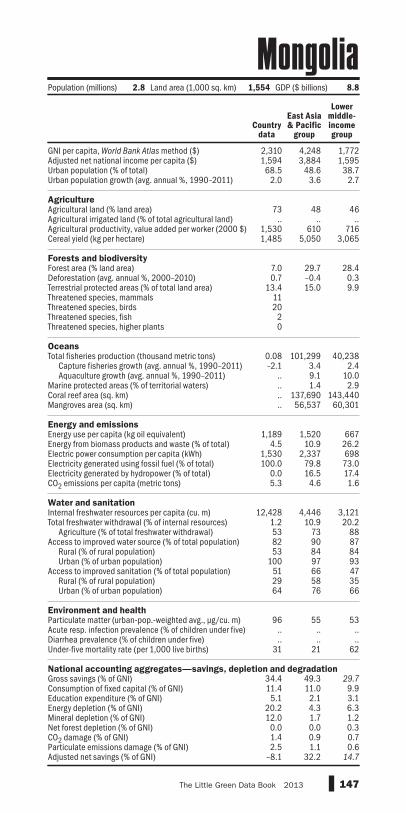
GNI per capita, World Bank Atlas method ($)Adjusted net national income per capita ($)Urban population (% of total)Urban population growth (avg. annual %, 1990–2011) AgricultureAgricultural land (% land area)Agricultural irrigated land (% of total agricultural land)Agricultural productivity, value added per worker (2000 $)Cereal yield (kg per hectare) Forests and biodiversityForest area (% land area)Deforestation (avg. annual %, 2000–2010)Terrestrial protected areas (% of total land area)Threatened species, mammalsThreatened species, birdsThreatened species, fishThreatened species, higher plants OceansTotal fisheries production (thousand metric tons)
Capture fisheries growth (avg. annual %, 1990–2011)Aquaculture growth (avg. annual %, 1990–2011)
Marine protected areas (% of territorial waters)Coral reef area (sq. km)Mangroves area (sq. km) Energy and emissionsEnergy use per capita (kg oil equivalent)Energy from biomass products and waste (% of total)Electric power consumption per capita (kWh)Electricity generated using fossil fuel (% of total)Electricity generated by hydropower (% of total)CO2 emissions per capita (metric tons) Water and sanitationInternal freshwater resources per capita (cu. m)Total freshwater withdrawal (% of internal resources)
Agriculture (% of total freshwater withdrawal)Access to improved water source (% of total population)
Rural (% of rural population)Urban (% of urban population)
Access to improved sanitation (% of total population)Rural (% of rural population)Urban (% of urban population)
Environment and healthParticulate matter (urban-pop.-weighted avg., µg/cu. m)Acute resp. infection prevalence (% of children under five)Diarrhea prevalence (% of children under five)Under-five mortality rate (per 1,000 live births) National accounting aggregates—savings, depletion and degradationGross savings (% of GNI)Consumption of fixed capital (% of GNI)Education expenditure (% of GNI)Energy depletion (% of GNI)Mineral depletion (% of GNI)Net forest depletion (% of GNI)CO2 damage (% of GNI)Particulate emissions damage (% of GNI)Adjusted net savings (% of GNI)
2,310 4,248 1,7721,594 3,884 1,59568.5 48.6 38.7
2.0 3.6 2.7
73 48 46.. .. ..
1,530 610 7161,485 5,050 3,065
7.0 29.7 28.40.7 –0.4 0.3
13.4 15.0 9.91120
20
0.08 101,299 40,238–2.1 3.4 2.4
.. 9.1 10.0
.. 1.4 2.9
.. 137,690 143,440
.. 56,537 60,301
1,189 1,520 6674.5 10.9 26.2
1,530 2,337 698100.0 79.8 73.0
0.0 16.5 17.45.3 4.6 1.6
12,428 4,446 3,1211.2 10.9 20.253 73 8882 90 8753 84 84
100 97 9351 66 4729 58 3564 76 66
96 55 53.. .. .... .. ..
31 21 62
34.4 49.3 29.711.4 11.0 9.95.1 2.1 3.1
20.2 4.3 6.312.0 1.7 1.2
0.0 0.0 0.31.4 0.9 0.72.5 1.1 0.6
–8.1 32.2 14.7
147The Little Green Data Book 2013
Population (millions) 2.8 Land area (1,000 sq. km) 1,554 GDP ($ billions) 8.8
Country data
East Asia & Pacific
group
Lower middle-income group
Mongolia

GNI per capita, World Bank Atlas method ($)Adjusted net national income per capita ($)Urban population (% of total)Urban population growth (avg. annual %, 1990–2011) AgricultureAgricultural land (% land area)Agricultural irrigated land (% of total agricultural land)Agricultural productivity, value added per worker (2000 $)Cereal yield (kg per hectare) Forests and biodiversityForest area (% land area)Deforestation (avg. annual %, 2000–2010)Terrestrial protected areas (% of total land area)Threatened species, mammalsThreatened species, birdsThreatened species, fishThreatened species, higher plants OceansTotal fisheries production (thousand metric tons)
Capture fisheries growth (avg. annual %, 1990–2011)Aquaculture growth (avg. annual %, 1990–2011)
Marine protected areas (% of territorial waters)Coral reef area (sq. km)Mangroves area (sq. km) Energy and emissionsEnergy use per capita (kg oil equivalent)Energy from biomass products and waste (% of total)Electric power consumption per capita (kWh)Electricity generated using fossil fuel (% of total)Electricity generated by hydropower (% of total)CO2 emissions per capita (metric tons) Water and sanitationInternal freshwater resources per capita (cu. m)Total freshwater withdrawal (% of internal resources)
Agriculture (% of total freshwater withdrawal)Access to improved water source (% of total population)
Rural (% of rural population)Urban (% of urban population)
Access to improved sanitation (% of total population)Rural (% of rural population)Urban (% of urban population)
Environment and healthParticulate matter (urban-pop.-weighted avg., µg/cu. m)Acute resp. infection prevalence (% of children under five)Diarrhea prevalence (% of children under five)Under-five mortality rate (per 1,000 live births) National accounting aggregates—savings, depletion and degradationGross savings (% of GNI)Consumption of fixed capital (% of GNI)Education expenditure (% of GNI)Energy depletion (% of GNI)Mineral depletion (% of GNI)Net forest depletion (% of GNI)CO2 damage (% of GNI)Particulate emissions damage (% of GNI)Adjusted net savings (% of GNI)
7,140 7,734 6,563.. 6,652 5,821
63.3 64.7 60.61.5 0.3 2.5
38 28 35.. .. ..
3,078 3,374 8693,666 2,740 3,944
40.4 38.7 34.80.0 0.0 0.0
13.3 7.5 13.36
1225
2
2.3 5,790 97,437.. –2.9 0.7.. –0.5 9.0
0.85 10.4 8.4.. .. 33,350.. .. 48,783
1,303 3,015 1,9483.1 2.0 8.1
5,547 4,059 2,94230.5 65.4 72.966.0 18.8 21.3
4.8 7.1 5.5
.. 12,498 8,550
.. 6.3 5.61 60 66
98 96 9396 91 8699 99 9890 84 7387 81 6292 87 81
.. 21 42
.. .. ..
.. .. ..7 21 20
.. 26.1 36.411.2 12.3 11.8
.. 3.6 3.30.0 9.3 5.70.0 0.8 1.6
.. 0.0 0.00.7 0.7 0.7
.. 0.3 0.7
.. 6.2 19.2
148 2013 The Little Green Data Book
Country data
Europe & Central
Asia group
Upper middle-income group
Population (thousands) 632 Land area (1,000 sq. km) 13 GDP ($ billions) 4.5
Montenegro

GNI per capita, World Bank Atlas method ($)Adjusted net national income per capita ($)Urban population (% of total)Urban population growth (avg. annual %, 1990–2011) AgricultureAgricultural land (% land area)Agricultural irrigated land (% of total agricultural land)Agricultural productivity, value added per worker (2000 $)Cereal yield (kg per hectare) Forests and biodiversityForest area (% land area)Deforestation (avg. annual %, 2000–2010)Terrestrial protected areas (% of total land area)Threatened species, mammalsThreatened species, birdsThreatened species, fishThreatened species, higher plants OceansTotal fisheries production (thousand metric tons)
Capture fisheries growth (avg. annual %, 1990–2011)Aquaculture growth (avg. annual %, 1990–2011)
Marine protected areas (% of territorial waters)Coral reef area (sq. km)Mangroves area (sq. km) Energy and emissionsEnergy use per capita (kg oil equivalent)Energy from biomass products and waste (% of total)Electric power consumption per capita (kWh)Electricity generated using fossil fuel (% of total)Electricity generated by hydropower (% of total)CO2 emissions per capita (metric tons) Water and sanitationInternal freshwater resources per capita (cu. m)Total freshwater withdrawal (% of internal resources)
Agriculture (% of total freshwater withdrawal)Access to improved water source (% of total population)
Rural (% of rural population)Urban (% of urban population)
Access to improved sanitation (% of total population)Rural (% of rural population)Urban (% of urban population)
Environment and healthParticulate matter (urban-pop.-weighted avg., µg/cu. m)Acute resp. infection prevalence (% of children under five)Diarrhea prevalence (% of children under five)Under-five mortality rate (per 1,000 live births) National accounting aggregates—savings, depletion and degradationGross savings (% of GNI)Consumption of fixed capital (% of GNI)Education expenditure (% of GNI)Energy depletion (% of GNI)Mineral depletion (% of GNI)Net forest depletion (% of GNI)CO2 damage (% of GNI)Particulate emissions damage (% of GNI)Adjusted net savings (% of GNI)
2,970 3,866 1,7722,616 3,285 1,595
57.0 58.9 38.72.0 2.5 2.7
67 23 464.6 .. ..
3,451 2,627 7161,407 2,475 3,065
11.5 2.4 28.4–0.2 –0.1 0.31.5 3.9 9.917114529
966 3,538 40,2382.5 2.4 2.46.0 13.1 10.01.3 2.0 2.9
.. 5,700 143,440
.. 217 60,301
517 1,372 6672.9 0.9 26.2781 1,658 69881.5 92.9 73.015.5 5.4 17.4
1.5 4.1 1.6
899 673 3,12143.5 122.1 20.2
87 86 8883 89 8761 81 8498 94 9370 88 4752 80 3583 94 66
23 59 53.. .. .... .. ..
33 32 62
28.5 27.0 29.710.4 10.8 9.95.2 4.5 3.10.0 15.2 6.32.6 0.6 1.20.0 0.1 0.30.4 0.6 0.70.1 0.9 0.6
20.1 6.1 14.7
149The Little Green Data Book 2013
Country data
Middle East &
N. Africa group
Lower middle-income group
Population (millions) 32.3 Land area (1,000 sq. km) 446 GDP ($ billions) 100.2
Morocco
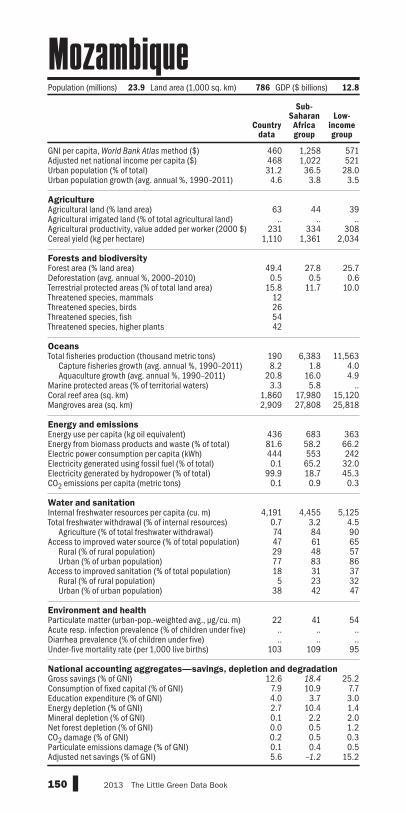
GNI per capita, World Bank Atlas method ($)Adjusted net national income per capita ($)Urban population (% of total)Urban population growth (avg. annual %, 1990–2011) AgricultureAgricultural land (% land area)Agricultural irrigated land (% of total agricultural land)Agricultural productivity, value added per worker (2000 $)Cereal yield (kg per hectare) Forests and biodiversityForest area (% land area)Deforestation (avg. annual %, 2000–2010)Terrestrial protected areas (% of total land area)Threatened species, mammalsThreatened species, birdsThreatened species, fishThreatened species, higher plants OceansTotal fisheries production (thousand metric tons)
Capture fisheries growth (avg. annual %, 1990–2011)Aquaculture growth (avg. annual %, 1990–2011)
Marine protected areas (% of territorial waters)Coral reef area (sq. km)Mangroves area (sq. km) Energy and emissionsEnergy use per capita (kg oil equivalent)Energy from biomass products and waste (% of total)Electric power consumption per capita (kWh)Electricity generated using fossil fuel (% of total)Electricity generated by hydropower (% of total)CO2 emissions per capita (metric tons) Water and sanitationInternal freshwater resources per capita (cu. m)Total freshwater withdrawal (% of internal resources)
Agriculture (% of total freshwater withdrawal)Access to improved water source (% of total population)
Rural (% of rural population)Urban (% of urban population)
Access to improved sanitation (% of total population)Rural (% of rural population)Urban (% of urban population)
Environment and healthParticulate matter (urban-pop.-weighted avg., µg/cu. m)Acute resp. infection prevalence (% of children under five)Diarrhea prevalence (% of children under five)Under-five mortality rate (per 1,000 live births) National accounting aggregates—savings, depletion and degradationGross savings (% of GNI)Consumption of fixed capital (% of GNI)Education expenditure (% of GNI)Energy depletion (% of GNI)Mineral depletion (% of GNI)Net forest depletion (% of GNI)CO2 damage (% of GNI)Particulate emissions damage (% of GNI)Adjusted net savings (% of GNI)
460 1,258 571468 1,022 52131.2 36.5 28.0
4.6 3.8 3.5
63 44 39.. .. ..
231 334 3081,110 1,361 2,034
49.4 27.8 25.70.5 0.5 0.6
15.8 11.7 10.012265442
190 6,383 11,5638.2 1.8 4.0
20.8 16.0 4.93.3 5.8 ..
1,860 17,980 15,1202,909 27,808 25,818
436 683 36381.6 58.2 66.2444 553 2420.1 65.2 32.0
99.9 18.7 45.30.1 0.9 0.3
4,191 4,455 5,1250.7 3.2 4.574 84 9047 61 6529 48 5777 83 8618 31 37
5 23 3238 42 47
22 41 54.. .. .... .. ..
103 109 95
12.6 18.4 25.27.9 10.9 7.74.0 3.7 3.02.7 10.4 1.40.1 2.2 2.00.0 0.5 1.20.2 0.5 0.30.1 0.4 0.55.6 –1.2 15.2
150 2013 The Little Green Data Book
Population (millions) 23.9 Land area (1,000 sq. km) 786 GDP ($ billions) 12.8
Country data
Sub-Saharan Africa group
Low-income group
Mozambique
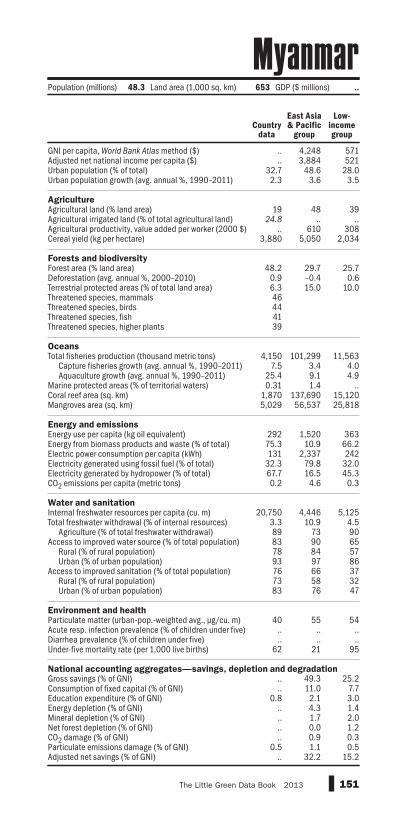
GNI per capita, World Bank Atlas method ($)Adjusted net national income per capita ($)Urban population (% of total)Urban population growth (avg. annual %, 1990–2011) AgricultureAgricultural land (% land area)Agricultural irrigated land (% of total agricultural land)Agricultural productivity, value added per worker (2000 $)Cereal yield (kg per hectare) Forests and biodiversityForest area (% land area)Deforestation (avg. annual %, 2000–2010)Terrestrial protected areas (% of total land area)Threatened species, mammalsThreatened species, birdsThreatened species, fishThreatened species, higher plants OceansTotal fisheries production (thousand metric tons)
Capture fisheries growth (avg. annual %, 1990–2011)Aquaculture growth (avg. annual %, 1990–2011)
Marine protected areas (% of territorial waters)Coral reef area (sq. km)Mangroves area (sq. km) Energy and emissionsEnergy use per capita (kg oil equivalent)Energy from biomass products and waste (% of total)Electric power consumption per capita (kWh)Electricity generated using fossil fuel (% of total)Electricity generated by hydropower (% of total)CO2 emissions per capita (metric tons) Water and sanitationInternal freshwater resources per capita (cu. m)Total freshwater withdrawal (% of internal resources)
Agriculture (% of total freshwater withdrawal)Access to improved water source (% of total population)
Rural (% of rural population)Urban (% of urban population)
Access to improved sanitation (% of total population)Rural (% of rural population)Urban (% of urban population)
Environment and healthParticulate matter (urban-pop.-weighted avg., µg/cu. m)Acute resp. infection prevalence (% of children under five)Diarrhea prevalence (% of children under five)Under-five mortality rate (per 1,000 live births) National accounting aggregates—savings, depletion and degradationGross savings (% of GNI)Consumption of fixed capital (% of GNI)Education expenditure (% of GNI)Energy depletion (% of GNI)Mineral depletion (% of GNI)Net forest depletion (% of GNI)CO2 damage (% of GNI)Particulate emissions damage (% of GNI)Adjusted net savings (% of GNI)
.. 4,248 571
.. 3,884 52132.7 48.6 28.02.3 3.6 3.5
19 48 3924.8 .. ..
.. 610 3083,880 5,050 2,034
48.2 29.7 25.70.9 –0.4 0.66.3 15.0 10.046444139
4,150 101,299 11,5637.5 3.4 4.0
25.4 9.1 4.90.31 1.4 ..
1,870 137,690 15,1205,029 56,537 25,818
292 1,520 36375.3 10.9 66.2131 2,337 242
32.3 79.8 32.067.7 16.5 45.30.2 4.6 0.3
20,750 4,446 5,1253.3 10.9 4.589 73 9083 90 6578 84 5793 97 8676 66 3773 58 3283 76 47
40 55 54.. .. .... .. ..
62 21 95
.. 49.3 25.2
.. 11.0 7.70.8 2.1 3.0
.. 4.3 1.4
.. 1.7 2.0
.. 0.0 1.2
.. 0.9 0.30.5 1.1 0.5
.. 32.2 15.2
151The Little Green Data Book 2013
Country data
East Asia & Pacific
group
Low-income group
Population (millions) 48.3 Land area (1,000 sq. km) 653 GDP ($ millions) ..
Myanmar
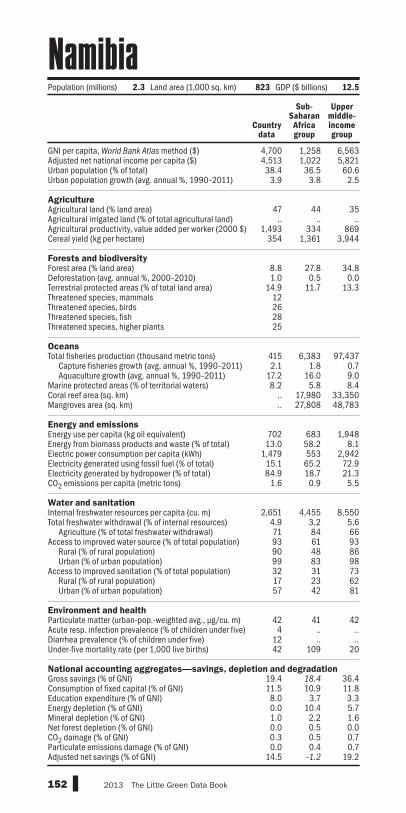
GNI per capita, World Bank Atlas method ($)Adjusted net national income per capita ($)Urban population (% of total)Urban population growth (avg. annual %, 1990–2011) AgricultureAgricultural land (% land area)Agricultural irrigated land (% of total agricultural land)Agricultural productivity, value added per worker (2000 $)Cereal yield (kg per hectare) Forests and biodiversityForest area (% land area)Deforestation (avg. annual %, 2000–2010)Terrestrial protected areas (% of total land area)Threatened species, mammalsThreatened species, birdsThreatened species, fishThreatened species, higher plants OceansTotal fisheries production (thousand metric tons)
Capture fisheries growth (avg. annual %, 1990–2011)Aquaculture growth (avg. annual %, 1990–2011)
Marine protected areas (% of territorial waters)Coral reef area (sq. km)Mangroves area (sq. km) Energy and emissionsEnergy use per capita (kg oil equivalent)Energy from biomass products and waste (% of total)Electric power consumption per capita (kWh)Electricity generated using fossil fuel (% of total)Electricity generated by hydropower (% of total)CO2 emissions per capita (metric tons) Water and sanitationInternal freshwater resources per capita (cu. m)Total freshwater withdrawal (% of internal resources)
Agriculture (% of total freshwater withdrawal)Access to improved water source (% of total population)
Rural (% of rural population)Urban (% of urban population)
Access to improved sanitation (% of total population)Rural (% of rural population)Urban (% of urban population)
Environment and healthParticulate matter (urban-pop.-weighted avg., µg/cu. m)Acute resp. infection prevalence (% of children under five)Diarrhea prevalence (% of children under five)Under-five mortality rate (per 1,000 live births) National accounting aggregates—savings, depletion and degradationGross savings (% of GNI)Consumption of fixed capital (% of GNI)Education expenditure (% of GNI)Energy depletion (% of GNI)Mineral depletion (% of GNI)Net forest depletion (% of GNI)CO2 damage (% of GNI)Particulate emissions damage (% of GNI)Adjusted net savings (% of GNI)
4,700 1,258 6,5634,513 1,022 5,82138.4 36.5 60.6
3.9 3.8 2.5
47 44 35.. .. ..
1,493 334 869354 1,361 3,944
8.8 27.8 34.81.0 0.5 0.0
14.9 11.7 13.312262825
415 6,383 97,4372.1 1.8 0.7
17.2 16.0 9.08.2 5.8 8.4
.. 17,980 33,350
.. 27,808 48,783
702 683 1,94813.0 58.2 8.1
1,479 553 2,94215.1 65.2 72.984.9 18.7 21.3
1.6 0.9 5.5
2,651 4,455 8,5504.9 3.2 5.671 84 6693 61 9390 48 8699 83 9832 31 7317 23 6257 42 81
42 41 424 .. ..
12 .. ..42 109 20
19.4 18.4 36.411.5 10.9 11.88.0 3.7 3.30.0 10.4 5.71.0 2.2 1.60.0 0.5 0.00.3 0.5 0.70.0 0.4 0.7
14.5 –1.2 19.2
152 2013 The Little Green Data Book
Country data
Sub-Saharan Africa group
Upper middle-income group
Population (millions) 2.3 Land area (1,000 sq. km) 823 GDP ($ billions) 12.5
Namibia
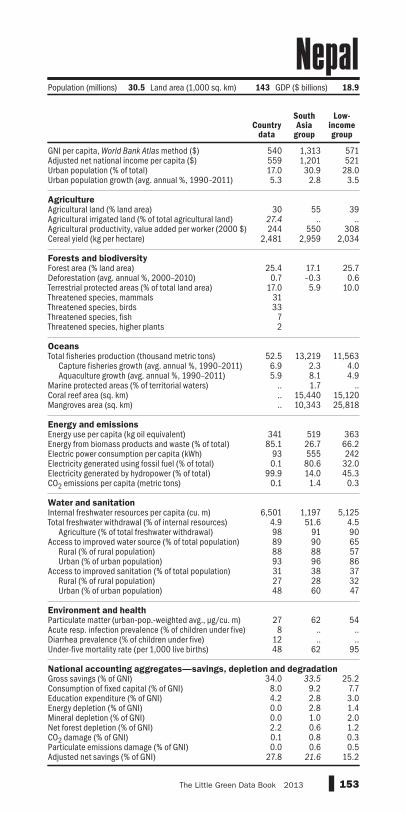
GNI per capita, World Bank Atlas method ($)Adjusted net national income per capita ($)Urban population (% of total)Urban population growth (avg. annual %, 1990–2011) AgricultureAgricultural land (% land area)Agricultural irrigated land (% of total agricultural land)Agricultural productivity, value added per worker (2000 $)Cereal yield (kg per hectare) Forests and biodiversityForest area (% land area)Deforestation (avg. annual %, 2000–2010)Terrestrial protected areas (% of total land area)Threatened species, mammalsThreatened species, birdsThreatened species, fishThreatened species, higher plants OceansTotal fisheries production (thousand metric tons)
Capture fisheries growth (avg. annual %, 1990–2011)Aquaculture growth (avg. annual %, 1990–2011)
Marine protected areas (% of territorial waters)Coral reef area (sq. km)Mangroves area (sq. km) Energy and emissionsEnergy use per capita (kg oil equivalent)Energy from biomass products and waste (% of total)Electric power consumption per capita (kWh)Electricity generated using fossil fuel (% of total)Electricity generated by hydropower (% of total)CO2 emissions per capita (metric tons) Water and sanitationInternal freshwater resources per capita (cu. m)Total freshwater withdrawal (% of internal resources)
Agriculture (% of total freshwater withdrawal)Access to improved water source (% of total population)
Rural (% of rural population)Urban (% of urban population)
Access to improved sanitation (% of total population)Rural (% of rural population)Urban (% of urban population)
Environment and healthParticulate matter (urban-pop.-weighted avg., µg/cu. m)Acute resp. infection prevalence (% of children under five)Diarrhea prevalence (% of children under five)Under-five mortality rate (per 1,000 live births) National accounting aggregates—savings, depletion and degradationGross savings (% of GNI)Consumption of fixed capital (% of GNI)Education expenditure (% of GNI)Energy depletion (% of GNI)Mineral depletion (% of GNI)Net forest depletion (% of GNI)CO2 damage (% of GNI)Particulate emissions damage (% of GNI)Adjusted net savings (% of GNI)
540 1,313 571559 1,201 52117.0 30.9 28.05.3 2.8 3.5
30 55 3927.4 .. ..244 550 308
2,481 2,959 2,034
25.4 17.1 25.70.7 –0.3 0.6
17.0 5.9 10.03133
72
52.5 13,219 11,5636.9 2.3 4.05.9 8.1 4.9
.. 1.7 ..
.. 15,440 15,120
.. 10,343 25,818
341 519 36385.1 26.7 66.2
93 555 2420.1 80.6 32.0
99.9 14.0 45.30.1 1.4 0.3
6,501 1,197 5,1254.9 51.6 4.598 91 9089 90 6588 88 5793 96 8631 38 3727 28 3248 60 47
27 62 548 .. ..
12 .. ..48 62 95
34.0 33.5 25.28.0 9.2 7.74.2 2.8 3.00.0 2.8 1.40.0 1.0 2.02.2 0.6 1.20.1 0.8 0.30.0 0.6 0.5
27.8 21.6 15.2
153The Little Green Data Book 2013
Country data
South Asia
group
Low-income group
Population (millions) 30.5 Land area (1,000 sq. km) 143 GDP ($ billions) 18.9
Nepal
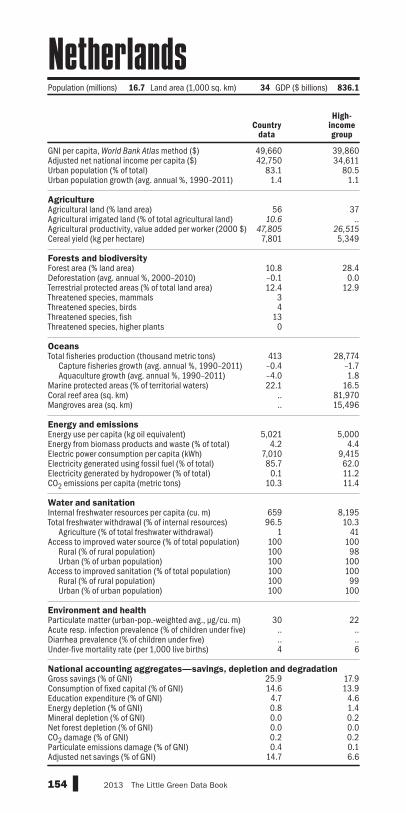
GNI per capita, World Bank Atlas method ($)Adjusted net national income per capita ($)Urban population (% of total)Urban population growth (avg. annual %, 1990–2011) AgricultureAgricultural land (% land area)Agricultural irrigated land (% of total agricultural land)Agricultural productivity, value added per worker (2000 $)Cereal yield (kg per hectare) Forests and biodiversityForest area (% land area)Deforestation (avg. annual %, 2000–2010)Terrestrial protected areas (% of total land area)Threatened species, mammalsThreatened species, birdsThreatened species, fishThreatened species, higher plants OceansTotal fisheries production (thousand metric tons)
Capture fisheries growth (avg. annual %, 1990–2011)Aquaculture growth (avg. annual %, 1990–2011)
Marine protected areas (% of territorial waters)Coral reef area (sq. km)Mangroves area (sq. km) Energy and emissionsEnergy use per capita (kg oil equivalent)Energy from biomass products and waste (% of total)Electric power consumption per capita (kWh)Electricity generated using fossil fuel (% of total)Electricity generated by hydropower (% of total)CO2 emissions per capita (metric tons) Water and sanitationInternal freshwater resources per capita (cu. m)Total freshwater withdrawal (% of internal resources)
Agriculture (% of total freshwater withdrawal)Access to improved water source (% of total population)
Rural (% of rural population)Urban (% of urban population)
Access to improved sanitation (% of total population)Rural (% of rural population)Urban (% of urban population)
Environment and healthParticulate matter (urban-pop.-weighted avg., µg/cu. m)Acute resp. infection prevalence (% of children under five)Diarrhea prevalence (% of children under five)Under-five mortality rate (per 1,000 live births) National accounting aggregates—savings, depletion and degradationGross savings (% of GNI)Consumption of fixed capital (% of GNI)Education expenditure (% of GNI)Energy depletion (% of GNI)Mineral depletion (% of GNI)Net forest depletion (% of GNI)CO2 damage (% of GNI)Particulate emissions damage (% of GNI)Adjusted net savings (% of GNI)
49,660 39,86042,750 34,611
83.1 80.51.4 1.1
56 3710.6 ..
47,805 26,5157,801 5,349
10.8 28.4–0.1 0.012.4 12.9
34
130
413 28,774–0.4 –1.7–4.0 1.822.1 16.5
.. 81,970
.. 15,496
5,021 5,0004.2 4.4
7,010 9,41585.7 62.0
0.1 11.210.3 11.4
659 8,19596.5 10.3
1 41100 100100 98100 100100 100100 99100 100
30 22.. .... ..4 6
25.9 17.914.6 13.9
4.7 4.60.8 1.40.0 0.20.0 0.00.2 0.20.4 0.1
14.7 6.6
154 2013 The Little Green Data Book
Country data
High-income group
Population (millions) 16.7 Land area (1,000 sq. km) 34 GDP ($ billions) 836.1
Netherlands
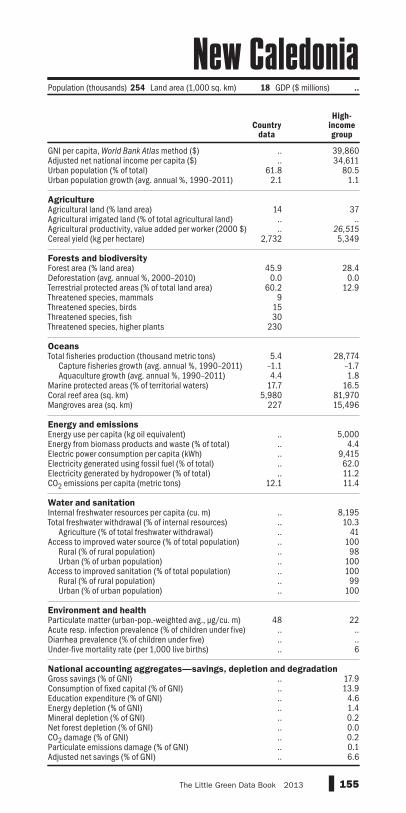
GNI per capita, World Bank Atlas method ($)Adjusted net national income per capita ($)Urban population (% of total)Urban population growth (avg. annual %, 1990–2011) AgricultureAgricultural land (% land area)Agricultural irrigated land (% of total agricultural land)Agricultural productivity, value added per worker (2000 $)Cereal yield (kg per hectare) Forests and biodiversityForest area (% land area)Deforestation (avg. annual %, 2000–2010)Terrestrial protected areas (% of total land area)Threatened species, mammalsThreatened species, birdsThreatened species, fishThreatened species, higher plants OceansTotal fisheries production (thousand metric tons)
Capture fisheries growth (avg. annual %, 1990–2011)Aquaculture growth (avg. annual %, 1990–2011)
Marine protected areas (% of territorial waters)Coral reef area (sq. km)Mangroves area (sq. km) Energy and emissionsEnergy use per capita (kg oil equivalent)Energy from biomass products and waste (% of total)Electric power consumption per capita (kWh)Electricity generated using fossil fuel (% of total)Electricity generated by hydropower (% of total)CO2 emissions per capita (metric tons) Water and sanitationInternal freshwater resources per capita (cu. m)Total freshwater withdrawal (% of internal resources)
Agriculture (% of total freshwater withdrawal)Access to improved water source (% of total population)
Rural (% of rural population)Urban (% of urban population)
Access to improved sanitation (% of total population)Rural (% of rural population)Urban (% of urban population)
Environment and healthParticulate matter (urban-pop.-weighted avg., µg/cu. m)Acute resp. infection prevalence (% of children under five)Diarrhea prevalence (% of children under five)Under-five mortality rate (per 1,000 live births) National accounting aggregates—savings, depletion and degradationGross savings (% of GNI)Consumption of fixed capital (% of GNI)Education expenditure (% of GNI)Energy depletion (% of GNI)Mineral depletion (% of GNI)Net forest depletion (% of GNI)CO2 damage (% of GNI)Particulate emissions damage (% of GNI)Adjusted net savings (% of GNI)
.. 39,860
.. 34,61161.8 80.5
2.1 1.1
14 37.. .... 26,515
2,732 5,349
45.9 28.40.0 0.0
60.2 12.99
1530
230
5.4 28,774–1.1 –1.74.4 1.8
17.7 16.55,980 81,970
227 15,496
.. 5,000
.. 4.4
.. 9,415
.. 62.0
.. 11.212.1 11.4
.. 8,195
.. 10.3
.. 41
.. 100
.. 98
.. 100
.. 100
.. 99
.. 100
48 22.. .... .... 6
.. 17.9
.. 13.9
.. 4.6
.. 1.4
.. 0.2
.. 0.0
.. 0.2
.. 0.1
.. 6.6
155The Little Green Data Book 2013
Population (thousands) 254 Land area (1,000 sq. km) 18 GDP ($ millions) ..
Country data
High-income group
New Caledonia

GNI per capita, World Bank Atlas method ($)Adjusted net national income per capita ($)Urban population (% of total)Urban population growth (avg. annual %, 1990–2011) AgricultureAgricultural land (% land area)Agricultural irrigated land (% of total agricultural land)Agricultural productivity, value added per worker (2000 $)Cereal yield (kg per hectare) Forests and biodiversityForest area (% land area)Deforestation (avg. annual %, 2000–2010)Terrestrial protected areas (% of total land area)Threatened species, mammalsThreatened species, birdsThreatened species, fishThreatened species, higher plants OceansTotal fisheries production (thousand metric tons)
Capture fisheries growth (avg. annual %, 1990–2011)Aquaculture growth (avg. annual %, 1990–2011)
Marine protected areas (% of territorial waters)Coral reef area (sq. km)Mangroves area (sq. km) Energy and emissionsEnergy use per capita (kg oil equivalent)Energy from biomass products and waste (% of total)Electric power consumption per capita (kWh)Electricity generated using fossil fuel (% of total)Electricity generated by hydropower (% of total)CO2 emissions per capita (metric tons) Water and sanitationInternal freshwater resources per capita (cu. m)Total freshwater withdrawal (% of internal resources)
Agriculture (% of total freshwater withdrawal)Access to improved water source (% of total population)
Rural (% of rural population)Urban (% of urban population)
Access to improved sanitation (% of total population)Rural (% of rural population)Urban (% of urban population)
Environment and healthParticulate matter (urban-pop.-weighted avg., µg/cu. m)Acute resp. infection prevalence (% of children under five)Diarrhea prevalence (% of children under five)Under-five mortality rate (per 1,000 live births) National accounting aggregates—savings, depletion and degradationGross savings (% of GNI)Consumption of fixed capital (% of GNI)Education expenditure (% of GNI)Energy depletion (% of GNI)Mineral depletion (% of GNI)Net forest depletion (% of GNI)CO2 damage (% of GNI)Particulate emissions damage (% of GNI)Adjusted net savings (% of GNI)
29,140 39,86026,828 34,611
86.2 80.51.4 1.1
43 37.. ..
26,556 26,5156,951 5,349
31.4 28.40.0 0.0
26.2 12.99
702319
545 28,7741.0 –1.77.0 1.8
10.8 16.5.. 81,970
261 15,496
4,166 5,0006.5 4.4
9,566 9,41526.6 62.055.1 11.2
7.4 11.4
74,230 8,1951.5 10.374 41
100 100100 98100 100
.. 100
.. 99
.. 100
11 22.. .... ..6 6
19.3 17.913.9 13.9
7.2 4.60.7 1.40.4 0.20.0 0.00.2 0.20.0 0.1
11.2 6.6
156 2013 The Little Green Data Book
Population (millions) 4.4 Land area (1,000 sq. km) 263 GDP ($ billions) 159.7
Country data
High-income group
New Zealand
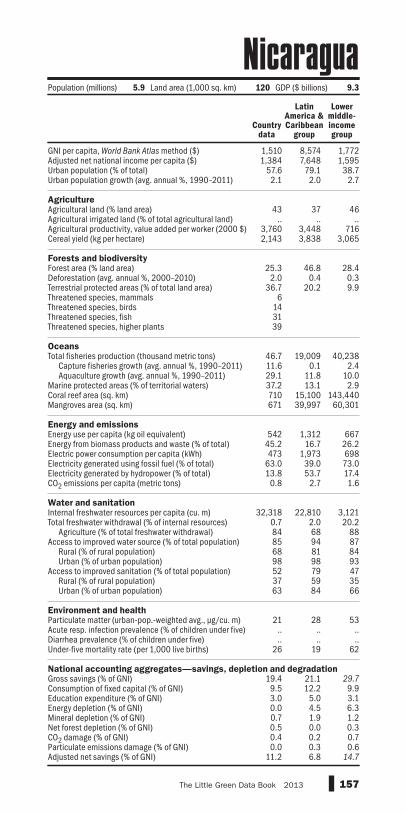
GNI per capita, World Bank Atlas method ($)Adjusted net national income per capita ($)Urban population (% of total)Urban population growth (avg. annual %, 1990–2011) AgricultureAgricultural land (% land area)Agricultural irrigated land (% of total agricultural land)Agricultural productivity, value added per worker (2000 $)Cereal yield (kg per hectare) Forests and biodiversityForest area (% land area)Deforestation (avg. annual %, 2000–2010)Terrestrial protected areas (% of total land area)Threatened species, mammalsThreatened species, birdsThreatened species, fishThreatened species, higher plants OceansTotal fisheries production (thousand metric tons)
Capture fisheries growth (avg. annual %, 1990–2011)Aquaculture growth (avg. annual %, 1990–2011)
Marine protected areas (% of territorial waters)Coral reef area (sq. km)Mangroves area (sq. km) Energy and emissionsEnergy use per capita (kg oil equivalent)Energy from biomass products and waste (% of total)Electric power consumption per capita (kWh)Electricity generated using fossil fuel (% of total)Electricity generated by hydropower (% of total)CO2 emissions per capita (metric tons) Water and sanitationInternal freshwater resources per capita (cu. m)Total freshwater withdrawal (% of internal resources)
Agriculture (% of total freshwater withdrawal)Access to improved water source (% of total population)
Rural (% of rural population)Urban (% of urban population)
Access to improved sanitation (% of total population)Rural (% of rural population)Urban (% of urban population)
Environment and healthParticulate matter (urban-pop.-weighted avg., µg/cu. m)Acute resp. infection prevalence (% of children under five)Diarrhea prevalence (% of children under five)Under-five mortality rate (per 1,000 live births) National accounting aggregates—savings, depletion and degradationGross savings (% of GNI)Consumption of fixed capital (% of GNI)Education expenditure (% of GNI)Energy depletion (% of GNI)Mineral depletion (% of GNI)Net forest depletion (% of GNI)CO2 damage (% of GNI)Particulate emissions damage (% of GNI)Adjusted net savings (% of GNI)
1,510 8,574 1,7721,384 7,648 1,595
57.6 79.1 38.72.1 2.0 2.7
43 37 46.. .. ..
3,760 3,448 7162,143 3,838 3,065
25.3 46.8 28.42.0 0.4 0.3
36.7 20.2 9.96
143139
46.7 19,009 40,23811.6 0.1 2.429.1 11.8 10.037.2 13.1 2.9710 15,100 143,440671 39,997 60,301
542 1,312 66745.2 16.7 26.2473 1,973 698
63.0 39.0 73.013.8 53.7 17.4
0.8 2.7 1.6
32,318 22,810 3,1210.7 2.0 20.284 68 8885 94 8768 81 8498 98 9352 79 4737 59 3563 84 66
21 28 53.. .. .... .. ..
26 19 62
19.4 21.1 29.79.5 12.2 9.93.0 5.0 3.10.0 4.5 6.30.7 1.9 1.20.5 0.0 0.30.4 0.2 0.70.0 0.3 0.6
11.2 6.8 14.7
157The Little Green Data Book 2013
Country data
Latin America & Caribbean
group
Lower middle-income group
Population (millions) 5.9 Land area (1,000 sq. km) 120 GDP ($ billions) 9.3
Nicaragua

GNI per capita, World Bank Atlas method ($)Adjusted net national income per capita ($)Urban population (% of total)Urban population growth (avg. annual %, 1990–2011) AgricultureAgricultural land (% land area)Agricultural irrigated land (% of total agricultural land)Agricultural productivity, value added per worker (2000 $)Cereal yield (kg per hectare) Forests and biodiversityForest area (% land area)Deforestation (avg. annual %, 2000–2010)Terrestrial protected areas (% of total land area)Threatened species, mammalsThreatened species, birdsThreatened species, fishThreatened species, higher plants OceansTotal fisheries production (thousand metric tons)
Capture fisheries growth (avg. annual %, 1990–2011)Aquaculture growth (avg. annual %, 1990–2011)
Marine protected areas (% of territorial waters)Coral reef area (sq. km)Mangroves area (sq. km) Energy and emissionsEnergy use per capita (kg oil equivalent)Energy from biomass products and waste (% of total)Electric power consumption per capita (kWh)Electricity generated using fossil fuel (% of total)Electricity generated by hydropower (% of total)CO2 emissions per capita (metric tons) Water and sanitationInternal freshwater resources per capita (cu. m)Total freshwater withdrawal (% of internal resources)
Agriculture (% of total freshwater withdrawal)Access to improved water source (% of total population)
Rural (% of rural population)Urban (% of urban population)
Access to improved sanitation (% of total population)Rural (% of rural population)Urban (% of urban population)
Environment and healthParticulate matter (urban-pop.-weighted avg., µg/cu. m)Acute resp. infection prevalence (% of children under five)Diarrhea prevalence (% of children under five)Under-five mortality rate (per 1,000 live births) National accounting aggregates—savings, depletion and degradationGross savings (% of GNI)Consumption of fixed capital (% of GNI)Education expenditure (% of GNI)Energy depletion (% of GNI)Mineral depletion (% of GNI)Net forest depletion (% of GNI)CO2 damage (% of GNI)Particulate emissions damage (% of GNI)Adjusted net savings (% of GNI)
360 1,258 571350 1,022 52117.9 36.5 28.04.2 3.8 3.5
35 44 390.2 .. ..
.. 334 308378 1,361 2,034
0.9 27.8 25.71.0 0.5 0.67.1 11.7 10.012
942
53.3 6,383 11,56314.1 1.8 4.04.2 16.0 4.9
.. 5.8 ..
.. 17,980 15,120
.. 27,808 25,818
.. 683 363
.. 58.2 66.2
.. 553 242
.. 65.2 32.0
.. 18.7 45.30.1 0.9 0.3
218 4,455 5,12567.5 3.2 4.5
88 84 9049 61 6539 48 57
100 83 869 31 374 23 32
34 42 47
96 41 5414 .. ..21 .. ..
125 109 95
.. 18.4 25.23.9 10.9 7.73.5 3.7 3.00.0 10.4 1.40.4 2.2 2.01.4 0.5 1.20.1 0.5 0.31.6 0.4 0.5
.. –1.2 15.2
158 2013 The Little Green Data Book
Country data
Sub-Saharan Africa group
Low-income group
Population (millions) 16.1 Land area (1,000 sq. km) 1,267 GDP ($ billions) 6.0
Niger

GNI per capita, World Bank Atlas method ($)Adjusted net national income per capita ($)Urban population (% of total)Urban population growth (avg. annual %, 1990–2011) AgricultureAgricultural land (% land area)Agricultural irrigated land (% of total agricultural land)Agricultural productivity, value added per worker (2000 $)Cereal yield (kg per hectare) Forests and biodiversityForest area (% land area)Deforestation (avg. annual %, 2000–2010)Terrestrial protected areas (% of total land area)Threatened species, mammalsThreatened species, birdsThreatened species, fishThreatened species, higher plants OceansTotal fisheries production (thousand metric tons)
Capture fisheries growth (avg. annual %, 1990–2011)Aquaculture growth (avg. annual %, 1990–2011)
Marine protected areas (% of territorial waters)Coral reef area (sq. km)Mangroves area (sq. km) Energy and emissionsEnergy use per capita (kg oil equivalent)Energy from biomass products and waste (% of total)Electric power consumption per capita (kWh)Electricity generated using fossil fuel (% of total)Electricity generated by hydropower (% of total)CO2 emissions per capita (metric tons) Water and sanitationInternal freshwater resources per capita (cu. m)Total freshwater withdrawal (% of internal resources)
Agriculture (% of total freshwater withdrawal)Access to improved water source (% of total population)
Rural (% of rural population)Urban (% of urban population)
Access to improved sanitation (% of total population)Rural (% of rural population)Urban (% of urban population)
Environment and healthParticulate matter (urban-pop.-weighted avg., µg/cu. m)Acute resp. infection prevalence (% of children under five)Diarrhea prevalence (% of children under five)Under-five mortality rate (per 1,000 live births) National accounting aggregates—savings, depletion and degradationGross savings (% of GNI)Consumption of fixed capital (% of GNI)Education expenditure (% of GNI)Energy depletion (% of GNI)Mineral depletion (% of GNI)Net forest depletion (% of GNI)CO2 damage (% of GNI)Particulate emissions damage (% of GNI)Adjusted net savings (% of GNI)
1,280 1,258 1,772889 1,022 1,59549.6 36.5 38.7
4.1 3.8 2.7
84 44 46.. .. .... 334 716
1,331 1,361 3,065
9.5 27.8 28.43.7 0.5 0.3
12.8 11.7 9.9261859
167
857 6,383 40,2383.5 1.8 2.4
17.6 16.0 10.00.16 5.8 2.9
.. 17,980 143,4407,356 27,808 60,301
714 683 66783.9 58.2 26.2136 553 69875.6 65.2 73.024.4 18.7 17.40.5 0.9 1.6
1,360 4,455 3,1214.7 3.2 20.253 84 8858 61 8743 48 8474 83 9331 31 4727 23 3535 42 66
38 41 533 .. ..
10 .. ..124 109 62
.. 18.4 29.710.2 10.9 9.90.9 3.7 3.1
24.2 10.4 6.30.0 2.2 1.20.2 0.5 0.30.4 0.5 0.70.5 0.4 0.6
.. –1.2 14.7
159The Little Green Data Book 2013
Country data
Sub-Saharan Africa group
Lower middle-income group
Population (millions) 162.5 Land area (1,000 sq. km) 911 GDP ($ billions) 244.0
Nigeria

GNI per capita, World Bank Atlas method ($)Adjusted net national income per capita ($)Urban population (% of total)Urban population growth (avg. annual %, 1990–2011) AgricultureAgricultural land (% land area)Agricultural irrigated land (% of total agricultural land)Agricultural productivity, value added per worker (2000 $)Cereal yield (kg per hectare) Forests and biodiversityForest area (% land area)Deforestation (avg. annual %, 2000–2010)Terrestrial protected areas (% of total land area)Threatened species, mammalsThreatened species, birdsThreatened species, fishThreatened species, higher plants OceansTotal fisheries production (thousand metric tons)
Capture fisheries growth (avg. annual %, 1990–2011)Aquaculture growth (avg. annual %, 1990–2011)
Marine protected areas (% of territorial waters)Coral reef area (sq. km)Mangroves area (sq. km) Energy and emissionsEnergy use per capita (kg oil equivalent)Energy from biomass products and waste (% of total)Electric power consumption per capita (kWh)Electricity generated using fossil fuel (% of total)Electricity generated by hydropower (% of total)CO2 emissions per capita (metric tons) Water and sanitationInternal freshwater resources per capita (cu. m)Total freshwater withdrawal (% of internal resources)
Agriculture (% of total freshwater withdrawal)Access to improved water source (% of total population)
Rural (% of rural population)Urban (% of urban population)
Access to improved sanitation (% of total population)Rural (% of rural population)Urban (% of urban population)
Environment and healthParticulate matter (urban-pop.-weighted avg., µg/cu. m)Acute resp. infection prevalence (% of children under five)Diarrhea prevalence (% of children under five)Under-five mortality rate (per 1,000 live births) National accounting aggregates—savings, depletion and degradationGross savings (% of GNI)Consumption of fixed capital (% of GNI)Education expenditure (% of GNI)Energy depletion (% of GNI)Mineral depletion (% of GNI)Net forest depletion (% of GNI)CO2 damage (% of GNI)Particulate emissions damage (% of GNI)Adjusted net savings (% of GNI)
.. 39,860
.. 34,61191.5 80.5
1.7 1.1
7 37.. .... 26,515.. 5,349
65.5 28.40.5 0.0
12.8 12.95
1512
4
0.25 28,7741.2 –1.7
.. 1.828.7 16.5<50 81,9700.07 15,496
.. 5,000
.. 4.4
.. 9,415
.. 62.0
.. 11.2
.. 11.4
.. 8,195
.. 10.3
.. 4198 10097 9898 10094 10096 9994 100
.. 22
.. ..
.. ..
.. 6
.. 17.9
.. 13.9
.. 4.6
.. 1.4
.. 0.2
.. 0.0
.. 0.2
.. 0.1
.. 6.6
160 2013 The Little Green Data Book
Population (thousands) 61 Land area (sq. km) 460 GDP ($ millions) ..
Country data
High-income group
Northern Mariana Islands

GNI per capita, World Bank Atlas method ($)Adjusted net national income per capita ($)Urban population (% of total)Urban population growth (avg. annual %, 1990–2011) AgricultureAgricultural land (% land area)Agricultural irrigated land (% of total agricultural land)Agricultural productivity, value added per worker (2000 $)Cereal yield (kg per hectare) Forests and biodiversityForest area (% land area)Deforestation (avg. annual %, 2000–2010)Terrestrial protected areas (% of total land area)Threatened species, mammalsThreatened species, birdsThreatened species, fishThreatened species, higher plants OceansTotal fisheries production (thousand metric tons)
Capture fisheries growth (avg. annual %, 1990–2011)Aquaculture growth (avg. annual %, 1990–2011)
Marine protected areas (% of territorial waters)Coral reef area (sq. km)Mangroves area (sq. km) Energy and emissionsEnergy use per capita (kg oil equivalent)Energy from biomass products and waste (% of total)Electric power consumption per capita (kWh)Electricity generated using fossil fuel (% of total)Electricity generated by hydropower (% of total)CO2 emissions per capita (metric tons) Water and sanitationInternal freshwater resources per capita (cu. m)Total freshwater withdrawal (% of internal resources)
Agriculture (% of total freshwater withdrawal)Access to improved water source (% of total population)
Rural (% of rural population)Urban (% of urban population)
Access to improved sanitation (% of total population)Rural (% of rural population)Urban (% of urban population)
Environment and healthParticulate matter (urban-pop.-weighted avg., µg/cu. m)Acute resp. infection prevalence (% of children under five)Diarrhea prevalence (% of children under five)Under-five mortality rate (per 1,000 live births) National accounting aggregates—savings, depletion and degradationGross savings (% of GNI)Consumption of fixed capital (% of GNI)Education expenditure (% of GNI)Energy depletion (% of GNI)Mineral depletion (% of GNI)Net forest depletion (% of GNI)CO2 damage (% of GNI)Particulate emissions damage (% of GNI)Adjusted net savings (% of GNI)
88,870 39,86075,531 34,611
79.4 80.51.2 1.1
3 374.3 ..
46,480 26,5153,226 5,349
33.3 28.4–0.8 0.014.6 12.9
74
192
3,573 28,7741.4 –1.7
10.1 1.82.4 16.5
.. 81,970
.. 15,496
6,637 5,0005.1 4.4
25,175 9,4154.0 62.0
94.7 11.29.7 11.4
77,124 8,1950.8 10.329 41
100 100100 98100 100100 100100 99100 100
16 22.. .... ..3 6
37.0 17.913.8 13.9
6.6 4.610.5 1.40.0 0.20.0 0.00.1 0.20.0 0.1
19.2 6.6
161The Little Green Data Book 2013
Country data
High-income group
Population (millions) 5.0 Land area (1,000 sq. km) 304 GDP ($ billions) 485.8
Norway

GNI per capita, World Bank Atlas method ($)Adjusted net national income per capita ($)Urban population (% of total)Urban population growth (avg. annual %, 1990–2011) AgricultureAgricultural land (% land area)Agricultural irrigated land (% of total agricultural land)Agricultural productivity, value added per worker (2000 $)Cereal yield (kg per hectare) Forests and biodiversityForest area (% land area)Deforestation (avg. annual %, 2000–2010)Terrestrial protected areas (% of total land area)Threatened species, mammalsThreatened species, birdsThreatened species, fishThreatened species, higher plants OceansTotal fisheries production (thousand metric tons)
Capture fisheries growth (avg. annual %, 1990–2011)Aquaculture growth (avg. annual %, 1990–2011)
Marine protected areas (% of territorial waters)Coral reef area (sq. km)Mangroves area (sq. km) Energy and emissionsEnergy use per capita (kg oil equivalent)Energy from biomass products and waste (% of total)Electric power consumption per capita (kWh)Electricity generated using fossil fuel (% of total)Electricity generated by hydropower (% of total)CO2 emissions per capita (metric tons) Water and sanitationInternal freshwater resources per capita (cu. m)Total freshwater withdrawal (% of internal resources)
Agriculture (% of total freshwater withdrawal)Access to improved water source (% of total population)
Rural (% of rural population)Urban (% of urban population)
Access to improved sanitation (% of total population)Rural (% of rural population)Urban (% of urban population)
Environment and healthParticulate matter (urban-pop.-weighted avg., µg/cu. m)Acute resp. infection prevalence (% of children under five)Diarrhea prevalence (% of children under five)Under-five mortality rate (per 1,000 live births) National accounting aggregates—savings, depletion and degradationGross savings (% of GNI)Consumption of fixed capital (% of GNI)Education expenditure (% of GNI)Energy depletion (% of GNI)Mineral depletion (% of GNI)Net forest depletion (% of GNI)CO2 damage (% of GNI)Particulate emissions damage (% of GNI)Adjusted net savings (% of GNI)
19,260 39,86010,846 34,611
73.4 80.52.5 1.1
6 374.0 ..
.. 26,51510,269 5,349
0.0 28.40.0 0.0
10.7 12.99
10276
159 28,7741.3 –1.7
.. 1.81.3 16.5
530 81,97010.9 15,496
7,188 5,0000.0 4.4
5,933 9,415100.0 62.0
0.0 11.215.2 11.4
492 8,19594.4 10.3
88 4189 10078 9893 10099 10095 99
100 100
95 22.. .... ..9 6
39.7 17.913.7 13.94.2 4.6
31.1 1.40.0 0.20.0 0.00.6 0.20.0 0.1
–8.1 6.6
162 2013 The Little Green Data Book
Country data
High-income group
Population (millions) 2.8 Land area (1,000 sq. km) 310 GDP ($ billions) 71.8
Oman

GNI per capita, World Bank Atlas method ($)Adjusted net national income per capita ($)Urban population (% of total)Urban population growth (avg. annual %, 1990–2011) AgricultureAgricultural land (% land area)Agricultural irrigated land (% of total agricultural land)Agricultural productivity, value added per worker (2000 $)Cereal yield (kg per hectare) Forests and biodiversityForest area (% land area)Deforestation (avg. annual %, 2000–2010)Terrestrial protected areas (% of total land area)Threatened species, mammalsThreatened species, birdsThreatened species, fishThreatened species, higher plants OceansTotal fisheries production (thousand metric tons)
Capture fisheries growth (avg. annual %, 1990–2011)Aquaculture growth (avg. annual %, 1990–2011)
Marine protected areas (% of territorial waters)Coral reef area (sq. km)Mangroves area (sq. km) Energy and emissionsEnergy use per capita (kg oil equivalent)Energy from biomass products and waste (% of total)Electric power consumption per capita (kWh)Electricity generated using fossil fuel (% of total)Electricity generated by hydropower (% of total)CO2 emissions per capita (metric tons) Water and sanitationInternal freshwater resources per capita (cu. m)Total freshwater withdrawal (% of internal resources)
Agriculture (% of total freshwater withdrawal)Access to improved water source (% of total population)
Rural (% of rural population)Urban (% of urban population)
Access to improved sanitation (% of total population)Rural (% of rural population)Urban (% of urban population)
Environment and healthParticulate matter (urban-pop.-weighted avg., µg/cu. m)Acute resp. infection prevalence (% of children under five)Diarrhea prevalence (% of children under five)Under-five mortality rate (per 1,000 live births) National accounting aggregates—savings, depletion and degradationGross savings (% of GNI)Consumption of fixed capital (% of GNI)Education expenditure (% of GNI)Energy depletion (% of GNI)Mineral depletion (% of GNI)Net forest depletion (% of GNI)CO2 damage (% of GNI)Particulate emissions damage (% of GNI)Adjusted net savings (% of GNI)
1,120 1,313 1,7721,105 1,201 1,59536.2 30.9 38.7
3.0 2.8 2.7
34 55 4670.2 .. ..951 550 716
2,718 2,959 3,065
2.1 17.1 28.42.2 –0.3 0.3
10.1 5.9 9.9232935
2
595 13,219 40,238–0.2 2.3 2.413.4 8.1 10.0
1.8 1.7 2.9.. 15,440 143,440
977 10,343 60,301
487 519 66734.1 26.7 26.2457 555 69862.7 80.6 73.033.7 14.0 17.40.9 1.4 1.6
311 1,197 3,121333.6 51.6 20.2
94 91 8892 90 8789 88 8496 96 9348 38 4734 28 3572 60 66
91 62 5314 .. ..22 .. ..72 62 62
19.5 33.5 29.78.5 9.2 9.91.6 2.8 3.12.0 2.8 6.30.1 1.0 1.20.6 0.6 0.30.6 0.8 0.71.0 0.6 0.68.3 21.6 14.7
163The Little Green Data Book 2013
Country data
South Asia
group
Lower middle-income group
Population (millions) 176.7 Land area (1,000 sq. km) 771 GDP ($ billions) 210.2
Pakistan

GNI per capita, World Bank Atlas method ($)Adjusted net national income per capita ($)Urban population (% of total)Urban population growth (avg. annual %, 1990–2011) AgricultureAgricultural land (% land area)Agricultural irrigated land (% of total agricultural land)Agricultural productivity, value added per worker (2000 $)Cereal yield (kg per hectare) Forests and biodiversityForest area (% land area)Deforestation (avg. annual %, 2000–2010)Terrestrial protected areas (% of total land area)Threatened species, mammalsThreatened species, birdsThreatened species, fishThreatened species, higher plants OceansTotal fisheries production (thousand metric tons)
Capture fisheries growth (avg. annual %, 1990–2011)Aquaculture growth (avg. annual %, 1990–2011)
Marine protected areas (% of territorial waters)Coral reef area (sq. km)Mangroves area (sq. km) Energy and emissionsEnergy use per capita (kg oil equivalent)Energy from biomass products and waste (% of total)Electric power consumption per capita (kWh)Electricity generated using fossil fuel (% of total)Electricity generated by hydropower (% of total)CO2 emissions per capita (metric tons) Water and sanitationInternal freshwater resources per capita (cu. m)Total freshwater withdrawal (% of internal resources)
Agriculture (% of total freshwater withdrawal)Access to improved water source (% of total population)
Rural (% of rural population)Urban (% of urban population)
Access to improved sanitation (% of total population)Rural (% of rural population)Urban (% of urban population)
Environment and healthParticulate matter (urban-pop.-weighted avg., µg/cu. m)Acute resp. infection prevalence (% of children under five)Diarrhea prevalence (% of children under five)Under-five mortality rate (per 1,000 live births) National accounting aggregates—savings, depletion and degradationGross savings (% of GNI)Consumption of fixed capital (% of GNI)Education expenditure (% of GNI)Energy depletion (% of GNI)Mineral depletion (% of GNI)Net forest depletion (% of GNI)CO2 damage (% of GNI)Particulate emissions damage (% of GNI)Adjusted net savings (% of GNI)
6,510 4,248 6,563.. 3,884 5,821
84.1 48.6 60.62.4 3.6 2.5
11 48 35.. .. .... 610 869.. 5,050 3,944
87.6 29.7 34.8–0.2 –0.4 0.02.0 15.0 13.3
44
153
1.0 101,299 97,437–0.3 3.4 0.712.5 9.1 9.05.3 1.4 8.4
1,150 137,690 33,35048.5 56,537 48,783
.. 1,520 1,948
.. 10.9 8.1
.. 2,337 2,942
.. 79.8 72.9
.. 16.5 21.310.3 4.6 5.5
.. 4,446 8,550
.. 10.9 5.6
.. 73 6685 90 9396 84 8683 97 98
100 66 73100 58 62100 76 81
.. 55 42
.. .. ..
.. .. ..19 21 20
.. 49.3 36.414.4 11.0 11.8
.. 2.1 3.30.0 4.3 5.70.0 1.7 1.6
.. 0.0 0.01.2 0.9 0.7
.. 1.1 0.7
.. 32.2 19.2
164 2013 The Little Green Data Book
Country data
East Asia & Pacific
group
Upper middle-income group
Population (thousands) 21 Land area (sq. km) 460 GDP ($ millions) 165.5
Palau

GNI per capita, World Bank Atlas method ($)Adjusted net national income per capita ($)Urban population (% of total)Urban population growth (avg. annual %, 1990–2011) AgricultureAgricultural land (% land area)Agricultural irrigated land (% of total agricultural land)Agricultural productivity, value added per worker (2000 $)Cereal yield (kg per hectare) Forests and biodiversityForest area (% land area)Deforestation (avg. annual %, 2000–2010)Terrestrial protected areas (% of total land area)Threatened species, mammalsThreatened species, birdsThreatened species, fishThreatened species, higher plants OceansTotal fisheries production (thousand metric tons)
Capture fisheries growth (avg. annual %, 1990–2011)Aquaculture growth (avg. annual %, 1990–2011)
Marine protected areas (% of territorial waters)Coral reef area (sq. km)Mangroves area (sq. km) Energy and emissionsEnergy use per capita (kg oil equivalent)Energy from biomass products and waste (% of total)Electric power consumption per capita (kWh)Electricity generated using fossil fuel (% of total)Electricity generated by hydropower (% of total)CO2 emissions per capita (metric tons) Water and sanitationInternal freshwater resources per capita (cu. m)Total freshwater withdrawal (% of internal resources)
Agriculture (% of total freshwater withdrawal)Access to improved water source (% of total population)
Rural (% of rural population)Urban (% of urban population)
Access to improved sanitation (% of total population)Rural (% of rural population)Urban (% of urban population)
Environment and healthParticulate matter (urban-pop.-weighted avg., µg/cu. m)Acute resp. infection prevalence (% of children under five)Diarrhea prevalence (% of children under five)Under-five mortality rate (per 1,000 live births) National accounting aggregates—savings, depletion and degradationGross savings (% of GNI)Consumption of fixed capital (% of GNI)Education expenditure (% of GNI)Energy depletion (% of GNI)Mineral depletion (% of GNI)Net forest depletion (% of GNI)CO2 damage (% of GNI)Particulate emissions damage (% of GNI)Adjusted net savings (% of GNI)
7,470 8,574 6,5636,077 7,648 5,82175.2 79.1 60.6
3.4 2.0 2.5
30 37 35.. .. ..
3,488 3,448 8692,569 3,838 3,944
43.6 46.8 34.80.4 0.4 0.0
18.7 20.2 13.3151941
191
165 19,009 97,4370.9 0.1 0.73.7 11.8 9.04.0 13.1 8.4
720 15,100 33,3501,744 39,997 48,783
1,073 1,312 1,94812.8 16.7 8.1
1,832 1,973 2,94243.0 39.0 72.956.0 53.7 21.3
2.3 2.7 5.5
41,275 22,810 8,5500.3 2.0 5.651 68 6693 94 9383 81 8697 98 9869 79 7351 59 6275 84 81
45 28 42.. .. .... .. ..
20 19 20
19.1 21.1 36.412.4 12.2 11.83.5 5.0 3.30.0 4.5 5.70.5 1.9 1.60.0 0.0 0.00.3 0.2 0.70.3 0.3 0.79.1 6.8 19.2
165The Little Green Data Book 2013
Country data
Latin America & Caribbean
group
Upper middle-income group
Population (millions) 3.6 Land area (1,000 sq. km) 74 GDP ($ billions) 26.8
Panama

GNI per capita, World Bank Atlas method ($)Adjusted net national income per capita ($)Urban population (% of total)Urban population growth (avg. annual %, 1990–2011) AgricultureAgricultural land (% land area)Agricultural irrigated land (% of total agricultural land)Agricultural productivity, value added per worker (2000 $)Cereal yield (kg per hectare) Forests and biodiversityForest area (% land area)Deforestation (avg. annual %, 2000–2010)Terrestrial protected areas (% of total land area)Threatened species, mammalsThreatened species, birdsThreatened species, fishThreatened species, higher plants OceansTotal fisheries production (thousand metric tons)
Capture fisheries growth (avg. annual %, 1990–2011)Aquaculture growth (avg. annual %, 1990–2011)
Marine protected areas (% of territorial waters)Coral reef area (sq. km)Mangroves area (sq. km) Energy and emissionsEnergy use per capita (kg oil equivalent)Energy from biomass products and waste (% of total)Electric power consumption per capita (kWh)Electricity generated using fossil fuel (% of total)Electricity generated by hydropower (% of total)CO2 emissions per capita (metric tons) Water and sanitationInternal freshwater resources per capita (cu. m)Total freshwater withdrawal (% of internal resources)
Agriculture (% of total freshwater withdrawal)Access to improved water source (% of total population)
Rural (% of rural population)Urban (% of urban population)
Access to improved sanitation (% of total population)Rural (% of rural population)Urban (% of urban population)
Environment and healthParticulate matter (urban-pop.-weighted avg., µg/cu. m)Acute resp. infection prevalence (% of children under five)Diarrhea prevalence (% of children under five)Under-five mortality rate (per 1,000 live births) National accounting aggregates—savings, depletion and degradationGross savings (% of GNI)Consumption of fixed capital (% of GNI)Education expenditure (% of GNI)Energy depletion (% of GNI)Mineral depletion (% of GNI)Net forest depletion (% of GNI)CO2 damage (% of GNI)Particulate emissions damage (% of GNI)Adjusted net savings (% of GNI)
1,480 4,248 1,7721,186 3,884 1,59512.5 48.6 38.7
1.6 3.6 2.7
3 48 46.. .. ..
688 610 7164,457 5,050 3,065
63.1 29.7 28.40.5 –0.4 0.33.1 15.0 9.9393745
142
187 101,299 40,2389.7 3.4 2.4
29.6 9.1 10.00.32 1.4 2.9
13,840 137,690 143,4404,265 56,537 60,301
.. 1,520 667
.. 10.9 26.2
.. 2,337 698
.. 79.8 73.0
.. 16.5 17.40.5 4.6 1.6
114,203 4,446 3,1210.0 10.9 20.2
0 73 8840 90 8733 84 8487 97 9345 66 4741 58 3571 76 66
16 55 53.. .. .... .. ..
58 21 62
20.8 49.3 29.79.9 11.0 9.9
.. 2.1 3.10.0 4.3 6.3
23.1 1.7 1.20.0 0.0 0.30.3 0.9 0.70.0 1.1 0.6
.. 32.2 14.7
166 2013 The Little Green Data Book
Country data
East Asia & Pacific
group
Lower middle-income group
Population (millions) 7.0 Land area (1,000 sq. km) 453 GDP ($ billions) 12.9
Papua New Guinea

GNI per capita, World Bank Atlas method ($)Adjusted net national income per capita ($)Urban population (% of total)Urban population growth (avg. annual %, 1990–2011) AgricultureAgricultural land (% land area)Agricultural irrigated land (% of total agricultural land)Agricultural productivity, value added per worker (2000 $)Cereal yield (kg per hectare) Forests and biodiversityForest area (% land area)Deforestation (avg. annual %, 2000–2010)Terrestrial protected areas (% of total land area)Threatened species, mammalsThreatened species, birdsThreatened species, fishThreatened species, higher plants OceansTotal fisheries production (thousand metric tons)
Capture fisheries growth (avg. annual %, 1990–2011)Aquaculture growth (avg. annual %, 1990–2011)
Marine protected areas (% of territorial waters)Coral reef area (sq. km)Mangroves area (sq. km) Energy and emissionsEnergy use per capita (kg oil equivalent)Energy from biomass products and waste (% of total)Electric power consumption per capita (kWh)Electricity generated using fossil fuel (% of total)Electricity generated by hydropower (% of total)CO2 emissions per capita (metric tons) Water and sanitationInternal freshwater resources per capita (cu. m)Total freshwater withdrawal (% of internal resources)
Agriculture (% of total freshwater withdrawal)Access to improved water source (% of total population)
Rural (% of rural population)Urban (% of urban population)
Access to improved sanitation (% of total population)Rural (% of rural population)Urban (% of urban population)
Environment and healthParticulate matter (urban-pop.-weighted avg., µg/cu. m)Acute resp. infection prevalence (% of children under five)Diarrhea prevalence (% of children under five)Under-five mortality rate (per 1,000 live births) National accounting aggregates—savings, depletion and degradationGross savings (% of GNI)Consumption of fixed capital (% of GNI)Education expenditure (% of GNI)Energy depletion (% of GNI)Mineral depletion (% of GNI)Net forest depletion (% of GNI)CO2 damage (% of GNI)Particulate emissions damage (% of GNI)Adjusted net savings (% of GNI)
3,020 8,574 1,7723,174 7,648 1,59561.9 79.1 38.73.2 2.0 2.7
53 37 46.. .. ..
2,784 3,448 7163,480 3,838 3,065
43.8 46.8 28.41.0 0.4 0.35.4 20.2 9.9
828
010
21.9 19,009 40,2381.5 0.1 2.4
23.3 11.8 10.0.. 13.1 2.9.. 15,100 143,440.. 39,997 60,301
742 1,312 66748.1 16.7 26.2
1,134 1,973 6980.0 39.0 73.0
100.0 53.7 17.40.7 2.7 1.6
14,311 22,810 3,1210.5 2.0 20.271 68 8886 94 8766 81 8499 98 9371 79 4740 59 3590 84 66
64 28 53.. .. .... .. ..
22 19 62
10.8 21.1 29.710.7 12.2 9.93.7 5.0 3.10.0 4.5 6.30.0 1.9 1.20.0 0.0 0.30.2 0.2 0.71.0 0.3 0.62.6 6.8 14.7
167The Little Green Data Book 2013
Country data
Latin America & Caribbean
group
Lower middle-income group
Population (millions) 6.6 Land area (1,000 sq. km) 397 GDP ($ billions) 23.8
Paraguay

GNI per capita, World Bank Atlas method ($)Adjusted net national income per capita ($)Urban population (% of total)Urban population growth (avg. annual %, 1990–2011) AgricultureAgricultural land (% land area)Agricultural irrigated land (% of total agricultural land)Agricultural productivity, value added per worker (2000 $)Cereal yield (kg per hectare) Forests and biodiversityForest area (% land area)Deforestation (avg. annual %, 2000–2010)Terrestrial protected areas (% of total land area)Threatened species, mammalsThreatened species, birdsThreatened species, fishThreatened species, higher plants OceansTotal fisheries production (thousand metric tons)
Capture fisheries growth (avg. annual %, 1990–2011)Aquaculture growth (avg. annual %, 1990–2011)
Marine protected areas (% of territorial waters)Coral reef area (sq. km)Mangroves area (sq. km) Energy and emissionsEnergy use per capita (kg oil equivalent)Energy from biomass products and waste (% of total)Electric power consumption per capita (kWh)Electricity generated using fossil fuel (% of total)Electricity generated by hydropower (% of total)CO2 emissions per capita (metric tons) Water and sanitationInternal freshwater resources per capita (cu. m)Total freshwater withdrawal (% of internal resources)
Agriculture (% of total freshwater withdrawal)Access to improved water source (% of total population)
Rural (% of rural population)Urban (% of urban population)
Access to improved sanitation (% of total population)Rural (% of rural population)Urban (% of urban population)
Environment and healthParticulate matter (urban-pop.-weighted avg., µg/cu. m)Acute resp. infection prevalence (% of children under five)Diarrhea prevalence (% of children under five)Under-five mortality rate (per 1,000 live births) National accounting aggregates—savings, depletion and degradationGross savings (% of GNI)Consumption of fixed capital (% of GNI)Education expenditure (% of GNI)Energy depletion (% of GNI)Mineral depletion (% of GNI)Net forest depletion (% of GNI)CO2 damage (% of GNI)Particulate emissions damage (% of GNI)Adjusted net savings (% of GNI)
5,150 8,574 6,5634,329 7,648 5,821
77.2 79.1 60.62.0 2.0 2.5
17 37 35.. .. ..
1,665 3,448 8693,899 3,838 3,944
53.0 46.8 34.80.2 0.4 0.0
13.6 20.2 13.354
12420
270
8,346 19,009 97,4370.9 0.1 0.7
14.6 11.8 9.02.8 13.1 8.4
.. 15,100 33,35053.1 39,997 48,783
667 1,312 1,94816.3 16.7 8.1
1,106 1,973 2,94242.1 39.0 72.955.8 53.7 21.3
1.6 2.7 5.5
54,966 22,810 8,5501.2 2.0 5.685 68 6685 94 9365 81 8691 98 9871 79 7337 59 6281 84 81
42 28 42.. .. .... .. ..
18 19 20
25.4 21.1 36.412.2 12.2 11.8
2.3 5.0 3.32.0 4.5 5.77.9 1.9 1.60.0 0.0 0.00.2 0.2 0.70.4 0.3 0.75.0 6.8 19.2
168 2013 The Little Green Data Book
Country data
Latin America & Caribbean
group
Upper middle-income group
Population (millions) 29.4 Land area (1,000 sq. km) 1,280 GDP ($ billions) 176.9
Peru

GNI per capita, World Bank Atlas method ($)Adjusted net national income per capita ($)Urban population (% of total)Urban population growth (avg. annual %, 1990–2011) AgricultureAgricultural land (% land area)Agricultural irrigated land (% of total agricultural land)Agricultural productivity, value added per worker (2000 $)Cereal yield (kg per hectare) Forests and biodiversityForest area (% land area)Deforestation (avg. annual %, 2000–2010)Terrestrial protected areas (% of total land area)Threatened species, mammalsThreatened species, birdsThreatened species, fishThreatened species, higher plants OceansTotal fisheries production (thousand metric tons)
Capture fisheries growth (avg. annual %, 1990–2011)Aquaculture growth (avg. annual %, 1990–2011)
Marine protected areas (% of territorial waters)Coral reef area (sq. km)Mangroves area (sq. km) Energy and emissionsEnergy use per capita (kg oil equivalent)Energy from biomass products and waste (% of total)Electric power consumption per capita (kWh)Electricity generated using fossil fuel (% of total)Electricity generated by hydropower (% of total)CO2 emissions per capita (metric tons) Water and sanitationInternal freshwater resources per capita (cu. m)Total freshwater withdrawal (% of internal resources)
Agriculture (% of total freshwater withdrawal)Access to improved water source (% of total population)
Rural (% of rural population)Urban (% of urban population)
Access to improved sanitation (% of total population)Rural (% of rural population)Urban (% of urban population)
Environment and healthParticulate matter (urban-pop.-weighted avg., µg/cu. m)Acute resp. infection prevalence (% of children under five)Diarrhea prevalence (% of children under five)Under-five mortality rate (per 1,000 live births) National accounting aggregates—savings, depletion and degradationGross savings (% of GNI)Consumption of fixed capital (% of GNI)Education expenditure (% of GNI)Energy depletion (% of GNI)Mineral depletion (% of GNI)Net forest depletion (% of GNI)CO2 damage (% of GNI)Particulate emissions damage (% of GNI)Adjusted net savings (% of GNI)
2,210 4,248 1,7722,084 3,884 1,59548.9 48.6 38.7
2.1 3.6 2.7
41 48 469.4 .. ..
1,143 610 7163,341 5,050 3,065
25.9 29.7 28.4–0.7 –0.4 0.310.9 15.0 9.9
387473
212
4,975 101,299 40,2381.2 3.4 2.46.7 9.1 10.02.5 1.4 2.9
25,060 137,690 143,4402,565 56,537 60,301
434 1,520 66717.0 10.9 26.2643 2,337 69873.7 79.8 73.011.5 16.5 17.4
0.7 4.6 1.6
5,050 4,446 3,12117.0 10.9 20.2
82 73 8892 90 8792 84 8493 97 9374 66 4769 58 3579 76 66
17 55 535 .. ..9 .. ..
25 21 62
25.0 49.3 29.79.8 11.0 9.92.4 2.1 3.10.5 4.3 6.32.1 1.7 1.20.1 0.0 0.30.3 0.9 0.70.0 1.1 0.6
14.6 32.2 14.7
169The Little Green Data Book 2013
Population (millions) 94.9 Land area (1,000 sq. km) 298 GDP ($ billions) 224.8
Country data
East Asia & Pacific
group
Lower middle-income group
Philippines

GNI per capita, World Bank Atlas method ($)Adjusted net national income per capita ($)Urban population (% of total)Urban population growth (avg. annual %, 1990–2011) AgricultureAgricultural land (% land area)Agricultural irrigated land (% of total agricultural land)Agricultural productivity, value added per worker (2000 $)Cereal yield (kg per hectare) Forests and biodiversityForest area (% land area)Deforestation (avg. annual %, 2000–2010)Terrestrial protected areas (% of total land area)Threatened species, mammalsThreatened species, birdsThreatened species, fishThreatened species, higher plants OceansTotal fisheries production (thousand metric tons)
Capture fisheries growth (avg. annual %, 1990–2011)Aquaculture growth (avg. annual %, 1990–2011)
Marine protected areas (% of territorial waters)Coral reef area (sq. km)Mangroves area (sq. km) Energy and emissionsEnergy use per capita (kg oil equivalent)Energy from biomass products and waste (% of total)Electric power consumption per capita (kWh)Electricity generated using fossil fuel (% of total)Electricity generated by hydropower (% of total)CO2 emissions per capita (metric tons) Water and sanitationInternal freshwater resources per capita (cu. m)Total freshwater withdrawal (% of internal resources)
Agriculture (% of total freshwater withdrawal)Access to improved water source (% of total population)
Rural (% of rural population)Urban (% of urban population)
Access to improved sanitation (% of total population)Rural (% of rural population)Urban (% of urban population)
Environment and healthParticulate matter (urban-pop.-weighted avg., µg/cu. m)Acute resp. infection prevalence (% of children under five)Diarrhea prevalence (% of children under five)Under-five mortality rate (per 1,000 live births) National accounting aggregates—savings, depletion and degradationGross savings (% of GNI)Consumption of fixed capital (% of GNI)Education expenditure (% of GNI)Energy depletion (% of GNI)Mineral depletion (% of GNI)Net forest depletion (% of GNI)CO2 damage (% of GNI)Particulate emissions damage (% of GNI)Adjusted net savings (% of GNI)
12,380 39,86010,975 34,611
60.9 80.50.0 1.1
49 370.4 ..
2,994 26,5153,358 5,349
30.8 28.4–0.3 0.022.4 12.9
5879
221 28,774–4.0 –1.70.5 1.84.1 16.5
.. 81,970
.. 15,496
2,657 5,0007.5 4.4
3,783 9,41592.9 62.0
1.9 11.27.8 11.4
1,391 8,19522.3 10.3
10 41.. 100.. 98
100 10090 10080 9996 100
33 22.. .... ..6 6
17.6 17.912.8 13.9
5.0 4.61.1 1.40.5 0.20.1 0.00.5 0.20.4 0.19.2 6.6
170 2013 The Little Green Data Book
Country data
High-income group
Population (millions) 38.5 Land area (1,000 sq. km) 304 GDP ($ billions) 514.5
Poland

GNI per capita, World Bank Atlas method ($)Adjusted net national income per capita ($)Urban population (% of total)Urban population growth (avg. annual %, 1990–2011) AgricultureAgricultural land (% land area)Agricultural irrigated land (% of total agricultural land)Agricultural productivity, value added per worker (2000 $)Cereal yield (kg per hectare) Forests and biodiversityForest area (% land area)Deforestation (avg. annual %, 2000–2010)Terrestrial protected areas (% of total land area)Threatened species, mammalsThreatened species, birdsThreatened species, fishThreatened species, higher plants OceansTotal fisheries production (thousand metric tons)
Capture fisheries growth (avg. annual %, 1990–2011)Aquaculture growth (avg. annual %, 1990–2011)
Marine protected areas (% of territorial waters)Coral reef area (sq. km)Mangroves area (sq. km) Energy and emissionsEnergy use per capita (kg oil equivalent)Energy from biomass products and waste (% of total)Electric power consumption per capita (kWh)Electricity generated using fossil fuel (% of total)Electricity generated by hydropower (% of total)CO2 emissions per capita (metric tons) Water and sanitationInternal freshwater resources per capita (cu. m)Total freshwater withdrawal (% of internal resources)
Agriculture (% of total freshwater withdrawal)Access to improved water source (% of total population)
Rural (% of rural population)Urban (% of urban population)
Access to improved sanitation (% of total population)Rural (% of rural population)Urban (% of urban population)
Environment and healthParticulate matter (urban-pop.-weighted avg., µg/cu. m)Acute resp. infection prevalence (% of children under five)Diarrhea prevalence (% of children under five)Under-five mortality rate (per 1,000 live births) National accounting aggregates—savings, depletion and degradationGross savings (% of GNI)Consumption of fixed capital (% of GNI)Education expenditure (% of GNI)Energy depletion (% of GNI)Mineral depletion (% of GNI)Net forest depletion (% of GNI)CO2 damage (% of GNI)Particulate emissions damage (% of GNI)Adjusted net savings (% of GNI)
21,370 39,86017,468 34,611
61.0 80.51.4 1.1
40 3712.7 ..
7,019 26,5153,459 5,349
37.8 28.4–0.1 0.08.3 12.9119
5468
225 28,774–2.0 –1.73.0 1.83.1 16.5
.. 81,970
.. 15,496
2,213 5,00013.5 4.4
4,929 9,41546.6 62.030.1 11.25.4 11.4
3,600 8,19522.3 10.3
73 4199 100
100 9899 100
100 100100 99100 100
18 22.. .... ..3 6
12.2 17.919.2 13.9
5.7 4.60.0 1.40.1 0.20.0 0.00.2 0.20.0 0.1
–1.7 6.6
171The Little Green Data Book 2013
Country data
High-income group
Population (millions) 10.6 Land area (1,000 sq. km) 91 GDP ($ billions) 237.4
Portugal
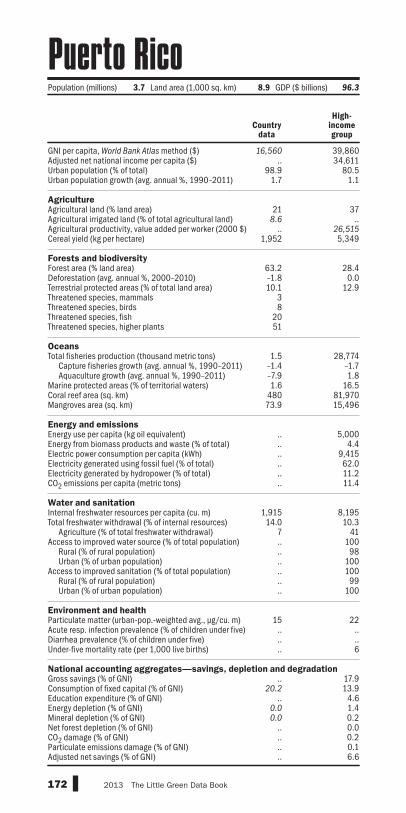
GNI per capita, World Bank Atlas method ($)Adjusted net national income per capita ($)Urban population (% of total)Urban population growth (avg. annual %, 1990–2011) AgricultureAgricultural land (% land area)Agricultural irrigated land (% of total agricultural land)Agricultural productivity, value added per worker (2000 $)Cereal yield (kg per hectare) Forests and biodiversityForest area (% land area)Deforestation (avg. annual %, 2000–2010)Terrestrial protected areas (% of total land area)Threatened species, mammalsThreatened species, birdsThreatened species, fishThreatened species, higher plants OceansTotal fisheries production (thousand metric tons)
Capture fisheries growth (avg. annual %, 1990–2011)Aquaculture growth (avg. annual %, 1990–2011)
Marine protected areas (% of territorial waters)Coral reef area (sq. km)Mangroves area (sq. km) Energy and emissionsEnergy use per capita (kg oil equivalent)Energy from biomass products and waste (% of total)Electric power consumption per capita (kWh)Electricity generated using fossil fuel (% of total)Electricity generated by hydropower (% of total)CO2 emissions per capita (metric tons) Water and sanitationInternal freshwater resources per capita (cu. m)Total freshwater withdrawal (% of internal resources)
Agriculture (% of total freshwater withdrawal)Access to improved water source (% of total population)
Rural (% of rural population)Urban (% of urban population)
Access to improved sanitation (% of total population)Rural (% of rural population)Urban (% of urban population)
Environment and healthParticulate matter (urban-pop.-weighted avg., µg/cu. m)Acute resp. infection prevalence (% of children under five)Diarrhea prevalence (% of children under five)Under-five mortality rate (per 1,000 live births) National accounting aggregates—savings, depletion and degradationGross savings (% of GNI)Consumption of fixed capital (% of GNI)Education expenditure (% of GNI)Energy depletion (% of GNI)Mineral depletion (% of GNI)Net forest depletion (% of GNI)CO2 damage (% of GNI)Particulate emissions damage (% of GNI)Adjusted net savings (% of GNI)
16,560 39,860.. 34,611
98.9 80.51.7 1.1
21 378.6 ..
.. 26,5151,952 5,349
63.2 28.4–1.8 0.010.1 12.9
38
2051
1.5 28,774–1.4 –1.7–7.9 1.81.6 16.5
480 81,97073.9 15,496
.. 5,000
.. 4.4
.. 9,415
.. 62.0
.. 11.2
.. 11.4
1,915 8,19514.0 10.3
7 41.. 100.. 98.. 100.. 100.. 99.. 100
15 22.. .... .... 6
.. 17.920.2 13.9
.. 4.60.0 1.40.0 0.2
.. 0.0
.. 0.2
.. 0.1
.. 6.6
172 2013 The Little Green Data Book
Population (millions) 3.7 Land area (1,000 sq. km) 8.9 GDP ($ billions) 96.3
Country data
High-income group
Puerto Rico

GNI per capita, World Bank Atlas method ($)Adjusted net national income per capita ($)Urban population (% of total)Urban population growth (avg. annual %, 1990–2011) AgricultureAgricultural land (% land area)Agricultural irrigated land (% of total agricultural land)Agricultural productivity, value added per worker (2000 $)Cereal yield (kg per hectare) Forests and biodiversityForest area (% land area)Deforestation (avg. annual %, 2000–2010)Terrestrial protected areas (% of total land area)Threatened species, mammalsThreatened species, birdsThreatened species, fishThreatened species, higher plants OceansTotal fisheries production (thousand metric tons)
Capture fisheries growth (avg. annual %, 1990–2011)Aquaculture growth (avg. annual %, 1990–2011)
Marine protected areas (% of territorial waters)Coral reef area (sq. km)Mangroves area (sq. km) Energy and emissionsEnergy use per capita (kg oil equivalent)Energy from biomass products and waste (% of total)Electric power consumption per capita (kWh)Electricity generated using fossil fuel (% of total)Electricity generated by hydropower (% of total)CO2 emissions per capita (metric tons) Water and sanitationInternal freshwater resources per capita (cu. m)Total freshwater withdrawal (% of internal resources)
Agriculture (% of total freshwater withdrawal)Access to improved water source (% of total population)
Rural (% of rural population)Urban (% of urban population)
Access to improved sanitation (% of total population)Rural (% of rural population)Urban (% of urban population)
Environment and healthParticulate matter (urban-pop.-weighted avg., µg/cu. m)Acute resp. infection prevalence (% of children under five)Diarrhea prevalence (% of children under five)Under-five mortality rate (per 1,000 live births) National accounting aggregates—savings, depletion and degradationGross savings (% of GNI)Consumption of fixed capital (% of GNI)Education expenditure (% of GNI)Energy depletion (% of GNI)Mineral depletion (% of GNI)Net forest depletion (% of GNI)CO2 damage (% of GNI)Particulate emissions damage (% of GNI)Adjusted net savings (% of GNI)
80,440 39,860.. 34,611
98.8 80.56.8 1.1
6 37.. .... 26,515
6,050 5,349
0.0 28.40.0 0.02.5 12.9
34
110
13.0 28,7744.0 –1.7
.. 1.80.25 16.5700 81,97012.3 15,496
12,799 5,0000.0 4.4
14,997 9,415100.0 62.0
0.0 11.244.0 11.4
30 8,195792.9 10.3
59 41100 100100 98100 100100 100100 99100 100
20 22.. .... ..8 6
.. 17.915.4 13.91.9 4.6
18.3 1.40.0 0.2
.. 0.00.5 0.20.0 0.1
.. 6.6
173The Little Green Data Book 2013
Country data
High-income group
Population (millions) 1.9 Land area (1,000 sq. km) 12 GDP ($ billions) 173.0
Qatar
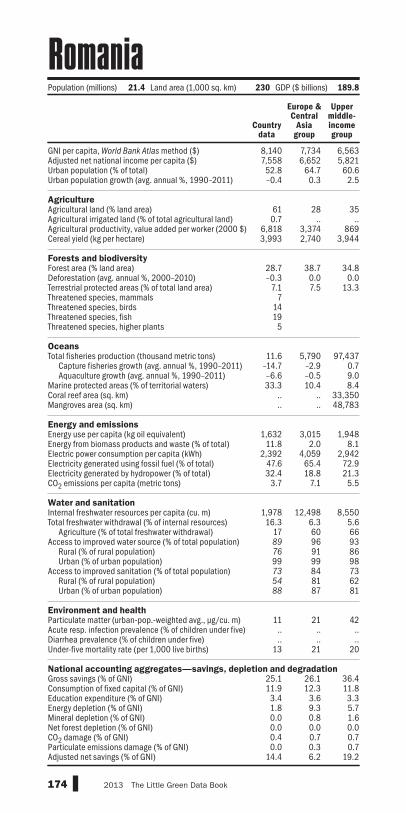
GNI per capita, World Bank Atlas method ($)Adjusted net national income per capita ($)Urban population (% of total)Urban population growth (avg. annual %, 1990–2011) AgricultureAgricultural land (% land area)Agricultural irrigated land (% of total agricultural land)Agricultural productivity, value added per worker (2000 $)Cereal yield (kg per hectare) Forests and biodiversityForest area (% land area)Deforestation (avg. annual %, 2000–2010)Terrestrial protected areas (% of total land area)Threatened species, mammalsThreatened species, birdsThreatened species, fishThreatened species, higher plants OceansTotal fisheries production (thousand metric tons)
Capture fisheries growth (avg. annual %, 1990–2011)Aquaculture growth (avg. annual %, 1990–2011)
Marine protected areas (% of territorial waters)Coral reef area (sq. km)Mangroves area (sq. km) Energy and emissionsEnergy use per capita (kg oil equivalent)Energy from biomass products and waste (% of total)Electric power consumption per capita (kWh)Electricity generated using fossil fuel (% of total)Electricity generated by hydropower (% of total)CO2 emissions per capita (metric tons) Water and sanitationInternal freshwater resources per capita (cu. m)Total freshwater withdrawal (% of internal resources)
Agriculture (% of total freshwater withdrawal)Access to improved water source (% of total population)
Rural (% of rural population)Urban (% of urban population)
Access to improved sanitation (% of total population)Rural (% of rural population)Urban (% of urban population)
Environment and healthParticulate matter (urban-pop.-weighted avg., µg/cu. m)Acute resp. infection prevalence (% of children under five)Diarrhea prevalence (% of children under five)Under-five mortality rate (per 1,000 live births) National accounting aggregates—savings, depletion and degradationGross savings (% of GNI)Consumption of fixed capital (% of GNI)Education expenditure (% of GNI)Energy depletion (% of GNI)Mineral depletion (% of GNI)Net forest depletion (% of GNI)CO2 damage (% of GNI)Particulate emissions damage (% of GNI)Adjusted net savings (% of GNI)
8,140 7,734 6,5637,558 6,652 5,82152.8 64.7 60.6–0.4 0.3 2.5
61 28 350.7 .. ..
6,818 3,374 8693,993 2,740 3,944
28.7 38.7 34.8–0.3 0.0 0.0
7.1 7.5 13.37
1419
5
11.6 5,790 97,437–14.7 –2.9 0.7–6.6 –0.5 9.033.3 10.4 8.4
.. .. 33,350
.. .. 48,783
1,632 3,015 1,94811.8 2.0 8.1
2,392 4,059 2,94247.6 65.4 72.932.4 18.8 21.3
3.7 7.1 5.5
1,978 12,498 8,55016.3 6.3 5.6
17 60 6689 96 9376 91 8699 99 9873 84 7354 81 6288 87 81
11 21 42.. .. .... .. ..
13 21 20
25.1 26.1 36.411.9 12.3 11.83.4 3.6 3.31.8 9.3 5.70.0 0.8 1.60.0 0.0 0.00.4 0.7 0.70.0 0.3 0.7
14.4 6.2 19.2
174 2013 The Little Green Data Book
Population (millions) 21.4 Land area (1,000 sq. km) 230 GDP ($ billions) 189.8
Country data
Europe & Central
Asia group
Upper middle-income group
Romania

GNI per capita, World Bank Atlas method ($)Adjusted net national income per capita ($)Urban population (% of total)Urban population growth (avg. annual %, 1990–2011) AgricultureAgricultural land (% land area)Agricultural irrigated land (% of total agricultural land)Agricultural productivity, value added per worker (2000 $)Cereal yield (kg per hectare) Forests and biodiversityForest area (% land area)Deforestation (avg. annual %, 2000–2010)Terrestrial protected areas (% of total land area)Threatened species, mammalsThreatened species, birdsThreatened species, fishThreatened species, higher plants OceansTotal fisheries production (thousand metric tons)
Capture fisheries growth (avg. annual %, 1990–2011)Aquaculture growth (avg. annual %, 1990–2011)
Marine protected areas (% of territorial waters)Coral reef area (sq. km)Mangroves area (sq. km) Energy and emissionsEnergy use per capita (kg oil equivalent)Energy from biomass products and waste (% of total)Electric power consumption per capita (kWh)Electricity generated using fossil fuel (% of total)Electricity generated by hydropower (% of total)CO2 emissions per capita (metric tons) Water and sanitationInternal freshwater resources per capita (cu. m)Total freshwater withdrawal (% of internal resources)
Agriculture (% of total freshwater withdrawal)Access to improved water source (% of total population)
Rural (% of rural population)Urban (% of urban population)
Access to improved sanitation (% of total population)Rural (% of rural population)Urban (% of urban population)
Environment and healthParticulate matter (urban-pop.-weighted avg., µg/cu. m)Acute resp. infection prevalence (% of children under five)Diarrhea prevalence (% of children under five)Under-five mortality rate (per 1,000 live births) National accounting aggregates—savings, depletion and degradationGross savings (% of GNI)Consumption of fixed capital (% of GNI)Education expenditure (% of GNI)Energy depletion (% of GNI)Mineral depletion (% of GNI)Net forest depletion (% of GNI)CO2 damage (% of GNI)Particulate emissions damage (% of GNI)Adjusted net savings (% of GNI)
10,650 7,734 6,5639,179 6,652 5,82173.8 64.7 60.6–0.1 0.3 2.5
13 28 352.0 .. ..
3,281 3,374 8692,262 2,740 3,944
49.4 38.7 34.80.0 0.0 0.09.1 7.5 13.3315236
8
4,391 5,790 97,437–2.6 –2.9 0.7–3.3 –0.5 9.010.8 10.4 8.4
.. .. 33,350
.. .. 48,783
4,927 3,015 1,9481.0 2.0 8.1
6,431 4,059 2,94267.1 65.4 72.916.1 18.8 21.311.1 7.1 5.5
30,169 12,498 8,5501.5 6.3 5.620 60 6697 96 9392 91 8699 99 9870 84 7359 81 6274 87 81
15 21 42.. .. .... .. ..
12 21 20
31.4 26.1 36.412.7 12.3 11.83.5 3.6 3.3
13.2 9.3 5.71.1 0.8 1.60.0 0.0 0.00.7 0.7 0.70.1 0.3 0.77.1 6.2 19.2
175The Little Green Data Book 2013
Country data
Europe & Central
Asia group
Upper middle-income group
Population (millions) 143.0 Land area (1,000 sq. km) 16,377 GDP ($ billions) 1,857.8
Russian Federation

GNI per capita, World Bank Atlas method ($)Adjusted net national income per capita ($)Urban population (% of total)Urban population growth (avg. annual %, 1990–2011) AgricultureAgricultural land (% land area)Agricultural irrigated land (% of total agricultural land)Agricultural productivity, value added per worker (2000 $)Cereal yield (kg per hectare) Forests and biodiversityForest area (% land area)Deforestation (avg. annual %, 2000–2010)Terrestrial protected areas (% of total land area)Threatened species, mammalsThreatened species, birdsThreatened species, fishThreatened species, higher plants OceansTotal fisheries production (thousand metric tons)
Capture fisheries growth (avg. annual %, 1990–2011)Aquaculture growth (avg. annual %, 1990–2011)
Marine protected areas (% of territorial waters)Coral reef area (sq. km)Mangroves area (sq. km) Energy and emissionsEnergy use per capita (kg oil equivalent)Energy from biomass products and waste (% of total)Electric power consumption per capita (kWh)Electricity generated using fossil fuel (% of total)Electricity generated by hydropower (% of total)CO2 emissions per capita (metric tons) Water and sanitationInternal freshwater resources per capita (cu. m)Total freshwater withdrawal (% of internal resources)
Agriculture (% of total freshwater withdrawal)Access to improved water source (% of total population)
Rural (% of rural population)Urban (% of urban population)
Access to improved sanitation (% of total population)Rural (% of rural population)Urban (% of urban population)
Environment and healthParticulate matter (urban-pop.-weighted avg., µg/cu. m)Acute resp. infection prevalence (% of children under five)Diarrhea prevalence (% of children under five)Under-five mortality rate (per 1,000 live births) National accounting aggregates—savings, depletion and degradationGross savings (% of GNI)Consumption of fixed capital (% of GNI)Education expenditure (% of GNI)Energy depletion (% of GNI)Mineral depletion (% of GNI)Net forest depletion (% of GNI)CO2 damage (% of GNI)Particulate emissions damage (% of GNI)Adjusted net savings (% of GNI)
570 1,258 571515 1,022 52119.1 36.5 28.08.1 3.8 3.5
78 44 39.. .. ..
257 334 3081,950 1,361 2,034
18.0 27.8 25.7–2.4 0.5 0.610.0 11.7 10.0
201495
17.8 6,383 11,5639.9 1.8 4.06.6 16.0 4.9
.. 5.8 ..
.. 17,980 15,120
.. 27,808 25,818
.. 683 363
.. 58.2 66.2
.. 553 242
.. 65.2 32.0
.. 18.7 45.30.1 0.9 0.3
868 4,455 5,1251.6 3.2 4.568 84 9065 61 6563 48 5776 83 8655 31 3756 23 3252 42 47
21 41 5415 .. ..14 .. ..54 109 95
11.4 18.4 25.28.0 10.9 7.74.2 3.7 3.00.0 10.4 1.40.1 2.2 2.02.8 0.5 1.20.1 0.5 0.30.1 0.4 0.54.5 –1.2 15.2
176 2013 The Little Green Data Book
Population (millions) 10.9 Land area (1,000 sq. km) 25 GDP ($ billions) 6.4
Country data
Sub-Saharan Africa group
Low-income group
Rwanda

GNI per capita, World Bank Atlas method ($)Adjusted net national income per capita ($)Urban population (% of total)Urban population growth (avg. annual %, 1990–2011) AgricultureAgricultural land (% land area)Agricultural irrigated land (% of total agricultural land)Agricultural productivity, value added per worker (2000 $)Cereal yield (kg per hectare) Forests and biodiversityForest area (% land area)Deforestation (avg. annual %, 2000–2010)Terrestrial protected areas (% of total land area)Threatened species, mammalsThreatened species, birdsThreatened species, fishThreatened species, higher plants OceansTotal fisheries production (thousand metric tons)
Capture fisheries growth (avg. annual %, 1990–2011)Aquaculture growth (avg. annual %, 1990–2011)
Marine protected areas (% of territorial waters)Coral reef area (sq. km)Mangroves area (sq. km) Energy and emissionsEnergy use per capita (kg oil equivalent)Energy from biomass products and waste (% of total)Electric power consumption per capita (kWh)Electricity generated using fossil fuel (% of total)Electricity generated by hydropower (% of total)CO2 emissions per capita (metric tons) Water and sanitationInternal freshwater resources per capita (cu. m)Total freshwater withdrawal (% of internal resources)
Agriculture (% of total freshwater withdrawal)Access to improved water source (% of total population)
Rural (% of rural population)Urban (% of urban population)
Access to improved sanitation (% of total population)Rural (% of rural population)Urban (% of urban population)
Environment and healthParticulate matter (urban-pop.-weighted avg., µg/cu. m)Acute resp. infection prevalence (% of children under five)Diarrhea prevalence (% of children under five)Under-five mortality rate (per 1,000 live births) National accounting aggregates—savings, depletion and degradationGross savings (% of GNI)Consumption of fixed capital (% of GNI)Education expenditure (% of GNI)Energy depletion (% of GNI)Mineral depletion (% of GNI)Net forest depletion (% of GNI)CO2 damage (% of GNI)Particulate emissions damage (% of GNI)Adjusted net savings (% of GNI)
3,160 4,248 1,7722,948 3,884 1,595
19.9 48.6 38.70.3 3.6 2.7
12 48 46.. .. ..
1,718 610 716.. 5,050 3,065
60.4 29.7 28.40.0 –0.4 0.33.4 15.0 9.9
26
132
11.8 101,299 40,23810.3 3.4 2.4
.. 9.1 10.00.55 1.4 2.9490 137,690 143,4403.7 56,537 60,301
320 1,520 667.. 10.9 26.2.. 2,337 698.. 79.8 73.0.. 16.5 17.4
0.9 4.6 1.6
.. 4,446 3,121
.. 10.9 20.2
.. 73 8896 90 8796 84 8496 97 9398 66 4798 58 3598 76 66
.. 55 53
.. .. ..
.. .. ..19 21 62
.. 49.3 29.711.0 11.0 9.94.4 2.1 3.10.0 4.3 6.30.0 1.7 1.20.3 0.0 0.30.2 0.9 0.7
.. 1.1 0.6
.. 32.2 14.7
177The Little Green Data Book 2013
Country data
East Asia & Pacific
group
Lower middle-income group
Population (thousands) 184 Land area (1,000 sq. km) 2.8 GDP ($ millions) 640.9
Samoa
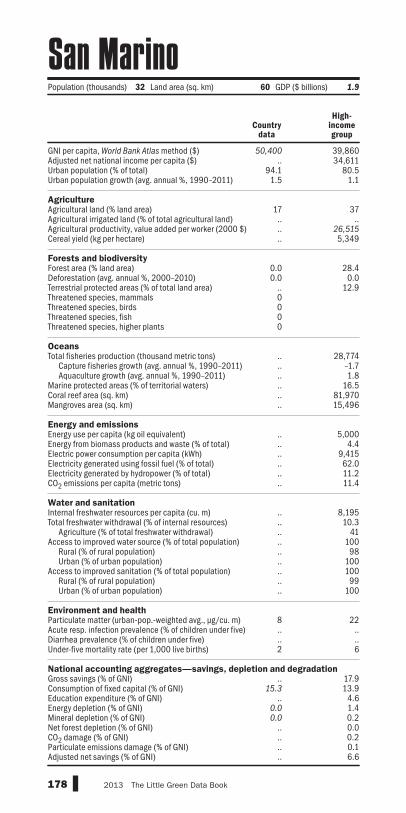
GNI per capita, World Bank Atlas method ($)Adjusted net national income per capita ($)Urban population (% of total)Urban population growth (avg. annual %, 1990–2011) AgricultureAgricultural land (% land area)Agricultural irrigated land (% of total agricultural land)Agricultural productivity, value added per worker (2000 $)Cereal yield (kg per hectare) Forests and biodiversityForest area (% land area)Deforestation (avg. annual %, 2000–2010)Terrestrial protected areas (% of total land area)Threatened species, mammalsThreatened species, birdsThreatened species, fishThreatened species, higher plants OceansTotal fisheries production (thousand metric tons)
Capture fisheries growth (avg. annual %, 1990–2011)Aquaculture growth (avg. annual %, 1990–2011)
Marine protected areas (% of territorial waters)Coral reef area (sq. km)Mangroves area (sq. km) Energy and emissionsEnergy use per capita (kg oil equivalent)Energy from biomass products and waste (% of total)Electric power consumption per capita (kWh)Electricity generated using fossil fuel (% of total)Electricity generated by hydropower (% of total)CO2 emissions per capita (metric tons) Water and sanitationInternal freshwater resources per capita (cu. m)Total freshwater withdrawal (% of internal resources)
Agriculture (% of total freshwater withdrawal)Access to improved water source (% of total population)
Rural (% of rural population)Urban (% of urban population)
Access to improved sanitation (% of total population)Rural (% of rural population)Urban (% of urban population)
Environment and healthParticulate matter (urban-pop.-weighted avg., µg/cu. m)Acute resp. infection prevalence (% of children under five)Diarrhea prevalence (% of children under five)Under-five mortality rate (per 1,000 live births) National accounting aggregates—savings, depletion and degradationGross savings (% of GNI)Consumption of fixed capital (% of GNI)Education expenditure (% of GNI)Energy depletion (% of GNI)Mineral depletion (% of GNI)Net forest depletion (% of GNI)CO2 damage (% of GNI)Particulate emissions damage (% of GNI)Adjusted net savings (% of GNI)
50,400 39,860.. 34,611
94.1 80.51.5 1.1
17 37.. .... 26,515.. 5,349
0.0 28.40.0 0.0
.. 12.90000
.. 28,774
.. –1.7
.. 1.8
.. 16.5
.. 81,970
.. 15,496
.. 5,000
.. 4.4
.. 9,415
.. 62.0
.. 11.2
.. 11.4
.. 8,195
.. 10.3
.. 41
.. 100
.. 98
.. 100
.. 100
.. 99
.. 100
8 22.. .... ..2 6
.. 17.915.3 13.9
.. 4.60.0 1.40.0 0.2
.. 0.0
.. 0.2
.. 0.1
.. 6.6
178 2013 The Little Green Data Book
Country data
High-income group
Population (thousands) 32 Land area (sq. km) 60 GDP ($ billions) 1.9
San Marino

GNI per capita, World Bank Atlas method ($)Adjusted net national income per capita ($)Urban population (% of total)Urban population growth (avg. annual %, 1990–2011) AgricultureAgricultural land (% land area)Agricultural irrigated land (% of total agricultural land)Agricultural productivity, value added per worker (2000 $)Cereal yield (kg per hectare) Forests and biodiversityForest area (% land area)Deforestation (avg. annual %, 2000–2010)Terrestrial protected areas (% of total land area)Threatened species, mammalsThreatened species, birdsThreatened species, fishThreatened species, higher plants OceansTotal fisheries production (thousand metric tons)
Capture fisheries growth (avg. annual %, 1990–2011)Aquaculture growth (avg. annual %, 1990–2011)
Marine protected areas (% of territorial waters)Coral reef area (sq. km)Mangroves area (sq. km) Energy and emissionsEnergy use per capita (kg oil equivalent)Energy from biomass products and waste (% of total)Electric power consumption per capita (kWh)Electricity generated using fossil fuel (% of total)Electricity generated by hydropower (% of total)CO2 emissions per capita (metric tons) Water and sanitationInternal freshwater resources per capita (cu. m)Total freshwater withdrawal (% of internal resources)
Agriculture (% of total freshwater withdrawal)Access to improved water source (% of total population)
Rural (% of rural population)Urban (% of urban population)
Access to improved sanitation (% of total population)Rural (% of rural population)Urban (% of urban population)
Environment and healthParticulate matter (urban-pop.-weighted avg., µg/cu. m)Acute resp. infection prevalence (% of children under five)Diarrhea prevalence (% of children under five)Under-five mortality rate (per 1,000 live births) National accounting aggregates—savings, depletion and degradationGross savings (% of GNI)Consumption of fixed capital (% of GNI)Education expenditure (% of GNI)Energy depletion (% of GNI)Mineral depletion (% of GNI)Net forest depletion (% of GNI)CO2 damage (% of GNI)Particulate emissions damage (% of GNI)Adjusted net savings (% of GNI)
1,350 1,258 1,7721,328 1,022 1,595
62.7 36.5 38.73.5 3.8 2.7
51 44 46.. .. .... 334 716
3,000 1,361 3,065
28.1 27.8 28.40.0 0.5 0.3
.. 11.7 9.95
131434
3.9 6,383 40,2380.1 1.8 2.4
.. 16.0 10.0
.. 5.8 2.9
.. 17,980 143,4401.4 27,808 60,301
280 683 667.. 58.2 26.2.. 553 698.. 65.2 73.0.. 18.7 17.4
0.8 0.9 1.6
12,936 4,455 3,1210.3 3.2 20.2
.. 84 8889 61 8788 48 8489 83 9326 31 4719 23 3530 42 66
28 41 53.. .. .... .. ..
89 109 62
.. 18.4 29.79.2 10.9 9.9
.. 3.7 3.10.0 10.4 6.30.0 2.2 1.20.7 0.5 0.30.5 0.5 0.70.2 0.4 0.6
.. –1.2 14.7
179The Little Green Data Book 2013
Country data
Sub-Saharan Africa group
Lower middle-income group
Population (thousands) 169 Land area (sq. km) 960 GDP ($ millions) 248.3
São Tomé and Príncipe
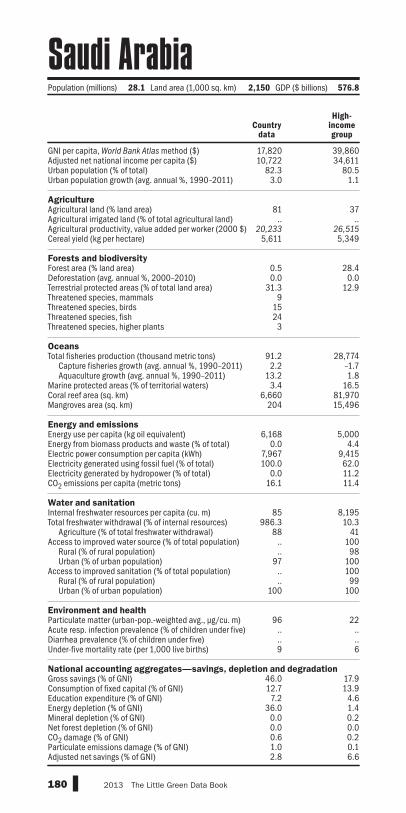
GNI per capita, World Bank Atlas method ($)Adjusted net national income per capita ($)Urban population (% of total)Urban population growth (avg. annual %, 1990–2011) AgricultureAgricultural land (% land area)Agricultural irrigated land (% of total agricultural land)Agricultural productivity, value added per worker (2000 $)Cereal yield (kg per hectare) Forests and biodiversityForest area (% land area)Deforestation (avg. annual %, 2000–2010)Terrestrial protected areas (% of total land area)Threatened species, mammalsThreatened species, birdsThreatened species, fishThreatened species, higher plants OceansTotal fisheries production (thousand metric tons)
Capture fisheries growth (avg. annual %, 1990–2011)Aquaculture growth (avg. annual %, 1990–2011)
Marine protected areas (% of territorial waters)Coral reef area (sq. km)Mangroves area (sq. km) Energy and emissionsEnergy use per capita (kg oil equivalent)Energy from biomass products and waste (% of total)Electric power consumption per capita (kWh)Electricity generated using fossil fuel (% of total)Electricity generated by hydropower (% of total)CO2 emissions per capita (metric tons) Water and sanitationInternal freshwater resources per capita (cu. m)Total freshwater withdrawal (% of internal resources)
Agriculture (% of total freshwater withdrawal)Access to improved water source (% of total population)
Rural (% of rural population)Urban (% of urban population)
Access to improved sanitation (% of total population)Rural (% of rural population)Urban (% of urban population)
Environment and healthParticulate matter (urban-pop.-weighted avg., µg/cu. m)Acute resp. infection prevalence (% of children under five)Diarrhea prevalence (% of children under five)Under-five mortality rate (per 1,000 live births) National accounting aggregates—savings, depletion and degradationGross savings (% of GNI)Consumption of fixed capital (% of GNI)Education expenditure (% of GNI)Energy depletion (% of GNI)Mineral depletion (% of GNI)Net forest depletion (% of GNI)CO2 damage (% of GNI)Particulate emissions damage (% of GNI)Adjusted net savings (% of GNI)
17,820 39,86010,722 34,611
82.3 80.53.0 1.1
81 37.. ..
20,233 26,5155,611 5,349
0.5 28.40.0 0.0
31.3 12.99
15243
91.2 28,7742.2 –1.7
13.2 1.83.4 16.5
6,660 81,970204 15,496
6,168 5,0000.0 4.4
7,967 9,415100.0 62.0
0.0 11.216.1 11.4
85 8,195986.3 10.3
88 41.. 100.. 98
97 100.. 100.. 99
100 100
96 22.. .... ..9 6
46.0 17.912.7 13.9
7.2 4.636.0 1.4
0.0 0.20.0 0.00.6 0.21.0 0.12.8 6.6
180 2013 The Little Green Data Book
Country data
High-income group
Population (millions) 28.1 Land area (1,000 sq. km) 2,150 GDP ($ billions) 576.8
Saudi Arabia

GNI per capita, World Bank Atlas method ($)Adjusted net national income per capita ($)Urban population (% of total)Urban population growth (avg. annual %, 1990–2011) AgricultureAgricultural land (% land area)Agricultural irrigated land (% of total agricultural land)Agricultural productivity, value added per worker (2000 $)Cereal yield (kg per hectare) Forests and biodiversityForest area (% land area)Deforestation (avg. annual %, 2000–2010)Terrestrial protected areas (% of total land area)Threatened species, mammalsThreatened species, birdsThreatened species, fishThreatened species, higher plants OceansTotal fisheries production (thousand metric tons)
Capture fisheries growth (avg. annual %, 1990–2011)Aquaculture growth (avg. annual %, 1990–2011)
Marine protected areas (% of territorial waters)Coral reef area (sq. km)Mangroves area (sq. km) Energy and emissionsEnergy use per capita (kg oil equivalent)Energy from biomass products and waste (% of total)Electric power consumption per capita (kWh)Electricity generated using fossil fuel (% of total)Electricity generated by hydropower (% of total)CO2 emissions per capita (metric tons) Water and sanitationInternal freshwater resources per capita (cu. m)Total freshwater withdrawal (% of internal resources)
Agriculture (% of total freshwater withdrawal)Access to improved water source (% of total population)
Rural (% of rural population)Urban (% of urban population)
Access to improved sanitation (% of total population)Rural (% of rural population)Urban (% of urban population)
Environment and healthParticulate matter (urban-pop.-weighted avg., µg/cu. m)Acute resp. infection prevalence (% of children under five)Diarrhea prevalence (% of children under five)Under-five mortality rate (per 1,000 live births) National accounting aggregates—savings, depletion and degradationGross savings (% of GNI)Consumption of fixed capital (% of GNI)Education expenditure (% of GNI)Energy depletion (% of GNI)Mineral depletion (% of GNI)Net forest depletion (% of GNI)CO2 damage (% of GNI)Particulate emissions damage (% of GNI)Adjusted net savings (% of GNI)
1,070 1,258 1,772990 1,022 1,59542.6 36.5 38.7
3.1 3.8 2.7
49 44 460.7 .. ..
233 334 716966 1,361 3,065
43.8 27.8 28.40.5 0.5 0.3
24.1 11.7 9.9161345
9
427 6,383 40,2381.5 1.8 2.4
20.2 16.0 10.012.4 5.8 2.9
.. 17,980 143,4401,279 27,808 60,301
272 683 66746.3 58.2 26.2195 553 698
88.1 65.2 73.08.4 18.7 17.40.4 0.9 1.6
2,021 4,455 3,1218.6 3.2 20.293 84 8872 61 8756 48 8493 83 9352 31 4739 23 3570 42 66
77 41 5313 .. ..22 .. ..65 109 62
22.0 18.4 29.78.9 10.9 9.95.2 3.7 3.10.0 10.4 6.31.6 2.2 1.20.0 0.5 0.30.3 0.5 0.70.7 0.4 0.6
17.3 –1.2 14.7
181The Little Green Data Book 2013
Population (millions) 12.8 Land area (1,000 sq. km) 193 GDP ($ billions) 14.3
Country data
Sub-Saharan Africa group
Lower middle-income group
Senegal

GNI per capita, World Bank Atlas method ($)Adjusted net national income per capita ($)Urban population (% of total)Urban population growth (avg. annual %, 1990–2011) AgricultureAgricultural land (% land area)Agricultural irrigated land (% of total agricultural land)Agricultural productivity, value added per worker (2000 $)Cereal yield (kg per hectare) Forests and biodiversityForest area (% land area)Deforestation (avg. annual %, 2000–2010)Terrestrial protected areas (% of total land area)Threatened species, mammalsThreatened species, birdsThreatened species, fishThreatened species, higher plants OceansTotal fisheries production (thousand metric tons)
Capture fisheries growth (avg. annual %, 1990–2011)Aquaculture growth (avg. annual %, 1990–2011)
Marine protected areas (% of territorial waters)Coral reef area (sq. km)Mangroves area (sq. km) Energy and emissionsEnergy use per capita (kg oil equivalent)Energy from biomass products and waste (% of total)Electric power consumption per capita (kWh)Electricity generated using fossil fuel (% of total)Electricity generated by hydropower (% of total)CO2 emissions per capita (metric tons) Water and sanitationInternal freshwater resources per capita (cu. m)Total freshwater withdrawal (% of internal resources)
Agriculture (% of total freshwater withdrawal)Access to improved water source (% of total population)
Rural (% of rural population)Urban (% of urban population)
Access to improved sanitation (% of total population)Rural (% of rural population)Urban (% of urban population)
Environment and healthParticulate matter (urban-pop.-weighted avg., µg/cu. m)Acute resp. infection prevalence (% of children under five)Diarrhea prevalence (% of children under five)Under-five mortality rate (per 1,000 live births) National accounting aggregates—savings, depletion and degradationGross savings (% of GNI)Consumption of fixed capital (% of GNI)Education expenditure (% of GNI)Energy depletion (% of GNI)Mineral depletion (% of GNI)Net forest depletion (% of GNI)CO2 damage (% of GNI)Particulate emissions damage (% of GNI)Adjusted net savings (% of GNI)
5,690 7,734 6,563.. 6,652 5,821
56.4 64.7 60.60.3 0.3 2.5
58 28 350.7 .. ..
2,057 3,374 8694,753 2,740 3,944
31.6 38.7 34.8–1.0 0.0 0.06.0 7.5 13.3
611113
13.0 5,790 97,437.. –2.9 0.7.. –0.5 9.0.. 10.4 8.4.. .. 33,350.. .. 48,783
2,141 3,015 1,9486.6 2.0 8.1
4,359 4,059 2,94268.2 65.4 72.931.8 18.8 21.36.3 7.1 5.5
1,158 12,498 8,55049.0 6.3 5.6
2 60 6699 96 9398 91 8699 99 9892 84 7388 81 6296 87 81
.. 21 42
.. .. ..
.. .. ..7 21 20
16.9 26.1 36.411.6 12.3 11.85.0 3.6 3.32.4 9.3 5.70.2 0.8 1.6
.. 0.0 0.00.9 0.7 0.7
.. 0.3 0.7
.. 6.2 19.2
182 2013 The Little Green Data Book
Country data
Europe & Central
Asia group
Upper middle-income group
Population (millions) 7.3 Land area (1,000 sq. km) 87 GDP ($ billions) 45.8
Serbia

GNI per capita, World Bank Atlas method ($)Adjusted net national income per capita ($)Urban population (% of total)Urban population growth (avg. annual %, 1990–2011) AgricultureAgricultural land (% land area)Agricultural irrigated land (% of total agricultural land)Agricultural productivity, value added per worker (2000 $)Cereal yield (kg per hectare) Forests and biodiversityForest area (% land area)Deforestation (avg. annual %, 2000–2010)Terrestrial protected areas (% of total land area)Threatened species, mammalsThreatened species, birdsThreatened species, fishThreatened species, higher plants OceansTotal fisheries production (thousand metric tons)
Capture fisheries growth (avg. annual %, 1990–2011)Aquaculture growth (avg. annual %, 1990–2011)
Marine protected areas (% of territorial waters)Coral reef area (sq. km)Mangroves area (sq. km) Energy and emissionsEnergy use per capita (kg oil equivalent)Energy from biomass products and waste (% of total)Electric power consumption per capita (kWh)Electricity generated using fossil fuel (% of total)Electricity generated by hydropower (% of total)CO2 emissions per capita (metric tons) Water and sanitationInternal freshwater resources per capita (cu. m)Total freshwater withdrawal (% of internal resources)
Agriculture (% of total freshwater withdrawal)Access to improved water source (% of total population)
Rural (% of rural population)Urban (% of urban population)
Access to improved sanitation (% of total population)Rural (% of rural population)Urban (% of urban population)
Environment and healthParticulate matter (urban-pop.-weighted avg., µg/cu. m)Acute resp. infection prevalence (% of children under five)Diarrhea prevalence (% of children under five)Under-five mortality rate (per 1,000 live births) National accounting aggregates—savings, depletion and degradationGross savings (% of GNI)Consumption of fixed capital (% of GNI)Education expenditure (% of GNI)Energy depletion (% of GNI)Mineral depletion (% of GNI)Net forest depletion (% of GNI)CO2 damage (% of GNI)Particulate emissions damage (% of GNI)Adjusted net savings (% of GNI)
11,270 1,258 6,56310,224 1,022 5,821
53.6 36.5 60.61.4 3.8 2.5
7 44 35.. .. ..
455 334 869.. 1,361 3,944
88.5 27.8 34.80.0 0.5 0.0
42.0 11.7 13.35
101855
75.4 6,383 97,43713.3 1.8 0.7
.. 16.0 9.00.51 5.8 8.4
1,690 17,980 33,35032.3 27,808 48,783
2,411 683 1,948.. 58.2 8.1.. 553 2,942.. 65.2 72.9.. 18.7 21.3
8.4 0.9 5.5
.. 4,455 8,550
.. 3.2 5.67 84 66.. 61 93.. 48 86
100 83 98.. 31 73.. 23 62
98 42 81
.. 41 42
.. .. ..
.. .. ..14 109 20
.. 18.4 36.412.8 10.9 11.8
4.6 3.7 3.30.0 10.4 5.70.0 2.2 1.60.0 0.5 0.00.6 0.5 0.7
.. 0.4 0.7
.. –1.2 19.2
183The Little Green Data Book 2013
Population (thousands) 86 Land area (sq. km) 460 GDP ($ billions) 1.1
Country data
Sub-Saharan Africa group
Upper middle-income group
Seychelles

GNI per capita, World Bank Atlas method ($)Adjusted net national income per capita ($)Urban population (% of total)Urban population growth (avg. annual %, 1990–2011) AgricultureAgricultural land (% land area)Agricultural irrigated land (% of total agricultural land)Agricultural productivity, value added per worker (2000 $)Cereal yield (kg per hectare) Forests and biodiversityForest area (% land area)Deforestation (avg. annual %, 2000–2010)Terrestrial protected areas (% of total land area)Threatened species, mammalsThreatened species, birdsThreatened species, fishThreatened species, higher plants OceansTotal fisheries production (thousand metric tons)
Capture fisheries growth (avg. annual %, 1990–2011)Aquaculture growth (avg. annual %, 1990–2011)
Marine protected areas (% of territorial waters)Coral reef area (sq. km)Mangroves area (sq. km) Energy and emissionsEnergy use per capita (kg oil equivalent)Energy from biomass products and waste (% of total)Electric power consumption per capita (kWh)Electricity generated using fossil fuel (% of total)Electricity generated by hydropower (% of total)CO2 emissions per capita (metric tons) Water and sanitationInternal freshwater resources per capita (cu. m)Total freshwater withdrawal (% of internal resources)
Agriculture (% of total freshwater withdrawal)Access to improved water source (% of total population)
Rural (% of rural population)Urban (% of urban population)
Access to improved sanitation (% of total population)Rural (% of rural population)Urban (% of urban population)
Environment and healthParticulate matter (urban-pop.-weighted avg., µg/cu. m)Acute resp. infection prevalence (% of children under five)Diarrhea prevalence (% of children under five)Under-five mortality rate (per 1,000 live births) National accounting aggregates—savings, depletion and degradationGross savings (% of GNI)Consumption of fixed capital (% of GNI)Education expenditure (% of GNI)Energy depletion (% of GNI)Mineral depletion (% of GNI)Net forest depletion (% of GNI)CO2 damage (% of GNI)Particulate emissions damage (% of GNI)Adjusted net savings (% of GNI)
460 1,258 571389 1,022 52139.3 36.5 28.0
2.8 3.8 3.5
48 44 39.. .. .... 334 308
1,669 1,361 2,034
37.8 27.8 25.70.7 0.5 0.64.9 11.7 10.017134748
199 6,383 11,5636.2 1.8 4.03.9 16.0 4.90.0 5.8 ..
.. 17,980 15,1201,049 27,808 25,818
.. 683 363
.. 58.2 66.2
.. 553 242
.. 65.2 32.0
.. 18.7 45.30.2 0.9 0.3
26,678 4,455 5,1250.3 3.2 4.571 84 9055 61 6535 48 5787 83 8613 31 37
6 23 3223 42 47
36 41 547 .. ..
13 .. ..185 109 95
9.9 18.4 25.24.0 10.9 7.73.4 3.7 3.00.0 10.4 1.40.7 2.2 2.01.1 0.5 1.21.1 0.5 0.31.0 0.4 0.5
–6.0 –1.2 15.2
184 2013 The Little Green Data Book
Country data
Sub-Saharan Africa group
Low-income group
Population (millions) 6.0 Land area (1,000 sq. km) 72 GDP ($ billions) 3.0
Sierra Leone
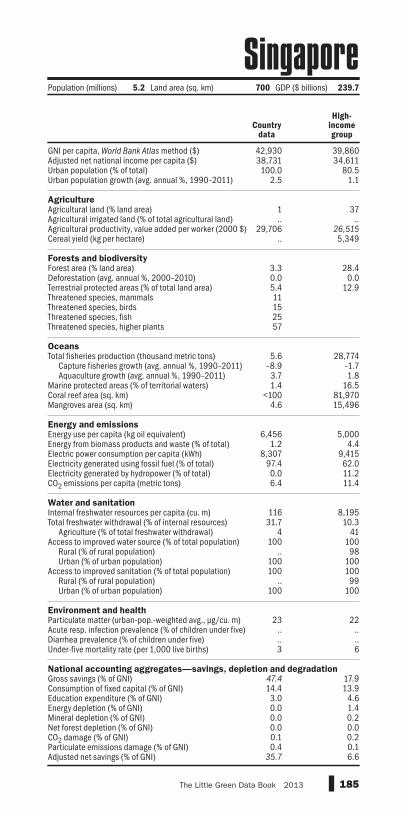
GNI per capita, World Bank Atlas method ($)Adjusted net national income per capita ($)Urban population (% of total)Urban population growth (avg. annual %, 1990–2011) AgricultureAgricultural land (% land area)Agricultural irrigated land (% of total agricultural land)Agricultural productivity, value added per worker (2000 $)Cereal yield (kg per hectare) Forests and biodiversityForest area (% land area)Deforestation (avg. annual %, 2000–2010)Terrestrial protected areas (% of total land area)Threatened species, mammalsThreatened species, birdsThreatened species, fishThreatened species, higher plants OceansTotal fisheries production (thousand metric tons)
Capture fisheries growth (avg. annual %, 1990–2011)Aquaculture growth (avg. annual %, 1990–2011)
Marine protected areas (% of territorial waters)Coral reef area (sq. km)Mangroves area (sq. km) Energy and emissionsEnergy use per capita (kg oil equivalent)Energy from biomass products and waste (% of total)Electric power consumption per capita (kWh)Electricity generated using fossil fuel (% of total)Electricity generated by hydropower (% of total)CO2 emissions per capita (metric tons) Water and sanitationInternal freshwater resources per capita (cu. m)Total freshwater withdrawal (% of internal resources)
Agriculture (% of total freshwater withdrawal)Access to improved water source (% of total population)
Rural (% of rural population)Urban (% of urban population)
Access to improved sanitation (% of total population)Rural (% of rural population)Urban (% of urban population)
Environment and healthParticulate matter (urban-pop.-weighted avg., µg/cu. m)Acute resp. infection prevalence (% of children under five)Diarrhea prevalence (% of children under five)Under-five mortality rate (per 1,000 live births) National accounting aggregates—savings, depletion and degradationGross savings (% of GNI)Consumption of fixed capital (% of GNI)Education expenditure (% of GNI)Energy depletion (% of GNI)Mineral depletion (% of GNI)Net forest depletion (% of GNI)CO2 damage (% of GNI)Particulate emissions damage (% of GNI)Adjusted net savings (% of GNI)
42,930 39,86038,731 34,611100.0 80.5
2.5 1.1
1 37.. ..
29,706 26,515.. 5,349
3.3 28.40.0 0.05.4 12.911152557
5.6 28,774–8.9 –1.73.7 1.81.4 16.5
<100 81,9704.6 15,496
6,456 5,0001.2 4.4
8,307 9,41597.4 62.00.0 11.26.4 11.4
116 8,19531.7 10.3
4 41100 100
.. 98100 100100 100
.. 99100 100
23 22.. .... ..3 6
47.4 17.914.4 13.93.0 4.60.0 1.40.0 0.20.0 0.00.1 0.20.4 0.1
35.7 6.6
185The Little Green Data Book 2013
Population (millions) 5.2 Land area (sq. km) 700 GDP ($ billions) 239.7
Country data
High-income group
Singapore

GNI per capita, World Bank Atlas method ($)Adjusted net national income per capita ($)Urban population (% of total)Urban population growth (avg. annual %, 1990–2011) AgricultureAgricultural land (% land area)Agricultural irrigated land (% of total agricultural land)Agricultural productivity, value added per worker (2000 $)Cereal yield (kg per hectare) Forests and biodiversityForest area (% land area)Deforestation (avg. annual %, 2000–2010)Terrestrial protected areas (% of total land area)Threatened species, mammalsThreatened species, birdsThreatened species, fishThreatened species, higher plants OceansTotal fisheries production (thousand metric tons)
Capture fisheries growth (avg. annual %, 1990–2011)Aquaculture growth (avg. annual %, 1990–2011)
Marine protected areas (% of territorial waters)Coral reef area (sq. km)Mangroves area (sq. km) Energy and emissionsEnergy use per capita (kg oil equivalent)Energy from biomass products and waste (% of total)Electric power consumption per capita (kWh)Electricity generated using fossil fuel (% of total)Electricity generated by hydropower (% of total)CO2 emissions per capita (metric tons) Water and sanitationInternal freshwater resources per capita (cu. m)Total freshwater withdrawal (% of internal resources)
Agriculture (% of total freshwater withdrawal)Access to improved water source (% of total population)
Rural (% of rural population)Urban (% of urban population)
Access to improved sanitation (% of total population)Rural (% of rural population)Urban (% of urban population)
Environment and healthParticulate matter (urban-pop.-weighted avg., µg/cu. m)Acute resp. infection prevalence (% of children under five)Diarrhea prevalence (% of children under five)Under-five mortality rate (per 1,000 live births) National accounting aggregates—savings, depletion and degradationGross savings (% of GNI)Consumption of fixed capital (% of GNI)Education expenditure (% of GNI)Energy depletion (% of GNI)Mineral depletion (% of GNI)Net forest depletion (% of GNI)CO2 damage (% of GNI)Particulate emissions damage (% of GNI)Adjusted net savings (% of GNI)
.. 39,860
.. 34,611
.. 80.5
.. 1.1
.. 37
.. ..
.. 26,515
.. 5,349
.. 28.4
.. 0.0
.. 12.90110
0.18 28,774.. –1.7.. 1.8.. 16.5.. 81,970.. 15,496
.. 5,000
.. 4.4
.. 9,415
.. 62.0
.. 11.2
.. 11.4
.. 8,195
.. 10.3
.. 41
.. 100
.. 98
.. 100
.. 100
.. 99
.. 100
.. 22
.. ..
.. ..
.. 6
.. 17.9
.. 13.9
.. 4.6
.. 1.4
.. 0.2
.. 0.0
.. 0.2
.. 0.1
.. 6.6
186 2013 The Little Green Data Book
Population (thousands) 37 Land area (sq. km) 34 GDP ($ millions) ..
Country data
High-income group
Sint Maarten (Dutch part)

GNI per capita, World Bank Atlas method ($)Adjusted net national income per capita ($)Urban population (% of total)Urban population growth (avg. annual %, 1990–2011) AgricultureAgricultural land (% land area)Agricultural irrigated land (% of total agricultural land)Agricultural productivity, value added per worker (2000 $)Cereal yield (kg per hectare) Forests and biodiversityForest area (% land area)Deforestation (avg. annual %, 2000–2010)Terrestrial protected areas (% of total land area)Threatened species, mammalsThreatened species, birdsThreatened species, fishThreatened species, higher plants OceansTotal fisheries production (thousand metric tons)
Capture fisheries growth (avg. annual %, 1990–2011)Aquaculture growth (avg. annual %, 1990–2011)
Marine protected areas (% of territorial waters)Coral reef area (sq. km)Mangroves area (sq. km) Energy and emissionsEnergy use per capita (kg oil equivalent)Energy from biomass products and waste (% of total)Electric power consumption per capita (kWh)Electricity generated using fossil fuel (% of total)Electricity generated by hydropower (% of total)CO2 emissions per capita (metric tons) Water and sanitationInternal freshwater resources per capita (cu. m)Total freshwater withdrawal (% of internal resources)
Agriculture (% of total freshwater withdrawal)Access to improved water source (% of total population)
Rural (% of rural population)Urban (% of urban population)
Access to improved sanitation (% of total population)Rural (% of rural population)Urban (% of urban population)
Environment and healthParticulate matter (urban-pop.-weighted avg., µg/cu. m)Acute resp. infection prevalence (% of children under five)Diarrhea prevalence (% of children under five)Under-five mortality rate (per 1,000 live births) National accounting aggregates—savings, depletion and degradationGross savings (% of GNI)Consumption of fixed capital (% of GNI)Education expenditure (% of GNI)Energy depletion (% of GNI)Mineral depletion (% of GNI)Net forest depletion (% of GNI)CO2 damage (% of GNI)Particulate emissions damage (% of GNI)Adjusted net savings (% of GNI)
16,190 39,86014,127 34,611
54.8 80.5–0.1 1.1
40 370.7 ..
9,924 26,5154,942 5,349
40.2 28.4–0.1 0.023.2 12.9
3856
2.7 28,774.. –1.7.. 1.8.. 16.5.. 81,970.. 15,496
3,280 5,0005.4 4.4
5,164 9,41525.1 62.019.1 11.26.3 11.4
2,334 8,1955.5 10.3
3 41100 100100 98100 100100 10099 99
100 100
13 22.. .... ..8 6
17.8 17.913.8 13.9
3.9 4.60.1 1.40.0 0.20.3 0.00.3 0.20.0 0.17.2 6.6
187The Little Green Data Book 2013
Country data
High-income group
Population (millions) 5.4 Land area (1,000 sq. km) 48 GDP ($ billions) 96.0
Slovak Republic
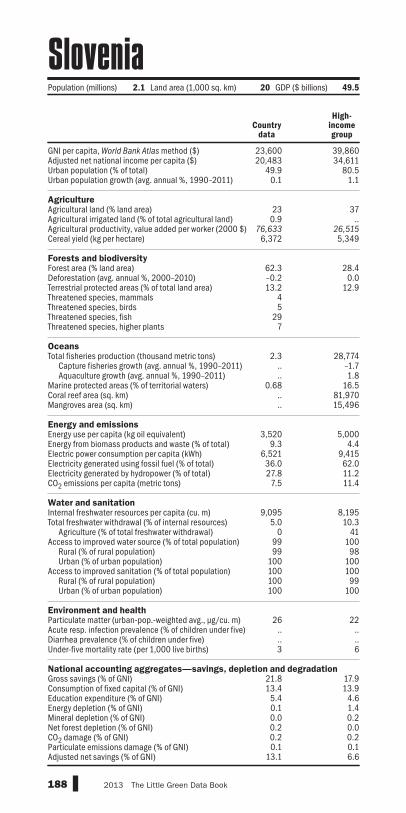
GNI per capita, World Bank Atlas method ($)Adjusted net national income per capita ($)Urban population (% of total)Urban population growth (avg. annual %, 1990–2011) AgricultureAgricultural land (% land area)Agricultural irrigated land (% of total agricultural land)Agricultural productivity, value added per worker (2000 $)Cereal yield (kg per hectare) Forests and biodiversityForest area (% land area)Deforestation (avg. annual %, 2000–2010)Terrestrial protected areas (% of total land area)Threatened species, mammalsThreatened species, birdsThreatened species, fishThreatened species, higher plants OceansTotal fisheries production (thousand metric tons)
Capture fisheries growth (avg. annual %, 1990–2011)Aquaculture growth (avg. annual %, 1990–2011)
Marine protected areas (% of territorial waters)Coral reef area (sq. km)Mangroves area (sq. km) Energy and emissionsEnergy use per capita (kg oil equivalent)Energy from biomass products and waste (% of total)Electric power consumption per capita (kWh)Electricity generated using fossil fuel (% of total)Electricity generated by hydropower (% of total)CO2 emissions per capita (metric tons) Water and sanitationInternal freshwater resources per capita (cu. m)Total freshwater withdrawal (% of internal resources)
Agriculture (% of total freshwater withdrawal)Access to improved water source (% of total population)
Rural (% of rural population)Urban (% of urban population)
Access to improved sanitation (% of total population)Rural (% of rural population)Urban (% of urban population)
Environment and healthParticulate matter (urban-pop.-weighted avg., µg/cu. m)Acute resp. infection prevalence (% of children under five)Diarrhea prevalence (% of children under five)Under-five mortality rate (per 1,000 live births) National accounting aggregates—savings, depletion and degradationGross savings (% of GNI)Consumption of fixed capital (% of GNI)Education expenditure (% of GNI)Energy depletion (% of GNI)Mineral depletion (% of GNI)Net forest depletion (% of GNI)CO2 damage (% of GNI)Particulate emissions damage (% of GNI)Adjusted net savings (% of GNI)
23,600 39,86020,483 34,611
49.9 80.50.1 1.1
23 370.9 ..
76,633 26,5156,372 5,349
62.3 28.4–0.2 0.013.2 12.9
45
297
2.3 28,774.. –1.7.. 1.8
0.68 16.5.. 81,970.. 15,496
3,520 5,0009.3 4.4
6,521 9,41536.0 62.027.8 11.27.5 11.4
9,095 8,1955.0 10.3
0 4199 10099 98
100 100100 100100 99100 100
26 22.. .... ..3 6
21.8 17.913.4 13.9
5.4 4.60.1 1.40.0 0.20.2 0.00.2 0.20.1 0.1
13.1 6.6
188 2013 The Little Green Data Book
Population (millions) 2.1 Land area (1,000 sq. km) 20 GDP ($ billions) 49.5
Country data
High-income group
Slovenia

GNI per capita, World Bank Atlas method ($)Adjusted net national income per capita ($)Urban population (% of total)Urban population growth (avg. annual %, 1990–2011) AgricultureAgricultural land (% land area)Agricultural irrigated land (% of total agricultural land)Agricultural productivity, value added per worker (2000 $)Cereal yield (kg per hectare) Forests and biodiversityForest area (% land area)Deforestation (avg. annual %, 2000–2010)Terrestrial protected areas (% of total land area)Threatened species, mammalsThreatened species, birdsThreatened species, fishThreatened species, higher plants OceansTotal fisheries production (thousand metric tons)
Capture fisheries growth (avg. annual %, 1990–2011)Aquaculture growth (avg. annual %, 1990–2011)
Marine protected areas (% of territorial waters)Coral reef area (sq. km)Mangroves area (sq. km) Energy and emissionsEnergy use per capita (kg oil equivalent)Energy from biomass products and waste (% of total)Electric power consumption per capita (kWh)Electricity generated using fossil fuel (% of total)Electricity generated by hydropower (% of total)CO2 emissions per capita (metric tons) Water and sanitationInternal freshwater resources per capita (cu. m)Total freshwater withdrawal (% of internal resources)
Agriculture (% of total freshwater withdrawal)Access to improved water source (% of total population)
Rural (% of rural population)Urban (% of urban population)
Access to improved sanitation (% of total population)Rural (% of rural population)Urban (% of urban population)
Environment and healthParticulate matter (urban-pop.-weighted avg., µg/cu. m)Acute resp. infection prevalence (% of children under five)Diarrhea prevalence (% of children under five)Under-five mortality rate (per 1,000 live births) National accounting aggregates—savings, depletion and degradationGross savings (% of GNI)Consumption of fixed capital (% of GNI)Education expenditure (% of GNI)Energy depletion (% of GNI)Mineral depletion (% of GNI)Net forest depletion (% of GNI)CO2 damage (% of GNI)Particulate emissions damage (% of GNI)Adjusted net savings (% of GNI)
1,110 4,248 1,772894 3,884 1,59520.5 48.6 38.7
4.7 3.6 2.7
3 48 46.. .. ..
1,777 610 7164,211 5,050 3,065
78.9 29.7 28.40.2 –0.4 0.30.1 15.0 9.920201816
58.9 101,299 40,2381.0 3.4 2.4
42.1 9.1 10.00.12 1.4 2.9
5,750 137,690 143,440603 56,537 60,301
129 1,520 667.. 10.9 26.2.. 2,337 698.. 79.8 73.0.. 16.5 17.4
0.4 4.6 1.6
80,939 4,446 3,121.. 10.9 20.2.. 73 88
70 90 8765 84 8494 97 9332 66 4718 58 3598 76 66
31 55 53.. .. .... .. ..
22 21 62
10.2 49.3 29.711.5 11.0 9.93.8 2.1 3.10.0 4.3 6.30.0 1.7 1.2
15.1 0.0 0.30.3 0.9 0.70.1 1.1 0.6
–7.6 32.2 14.7
189The Little Green Data Book 2013
Country data
East Asia & Pacific
group
Lower middle-income group
Population (thousands) 552 Land area (1,000 sq. km) 28 GDP ($ millions) 838.0
Solomon Islands

GNI per capita, World Bank Atlas method ($)Adjusted net national income per capita ($)Urban population (% of total)Urban population growth (avg. annual %, 1990–2011) AgricultureAgricultural land (% land area)Agricultural irrigated land (% of total agricultural land)Agricultural productivity, value added per worker (2000 $)Cereal yield (kg per hectare) Forests and biodiversityForest area (% land area)Deforestation (avg. annual %, 2000–2010)Terrestrial protected areas (% of total land area)Threatened species, mammalsThreatened species, birdsThreatened species, fishThreatened species, higher plants OceansTotal fisheries production (thousand metric tons)
Capture fisheries growth (avg. annual %, 1990–2011)Aquaculture growth (avg. annual %, 1990–2011)
Marine protected areas (% of territorial waters)Coral reef area (sq. km)Mangroves area (sq. km) Energy and emissionsEnergy use per capita (kg oil equivalent)Energy from biomass products and waste (% of total)Electric power consumption per capita (kWh)Electricity generated using fossil fuel (% of total)Electricity generated by hydropower (% of total)CO2 emissions per capita (metric tons) Water and sanitationInternal freshwater resources per capita (cu. m)Total freshwater withdrawal (% of internal resources)
Agriculture (% of total freshwater withdrawal)Access to improved water source (% of total population)
Rural (% of rural population)Urban (% of urban population)
Access to improved sanitation (% of total population)Rural (% of rural population)Urban (% of urban population)
Environment and healthParticulate matter (urban-pop.-weighted avg., µg/cu. m)Acute resp. infection prevalence (% of children under five)Diarrhea prevalence (% of children under five)Under-five mortality rate (per 1,000 live births) National accounting aggregates—savings, depletion and degradationGross savings (% of GNI)Consumption of fixed capital (% of GNI)Education expenditure (% of GNI)Energy depletion (% of GNI)Mineral depletion (% of GNI)Net forest depletion (% of GNI)CO2 damage (% of GNI)Particulate emissions damage (% of GNI)Adjusted net savings (% of GNI)
.. 1,258 571
.. 1,022 52137.8 36.5 28.02.9 3.8 3.5
70 44 39.. .. .... 334 308
466 1,361 2,034
10.6 27.8 25.71.1 0.5 0.60.6 11.7 10.015142823
30.0 6,383 11,5631.3 1.8 4.0
.. 16.0 4.90.0 5.8 ..710 17,980 15,120
48.0 27,808 25,818
.. 683 363
.. 58.2 66.2
.. 553 242
.. 65.2 32.0
.. 18.7 45.30.1 0.9 0.3
628 4,455 5,12555.0 3.2 4.5
99 84 9029 61 65
7 48 5766 83 8623 31 37
6 23 3252 42 47
26 41 54.. .. .... .. ..
180 109 95
.. 18.4 25.2
.. 10.9 7.7
.. 3.7 3.0
.. 10.4 1.4
.. 2.2 2.0
.. 0.5 1.2
.. 0.5 0.30.4 0.4 0.5
.. –1.2 15.2
190 2013 The Little Green Data Book
Population (millions) 9.6 Land area (1,000 sq. km) 627 GDP ($ millions) ..
Country data
Sub-Saharan Africa group
Low-income group
Somalia

GNI per capita, World Bank Atlas method ($)Adjusted net national income per capita ($)Urban population (% of total)Urban population growth (avg. annual %, 1990–2011) AgricultureAgricultural land (% land area)Agricultural irrigated land (% of total agricultural land)Agricultural productivity, value added per worker (2000 $)Cereal yield (kg per hectare) Forests and biodiversityForest area (% land area)Deforestation (avg. annual %, 2000–2010)Terrestrial protected areas (% of total land area)Threatened species, mammalsThreatened species, birdsThreatened species, fishThreatened species, higher plants OceansTotal fisheries production (thousand metric tons)
Capture fisheries growth (avg. annual %, 1990–2011)Aquaculture growth (avg. annual %, 1990–2011)
Marine protected areas (% of territorial waters)Coral reef area (sq. km)Mangroves area (sq. km) Energy and emissionsEnergy use per capita (kg oil equivalent)Energy from biomass products and waste (% of total)Electric power consumption per capita (kWh)Electricity generated using fossil fuel (% of total)Electricity generated by hydropower (% of total)CO2 emissions per capita (metric tons) Water and sanitationInternal freshwater resources per capita (cu. m)Total freshwater withdrawal (% of internal resources)
Agriculture (% of total freshwater withdrawal)Access to improved water source (% of total population)
Rural (% of rural population)Urban (% of urban population)
Access to improved sanitation (% of total population)Rural (% of rural population)Urban (% of urban population)
Environment and healthParticulate matter (urban-pop.-weighted avg., µg/cu. m)Acute resp. infection prevalence (% of children under five)Diarrhea prevalence (% of children under five)Under-five mortality rate (per 1,000 live births) National accounting aggregates—savings, depletion and degradationGross savings (% of GNI)Consumption of fixed capital (% of GNI)Education expenditure (% of GNI)Energy depletion (% of GNI)Mineral depletion (% of GNI)Net forest depletion (% of GNI)CO2 damage (% of GNI)Particulate emissions damage (% of GNI)Adjusted net savings (% of GNI)
6,960 1,258 6,5636,333 1,022 5,821
62.0 36.5 60.62.6 3.8 2.5
79 44 351.7 .. ..
4,097 334 8694,024 1,361 3,944
7.6 27.8 34.80.0 0.5 0.06.9 11.7 13.324418567
545 6,383 97,437–0.1 1.8 0.72.8 16.0 9.06.5 5.8 8.4
.. 17,980 33,35030.5 27,808 48,783
2,738 683 1,94810.5 58.2 8.1
4,803 553 2,94294.3 65.2 72.9
0.8 18.7 21.310.1 0.9 5.5
886 4,455 8,55027.9 3.2 5.6
63 84 6691 61 9379 48 8699 83 9879 31 7367 23 6286 42 81
18 41 42.. .. .... .. ..
47 109 20
16.8 18.4 36.413.0 10.9 11.8
5.4 3.7 3.33.6 10.4 5.72.9 2.2 1.60.2 0.5 0.00.9 0.5 0.70.1 0.4 0.71.5 –1.2 19.2
191The Little Green Data Book 2013
Country data
Sub-Saharan Africa group
Upper middle-income group
Population (millions) 50.6 Land area (1,000 sq. km) 1,213 GDP ($ billions) 408.2
South Africa

GNI per capita, World Bank Atlas method ($)Adjusted net national income per capita ($)Urban population (% of total)Urban population growth (avg. annual %, 1990–2011) AgricultureAgricultural land (% land area)Agricultural irrigated land (% of total agricultural land)Agricultural productivity, value added per worker (2000 $)Cereal yield (kg per hectare) Forests and biodiversityForest area (% land area)Deforestation (avg. annual %, 2000–2010)Terrestrial protected areas (% of total land area)Threatened species, mammalsThreatened species, birdsThreatened species, fishThreatened species, higher plants OceansTotal fisheries production (thousand metric tons)
Capture fisheries growth (avg. annual %, 1990–2011)Aquaculture growth (avg. annual %, 1990–2011)
Marine protected areas (% of territorial waters)Coral reef area (sq. km)Mangroves area (sq. km) Energy and emissionsEnergy use per capita (kg oil equivalent)Energy from biomass products and waste (% of total)Electric power consumption per capita (kWh)Electricity generated using fossil fuel (% of total)Electricity generated by hydropower (% of total)CO2 emissions per capita (metric tons) Water and sanitationInternal freshwater resources per capita (cu. m)Total freshwater withdrawal (% of internal resources)
Agriculture (% of total freshwater withdrawal)Access to improved water source (% of total population)
Rural (% of rural population)Urban (% of urban population)
Access to improved sanitation (% of total population)Rural (% of rural population)Urban (% of urban population)
Environment and healthParticulate matter (urban-pop.-weighted avg., µg/cu. m)Acute resp. infection prevalence (% of children under five)Diarrhea prevalence (% of children under five)Under-five mortality rate (per 1,000 live births) National accounting aggregates—savings, depletion and degradationGross savings (% of GNI)Consumption of fixed capital (% of GNI)Education expenditure (% of GNI)Energy depletion (% of GNI)Mineral depletion (% of GNI)Net forest depletion (% of GNI)CO2 damage (% of GNI)Particulate emissions damage (% of GNI)Adjusted net savings (% of GNI)
.. 1,258 1,772
.. 1,022 1,59518.1 36.5 38.74.0 3.8 2.7
.. 44 46
.. .. ..
.. 334 716
.. 1,361 3,065
.. 27.8 28.4
.. 0.5 0.3
.. 11.7 9.90
14....
.. 6,383 40,238
.. 1.8 2.4
.. 16.0 10.0
.. 5.8 2.9
.. 17,980 143,440
.. 27,808 60,301
.. 683 667
.. 58.2 26.2
.. 553 698
.. 65.2 73.0
.. 18.7 17.4
.. 0.9 1.6
.. 4,455 3,121
.. 3.2 20.2
.. 84 88
.. 61 87
.. 48 84
.. 83 93
.. 31 47
.. 23 35
.. 42 66
.. 41 53
.. .. ..
.. .. ..121 109 62
.. 18.4 29.7
.. 10.9 9.9
.. 3.7 3.1
.. 10.4 6.3
.. 2.2 1.2
.. 0.5 0.3
.. 0.5 0.7
.. 0.4 0.6
.. –1.2 14.7
192 2013 The Little Green Data Book
Country data
Sub-Saharan Africa group
Lower middle-income group
Population (millions) 10.3 Land area (sq. km) .. GDP ($ billions) 19.2
South Sudan

GNI per capita, World Bank Atlas method ($)Adjusted net national income per capita ($)Urban population (% of total)Urban population growth (avg. annual %, 1990–2011) AgricultureAgricultural land (% land area)Agricultural irrigated land (% of total agricultural land)Agricultural productivity, value added per worker (2000 $)Cereal yield (kg per hectare) Forests and biodiversityForest area (% land area)Deforestation (avg. annual %, 2000–2010)Terrestrial protected areas (% of total land area)Threatened species, mammalsThreatened species, birdsThreatened species, fishThreatened species, higher plants OceansTotal fisheries production (thousand metric tons)
Capture fisheries growth (avg. annual %, 1990–2011)Aquaculture growth (avg. annual %, 1990–2011)
Marine protected areas (% of territorial waters)Coral reef area (sq. km)Mangroves area (sq. km) Energy and emissionsEnergy use per capita (kg oil equivalent)Energy from biomass products and waste (% of total)Electric power consumption per capita (kWh)Electricity generated using fossil fuel (% of total)Electricity generated by hydropower (% of total)CO2 emissions per capita (metric tons) Water and sanitationInternal freshwater resources per capita (cu. m)Total freshwater withdrawal (% of internal resources)
Agriculture (% of total freshwater withdrawal)Access to improved water source (% of total population)
Rural (% of rural population)Urban (% of urban population)
Access to improved sanitation (% of total population)Rural (% of rural population)Urban (% of urban population)
Environment and healthParticulate matter (urban-pop.-weighted avg., µg/cu. m)Acute resp. infection prevalence (% of children under five)Diarrhea prevalence (% of children under five)Under-five mortality rate (per 1,000 live births) National accounting aggregates—savings, depletion and degradationGross savings (% of GNI)Consumption of fixed capital (% of GNI)Education expenditure (% of GNI)Energy depletion (% of GNI)Mineral depletion (% of GNI)Net forest depletion (% of GNI)CO2 damage (% of GNI)Particulate emissions damage (% of GNI)Adjusted net savings (% of GNI)
30,930 39,86026,987 34,611
77.4 80.51.0 1.1
55 3712.0 ..
22,035 26,5153,658 5,349
36.8 28.4–0.7 0.08.6 12.9161270
205
1,266 28,774–0.6 –1.71.4 1.83.5 16.5
.. 81,970
.. 15,496
2,773 5,0005.3 4.4
6,155 9,41546.5 62.014.1 11.26.3 11.4
2,408 8,19529.2 10.3
61 41100 100100 98100 100100 100100 99100 100
24 22.. .... ..4 6
18.5 17.913.8 13.9
4.6 4.60.0 1.40.0 0.20.0 0.00.2 0.20.2 0.18.9 6.6
193The Little Green Data Book 2013
Country data
High-income group
Population (millions) 46.2 Land area (1,000 sq. km) 499 GDP ($ billions) 1,476.9
Spain

GNI per capita, World Bank Atlas method ($)Adjusted net national income per capita ($)Urban population (% of total)Urban population growth (avg. annual %, 1990–2011) AgricultureAgricultural land (% land area)Agricultural irrigated land (% of total agricultural land)Agricultural productivity, value added per worker (2000 $)Cereal yield (kg per hectare) Forests and biodiversityForest area (% land area)Deforestation (avg. annual %, 2000–2010)Terrestrial protected areas (% of total land area)Threatened species, mammalsThreatened species, birdsThreatened species, fishThreatened species, higher plants OceansTotal fisheries production (thousand metric tons)
Capture fisheries growth (avg. annual %, 1990–2011)Aquaculture growth (avg. annual %, 1990–2011)
Marine protected areas (% of territorial waters)Coral reef area (sq. km)Mangroves area (sq. km) Energy and emissionsEnergy use per capita (kg oil equivalent)Energy from biomass products and waste (% of total)Electric power consumption per capita (kWh)Electricity generated using fossil fuel (% of total)Electricity generated by hydropower (% of total)CO2 emissions per capita (metric tons) Water and sanitationInternal freshwater resources per capita (cu. m)Total freshwater withdrawal (% of internal resources)
Agriculture (% of total freshwater withdrawal)Access to improved water source (% of total population)
Rural (% of rural population)Urban (% of urban population)
Access to improved sanitation (% of total population)Rural (% of rural population)Urban (% of urban population)
Environment and healthParticulate matter (urban-pop.-weighted avg., µg/cu. m)Acute resp. infection prevalence (% of children under five)Diarrhea prevalence (% of children under five)Under-five mortality rate (per 1,000 live births) National accounting aggregates—savings, depletion and degradationGross savings (% of GNI)Consumption of fixed capital (% of GNI)Education expenditure (% of GNI)Energy depletion (% of GNI)Mineral depletion (% of GNI)Net forest depletion (% of GNI)CO2 damage (% of GNI)Particulate emissions damage (% of GNI)Adjusted net savings (% of GNI)
2,580 1,313 1,7722,509 1,201 1,595
15.1 30.9 38.70.4 2.8 2.7
42 55 46.. .. ..
978 550 7163,503 2,959 3,065
29.4 17.1 28.41.1 –0.3 0.3
21.5 5.9 9.9291544
283
445 13,219 40,2384.1 2.3 2.4
12.4 8.1 10.01.1 1.7 2.9
680 15,440 143,44088.8 10,343 60,301
478 519 66751.2 26.7 26.2449 555 69847.5 80.6 73.052.3 14.0 17.4
0.6 1.4 1.6
2,530 1,197 3,12124.5 51.6 20.2
87 91 8891 90 8790 88 8499 96 9392 38 4793 28 3588 60 66
65 62 53.. .. .... .. ..
12 62 62
22.4 33.5 29.710.3 9.2 9.9
1.7 2.8 3.10.0 2.8 6.30.0 1.0 1.20.3 0.6 0.30.2 0.8 0.70.2 0.6 0.6
13.2 21.6 14.7
194 2013 The Little Green Data Book
Country data
South Asia
group
Lower middle-income group
Population (millions) 20.9 Land area (1,000 sq. km) 63 GDP ($ billions) 59.2
Sri Lanka

GNI per capita, World Bank Atlas method ($)Adjusted net national income per capita ($)Urban population (% of total)Urban population growth (avg. annual %, 1990–2011) AgricultureAgricultural land (% land area)Agricultural irrigated land (% of total agricultural land)Agricultural productivity, value added per worker (2000 $)Cereal yield (kg per hectare) Forests and biodiversityForest area (% land area)Deforestation (avg. annual %, 2000–2010)Terrestrial protected areas (% of total land area)Threatened species, mammalsThreatened species, birdsThreatened species, fishThreatened species, higher plants OceansTotal fisheries production (thousand metric tons)
Capture fisheries growth (avg. annual %, 1990–2011)Aquaculture growth (avg. annual %, 1990–2011)
Marine protected areas (% of territorial waters)Coral reef area (sq. km)Mangroves area (sq. km) Energy and emissionsEnergy use per capita (kg oil equivalent)Energy from biomass products and waste (% of total)Electric power consumption per capita (kWh)Electricity generated using fossil fuel (% of total)Electricity generated by hydropower (% of total)CO2 emissions per capita (metric tons) Water and sanitationInternal freshwater resources per capita (cu. m)Total freshwater withdrawal (% of internal resources)
Agriculture (% of total freshwater withdrawal)Access to improved water source (% of total population)
Rural (% of rural population)Urban (% of urban population)
Access to improved sanitation (% of total population)Rural (% of rural population)Urban (% of urban population)
Environment and healthParticulate matter (urban-pop.-weighted avg., µg/cu. m)Acute resp. infection prevalence (% of children under five)Diarrhea prevalence (% of children under five)Under-five mortality rate (per 1,000 live births) National accounting aggregates—savings, depletion and degradationGross savings (% of GNI)Consumption of fixed capital (% of GNI)Education expenditure (% of GNI)Energy depletion (% of GNI)Mineral depletion (% of GNI)Net forest depletion (% of GNI)CO2 damage (% of GNI)Particulate emissions damage (% of GNI)Adjusted net savings (% of GNI)
12,610 39,860.. 34,611
32.0 80.50.7 1.1
23 3713.3 ..
1,517 26,515.. 5,349
42.3 28.40.0 0.03.6 12.9
21
192
31.0 28,77420.5 –1.7–5.1 1.80.53 16.5180 81,970
0.68 15,496
1,645 5,000.. 4.4.. 9,415.. 62.0.. 11.2
5.0 11.4
452 8,195.. 10.3.. 41
99 10099 9899 10096 10096 9996 100
15 22.. .... ..7 6
24.5 17.912.9 13.9
3.5 4.60.0 1.40.0 0.2
.. 0.00.3 0.2
.. 0.1
.. 6.6
195The Little Green Data Book 2013
Population (thousands) 53 Land area (sq. km) 260 GDP ($ millions) 697.3
Country data
Latin America & Caribbean
group
High-income group
St. Kitts and Nevis
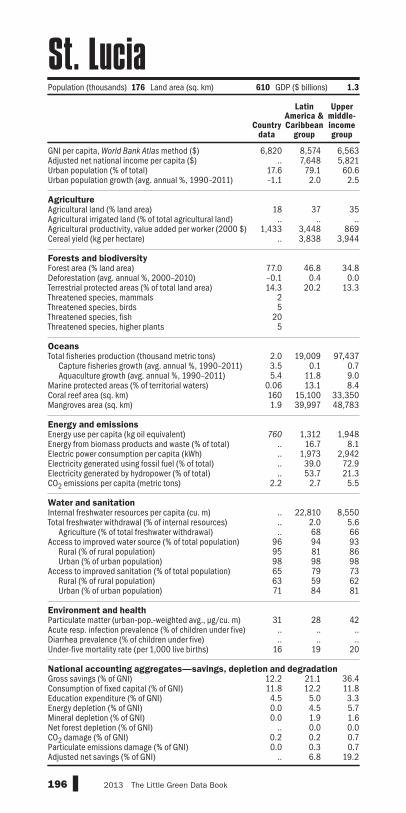
GNI per capita, World Bank Atlas method ($)Adjusted net national income per capita ($)Urban population (% of total)Urban population growth (avg. annual %, 1990–2011) AgricultureAgricultural land (% land area)Agricultural irrigated land (% of total agricultural land)Agricultural productivity, value added per worker (2000 $)Cereal yield (kg per hectare) Forests and biodiversityForest area (% land area)Deforestation (avg. annual %, 2000–2010)Terrestrial protected areas (% of total land area)Threatened species, mammalsThreatened species, birdsThreatened species, fishThreatened species, higher plants OceansTotal fisheries production (thousand metric tons)
Capture fisheries growth (avg. annual %, 1990–2011)Aquaculture growth (avg. annual %, 1990–2011)
Marine protected areas (% of territorial waters)Coral reef area (sq. km)Mangroves area (sq. km) Energy and emissionsEnergy use per capita (kg oil equivalent)Energy from biomass products and waste (% of total)Electric power consumption per capita (kWh)Electricity generated using fossil fuel (% of total)Electricity generated by hydropower (% of total)CO2 emissions per capita (metric tons) Water and sanitationInternal freshwater resources per capita (cu. m)Total freshwater withdrawal (% of internal resources)
Agriculture (% of total freshwater withdrawal)Access to improved water source (% of total population)
Rural (% of rural population)Urban (% of urban population)
Access to improved sanitation (% of total population)Rural (% of rural population)Urban (% of urban population)
Environment and healthParticulate matter (urban-pop.-weighted avg., µg/cu. m)Acute resp. infection prevalence (% of children under five)Diarrhea prevalence (% of children under five)Under-five mortality rate (per 1,000 live births) National accounting aggregates—savings, depletion and degradationGross savings (% of GNI)Consumption of fixed capital (% of GNI)Education expenditure (% of GNI)Energy depletion (% of GNI)Mineral depletion (% of GNI)Net forest depletion (% of GNI)CO2 damage (% of GNI)Particulate emissions damage (% of GNI)Adjusted net savings (% of GNI)
6,820 8,574 6,563.. 7,648 5,821
17.6 79.1 60.6–1.1 2.0 2.5
18 37 35.. .. ..
1,433 3,448 869.. 3,838 3,944
77.0 46.8 34.8–0.1 0.4 0.014.3 20.2 13.3
25
205
2.0 19,009 97,4373.5 0.1 0.75.4 11.8 9.0
0.06 13.1 8.4160 15,100 33,3501.9 39,997 48,783
760 1,312 1,948.. 16.7 8.1.. 1,973 2,942.. 39.0 72.9.. 53.7 21.3
2.2 2.7 5.5
.. 22,810 8,550
.. 2.0 5.6
.. 68 6696 94 9395 81 8698 98 9865 79 7363 59 6271 84 81
31 28 42.. .. .... .. ..
16 19 20
12.2 21.1 36.411.8 12.2 11.84.5 5.0 3.30.0 4.5 5.70.0 1.9 1.6
.. 0.0 0.00.2 0.2 0.70.0 0.3 0.7
.. 6.8 19.2
196 2013 The Little Green Data Book
Country data
Latin America & Caribbean
group
Upper middle-income group
Population (thousands) 176 Land area (sq. km) 610 GDP ($ billions) 1.3
St. Lucia

GNI per capita, World Bank Atlas method ($)Adjusted net national income per capita ($)Urban population (% of total)Urban population growth (avg. annual %, 1990–2011) AgricultureAgricultural land (% land area)Agricultural irrigated land (% of total agricultural land)Agricultural productivity, value added per worker (2000 $)Cereal yield (kg per hectare) Forests and biodiversityForest area (% land area)Deforestation (avg. annual %, 2000–2010)Terrestrial protected areas (% of total land area)Threatened species, mammalsThreatened species, birdsThreatened species, fishThreatened species, higher plants OceansTotal fisheries production (thousand metric tons)
Capture fisheries growth (avg. annual %, 1990–2011)Aquaculture growth (avg. annual %, 1990–2011)
Marine protected areas (% of territorial waters)Coral reef area (sq. km)Mangroves area (sq. km) Energy and emissionsEnergy use per capita (kg oil equivalent)Energy from biomass products and waste (% of total)Electric power consumption per capita (kWh)Electricity generated using fossil fuel (% of total)Electricity generated by hydropower (% of total)CO2 emissions per capita (metric tons) Water and sanitationInternal freshwater resources per capita (cu. m)Total freshwater withdrawal (% of internal resources)
Agriculture (% of total freshwater withdrawal)Access to improved water source (% of total population)
Rural (% of rural population)Urban (% of urban population)
Access to improved sanitation (% of total population)Rural (% of rural population)Urban (% of urban population)
Environment and healthParticulate matter (urban-pop.-weighted avg., µg/cu. m)Acute resp. infection prevalence (% of children under five)Diarrhea prevalence (% of children under five)Under-five mortality rate (per 1,000 live births) National accounting aggregates—savings, depletion and degradationGross savings (% of GNI)Consumption of fixed capital (% of GNI)Education expenditure (% of GNI)Energy depletion (% of GNI)Mineral depletion (% of GNI)Net forest depletion (% of GNI)CO2 damage (% of GNI)Particulate emissions damage (% of GNI)Adjusted net savings (% of GNI)
.. 39,860
.. 34,611
.. 80.5
.. 1.1
.. 37
.. ..
.. 26,515
.. 5,349
.. 28.40.0 0.0
.. 12.91052
0.20 28,774.. –1.7.. 1.8.. 16.5.. 81,970.. 15,496
.. 5,000
.. 4.4
.. 9,415
.. 62.0
.. 11.2
.. 11.4
.. 8,195
.. 10.3
.. 41
.. 100
.. 98
.. 100
.. 100
.. 99
.. 100
.. 22
.. ..
.. ..
.. 6
.. 17.9
.. 13.9
.. 4.6
.. 1.4
.. 0.2
.. 0.0
.. 0.2
.. 0.1
.. 6.6
197The Little Green Data Book 2013
Population (thousands) 31 Land area (sq. km) 54 GDP ($ millions) ..
Country data
High-income group
St. Martin (French part)

GNI per capita, World Bank Atlas method ($)Adjusted net national income per capita ($)Urban population (% of total)Urban population growth (avg. annual %, 1990–2011) AgricultureAgricultural land (% land area)Agricultural irrigated land (% of total agricultural land)Agricultural productivity, value added per worker (2000 $)Cereal yield (kg per hectare) Forests and biodiversityForest area (% land area)Deforestation (avg. annual %, 2000–2010)Terrestrial protected areas (% of total land area)Threatened species, mammalsThreatened species, birdsThreatened species, fishThreatened species, higher plants OceansTotal fisheries production (thousand metric tons)
Capture fisheries growth (avg. annual %, 1990–2011)Aquaculture growth (avg. annual %, 1990–2011)
Marine protected areas (% of territorial waters)Coral reef area (sq. km)Mangroves area (sq. km) Energy and emissionsEnergy use per capita (kg oil equivalent)Energy from biomass products and waste (% of total)Electric power consumption per capita (kWh)Electricity generated using fossil fuel (% of total)Electricity generated by hydropower (% of total)CO2 emissions per capita (metric tons) Water and sanitationInternal freshwater resources per capita (cu. m)Total freshwater withdrawal (% of internal resources)
Agriculture (% of total freshwater withdrawal)Access to improved water source (% of total population)
Rural (% of rural population)Urban (% of urban population)
Access to improved sanitation (% of total population)Rural (% of rural population)Urban (% of urban population)
Environment and healthParticulate matter (urban-pop.-weighted avg., µg/cu. m)Acute resp. infection prevalence (% of children under five)Diarrhea prevalence (% of children under five)Under-five mortality rate (per 1,000 live births) National accounting aggregates—savings, depletion and degradationGross savings (% of GNI)Consumption of fixed capital (% of GNI)Education expenditure (% of GNI)Energy depletion (% of GNI)Mineral depletion (% of GNI)Net forest depletion (% of GNI)CO2 damage (% of GNI)Particulate emissions damage (% of GNI)Adjusted net savings (% of GNI)
6,070 8,574 6,5635,421 7,648 5,82149.3 79.1 60.6
0.9 2.0 2.5
26 37 35.. .. ..
2,299 3,448 8695,297 3,838 3,944
68.7 46.8 34.8–0.3 0.4 0.010.9 20.2 13.3
22
204
76.6 19,009 97,43710.7 0.1 0.7
.. 11.8 9.00.61 13.1 8.4140 15,100 33,350
0.90 39,997 48,783
642 1,312 1,948.. 16.7 8.1.. 1,973 2,942.. 39.0 72.9.. 53.7 21.3
1.8 2.7 5.5
.. 22,810 8,550
.. 2.0 5.6
.. 68 66
.. 94 93
.. 81 86
.. 98 98
.. 79 7396 59 62
.. 84 81
22 28 42.. .. .... .. ..
21 19 20
–4.9 21.1 36.411.6 12.2 11.84.5 5.0 3.30.0 4.5 5.70.0 1.9 1.60.0 0.0 0.00.2 0.2 0.70.1 0.3 0.7
–12.2 6.8 19.2
198 2013 The Little Green Data Book
Population (thousands) 109 Land area (sq. km) 390 GDP ($ millions) 688.0
Country data
Latin America & Caribbean
group
Upper middle-income group
St. Vincent and Grenadines

GNI per capita, World Bank Atlas method ($)Adjusted net national income per capita ($)Urban population (% of total)Urban population growth (avg. annual %, 1990–2011) AgricultureAgricultural land (% land area)Agricultural irrigated land (% of total agricultural land)Agricultural productivity, value added per worker (2000 $)Cereal yield (kg per hectare) Forests and biodiversityForest area (% land area)Deforestation (avg. annual %, 2000–2010)Terrestrial protected areas (% of total land area)Threatened species, mammalsThreatened species, birdsThreatened species, fishThreatened species, higher plants OceansTotal fisheries production (thousand metric tons)
Capture fisheries growth (avg. annual %, 1990–2011)Aquaculture growth (avg. annual %, 1990–2011)
Marine protected areas (% of territorial waters)Coral reef area (sq. km)Mangroves area (sq. km) Energy and emissionsEnergy use per capita (kg oil equivalent)Energy from biomass products and waste (% of total)Electric power consumption per capita (kWh)Electricity generated using fossil fuel (% of total)Electricity generated by hydropower (% of total)CO2 emissions per capita (metric tons) Water and sanitationInternal freshwater resources per capita (cu. m)Total freshwater withdrawal (% of internal resources)
Agriculture (% of total freshwater withdrawal)Access to improved water source (% of total population)
Rural (% of rural population)Urban (% of urban population)
Access to improved sanitation (% of total population)Rural (% of rural population)Urban (% of urban population)
Environment and healthParticulate matter (urban-pop.-weighted avg., µg/cu. m)Acute resp. infection prevalence (% of children under five)Diarrhea prevalence (% of children under five)Under-five mortality rate (per 1,000 live births) National accounting aggregates—savings, depletion and degradationGross savings (% of GNI)Consumption of fixed capital (% of GNI)Education expenditure (% of GNI)Energy depletion (% of GNI)Mineral depletion (% of GNI)Net forest depletion (% of GNI)CO2 damage (% of GNI)Particulate emissions damage (% of GNI)Adjusted net savings (% of GNI)
199The Little Green Data Book 2013
Country data
Sub-Saharan Africa group
Lower middle-income group
Population (millions) 34.3b Land area (1,000 sq. km) 2,376 GDP ($ billions) 64.1c
Sudan
1,310 1,258 1,7721,044 1,022 1,59533.2 36.5 38.7
3.2 3.8 2.7
57 44 461.0 .. ..
1,015 334 716452 1,361 3,065
29.4 27.8 28.40.1 0.5 0.34.2 11.7 9.915172017
73.2 6,383 40,2383.9 1.8 2.4
11.3 16.0 10.00.05 5.8 2.9
2,720 17,980 143,4409.8 27,808 60,301
371 683 66768.7 58.2 26.2141 553 698
51.0 65.2 73.049.0 18.7 17.40.3 0.9 1.6
672 4,455 3,121123.8 3.2 20.2
97 84 8858 61 8752 48 8467 83 9326 31 4714 23 3544 42 66
137 41 53.. .. .... .. ..
86 109 62
22.8 18.4 29.710.5 10.9 9.90.9 3.7 3.19.7 10.4 6.30.1 2.2 1.20.0 0.5 0.30.2 0.5 0.70.9 0.4 0.60.1 –1.2 14.7
c
bb

GNI per capita, World Bank Atlas method ($)Adjusted net national income per capita ($)Urban population (% of total)Urban population growth (avg. annual %, 1990–2011) AgricultureAgricultural land (% land area)Agricultural irrigated land (% of total agricultural land)Agricultural productivity, value added per worker (2000 $)Cereal yield (kg per hectare) Forests and biodiversityForest area (% land area)Deforestation (avg. annual %, 2000–2010)Terrestrial protected areas (% of total land area)Threatened species, mammalsThreatened species, birdsThreatened species, fishThreatened species, higher plants OceansTotal fisheries production (thousand metric tons)
Capture fisheries growth (avg. annual %, 1990–2011)Aquaculture growth (avg. annual %, 1990–2011)
Marine protected areas (% of territorial waters)Coral reef area (sq. km)Mangroves area (sq. km) Energy and emissionsEnergy use per capita (kg oil equivalent)Energy from biomass products and waste (% of total)Electric power consumption per capita (kWh)Electricity generated using fossil fuel (% of total)Electricity generated by hydropower (% of total)CO2 emissions per capita (metric tons) Water and sanitationInternal freshwater resources per capita (cu. m)Total freshwater withdrawal (% of internal resources)
Agriculture (% of total freshwater withdrawal)Access to improved water source (% of total population)
Rural (% of rural population)Urban (% of urban population)
Access to improved sanitation (% of total population)Rural (% of rural population)Urban (% of urban population)
Environment and healthParticulate matter (urban-pop.-weighted avg., µg/cu. m)Acute resp. infection prevalence (% of children under five)Diarrhea prevalence (% of children under five)Under-five mortality rate (per 1,000 live births) National accounting aggregates—savings, depletion and degradationGross savings (% of GNI)Consumption of fixed capital (% of GNI)Education expenditure (% of GNI)Energy depletion (% of GNI)Mineral depletion (% of GNI)Net forest depletion (% of GNI)CO2 damage (% of GNI)Particulate emissions damage (% of GNI)Adjusted net savings (% of GNI)
7,840 8,574 6,5636,037 7,648 5,821
69.7 79.1 60.62.0 2.0 2.5
1 37 35.. .. ..
4,048 3,448 8694,133 3,838 3,944
94.6 46.8 34.80.0 0.4 0.0
11.6 20.2 13.387
2626
34.5 19,009 97,4378.3 0.1 0.7
.. 11.8 9.022.9 13.1 8.4
.. 15,100 33,350510 39,997 48,783
1,400 1,312 1,948.. 16.7 8.1.. 1,973 2,942.. 39.0 72.9.. 53.7 21.3
4.8 2.7 5.5
166,220 22,810 8,5500.8 2.0 5.693 68 6692 94 9381 81 8697 98 9883 79 7366 59 6290 84 81
19 28 42.. .. .... .. ..
30 19 20
.. 21.1 36.412.4 12.2 11.8
.. 5.0 3.30.0 4.5 5.78.5 1.9 1.60.0 0.0 0.00.5 0.2 0.70.1 0.3 0.7
.. 6.8 19.2
200 2013 The Little Green Data Book
Population (thousands) 529 Land area (1,000 sq. km) 156 GDP ($ billions) 4.3
Country data
Latin America & Caribbean
group
Upper middle-income group
Suriname

GNI per capita, World Bank Atlas method ($)Adjusted net national income per capita ($)Urban population (% of total)Urban population growth (avg. annual %, 1990–2011) AgricultureAgricultural land (% land area)Agricultural irrigated land (% of total agricultural land)Agricultural productivity, value added per worker (2000 $)Cereal yield (kg per hectare) Forests and biodiversityForest area (% land area)Deforestation (avg. annual %, 2000–2010)Terrestrial protected areas (% of total land area)Threatened species, mammalsThreatened species, birdsThreatened species, fishThreatened species, higher plants OceansTotal fisheries production (thousand metric tons)
Capture fisheries growth (avg. annual %, 1990–2011)Aquaculture growth (avg. annual %, 1990–2011)
Marine protected areas (% of territorial waters)Coral reef area (sq. km)Mangroves area (sq. km) Energy and emissionsEnergy use per capita (kg oil equivalent)Energy from biomass products and waste (% of total)Electric power consumption per capita (kWh)Electricity generated using fossil fuel (% of total)Electricity generated by hydropower (% of total)CO2 emissions per capita (metric tons) Water and sanitationInternal freshwater resources per capita (cu. m)Total freshwater withdrawal (% of internal resources)
Agriculture (% of total freshwater withdrawal)Access to improved water source (% of total population)
Rural (% of rural population)Urban (% of urban population)
Access to improved sanitation (% of total population)Rural (% of rural population)Urban (% of urban population)
Environment and healthParticulate matter (urban-pop.-weighted avg., µg/cu. m)Acute resp. infection prevalence (% of children under five)Diarrhea prevalence (% of children under five)Under-five mortality rate (per 1,000 live births) National accounting aggregates—savings, depletion and degradationGross savings (% of GNI)Consumption of fixed capital (% of GNI)Education expenditure (% of GNI)Energy depletion (% of GNI)Mineral depletion (% of GNI)Net forest depletion (% of GNI)CO2 damage (% of GNI)Particulate emissions damage (% of GNI)Adjusted net savings (% of GNI)
3,470 1,258 1,7723,348 1,022 1,595
21.3 36.5 38.70.7 3.8 2.7
71 44 46.. .. ..
1,213 334 7161,148 1,361 3,065
33.0 27.8 28.4–0.8 0.5 0.33.0 11.7 9.9
61143
0.29 6,383 40,2380.4 1.8 2.47.8 16.0 10.0
.. 5.8 2.9
.. 17,980 143,440
.. 27,808 60,301
415 683 667.. 58.2 26.2.. 553 698.. 65.2 73.0.. 18.7 17.4
1.0 0.9 1.6
2,472 4,455 3,12139.5 3.2 20.2
97 84 8871 61 8765 48 8491 83 9357 31 4755 23 3564 42 66
29 41 538 .. ..
13 .. ..104 109 62
–0.5 18.4 29.710.8 10.9 9.96.9 3.7 3.10.0 10.4 6.30.0 2.2 1.20.0 0.5 0.30.2 0.5 0.70.0 0.4 0.6
–5.1 –1.2 14.7
201The Little Green Data Book 2013
Country data
Sub-Saharan Africa group
Lower middle-income group
Population (millions) 1.1 Land area (1,000 sq. km) 17 GDP ($ billions) 4.1
Swaziland

GNI per capita, World Bank Atlas method ($)Adjusted net national income per capita ($)Urban population (% of total)Urban population growth (avg. annual %, 1990–2011) AgricultureAgricultural land (% land area)Agricultural irrigated land (% of total agricultural land)Agricultural productivity, value added per worker (2000 $)Cereal yield (kg per hectare) Forests and biodiversityForest area (% land area)Deforestation (avg. annual %, 2000–2010)Terrestrial protected areas (% of total land area)Threatened species, mammalsThreatened species, birdsThreatened species, fishThreatened species, higher plants OceansTotal fisheries production (thousand metric tons)
Capture fisheries growth (avg. annual %, 1990–2011)Aquaculture growth (avg. annual %, 1990–2011)
Marine protected areas (% of territorial waters)Coral reef area (sq. km)Mangroves area (sq. km) Energy and emissionsEnergy use per capita (kg oil equivalent)Energy from biomass products and waste (% of total)Electric power consumption per capita (kWh)Electricity generated using fossil fuel (% of total)Electricity generated by hydropower (% of total)CO2 emissions per capita (metric tons) Water and sanitationInternal freshwater resources per capita (cu. m)Total freshwater withdrawal (% of internal resources)
Agriculture (% of total freshwater withdrawal)Access to improved water source (% of total population)
Rural (% of rural population)Urban (% of urban population)
Access to improved sanitation (% of total population)Rural (% of rural population)Urban (% of urban population)
Environment and healthParticulate matter (urban-pop.-weighted avg., µg/cu. m)Acute resp. infection prevalence (% of children under five)Diarrhea prevalence (% of children under five)Under-five mortality rate (per 1,000 live births) National accounting aggregates—savings, depletion and degradationGross savings (% of GNI)Consumption of fixed capital (% of GNI)Education expenditure (% of GNI)Energy depletion (% of GNI)Mineral depletion (% of GNI)Net forest depletion (% of GNI)CO2 damage (% of GNI)Particulate emissions damage (% of GNI)Adjusted net savings (% of GNI)
53,170 39,86050,463 34,611
85.2 80.50.6 1.1
7 372.0 ..
51,585 26,5154,716 5,349
68.7 28.4–0.3 0.010.9 12.9
14
124
195 28,774–1.5 –1.71.9 1.85.3 16.5
.. 81,970
.. 15,496
5,468 5,00023.2 4.4
14,939 9,4154.5 62.0
44.7 11.24.7 11.4
18,097 8,1951.5 10.3
4 41100 100100 98100 100100 100100 99100 100
10 22.. .... ..3 6
25.8 17.912.7 13.96.2 4.60.0 1.40.4 0.20.0 0.00.1 0.20.0 0.1
18.7 6.6
202 2013 The Little Green Data Book
Population (millions) 9.4 Land area (1,000 sq. km) 410 GDP ($ billions) 539.7
Country data
High-income group
Sweden

GNI per capita, World Bank Atlas method ($)Adjusted net national income per capita ($)Urban population (% of total)Urban population growth (avg. annual %, 1990–2011) AgricultureAgricultural land (% land area)Agricultural irrigated land (% of total agricultural land)Agricultural productivity, value added per worker (2000 $)Cereal yield (kg per hectare) Forests and biodiversityForest area (% land area)Deforestation (avg. annual %, 2000–2010)Terrestrial protected areas (% of total land area)Threatened species, mammalsThreatened species, birdsThreatened species, fishThreatened species, higher plants OceansTotal fisheries production (thousand metric tons)
Capture fisheries growth (avg. annual %, 1990–2011)Aquaculture growth (avg. annual %, 1990–2011)
Marine protected areas (% of territorial waters)Coral reef area (sq. km)Mangroves area (sq. km) Energy and emissionsEnergy use per capita (kg oil equivalent)Energy from biomass products and waste (% of total)Electric power consumption per capita (kWh)Electricity generated using fossil fuel (% of total)Electricity generated by hydropower (% of total)CO2 emissions per capita (metric tons) Water and sanitationInternal freshwater resources per capita (cu. m)Total freshwater withdrawal (% of internal resources)
Agriculture (% of total freshwater withdrawal)Access to improved water source (% of total population)
Rural (% of rural population)Urban (% of urban population)
Access to improved sanitation (% of total population)Rural (% of rural population)Urban (% of urban population)
Environment and healthParticulate matter (urban-pop.-weighted avg., µg/cu. m)Acute resp. infection prevalence (% of children under five)Diarrhea prevalence (% of children under five)Under-five mortality rate (per 1,000 live births) National accounting aggregates—savings, depletion and degradationGross savings (% of GNI)Consumption of fixed capital (% of GNI)Education expenditure (% of GNI)Energy depletion (% of GNI)Mineral depletion (% of GNI)Net forest depletion (% of GNI)CO2 damage (% of GNI)Particulate emissions damage (% of GNI)Adjusted net savings (% of GNI)
76,350 39,86073,014 34,611
73.7 80.50.8 1.1
38 372.4 ..
.. 26,5156,680 5,349
31.1 28.4–0.4 0.024.9 12.9
2392
2.9 28,774–3.0 –1.70.8 1.8
.. 16.5
.. 81,970
.. 15,496
3,349 5,0008.9 4.4
8,175 9,4151.7 62.0
54.6 11.25.4 11.4
5,106 8,1956.5 10.3
2 41100 100100 98100 100100 100100 99100 100
20 22.. .... ..4 6
31.3 17.914.5 13.95.3 4.60.0 1.40.0 0.20.0 0.00.0 0.20.1 0.1
21.9 6.6
203The Little Green Data Book 2013
Country data
High-income group
Population (millions) 7.9 Land area (1,000 sq. km) 40 GDP ($ billions) 659.3
Switzerland
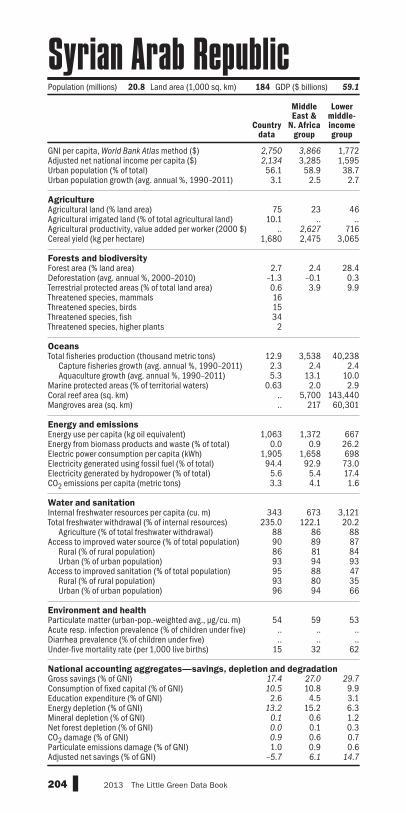
GNI per capita, World Bank Atlas method ($)Adjusted net national income per capita ($)Urban population (% of total)Urban population growth (avg. annual %, 1990–2011) AgricultureAgricultural land (% land area)Agricultural irrigated land (% of total agricultural land)Agricultural productivity, value added per worker (2000 $)Cereal yield (kg per hectare) Forests and biodiversityForest area (% land area)Deforestation (avg. annual %, 2000–2010)Terrestrial protected areas (% of total land area)Threatened species, mammalsThreatened species, birdsThreatened species, fishThreatened species, higher plants OceansTotal fisheries production (thousand metric tons)
Capture fisheries growth (avg. annual %, 1990–2011)Aquaculture growth (avg. annual %, 1990–2011)
Marine protected areas (% of territorial waters)Coral reef area (sq. km)Mangroves area (sq. km) Energy and emissionsEnergy use per capita (kg oil equivalent)Energy from biomass products and waste (% of total)Electric power consumption per capita (kWh)Electricity generated using fossil fuel (% of total)Electricity generated by hydropower (% of total)CO2 emissions per capita (metric tons) Water and sanitationInternal freshwater resources per capita (cu. m)Total freshwater withdrawal (% of internal resources)
Agriculture (% of total freshwater withdrawal)Access to improved water source (% of total population)
Rural (% of rural population)Urban (% of urban population)
Access to improved sanitation (% of total population)Rural (% of rural population)Urban (% of urban population)
Environment and healthParticulate matter (urban-pop.-weighted avg., µg/cu. m)Acute resp. infection prevalence (% of children under five)Diarrhea prevalence (% of children under five)Under-five mortality rate (per 1,000 live births) National accounting aggregates—savings, depletion and degradationGross savings (% of GNI)Consumption of fixed capital (% of GNI)Education expenditure (% of GNI)Energy depletion (% of GNI)Mineral depletion (% of GNI)Net forest depletion (% of GNI)CO2 damage (% of GNI)Particulate emissions damage (% of GNI)Adjusted net savings (% of GNI)
2,750 3,866 1,7722,134 3,285 1,59556.1 58.9 38.7
3.1 2.5 2.7
75 23 4610.1 .. ..
.. 2,627 7161,680 2,475 3,065
2.7 2.4 28.4–1.3 –0.1 0.30.6 3.9 9.9161534
2
12.9 3,538 40,2382.3 2.4 2.45.3 13.1 10.0
0.63 2.0 2.9.. 5,700 143,440.. 217 60,301
1,063 1,372 6670.0 0.9 26.2
1,905 1,658 69894.4 92.9 73.0
5.6 5.4 17.43.3 4.1 1.6
343 673 3,121235.0 122.1 20.2
88 86 8890 89 8786 81 8493 94 9395 88 4793 80 3596 94 66
54 59 53.. .. .... .. ..
15 32 62
17.4 27.0 29.710.5 10.8 9.9
2.6 4.5 3.113.2 15.2 6.3
0.1 0.6 1.20.0 0.1 0.30.9 0.6 0.71.0 0.9 0.6
–5.7 6.1 14.7
204 2013 The Little Green Data Book
Population (millions) 20.8 Land area (1,000 sq. km) 184 GDP ($ billions) 59.1
Country data
Middle East &
N. Africa group
Lower middle-income group
Syrian Arab Republic

GNI per capita, World Bank Atlas method ($)Adjusted net national income per capita ($)Urban population (% of total)Urban population growth (avg. annual %, 1990–2011) AgricultureAgricultural land (% land area)Agricultural irrigated land (% of total agricultural land)Agricultural productivity, value added per worker (2000 $)Cereal yield (kg per hectare) Forests and biodiversityForest area (% land area)Deforestation (avg. annual %, 2000–2010)Terrestrial protected areas (% of total land area)Threatened species, mammalsThreatened species, birdsThreatened species, fishThreatened species, higher plants OceansTotal fisheries production (thousand metric tons)
Capture fisheries growth (avg. annual %, 1990–2011)Aquaculture growth (avg. annual %, 1990–2011)
Marine protected areas (% of territorial waters)Coral reef area (sq. km)Mangroves area (sq. km) Energy and emissionsEnergy use per capita (kg oil equivalent)Energy from biomass products and waste (% of total)Electric power consumption per capita (kWh)Electricity generated using fossil fuel (% of total)Electricity generated by hydropower (% of total)CO2 emissions per capita (metric tons) Water and sanitationInternal freshwater resources per capita (cu. m)Total freshwater withdrawal (% of internal resources)
Agriculture (% of total freshwater withdrawal)Access to improved water source (% of total population)
Rural (% of rural population)Urban (% of urban population)
Access to improved sanitation (% of total population)Rural (% of rural population)Urban (% of urban population)
Environment and healthParticulate matter (urban-pop.-weighted avg., µg/cu. m)Acute resp. infection prevalence (% of children under five)Diarrhea prevalence (% of children under five)Under-five mortality rate (per 1,000 live births) National accounting aggregates—savings, depletion and degradationGross savings (% of GNI)Consumption of fixed capital (% of GNI)Education expenditure (% of GNI)Energy depletion (% of GNI)Mineral depletion (% of GNI)Net forest depletion (% of GNI)CO2 damage (% of GNI)Particulate emissions damage (% of GNI)Adjusted net savings (% of GNI)
870 7,734 571832 6,652 52126.6 64.7 28.0
0.5 0.3 3.5
35 28 3914.8 .. ..600 3,374 308
2,519 2,740 2,034
2.9 38.7 25.70.0 0.0 0.64.1 7.5 10.0
812
513
0.70 5,790 11,563–2.7 –2.9 4.0–8.7 –0.5 4.9
.. 10.4 ..
.. .. 15,120
.. .. 25,818
336 3,015 3630.0 2.0 66.2
2,004 4,059 2423.4 65.4 32.0
96.6 18.8 45.30.4 7.1 0.3
9,096 12,498 5,12518.1 6.3 4.5
91 60 9064 96 6554 91 5792 99 8694 84 3794 81 3295 87 47
29 21 54.. .. .... .. ..
63 21 95
23.5 26.1 25.28.7 12.3 7.73.2 3.6 3.00.4 9.3 1.40.7 0.8 2.00.0 0.0 1.20.5 0.7 0.30.2 0.3 0.5
16.1 6.2 15.2
205The Little Green Data Book 2013
Country data
Europe & Central
Asia group
Low-income group
Population (millions) 7.0 Land area (1,000 sq. km) 140 GDP ($ billions) 6.5
Tajikistan

GNI per capita, World Bank Atlas method ($)Adjusted net national income per capita ($)Urban population (% of total)Urban population growth (avg. annual %, 1990–2011) AgricultureAgricultural land (% land area)Agricultural irrigated land (% of total agricultural land)Agricultural productivity, value added per worker (2000 $)Cereal yield (kg per hectare) Forests and biodiversityForest area (% land area)Deforestation (avg. annual %, 2000–2010)Terrestrial protected areas (% of total land area)Threatened species, mammalsThreatened species, birdsThreatened species, fishThreatened species, higher plants OceansTotal fisheries production (thousand metric tons)
Capture fisheries growth (avg. annual %, 1990–2011)Aquaculture growth (avg. annual %, 1990–2011)
Marine protected areas (% of territorial waters)Coral reef area (sq. km)Mangroves area (sq. km) Energy and emissionsEnergy use per capita (kg oil equivalent)Energy from biomass products and waste (% of total)Electric power consumption per capita (kWh)Electricity generated using fossil fuel (% of total)Electricity generated by hydropower (% of total)CO2 emissions per capita (metric tons) Water and sanitationInternal freshwater resources per capita (cu. m)Total freshwater withdrawal (% of internal resources)
Agriculture (% of total freshwater withdrawal)Access to improved water source (% of total population)
Rural (% of rural population)Urban (% of urban population)
Access to improved sanitation (% of total population)Rural (% of rural population)Urban (% of urban population)
Environment and healthParticulate matter (urban-pop.-weighted avg., µg/cu. m)Acute resp. infection prevalence (% of children under five)Diarrhea prevalence (% of children under five)Under-five mortality rate (per 1,000 live births) National accounting aggregates—savings, depletion and degradationGross savings (% of GNI)Consumption of fixed capital (% of GNI)Education expenditure (% of GNI)Energy depletion (% of GNI)Mineral depletion (% of GNI)Net forest depletion (% of GNI)CO2 damage (% of GNI)Particulate emissions damage (% of GNI)Adjusted net savings (% of GNI)
540 1,258 571462 1,022 52126.7 36.5 28.04.5 3.8 3.5
42 44 39.. .. ..
291 334 3081,361 1,361 2,034
37.3 27.8 25.71.1 0.5 0.6
27.5 11.7 10.03544
175295
351 6,383 11,563–0.9 1.8 4.08.2 16.0 4.9
10.0 5.8 ..3,580 17,980 15,1201,287 27,808 25,818
448 683 36388.4 58.2 66.2
78 553 24242.0 65.2 32.058.0 18.7 45.3
0.2 0.9 0.3
1,817 4,455 5,1256.2 3.2 4.589 84 9053 61 6544 48 5779 83 8610 31 377 23 32
20 42 47
19 41 544 .. ..
15 .. ..68 109 95
20.6 18.4 25.27.8 10.9 7.72.4 3.7 3.00.3 10.4 1.44.0 2.2 2.00.0 0.5 1.20.3 0.5 0.30.0 0.4 0.5
10.5 –1.2 15.2
206 2013 The Little Green Data Book
Population (millions) 46.2 Land area (1,000 sq. km) 886 GDP ($ billions) 23.9
Country data
Sub-Saharan Africa group
Low-income group
Tanzania

GNI per capita, World Bank Atlas method ($)Adjusted net national income per capita ($)Urban population (% of total)Urban population growth (avg. annual %, 1990–2011) AgricultureAgricultural land (% land area)Agricultural irrigated land (% of total agricultural land)Agricultural productivity, value added per worker (2000 $)Cereal yield (kg per hectare) Forests and biodiversityForest area (% land area)Deforestation (avg. annual %, 2000–2010)Terrestrial protected areas (% of total land area)Threatened species, mammalsThreatened species, birdsThreatened species, fishThreatened species, higher plants OceansTotal fisheries production (thousand metric tons)
Capture fisheries growth (avg. annual %, 1990–2011)Aquaculture growth (avg. annual %, 1990–2011)
Marine protected areas (% of territorial waters)Coral reef area (sq. km)Mangroves area (sq. km) Energy and emissionsEnergy use per capita (kg oil equivalent)Energy from biomass products and waste (% of total)Electric power consumption per capita (kWh)Electricity generated using fossil fuel (% of total)Electricity generated by hydropower (% of total)CO2 emissions per capita (metric tons) Water and sanitationInternal freshwater resources per capita (cu. m)Total freshwater withdrawal (% of internal resources)
Agriculture (% of total freshwater withdrawal)Access to improved water source (% of total population)
Rural (% of rural population)Urban (% of urban population)
Access to improved sanitation (% of total population)Rural (% of rural population)Urban (% of urban population)
Environment and healthParticulate matter (urban-pop.-weighted avg., µg/cu. m)Acute resp. infection prevalence (% of children under five)Diarrhea prevalence (% of children under five)Under-five mortality rate (per 1,000 live births) National accounting aggregates—savings, depletion and degradationGross savings (% of GNI)Consumption of fixed capital (% of GNI)Education expenditure (% of GNI)Energy depletion (% of GNI)Mineral depletion (% of GNI)Net forest depletion (% of GNI)CO2 damage (% of GNI)Particulate emissions damage (% of GNI)Adjusted net savings (% of GNI)
4,440 4,248 6,5634,098 3,884 5,821
34.1 48.6 60.61.6 3.6 2.5
41 48 35.. .. ..
743 610 8693,065 5,050 3,944
37.2 29.7 34.80.0 –0.4 0.0
20.1 15.0 13.3574796
116
2,870 101,299 97,437–1.4 3.4 0.76.1 9.1 9.04.4 1.4 8.4
2,130 137,690 33,3502,484 56,537 48,783
1,699 1,520 1,94819.2 10.9 8.1
2,243 2,337 2,94294.4 79.8 72.9
3.5 16.5 21.34.0 4.6 5.5
3,229 4,446 8,55025.5 10.9 5.6
90 73 6696 90 9395 84 8697 97 9896 66 7396 58 6295 76 81
53 55 42.. .. .... .. ..
12 21 20
32.3 49.3 36.411.3 11.0 11.8
4.1 2.1 3.33.3 4.3 5.70.1 1.7 1.60.1 0.0 0.00.7 0.9 0.70.3 1.1 0.7
20.8 32.2 19.2
207The Little Green Data Book 2013
Country data
East Asia & Pacific
group
Upper middle-income group
Population (millions) 69.5 Land area (1,000 sq. km) 511 GDP ($ billions) 345.7
Thailand
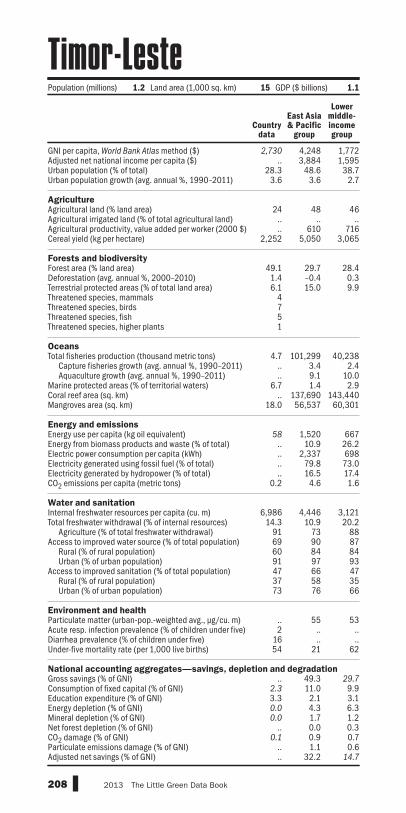
GNI per capita, World Bank Atlas method ($)Adjusted net national income per capita ($)Urban population (% of total)Urban population growth (avg. annual %, 1990–2011) AgricultureAgricultural land (% land area)Agricultural irrigated land (% of total agricultural land)Agricultural productivity, value added per worker (2000 $)Cereal yield (kg per hectare) Forests and biodiversityForest area (% land area)Deforestation (avg. annual %, 2000–2010)Terrestrial protected areas (% of total land area)Threatened species, mammalsThreatened species, birdsThreatened species, fishThreatened species, higher plants OceansTotal fisheries production (thousand metric tons)
Capture fisheries growth (avg. annual %, 1990–2011)Aquaculture growth (avg. annual %, 1990–2011)
Marine protected areas (% of territorial waters)Coral reef area (sq. km)Mangroves area (sq. km) Energy and emissionsEnergy use per capita (kg oil equivalent)Energy from biomass products and waste (% of total)Electric power consumption per capita (kWh)Electricity generated using fossil fuel (% of total)Electricity generated by hydropower (% of total)CO2 emissions per capita (metric tons) Water and sanitationInternal freshwater resources per capita (cu. m)Total freshwater withdrawal (% of internal resources)
Agriculture (% of total freshwater withdrawal)Access to improved water source (% of total population)
Rural (% of rural population)Urban (% of urban population)
Access to improved sanitation (% of total population)Rural (% of rural population)Urban (% of urban population)
Environment and healthParticulate matter (urban-pop.-weighted avg., µg/cu. m)Acute resp. infection prevalence (% of children under five)Diarrhea prevalence (% of children under five)Under-five mortality rate (per 1,000 live births) National accounting aggregates—savings, depletion and degradationGross savings (% of GNI)Consumption of fixed capital (% of GNI)Education expenditure (% of GNI)Energy depletion (% of GNI)Mineral depletion (% of GNI)Net forest depletion (% of GNI)CO2 damage (% of GNI)Particulate emissions damage (% of GNI)Adjusted net savings (% of GNI)
2,730 4,248 1,772.. 3,884 1,595
28.3 48.6 38.73.6 3.6 2.7
24 48 46.. .. .... 610 716
2,252 5,050 3,065
49.1 29.7 28.41.4 –0.4 0.36.1 15.0 9.9
4751
4.7 101,299 40,238.. 3.4 2.4.. 9.1 10.0
6.7 1.4 2.9.. 137,690 143,440
18.0 56,537 60,301
58 1,520 667.. 10.9 26.2.. 2,337 698.. 79.8 73.0.. 16.5 17.4
0.2 4.6 1.6
6,986 4,446 3,12114.3 10.9 20.2
91 73 8869 90 8760 84 8491 97 9347 66 4737 58 3573 76 66
.. 55 532 .. ..
16 .. ..54 21 62
.. 49.3 29.72.3 11.0 9.93.3 2.1 3.10.0 4.3 6.30.0 1.7 1.2
.. 0.0 0.30.1 0.9 0.7
.. 1.1 0.6
.. 32.2 14.7
208 2013 The Little Green Data Book
Population (millions) 1.2 Land area (1,000 sq. km) 15 GDP ($ billions) 1.1
Country data
East Asia & Pacific
group
Lower middle-income group
Timor-Leste
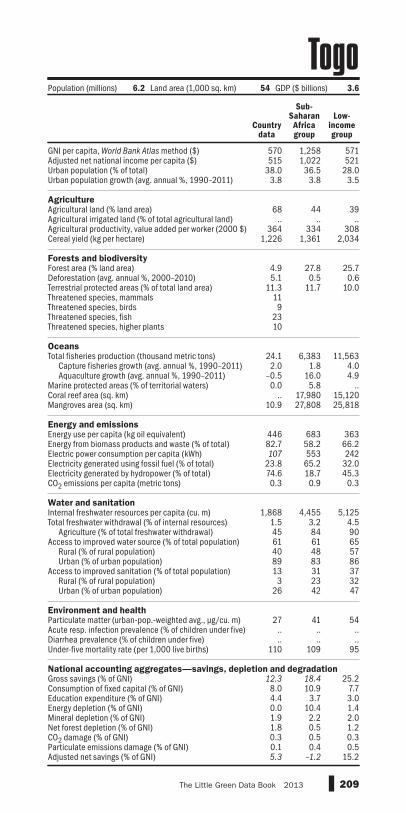
GNI per capita, World Bank Atlas method ($)Adjusted net national income per capita ($)Urban population (% of total)Urban population growth (avg. annual %, 1990–2011) AgricultureAgricultural land (% land area)Agricultural irrigated land (% of total agricultural land)Agricultural productivity, value added per worker (2000 $)Cereal yield (kg per hectare) Forests and biodiversityForest area (% land area)Deforestation (avg. annual %, 2000–2010)Terrestrial protected areas (% of total land area)Threatened species, mammalsThreatened species, birdsThreatened species, fishThreatened species, higher plants OceansTotal fisheries production (thousand metric tons)
Capture fisheries growth (avg. annual %, 1990–2011)Aquaculture growth (avg. annual %, 1990–2011)
Marine protected areas (% of territorial waters)Coral reef area (sq. km)Mangroves area (sq. km) Energy and emissionsEnergy use per capita (kg oil equivalent)Energy from biomass products and waste (% of total)Electric power consumption per capita (kWh)Electricity generated using fossil fuel (% of total)Electricity generated by hydropower (% of total)CO2 emissions per capita (metric tons) Water and sanitationInternal freshwater resources per capita (cu. m)Total freshwater withdrawal (% of internal resources)
Agriculture (% of total freshwater withdrawal)Access to improved water source (% of total population)
Rural (% of rural population)Urban (% of urban population)
Access to improved sanitation (% of total population)Rural (% of rural population)Urban (% of urban population)
Environment and healthParticulate matter (urban-pop.-weighted avg., µg/cu. m)Acute resp. infection prevalence (% of children under five)Diarrhea prevalence (% of children under five)Under-five mortality rate (per 1,000 live births) National accounting aggregates—savings, depletion and degradationGross savings (% of GNI)Consumption of fixed capital (% of GNI)Education expenditure (% of GNI)Energy depletion (% of GNI)Mineral depletion (% of GNI)Net forest depletion (% of GNI)CO2 damage (% of GNI)Particulate emissions damage (% of GNI)Adjusted net savings (% of GNI)
570 1,258 571515 1,022 521
38.0 36.5 28.03.8 3.8 3.5
68 44 39.. .. ..
364 334 3081,226 1,361 2,034
4.9 27.8 25.75.1 0.5 0.6
11.3 11.7 10.0119
2310
24.1 6,383 11,5632.0 1.8 4.0
–0.5 16.0 4.90.0 5.8 ..
.. 17,980 15,12010.9 27,808 25,818
446 683 36382.7 58.2 66.2107 553 242
23.8 65.2 32.074.6 18.7 45.30.3 0.9 0.3
1,868 4,455 5,1251.5 3.2 4.545 84 9061 61 6540 48 5789 83 8613 31 37
3 23 3226 42 47
27 41 54.. .. .... .. ..
110 109 95
12.3 18.4 25.28.0 10.9 7.74.4 3.7 3.00.0 10.4 1.41.9 2.2 2.01.8 0.5 1.20.3 0.5 0.30.1 0.4 0.55.3 –1.2 15.2
209The Little Green Data Book 2013
Country data
Sub-Saharan Africa group
Low-income group
Population (millions) 6.2 Land area (1,000 sq. km) 54 GDP ($ billions) 3.6
Togo

GNI per capita, World Bank Atlas method ($)Adjusted net national income per capita ($)Urban population (% of total)Urban population growth (avg. annual %, 1990–2011) AgricultureAgricultural land (% land area)Agricultural irrigated land (% of total agricultural land)Agricultural productivity, value added per worker (2000 $)Cereal yield (kg per hectare) Forests and biodiversityForest area (% land area)Deforestation (avg. annual %, 2000–2010)Terrestrial protected areas (% of total land area)Threatened species, mammalsThreatened species, birdsThreatened species, fishThreatened species, higher plants OceansTotal fisheries production (thousand metric tons)
Capture fisheries growth (avg. annual %, 1990–2011)Aquaculture growth (avg. annual %, 1990–2011)
Marine protected areas (% of territorial waters)Coral reef area (sq. km)Mangroves area (sq. km) Energy and emissionsEnergy use per capita (kg oil equivalent)Energy from biomass products and waste (% of total)Electric power consumption per capita (kWh)Electricity generated using fossil fuel (% of total)Electricity generated by hydropower (% of total)CO2 emissions per capita (metric tons) Water and sanitationInternal freshwater resources per capita (cu. m)Total freshwater withdrawal (% of internal resources)
Agriculture (% of total freshwater withdrawal)Access to improved water source (% of total population)
Rural (% of rural population)Urban (% of urban population)
Access to improved sanitation (% of total population)Rural (% of rural population)Urban (% of urban population)
Environment and healthParticulate matter (urban-pop.-weighted avg., µg/cu. m)Acute resp. infection prevalence (% of children under five)Diarrhea prevalence (% of children under five)Under-five mortality rate (per 1,000 live births) National accounting aggregates—savings, depletion and degradationGross savings (% of GNI)Consumption of fixed capital (% of GNI)Education expenditure (% of GNI)Energy depletion (% of GNI)Mineral depletion (% of GNI)Net forest depletion (% of GNI)CO2 damage (% of GNI)Particulate emissions damage (% of GNI)Adjusted net savings (% of GNI)
3,820 4,248 1,7723,804 3,884 1,595
23.5 48.6 38.70.6 3.6 2.7
43 48 46.. .. ..
3,278 610 716.. 5,050 3,065
12.5 29.7 28.40.0 –0.4 0.3
14.5 15.0 9.925
122
2.1 101,299 40,2381.2 3.4 2.4
.. 9.1 10.09.4 1.4 2.9
1,500 137,690 143,4403.4 56,537 60,301
567 1,520 667.. 10.9 26.2.. 2,337 698.. 79.8 73.0.. 16.5 17.4
1.7 4.6 1.6
.. 4,446 3,121
.. 10.9 20.2
.. 73 88100 90 87100 84 84100 97 93
96 66 4796 58 3598 76 66
.. 55 53
.. .. ..
.. .. ..15 21 62
3.8 49.3 29.710.4 11.0 9.93.0 2.1 3.10.0 4.3 6.30.0 1.7 1.20.0 0.0 0.30.3 0.9 0.7
.. 1.1 0.6
.. 32.2 14.7
210 2013 The Little Green Data Book
Population (thousands) 105 Land area (sq. km) 720 GDP ($ millions) 433.9
Country data
East Asia & Pacific
group
Lower middle-income group
Tonga
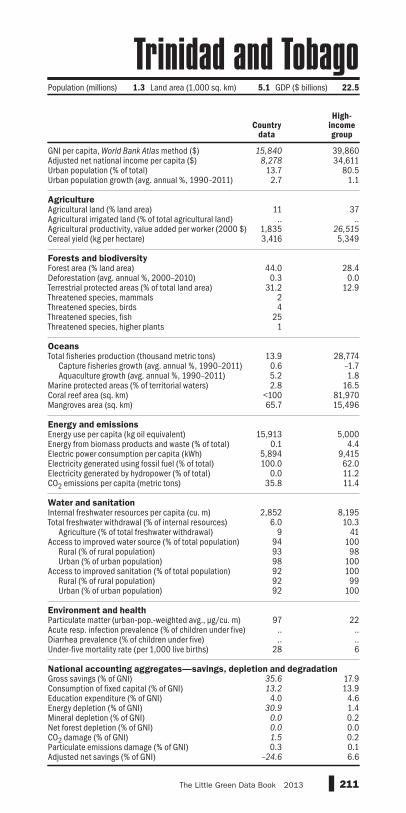
GNI per capita, World Bank Atlas method ($)Adjusted net national income per capita ($)Urban population (% of total)Urban population growth (avg. annual %, 1990–2011) AgricultureAgricultural land (% land area)Agricultural irrigated land (% of total agricultural land)Agricultural productivity, value added per worker (2000 $)Cereal yield (kg per hectare) Forests and biodiversityForest area (% land area)Deforestation (avg. annual %, 2000–2010)Terrestrial protected areas (% of total land area)Threatened species, mammalsThreatened species, birdsThreatened species, fishThreatened species, higher plants OceansTotal fisheries production (thousand metric tons)
Capture fisheries growth (avg. annual %, 1990–2011)Aquaculture growth (avg. annual %, 1990–2011)
Marine protected areas (% of territorial waters)Coral reef area (sq. km)Mangroves area (sq. km) Energy and emissionsEnergy use per capita (kg oil equivalent)Energy from biomass products and waste (% of total)Electric power consumption per capita (kWh)Electricity generated using fossil fuel (% of total)Electricity generated by hydropower (% of total)CO2 emissions per capita (metric tons) Water and sanitationInternal freshwater resources per capita (cu. m)Total freshwater withdrawal (% of internal resources)
Agriculture (% of total freshwater withdrawal)Access to improved water source (% of total population)
Rural (% of rural population)Urban (% of urban population)
Access to improved sanitation (% of total population)Rural (% of rural population)Urban (% of urban population)
Environment and healthParticulate matter (urban-pop.-weighted avg., µg/cu. m)Acute resp. infection prevalence (% of children under five)Diarrhea prevalence (% of children under five)Under-five mortality rate (per 1,000 live births) National accounting aggregates—savings, depletion and degradationGross savings (% of GNI)Consumption of fixed capital (% of GNI)Education expenditure (% of GNI)Energy depletion (% of GNI)Mineral depletion (% of GNI)Net forest depletion (% of GNI)CO2 damage (% of GNI)Particulate emissions damage (% of GNI)Adjusted net savings (% of GNI)
15,840 39,8608,278 34,611
13.7 80.52.7 1.1
11 37.. ..
1,835 26,5153,416 5,349
44.0 28.40.3 0.0
31.2 12.924
251
13.9 28,7740.6 –1.75.2 1.82.8 16.5
<100 81,97065.7 15,496
15,913 5,0000.1 4.4
5,894 9,415100.0 62.0
0.0 11.235.8 11.4
2,852 8,1956.0 10.3
9 4194 10093 9898 10092 10092 9992 100
97 22.. .... ..
28 6
35.6 17.913.2 13.9
4.0 4.630.9 1.4
0.0 0.20.0 0.01.5 0.20.3 0.1
–24.6 6.6
211The Little Green Data Book 2013
Country data
High-income group
Population (millions) 1.3 Land area (1,000 sq. km) 5.1 GDP ($ billions) 22.5
Trinidad and Tobago
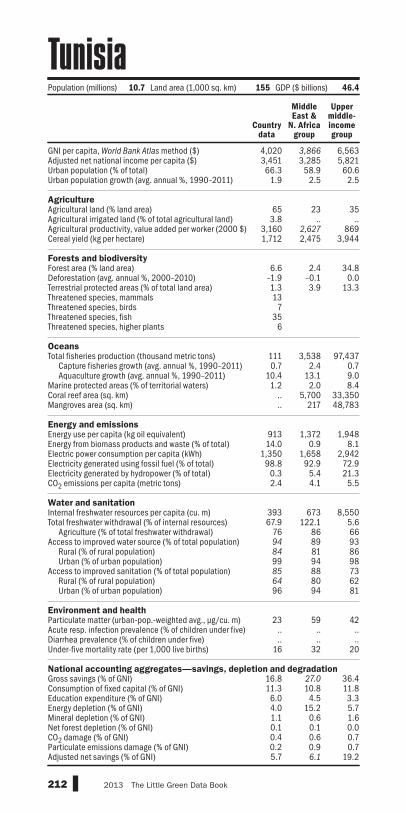
GNI per capita, World Bank Atlas method ($)Adjusted net national income per capita ($)Urban population (% of total)Urban population growth (avg. annual %, 1990–2011) AgricultureAgricultural land (% land area)Agricultural irrigated land (% of total agricultural land)Agricultural productivity, value added per worker (2000 $)Cereal yield (kg per hectare) Forests and biodiversityForest area (% land area)Deforestation (avg. annual %, 2000–2010)Terrestrial protected areas (% of total land area)Threatened species, mammalsThreatened species, birdsThreatened species, fishThreatened species, higher plants OceansTotal fisheries production (thousand metric tons)
Capture fisheries growth (avg. annual %, 1990–2011)Aquaculture growth (avg. annual %, 1990–2011)
Marine protected areas (% of territorial waters)Coral reef area (sq. km)Mangroves area (sq. km) Energy and emissionsEnergy use per capita (kg oil equivalent)Energy from biomass products and waste (% of total)Electric power consumption per capita (kWh)Electricity generated using fossil fuel (% of total)Electricity generated by hydropower (% of total)CO2 emissions per capita (metric tons) Water and sanitationInternal freshwater resources per capita (cu. m)Total freshwater withdrawal (% of internal resources)
Agriculture (% of total freshwater withdrawal)Access to improved water source (% of total population)
Rural (% of rural population)Urban (% of urban population)
Access to improved sanitation (% of total population)Rural (% of rural population)Urban (% of urban population)
Environment and healthParticulate matter (urban-pop.-weighted avg., µg/cu. m)Acute resp. infection prevalence (% of children under five)Diarrhea prevalence (% of children under five)Under-five mortality rate (per 1,000 live births) National accounting aggregates—savings, depletion and degradationGross savings (% of GNI)Consumption of fixed capital (% of GNI)Education expenditure (% of GNI)Energy depletion (% of GNI)Mineral depletion (% of GNI)Net forest depletion (% of GNI)CO2 damage (% of GNI)Particulate emissions damage (% of GNI)Adjusted net savings (% of GNI)
4,020 3,866 6,5633,451 3,285 5,82166.3 58.9 60.6
1.9 2.5 2.5
65 23 353.8 .. ..
3,160 2,627 8691,712 2,475 3,944
6.6 2.4 34.8–1.9 –0.1 0.01.3 3.9 13.313
735
6
111 3,538 97,4370.7 2.4 0.7
10.4 13.1 9.01.2 2.0 8.4
.. 5,700 33,350
.. 217 48,783
913 1,372 1,94814.0 0.9 8.1
1,350 1,658 2,94298.8 92.9 72.9
0.3 5.4 21.32.4 4.1 5.5
393 673 8,55067.9 122.1 5.6
76 86 6694 89 9384 81 8699 94 9885 88 7364 80 6296 94 81
23 59 42.. .. .... .. ..
16 32 20
16.8 27.0 36.411.3 10.8 11.86.0 4.5 3.34.0 15.2 5.71.1 0.6 1.60.1 0.1 0.00.4 0.6 0.70.2 0.9 0.75.7 6.1 19.2
212 2013 The Little Green Data Book
Population (millions) 10.7 Land area (1,000 sq. km) 155 GDP ($ billions) 46.4
Country data
Middle East &
N. Africa group
Upper middle-income group
Tunisia

GNI per capita, World Bank Atlas method ($)Adjusted net national income per capita ($)Urban population (% of total)Urban population growth (avg. annual %, 1990–2011) AgricultureAgricultural land (% land area)Agricultural irrigated land (% of total agricultural land)Agricultural productivity, value added per worker (2000 $)Cereal yield (kg per hectare) Forests and biodiversityForest area (% land area)Deforestation (avg. annual %, 2000–2010)Terrestrial protected areas (% of total land area)Threatened species, mammalsThreatened species, birdsThreatened species, fishThreatened species, higher plants OceansTotal fisheries production (thousand metric tons)
Capture fisheries growth (avg. annual %, 1990–2011)Aquaculture growth (avg. annual %, 1990–2011)
Marine protected areas (% of territorial waters)Coral reef area (sq. km)Mangroves area (sq. km) Energy and emissionsEnergy use per capita (kg oil equivalent)Energy from biomass products and waste (% of total)Electric power consumption per capita (kWh)Electricity generated using fossil fuel (% of total)Electricity generated by hydropower (% of total)CO2 emissions per capita (metric tons) Water and sanitationInternal freshwater resources per capita (cu. m)Total freshwater withdrawal (% of internal resources)
Agriculture (% of total freshwater withdrawal)Access to improved water source (% of total population)
Rural (% of rural population)Urban (% of urban population)
Access to improved sanitation (% of total population)Rural (% of rural population)Urban (% of urban population)
Environment and healthParticulate matter (urban-pop.-weighted avg., µg/cu. m)Acute resp. infection prevalence (% of children under five)Diarrhea prevalence (% of children under five)Under-five mortality rate (per 1,000 live births) National accounting aggregates—savings, depletion and degradationGross savings (% of GNI)Consumption of fixed capital (% of GNI)Education expenditure (% of GNI)Energy depletion (% of GNI)Mineral depletion (% of GNI)Net forest depletion (% of GNI)CO2 damage (% of GNI)Particulate emissions damage (% of GNI)Adjusted net savings (% of GNI)
10,410 7,734 6,5639,104 6,652 5,821
71.4 64.7 60.62.4 0.3 2.5
50 28 3513.6 .. ..
4,035 3,374 8692,958 2,740 3,944
14.9 38.7 34.8–1.1 0.0 0.01.9 7.5 13.3171670
7
704 5,790 97,4371.5 –2.9 0.7
18.1 –0.5 9.02.4 10.4 8.4
.. .. 33,350
.. .. 48,783
1,445 3,015 1,9484.3 2.0 8.1
2,477 4,059 2,94273.6 65.4 72.924.5 18.8 21.33.9 7.1 5.5
3,083 12,498 8,55017.7 6.3 5.6
74 60 66100 96 9399 91 86
100 99 9890 84 7375 81 6297 87 81
35 21 42.. .. .... .. ..
15 21 20
14.3 26.1 36.412.1 12.3 11.82.6 3.6 3.30.3 9.3 5.70.2 0.8 1.60.0 0.0 0.00.3 0.7 0.70.9 0.3 0.73.1 6.2 19.2
213The Little Green Data Book 2013
Country data
Europe & Central
Asia group
Upper middle-income group
Population (millions) 73.6 Land area (1,000 sq. km) 770 GDP ($ billions) 775.0
Turkey

GNI per capita, World Bank Atlas method ($)Adjusted net national income per capita ($)Urban population (% of total)Urban population growth (avg. annual %, 1990–2011) AgricultureAgricultural land (% land area)Agricultural irrigated land (% of total agricultural land)Agricultural productivity, value added per worker (2000 $)Cereal yield (kg per hectare) Forests and biodiversityForest area (% land area)Deforestation (avg. annual %, 2000–2010)Terrestrial protected areas (% of total land area)Threatened species, mammalsThreatened species, birdsThreatened species, fishThreatened species, higher plants OceansTotal fisheries production (thousand metric tons)
Capture fisheries growth (avg. annual %, 1990–2011)Aquaculture growth (avg. annual %, 1990–2011)
Marine protected areas (% of territorial waters)Coral reef area (sq. km)Mangroves area (sq. km) Energy and emissionsEnergy use per capita (kg oil equivalent)Energy from biomass products and waste (% of total)Electric power consumption per capita (kWh)Electricity generated using fossil fuel (% of total)Electricity generated by hydropower (% of total)CO2 emissions per capita (metric tons) Water and sanitationInternal freshwater resources per capita (cu. m)Total freshwater withdrawal (% of internal resources)
Agriculture (% of total freshwater withdrawal)Access to improved water source (% of total population)
Rural (% of rural population)Urban (% of urban population)
Access to improved sanitation (% of total population)Rural (% of rural population)Urban (% of urban population)
Environment and healthParticulate matter (urban-pop.-weighted avg., µg/cu. m)Acute resp. infection prevalence (% of children under five)Diarrhea prevalence (% of children under five)Under-five mortality rate (per 1,000 live births) National accounting aggregates—savings, depletion and degradationGross savings (% of GNI)Consumption of fixed capital (% of GNI)Education expenditure (% of GNI)Energy depletion (% of GNI)Mineral depletion (% of GNI)Net forest depletion (% of GNI)CO2 damage (% of GNI)Particulate emissions damage (% of GNI)Adjusted net savings (% of GNI)
4,800 7,734 6,563.. 6,652 5,821
48.7 64.7 60.61.9 0.3 2.5
69 28 35.. .. ..
2,156 3,374 8693,564 2,740 3,944
8.8 38.7 34.80.0 0.0 0.03.0 7.5 13.3
916114
15.0 5,790 97,437–4.8 –2.9 0.7
–21.0 –0.5 9.0.. 10.4 8.4.. .. 33,350.. .. 48,783
4,226 3,015 1,9480.0 2.0 8.1
2,403 4,059 2,942100.0 65.4 72.9
0.0 18.8 21.39.7 7.1 5.5
275 12,498 8,5501,989.3 6.3 5.6
94 60 6684 96 9372 91 8697 99 9898 84 7397 81 6299 87 81
36 21 42.. .. .... .. ..
53 21 20
.. 26.1 36.412.0 12.3 11.8
.. 3.6 3.334.9 9.3 5.7
0.0 0.8 1.6.. 0.0 0.0
2.1 0.7 0.70.6 0.3 0.7
.. 6.2 19.2
214 2013 The Little Green Data Book
Population (millions) 5.1 Land area (1,000 sq. km) 470 GDP ($ billions) 28.1
Country data
Europe & Central
Asia group
Upper middle-income group
Turkmenistan

GNI per capita, World Bank Atlas method ($)Adjusted net national income per capita ($)Urban population (% of total)Urban population growth (avg. annual %, 1990–2011) AgricultureAgricultural land (% land area)Agricultural irrigated land (% of total agricultural land)Agricultural productivity, value added per worker (2000 $)Cereal yield (kg per hectare) Forests and biodiversityForest area (% land area)Deforestation (avg. annual %, 2000–2010)Terrestrial protected areas (% of total land area)Threatened species, mammalsThreatened species, birdsThreatened species, fishThreatened species, higher plants OceansTotal fisheries production (thousand metric tons)
Capture fisheries growth (avg. annual %, 1990–2011)Aquaculture growth (avg. annual %, 1990–2011)
Marine protected areas (% of territorial waters)Coral reef area (sq. km)Mangroves area (sq. km) Energy and emissionsEnergy use per capita (kg oil equivalent)Energy from biomass products and waste (% of total)Electric power consumption per capita (kWh)Electricity generated using fossil fuel (% of total)Electricity generated by hydropower (% of total)CO2 emissions per capita (metric tons) Water and sanitationInternal freshwater resources per capita (cu. m)Total freshwater withdrawal (% of internal resources)
Agriculture (% of total freshwater withdrawal)Access to improved water source (% of total population)
Rural (% of rural population)Urban (% of urban population)
Access to improved sanitation (% of total population)Rural (% of rural population)Urban (% of urban population)
Environment and healthParticulate matter (urban-pop.-weighted avg., µg/cu. m)Acute resp. infection prevalence (% of children under five)Diarrhea prevalence (% of children under five)Under-five mortality rate (per 1,000 live births) National accounting aggregates—savings, depletion and degradationGross savings (% of GNI)Consumption of fixed capital (% of GNI)Education expenditure (% of GNI)Energy depletion (% of GNI)Mineral depletion (% of GNI)Net forest depletion (% of GNI)CO2 damage (% of GNI)Particulate emissions damage (% of GNI)Adjusted net savings (% of GNI)
.. 39,860
.. 34,61193.7 80.56.9 1.1
1 37.. .... 26,515.. 5,349
36.2 28.40.0 0.0
42.9 12.922
187
3.8 28,7740.1 –1.7
.. 1.80.95 16.5730 81,970236 15,496
.. 5,000
.. 4.4
.. 9,415
.. 62.0
.. 11.24.3 11.4
.. 8,195
.. 10.3
.. 41100 100100 98100 100
.. 100
.. 9998 100
.. 22
.. ..
.. ..
.. 6
.. 17.9
.. 13.9
.. 4.6
.. 1.4
.. 0.2
.. 0.0
.. 0.2
.. 0.1
.. 6.6
215The Little Green Data Book 2013
Population (thousands) 39 Land area (sq. km) 950 GDP ($ millions) ..
Country data
High-income group
Turks and Caicos Islands
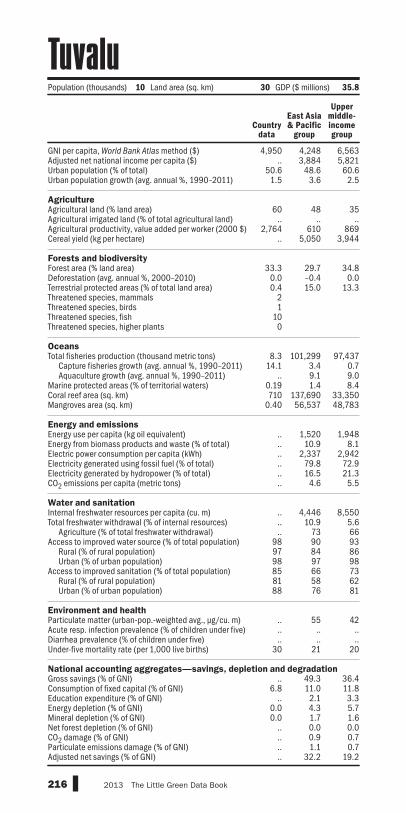
GNI per capita, World Bank Atlas method ($)Adjusted net national income per capita ($)Urban population (% of total)Urban population growth (avg. annual %, 1990–2011) AgricultureAgricultural land (% land area)Agricultural irrigated land (% of total agricultural land)Agricultural productivity, value added per worker (2000 $)Cereal yield (kg per hectare) Forests and biodiversityForest area (% land area)Deforestation (avg. annual %, 2000–2010)Terrestrial protected areas (% of total land area)Threatened species, mammalsThreatened species, birdsThreatened species, fishThreatened species, higher plants OceansTotal fisheries production (thousand metric tons)
Capture fisheries growth (avg. annual %, 1990–2011)Aquaculture growth (avg. annual %, 1990–2011)
Marine protected areas (% of territorial waters)Coral reef area (sq. km)Mangroves area (sq. km) Energy and emissionsEnergy use per capita (kg oil equivalent)Energy from biomass products and waste (% of total)Electric power consumption per capita (kWh)Electricity generated using fossil fuel (% of total)Electricity generated by hydropower (% of total)CO2 emissions per capita (metric tons) Water and sanitationInternal freshwater resources per capita (cu. m)Total freshwater withdrawal (% of internal resources)
Agriculture (% of total freshwater withdrawal)Access to improved water source (% of total population)
Rural (% of rural population)Urban (% of urban population)
Access to improved sanitation (% of total population)Rural (% of rural population)Urban (% of urban population)
Environment and healthParticulate matter (urban-pop.-weighted avg., µg/cu. m)Acute resp. infection prevalence (% of children under five)Diarrhea prevalence (% of children under five)Under-five mortality rate (per 1,000 live births) National accounting aggregates—savings, depletion and degradationGross savings (% of GNI)Consumption of fixed capital (% of GNI)Education expenditure (% of GNI)Energy depletion (% of GNI)Mineral depletion (% of GNI)Net forest depletion (% of GNI)CO2 damage (% of GNI)Particulate emissions damage (% of GNI)Adjusted net savings (% of GNI)
4,950 4,248 6,563.. 3,884 5,821
50.6 48.6 60.61.5 3.6 2.5
60 48 35.. .. ..
2,764 610 869.. 5,050 3,944
33.3 29.7 34.80.0 –0.4 0.00.4 15.0 13.3
21
100
8.3 101,299 97,43714.1 3.4 0.7
.. 9.1 9.00.19 1.4 8.4710 137,690 33,350
0.40 56,537 48,783
.. 1,520 1,948
.. 10.9 8.1
.. 2,337 2,942
.. 79.8 72.9
.. 16.5 21.3
.. 4.6 5.5
.. 4,446 8,550
.. 10.9 5.6
.. 73 6698 90 9397 84 8698 97 9885 66 7381 58 6288 76 81
.. 55 42
.. .. ..
.. .. ..30 21 20
.. 49.3 36.46.8 11.0 11.8
.. 2.1 3.30.0 4.3 5.70.0 1.7 1.6
.. 0.0 0.0
.. 0.9 0.7
.. 1.1 0.7
.. 32.2 19.2
216 2013 The Little Green Data Book
Population (thousands) 10 Land area (sq. km) 30 GDP ($ millions) 35.8
Country data
East Asia & Pacific
group
Upper middle-income group
Tuvalu

GNI per capita, World Bank Atlas method ($)Adjusted net national income per capita ($)Urban population (% of total)Urban population growth (avg. annual %, 1990–2011) AgricultureAgricultural land (% land area)Agricultural irrigated land (% of total agricultural land)Agricultural productivity, value added per worker (2000 $)Cereal yield (kg per hectare) Forests and biodiversityForest area (% land area)Deforestation (avg. annual %, 2000–2010)Terrestrial protected areas (% of total land area)Threatened species, mammalsThreatened species, birdsThreatened species, fishThreatened species, higher plants OceansTotal fisheries production (thousand metric tons)
Capture fisheries growth (avg. annual %, 1990–2011)Aquaculture growth (avg. annual %, 1990–2011)
Marine protected areas (% of territorial waters)Coral reef area (sq. km)Mangroves area (sq. km) Energy and emissionsEnergy use per capita (kg oil equivalent)Energy from biomass products and waste (% of total)Electric power consumption per capita (kWh)Electricity generated using fossil fuel (% of total)Electricity generated by hydropower (% of total)CO2 emissions per capita (metric tons) Water and sanitationInternal freshwater resources per capita (cu. m)Total freshwater withdrawal (% of internal resources)
Agriculture (% of total freshwater withdrawal)Access to improved water source (% of total population)
Rural (% of rural population)Urban (% of urban population)
Access to improved sanitation (% of total population)Rural (% of rural population)Urban (% of urban population)
Environment and healthParticulate matter (urban-pop.-weighted avg., µg/cu. m)Acute resp. infection prevalence (% of children under five)Diarrhea prevalence (% of children under five)Under-five mortality rate (per 1,000 live births) National accounting aggregates—savings, depletion and degradationGross savings (% of GNI)Consumption of fixed capital (% of GNI)Education expenditure (% of GNI)Energy depletion (% of GNI)Mineral depletion (% of GNI)Net forest depletion (% of GNI)CO2 damage (% of GNI)Particulate emissions damage (% of GNI)Adjusted net savings (% of GNI)
510 1,258 571415 1,022 521
15.6 36.5 28.04.8 3.8 3.5
70 44 39.. .. ..
200 334 3082,099 1,361 2,034
14.5 27.8 25.72.6 0.5 0.6
10.3 11.7 10.022226137
523 6,383 11,5632.8 1.8 4.0
42.3 16.0 4.9.. 5.8 .... 17,980 15,120.. 27,808 25,818
.. 683 363
.. 58.2 66.2
.. 553 242
.. 65.2 32.0
.. 18.7 45.30.1 0.9 0.3
1,130 4,455 5,1250.8 3.2 4.538 84 9072 61 6568 48 5795 83 8634 31 3734 23 3234 42 47
10 41 5423 .. ..26 .. ..90 109 95
21.3 18.4 25.27.8 10.9 7.73.0 3.7 3.00.0 10.4 1.40.0 2.2 2.05.0 0.5 1.20.2 0.5 0.30.0 0.4 0.5
11.2 –1.2 15.2
217The Little Green Data Book 2013
Country data
Sub-Saharan Africa group
Low-income group
Population (millions) 34.5 Land area (1,000 sq. km) 200 GDP ($ billions) 16.8
Uganda

GNI per capita, World Bank Atlas method ($)Adjusted net national income per capita ($)Urban population (% of total)Urban population growth (avg. annual %, 1990–2011) AgricultureAgricultural land (% land area)Agricultural irrigated land (% of total agricultural land)Agricultural productivity, value added per worker (2000 $)Cereal yield (kg per hectare) Forests and biodiversityForest area (% land area)Deforestation (avg. annual %, 2000–2010)Terrestrial protected areas (% of total land area)Threatened species, mammalsThreatened species, birdsThreatened species, fishThreatened species, higher plants OceansTotal fisheries production (thousand metric tons)
Capture fisheries growth (avg. annual %, 1990–2011)Aquaculture growth (avg. annual %, 1990–2011)
Marine protected areas (% of territorial waters)Coral reef area (sq. km)Mangroves area (sq. km) Energy and emissionsEnergy use per capita (kg oil equivalent)Energy from biomass products and waste (% of total)Electric power consumption per capita (kWh)Electricity generated using fossil fuel (% of total)Electricity generated by hydropower (% of total)CO2 emissions per capita (metric tons) Water and sanitationInternal freshwater resources per capita (cu. m)Total freshwater withdrawal (% of internal resources)
Agriculture (% of total freshwater withdrawal)Access to improved water source (% of total population)
Rural (% of rural population)Urban (% of urban population)
Access to improved sanitation (% of total population)Rural (% of rural population)Urban (% of urban population)
Environment and healthParticulate matter (urban-pop.-weighted avg., µg/cu. m)Acute resp. infection prevalence (% of children under five)Diarrhea prevalence (% of children under five)Under-five mortality rate (per 1,000 live births) National accounting aggregates—savings, depletion and degradationGross savings (% of GNI)Consumption of fixed capital (% of GNI)Education expenditure (% of GNI)Energy depletion (% of GNI)Mineral depletion (% of GNI)Net forest depletion (% of GNI)CO2 damage (% of GNI)Particulate emissions damage (% of GNI)Adjusted net savings (% of GNI)
3,130 7,734 1,7723,016 6,652 1,59568.9 64.7 38.7–0.5 0.3 2.7
71 28 465.3 .. ..
3,039 3,374 7163,754 2,740 3,065
16.8 38.7 28.4–0.2 0.0 0.33.5 7.5 9.911142117
204 5,790 40,238–7.2 –2.9 2.4–5.7 –0.5 10.04.9 10.4 2.9
.. .. 143,440
.. .. 60,301
2,845 3,015 6671.1 2.0 26.2
3,550 4,059 69845.6 65.4 73.0
7.0 18.8 17.45.9 7.1 1.6
1,162 12,498 3,12172.5 6.3 20.2
51 60 8898 96 8798 91 8498 99 9394 84 4789 81 3596 87 66
15 21 53.. .. .... .. ..
10 21 62
16.4 26.1 29.710.7 12.3 9.95.9 3.6 3.13.9 9.3 6.30.0 0.8 1.20.0 0.0 0.31.5 0.7 0.70.1 0.3 0.66.1 6.2 14.7
218 2013 The Little Green Data Book
Population (millions) 45.7 Land area (1,000 sq. km) 579 GDP ($ billions) 165.2
Country data
Europe & Central
Asia group
Lower middle-income group
Ukraine

GNI per capita, World Bank Atlas method ($)Adjusted net national income per capita ($)Urban population (% of total)Urban population growth (avg. annual %, 1990–2011) AgricultureAgricultural land (% land area)Agricultural irrigated land (% of total agricultural land)Agricultural productivity, value added per worker (2000 $)Cereal yield (kg per hectare) Forests and biodiversityForest area (% land area)Deforestation (avg. annual %, 2000–2010)Terrestrial protected areas (% of total land area)Threatened species, mammalsThreatened species, birdsThreatened species, fishThreatened species, higher plants OceansTotal fisheries production (thousand metric tons)
Capture fisheries growth (avg. annual %, 1990–2011)Aquaculture growth (avg. annual %, 1990–2011)
Marine protected areas (% of territorial waters)Coral reef area (sq. km)Mangroves area (sq. km) Energy and emissionsEnergy use per capita (kg oil equivalent)Energy from biomass products and waste (% of total)Electric power consumption per capita (kWh)Electricity generated using fossil fuel (% of total)Electricity generated by hydropower (% of total)CO2 emissions per capita (metric tons) Water and sanitationInternal freshwater resources per capita (cu. m)Total freshwater withdrawal (% of internal resources)
Agriculture (% of total freshwater withdrawal)Access to improved water source (% of total population)
Rural (% of rural population)Urban (% of urban population)
Access to improved sanitation (% of total population)Rural (% of rural population)Urban (% of urban population)
Environment and healthParticulate matter (urban-pop.-weighted avg., µg/cu. m)Acute resp. infection prevalence (% of children under five)Diarrhea prevalence (% of children under five)Under-five mortality rate (per 1,000 live births) National accounting aggregates—savings, depletion and degradationGross savings (% of GNI)Consumption of fixed capital (% of GNI)Education expenditure (% of GNI)Energy depletion (% of GNI)Mineral depletion (% of GNI)Net forest depletion (% of GNI)CO2 damage (% of GNI)Particulate emissions damage (% of GNI)Adjusted net savings (% of GNI)
40,760 39,860.. 34,611
84.3 80.57.3 1.1
5 3719.1 ..
.. 26,5152,625 5,349
3.8 28.4–0.2 0.05.6 12.9
79
130
75.3 28,774–1.1 –1.7
.. 1.82.6 16.5
1,190 81,97068.2 15,496
8,271 5,0000.0 4.4
11,044 9,415100.0 62.0
0.0 11.222.6 11.4
19 8,1952,665.3 10.3
83 41100 100100 98100 100
98 10095 9998 100
89 22.. .... ..7 6
.. 17.914.1 13.9
.. 4.615.1 1.40.0 0.2
.. 0.00.3 0.20.6 0.1
.. 6.6
219The Little Green Data Book 2013
Country data
High-income group
Population (millions) 7.9 Land area (1,000 sq. km) 84 GDP ($ billions) 360.2
United Arab Emirates

GNI per capita, World Bank Atlas method ($)Adjusted net national income per capita ($)Urban population (% of total)Urban population growth (avg. annual %, 1990–2011) AgricultureAgricultural land (% land area)Agricultural irrigated land (% of total agricultural land)Agricultural productivity, value added per worker (2000 $)Cereal yield (kg per hectare) Forests and biodiversityForest area (% land area)Deforestation (avg. annual %, 2000–2010)Terrestrial protected areas (% of total land area)Threatened species, mammalsThreatened species, birdsThreatened species, fishThreatened species, higher plants OceansTotal fisheries production (thousand metric tons)
Capture fisheries growth (avg. annual %, 1990–2011)Aquaculture growth (avg. annual %, 1990–2011)
Marine protected areas (% of territorial waters)Coral reef area (sq. km)Mangroves area (sq. km) Energy and emissionsEnergy use per capita (kg oil equivalent)Energy from biomass products and waste (% of total)Electric power consumption per capita (kWh)Electricity generated using fossil fuel (% of total)Electricity generated by hydropower (% of total)CO2 emissions per capita (metric tons) Water and sanitationInternal freshwater resources per capita (cu. m)Total freshwater withdrawal (% of internal resources)
Agriculture (% of total freshwater withdrawal)Access to improved water source (% of total population)
Rural (% of rural population)Urban (% of urban population)
Access to improved sanitation (% of total population)Rural (% of rural population)Urban (% of urban population)
Environment and healthParticulate matter (urban-pop.-weighted avg., µg/cu. m)Acute resp. infection prevalence (% of children under five)Diarrhea prevalence (% of children under five)Under-five mortality rate (per 1,000 live births) National accounting aggregates—savings, depletion and degradationGross savings (% of GNI)Consumption of fixed capital (% of GNI)Education expenditure (% of GNI)Energy depletion (% of GNI)Mineral depletion (% of GNI)Net forest depletion (% of GNI)CO2 damage (% of GNI)Particulate emissions damage (% of GNI)Adjusted net savings (% of GNI)
37,780 39,86033,456 34,611
79.6 80.50.5 1.1
71 37.. .... 26,515
6,985 5,349
11.9 28.4–0.3 0.026.4 12.9
54
4311
782 28,774–1.2 –1.76.2 1.85.7 16.5
.. 81,970
.. 15,496
3,252 5,0002.9 4.4
5,733 9,41576.4 62.0
1.0 11.27.7 11.4
2,311 8,1959.0 10.310 41
100 100100 98100 100100 100100 99100 100
13 22.. .... ..5 6
12.7 17.913.7 13.95.1 4.61.3 1.40.0 0.20.0 0.00.2 0.20.0 0.12.7 6.6
220 2013 The Little Green Data Book
Population (millions) 62.7 Land area (1,000 sq. km) 242 GDP ($ billions) 2,445.4
Country data
High-income group
United Kingdom

GNI per capita, World Bank Atlas method ($)Adjusted net national income per capita ($)Urban population (% of total)Urban population growth (avg. annual %, 1990–2011) AgricultureAgricultural land (% land area)Agricultural irrigated land (% of total agricultural land)Agricultural productivity, value added per worker (2000 $)Cereal yield (kg per hectare) Forests and biodiversityForest area (% land area)Deforestation (avg. annual %, 2000–2010)Terrestrial protected areas (% of total land area)Threatened species, mammalsThreatened species, birdsThreatened species, fishThreatened species, higher plants OceansTotal fisheries production (thousand metric tons)
Capture fisheries growth (avg. annual %, 1990–2011)Aquaculture growth (avg. annual %, 1990–2011)
Marine protected areas (% of territorial waters)Coral reef area (sq. km)Mangroves area (sq. km) Energy and emissionsEnergy use per capita (kg oil equivalent)Energy from biomass products and waste (% of total)Electric power consumption per capita (kWh)Electricity generated using fossil fuel (% of total)Electricity generated by hydropower (% of total)CO2 emissions per capita (metric tons) Water and sanitationInternal freshwater resources per capita (cu. m)Total freshwater withdrawal (% of internal resources)
Agriculture (% of total freshwater withdrawal)Access to improved water source (% of total population)
Rural (% of rural population)Urban (% of urban population)
Access to improved sanitation (% of total population)Rural (% of rural population)Urban (% of urban population)
Environment and healthParticulate matter (urban-pop.-weighted avg., µg/cu. m)Acute resp. infection prevalence (% of children under five)Diarrhea prevalence (% of children under five)Under-five mortality rate (per 1,000 live births) National accounting aggregates—savings, depletion and degradationGross savings (% of GNI)Consumption of fixed capital (% of GNI)Education expenditure (% of GNI)Energy depletion (% of GNI)Mineral depletion (% of GNI)Net forest depletion (% of GNI)CO2 damage (% of GNI)Particulate emissions damage (% of GNI)Adjusted net savings (% of GNI)
48,620 39,86041,448 34,611
82.4 80.51.5 1.1
45 37.. ..
51,370 26,5156,818 5,349
33.3 28.4–0.1 0.012.4 12.9
3679
185232
5,560 28,774–0.4 –1.71.1 1.8
28.6 16.51,250 81,9703,030 15,496
7,164 5,0004.1 4.4
13,394 9,41570.3 62.0
6.0 11.217.3 11.4
9,044 8,19517.0 10.3
40 4199 10094 98
100 100100 10099 99
100 100
18 22.. .... ..8 6
11.5 17.913.9 13.9
4.8 4.61.0 1.40.1 0.20.0 0.00.3 0.20.1 0.10.9 6.6
221The Little Green Data Book 2013
Country data
High-income group
Population (millions) 311.6 Land area (1,000 sq. km) 9,147 GDP ($ billions) 14,991.3
United States

GNI per capita, World Bank Atlas method ($)Adjusted net national income per capita ($)Urban population (% of total)Urban population growth (avg. annual %, 1990–2011) AgricultureAgricultural land (% land area)Agricultural irrigated land (% of total agricultural land)Agricultural productivity, value added per worker (2000 $)Cereal yield (kg per hectare) Forests and biodiversityForest area (% land area)Deforestation (avg. annual %, 2000–2010)Terrestrial protected areas (% of total land area)Threatened species, mammalsThreatened species, birdsThreatened species, fishThreatened species, higher plants OceansTotal fisheries production (thousand metric tons)
Capture fisheries growth (avg. annual %, 1990–2011)Aquaculture growth (avg. annual %, 1990–2011)
Marine protected areas (% of territorial waters)Coral reef area (sq. km)Mangroves area (sq. km) Energy and emissionsEnergy use per capita (kg oil equivalent)Energy from biomass products and waste (% of total)Electric power consumption per capita (kWh)Electricity generated using fossil fuel (% of total)Electricity generated by hydropower (% of total)CO2 emissions per capita (metric tons) Water and sanitationInternal freshwater resources per capita (cu. m)Total freshwater withdrawal (% of internal resources)
Agriculture (% of total freshwater withdrawal)Access to improved water source (% of total population)
Rural (% of rural population)Urban (% of urban population)
Access to improved sanitation (% of total population)Rural (% of rural population)Urban (% of urban population)
Environment and healthParticulate matter (urban-pop.-weighted avg., µg/cu. m)Acute resp. infection prevalence (% of children under five)Diarrhea prevalence (% of children under five)Under-five mortality rate (per 1,000 live births) National accounting aggregates—savings, depletion and degradationGross savings (% of GNI)Consumption of fixed capital (% of GNI)Education expenditure (% of GNI)Energy depletion (% of GNI)Mineral depletion (% of GNI)Net forest depletion (% of GNI)CO2 damage (% of GNI)Particulate emissions damage (% of GNI)Adjusted net savings (% of GNI)
11,860 8,574 6,56311,669 7,648 5,821
92.5 79.1 60.60.6 2.0 2.5
82 37 351.4 .. ..
9,064 3,448 8694,587 3,838 3,944
10.2 46.8 34.8–2.1 0.4 0.00.3 20.2 13.3112436
0
89.1 19,009 97,437–0.1 0.1 0.716.8 11.8 9.00.33 13.1 8.4
.. 15,100 33,350
.. 39,997 48,783
1,241 1,312 1,94830.9 16.7 8.1
2,763 1,973 2,94211.0 39.0 72.980.2 53.7 21.3
2.4 2.7 5.5
17,515 22,810 8,5506.2 2.0 5.687 68 66
100 94 93100 81 86100 98 98100 79 7399 59 62
100 84 81
112 28 42.. .. .... .. ..
10 19 20
17.0 21.1 36.412.8 12.2 11.8
2.3 5.0 3.30.0 4.5 5.70.1 1.9 1.60.4 0.0 0.00.1 0.2 0.71.8 0.3 0.74.1 6.8 19.2
222 2013 The Little Green Data Book
Population (millions) 3.4 Land area (1,000 sq. km) 175 GDP ($ billions) 46.7
Country data
Latin America & Caribbean
group
Upper middle-income group
Uruguay

GNI per capita, World Bank Atlas method ($)Adjusted net national income per capita ($)Urban population (% of total)Urban population growth (avg. annual %, 1990–2011) AgricultureAgricultural land (% land area)Agricultural irrigated land (% of total agricultural land)Agricultural productivity, value added per worker (2000 $)Cereal yield (kg per hectare) Forests and biodiversityForest area (% land area)Deforestation (avg. annual %, 2000–2010)Terrestrial protected areas (% of total land area)Threatened species, mammalsThreatened species, birdsThreatened species, fishThreatened species, higher plants OceansTotal fisheries production (thousand metric tons)
Capture fisheries growth (avg. annual %, 1990–2011)Aquaculture growth (avg. annual %, 1990–2011)
Marine protected areas (% of territorial waters)Coral reef area (sq. km)Mangroves area (sq. km) Energy and emissionsEnergy use per capita (kg oil equivalent)Energy from biomass products and waste (% of total)Electric power consumption per capita (kWh)Electricity generated using fossil fuel (% of total)Electricity generated by hydropower (% of total)CO2 emissions per capita (metric tons) Water and sanitationInternal freshwater resources per capita (cu. m)Total freshwater withdrawal (% of internal resources)
Agriculture (% of total freshwater withdrawal)Access to improved water source (% of total population)
Rural (% of rural population)Urban (% of urban population)
Access to improved sanitation (% of total population)Rural (% of rural population)Urban (% of urban population)
Environment and healthParticulate matter (urban-pop.-weighted avg., µg/cu. m)Acute resp. infection prevalence (% of children under five)Diarrhea prevalence (% of children under five)Under-five mortality rate (per 1,000 live births) National accounting aggregates—savings, depletion and degradationGross savings (% of GNI)Consumption of fixed capital (% of GNI)Education expenditure (% of GNI)Energy depletion (% of GNI)Mineral depletion (% of GNI)Net forest depletion (% of GNI)CO2 damage (% of GNI)Particulate emissions damage (% of GNI)Adjusted net savings (% of GNI)
1,510 7,734 1,7721,182 6,652 1,59536.2 64.7 38.7
1.2 0.3 2.7
63 28 46.. .. ..
2,904 3,374 7164,771 2,740 3,065
7.7 38.7 28.4–0.2 0.0 0.32.3 7.5 9.910167
17
10.7 5,790 40,238–0.9 –2.9 2.4–5.5 –0.5 10.0
.. 10.4 2.9
.. .. 143,440
.. .. 60,301
1,533 3,015 6670.0 2.0 26.2
1,648 4,059 69879.0 65.4 73.021.0 18.8 17.44.2 7.1 1.6
557 12,498 3,121342.7 6.3 20.2
90 60 8887 96 8781 91 8498 99 93
100 84 47100 81 35100 87 66
31 21 53.. .. .... .. ..
49 21 62
.. 26.1 29.78.9 12.3 9.99.4 3.6 3.1
11.4 9.3 6.36.1 0.8 1.20.0 0.0 0.32.5 0.7 0.70.3 0.3 0.6
.. 6.2 14.7
223The Little Green Data Book 2013
Country data
Europe & Central
Asia group
Lower middle-income group
Population (millions) 29.3 Land area (1,000 sq. km) 425 GDP ($ billions) 45.4
Uzbekistan

GNI per capita, World Bank Atlas method ($)Adjusted net national income per capita ($)Urban population (% of total)Urban population growth (avg. annual %, 1990–2011) AgricultureAgricultural land (% land area)Agricultural irrigated land (% of total agricultural land)Agricultural productivity, value added per worker (2000 $)Cereal yield (kg per hectare) Forests and biodiversityForest area (% land area)Deforestation (avg. annual %, 2000–2010)Terrestrial protected areas (% of total land area)Threatened species, mammalsThreatened species, birdsThreatened species, fishThreatened species, higher plants OceansTotal fisheries production (thousand metric tons)
Capture fisheries growth (avg. annual %, 1990–2011)Aquaculture growth (avg. annual %, 1990–2011)
Marine protected areas (% of territorial waters)Coral reef area (sq. km)Mangroves area (sq. km) Energy and emissionsEnergy use per capita (kg oil equivalent)Energy from biomass products and waste (% of total)Electric power consumption per capita (kWh)Electricity generated using fossil fuel (% of total)Electricity generated by hydropower (% of total)CO2 emissions per capita (metric tons) Water and sanitationInternal freshwater resources per capita (cu. m)Total freshwater withdrawal (% of internal resources)
Agriculture (% of total freshwater withdrawal)Access to improved water source (% of total population)
Rural (% of rural population)Urban (% of urban population)
Access to improved sanitation (% of total population)Rural (% of rural population)Urban (% of urban population)
Environment and healthParticulate matter (urban-pop.-weighted avg., µg/cu. m)Acute resp. infection prevalence (% of children under five)Diarrhea prevalence (% of children under five)Under-five mortality rate (per 1,000 live births) National accounting aggregates—savings, depletion and degradationGross savings (% of GNI)Consumption of fixed capital (% of GNI)Education expenditure (% of GNI)Energy depletion (% of GNI)Mineral depletion (% of GNI)Net forest depletion (% of GNI)CO2 damage (% of GNI)Particulate emissions damage (% of GNI)Adjusted net savings (% of GNI)
2,730 4,248 1,7722,695 3,884 1,595
24.9 48.6 38.73.8 3.6 2.7
15 48 46.. .. ..
2,164 610 716559 5,050 3,065
36.1 29.7 28.40.0 –0.4 0.34.3 15.0 9.9
89
158
56.4 101,299 40,2381.4 3.4 2.4
.. 9.1 10.00.05 1.4 2.9
4,110 137,690 143,44020.5 56,537 60,301
157 1,520 667.. 10.9 26.2.. 2,337 698.. 79.8 73.0.. 16.5 17.4
0.5 4.6 1.6
.. 4,446 3,121
.. 10.9 20.2
.. 73 8890 90 8787 84 8498 97 9357 66 4754 58 3564 76 66
14 55 53.. .. .... .. ..
13 21 62
19.6 49.3 29.710.5 11.0 9.95.2 2.1 3.10.0 4.3 6.30.0 1.7 1.20.0 0.0 0.30.1 0.9 0.70.0 1.1 0.6
14.3 32.2 14.7
224 2013 The Little Green Data Book
Population (thousands) 246 Land area (1,000 sq. km) 12 GDP ($ millions) 760.0
Country data
East Asia & Pacific
group
Lower middle-income group
Vanuatu

GNI per capita, World Bank Atlas method ($)Adjusted net national income per capita ($)Urban population (% of total)Urban population growth (avg. annual %, 1990–2011) AgricultureAgricultural land (% land area)Agricultural irrigated land (% of total agricultural land)Agricultural productivity, value added per worker (2000 $)Cereal yield (kg per hectare) Forests and biodiversityForest area (% land area)Deforestation (avg. annual %, 2000–2010)Terrestrial protected areas (% of total land area)Threatened species, mammalsThreatened species, birdsThreatened species, fishThreatened species, higher plants OceansTotal fisheries production (thousand metric tons)
Capture fisheries growth (avg. annual %, 1990–2011)Aquaculture growth (avg. annual %, 1990–2011)
Marine protected areas (% of territorial waters)Coral reef area (sq. km)Mangroves area (sq. km) Energy and emissionsEnergy use per capita (kg oil equivalent)Energy from biomass products and waste (% of total)Electric power consumption per capita (kWh)Electricity generated using fossil fuel (% of total)Electricity generated by hydropower (% of total)CO2 emissions per capita (metric tons) Water and sanitationInternal freshwater resources per capita (cu. m)Total freshwater withdrawal (% of internal resources)
Agriculture (% of total freshwater withdrawal)Access to improved water source (% of total population)
Rural (% of rural population)Urban (% of urban population)
Access to improved sanitation (% of total population)Rural (% of rural population)Urban (% of urban population)
Environment and healthParticulate matter (urban-pop.-weighted avg., µg/cu. m)Acute resp. infection prevalence (% of children under five)Diarrhea prevalence (% of children under five)Under-five mortality rate (per 1,000 live births) National accounting aggregates—savings, depletion and degradationGross savings (% of GNI)Consumption of fixed capital (% of GNI)Education expenditure (% of GNI)Energy depletion (% of GNI)Mineral depletion (% of GNI)Net forest depletion (% of GNI)CO2 damage (% of GNI)Particulate emissions damage (% of GNI)Adjusted net savings (% of GNI)
11,820 8,574 6,5637,045 7,648 5,82193.5 79.1 60.6
2.4 2.0 2.5
24 37 35.. .. ..
8,447 3,448 8693,601 3,838 3,944
52.1 46.8 34.80.6 0.4 0.0
53.8 20.2 13.332403768
248 19,009 97,437–1.8 0.1 0.717.4 11.8 9.015.3 13.1 8.4480 15,100 33,350
3,569 39,997 48,783
2,669 1,312 1,9481.2 16.7 8.1
3,287 1,973 2,94235.1 39.0 72.964.9 53.7 21.3
6.5 2.7 5.5
24,674 22,810 8,5501.3 2.0 5.644 68 6693 94 9375 81 8694 98 9891 79 7357 59 6294 84 81
10 28 42.. .. .... .. ..
15 19 20
31.4 21.1 36.412.3 12.2 11.8
3.6 5.0 3.320.2 4.5 5.7
0.6 1.9 1.60.0 0.0 0.00.5 0.2 0.70.0 0.3 0.71.4 6.8 19.2
225The Little Green Data Book 2013
Country data
Latin America & Caribbean
group
Upper middle-income group
Population (millions) 29.3 Land area (1,000 sq. km) 882 GDP ($ billions) 316.5
Venezuela, RB

GNI per capita, World Bank Atlas method ($)Adjusted net national income per capita ($)Urban population (% of total)Urban population growth (avg. annual %, 1990–2011) AgricultureAgricultural land (% land area)Agricultural irrigated land (% of total agricultural land)Agricultural productivity, value added per worker (2000 $)Cereal yield (kg per hectare) Forests and biodiversityForest area (% land area)Deforestation (avg. annual %, 2000–2010)Terrestrial protected areas (% of total land area)Threatened species, mammalsThreatened species, birdsThreatened species, fishThreatened species, higher plants OceansTotal fisheries production (thousand metric tons)
Capture fisheries growth (avg. annual %, 1990–2011)Aquaculture growth (avg. annual %, 1990–2011)
Marine protected areas (% of territorial waters)Coral reef area (sq. km)Mangroves area (sq. km) Energy and emissionsEnergy use per capita (kg oil equivalent)Energy from biomass products and waste (% of total)Electric power consumption per capita (kWh)Electricity generated using fossil fuel (% of total)Electricity generated by hydropower (% of total)CO2 emissions per capita (metric tons) Water and sanitationInternal freshwater resources per capita (cu. m)Total freshwater withdrawal (% of internal resources)
Agriculture (% of total freshwater withdrawal)Access to improved water source (% of total population)
Rural (% of rural population)Urban (% of urban population)
Access to improved sanitation (% of total population)Rural (% of rural population)Urban (% of urban population)
Environment and healthParticulate matter (urban-pop.-weighted avg., µg/cu. m)Acute resp. infection prevalence (% of children under five)Diarrhea prevalence (% of children under five)Under-five mortality rate (per 1,000 live births) National accounting aggregates—savings, depletion and degradationGross savings (% of GNI)Consumption of fixed capital (% of GNI)Education expenditure (% of GNI)Energy depletion (% of GNI)Mineral depletion (% of GNI)Net forest depletion (% of GNI)CO2 damage (% of GNI)Particulate emissions damage (% of GNI)Adjusted net savings (% of GNI)
1,270 4,248 1,7721,083 3,884 1,595
31.0 48.6 38.73.4 3.6 2.7
35 48 46.. .. ..
378 610 7165,383 5,050 3,065
45.0 29.7 28.4–1.6 –0.4 0.36.2 15.0 9.9544573
141
5,555 101,299 40,2385.7 3.4 2.4
15.0 9.1 10.01.7 1.4 2.9
1,270 137,690 143,4401,056 56,537 60,301
681 1,520 66724.8 10.9 26.2
1,035 2,337 69870.9 79.8 73.029.0 16.5 17.4
1.7 4.6 1.6
4,092 4,446 3,12122.8 10.9 20.2
95 73 8895 90 8793 84 8499 97 9376 66 4768 58 3594 76 66
54 55 53.. .. .... .. ..
22 21 62
34.7 49.3 29.79.6 11.0 9.92.8 2.1 3.19.1 4.3 6.30.4 1.7 1.20.2 0.0 0.30.9 0.9 0.70.6 1.1 0.6
16.8 32.2 14.7
226 2013 The Little Green Data Book
Population (millions) 87.8 Land area (1,000 sq. km) 310 GDP ($ billions) 123.6
Country data
East Asia & Pacific
group
Lower middle-income group
Vietnam

GNI per capita, World Bank Atlas method ($)Adjusted net national income per capita ($)Urban population (% of total)Urban population growth (avg. annual %, 1990–2011) AgricultureAgricultural land (% land area)Agricultural irrigated land (% of total agricultural land)Agricultural productivity, value added per worker (2000 $)Cereal yield (kg per hectare) Forests and biodiversityForest area (% land area)Deforestation (avg. annual %, 2000–2010)Terrestrial protected areas (% of total land area)Threatened species, mammalsThreatened species, birdsThreatened species, fishThreatened species, higher plants OceansTotal fisheries production (thousand metric tons)
Capture fisheries growth (avg. annual %, 1990–2011)Aquaculture growth (avg. annual %, 1990–2011)
Marine protected areas (% of territorial waters)Coral reef area (sq. km)Mangroves area (sq. km) Energy and emissionsEnergy use per capita (kg oil equivalent)Energy from biomass products and waste (% of total)Electric power consumption per capita (kWh)Electricity generated using fossil fuel (% of total)Electricity generated by hydropower (% of total)CO2 emissions per capita (metric tons) Water and sanitationInternal freshwater resources per capita (cu. m)Total freshwater withdrawal (% of internal resources)
Agriculture (% of total freshwater withdrawal)Access to improved water source (% of total population)
Rural (% of rural population)Urban (% of urban population)
Access to improved sanitation (% of total population)Rural (% of rural population)Urban (% of urban population)
Environment and healthParticulate matter (urban-pop.-weighted avg., µg/cu. m)Acute resp. infection prevalence (% of children under five)Diarrhea prevalence (% of children under five)Under-five mortality rate (per 1,000 live births) National accounting aggregates—savings, depletion and degradationGross savings (% of GNI)Consumption of fixed capital (% of GNI)Education expenditure (% of GNI)Energy depletion (% of GNI)Mineral depletion (% of GNI)Net forest depletion (% of GNI)CO2 damage (% of GNI)Particulate emissions damage (% of GNI)Adjusted net savings (% of GNI)
.. 39,860
.. 34,61195.4 80.5
0.7 1.1
11 37.. .... 26,515.. 5,349
57.4 28.40.8 0.0
15.2 12.921
1512
0.82 28,7740.8 –1.7
.. 1.80.64 16.5200 81,9702.6 15,496
.. 5,000
.. 4.4
.. 9,415
.. 62.0
.. 11.2
.. 11.4
.. 8,195
.. 10.3
.. 41
.. 100
.. 98
.. 100
.. 100
.. 99
.. 100
.. 22
.. ..
.. ..
.. 6
.. 17.9
.. 13.9
.. 4.6
.. 1.4
.. 0.2
.. 0.0
.. 0.2
.. 0.1
.. 6.6
227The Little Green Data Book 2013
Country data
High-income group
Population (thousands) 110 Land area (sq. km) 350 GDP ($ millions) ..
Virgin Islands (U.S.)

GNI per capita, World Bank Atlas method ($)Adjusted net national income per capita ($)Urban population (% of total)Urban population growth (avg. annual %, 1990–2011) AgricultureAgricultural land (% land area)Agricultural irrigated land (% of total agricultural land)Agricultural productivity, value added per worker (2000 $)Cereal yield (kg per hectare) Forests and biodiversityForest area (% land area)Deforestation (avg. annual %, 2000–2010)Terrestrial protected areas (% of total land area)Threatened species, mammalsThreatened species, birdsThreatened species, fishThreatened species, higher plants OceansTotal fisheries production (thousand metric tons)
Capture fisheries growth (avg. annual %, 1990–2011)Aquaculture growth (avg. annual %, 1990–2011)
Marine protected areas (% of territorial waters)Coral reef area (sq. km)Mangroves area (sq. km) Energy and emissionsEnergy use per capita (kg oil equivalent)Energy from biomass products and waste (% of total)Electric power consumption per capita (kWh)Electricity generated using fossil fuel (% of total)Electricity generated by hydropower (% of total)CO2 emissions per capita (metric tons) Water and sanitationInternal freshwater resources per capita (cu. m)Total freshwater withdrawal (% of internal resources)
Agriculture (% of total freshwater withdrawal)Access to improved water source (% of total population)
Rural (% of rural population)Urban (% of urban population)
Access to improved sanitation (% of total population)Rural (% of rural population)Urban (% of urban population)
Environment and healthParticulate matter (urban-pop.-weighted avg., µg/cu. m)Acute resp. infection prevalence (% of children under five)Diarrhea prevalence (% of children under five)Under-five mortality rate (per 1,000 live births) National accounting aggregates—savings, depletion and degradationGross savings (% of GNI)Consumption of fixed capital (% of GNI)Education expenditure (% of GNI)Energy depletion (% of GNI)Mineral depletion (% of GNI)Net forest depletion (% of GNI)CO2 damage (% of GNI)Particulate emissions damage (% of GNI)Adjusted net savings (% of GNI)
.. 3,866 1,772
.. 3,285 1,59574.4 58.9 38.73.7 2.5 2.7
43 23 464.9 .. ..
.. 2,627 7161,536 2,475 3,065
1.5 2.4 28.4–0.1 –0.1 0.30.6 3.9 9.9
31000
.. 3,538 40,238
.. 2.4 2.4
.. 13.1 10.0
.. 2.0 2.9
.. 5,700 143,440
.. 217 60,301
.. 1,372 667
.. 0.9 26.2
.. 1,658 698
.. 92.9 73.0
.. 5.4 17.40.6 4.1 1.6
207 673 3,12151.5 122.1 20.2
45 86 8885 89 8781 81 8486 94 9392 88 4792 80 3592 94 66
.. 59 53
.. .. ..
.. .. ..22 32 62
.. 27.0 29.7
.. 10.8 9.9
.. 4.5 3.1
.. 15.2 6.3
.. 0.6 1.2
.. 0.1 0.3
.. 0.6 0.7
.. 0.9 0.6
.. 6.1 14.7
228 2013 The Little Green Data Book
Population (millions) 3.9 Land area (1,000 sq. km) 6.0 GDP ($ millions) ..
Country data
Middle East &
N. Africa group
Lower middle-income group
West Bank and Gaza
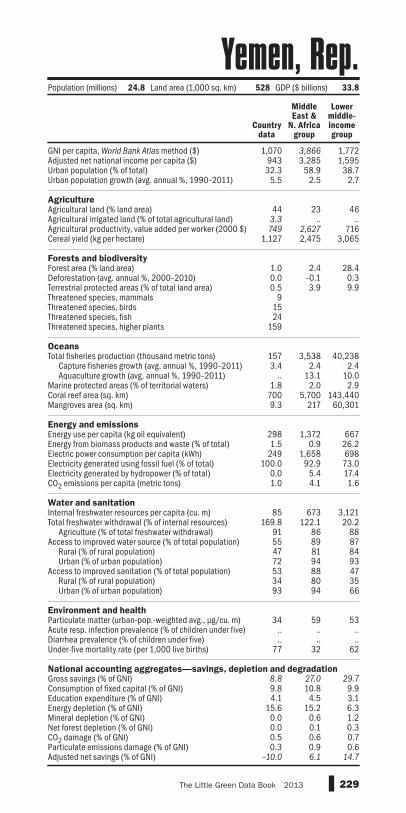
GNI per capita, World Bank Atlas method ($)Adjusted net national income per capita ($)Urban population (% of total)Urban population growth (avg. annual %, 1990–2011) AgricultureAgricultural land (% land area)Agricultural irrigated land (% of total agricultural land)Agricultural productivity, value added per worker (2000 $)Cereal yield (kg per hectare) Forests and biodiversityForest area (% land area)Deforestation (avg. annual %, 2000–2010)Terrestrial protected areas (% of total land area)Threatened species, mammalsThreatened species, birdsThreatened species, fishThreatened species, higher plants OceansTotal fisheries production (thousand metric tons)
Capture fisheries growth (avg. annual %, 1990–2011)Aquaculture growth (avg. annual %, 1990–2011)
Marine protected areas (% of territorial waters)Coral reef area (sq. km)Mangroves area (sq. km) Energy and emissionsEnergy use per capita (kg oil equivalent)Energy from biomass products and waste (% of total)Electric power consumption per capita (kWh)Electricity generated using fossil fuel (% of total)Electricity generated by hydropower (% of total)CO2 emissions per capita (metric tons) Water and sanitationInternal freshwater resources per capita (cu. m)Total freshwater withdrawal (% of internal resources)
Agriculture (% of total freshwater withdrawal)Access to improved water source (% of total population)
Rural (% of rural population)Urban (% of urban population)
Access to improved sanitation (% of total population)Rural (% of rural population)Urban (% of urban population)
Environment and healthParticulate matter (urban-pop.-weighted avg., µg/cu. m)Acute resp. infection prevalence (% of children under five)Diarrhea prevalence (% of children under five)Under-five mortality rate (per 1,000 live births) National accounting aggregates—savings, depletion and degradationGross savings (% of GNI)Consumption of fixed capital (% of GNI)Education expenditure (% of GNI)Energy depletion (% of GNI)Mineral depletion (% of GNI)Net forest depletion (% of GNI)CO2 damage (% of GNI)Particulate emissions damage (% of GNI)Adjusted net savings (% of GNI)
1,070 3,866 1,772943 3,285 1,59532.3 58.9 38.7
5.5 2.5 2.7
44 23 463.3 .. ..749 2,627 716
1,127 2,475 3,065
1.0 2.4 28.40.0 –0.1 0.30.5 3.9 9.9
91524
159
157 3,538 40,2383.4 2.4 2.4
.. 13.1 10.01.8 2.0 2.9
700 5,700 143,4409.3 217 60,301
298 1,372 6671.5 0.9 26.2
249 1,658 698100.0 92.9 73.0
0.0 5.4 17.41.0 4.1 1.6
85 673 3,121169.8 122.1 20.2
91 86 8855 89 8747 81 8472 94 9353 88 4734 80 3593 94 66
34 59 53.. .. .... .. ..
77 32 62
8.8 27.0 29.79.8 10.8 9.94.1 4.5 3.1
15.6 15.2 6.30.0 0.6 1.20.0 0.1 0.30.5 0.6 0.70.3 0.9 0.6
–10.0 6.1 14.7
229The Little Green Data Book 2013
Country data
Middle East &
N. Africa group
Lower middle-income group
Population (millions) 24.8 Land area (1,000 sq. km) 528 GDP ($ billions) 33.8
Yemen, Rep.

GNI per capita, World Bank Atlas method ($)Adjusted net national income per capita ($)Urban population (% of total)Urban population growth (avg. annual %, 1990–2011) AgricultureAgricultural land (% land area)Agricultural irrigated land (% of total agricultural land)Agricultural productivity, value added per worker (2000 $)Cereal yield (kg per hectare) Forests and biodiversityForest area (% land area)Deforestation (avg. annual %, 2000–2010)Terrestrial protected areas (% of total land area)Threatened species, mammalsThreatened species, birdsThreatened species, fishThreatened species, higher plants OceansTotal fisheries production (thousand metric tons)
Capture fisheries growth (avg. annual %, 1990–2011)Aquaculture growth (avg. annual %, 1990–2011)
Marine protected areas (% of territorial waters)Coral reef area (sq. km)Mangroves area (sq. km) Energy and emissionsEnergy use per capita (kg oil equivalent)Energy from biomass products and waste (% of total)Electric power consumption per capita (kWh)Electricity generated using fossil fuel (% of total)Electricity generated by hydropower (% of total)CO2 emissions per capita (metric tons) Water and sanitationInternal freshwater resources per capita (cu. m)Total freshwater withdrawal (% of internal resources)
Agriculture (% of total freshwater withdrawal)Access to improved water source (% of total population)
Rural (% of rural population)Urban (% of urban population)
Access to improved sanitation (% of total population)Rural (% of rural population)Urban (% of urban population)
Environment and healthParticulate matter (urban-pop.-weighted avg., µg/cu. m)Acute resp. infection prevalence (% of children under five)Diarrhea prevalence (% of children under five)Under-five mortality rate (per 1,000 live births) National accounting aggregates—savings, depletion and degradationGross savings (% of GNI)Consumption of fixed capital (% of GNI)Education expenditure (% of GNI)Energy depletion (% of GNI)Mineral depletion (% of GNI)Net forest depletion (% of GNI)CO2 damage (% of GNI)Particulate emissions damage (% of GNI)Adjusted net savings (% of GNI)
1,160 1,258 1,772949 1,022 1,59539.2 36.5 38.7
2.5 3.8 2.7
32 44 46.. .. ..
264 334 7162,359 1,361 3,065
66.3 27.8 28.40.3 0.5 0.3
36.0 11.7 9.99
152010
79.9 6,383 40,2380.3 1.8 2.49.9 16.0 10.0
.. 5.8 2.9
.. 17,980 143,440
.. 27,808 60,301
628 683 66780.2 58.2 26.2623 553 6980.3 65.2 73.0
99.7 18.7 17.40.2 0.9 1.6
5,952 4,455 3,1212.2 3.2 20.276 84 8861 61 8746 48 8487 83 9348 31 4743 23 3557 42 66
27 41 535 .. ..
16 .. ..83 109 62
30.3 18.4 29.710.0 10.9 9.91.3 3.7 3.10.0 10.4 6.3
17.5 2.2 1.20.0 0.5 0.30.1 0.5 0.70.2 0.4 0.63.8 –1.2 14.7
230 2013 The Little Green Data Book
Population (millions) 13.5 Land area (1,000 sq. km) 743 GDP ($ billions) 19.2
Country data
Sub-Saharan Africa group
Lower middle-income group
Zambia

GNI per capita, World Bank Atlas method ($)Adjusted net national income per capita ($)Urban population (% of total)Urban population growth (avg. annual %, 1990–2011) AgricultureAgricultural land (% land area)Agricultural irrigated land (% of total agricultural land)Agricultural productivity, value added per worker (2000 $)Cereal yield (kg per hectare) Forests and biodiversityForest area (% land area)Deforestation (avg. annual %, 2000–2010)Terrestrial protected areas (% of total land area)Threatened species, mammalsThreatened species, birdsThreatened species, fishThreatened species, higher plants OceansTotal fisheries production (thousand metric tons)
Capture fisheries growth (avg. annual %, 1990–2011)Aquaculture growth (avg. annual %, 1990–2011)
Marine protected areas (% of territorial waters)Coral reef area (sq. km)Mangroves area (sq. km) Energy and emissionsEnergy use per capita (kg oil equivalent)Energy from biomass products and waste (% of total)Electric power consumption per capita (kWh)Electricity generated using fossil fuel (% of total)Electricity generated by hydropower (% of total)CO2 emissions per capita (metric tons) Water and sanitationInternal freshwater resources per capita (cu. m)Total freshwater withdrawal (% of internal resources)
Agriculture (% of total freshwater withdrawal)Access to improved water source (% of total population)
Rural (% of rural population)Urban (% of urban population)
Access to improved sanitation (% of total population)Rural (% of rural population)Urban (% of urban population)
Environment and healthParticulate matter (urban-pop.-weighted avg., µg/cu. m)Acute resp. infection prevalence (% of children under five)Diarrhea prevalence (% of children under five)Under-five mortality rate (per 1,000 live births) National accounting aggregates—savings, depletion and degradationGross savings (% of GNI)Consumption of fixed capital (% of GNI)Education expenditure (% of GNI)Energy depletion (% of GNI)Mineral depletion (% of GNI)Net forest depletion (% of GNI)CO2 damage (% of GNI)Particulate emissions damage (% of GNI)Adjusted net savings (% of GNI)
660 1,258 571671 1,022 521
38.6 36.5 28.02.3 3.8 3.5
42 44 39.. .. ..
167 334 308820 1,361 2,034
39.5 27.8 25.71.9 0.5 0.6
28.0 11.7 10.0....3
14
18.1 6,383 11,563–4.2 1.8 4.020.3 16.0 4.9
.. 5.8 ..
.. 17,980 15,120
.. 27,808 25,818
764 683 36365.2 58.2 66.2
1,022 553 24249.8 65.2 32.050.2 18.7 45.3
0.7 0.9 0.3
961 4,455 5,12534.3 3.2 4.5
79 84 9080 61 6569 48 5798 83 8640 31 3732 23 3252 42 47
34 41 5411 .. ..12 .. ..67 109 95
.. 18.4 25.28.3 10.9 7.72.5 3.7 3.01.8 10.4 1.41.6 2.2 2.00.0 0.5 1.20.8 0.5 0.30.2 0.4 0.5
.. –1.2 15.2
231The Little Green Data Book 2013
Country data
Sub-Saharan Africa group
Low-income group
Population (millions) 12.8 Land area (1,000 sq. km) 387 GDP ($ billions) 9.7
Zimbabwe

232 2013 The Little Green Data Book
a . Refers to area free from ice .
b . Excludes South Sudan .
c . Excludes South Sudan after July 9, 2011
Notes

233The Little Green Data Book 2013
Access to improved sanitation is the percentage of population with adequate access to excreta disposal facilities (private or shared, but not public) that can effectively prevent human, animal, and insect contact with excreta . Improved facilities range from simple but protected pit latrines to flush toilets with a sewerage connection . To be effective, facilities must be correctly constructed and properly maintained . (World Health Organization; data are for 2010)
Access to improved water source is the percentage of the population with reasonable access to an adequate amount of water from an improved source, such as piped water into a dwelling, plot, or yard; public tap or standpipe; tube-well or borehole; protected dug well or spring; or rainwater collection . Unimproved sources include an unprotected dug well or spring, cart with small tank or drum, bottled water, and tanker trucks . Reasonable access to an adequate amount means the availability of at least 20 liters a person a day from a source within 1 kilometer of the dwelling . (World Health Organization; data are for 2010)
Acute respiratory infection prevalence is the percentage of children under age five with acute respiratory infection in the two weeks prior to the survey . (United Nations Children’s Fund; data are for the most recent year available during 2005–10)
Adjusted net national income equals gross national income minus consumption of fixed capital, energy depletion, mineral depletion, and net forest depletion . (World Bank; data are for 2011)
Adjusted net savings equal gross savings minus consumption of fixed capital, plus education expenditures, minus energy depletion, mineral depletion, net forest depletion, and particulate emissions and carbon dioxide damage . (World Bank; data are for 2011)
Agricultural irrigated land refers to agricultural areas purposely provided with water, including land irrigated by controlled flooding . (Food and Agriculture Organization; data are for 2011)
Agricultural land is arable land, land under permanent crops, and permanent pastures . Arable land includes land defined by the Food and Agriculture Organization of the United Nations as land under temporary crops (double-cropped areas are counted once), temporary meadows for mowing or for pasture, land under market or kitchen gardens, and land temporarily fallow . Land abandoned as a result of shifting cultivation is excluded . Land under permanent crops is land cultivated with crops that occupy the land for long periods and need not be replanted after each harvest, such as cocoa, coffee, and rubber . This category includes land under flowering shrubs, fruit trees, nut trees, and vines but excludes land under trees grown for wood or timber . Permanent pasture is land used for five or more years for forage, including natural and cultivated crops . (Food and Agriculture Organization; data are for 2011)
Agricultural productivity is the ratio of agricultural value added, measured in 2000 U .S . dollars, to the number of workers in agriculture . Agricultural
Glossary
234 2013 The Little Green Data Book
productivity is measured by value added per unit of input . Agricultural value added includes that from forestry and fishing . Thus interpretations of land productivity should be made with caution . (Food and Agriculture Organization and World Bank; data are for 2011)
Aquaculture growth is the exponential change in aquaculture fisheries production for the period indicated . Aquaculture is understood to mean the farming of aquatic organisms including fish, molluscs, crustaceans, and aquatic plants . Aquaculture production specifically refers to output from aquaculture activities, which are designated for final harvest for consumption . (Food and Agriculture Organization; data are for 1990–2011)
Capture fisheries growth is the exponential change in capture fisheries production for the period indicated . Capture fisheries production contains the volume of fish catches landed by a country for all commercial, industrial, recreational, and subsistence purposes . (Food and Agriculture Organization; data are for 1990–2011)
Carbon dioxide (CO2) damage is estimated at $20 per ton of carbon (the unit damage in 1995 U .S . dollars) times the number of tons of carbon emitted . (World Bank estimates; data are for 2011)
Carbon dioxide (CO2) emissions per capita are carbon dioxide emissions divided by midyear population . (Carbon Dioxide Information Analysis Center, World Bank, and United Nations; data are for 2009)
Cereal yield, measured as kilograms per hectare of harvested land, includes wheat, rice, maize, barley, oats, rye, millet, sorghum, buckwheat, and mixed grains . Production data on cereals relate to crops harvested for dry grain only . Cereal crops harvested for hay or harvested green for food, feed, or silage and those used for grazing are excluded . The FAO allocates production data to the calendar year in which the bulk of the harvest took place . Most of a crop harvested near the end of a year will be used in the following year . (Food and Agriculture Organization; data are for 2011)
Consumption of fixed capital is the replacement value of capital used up in the process of production . (United Nations; data are extrapolated to 2011 from the most recent year available)
Coral reef area is a country’s area of coral reefs, which are shallow marine habitats defined both by a physical structure (corals) and by the organisms found on them . (See The World Atlas of Coral Reefs (2001), UNEP-World Conservation Monitoring Centre)
Deforestation is the permanent conversion of natural forest area to other uses, including shifting cultivation, permanent agriculture, ranching, settlements, and infrastructure development . Deforested areas do not include areas logged but intended for regeneration or areas degraded by fuel-wood gathering, acid precipitation, or forest fires . Negative numbers
Glossary

235The Little Green Data Book 2013
Glossaryindicate an increase in forest areas . (Food and Agriculture Organization; data are for 2000–2010)
Diarrhea prevalence is the percentage of children under age five who had diarrhea in the two weeks prior to the survey . (United Nations Children’s Fund; data are for the most recent year available during 2005–10)
Education expenditure is public current operating expenditures in education, including wages and salaries and excluding capital investments in buildings and equipment . (United Nations; data are extrapolated to 2011 from the most recent year available)
Electric power consumption per capita is the production of power plants and combined heat and power plants, minus transmission, distribution, and transformation losses and own use by heat and power plants plus imports minus exports divided by midyear population . (International Energy Agency; data are for 2010)
Electricity generated by hydropower is use of hydropower as a percentage of total inputs to the generation of electricity . (International Energy Agency; data are for 2010)
Electricity generated using fossil fuel is use of coal, oil, and gas as a percentage of total inputs to the generation of electricity . (International Energy Agency; data are for 2010)
Energy depletion is the ratio of the value of the stock of energy resources to the remaining reserve lifetime (capped at 25 years) . It covers crude oil, natural gas, and coal . (See World Bank 2011 for details; data are for 2011)
Energy from biomass products and waste is energy from solid biomass, liquid biomass, biogas, industrial waste, and municipal waste as a percentage of total energy use . (International Energy Agency; data are for 2010)
Energy use per capita refers to apparent consumption, which is equal to indigenous production plus imports and stock changes, minus exports and fuels supplied to ships and aircraft engaged in international transport . (International Energy Agency; data are for 2010)
Fisheries production, total, contains the volume of aquatic species caught by a country for all commercial, industrial, recreational, and subsistence purposes . The harvest from mariculture, aquaculture, and other types of fish farming is also included . (Food and Agriculture Organization; data are for 2011)
Forest area is land under natural or planted stands of trees, whether productive or not . (Food and Agriculture Organization; data are for 2011)
Freshwater withdrawal, agriculture, is withdrawals for irrigation and livestock production as a percentage of total freshwater withdrawal . (World Resources Institute; data are for various years; for details see World Development
Indicators 2013, Primary data documentation .)

236 2013 The Little Green Data Book
Freshwater withdrawal, total, is total water withdrawal, excluding evaporation losses from storage basins and including water from desalination plants in countries where they are a significant source . Withdrawals can exceed 100 percent of internal renewable resources because river flows from other countries are not included, because extraction from nonrenewable aquifers or desalination plants is considerable, or because there is significant water reuse . (Food and Agriculture Organization and World Resources Institute; data are for various years; for details see World Development Indicators
2013, Primary data documentation .)
GDP is gross domestic product and measures the total output of goods and services for final use occurring within the domestic territory of a given country, regardless of the allocation to domestic and foreign claims . GDP at purchaser values (market prices) is the sum of gross value added by all resident and nonresident producers in the economy plus any taxes and minus any subsidies not included in the value of the products . It is calculated without deductions for depreciation of fabricated assets or for depletion and degradation of natural resources . (World Bank, Organization for Economic Co-operation and Development, and United Nations; data are for 2011)
GNI is gross domestic product plus net receipts of primary income (employee compensation and property income) from abroad . GNI per capita is in current U .S . dollars, converted using the World Bank Atlas method (see World
Development Indicators 2013, Statistical methods) . (World Bank, Organization for Economic Co-operation and Development, and United Nations; data are for 2011)
GNI per capita is gross national income (GNI) divided by midyear population .
Gross savings are calculated as gross national income less total consumption, plus net transfers . (World Bank and Organization for Economic Co-operation and Development; data are for 2011)
Internal freshwater resources per capita are internal renewable resources, which include flows of rivers and groundwater from rainfall in the country but excludes river flows from other countries, divided by midyear population . (Refers to data reported to the Food and Agriculture Organization as of 2011)
Land area is a country’s total land area, excluding area under inland water bodies, national claims to continental shelf, and exclusive economic zones . In most cases the definition of inland water bodies includes major rivers and lakes . (Food and Agriculture Organization; data are for 2011)
Mangroves area is a country’s total area of mangroves, which are plants of a variety of different species, including trees, shrubs, palms, and ferns, that grow in the tropics and subtropics in saline inter-tidal coastal habitats, such as estuaries and shorelines . (See The World Atlas of Mangroves (2010), International Society for Mangrove Ecosystems, The Nature Conservancy, Food and Agriculture Organization, UNEP-World Conservation Monitoring Centre)
Glossary

237The Little Green Data Book 2013
GlossaryMarine protected areas are areas of intertidal or subtidal terrain—and overlying water and associated flora and fauna and historical and cultural features—that have been reserved by law or other effective means to protect part or all of the enclosed environment . (United Nations Environmental Program and the World Conservation Monitoring Centre, as compiled by the World Resources Institute; data are for 2010)
Mineral depletion is the ratio of the value of the stock of mineral resources to the remaining reserve lifetime (capped at 25 years) . It covers bauxite, copper, iron, lead, nickel, phosphate, tin, gold, silver, and zinc . (See World Bank 2011 for details; data are for 2011)
Net forest depletion is the product of unit resource rents and the excess of round-wood harvest over natural growth . If growth exceeds harvest, this figure is zero . (Food and Agriculture Organization and World Bank estimates of natural growth; data are for 2011)
Particulate emissions damage is calculated as the willingness to pay to reduce the risk of illness and death attributable to particulate emissions . (World Bank estimates; data are for 2010)
Particulate matter is fine suspended particulates of less than 10 microns in diameter that are capable of penetrating deep into the respiratory tract and causing damage . The indicator is the population-weighted average of all cities in the country with a population greater than 100,000 . (World Bank estimates; data are for 2010)
Population includes all residents who are present regardless of legal status or citizenship except for refugees not permanently settled in the country of asylum, who are generally considered part of the population of their country of origin . (United Nations; data are midyear estimates for 2011)
Terrestrial protected areas are totally or partially protected areas of at least 1,000 hectares that are designated as national parks, natural monuments, nature reserves, or wildlife sanctuaries; protected landscapes and seascapes; and scientific reserves . It includes World Conservation Union–protected area categories I–VI . (United Nations Environmental Program and the World Conservation Monitoring Centre, as compiled by the World Resources Institute; data are for 2010)
Threatened species, birds, are the number of species of birds classified by the International Union for Conservation of Nature (IUCN) as endangered, vulnerable, rare, indeterminate, out of danger, or insufficiently known . Birds are listed for countries included within their breeding or wintering ranges . (World Conservation Monitoring Centre and IUCN; data are for 2012)
Threatened species, fish, are the number of species of fish—cold-blooded aquatic vertebrates of the superclass Pisces—classified by the IUCN as endangered, vulnerable, rare, indeterminate, out of danger, or insufficiently known . (World Conservation Monitoring Centre and IUCN; data are for 2012)

238 2013 The Little Green Data Book
GlossaryThreatened species, higher plants, are the number of native vascular plant species classified by the IUCN as endangered, vulnerable, rare, indeterminate, out of danger, or insufficiently known . (World Conservation Monitoring Centre and IUCN; data are for 2012)
Threatened species, mammals, are the number of species of mammals— excluding whales and porpoises—classified by the IUCN as endangered, vulnerable, rare, indeterminate, out of danger, or insufficiently known . (World Conservation Monitoring Centre and IUCN; data are for 2012)
Under-five mortality rate is the probability that a newborn baby will die before reaching age five if subject to current age-specific mortality rates . (United Nations and United Nations Children’s Fund; data are for 2011)
Urban population is the share of the midyear population living in areas defined as urban in each country . (United Nations; data are for 2011)
Urban population growth is the exponential change in urban population for the period indicated . (United Nations; data are for 1990–2011)

239The Little Green Data Book 2013
World Bank 2011 . The Changing Wealth of Nations: Measuring Sustainable
Development in the New Millennium . Washington, D .C .: World Bank .
World Bank 2013 . World Development Indicators 2013 . Washington, D .C .: World Bank .
References

13AFGHANISTAN ALBANIA ALGERIA AMERICAN SAMOA ANDORRA ANGOLA ANTIGUA AND BARBUDA ARGENTINA ARMENIA ARUBA AUSTRALIA AUSTRIA AZERBAIJAN THE BAHAMAS BAHRAIN BANGLADESH BARBADOS BELARUS BELGIUM BELIZE BENIN BERMUDA BHUTAN BOLIVIA BOSNIA AND HERZEGOVINA BOTSWANA BRAZIL BRUNEI DARUSSALAM BULGARIA BURKINA FASO BURUNDI CAMBODIA CAMEROON CANADA CAPE VERDE CAYMAN ISLANDS CENTRAL AFRICAN REPUBLIC CHAD CHANNEL ISLANDS CHILE CHINA COLOMBIA COMOROS DEMOCRATIC REPUBLIC OF CONGO REPUBLIC OF CONGO COSTA RICA CÔTE D’IVOIRE CROATIA CUBA CURACAO CYPRUS CZECH REPUBLIC DENMARK DJIBOUTI DOMINICA DOMINICAN REPUBLIC ECUADOR ARAB REPUBLIC OF EGYPT EL SALVADOR EQUATORIAL GUINEA ERITREA ESTONIA ETHIOPIA FAEROE ISLANDS FIJI FINLAND FRANCE FRENCH POLYNESIA GABON THE GAMBIA GEORGIA GERMANY GHANA GREECE GREENLAND GRENADA GUAM GUATEMALA GUINEA GUINEA-BISSAU GUYANA HAITI HONDURAS HONG KONG SAR, CHINA HUNGARY ICELAND INDIA INDONESIA ISLAMIC REPUBLIC OF IRAN IRAQ IRELAND ISLE OF MAN ISRAEL ITALY JAMAICA JAPAN JORDAN KAZAKHSTAN KENYA KIRIBATI DEMOCRATIC PEOPLE’S REPUBLIC OF KOREA REPUBLIC OF KOREA KOSOVO KUWAIT KYRGYZ REPUBLIC LAO PEOPLE’S DEMOCRATIC REPUBLIC LATVIA LEBANON LESOTHO LIBERIA LIBYA LIECHTENSTEIN LITHUANIA LUXEMBOURG MACAO SAR, CHINA FORMER YUGOSLAV REPUBLIC OF MACEDONIA MADAGASCAR MALAWI MALAYSIA MALDIVES MALI MALTA MARSHALL ISLANDS MAURITANIA MAURITIUS MEXICO FEDERATED STATES OF MICRONESIA MOLDOVA MONACO MONGOLIA MONTENEGRO MOROCCO MOZAMBIQUE MYANMAR NAMIBIA NEPAL NETHERLANDS NEW CALEDONIA NEW ZEALAND NICARAGUA NIGER NIGERIA NORTHERN MARIANA ISLANDS NORWAY OMAN PAKISTAN PALAU PANAMA PAPUA NEW GUINEA PARAGUAY PERU PHILIPPINES POLAND PORTUGAL PUERTO RICO QATAR ROMANIA RUSSIAN FEDERATION RWANDA SAMOA SAN MARINO SÃO TOMÉ AND PRÍNCIPE SAUDI ARABIA SENEGAL SERBIA SEYCHELLES SIERRA LEONE SINGAPORE SINT MAARTEN SLOVAK REPUBLIC SLOVENIA SOLOMON ISLANDS SOMALIA SOUTH AFRICA SOUTH SUDAN SPAIN SRI LANKA ST. KITTS AND NEVIS ST. LUCIA ST. MARTIN ST. VINCENT AND GRENADINES SUDAN SURINAME SWAZILAND SWEDEN SWITZERLAND SYRIAN ARAB REPUBLIC TAJIKISTAN TANZANIA THAILAND TIMOR-LESTE TOGO TONGA TRINIDAD AND TOBAGO TUNISIA TURKEY TURKMENISTAN TURKS AND CAICOS ISLANDS TUVALU UGANDA UKRAINE UNITED ARAB EMIRATES UNITED KINGDOM UNITED STATES URUGUAY UZBEKISTAN VANUATU REPÚBLICA BOLIVARIANA DE VENEZUELA VIETNAM U.S. VIRGIN ISLANDS WEST BANK AND GAZA REPUBLIC OF YEMEN ZAMBIA ZIMBABWE
From World Development Indicators
The Little Green Data Book
The Little Green Data Book
1818 H Street N.W.
Washington, D.C. 20433 USA
Telephone: 202 473 1000
Fax: 202 477 6391
Web site: data.worldbank.org
Email: [email protected]
Agriculture
Forests and biodiversity
Oceans
Energy and emissions
Water and sanitation
Environment and health
National accounting aggregates
SKU 19814
ISBN 978-0-8213-9814-2
13