Embed Size (px)
Citation preview


ii
Published by:
Master of Education Policy and Development
Postgraduate Muhammadiyah University of Malang-Indonesia
ISBN : 978-979-796-258-6
Copyright © UMM Press
University of Muhammadiyah Malang-Indonesia
Jl. Raya Tlogomas No. 246 Malang 65144 Indonesia
Telp. +62341-464318 ext 149, Fax +62341-460435
Steering Committee
Prof. Madya Dr . Noorshah Saad (Sultan Idris University of Education, Malaysia)
Dr. Latipun (Muhammadiyah University of Malang, Indonesia)
Dr. Dwi Sulisworo (Ahmad Dahlan University of Yogyakarta, Indonesia)
Rohani Pooteh, MA (Prince of Songkla University Hatyai Thailand)
Suwandi, M.Ed (University of Malaya, Malaysia)
Prof. Madya Dr. Mohamad Zain Musa (Musa Asiah Foundation of Cambodia)
Nekmah Bakar, MA (An Nahdhah Education of Singapore)
The organizing committee is not responsible for any errors or views expressed in the papers as these
are responsibility of the individual author.
April, 2013

iii
Preface
Strenghtening the quality of education can be realized through innovation and development of
education. A model development in accordance with materials taught covers strategies, approach, and
method implemented in the learning process. Various models have been developed as a trend to
improve learning quality, including learning media, the integration of materials which fit to the
learning condition, long-distant learning, and a web-based learning. This international seminar on
education discussing innovation and development about education with concept or development
implementation in education
This International Seminar on Education, a cooperation between the Postgraduate Program of
the University of Muhammadiyah Malang Indonesia and Musa Asiah Foundation of Cambodia is
intended to study any issues concerning with strengthening teacher professionalism thorugh an
interdisciplinary approach. This seminar is appropriate and can give some chanches to share ideas
useful for improving the quality of education.
Selangor, April 27 2013
Editor

iv
v
Content
Preface iii
Content v-vi
Problem Solving in Mathematics
Akhsanul In’am
1-5
Implementation of Think-Pair Share Model to Improve The Ability Process and The
Learning Achievement of The Electric Static Concept of The Ninth Grade Students of
SMPN 7 Tarakan
Amat
6-9
Islamic Education Curriculum
Aminullah Malik Katamsi Afandi
10-13
Increasing The Effective Speed Reading using Tri Focus Steve Snyder
Dian Maulina
The Effect of Teams Games Tournament Strategy, Gender and Intelligence to
Learning Achievement
Dwi Riyanto
14-17
18-22
The Paradox on IT Literacy and Science’s Learning Achievement in Secondary
School
Dwi Sulisworo
23-26
Self Medication in Yogyakarta: Proportion And Predictors
Dyah Aryani Perwitasari, A Sakina
27-30
Instructional Program Evaluation Model
Eko Putro Widoyoko
31-33
Character Education Based on Language and Literature
Eny Hartari
34-38
Mental Health Psycho-Education As A Preventive Action To Realize Holistic Health
Community
I Dewa Ayu Eka Dharmatari
39-44
Professional Practice Report Case Receptive-Expressive Communication Disorders
Ida Sriwaty
45-48
A Group Case in Unit Pasaraya Cebongan (Implementation of Management Conflict
Training)
Indriani
49-52
Developing Learning Worksheet Using 7e Cycle To Enhance Learning Achievement
And Critical Thinking Skills
Irma Rosa Indriyani
53-56
Preliminary Study of Competitive Learning Model Ff-CURE in The Mathematics
Learning
Jero Budi Darmayasa
57-60
Gobak Sodor Games To Improve Student’s Motivation on Learning Mathematics
Kustiningsih
61-71
Fire Alarm Equipment as A Tool To Improve Student Critical Thinking Skills
Mahmudah
72-75

vi
Web Based Interactive Learning Media to Improve Learning Achievement
Masdi Saleh
76-79
Obtaining The Ni80Fe20 Thin Film Smoothness Through The Capasitance Value Of Film In The R-C Serial
Device
Moh Toifur
80-86
Islamic Counseling, An Intervention Model To Value Crisis
Muhammad Japar
87-89
The Role of Leader on Implementation of Quality Based Education
Nurmala Widyasari
90-92
Using Group Investigation Technique to Enhance Learning Achievement on Physics
Education
Nuryanto
93-97
Developing Children’s Autonomy Through Family and Preschool Education
Purwati
98-102
E-Learning Effectiveness to Improve Learning Achievement on Physics Learning At
Senior High School
Sri Puji Agustin
103-105
Implementation of Cooperative Learning Quiz-RT Students Class IX Junior High
School 01 Batu
Suharlik
106-111
A Contrastive Study Between Bugisness and English In Adjectives of Comparative
Degrees
Suparman
112-114
The Concept Character Building in The Javanese Society
Suradi
115-116
ICT Based Learning Media to Improve Education Quality
Suwartini
117-120
Optimizing The Understanding of Mathematics Content Using Learning Model
"Barter"
Sri Teguh Lestari Saptarini
121-124
Problem Based Learning Model to Promote Critical Thinking Tusino
125-128
Developing Computer Based Multimedia Instruction for Fundamental Concepts of
English Speech for Junior High School Students in Tarakan
Winarno
129-136
International Seminar on Innovation and Developmnet in Education Muhammadiyah University of Malang
Selangor, Saturday, April, 27 2013 Musa Asiah Foundation of Cambodia ISBN: 978-979-796-258-6 National University of Malaysia
80
Obtaining The Ni80Fe20 Thin Film Smoothness Through The Capasitance Value Of
Film In The R-C Serial Device
Moh. Toifur
Physics Department
Ahmad Dahlan University Yogyakarta,
Email: [email protected]
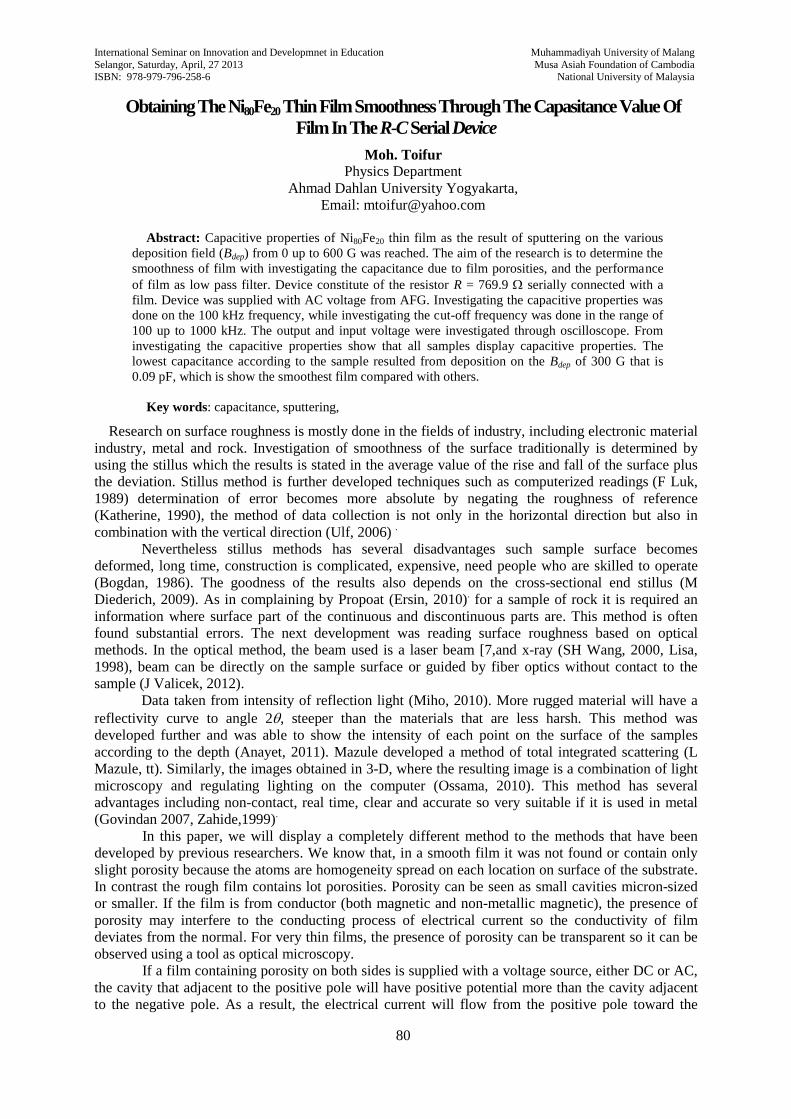
Abstract: Capacitive properties of Ni80Fe20 thin film as the result of sputtering on the various
deposition field (Bdep) from 0 up to 600 G was reached. The aim of the research is to determine the
smoothness of film with investigating the capacitance due to film porosities, and the performance
of film as low pass filter. Device constitute of the resistor R = 769.9 serially connected with a
film. Device was supplied with AC voltage from AFG. Investigating the capacitive properties was
done on the 100 kHz frequency, while investigating the cut-off frequency was done in the range of
100 up to 1000 kHz. The output and input voltage were investigated through oscilloscope. From
investigating the capacitive properties show that all samples display capacitive properties. The
lowest capacitance according to the sample resulted from deposition on the Bdep of 300 G that is
0.09 pF, which is show the smoothest film compared with others.
Key words: capacitance, sputtering,
Research on surface roughness is mostly done in the fields of industry, including electronic material
industry, metal and rock. Investigation of smoothness of the surface traditionally is determined by
using the stillus which the results is stated in the average value of the rise and fall of the surface plus
the deviation. Stillus method is further developed techniques such as computerized readings (F Luk,
1989) determination of error becomes more absolute by negating the roughness of reference
(Katherine, 1990), the method of data collection is not only in the horizontal direction but also in
combination with the vertical direction (Ulf, 2006) .
Nevertheless stillus methods has several disadvantages such sample surface becomes
deformed, long time, construction is complicated, expensive, need people who are skilled to operate
(Bogdan, 1986). The goodness of the results also depends on the cross-sectional end stillus (M
Diederich, 2009). As in complaining by Propoat (Ersin, 2010). for a sample of rock it is required an
information where surface part of the continuous and discontinuous parts are. This method is often
found substantial errors. The next development was reading surface roughness based on optical
methods. In the optical method, the beam used is a laser beam [7,and x-ray (SH Wang, 2000, Lisa,
1998), beam can be directly on the sample surface or guided by fiber optics without contact to the
sample (J Valicek, 2012).
Data taken from intensity of reflection light (Miho, 2010). More rugged material will have a
reflectivity curve to angle 2, steeper than the materials that are less harsh. This method was
developed further and was able to show the intensity of each point on the surface of the samples
according to the depth (Anayet, 2011). Mazule developed a method of total integrated scattering (L
Mazule, tt). Similarly, the images obtained in 3-D, where the resulting image is a combination of light
microscopy and regulating lighting on the computer (Ossama, 2010). This method has several
advantages including non-contact, real time, clear and accurate so very suitable if it is used in metal
(Govindan 2007, Zahide,1999).
In this paper, we will display a completely different method to the methods that have been
developed by previous researchers. We know that, in a smooth film it was not found or contain only
slight porosity because the atoms are homogeneity spread on each location on surface of the substrate.
In contrast the rough film contains lot porosities. Porosity can be seen as small cavities micron-sized
or smaller. If the film is from conductor (both magnetic and non-metallic magnetic), the presence of
porosity may interfere to the conducting process of electrical current so the conductivity of film
deviates from the normal. For very thin films, the presence of porosity can be transparent so it can be
observed using a tool as optical microscopy.
If a film containing porosity on both sides is supplied with a voltage source, either DC or AC,
the cavity that adjacent to the positive pole will have positive potential more than the cavity adjacent
to the negative pole. As a result, the electrical current will flow from the positive pole toward the

International Seminar on Innovation and Developmnet in Education Muhammadiyah University of Malang
Selangor, Saturday, April, 27 2013 Musa Asiah Foundation of Cambodia ISBN: 978-979-796-258-6 National University of Malaysia
81
negative pole. If the flowing of electric current strike the cavity, apart of the current will take another
route out of the cavity and apart of them occupy the two side of cavity as the surface charge. As a
result, this cavity can role as a capacitor and the medium in the cavity acts as a dielectric. Film having
a lot number cavities or have the large size cavity has a large capacitance, while in contrast on a film
which has a fewer and a smaller cavities will has a small capacitance.
This paper will discuss determining the value of the capacitance of permalloy thin film
(Ni80Fe20) as a results of sputtering on various deposition field. The estimation that the film has a
capacitive character was tested by using a serial RC circuit which is connected to AC voltage source
from AFG (Audio Frequency Generator) in the squarewave form with a frequency that can be set.
Output voltage is displayed visually through CRO screen. If the output voltage of film is the triangle
wave the film is capacitive properties. Furthermore, the value of C can be determined by two ways
that are from value of a fitting constant B that is equal to 1/RC if data (ti, vi) is fitted according to the BxAey where x = t and y = V; another is from the time constants RCτ corresponding to the
voltage max66,0 VV on the V vs. t curve.
Theory
1. Character of capacitive film
(a) (b)
Fig. 1. (a) Response of capacitor voltage (Vo) of the square wave input voltage (Vi). (b) Graph of
V vs. t and = RC position corresponding to V = 0.66 Vmax
If on electrical circuit containing a capacitor is supplied by square wave voltage, then output voltage
in capacitor is no longer the square wave but there is a reduction to a triangular wave. This reduction is
due to the event charging and discharging on the capacitor. The curvature mode of input and output is
as shown in Fig. 1. The equation for the output on capacitor is:
RCto eVtV /
max 1)( (1)
Where t = time, R = resistance, C = capacitance, Vmax = The maximum voltage. On t = RC or
commonly referred to as the time constant, , so eq. (1) becomes:
max66,0)( VtVo (2)
t
V(t)
Vi
Vo 0,66Vma
x
= RC
t
V(t)
International Seminar on Innovation and Developmnet in Education Muhammadiyah University of Malang
Selangor, Saturday, April, 27 2013 Musa Asiah Foundation of Cambodia ISBN: 978-979-796-258-6 National University of Malaysia
82
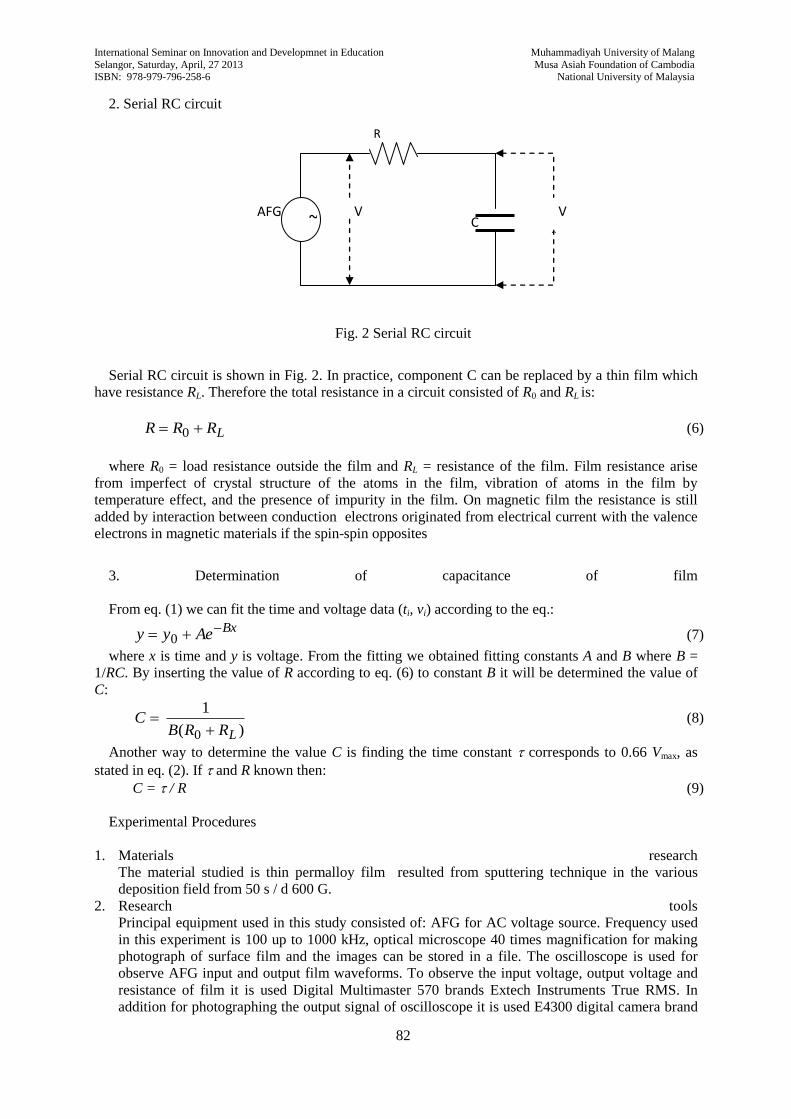
2. Serial RC circuit
Fig. 2 Serial RC circuit
Serial RC circuit is shown in Fig. 2. In practice, component C can be replaced by a thin film which
have resistance RL. Therefore the total resistance in a circuit consisted of R0 and RL is:
LRRR 0 (6)
where R0 = load resistance outside the film and RL = resistance of the film. Film resistance arise
from imperfect of crystal structure of the atoms in the film, vibration of atoms in the film by
temperature effect, and the presence of impurity in the film. On magnetic film the resistance is still
added by interaction between conduction electrons originated from electrical current with the valence
electrons in magnetic materials if the spin-spin opposites
3. Determination of capacitance of film
From eq. (1) we can fit the time and voltage data (ti, vi) according to the eq.:
BxAeyy 0 (7)
where x is time and y is voltage. From the fitting we obtained fitting constants A and B where B =
1/RC. By inserting the value of R according to eq. (6) to constant B it will be determined the value of
C:
)(
1
0 LRRBC
(8)
Another way to determine the value C is finding the time constant corresponds to 0.66 Vmax, as
stated in eq. (2). If and R known then:
C = / R (9)
Experimental Procedures
1. Materials research
The material studied is thin permalloy film resulted from sputtering technique in the various
deposition field from 50 s / d 600 G.
2. Research tools
Principal equipment used in this study consisted of: AFG for AC voltage source. Frequency used
in this experiment is 100 up to 1000 kHz, optical microscope 40 times magnification for making
photograph of surface film and the images can be stored in a file. The oscilloscope is used for
observe AFG input and output film waveforms. To observe the input voltage, output voltage and
resistance of film it is used Digital Multimaster 570 brands Extech Instruments True RMS. In
addition for photographing the output signal of oscilloscope it is used E4300 digital camera brand
~ C
R
0
AFG V
i V
o
International Seminar on Innovation and Developmnet in Education Muhammadiyah University of Malang
Selangor, Saturday, April, 27 2013 Musa Asiah Foundation of Cambodia ISBN: 978-979-796-258-6 National University of Malaysia
83
Nixon, Nixon Corp production Japan, two point probes is used to supply voltages in the film, the
potentiometer is used for determining the R that suitable to the requirements after serially arranged
together with film. In addition to these tools it is also used Igor software for data fitting process
between Vo and t according to equation (7).
Research procedures
The research was conducted through the following procedures:
a. Thin surface film Ni80Fe20 is photographed with an optical microscope and stored with the
specified file name.
b. Making a serial RC circuit as shown on Fig. 2 with installing a film as a capacitor and connecting
device with the source of AFG AC voltage at a frequency 100 kHz. Observation of input and
output voltages on oscilloscope is installed on dual mode (XY) so that Vi and Vo can be clearly
distinguished. Furthermore, the display on the CRO screen is photographed with a digital camera.
Meanwhile, measurements of film resistance is done with multimaster.
c. Repeating the procedure a and b for another sample.
Results and Discussion
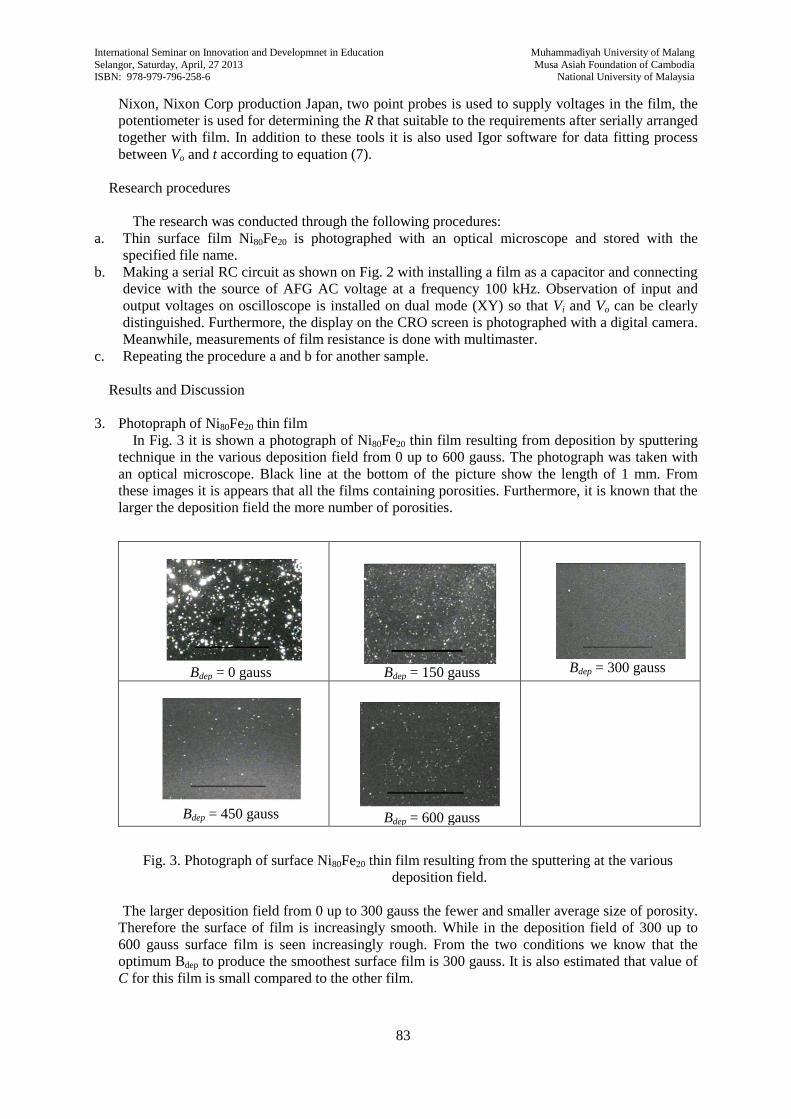
3. Photopraph of Ni80Fe20 thin film
In Fig. 3 it is shown a photograph of Ni80Fe20 thin film resulting from deposition by sputtering
technique in the various deposition field from 0 up to 600 gauss. The photograph was taken with
an optical microscope. Black line at the bottom of the picture show the length of 1 mm. From
these images it is appears that all the films containing porosities. Furthermore, it is known that the
larger the deposition field the more number of porosities.
Bdep = 0 gauss
Bdep = 150 gauss
Bdep = 300 gauss
Bdep = 450 gauss
Bdep = 600 gauss
Fig. 3. Photograph of surface Ni80Fe20 thin film resulting from the sputtering at the various
deposition field.
The larger deposition field from 0 up to 300 gauss the fewer and smaller average size of porosity.
Therefore the surface of film is increasingly smooth. While in the deposition field of 300 up to
600 gauss surface film is seen increasingly rough. From the two conditions we know that the
optimum Bdep to produce the smoothest surface film is 300 gauss. It is also estimated that value of
C for this film is small compared to the other film.

International Seminar on Innovation and Developmnet in Education Muhammadiyah University of Malang
Selangor, Saturday, April, 27 2013 Musa Asiah Foundation of Cambodia ISBN: 978-979-796-258-6 National University of Malaysia
84
2. Capacitive character of film
In Fig. 4 it is displayed photograph of V vs. t curve of each film on the oscilloscope screen. Picture
is taken at a frequency 100 KHz. From the graph it can be seen that all the films reveal capacitive
character. It is characterized by a change of signal from square wave in input to triangle wave in
output. Output waveforms such as those indicating the charging and discharging that occurs in the
film.
(a)
(b)
(c)
(d)
(e)
Fig. 4. Input and output signals for several films resulted from sputtering on various deposition field
(a) 0 G, (b) 150 G, (c) 300 G, (d) 450 G, (e) 600 G.
Furthermore, by looking the changes in curvature level of Vo and value Vmak on each graph, it
is appear that the magnitude of field affect the value of C. On the slowing curve, it is known that if
1/RC is large or C is small. In contrast on the steep curve Vo the value of C is large. In order to
quantitatively determine the value of C, on subsection 3 it is displayed the values resulting from data
fitting V vs. t of each sample.
3. Capacitance of film
in Table 1 it is shown equation of curve obtained from data fitting Vi vs ti for each sample
according to eq. (7). From the value B of each equation, by taking R as shown on column 4 of Table 1,
it is obtained value of C as shown in columns 5 and 6.
Table 1 Equation from fitting of set data (ti, vi) for film resulted by sputtering on variation Bdep
Bdep
(G) Fitting Equation R ()
C from
fitting
constant of
B (pF)
C’ from
time
constant (pF)
Relative
error
%100'
'
C
C
0 tetV 4718800078,556,4)( 4654,6 45,53 60,91 25,25
150 tetV 482180083,082,0)(
146139
,6 1,42 1,48 4,16
300 tetV 133320050,450,4)(
793877
0 0,09 0,10 8,19
450 tetV 334300087,1025,9)(
177829
,6 1,78 2,49 32,47
600 tetV 42740,406,84,7)( 1078,6 2093,99 2614,40 19,91

International Seminar on Innovation and Developmnet in Education Muhammadiyah University of Malang
Selangor, Saturday, April, 27 2013 Musa Asiah Foundation of Cambodia ISBN: 978-979-796-258-6 National University of Malaysia
85
Fig. 5 Graph the relationship between capacitance and field deposition. (a) The value of C
calculated from fitting constant B, (b) The value of C calculated from the time constant.
In column 5, table 1, it is appear that the capacitance of each film is small enough that is in
order of 10-1
up to 103 pF. Graphs depicting the relationship between capacitance and deposition field
can be seen in Fig. 5. It is appear that the magnitude of the deposition field affect on the value of C.
On deposition field of 0 up to 300 G, the value of C is dropped from 45.53 pF to 0.09 pF. In the
deposition field of 300 up to 450 G, the value of C is rose from 0.09 pF up to 2093.99 pF. This is
shows that the field Bdep 300 G is optimum field to produce the smoothest film and most little contains
porosity relative to the other film. These results are consistent with that obtained by the photographs as
refered in C.1.
Conclusion
From the discussion above it can be concluded some of the following: The method can be
used as an alternative to obtain the smoothness of metal thin film. Permalloy thin film resulted on Bdep
= 300 G has the smallest capacitance compared to the other permallois that is 0.09 pF which, so the
film is smoother than others.
References
Anayet U. Patwari, M. D. Arif, N.A. Chowdhury, and S. I. Chowdhury. (2011). 3-D Contour
Generation And Determination of Surface Roughness of Shaped and Horizontally Milled
plates Using Digital Image Processing, Annals Of Faculty Engineering Hunedoara,
International Journal Of Engineering, 9(3), 127-130
Bogdan Nowicki. (1986). Surface roughness and measurement with new contact methods,
International Journal of Machine Tool Design and Research, 26, 1, 61–68.
Ersin Kayahan, Hasan Oktem, Fikret Hacizade, Humbat Nasibov, Ozcan Gundogdu. (2010).
Measurement of surface roughness of metals using binary speckle image analysis, Tribology
International 43, 307–311
F Luk, V Huynh, W North, Measurement of surface roughness by a machine vision system. (1989).
Journal of Physics E: Scientific Instruments, 22 (12),977-980.
Govindan Gobi, Athi Balaji Ganesh, T. K. Radhakrishnan, and Dillibabu Sastikumar. (2007). An
Optical Approach to Estimate the Surface Roughness of Metals, Journal of American Science,
3(3), 49-53
J. Valíček, M. Držík, T. Hryniewicz, M. Harničárová, K. Rokosz, M. Kušnerová, K. Barčová, D.
Bražina. (2012). Non-Contact Method for Surface Roughness Measurement After Machining,
Measurement Science Review, 12(5), 184-188.
Katherine Creath and James C. Wyant, Absolute measurement of surface roughness. (1990). Applied
Optics, 29 (26), 3823-3827
International Seminar on Innovation and Developmnet in Education Muhammadiyah University of Malang
Selangor, Saturday, April, 27 2013 Musa Asiah Foundation of Cambodia ISBN: 978-979-796-258-6 National University of Malaysia
86
L Mazule, S Liukaityte, R C Eckardt2, A Melninkaitis, O Balachninaite and V Sirutkaitis, A system for
measuring surface roughness by total integrated scattering, J. Phys. D: Appl. Phys. 44(50),
Lisa C Leonard, Vincent Toal.(1998). Roughness Measurement Of Metallic Surfaces Based On The
Laser Speckle Contrast Method, Optics and Lasers in Engineering, 30(5), 433–440.
M.Diederichs and G. Grasselli. (2009). Measurement of Surface Roughness of Rock Discontinuities,
Proceedings of the 3rd CANUS Rock Mechanics Symposium, CSIRO Exploration and Mining,
Toronto, Australia.
Miho Yasaka. (2010). X-Ray Measurement Thin-Film Techniques V, The Rigaku Journal, 26(2).
Ossama B. Abouelatta. (2010). 3D Surface Roughness Measurement Using a Light Sectioning Vision
System, Proceedings of the World Congress on Engineering 2010, Vol I WCE 2010, June 30
- July 2, 2010, London, U.K.
S.H. Wang, Chenggen Quan, C.J. Tay, and H.M. Shang. (2000). Surface Roughness Measurement In
The Submicrometer Range Using Laser Scattering, Opt. Eng. 39(6), 1597-1601.
Ulf Persson. (2006). Surface roughness measurement on machined surfaces using angular speckle
correlation, Journal of Materials Processing Technology, DOI:10.1016/ j.jmatprotec. 06.010
Zahide Yilbas, M.S.J. Hasmi. (1999). Surface roughness measurement using an optical system,
Journal of Materials Processing Technology, 88 (1–3), 10–22


![s3-us-west-2.amazonaws.comAlbert+… · 54 BRUDERHEIM—BRUDERHEiM Normand M 796-3090 i Nussey Myron 796-3988 1Nussey Myron 796-3992] Nuthack Richard 4626 53Av 796-3500 l ObodiakMarcel](https://img.pdfslide.net/doc/110x75/5f5d1690a781cc79b10881ca/s3-us-west-2-albert-54-bruderheimabruderheim-normand-m-796-3090-i-nussey-myron.jpg)