Embed Size (px)
Citation preview
CONFIDENTIAL: DO NOT COPY OR DISTRIBUTE
Becoming an Island of Excellence®
XYZ Corporation
Breckenridge Culture Indicator™ (BCI™)
Level 1
Breckenridge Institute® PO Box 7950
Boulder, CO 80306 1-800-303-2554
www.breckenridgeinstitute.com
August 31, 2009
VERSION 1.0
Copyright © 2008, Mark Bodnarczuk, All Rights Reserved Page 2 of 21
TABLE OF CONTENTS Introduction ................................................................................................................................................... 3 Key Stakeholders .......................................................................................................................................... 4 Organizational Alignment.............................................................................................................................. 6 Four-Ways of Working™............................................................................................................................... 9 Emotional Messages................................................................................................................................... 11 Organizational Trust Index™ ...................................................................................................................... 14 Financial Impact .......................................................................................................................................... 16 Ten Cultural Questions ............................................................................................................................... 18 End Notes and Resources .......................................................................................................................... 19
VERSION 1.0
Copyright © 2008, Mark Bodnarczuk, All Rights Reserved Page 3 of 21
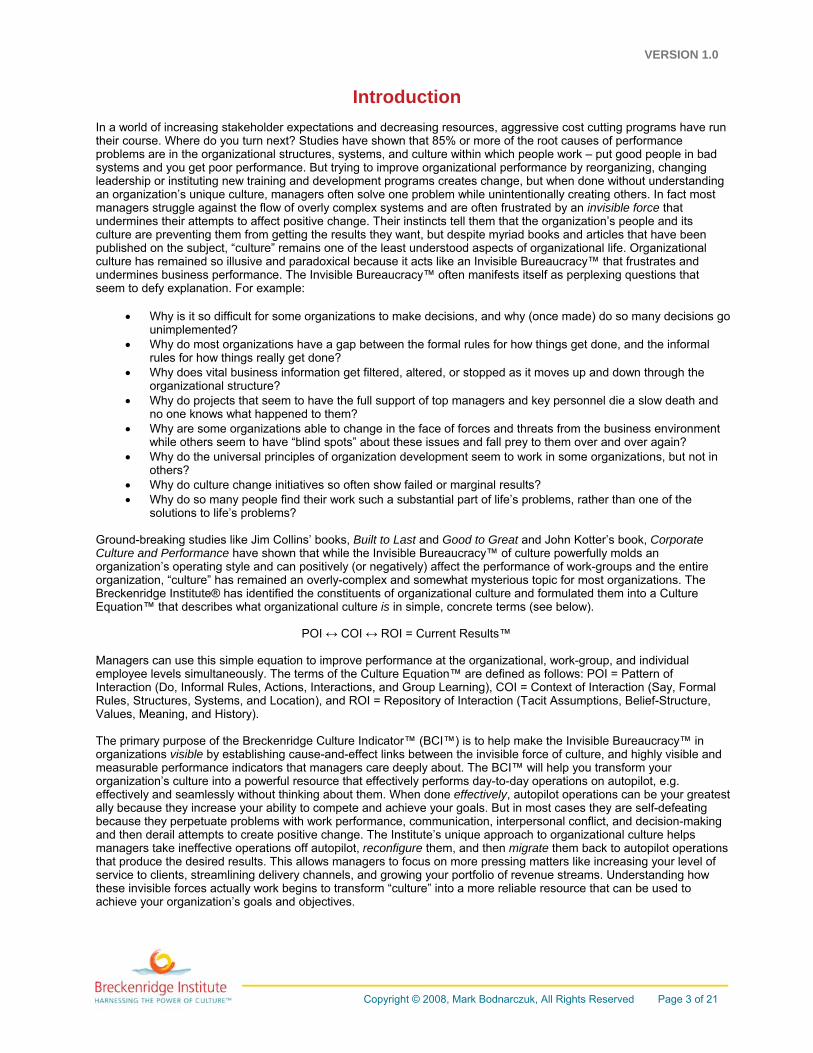
Introduction In a world of increasing stakeholder expectations and decreasing resources, aggressive cost cutting programs have run their course. Where do you turn next? Studies have shown that 85% or more of the root causes of performance problems are in the organizational structures, systems, and culture within which people work – put good people in bad systems and you get poor performance. But trying to improve organizational performance by reorganizing, changing leadership or instituting new training and development programs creates change, but when done without understanding an organization’s unique culture, managers often solve one problem while unintentionally creating others. In fact most managers struggle against the flow of overly complex systems and are often frustrated by an invisible force that undermines their attempts to affect positive change. Their instincts tell them that the organization’s people and its culture are preventing them from getting the results they want, but despite myriad books and articles that have been published on the subject, “culture” remains one of the least understood aspects of organizational life. Organizational culture has remained so illusive and paradoxical because it acts like an Invisible Bureaucracy™ that frustrates and undermines business performance. The Invisible Bureaucracy™ often manifests itself as perplexing questions that seem to defy explanation. For example:
• Why is it so difficult for some organizations to make decisions, and why (once made) do so many decisions go unimplemented?
• Why do most organizations have a gap between the formal rules for how things get done, and the informal rules for how things really get done?
• Why does vital business information get filtered, altered, or stopped as it moves up and down through the organizational structure?
• Why do projects that seem to have the full support of top managers and key personnel die a slow death and no one knows what happened to them?
• Why are some organizations able to change in the face of forces and threats from the business environment while others seem to have “blind spots” about these issues and fall prey to them over and over again?
• Why do the universal principles of organization development seem to work in some organizations, but not in others?
• Why do culture change initiatives so often show failed or marginal results? • Why do so many people find their work such a substantial part of life’s problems, rather than one of the
solutions to life’s problems? Ground-breaking studies like Jim Collins’ books, Built to Last and Good to Great and John Kotter’s book, Corporate Culture and Performance have shown that while the Invisible Bureaucracy™ of culture powerfully molds an organization’s operating style and can positively (or negatively) affect the performance of work-groups and the entire organization, “culture” has remained an overly-complex and somewhat mysterious topic for most organizations. The Breckenridge Institute® has identified the constituents of organizational culture and formulated them into a Culture Equation™ that describes what organizational culture is in simple, concrete terms (see below).
POI ↔ COI ↔ ROI = Current Results™ Managers can use this simple equation to improve performance at the organizational, work-group, and individual employee levels simultaneously. The terms of the Culture Equation™ are defined as follows: POI = Pattern of Interaction (Do, Informal Rules, Actions, Interactions, and Group Learning), COI = Context of Interaction (Say, Formal Rules, Structures, Systems, and Location), and ROI = Repository of Interaction (Tacit Assumptions, Belief-Structure, Values, Meaning, and History). The primary purpose of the Breckenridge Culture Indicator™ (BCI™) is to help make the Invisible Bureaucracy™ in organizations visible by establishing cause-and-effect links between the invisible force of culture, and highly visible and measurable performance indicators that managers care deeply about. The BCI™ will help you transform your organization’s culture into a powerful resource that effectively performs day-to-day operations on autopilot, e.g. effectively and seamlessly without thinking about them. When done effectively, autopilot operations can be your greatest ally because they increase your ability to compete and achieve your goals. But in most cases they are self-defeating because they perpetuate problems with work performance, communication, interpersonal conflict, and decision-making and then derail attempts to create positive change. The Institute’s unique approach to organizational culture helps managers take ineffective operations off autopilot, reconfigure them, and then migrate them back to autopilot operations that produce the desired results. This allows managers to focus on more pressing matters like increasing your level of service to clients, streamlining delivery channels, and growing your portfolio of revenue streams. Understanding how these invisible forces actually work begins to transform “culture” into a more reliable resource that can be used to achieve your organization’s goals and objectives.
VERSION 1.0
Copyright © 2008, Mark Bodnarczuk, All Rights Reserved Page 4 of 21
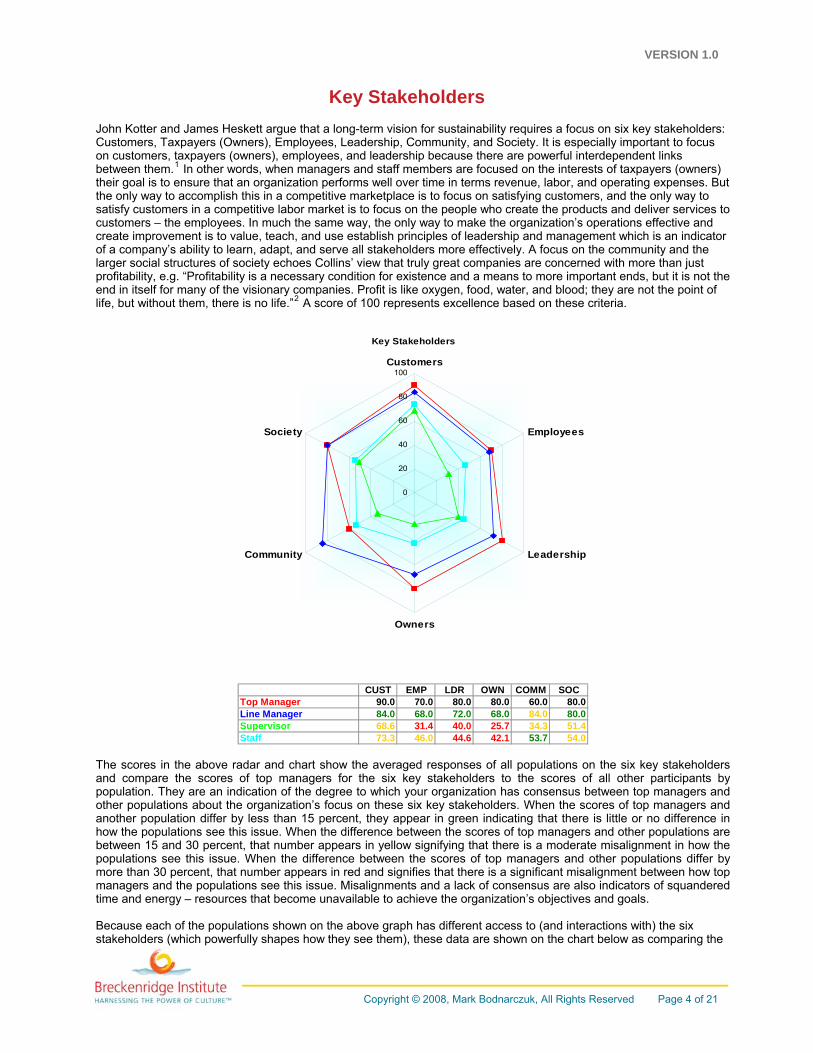
Key Stakeholders John Kotter and James Heskett argue that a long-term vision for sustainability requires a focus on six key stakeholders: Customers, Taxpayers (Owners), Employees, Leadership, Community, and Society. It is especially important to focus on customers, taxpayers (owners), employees, and leadership because there are powerful interdependent links between them.1 In other words, when managers and staff members are focused on the interests of taxpayers (owners) their goal is to ensure that an organization performs well over time in terms revenue, labor, and operating expenses. But the only way to accomplish this in a competitive marketplace is to focus on satisfying customers, and the only way to satisfy customers in a competitive labor market is to focus on the people who create the products and deliver services to customers – the employees. In much the same way, the only way to make the organization’s operations effective and create improvement is to value, teach, and use establish principles of leadership and management which is an indicator of a company’s ability to learn, adapt, and serve all stakeholders more effectively. A focus on the community and the larger social structures of society echoes Collins’ view that truly great companies are concerned with more than just profitability, e.g. “Profitability is a necessary condition for existence and a means to more important ends, but it is not the end in itself for many of the visionary companies. Profit is like oxygen, food, water, and blood; they are not the point of life, but without them, there is no life.”2 A score of 100 represents excellence based on these criteria.
Key Stakeholders
0
20
40
60
80
100Customers
Employees
Leadership
Owners
Community
Society
CUST EMP LDR OWN COMM SOC
90.0 70.0 80.0 80.0 60.0 80.0Line Manager 84.0 68.0 72.0 68.0 84.0 80.0Supervisor 68.6 34.3 51.4Staff 73.3 46.0 53.7 54.0
Top Manager
31.4 40.0 25.744.6 42.1
The scores in the above radar and chart show the averaged responses of all populations on the six key stakeholders and compare the scores of top managers for the six key stakeholders to the scores of all other participants by population. They are an indication of the degree to which your organization has consensus between top managers and other populations about the organization’s focus on these six key stakeholders. When the scores of top managers and another population differ by less than 15 percent, they appear in green indicating that there is little or no difference in how the populations see this issue. When the difference between the scores of top managers and other populations are between 15 and 30 percent, that number appears in yellow signifying that there is a moderate misalignment in how the populations see this issue. When the difference between the scores of top managers and other populations differ by more than 30 percent, that number appears in red and signifies that there is a significant misalignment between how top managers and the populations see this issue. Misalignments and a lack of consensus are also indicators of squandered time and energy – resources that become unavailable to achieve the organization’s objectives and goals. Because each of the populations shown on the above graph has different access to (and interactions with) the six stakeholders (which powerfully shapes how they see them), these data are shown on the chart below as comparing the
VERSION 1.0
Copyright © 2008, Mark Bodnarczuk, All Rights Reserved Page 5 of 21
scores of top managers for the six key stakeholders to the scores of all other participants by organizational unit and/or work-group.
CUST EMP LDR OWN COMM SOCTop Manager 90.0 70.0 80.0 80.0 60.0 80.0Business Administration 81.8 43.6 60.0 74.5 78.2Business Development 77.1 57.1 54.3 60.0 77.1 77.1Field Operations 74.6 44.6 40.8Technical Assurance 75.7 74.3 72.9 74.3 72.9 74.3Technical Services 71.3 67.0 58.3
41.8
48.8 34.2 49.6
40.0 42.6 38.3
When the scores of top managers and an organizational unit differ by less than 15 percent, they appear in green indicating that there is little or no difference in how the populations see this issue. When the difference between the scores of top managers and a work-group are between 15 and 30 percent, that number appears in yellow signifying that there is a moderate misalignment in how the populations see this issue. When the difference between the scores of top managers and a work-group differ by more than 30 percent, that number appears in red and signifies that there is a significant misalignment between how top managers and that work-group see this issue. As mentioned above, misalignments and a lack of consensus are also indicators of squandered time and energy – resources that become unavailable to achieve the organization’s objectives and goals.
VERSION 1.0
Copyright © 2008, Mark Bodnarczuk, All Rights Reserved Page 6 of 21
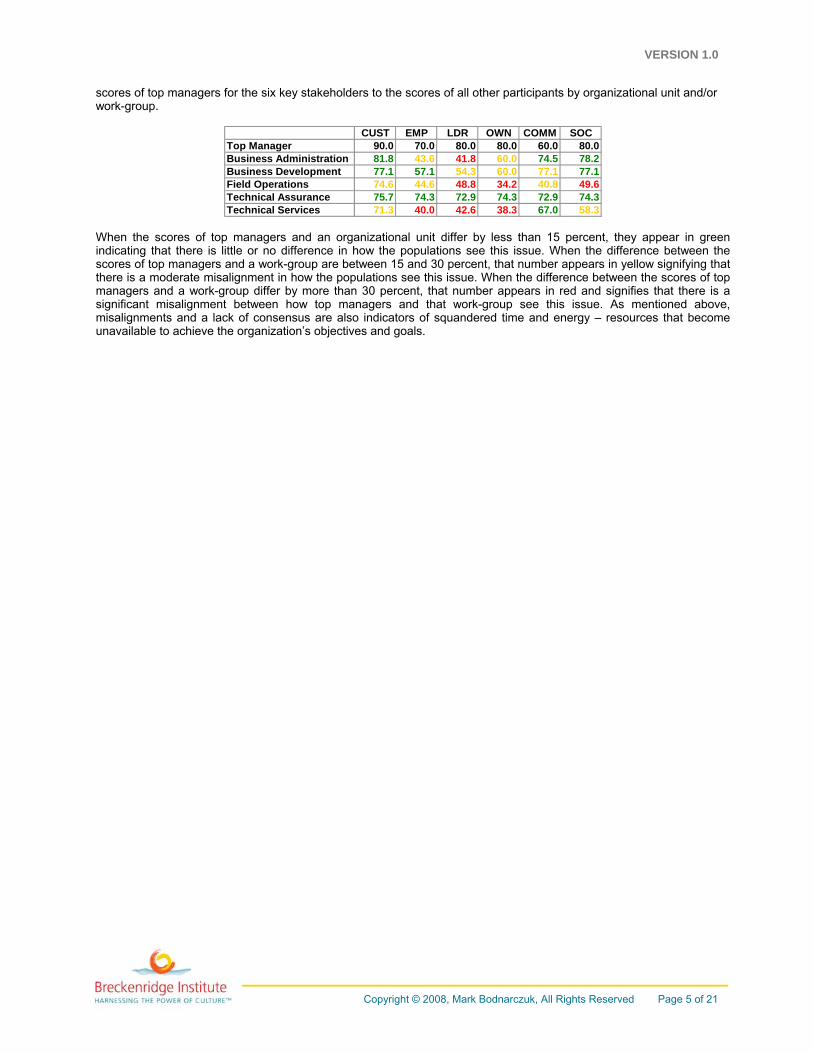
Organizational Alignment This part of the BCI™ report evaluates three areas: a) strategic view, b) execution, and c) organizational climate. The perspectives of Leadership Focus and Resources and Policies take a strategic (100,000 foot elevation) view of an organization. These evaluation criteria are based upon the principles taught by business experts such as Jim Collins, Peter Drucker, Jay Galbraith, Harry Beckwith, Al Ries and Jack Trout, Larry Bossidy, Michael Porter, Edwards Deming, numerous articles in the Harvard Business Review, and the Global Organization Design model developed by Elliot Jaques.3 The perspectives of Decisions and Rewards take evaluate how effectively the organizational units and work-groups in an organization can carry out and implement plans, goals, objectives and the organization’s overall strategic direction. These evaluation criteria are based on the principles taught by business experts such as Dave Hanna, Alec Sharp, Edwards Deming, Thomas Davenport, Paul Harmon, J.M. Juran, Alfie Kohn, the body of knowledge known as Human Performance Technology, numerous articles in the Harvard Business Review, and the Global Organization Design model developed by Elliot Jaques.4 The perspectives of Just Culture and Management Philosophy describe the characteristics of Organizational Climate. These evaluation criteria are based upon the principles taught by Edgar Schein, John Kotter, David Cooperrider, Terrence Deal and Allan Kennedy, Chris Argyris, Clotaire Rapaille, Alan Wilkins, Howell Baum, William Bridges, Ichak Adizes, Lawrence Millar, Rollo May, Anthony Storr, Arthur Koester, numerous articles in the Harvard Business Review, and the Global Organization Design model developed by Elliot Jaques.5 A score of 100 represents excellence as measured against the timeless principles defined by these practitioners and theorists.
Organizational Alignment
0
20
40
60
80
100Leadership Focus
Just Culture
Management Philosophy
Resources & Policies
Rewards
Decisions
LDR JUST MGMT RES REW DEC
66.7 62.0 72.0 53.8 44.0 52.0Line Manager 75.1 64.8 72.0 45.0 44.8 54.4Supervisor 43.2 38.3 42.3 33.9 17.1 41.7Staf
Top Manager
f 45.6 47.6 44.4 33.2 25.6 38.7
The key to interpreting the data on the radar graph is to look for: a) high scores, and b) the degree of overlap between the scores of populations. Similarities and differences between scores are an indication of the degree to which the organization has consensus between top managers and other populations in these six key areas. When the scores of top managers and another population differ by less than 15 percent, they appear in green which indicates that top managers and other populations see these issues in much the same way (see chart above). When the difference between the scores of top managers and other populations are between 15 and 30 percent, that number appears in yellow signifying that there is a moderate misalignment between that population and top managers in terms of how they see these issues. When the difference between the scores of top managers and other populations differ by more than 30 percent, that number appears in red and signifies that there is a significant misalignment between that population
VERSION 1.0
Copyright © 2008, Mark Bodnarczuk, All Rights Reserved Page 7 of 21
and top managers in terms of how they see these issues. Misalignments and a lack of consensus are also indicators of squandered time and energy – resources that become unavailable to achieve the organization’s objectives and goals. The data on the chart below is an indication of the degree to which your organization has consensus between top managers and work-groups in these six key areas. When the scores of top managers and a work-group differ by less than 15 percent, they appear in green which indicates that top managers and that work-group see these issues in much the same way.
LDR JUST MGMT RES REW DECTop Manager 66.7 62.0 72.0 53.8 44.0 52.0Business Administration 57.8 42.2 51.6 34.8 29.1 46.2Business Development 40.6 45.7 49.7 25.0 20.0 35.4Field Operations 46.7 49.6 48.8 36.4 22.4 40.9Technical Assurance 78.4 60.6 70.0 47.0 47.1 50.9Technical Services 49.0 49.0 42.6 33.6 32.3 43.8
When the difference between the scores of top managers and a work-group is between 15 and 30 percent, that number appears in yellow signifying that there is a moderate misalignment between that work-group and top managers in terms of how they see these issues. When the difference between the scores of top managers and a work-group differ by more than 30 percent, that number appears in red and signifies that there is a significant misalignment between that work-group and top managers in terms of how they see these issues. Misalignments and a lack of consensus are also indicators of squandered time and energy – resources that become unavailable to achieve the organization’s objectives and goals. The six perspectives shown on the radar graph and charts are defined below. Leadership Focus: This perspective evaluates the degree to which top managers in an organization have set a clear direction for achieving an organization’s mission and goals and can clearly communicate the organization’s purpose, goals, and core values to people inside and outside the organization. It also indicates whether top managers have identified the most important sources of revenue that drive financial performance and whether they use a balanced array of "vital few" performance measures to focus the time and energy of the entire organization on a common purpose and direction. The Leadership Focus perspective is an indicator of the degree to which top managers do what’s in the best interest of the organization, rather than being motivated by self-interest. It indicates the degree to which top managers are viewed as being competent to lead the organization (they know what they’re doing), can make tough choices, and have the determination and resolve to persevere in the face of obstacles. Resources and Policies: This perspective focuses on the degree to which management only budgets for, and commits resources to things that help the organization achieve its goals and objectives, and are consistent with the organization’s values. It also indicates whether the level of human, financial, and physical resources is adequate to achieve the goals and objectives defined in the organization’s strategic plan, and whether the allocation of financial and human resources, equipment, and space send a consistent set of signals that reinforce the desired behaviors. The Resources and Policies perspective also evaluates the degree to which high-level policies are aligned with (and support) achieving the strategic goals and objectives, and extent to which the compensation system motivates people to achieve their goals. Decisions: This perspective evaluates the degree to which an organization’s decision-making style has a bias toward action and producing practical solutions (issues don’t get “studied to death”), with meetings that are action-oriented and result in task assignments, due dates, milestones, deliverables, and follow-up. Also, managers have an effective method for reaching consensus on important issues, and only support decisions that implement or accelerate achieving the goals in the strategic plan. The Decision perspective also indicates the extent to which the organization uses fact-based decision-making with quantitative data and scientific analytics, not just business experience and intuition, and whether strategic goals, organizational unit plans, goals, and budgets are used to help direct the organization’s week-to-week and month-to-month operations. Rewards: This perspective focuses on the degree to which managers reward behaviors that implement or accelerate the process of achieving the goals in the strategic plan, and the degree to which they use their own visible behavior to teach employees how to handle problems in ways that reinforce the desired behaviors. The Rewards perspective also evaluates whether the criteria that managers use to allocate rewards and status, and things that managers pay attention to and care about (including their emotional reactions to critical incidents and crises), serve to reinforce the desired behaviors. Just Culture: This perspective evaluates the degree to which the organization analyzes the root causes of ineffective organizational performance in the structures, systems, and culture; e.g., managers don’t blame individual employees for an organization’s performance problems. It also indicates the size of the gap between the formal rules of the game for how things get done (Policies and Procedures) and the informal (unwritten) rules for how things “really” get done. The Just Culture perspective also evaluates whether managers are fair and objective, basing their evaluations on
VERSION 1.0
Copyright © 2008, Mark Bodnarczuk, All Rights Reserved Page 8 of 21
facts and quantitative data, not “politics” or personalities; whether managers and staff members trust the organization to do what it says; and whether people are free to present the unvarnished truth about organizational matters without fear of retribution. Management Philosophy: This perspective focuses on the degree to which managers are held accountable for the outputs of those who report to them, and for creating and sustaining a team that collaborates and is capable of producing the desired outputs. It also indicates whether managers are held accountable for providing leadership to their team (getting them to move in the same direction), and for adding value to the work of their direct reports. The Management Philosophy perspective also evaluates the extent to which managers have the authority to veto the appointment of new people to their organization, and to decide the kinds of work assignments that their direct reports will carry out. It also indicates whether managers have the authority to conduct personal effectiveness appraisals of their direct reports; to reward the desired performance; and to initiate the removal of a direct report from their role in their organization.
VERSION 1.0
Copyright © 2008, Mark Bodnarczuk, All Rights Reserved Page 9 of 21
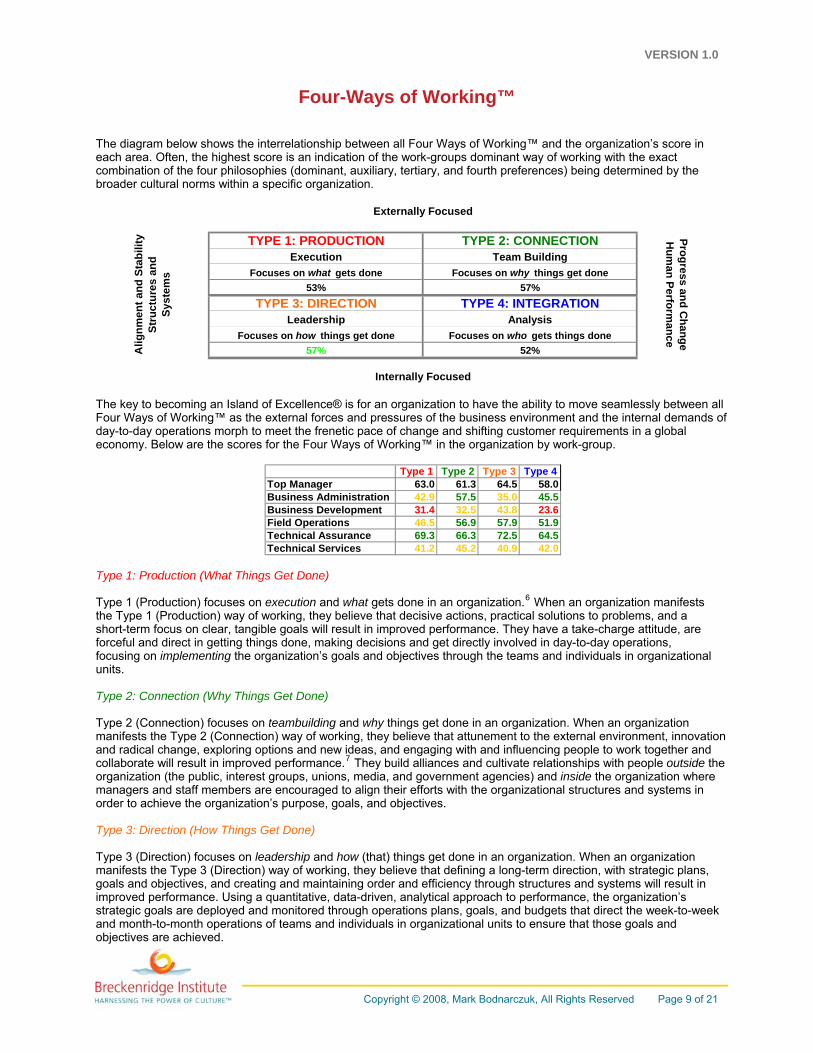
Four-Ways of Working™ The diagram below shows the interrelationship between all Four Ways of Working™ and the organization’s score in each area. Often, the highest score is an indication of the work-groups dominant way of working with the exact combination of the four philosophies (dominant, auxiliary, tertiary, and fourth preferences) being determined by the broader cultural norms within a specific organization.
Focuses on who gets things done57% 52%
Internally Focused
Progress and Change
Hum
an Performance
Execution Team Building
TYPE 3: DIRECTION TYPE 4: INTEGRATION
Externally Focused
Alig
nmen
t and
Sta
bilit
y St
ruct
ures
and
Sy
stem
s
TYPE 2: CONNECTION
Leadership AnalysisFocuses on how things get done
Focuses on what gets done Focuses on why things get done53% 57%
TYPE 1: PRODUCTION
The key to becoming an Island of Excellence® is for an organization to have the ability to move seamlessly between all Four Ways of Working™ as the external forces and pressures of the business environment and the internal demands of day-to-day operations morph to meet the frenetic pace of change and shifting customer requirements in a global economy. Below are the scores for the Four Ways of Working™ in the organization by work-group.
Type 1
31.4 23.6
Type 2 Type 3 Type 4Top Manager 63.0 61.3 64.5 58.0Business Administration 42.9 57.5 35.0 45.5Business Development 32.5 43.8Field Operations 46.5 56.9 57.9 51.9Technical Assurance 69.3 66.3 72.5 64.5Technical Services 41.2 45.2 40.9 42.0
Type 1: Production (What Things Get Done) Type 1 (Production) focuses on execution and what gets done in an organization.6 When an organization manifests the Type 1 (Production) way of working, they believe that decisive actions, practical solutions to problems, and a short-term focus on clear, tangible goals will result in improved performance. They have a take-charge attitude, are forceful and direct in getting things done, making decisions and get directly involved in day-to-day operations, focusing on implementing the organization’s goals and objectives through the teams and individuals in organizational units. Type 2: Connection (Why Things Get Done) Type 2 (Connection) focuses on teambuilding and why things get done in an organization. When an organization manifests the Type 2 (Connection) way of working, they believe that attunement to the external environment, innovation and radical change, exploring options and new ideas, and engaging with and influencing people to work together and collaborate will result in improved performance.7 They build alliances and cultivate relationships with people outside the organization (the public, interest groups, unions, media, and government agencies) and inside the organization where managers and staff members are encouraged to align their efforts with the organizational structures and systems in order to achieve the organization’s purpose, goals, and objectives. Type 3: Direction (How Things Get Done)
Type 3 (Direction) focuses on leadership and how (that) things get done in an organization. When an organization manifests the Type 3 (Direction) way of working, they believe that defining a long-term direction, with strategic plans, goals and objectives, and creating and maintaining order and efficiency through structures and systems will result in improved performance. Using a quantitative, data-driven, analytical approach to performance, the organization’s strategic goals are deployed and monitored through operations plans, goals, and budgets that direct the week-to-week and month-to-month operations of teams and individuals in organizational units to ensure that those goals and objectives are achieved.
VERSION 1.0
Copyright © 2008, Mark Bodnarczuk, All Rights Reserved Page 10 of 21
Type 4: Integration (Who Gets Things Done) Type 4 (Integration) focuses on analysis and who gets things done in the organization. When an organization manifests the Type 4 (Integration) way of working, they believe that building the organization’s knowledge-base and capabilities, attracting top talent and supporting and encouraging individual contributors, and analyzing how concepts, ideas, and underlying organizational patterns relate to each other will result in improved performance. They help achieve the organization’s goals and objectives through inner vision, inspiration, and by integrating the knowledge-base and competencies of human performers with the organization’s structures and systems to get the desired results. Here are some key ways to interpret the scores in the four quadrants shown above and how the four quadrants relate to each other and might manifest themselves in the organization.
• Top Half of the Graph: Type 1 (Production) and T2 (Connection) are externally focused toward the business environment, with a primary focus on serving customers as the reason for which an organization exists, and a secondary focus on the organization’s internal operations.
• Bottom Half of the Graph: Type 3 (Direction) and Type 4 (Integration) are internally focused toward the
organization’s operations, with a primary focus on internal operations, and a secondary focus on serving customers as the reason for which an organization exists.
• Left Side of the Graph: Type 1 (Production) and Type 3 (Direction) tend to see an organization as a
mechanistic configuration of structures and systems, with a focus on alignment and stability in both strategic and tactical operations.
• Right Side of the Graph: Type 2 (Connection) and Type 4 (Integration) tend to see an organization as an
organic network of human performers, with a focus on change and progress at both strategic and tactical levels.
• Compensatory Opposites: Type 1 (Production) and Type 4 (Integration) meet only at the center of the graph
and are paradoxical opposites that balance each other in a compensatory way and hold the greatest potential for deep change and growth because they exist in an Essential Tension™ that drives an organization toward a more well-round approach to doing business.
• Compensatory Opposites: Type 2 (Connection) and Type 3 (Direction) meet only at the center of the graph and
are paradoxical opposites that balance each other in a compensatory way and hold the greatest potential for deep change and growth because they exist in an Essential Tension™ that drives an organization toward a more well-round approach to doing business.
VERSION 1.0
Copyright © 2008, Mark Bodnarczuk, All Rights Reserved Page 11 of 21
onstructive.
Destructive
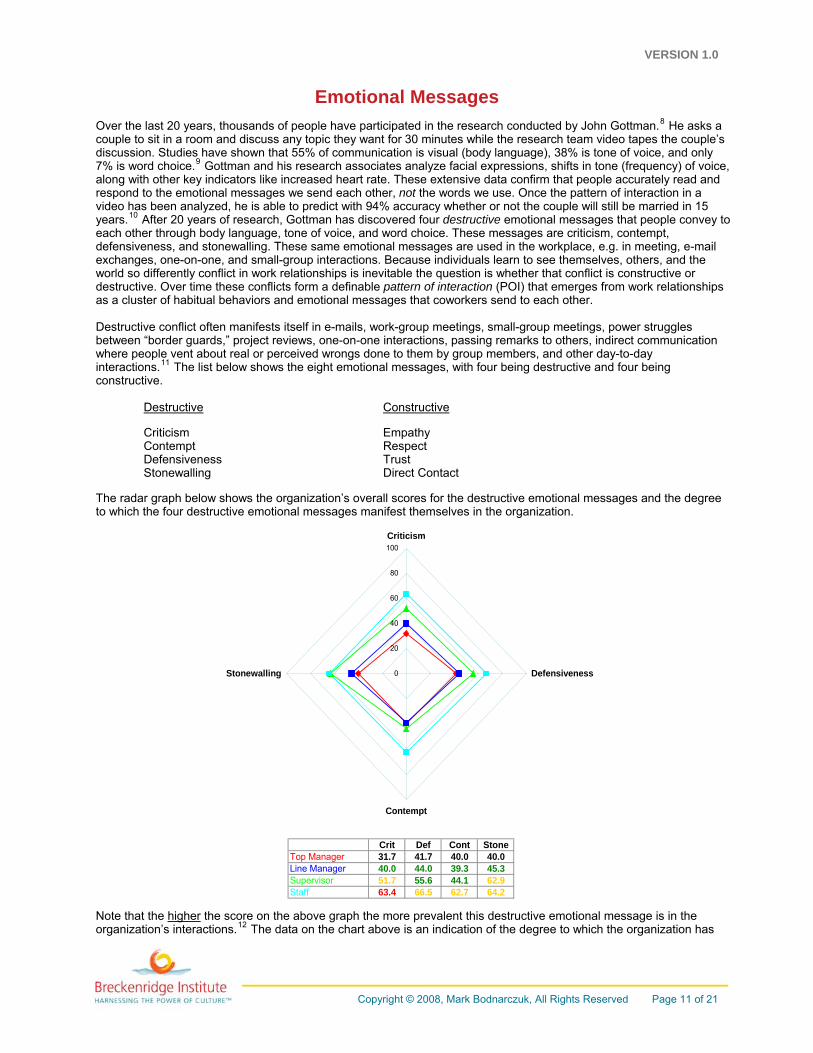
Emotional Messages Over the last 20 years, thousands of people have participated in the research conducted by John Gottman.8 He asks a couple to sit in a room and discuss any topic they want for 30 minutes while the research team video tapes the couple’s discussion. Studies have shown that 55% of communication is visual (body language), 38% is tone of voice, and only 7% is word choice.9 Gottman and his research associates analyze facial expressions, shifts in tone (frequency) of voice, along with other key indicators like increased heart rate. These extensive data confirm that people accurately read and respond to the emotional messages we send each other, not the words we use. Once the pattern of interaction in a video has been analyzed, he is able to predict with 94% accuracy whether or not the couple will still be married in 15 years.10 After 20 years of research, Gottman has discovered four destructive emotional messages that people convey to each other through body language, tone of voice, and word choice. These messages are criticism, contempt, defensiveness, and stonewalling. These same emotional messages are used in the workplace, e.g. in meeting, e-mail exchanges, one-on-one, and small-group interactions. Because individuals learn to see themselves, others, and the world so differently conflict in work relationships is inevitable the question is whether that conflict is constructive or destructive. Over time these conflicts form a definable pattern of interaction (POI) that emerges from work relationships as a cluster of habitual behaviors and emotional messages that coworkers send to each other. Destructive conflict often manifests itself in e-mails, work-group meetings, small-group meetings, power struggles between “border guards,” project reviews, one-on-one interactions, passing remarks to others, indirect communication where people vent about real or perceived wrongs done to them by group members, and other day-to-day interactions.11 The list below shows the eight emotional messages, with four being destructive and four beingc
Constructive
Stonewalling Direct Contact
messages and the degree to which the four destructive emotional messages manifest themselves in the organization.
Criticism Empathy Contempt Respect Defensiveness Trust
The radar graph below shows the organization’s overall scores for the destructive emotional
Crit Def Cont StoneTop Manager 31.7 41.7 40.0 40.0Line Manager 40.0 44.0 39.3 45.3Supervisor 55.6 44.1 62.9Staff 63.4 66.5 62.7 64.2
51.7
0
20
40
60
80
100Criticism
Defensiveness
Contempt
Stonewalling
Note that the higher the score on the above graph the more prevalent this destructive emotional message is in the organization’s interactions.12 The data on the chart above is an indication of the degree to which the organization has
VERSION 1.0
Copyright © 2008, Mark Bodnarczuk, All Rights Reserved Page 12 of 21
d
other
e
rganization to achieve its objectives and goals. The chart below shows the scores for e organization by work-group.
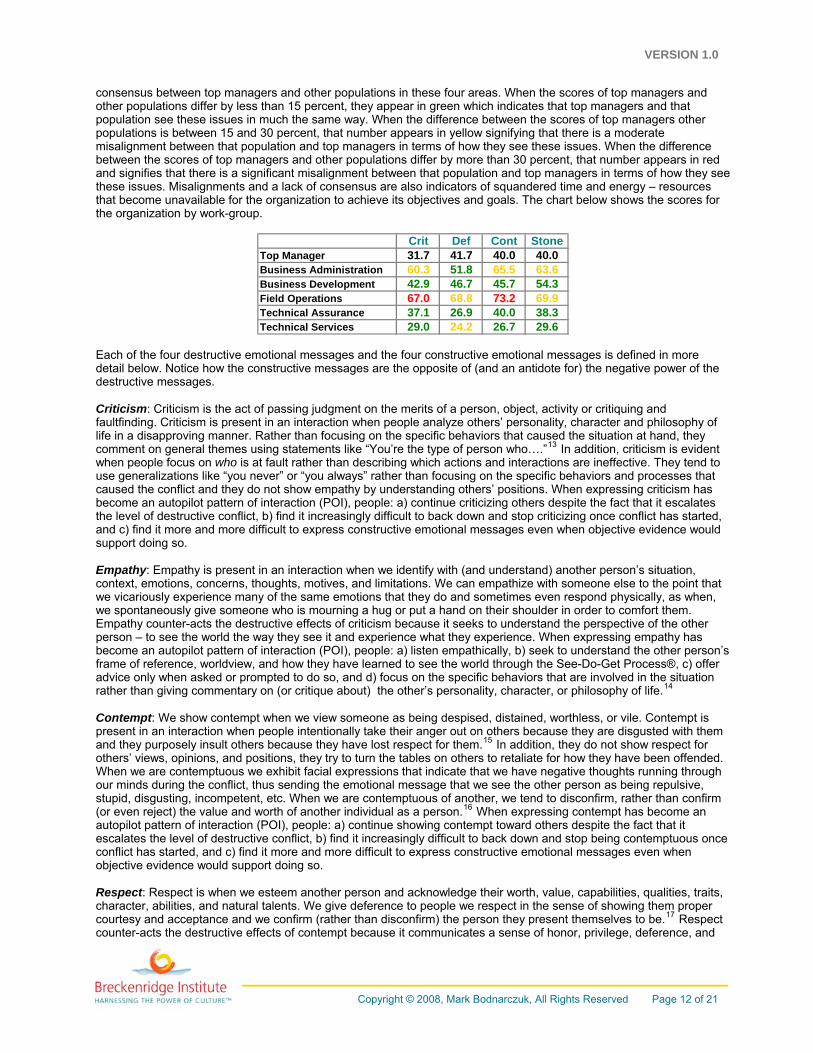
consensus between top managers and other populations in these four areas. When the scores of top managers another populations differ by less than 15 percent, they appear in green which indicates that top managers and that population see these issues in much the same way. When the difference between the scores of top managerspopulations is between 15 and 30 percent, that number appears in yellow signifying that there is a moderate misalignment between that population and top managers in terms of how they see these issues. When the difference between the scores of top managers and other populations differ by more than 30 percent, that number appears in red and signifies that there is a significant misalignment between that population and top managers in terms of how they sethese issues. Misalignments and a lack of consensus are also indicators of squandered time and energy – resources that become unavailable for the oth
Crit Def Cont StoneTop Manager 31.7 41.7 40.0 40.0Business Administration 60.3 51.8 65.5 63.6Business Development 46.7 54.3Field Operations 67.0 68.8 73.2 69.9Technical Assurance 37.1 26.9 40.0 38.3Technical Services 29.0 24.2 26.7 29.6
42.9 45.7
Each of the four destructive emotional messages and the four constructive emotional messages is defined in more detail below. Notice how the constructive messages are the opposite of (and an antidote for) the negative power of the estructive messages.
f
and more difficult to express constructive emotional messages even when objective evidence would upport doing so.
en,
tuation ther than giving commentary on (or critique about) the other’s personality, character, or philosophy of life.
m
h
m an
once ore difficult to express constructive emotional messages even when
bjective evidence would support doing so.
,
d Criticism: Criticism is the act of passing judgment on the merits of a person, object, activity or critiquing and faultfinding. Criticism is present in an interaction when people analyze others’ personality, character and philosophy olife in a disapproving manner. Rather than focusing on the specific behaviors that caused the situation at hand, they comment on general themes using statements like “You’re the type of person who….”13 In addition, criticism is evident when people focus on who is at fault rather than describing which actions and interactions are ineffective. They tend to use generalizations like “you never” or “you always” rather than focusing on the specific behaviors and processes that caused the conflict and they do not show empathy by understanding others’ positions. When expressing criticism has become an autopilot pattern of interaction (POI), people: a) continue criticizing others despite the fact that it escalates the level of destructive conflict, b) find it increasingly difficult to back down and stop criticizing once conflict has started, and c) find it more s Empathy: Empathy is present in an interaction when we identify with (and understand) another person’s situation, context, emotions, concerns, thoughts, motives, and limitations. We can empathize with someone else to the point thatwe vicariously experience many of the same emotions that they do and sometimes even respond physically, as whwe spontaneously give someone who is mourning a hug or put a hand on their shoulder in order to comfort them. Empathy counter-acts the destructive effects of criticism because it seeks to understand the perspective of the otherperson – to see the world the way they see it and experience what they experience. When expressing empathy has become an autopilot pattern of interaction (POI), people: a) listen empathically, b) seek to understand the other person’sframe of reference, worldview, and how they have learned to see the world through the See-Do-Get Process®, c) offer advice only when asked or prompted to do so, and d) focus on the specific behaviors that are involved in the si
14ra Contempt: We show contempt when we view someone as being despised, distained, worthless, or vile. Contempt is present in an interaction when people intentionally take their anger out on others because they are disgusted with theand they purposely insult others because they have lost respect for them.15 In addition, they do not show respect for others’ views, opinions, and positions, they try to turn the tables on others to retaliate for how they have been offended. When we are contemptuous we exhibit facial expressions that indicate that we have negative thoughts running througour minds during the conflict, thus sending the emotional message that we see the other person as being repulsive, stupid, disgusting, incompetent, etc. When we are contemptuous of another, we tend to disconfirm, rather than confir(or even reject) the value and worth of another individual as a person.16 When expressing contempt has become autopilot pattern of interaction (POI), people: a) continue showing contempt toward others despite the fact that it escalates the level of destructive conflict, b) find it increasingly difficult to back down and stop being contemptuousconflict has started, and c) find it more and mo Respect: Respect is when we esteem another person and acknowledge their worth, value, capabilities, qualities, traitscharacter, abilities, and natural talents. We give deference to people we respect in the sense of showing them proper courtesy and acceptance and we confirm (rather than disconfirm) the person they present themselves to be.17 Respectcounter-acts the destructive effects of contempt because it communicates a sense of honor, privilege, deference, and
VERSION 1.0
Copyright © 2008, Mark Bodnarczuk, All Rights Reserved Page 13 of 21
)
s in the lationship, and d) learn from how the other person sees themselves, others, and the world around them.
.
ess
d more difficult to express onstructive emotional messages even when objective evidence would support doing so.
, with
);
e
y of excusing their own behavior, and d) generally trust others to do what is appropriate nd fair in a given situation.
ine
it
ore difficult to express constructive emotional messages even when objective evidence would support doing so.
ause it
how leave issues
nsettled or things unsaid lest they accumulate, fester, and escalate destructive conflict over time.
esteem to the other person. When expressing respect has become an autopilot pattern of interaction (POI), people: atry to support one another rather than trying to turn the tables on each other to retaliate, b) exhibit facial expressions that communicate an emotional message of admiration, recognition, regard, and interest in what the other person is saying or trying to communicate non-verbally, c) grow in self-awareness as a result of working-through issuere Defensive: Being defensive is when people are excessively concerned about guarding against the real (or perceived)embarrassment and threat of having their shortcomings, inadequacies, failures, mistakes, or blind spots revealed by others. Being defensive is often caused by a lack of self-esteem and a lack of trust in ourselves, others, and the worldDefensiveness is present in an interaction when people try to make excuses when others complain about something they have done; they deny their responsibility for the things that caused the conflict and develop counter arguments to others’ complaints about them that put the blame back on others, e.g. “Yes-But-You….”18 They also try to second-guothers true feelings and motives, e.g. “You did that because you really think…” and rarely trust others to do what is appropriate and fair. When being defensive has become an autopilot pattern of interaction (POI), people: a) continue being defensive with others despite the fact that it escalates the level of destructive conflict, b) find it increasingly difficult to back down and stop their defensiveness once conflict has started, and c) find it more anc Trust: Trust is when we have confidence in (and can rely on) another person to deal with us honestly, fairlyintegrity, and to have our best interest in mind. People who encourage trust in others often exhibit six key characteristics, they: speak the unvarnished truth; have integrity by doing what they say (their deeds follow their wordsuse power fairly and without self-interest; demonstrate authentic competency in their personal and professional lives; model ethics and values even in difficult situations where it would be in their best interest to do otherwise; see us for who we really are.19 Trust counter-acts the destructive effects of defensiveness because there is no need to defend ourselves against people who demonstrate the six characteristics of trust over time. When expressing trust has becoman autopilot pattern of interaction (POI), people: a) accept personal responsibility for their mistakes, shortcoming, and failures, b) don’t blame others for problems and situations they have created, c) don’t try to second-guess others true feelings and motives as a waa Stonewalling: When people stonewall, they intentionally block, stall, resist, obstruct, hinder, or passively undermdecisions, actions, or interactions while trying to appear that they are not doing so. Stonewalling is present in an interaction when people show their disapproval with others by just walking away, leaving the room, or by letting others talk on-and-on and just “tuning out” what they are saying.20 They try not to show any reaction at all, even though they know that others are upset with them. When people stonewall others they just bite their tongue rather than respond to others complaints about them, and they do not communicate directly and open up about the situation so many things are left unsaid and many issues remain unsolved. When stonewalling has become an autopilot pattern of interaction (POI), people: a) continue stonewalling others despite the fact that it escalates the level of destructive conflict, b) findincreasingly difficult to stop stonewalling and communicate directly once conflict has started, and c) find it more andm Direct Contact: Direct contact is when people are straightforward, frank, candid, open, and transparent about dealing with a situation or interaction that is frustrating and undermining the relationship. Rather than defer an open discussionwith another person (even if it involves conflict), people who practice direct contact like to get things out on the table, especially in their intimate relationships. Direct contact counter-acts the destructive effects of stonewalling becacknowledges the reality of the situation and its affect on the other person and the importance of dealing with problematic situations as quickly as possible. When direct contact has become an autopilot pattern of interaction (POI), people: a) make eye contact in face-to-face discussions and situations that frustrate and undermine the relationship, b) focus on (and tune into) what others are trying to say and communicate in order to move beyond the impasse, c) shonest reactions and give frank feedback to others to communicate their perspective, and d) do notu
VERSION 1.0
Copyright © 2008, Mark Bodnarczuk, All Rights Reserved Page 14 of 21
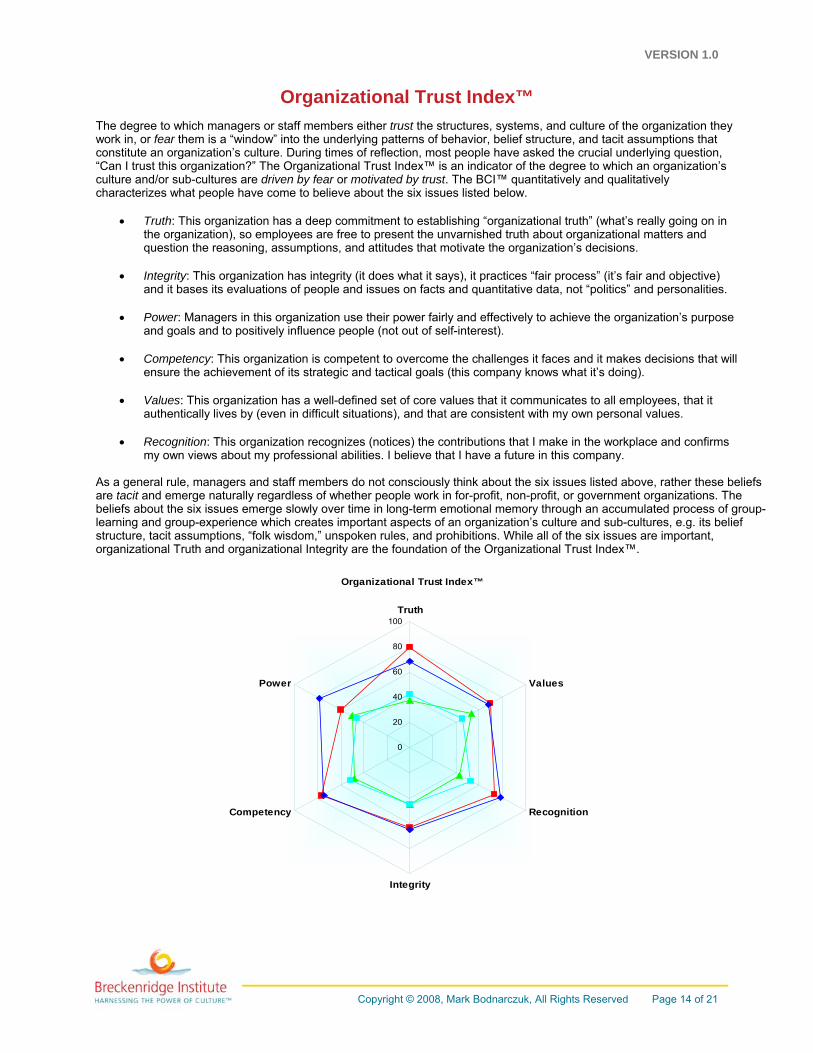
Organizational Trust Index™ The degree to which managers or staff members either trust the structures, systems, and culture of the organization they work in, or fear them is a “window” into the underlying patterns of behavior, belief structure, and tacit assumptions that constitute an organization’s culture. During times of reflection, most people have asked the crucial underlying question, “Can I trust this organization?” The Organizational Trust Index™ is an indicator of the degree to which an organization’s culture and/or sub-cultures are driven by fear or motivated by trust. The BCI™ quantitatively and qualitatively characterizes what people have come to believe about the six issues listed below.
• Truth: This organization has a deep commitment to establishing “organizational truth” (what’s really going on in the organization), so employees are free to present the unvarnished truth about organizational matters and question the reasoning, assumptions, and attitudes that motivate the organization’s decisions.
• Integrity: This organization has integrity (it does what it says), it practices “fair process” (it’s fair and objective)
and it bases its evaluations of people and issues on facts and quantitative data, not “politics” and personalities.
• Power: Managers in this organization use their power fairly and effectively to achieve the organization’s purpose and goals and to positively influence people (not out of self-interest).
• Competency: This organization is competent to overcome the challenges it faces and it makes decisions that will
ensure the achievement of its strategic and tactical goals (this company knows what it’s doing).
• Values: This organization has a well-defined set of core values that it communicates to all employees, that it authentically lives by (even in difficult situations), and that are consistent with my own personal values.
• Recognition: This organization recognizes (notices) the contributions that I make in the workplace and confirms
my own views about my professional abilities. I believe that I have a future in this company. As a general rule, managers and staff members do not consciously think about the six issues listed above, rather these beliefs are tacit and emerge naturally regardless of whether people work in for-profit, non-profit, or government organizations. The beliefs about the six issues emerge slowly over time in long-term emotional memory through an accumulated process of group-learning and group-experience which creates important aspects of an organization’s culture and sub-cultures, e.g. its belief structure, tacit assumptions, “folk wisdom,” unspoken rules, and prohibitions. While all of the six issues are important, organizational Truth and organizational Integrity are the foundation of the Organizational Trust Index™.
Organizational Trust Index™
0
20
40
60
80
100Truth
Values
Recognition
Integrity
Competency
Power
VERSION 1.0
Copyright © 2008, Mark Bodnarczuk, All Rights Reserved Page 15 of 21
TRU VAL REC INT COMP POW80.0 70.0 73.3 63.3 76.7 60.0
Line Manager 68.8 68.0 78.7 65.3 74.7 78.7Supervisor 53.3 45.6 48.0 50.0Staff 45.3 53.1 44.6 51.8 46.4
Top Manager
37.7 42.942.2
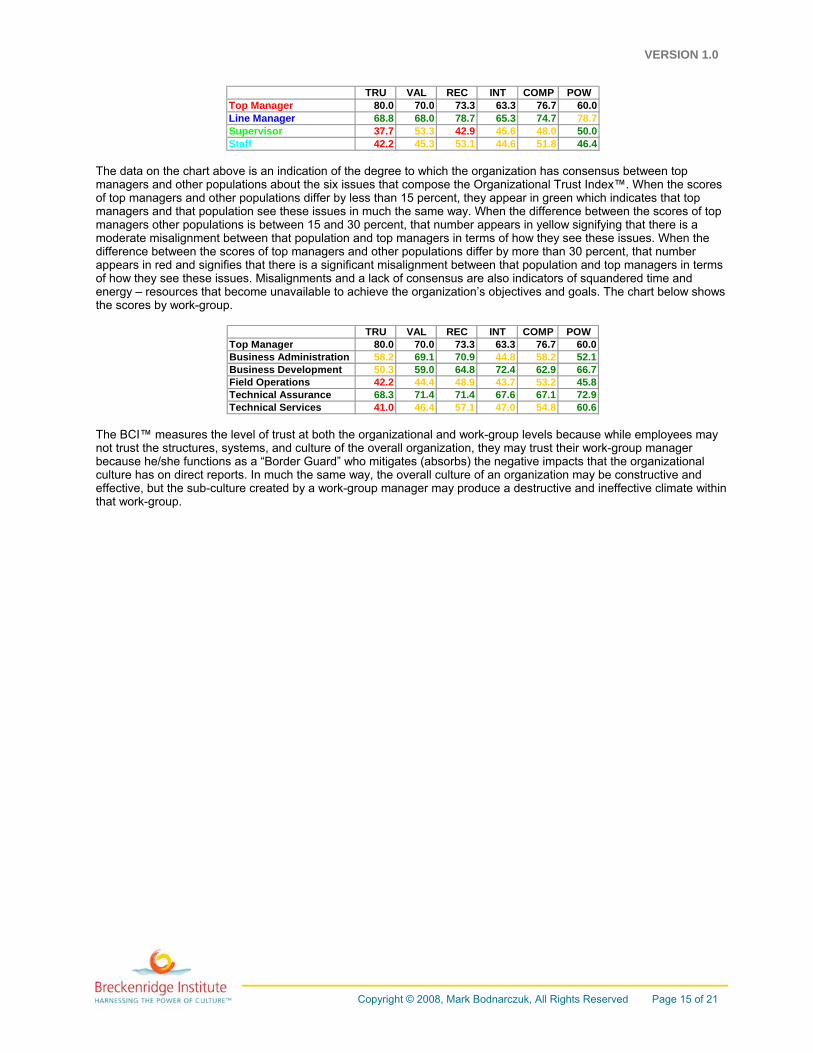
The data on the chart above is an indication of the degree to which the organization has consensus between top managers and other populations about the six issues that compose the Organizational Trust Index™. When the scores of top managers and other populations differ by less than 15 percent, they appear in green which indicates that top managers and that population see these issues in much the same way. When the difference between the scores of top managers other populations is between 15 and 30 percent, that number appears in yellow signifying that there is a moderate misalignment between that population and top managers in terms of how they see these issues. When the difference between the scores of top managers and other populations differ by more than 30 percent, that number appears in red and signifies that there is a significant misalignment between that population and top managers in terms of how they see these issues. Misalignments and a lack of consensus are also indicators of squandered time and energy – resources that become unavailable to achieve the organization’s objectives and goals. The chart below shows the scores by work-group.
TRU VAL REC INT COMP POWTop Manager 80.0 70.0 73.3 63.3 76.7 60.0Business Administration 58.2 69.1 70.9 44.8 58.2 52.1Business Development 50.3 59.0 64.8 72.4 62.9 66.7Field Operations 44.4 48.9 43.7 53.2 45.8Technical Assurance 68.3 71.4 71.4 67.6 67.1 72.9Technical Services 46.4 57.1 47.0 54.8 60.6
42.2
41.0 The BCI™ measures the level of trust at both the organizational and work-group levels because while employees may not trust the structures, systems, and culture of the overall organization, they may trust their work-group manager because he/she functions as a “Border Guard” who mitigates (absorbs) the negative impacts that the organizational culture has on direct reports. In much the same way, the overall culture of an organization may be constructive and effective, but the sub-culture created by a work-group manager may produce a destructive and ineffective climate within that work-group.
VERSION 1.0
Copyright © 2008, Mark Bodnarczuk, All Rights Reserved Page 16 of 21
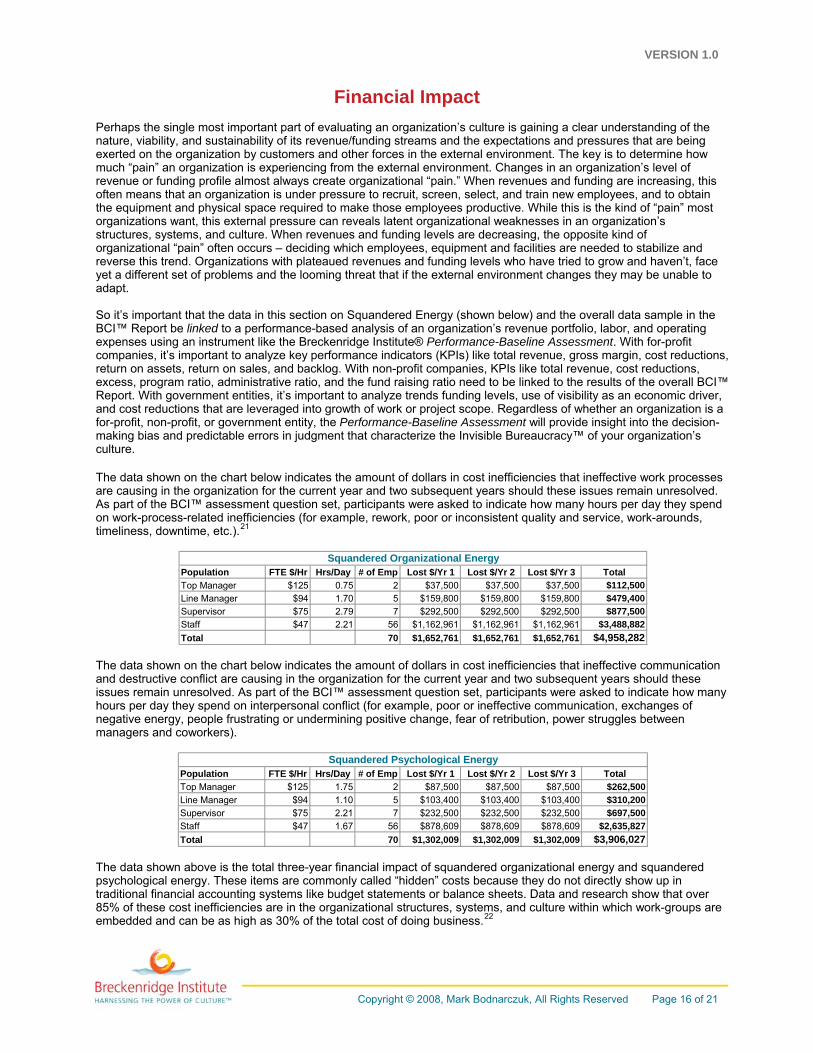
Financial Impact Perhaps the single most important part of evaluating an organization’s culture is gaining a clear understanding of the nature, viability, and sustainability of its revenue/funding streams and the expectations and pressures that are being exerted on the organization by customers and other forces in the external environment. The key is to determine how much “pain” an organization is experiencing from the external environment. Changes in an organization’s level of revenue or funding profile almost always create organizational “pain.” When revenues and funding are increasing, this often means that an organization is under pressure to recruit, screen, select, and train new employees, and to obtain the equipment and physical space required to make those employees productive. While this is the kind of “pain” most organizations want, this external pressure can reveals latent organizational weaknesses in an organization’s structures, systems, and culture. When revenues and funding levels are decreasing, the opposite kind of organizational “pain” often occurs – deciding which employees, equipment and facilities are needed to stabilize and reverse this trend. Organizations with plateaued revenues and funding levels who have tried to grow and haven’t, face yet a different set of problems and the looming threat that if the external environment changes they may be unable to adapt. So it’s important that the data in this section on Squandered Energy (shown below) and the overall data sample in the BCI™ Report be linked to a performance-based analysis of an organization’s revenue portfolio, labor, and operating expenses using an instrument like the Breckenridge Institute® Performance-Baseline Assessment. With for-profit companies, it’s important to analyze key performance indicators (KPIs) like total revenue, gross margin, cost reductions, return on assets, return on sales, and backlog. With non-profit companies, KPIs like total revenue, cost reductions, excess, program ratio, administrative ratio, and the fund raising ratio need to be linked to the results of the overall BCI™ Report. With government entities, it’s important to analyze trends funding levels, use of visibility as an economic driver, and cost reductions that are leveraged into growth of work or project scope. Regardless of whether an organization is a for-profit, non-profit, or government entity, the Performance-Baseline Assessment will provide insight into the decision-making bias and predictable errors in judgment that characterize the Invisible Bureaucracy™ of your organization’s culture. The data shown on the chart below indicates the amount of dollars in cost inefficiencies that ineffective work processes are causing in the organization for the current year and two subsequent years should these issues remain unresolved. As part of the BCI™ assessment question set, participants were asked to indicate how many hours per day they spend on work-process-related inefficiencies (for example, rework, poor or inconsistent quality and service, work-arounds, timeliness, downtime, etc.).21
Population FTE $/Hr Hrs/Day # of Emp Lost $/Yr 1 Lost $/Yr 2 Lost $/Yr 3 TotalTop Manager $125 0.75 2 $37,500 $37,500 $37,500 $112,500Line Manager $94 1.70 5 $159,800 $159,800 $159,800 $479,400Supervisor $75 2.79 7 $292,500 $292,500 $292,500 $877,500Staff $47 2.21 56 $1,162,961 $1,162,961 $1,162,961 $3,488,882Total 70 $1,652,761 $1,652,761 $1,652,761 $4,958,282
Squandered Organizational Energy
The data shown on the chart below indicates the amount of dollars in cost inefficiencies that ineffective communication and destructive conflict are causing in the organization for the current year and two subsequent years should these issues remain unresolved. As part of the BCI™ assessment question set, participants were asked to indicate how many hours per day they spend on interpersonal conflict (for example, poor or ineffective communication, exchanges of negative energy, people frustrating or undermining positive change, fear of retribution, power struggles between managers and coworkers).
Population FTE $/Hr Hrs/Day # of Emp Lost $/Yr 1 Lost $/Yr 2 Lost $/Yr 3 TotalTop Manager $125 1.75 2 $87,500 $87,500 $87,500 $262,500Line Manager $94 1.10 5 $103,400 $103,400 $103,400 $310,200Supervisor $75 2.21 7 $232,500 $232,500 $232,500 $697,500Staff $47 1.67 56 $878,609 $878,609 $878,609 $2,635,827Total 70 $1,302,009 $1,302,009 $1,302,009 $3,906,027
Squandered Psychological Energy
The data shown above is the total three-year financial impact of squandered organizational energy and squandered psychological energy. These items are commonly called “hidden” costs because they do not directly show up in traditional financial accounting systems like budget statements or balance sheets. Data and research show that over 85% of these cost inefficiencies are in the organizational structures, systems, and culture within which work-groups are embedded and can be as high as 30% of the total cost of doing business.22
VERSION 1.0
Copyright © 2008, Mark Bodnarczuk, All Rights Reserved Page 17 of 21
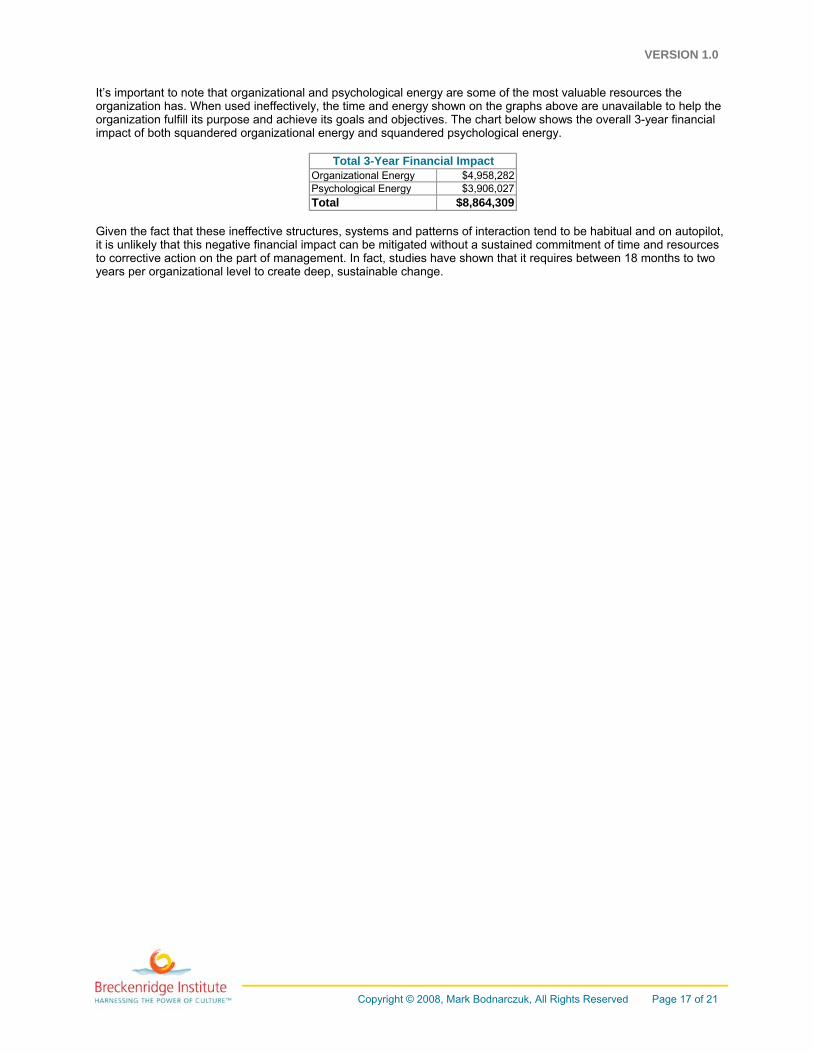
It’s important to note that organizational and psychological energy are some of the most valuable resources the organization has. When used ineffectively, the time and energy shown on the graphs above are unavailable to help the organization fulfill its purpose and achieve its goals and objectives. The chart below shows the overall 3-year financial impact of both squandered organizational energy and squandered psychological energy.
Organizational Energy $4,958,282Psychological Energy $3,906,027Total $8,864,309
Total 3-Year Financial Impact
Given the fact that these ineffective structures, systems and patterns of interaction tend to be habitual and on autopilot, it is unlikely that this negative financial impact can be mitigated without a sustained commitment of time and resources to corrective action on the part of management. In fact, studies have shown that it requires between 18 months to two years per organizational level to create deep, sustainable change.
VERSION 1.0
Copyright © 2008, Mark Bodnarczuk, All Rights Reserved Page 18 of 21
Ten Cultural Questions The Ten Cultural Questions are a mechanism for learning how to see organization’s differently. They provide a “window” into the underlying patterns of an organization’s culture, and a guide for reflecting on (and linking) the scores shown in the radar graphs with the day-to-day activities of organizational life. The ten questions are also a way to establish the “face-validity” of the data. As you review the scores on the radar graphs, charts, and the definitions for each perspective, reflect on the following questions and answer them as openly and honestly as possible.
• First, to what extent do the scores reflect your common sense experience and perceptions of day-to-day operations in your organization?
• Second, to what extent is one or more of the six perspectives derailing effective performance and preventing
you from getting the results you want in terms of revenue, labor, and operating expenses?
• Third, if a score is low and there is solid agreement that this set of practices is not happening in your organization is this the result of a conscious and deliberate strategy because an alternative set of practices was viewed as being more fitting to the organization?
• Fourth, if the omission of the set of practices was not the result of a conscious and deliberate strategy, would
implementing a “tailored” version of these practices improve organizational, work-group, and individual performance and help you get the results you want?
• Fifth, if the omission was not a conscious, deliberate decision and if implementing these practices would
improve performance, what are the underlying tacit beliefs, assumptions, attitudes, values (ROI) and ways of “seeing” these practices that prevent them from being implemented?
• Sixth, if the omission was not a conscious, deliberate decision and if implementing these practices would
improve performance, what structures, systems and formal rewards (COI) help to keep the current configuration in place?
• Seventh, if the omission was not a conscious, deliberate decision and if implementing these practices would
improve performance, what underlying patterns-of-interaction and informal rewards (POI) help to keep the current configuration in place?
• Eighth, what messages does the current configuration of POI, COI, and ROI send to employees and customers
about the organization and what are these messages encouraging and discouraging?
• Ninth, how much destructive or constructive conflict is the configuration of POI, COI, and ROI creating in the organization and how much organizational and psychological energy is this squandering in terms of revenue, labor, and operating expenses?
• Tenth, how wide is the gap between the formal and informal rules of the game, how undiscussible is the gap,
and how strong are the overt and covert forces that will rise up to derail a change initiative to narrow the gap if they “see” it as not being in their best-interest.
The current configuration of POI ↔ COI ↔ ROI = Current Results™ often creates decision-making bias and predictable errors in judgment at the organizational, work-group, and individual levels. This expresses itself in day-to-day operations and in the way participants answer the questions on the BCI™ survey. Consequently, when the data shown on the BCI™ radar graphs and charts are combined with the answers to the Ten Cultural Questions, they become a window into Invisible Bureaucracy™ in your organization and the configuration of your organization’s culture. More specifically, an organization’s culture is an interlocking set of beliefs, tacit assumptions, “folk wisdom,” unspoken rules, and prohibitions (ROI) that manifest themselves in the day-to-day realities of organizational life (POI and COI). The repository-of-interaction (ROI) is an interdependent, complementary, competing, and conflicting ways of seeing coworkers, business processes, strategy, work-practices, customers, and the external environment within which the organization is situated. These invisible cultural elements that lie beneath the surface of organizational consciousness can be made visible by repetitively asking the question “why” in the face of organizational issues until the underlying causes are identified. As Chris Argyris points out, the key to obtaining sustainable organizational and cultural change is for managers and staff at all organizational levels to have a common understanding of three things: a) the current results, b) the underlying causes of performance problems, and c) the desired results.23 If the quantitative data and reflections on the Ten Cultural Questions indicate that your organization has consensus in these three areas, the probability of achieving sustainable organizational and culture change is higher. If there are significant misalignments on these issues, the probability of achieving sustainable change will tend to be lower.

VERSION 1.0
Copyright © 2008, Mark Bodnarczuk, All Rights Reserved Page 19 of 21
VERSION 1.0
Copyright © 2008, Mark Bodnarczuk, All Rights Reserved Page 20 of 21
End Notes and Resources
1 John Kotter and James Heskett, Corporate Culture and Performance, (New York: Free Press, 1992), p. 46 ff; John Kotter, A Force for Change: How Leadership Differs from Management, (New York: Free Press, 1990). 2 James Collins and Jerry Porras, Built to Last, (New York: Harper Business, 1994), p. 46 ff. 3 Jim Collins, Good to Great, (New York: Harper Business, 2001); James C. Collins and Jerry I. Porras, Built to Last, (New York: Harper Business, 1994); Peter Drucker, The Essential Drucker, 1st
edition, (New York: Collins, 2001); Peter Drucker,
Management Challenges for the 21st Century, 1st edition, (New York: Collins, 1999); Peter Drucker, Innovation and
Entrepreneurship, (Harper Business, 1985); Jay Galbraith, Designing Organizations, (San Francisco: Jossey-Bass, 2002); Al Ries and Jack Trout, Positioning: The Battle for Your Mind, (New York: McGraw-Hill, 2001); Harry Beckwith, Selling the Invisible: A Field Guide to Modern Marketing, (New York: Warner Books, 1997); Harry Beckwith, The Invisible Touch: The Four Keys to Modern Marketing, (New York: Warner Books, 2000); Harry Beckwith, What Clients Love, (New York: Warner Books, 2003); Larry Bossidy and Ram Charan, Execution, (New York: Crown Business, 2002); Larry Bossidy and Ram Charan, Confronting Reality, (New York: Crown Business, 2004); Michael Porter, Competitive Strategy, 1998; Porter, Competitive Advantage, 1998; Deming, Out of Crisis,1986; Peter Drucker, “Managing Oneself” in the Harvard Business Review, March-April, 1999; Robert Kaplan and David Norton, “The Balanced Scorecard – Measures That Drive Performance” in the Harvard Business Review, January-February, 1992; Jim Collins, “Level 5 Leadership: The Triumph of Humility and Fierce Resolve” in the Harvard Business Review, January 2001; Harold J. Leavitt, “Why Hierarchies Thrive” in the Harvard Business Review, March 2003; Elliot Jaques, Requisite Organization, revised 2nd
edition memorial,
(Baltimore, MD: Cason Hall & Co., 2006); Elliot Jaques and Stephen D. Clement, Executive Leadership, (Arlington, VA: Cason Hall & Co., 1994); Elliot Jaques and Kathryn Cason, Human Capability, (Falls Church, VA: Cason Hall & Co., 1994); and Elliot Jaques, The Life and Behavior of Living Organisms: A General Theory, (Westport, CT: Praeger, 2002). 4 David P. Hanna, Designing Organizations for High Performance, (New York: Addison-Wesley, 1988); Alec Sharp and Patrick McDermott, Workflow Modeling: Tools for Process Improvement and Application Development, (Boston: Artech House, 2001); Deming, Out of Crisis, 1992; Thomas H. Davenport, Process Innovation: Reengineering Work through Information Technology, (Cambridge, MA: Harvard Business School Press, 1993; Paul Harmon, Business Process Change, (New York: Morgan Kaufman Publishers, 2003); Juran, Quality Control Handbook, 1979; 1986; Alfie Kohn, Punished by Rewards, (New York: Houghton Mifflin, 1993); Ram Charan, “Conquering a Culture of Indecision” in the Harvard Business Review, April 2001, Harold D. Stolovitch and Erica J. Keeps (eds.), Handbook of Human Performance Technology, 2nd
edition, (San Francisco: Pfeiffer, 1999); and Elliot Jaques and Stephen D. Clement, Executive Leadership,
(Arlington, VA: Cason Hall & Co., 1994). 5 Edgar Schein, The Corporate Survival Guide, (San Francisco: Jossey-Bass, 1999); Edgar Schein, Organizational Culture and Leadership, (San Francisco: Jossey-Bass, 1992); Edgar Schein, Process Consultation Revisited, (New York: Addison-Wesley, 1999); John Kotter and James Heskett, Corporate Culture and Performance, (New York: The Free Press, 1992); David Cooperrider, Diana Whitney, and Jacqueline Stavros, Appreciative Inquiry Handbook, (San Francisco: Berrett-Koehler Publishers, 2005); Terrence deal and Allan Kennedy, Corporate Cultures, (Cambridge, MA: Perseus, 2000); Chris Argyris, Robert Putnam, and Diana McLain Smith, Action Science, (San Francisco: Jossey-Bass, 1985); Chris Argyris, Knowledge for Action, (San Francisco: Jossey-Bass, 1993); Rapaille, The Culture Code, 2006); Alan Wilkins, Developing Corporate Character, (San Francisco: Jossey-Bass, 1989); Howell Baum, The Invisible Bureaucracy, (New York: Oxford University Press, 1987); William Bridge, Managing Transitions, (New York: Addison-Wesley, 1991); Ichak Adizes, Corporate Lifecycles, (Paramus, NJ: Prentice Hall, 1988); Lawrence Miller, Barbarians to Bureaucrats: Corporate Life Cycle Strategies, (New York: Fawcett Columbine, 1989); Rollo May, The Courage to Create, (New York: W.W. Norton & Company, 1975); Arthur Koestler, The Act of Creation, (New York: Arkana Penguin Books, 1989); Anthony Storr, The Dynamics of Creation, (New York: Ballantine Books, 1993); Peter Frost and Sandra Robinson, “The Toxic Handler: Organizational Hero and Casualty” in the Harvard Business Review, July-August 1999; Robert J. Herbold, “Inside Microsoft: Balancing Creativity and Discipline” in the Harvard Business Review, January 2002; Diane L. Coutu, “The Anxiety of Learning” in the Harvard Business Review, March 2002; Teresa M. Amabile, “How to Kill Creativity” in the Harvard Business Review, September-October, 1998; Carol Lavin Bernick, “When Your Culture Needs a Makeover” in the Harvard Business Review, June 2001; Elliot Jaques and Stephen D. Clement, Executive Leadership, (Arlington, VA: Cason Hall & Co., 1994); and Elliot Jaques, Creativity and Work, (Gloucester, MA: Cason Hall & Co., 1998). 6 The distinction between what, why, how, and who gets done in organizations was suggested by Ichak Adizes in Ichak Adizes, Corporate Life Cycles, (Paramus, NJ: Prentice Hall, 1988). 7 Capra argues that all of life and living systems can be organized into interdependent patterns, structures, and processes. See Fritjof Capra, The Web of Life: A New Scientific Understanding of Living Systems, (New York: Anchor Books, 1997). 8 See, John Gottman, Why Marriages Succeed or Fail and How You Can Make Yours Last, (New York: Simon & Schuster, 1994) and John Gottman, The Marriage Clinic: A Scientifically Based Marital Therapy, (New York: W.W. Norton & Company, 1999). 9 Paul Watzlawick argues that it is impossible for people not to communicate see, Paul Watzlawick, Janet Beavin, and Don Jackson, Pragmatics of Human Communication: A Study of Interaction Patterns, Pathologies, and Paradoxes, (New York: W.W. Norton & Company, 1967), p. 48 ff. 10 Malcolm Gladwell, Blink, (New York: Little, Brown, and Company, 2005), pp. 18-23.
VERSION 1.0
Copyright © 2008, Mark Bodnarczuk, All Rights Reserved Page 21 of 21
11 Because 55% of communication is visual-body language, 38% is tone of voice, and only 7% is word choice, e-mail leaves out 93% of the communication. Regardless of the intentions of the sender, recipients of e-mails tend to project their own meaning into the message to fill the 93% communication void. More times than not, this results in destructive conflict. In fact, Dunbar argues that the impersonality of communicating electronically through e-mail makes people less discrete in their interactions with others than face-to-face communication, e.g. they are more likely to be abusive when angry. Dunbar compares this “net rage” to the phenomenon of “road rage” where people in cars escalate to anger much more quickly than they probably would have had they been involved in face-to-face contact with the same person. See Robin Dunbar, Grooming, Gossip, and the Evolution of Language, (Cambridge, MA: Harvard University Press, 1997), p. 204 ff. 12 The definitions of the four destructive emotional messages presented here echo those developed by John Gottman in, John Gottman, Why Marriages Succeed or Fail and How You Can Make Yours Last, (Simon and Schuster, 1994), p. 72 ff. 13 This section echoes Gottman’s more detailed descriptions of Criticism found in John Gottman, Why Marriages Succeed or Fail, (New York: Simon and Schuster, 1994, p. 72 ff.). 14 Some methods for doing this can be found in the “Client-Centered” approach to listening proposed by Carl Rogers in Carl Rogers, On Becoming a Person, (Boston: Houghton Mifflin Company, 1961). Another more popularized method can be found in Stephen R. Covey’s Habit 5, “Seek first to understand, then to be understood” in Stephen R. Covey, The 7 Habits of Highly Effective People, (New York: Simon & Schuster, 1991). 15 This section echoes Gottman’s more detailed descriptions of Contempt found in John Gottman, Why Marriages Succeed or Fail, (New York: Simon and Schuster, 1994, p. 79 ff.). 16 For a description of confirming, rejecting, and disconfirming others as people, see Paul Watzlawick, Janet Helmick Beavin, and Don Jackson, Pragmatics of Human Communication, (New York: W.W. Norton & Company, 1967), p. 83 ff. 17 For a description of confirming, rejecting, and disconfirming others as people, see Paul Watzlawick, Janet Helmick Beavin, and Don Jackson, Pragmatics of Human Communication, (New York: W.W. Norton & Company, 1967), p. 83 ff. 18 This section echoes Gottman’s more detailed descriptions of Defensiveness found in John Gottman, Why Marriages Succeed or Fail, (New York: Simon and Schuster, 1994, p. 84 ff.). 19 Many of the principles of trust that hold in professional relationships also hold in intimate relationships. For a more complete discussion of the nature of trust in organizations see, Mark Bodnarczuk, The Organizational Trust Index™ as a Window into Organizational Culture, (web article, 2008). 20 This section echoes Gottman’s more detailed descriptions of Stonewalling found in John Gottman, Why Marriages Succeed or Fail, (New York: Simon and Schuster, 1994, p. 93 ff.). 21 This is based on the assumption that a senior manager’s fully loaded salary is $200,000 per year, a line manager’s fully loaded salary is $150,000 per year, a supervisor’s fully loaded salary is $120,000, and a staff member’s fully loaded is $75,000. More specifically, we are assuming eight hours/day and five days/week, with 200 days/year worked = 1,600 hours/year with the following fully-loaded dollar-per-hour rates: a) top managers = $125/hr, b) middle managers = $94/hr, c) supervisors = $75/hr, and d) staff = $47/hr. 22 For a more complete discussion on hidden costs in the structures, system, and culture see, J.M. Juran (ed.), Quality Control Handbook, 3rd Edition, (New York: McGraw-Hill Book Company, 1979), p. 5-1 ff. 23 Chris Argyris, Flawed Advice and the Management Trap, (New York: Oxford University Press, 2000).