Embed Size (px)
Citation preview

Isolation of Natural Products from Casearia nigrescens
Rebecca Clare Guza
A thesis submitted in partial fulfillment of the requirements for the degree of
Masters of Science in Chemistry
Virginia Polytechnic Institute and State University
Dr. David G. I. Kingston Dr. Timothy Long Dr. Paul R. Carlier
June 14, 2004 Blacksburg, VA
Keywords: natural products, clerodane diterpenes, Casearia nigrescens
Abstract
Isolation of Natural Products from Casearia nigrescens
Rebecca Clare Guza
As part of the continuing work of the International Cooperative Biodiversity Group
(ICBG), plant extracts were received from Madagascar. The extracts were screened for
cytotoxicity using the A2780 human ovarian cancer cell line bioassay. The crude extract of
Casearia nigrescens was fractionated and yielded five known compounds and one new
compound that were cytotoxic. Mass spectrometry and 1D and 2D NMR techniques were used
to determine the structure of the isolated compounds.
The dichloromethane fraction of Casearia nigrescens was weakly active in the A2780
human ovarian cancer cell line bioassay. Further separation of the dichloromethane fraction
resulted in the isolation of five known compounds (casearlucin A, caseamenbrol A, rel-
18(S),19(R)-diacetoxy-18,19-epoxy-6(R)-hydroxy-2(S)-(2ξ-methylbutanoyloxy)-
5(R),8(S),9(S),10(R)-cleroda-3,13(16),14-triene, casearlucin B, and rel-18(S),19(R)-diacetoxy-
18,19-epoxy-2(S)-(2ξ-methylbutanoyloxy)-5(R),8(S),9(S),10(R)-cleroda-3,13(16),14-triene) and
one new compound (casearlucin L). Based on the available literature this was the first
investigation of the natural products of Casearia nigrescens. The structure of the known
compounds was determined by comparison of the NMR, MS, optical rotation, UV, and IR data
with the data found in the literature. The structure of casearlucin L was determined by NMR
data and comparison with the NMR data for similar known compounds.

iii
Acknowledgements
I would like to thank Dr. Kingston for allowing me to work in his group and learn more
about the area of natural product chemistry. I would also like to thank all the members of the
Kingston group for their help and guidance. Finally, I would like to thank Tom Glass and Bill
Bebout for all their help with spectral analysis.

iv
Table of Contents
Abstract ii
List of Structures vi
List of Figures vii
List of Schemes viii
List of Tables ix
I. Natural Product Chemistry 1
1.1 General Introduction 1
1.2 Historically Important Natural Products 1
1.2.1 Morphine 2
1.2.2 Quinine 2
1.2.3 Penicillin 3
1.2.4 Vinblastine and Vincristine 3
1.2.5 Paclitaxel 4
1.3 Natural Products in Pharmaceuticals 5
1.3.1 Cancer and the Role of Natural Products 6
1.4 International Cooperative Biodiversity Group (ICBG) 7
1.5 Bioassays 8
1.5.1 Mechanism-Based Assays 8
1.5.2 Cell-Based Assays 9
1.5.3 A2780 Assay 9
II. Cytotoxic Clerodane Diterpenes from Casearia nigrescens 10
2.1 Introduction 10
v
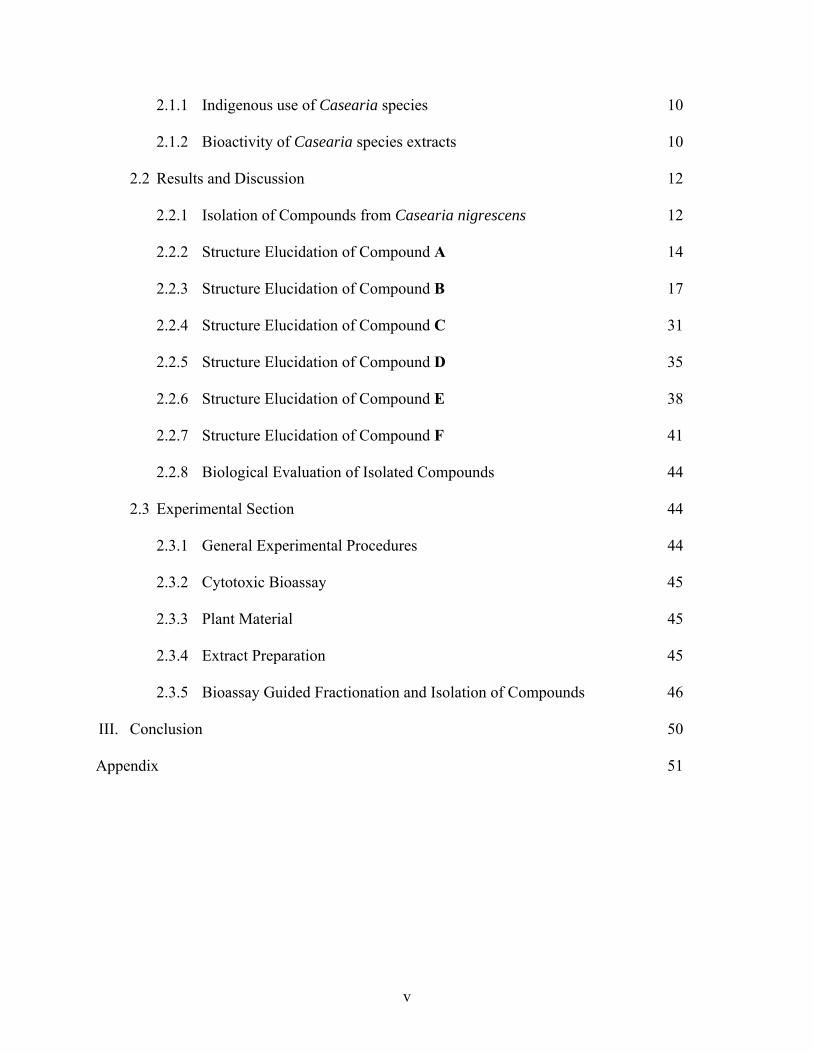
2.1.1 Indigenous use of Casearia species 10
2.1.2 Bioactivity of Casearia species extracts 10
2.2 Results and Discussion 12
2.2.1 Isolation of Compounds from Casearia nigrescens 12
2.2.2 Structure Elucidation of Compound A 14
2.2.3 Structure Elucidation of Compound B 17
2.2.4 Structure Elucidation of Compound C 31
2.2.5 Structure Elucidation of Compound D 35
2.2.6 Structure Elucidation of Compound E 38
2.2.7 Structure Elucidation of Compound F 41
2.2.8 Biological Evaluation of Isolated Compounds 44
2.3 Experimental Section 44
2.3.1 General Experimental Procedures 44
2.3.2 Cytotoxic Bioassay 45
2.3.3 Plant Material 45
2.3.4 Extract Preparation 45
2.3.5 Bioassay Guided Fractionation and Isolation of Compounds 46
III. Conclusion 50
Appendix 51

vi
List of Structures
1.1 Morphine 2
1.2 Quinine 3
1.3 Chloroquine 3
1.4 Mefloquine 3
1.5 Penicillin G 3
1.6 Vinblastine 4
1.7 Vincristine 4
1.8 Paxlitaxol 5
2.1 Clerodane diterpene skeleton 11
2.2 Casearlucin A 16
2.3 Caseamenbrol A 29
2.4 rel-18(S),19(R)-diacetoxy-18,19-epoxy-6(R)-hydroxy-2(S)- (2ξ-methylbutanoyloxy)-5(R),8(S),9(S),10(R)-cleroda-3,13(16),14-triene 32 2.5 Casearlucin L 36
2.6 Casearlucin B 39
2.7 rel-18(S),19(R)-diacetoxy-18,19-epoxy-2(S)-(2ξ-methylbutanoyloxy)- 5(R),8(S),9(S),10(R)-cleroda-3,13(16),14-triene 42
vii
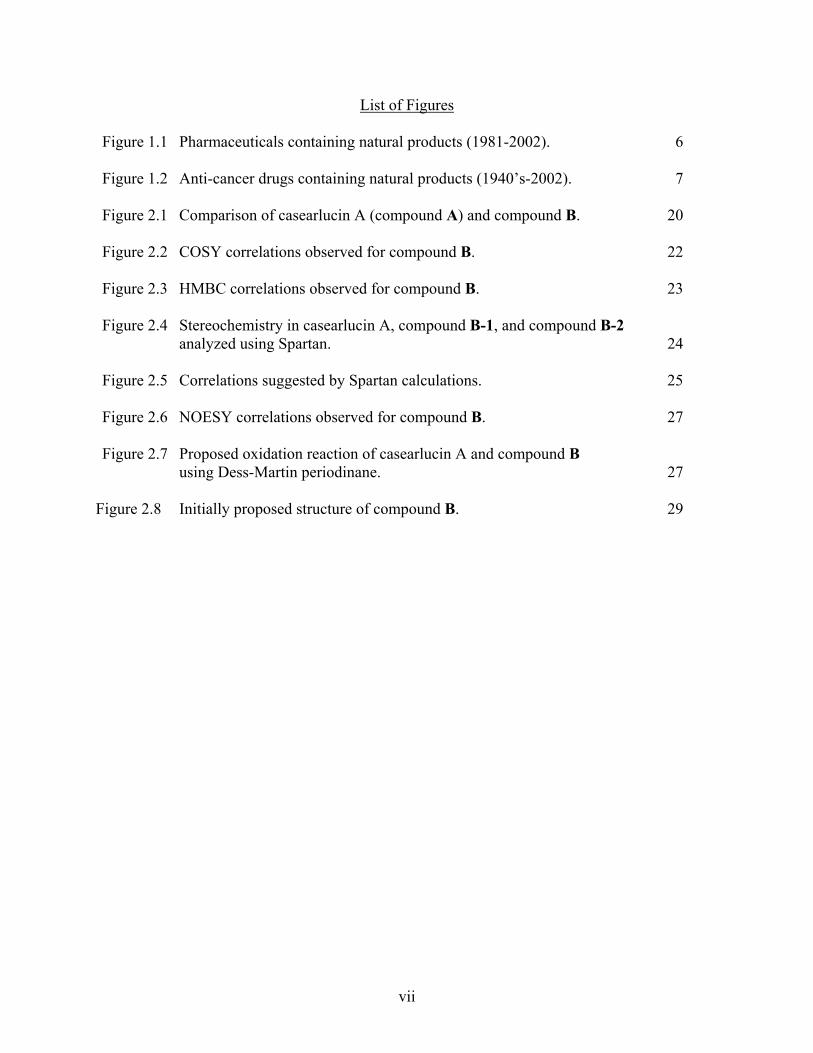
List of Figures
Figure 1.1 Pharmaceuticals containing natural products (1981-2002). 6
Figure 1.2 Anti-cancer drugs containing natural products (1940’s-2002). 7
Figure 2.1 Comparison of casearlucin A (compound A) and compound B. 20
Figure 2.2 COSY correlations observed for compound B. 22
Figure 2.3 HMBC correlations observed for compound B. 23
Figure 2.4 Stereochemistry in casearlucin A, compound B-1, and compound B-2 analyzed using Spartan. 24
Figure 2.5 Correlations suggested by Spartan calculations. 25
Figure 2.6 NOESY correlations observed for compound B. 27
Figure 2.7 Proposed oxidation reaction of casearlucin A and compound B using Dess-Martin periodinane. 27
Figure 2.8 Initially proposed structure of compound B. 29

viii
List of Schemes
Scheme 2.1 Fractionation tree for Casearia nigrescens. 13

ix
List of Tables
Table 2.1 1H NMR and 13C NMR data for casearlucin A and compound A. 17
Table 2.2 1H NMR and 13C NMR data for casearlucin A (compound A) and compound B. 21
Table 2.3 1H NMR and 13C NMR data for caseamenbrol A and compound B. 30
Table 2.4 1H NMR data for casearlucin A, compound C, and rel-18(S),19(R)- diacetoxy-18,19-epoxy-6(R)-hydroxy-2(S)-(2ξ-methylbutanoyloxy)- 5(R),8(S),9(S),10(R)-cleroda-3,13(16),14-triene. 33
Table 2.5 13C NMR data for casearlucin A, compound C, and rel-18(S),19(R)- diacetoxy-18,19-epoxy-6(R)-hydroxy-2(S)-(2ξ-methylbutanoyloxy)- 5(R),8(S),9(S),10(R)-cleroda-3,13(16),14-triene. 34
Table 2.6 1H NMR data for rel-18(S),19(R)-diacetoxy-18,19-epoxy-6(R)- hydroxy-2(S)-(2ξ-methylbutanoyloxy)-5(R),8(S),9(S),10(R)-cleroda- 3,13(16),14-triene (compound C), compound D, and caseamenbrol A (compound B). 37
Table 2.7 1H NMR and 13C NMR data for casearlucin B and compound E. 40
Table 2.8 1H NMR and 13C NMR data for rel-18(S),19(R)-diacetoxy-18,19- epoxy-2(S)-(2ξ-methylbutanoyloxy)-5(R),8(S),9(S),10(R)-cleroda- 3,13(16),14-triene and compound F. 43
Table 2.9 IC50 values for compounds A-F tested in the A2780 assay. 44

1
I. Natural Product Chemistry
1.1 General Introduction
Natural product chemistry stems from the use of nature for medicinal purposes. The
World Health Organization (WHO) estimates that approximately 80% of the world relies on
natural sources for primary medical treatment and that the health care systems for the remaining
20% of the population also incorporate natural sources in their medical treatment.1 Natural
product chemistry can be defined as the exploration of nature in search of novel drugs or drug
leads.
Some possible sources of natural products include plants, marine organisms, microbes
and fungi. Of the approximately 250,000 higher species of plants it is estimated that only 5-15%
have been investigated for natural products.2 Marine organisms are abundant in the oceans,
which cover more than 70% of the Earth’s surface.2 Also, research suggests that less than 1% of
bacterial species and less than 5% of fungal species are currently known.3 Therefore, it is
important that natural product chemistry continues to explore natural resources in search of new
natural products.
1.2 Historically Important Natural Products
Some well known and important drugs have originated from natural sources. A few
examples are given to indicate what an important impact these drugs have had on medical
1 Cragg, G. M. Natural Product Drug Discovery and Development: The United States National Cancer Institute
Role. Puerto Rico Health Sciences Journal 2002, 21, 97-111. 2 Cragg, G. M.; Newman, D. J. Natural Product Drug Discovery in the Next Millennium. Pharmaceutical Biology
2001, 39, S8-17. 3 Cragg, G. M.; Newman, D. J. Nature’s Bounty. Chem. Br. 2001, 37, 22-26.

2
treatment and disease control. It can be noted that these drugs were isolated from natural sources
many of which have been used by various cultures throughout history.
1.2.1 Morphine
Morphine (1.1) was first isolated from the opium poppy (Papaver somniferum) in 1861.2
In ancient Mesopotamia the oils of P. somniferum were used as an analgesic.2 The discovery and
isolation of morphine led to an increased interest in alkaloid chemistry and resulted in the
development of other analgesic agents.2 Morphine was the first commercially available pure
natural product, marketed in 1826.4
O
OH
NMeH
OHH
1.1 Morphine
1.2.2 Quinine
Malaria has been and continues to be a problem in many areas around the world. The
native Amerindians of the Amazon region used the bark of the Cinchona tree to treat malaria.5
Quinine (1.2), the active component of Cinchona bark, was isolated in 1820 from C. officinalis.1
Quinine was the first effective anti-malarial drug to be isolated.6 Other anti-malarial drugs such
as chloroquine (1.3) and mefloquine (1.4) were synthesized based on the structure of quinine.2
4 Newman, D. J.; Cragg, G. M.; Snader, K. M. The Influence of Natural Products upon Drug Discovery. Nat. Prod.
Rep. 2000, 17, 215-234. 5 Clark, A. M. Natural Products as a Resource for New Drugs. Pharm. Res. 1996, 13, 1133-1141. 6 Phillipson, J. D. Phytochemistry and Medicinal Plants. Phytochemistry 2001, 56, 237-243.

3
N
NMeO
OHH
H
H
NCl
NHNEt2
N
OHNH
CF3
CF3
1.2 Quinine 1.3 Chloroquine 1.4 Mefloquine
1.2.3 Penicillin
Penicillin (1.5) was first discovered in 1929 by Fleming from the fungus, Penicillium
notatum.2 This discovery was important to the development of antibiotics and changed medicine
forever.5 The discovery of this revolutionary drug from a natural source prompted the
investigation of nature for other novel compounds.1
S
NNH
O
O
Me
Me
H
CO2H
1.5 Penicillin G
1.2.4 Vinblastine and Vincristine
The plant Catharanthus roseus, commonly known as the Madagascar periwinkle, was
used in some cultures as a folk remedy to treat diabetes.2 However, when C. roseus was
evaluated for hypoglycemic compounds, no such compounds were found.5 Instead, the results
led to the hypothesis that the plant extract contained a compound potentially useful for the
treatment of cancer.5 Upon further investigation of C. roseus for anti-cancer agents, vinblastine

4
(1.6) and vincristine (1.7) were isolated in 1954.7 These drugs were developed by Eli Lily and
are important agents in the treatment of cancer.
N
N
HOH
H
NH
N
MeOCO2Me
OAc
R
MeO2C
OH
1.6 Vinblastine R = Me1.7 Vincristine R = CHO
1.2.5 Paclitaxel
A random collection of plants by the United States Department of Agriculture (USDA)
for the National Cancer Institute (NCI) yielded an extract with anti-cancer activity.2 The extract
was from the Pacific yew tree (Taxus brevifolia) and the active compound, paclitaxel (1.8), was
isolated in 1969.1 Several Native American tribes use various parts of Taxus trees for the
treatment of a wide range of non-cancerous ailments.2 Paclitaxel is an important anti-cancer
drug in use today.
7 Noble, R. The Discovery of the vinca alkaloids—Chemotherapeutic Agents against Cancer. Biochem. Cell Biol.
1990, 68, 1344-1351.

5
AcO
Me OH
O
MeMeMe
OH HAcO
O
ONH
OH
OO
Ph
Ph
BzO
1.8 Paclitaxel
1.3 Natural Products in Pharmaceuticals
As the previous examples show, natural products are important pharmaceuticals. In a
study of the pharmaceuticals on the market from 1981-2002, only 43% of the drugs were purely
synthetic, while the remaining 57% were derived from a natural source (Figure 1.1).8 The data
shown in Figure 1.1 categorizes natural sources in the following way: biological – a peptide or
protein isolated from an organism or cell line; natural product; natural product derivative –
derived from a natural product usually with some semi-synthetic modifications; synthetic drug;
synthetic drug with a natural product pharmacophore; vaccine.8
8 Newman, D. J.; Cragg, G. M.; Snader, K. M. Natural Products as Sources of New Drugs over the Period 1981-
2002. J. Nat. Prod. 2003, 66, 1022-1037.

6
12%
5%
23%
43%
14%3%
Biological
Natural Product
Natural ProductDerivative
Synthetic Drug
Synthetic Drug w/Natural ProductPharmacophoreVaccine
Figure 1.1 Pharmaceuticals containing natural products (1981-2002). Adapted from Newman, Cragg, and Snader (2003).8
1.3.1 Cancer and the Role of Natural Products
The research presented in this paper focuses on natural products that are cytotoxic against
cancer. Cancer is a devastating disease that affects millions of people each year. The American
Cancer Society estimates that over 560,000 Americans will die of non-invasive cancers this year,
making cancer the second leading cause of death in the United States.9 Natural products are
important in the treatment of cancer. In a study of anti-cancer drugs on the market from the
1940’s-2002, only 36% of the drugs were purely synthetic while the remaining 64% were of
natural origins (Figure 1.2).8
9 American Cancer Society—Cancer Facts & Figures 2004. http://www.cancer.org (accessed April 2004).

7
9%
14%
26%36%
14%1%
Biological
Natural Product
Natural ProductDerivative
Synthetic Drug
Synthetic Drug w/Natural ProductPharmacophoreVaccine
Figure 1.2 Anti-cancer drugs containing natural products (1940’s-2002). Adapted from Newman, Cragg, and Snader (2003).8
1.4 International Cooperative Biodiversity Group (ICBG)
This research is in conjunction with the International Cooperative Biodiversity Group
(ICBG). The ICBG program focuses on four main areas: drug discovery, economic
development, conservation, and biodiversity.10 The drug discovery portion of the program is
carried out at Virginia Tech. Plant extracts from Madagascar are screened for bioactivity against
cancer. Active components of the extract are isolated and identified; highly active compounds
may then be developed for commercial use.10 The ICBG program provides learning
opportunities in the area of science, biodiversity, and conservation to the people of
Madagascar.10 Compensation is also provided to the county for the use of natural resources.
With adequate compensation to Madagascar for the plant extracts that are collected and for any
new compounds that are developed into commercial drugs, the ICBG program hopes to motivate
10 International Cooperative Biodiversity Groups. http://www.fic.nih.gov/programs/icbg.html (accessed April 2004).
8
the country to conserve their natural resources.10 As a final goal of the ICBG program, while
extracts are collected, the biodiversity of the region is assessed.10
1.5 Bioassays
Bioassays are used to screen natural product extracts. Once an extract is identified as
active, purification of the extract begins. The fractions that are obtained from purification are
again evaluated for bioactivity. Purification followed by bioassay testing continues until pure
compounds are isolated. This process is known as bioassay-guided fractionation.
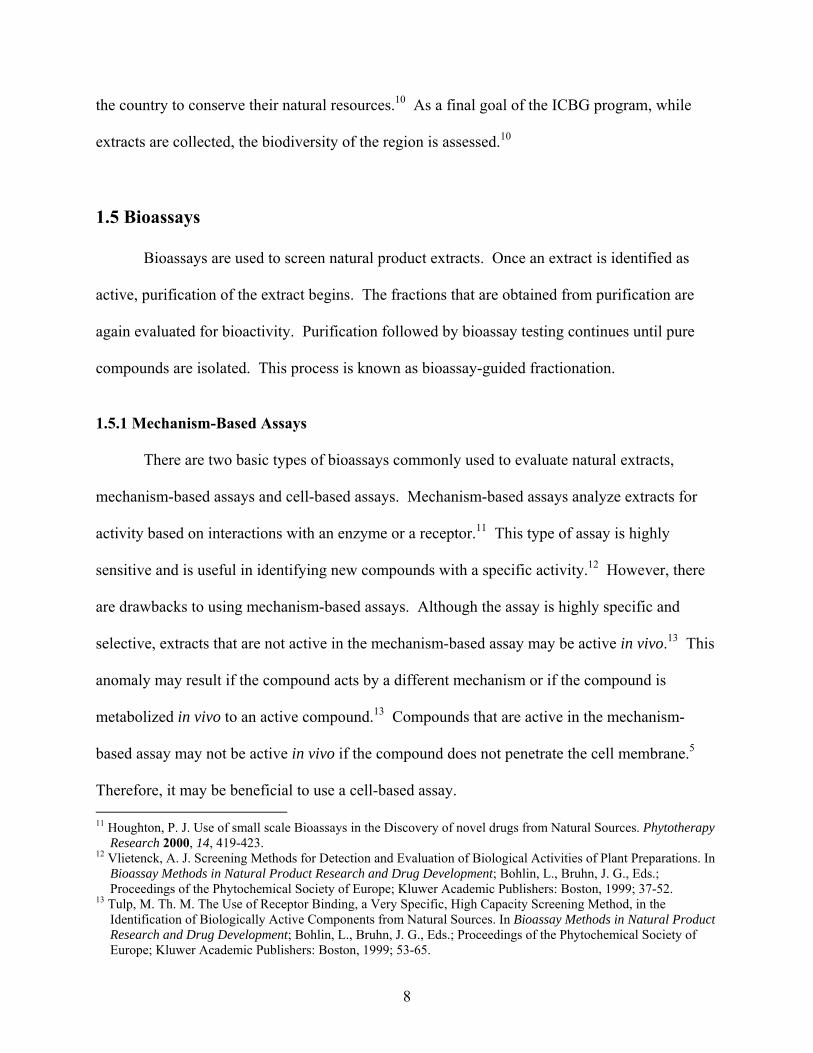
1.5.1 Mechanism-Based Assays
There are two basic types of bioassays commonly used to evaluate natural extracts,
mechanism-based assays and cell-based assays. Mechanism-based assays analyze extracts for
activity based on interactions with an enzyme or a receptor.11 This type of assay is highly
sensitive and is useful in identifying new compounds with a specific activity.12 However, there
are drawbacks to using mechanism-based assays. Although the assay is highly specific and
selective, extracts that are not active in the mechanism-based assay may be active in vivo.13 This
anomaly may result if the compound acts by a different mechanism or if the compound is
metabolized in vivo to an active compound.13 Compounds that are active in the mechanism-
based assay may not be active in vivo if the compound does not penetrate the cell membrane.5
Therefore, it may be beneficial to use a cell-based assay. 11 Houghton, P. J. Use of small scale Bioassays in the Discovery of novel drugs from Natural Sources. Phytotherapy
Research 2000, 14, 419-423. 12 Vlietenck, A. J. Screening Methods for Detection and Evaluation of Biological Activities of Plant Preparations. In
Bioassay Methods in Natural Product Research and Drug Development; Bohlin, L., Bruhn, J. G., Eds.; Proceedings of the Phytochemical Society of Europe; Kluwer Academic Publishers: Boston, 1999; 37-52.
13 Tulp, M. Th. M. The Use of Receptor Binding, a Very Specific, High Capacity Screening Method, in the Identification of Biologically Active Components from Natural Sources. In Bioassay Methods in Natural Product Research and Drug Development; Bohlin, L., Bruhn, J. G., Eds.; Proceedings of the Phytochemical Society of Europe; Kluwer Academic Publishers: Boston, 1999; 53-65.

9
1.5.2 Cell-Based Assays
Cell-based assays use intact cells from human or animal origins.11 Extracts are evaluated
for their cytotoxicity against the cells. Cell-based assays eliminate extracts containing
compounds that are unable to enter the cell or are rapidly metabolized by the cell; characteristics
which are unwanted in a drug.12 However, the mechanism by which the compound inhibits the
cell is unknown from the results of the cell-based assay. By using the two types of assays in
combination, information about the mechanism by which the cytotoxic compound acts can be
determined.
1.5.3 A2780 Assay
A cell-based assay is used to screen the extracts from Madagascar and bioassay-guided
fractionation is used to isolate cytotoxic anti-cancer agents. Human ovarian cancer cells (A2780)
are used in a microtiter plate assay. The plates are seeded with cells and the compounds
(dissolved in 1:1 DMSO:H2O) are added to the cells at specific concentrations. The plates are
incubated at 37°C and 5% CO2 for 48 hours. Then Alamar Blue (Biosource International) is
added to the cells and the plates are incubated for three hours. During this time the Alamar Blue
is taken up by the live cells and reduced. The reduced form of Alamar Blue is stable and
fluorescent. The fluorescence of each well in the plate is measured. The fluorescence is directly
proportional to the percent inhibition of the growth of the cells. The IC50 value is determined by
plotting the data on a dose response curve of percent inhibition versus concentration. The IC50
value is defined as the concentration of sample necessary to produce 50% inhibition of the
growth of the cells. The smaller the IC50 value the more active the compound.
10
II. Cytotoxic Clerodane Diterpenes from Casearia nigrescens
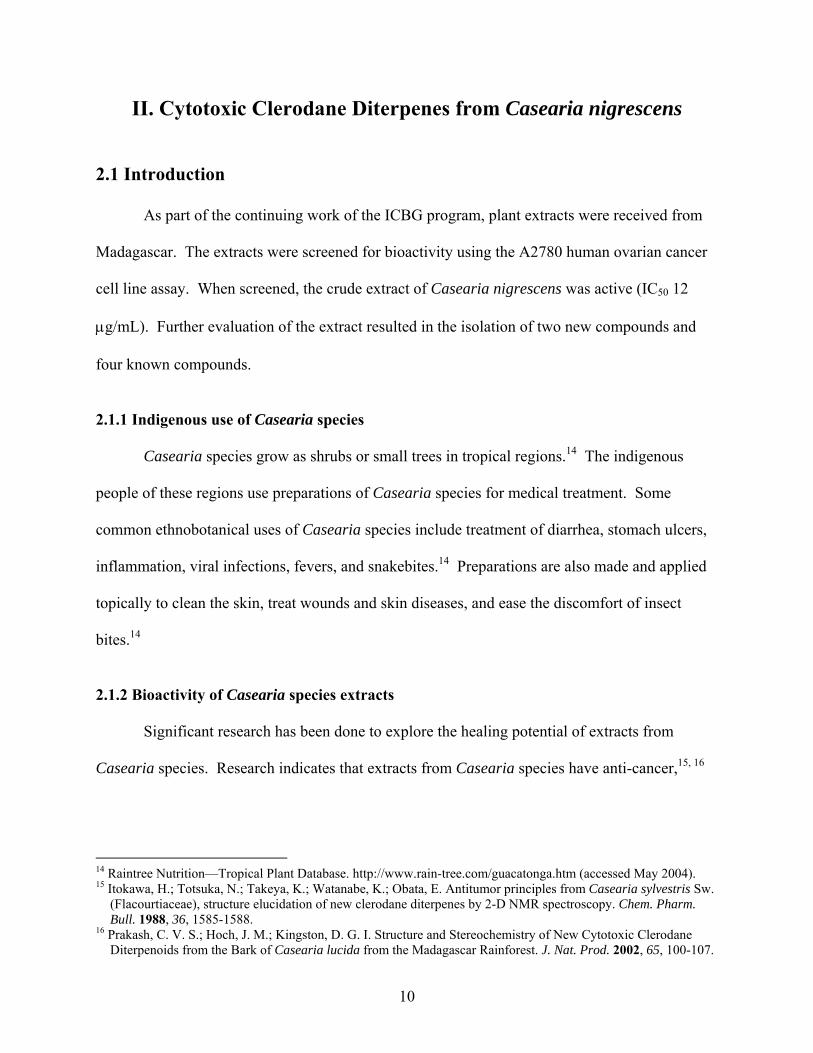
2.1 Introduction
As part of the continuing work of the ICBG program, plant extracts were received from
Madagascar. The extracts were screened for bioactivity using the A2780 human ovarian cancer
cell line assay. When screened, the crude extract of Casearia nigrescens was active (IC50 12
µg/mL). Further evaluation of the extract resulted in the isolation of two new compounds and
four known compounds.
2.1.1 Indigenous use of Casearia species
Casearia species grow as shrubs or small trees in tropical regions.14 The indigenous
people of these regions use preparations of Casearia species for medical treatment. Some
common ethnobotanical uses of Casearia species include treatment of diarrhea, stomach ulcers,
inflammation, viral infections, fevers, and snakebites.14 Preparations are also made and applied
topically to clean the skin, treat wounds and skin diseases, and ease the discomfort of insect
bites.14
2.1.2 Bioactivity of Casearia species extracts
Significant research has been done to explore the healing potential of extracts from
Casearia species. Research indicates that extracts from Casearia species have anti-cancer,15, 16
14 Raintree Nutrition—Tropical Plant Database. http://www.rain-tree.com/guacatonga.htm (accessed May 2004). 15 Itokawa, H.; Totsuka, N.; Takeya, K.; Watanabe, K.; Obata, E. Antitumor principles from Casearia sylvestris Sw.
(Flacourtiaceae), structure elucidation of new clerodane diterpenes by 2-D NMR spectroscopy. Chem. Pharm. Bull. 1988, 36, 1585-1588.
16 Prakash, C. V. S.; Hoch, J. M.; Kingston, D. G. I. Structure and Stereochemistry of New Cytotoxic Clerodane Diterpenoids from the Bark of Casearia lucida from the Madagascar Rainforest. J. Nat. Prod. 2002, 65, 100-107.

11
anti-fungal,17 anti-ulcer,18 anti-hyperglycemic,19 analgesic,20 and anti-inflammatory activities,20
as well as the ability to neutralize several types of snake venom.21 The majority of compounds
isolated from Casearia species are clerodane diterpenes15, 16, 22, 23 (2.1).
2.1 Clerodane diterpene skeleton
Continued research of Casearia species may result in the isolation of novel compounds with
important medicinal properties.
17 Oberlies, N. H.; Burgess, J. P.; Navarro, H. A.; Pinos, R. E.; Fairchild, C. R.; Peterson, R. W.; Soejarto, D. D.;
Farnsworth, N. R.; Kinghorn, A. D.; Wani, M. C.; Wall, M. E. Novel Bioactive Clerodane Diterpenoids from the leaves and twig of Casearia sylvestris. J. Nat. Prod. 2002, 65, 95-99.
18 Basile, A. C.; Sertie, J. A.; Panizza, S.; Oshiro, T. T.; Azzolini, C. A. Pharmacological assay of Casearia sylvestris. I: Preventive anti-ulcer activity and toxicity of the leaf crude extract. J. Ethnopharmacol. 1990, 30, 185-197.
19 Prakasam, A.; Sethupathy, S.; Pugalendi, K. V. Antihyperglycemic Effect of Casearia esculenta root Extracts in streptozotocin-induced Diabetic Rats. Pharmazie. 2002, 57, 758-760.
20 Ruppelt, B. M.; Pereira, E. F.; Goncalves, L. C.; Pereira, N. A. Pharmacological Screening of Plants Recommended by Folk Medicine as Anti-snake Venom--I. Analgesic and Anti-inflammatory Activities. Mem. Inst. Oswaldo Cruz 1991, 86, 203-205.
21 Borges, M. H.; Soares, A. M.; Rodrigues, V. M.; Oliveira, F.; Fransheschi, A. M. Rucavado, A.; Giglio, J. R.; Homsi-Brandeburgo, M. I. Neutralization of Proteases from Bothrops Snake Venoms by the aqueous extract from Casearia sylvestris (Flacourtiaceae). Toxicon 2001, 39, 1863-1869.
22 Hayashi, K.; Nakanishi, Y.; Bastow, K. F.; Cragg, G.; Nozaki, H.; Lee, K.-H. Antitumor Agents. Part 212: Bucidarasins A-C, Three New Cytotoxic Clerodane Diterpenes from Bucida buceras. Bioorg. Med. Chem. Lett. 2002, 12, 345-348.
23 Gibbons, S.; Gray, A. I.; Waterman, P. G. Clerodane diterpenes from the bark of Casearia tremula. Phytochemistry 1996, 41, 565-570.
12
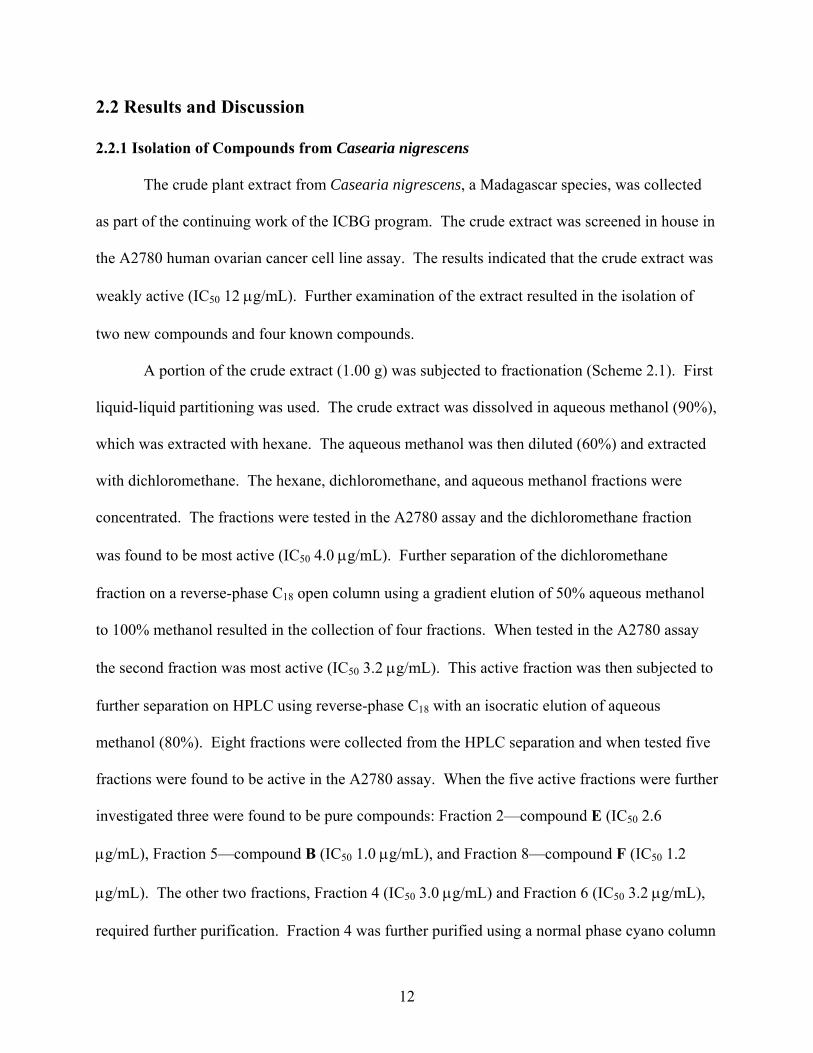
2.2 Results and Discussion
2.2.1 Isolation of Compounds from Casearia nigrescens
The crude plant extract from Casearia nigrescens, a Madagascar species, was collected
as part of the continuing work of the ICBG program. The crude extract was screened in house in
the A2780 human ovarian cancer cell line assay. The results indicated that the crude extract was
weakly active (IC50 12 µg/mL). Further examination of the extract resulted in the isolation of
two new compounds and four known compounds.
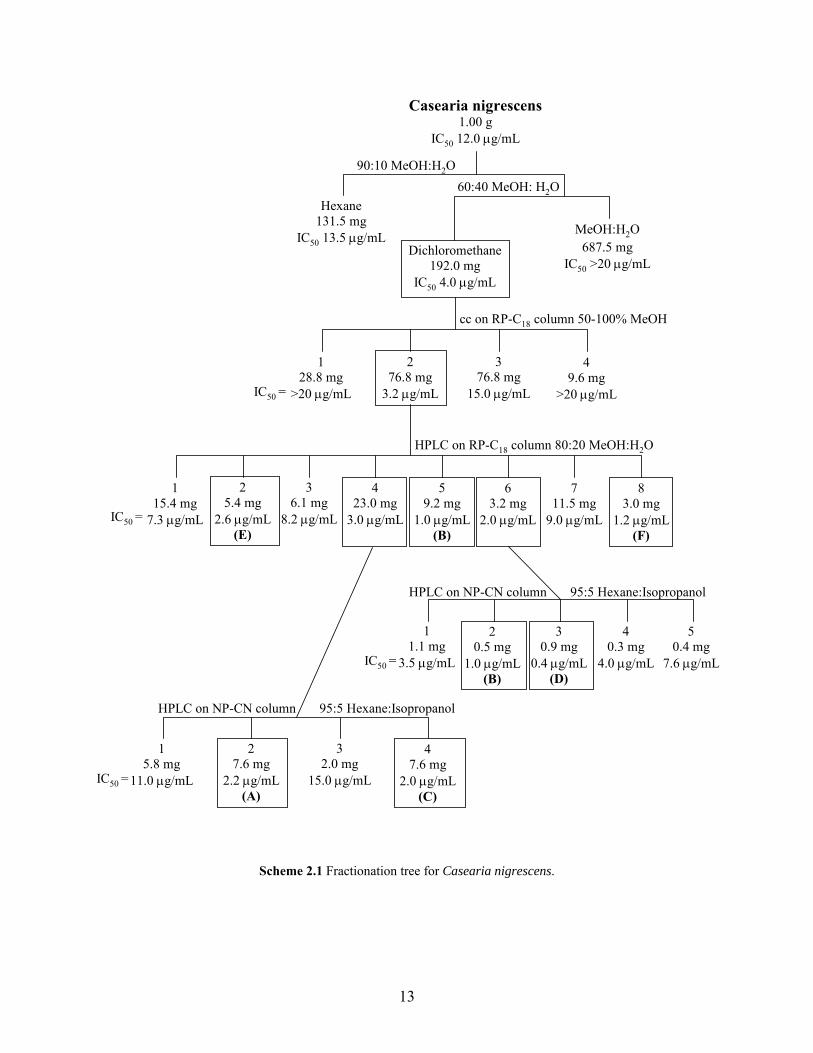
A portion of the crude extract (1.00 g) was subjected to fractionation (Scheme 2.1). First
liquid-liquid partitioning was used. The crude extract was dissolved in aqueous methanol (90%),
which was extracted with hexane. The aqueous methanol was then diluted (60%) and extracted
with dichloromethane. The hexane, dichloromethane, and aqueous methanol fractions were
concentrated. The fractions were tested in the A2780 assay and the dichloromethane fraction
was found to be most active (IC50 4.0 µg/mL). Further separation of the dichloromethane
fraction on a reverse-phase C18 open column using a gradient elution of 50% aqueous methanol
to 100% methanol resulted in the collection of four fractions. When tested in the A2780 assay
the second fraction was most active (IC50 3.2 µg/mL). This active fraction was then subjected to
further separation on HPLC using reverse-phase C18 with an isocratic elution of aqueous
methanol (80%). Eight fractions were collected from the HPLC separation and when tested five
fractions were found to be active in the A2780 assay. When the five active fractions were further
investigated three were found to be pure compounds: Fraction 2—compound E (IC50 2.6
µg/mL), Fraction 5—compound B (IC50 1.0 µg/mL), and Fraction 8—compound F (IC50 1.2
µg/mL). The other two fractions, Fraction 4 (IC50 3.0 µg/mL) and Fraction 6 (IC50 3.2 µg/mL),
required further purification. Fraction 4 was further purified using a normal phase cyano column
13
Casearia nigrescens1.00 g
IC50 12.0 µg/mL
90:10 MeOH:H2O60:40 MeOH: H2O
MeOH:H2O 687.5 mg
IC50 >20 µg/mLDichloromethane
192.0 mgIC50 4.0 µg/mL
Hexane131.5 mg
IC50 13.5 µg/mL
1 28.8 mg
>20 µg/mL
2 76.8 mg
3.2 µg/mL
3 76.8 mg
15.0 µg/mL
4 9.6 mg
>20 µg/mL
1 15.4 mg
7.3 µg/mL
2 5.4 mg
2.6 µg/mL(E)
3 6.1 mg
8.2 µg/mL
4 23.0 mg
3.0 µg/mL
5 9.2 mg
1.0 µg/mL(B)
6 3.2 mg
2.0 µg/mL
7 11.5 mg
9.0 µg/mL
8 3.0 mg
1.2 µg/mL(F)
5 0.4 mg
7.6 µg/mL
4 0.3 mg
4.0 µg/mL
3 0.9 mg
0.4 µg/mL(D)
2 0.5 mg
1.0 µg/mL(B)
1 1.1 mg
3.5 µg/mL
IC50 =
1 5.8 mg
11.0 µg/mL
2 7.6 mg
2.2 µg/mL(A)
3 2.0 mg
15.0 µg/mL
4 7.6 mg
2.0 µg/mL(C)
IC50 =
IC50 =
cc on RP-C18 column 50-100% MeOH
HPLC on RP-C18 column 80:20 MeOH:H2O
HPLC on NP-CN column 95:5 Hexane:Isopropanol
HPLC on NP-CN column 95:5 Hexane:Isopropanol
IC50 =
Scheme 2.1 Fractionation tree for Casearia nigrescens.

14
on HPLC with an isocratic elution of hexane:isopropanol (95:5). This resulted in the collection
of four fractions. When tested two fractions were active in the A2780 assay and upon further
investigation these two fractions were found to be pure compounds: compound A (IC50 2.2
µg/mL) and compound C (IC50 2.0 µg/mL). Fraction 6 was also further purified using a normal
phase cyano column on HPLC with an isocratic elution of hexane:isopropanol (95:5). This
resulted in the collection of five fractions, two of which were pure. One of the pure fractions
resulted in the additional isolation of compound B (IC50 1.0 µg/mL) and the other pure fraction
resulted in the isolation of compound D (IC50 0.4 µg/mL).
2.2.2 Structure Elucidation of Compound A
Compound A was isolated as a viscous oil. The HRFAB mass spectrum gave a
molecular ion formed as a sodium ion adduct of m/z 541.27765, which corresponded to the
molecular formula C29H42O8 + Na. This molecular formula indicated nine units of unsaturation
in the molecule.
The 1H NMR spectrum of compound A in CDCl3 showed the presence of signals for two
methyl groups (δ 0.81 s; δ 0.93 d, J = 6.7 Hz); two oxymethine protons (δ 3.80 m; δ 5.44 m);
two acetal-acyloxy methine protons (δ 6.51 s; δ 6.73 t; J = 1.6 Hz); and a trisubstituted olefinic
proton (δ 6.01 dd, J = 4.4 Hz, 1.8 Hz) all indicative of the basic skeleton of a clerodane
diterpene. The 1H NMR spectrum also contained signals for two methyl groups (δ 1.93 s; δ 2.08
s) corresponding to the methyls of two acetate units. The signals for two additional methyl
groups (δ 0.97 t, J = 7.5 Hz; δ 1.18 d, J = 7.1 Hz) and one of the previously mentioned
oxymethine protons (δ 5.44 m) indicated the presence of a 2-methylbutanoyloxy side chain
located at C-2. Also observed in the 1H NMR spectrum was a signal for an allylic methyl (δ 1.66
15
s); a saturated methylene (δ 1.63 m; δ 2.23 dd, J = 8.0 Hz, 16.7 Hz); a terminal unsaturated
methylene (δ 4.93 d, J = 10.6 Hz; δ 5.10 d, J = 17.4 Hz); and two vinyl protons (δ 5.36 br d; δ
6.26 dd, J = 10.7 Hz, 17.1 Hz) all suggesting the presence of a six carbon diene side chain.
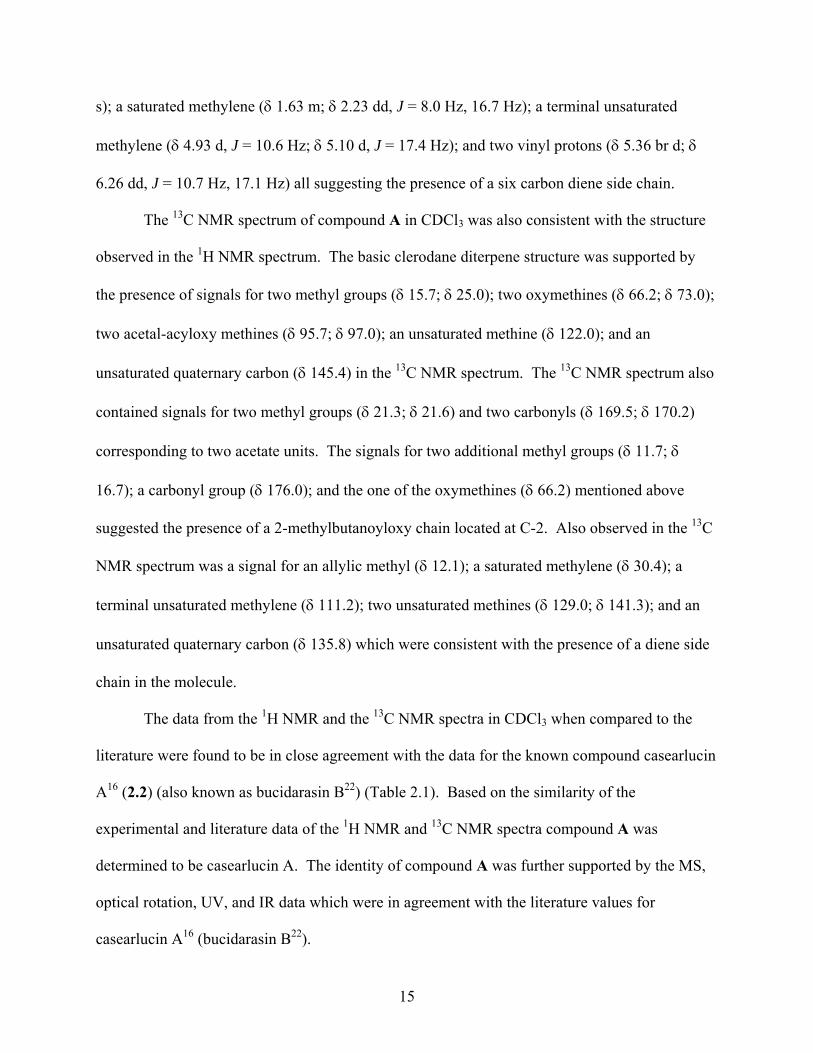
The 13C NMR spectrum of compound A in CDCl3 was also consistent with the structure
observed in the 1H NMR spectrum. The basic clerodane diterpene structure was supported by
the presence of signals for two methyl groups (δ 15.7; δ 25.0); two oxymethines (δ 66.2; δ 73.0);
two acetal-acyloxy methines (δ 95.7; δ 97.0); an unsaturated methine (δ 122.0); and an
unsaturated quaternary carbon (δ 145.4) in the 13C NMR spectrum. The 13C NMR spectrum also
contained signals for two methyl groups (δ 21.3; δ 21.6) and two carbonyls (δ 169.5; δ 170.2)
corresponding to two acetate units. The signals for two additional methyl groups (δ 11.7; δ
16.7); a carbonyl group (δ 176.0); and the one of the oxymethines (δ 66.2) mentioned above
suggested the presence of a 2-methylbutanoyloxy chain located at C-2. Also observed in the 13C
NMR spectrum was a signal for an allylic methyl (δ 12.1); a saturated methylene (δ 30.4); a
terminal unsaturated methylene (δ 111.2); two unsaturated methines (δ 129.0; δ 141.3); and an
unsaturated quaternary carbon (δ 135.8) which were consistent with the presence of a diene side
chain in the molecule.
The data from the 1H NMR and the 13C NMR spectra in CDCl3 when compared to the
literature were found to be in close agreement with the data for the known compound casearlucin
A16 (2.2) (also known as bucidarasin B22) (Table 2.1). Based on the similarity of the
experimental and literature data of the 1H NMR and 13C NMR spectra compound A was
determined to be casearlucin A. The identity of compound A was further supported by the MS,
optical rotation, UV, and IR data which were in agreement with the literature values for
casearlucin A16 (bucidarasin B22).

16
OOH
O
OH
O
O O
O
2.2 Casearlucin A
1
3
1819
6
1720
15
1613
115'
1'4'

17
Table 2.1 1H NMR and 13C NMR data for casearlucin A and compound A. Casearlucin A16, a Compound Aa
Position 13C NMR data 1H NMR data 13C NMR data 1H NMR data 1 26.8 1.88 m 26.8 1.89 m 2 66.2 5.43 br s 66.2 5.44 m 3 121.9 6.00 d (4.6) 122.0 6.01 dd (1.8, 4.4) 4 145.2 145.4 5 53.6 53.6 6 73.0 3.78 d (6.9) 73.0 3.80 m 7 37.5 1.67 m 37.5 1.62 m 1.74 m
8 36.9 1.80 m 36.9 1.76 m 9 37.7 37.7
10 36.9 2.37 br t (8.9) 36.8 2.37 br t (8.6) 11 30.4 1.58 m 30.4 1.63 m
2.23 dd (8.0, 16.7) 2.23 dd (8.0, 16.7) 12 129.0 5.37 br s 129.0 5.36 br d (6.2) 13 135.8 135.8 14 141.3 6.25 dd (10.5, 17.1) 141.3 6.26 dd (10.7, 17.0) 15 111.2 4.92 d (11.2) 111.2 4.93 d (10.6)
5.09 d (17.6) 5.10 d (17.4) 16 12.1 1.65 s 12.1 1.66 s 17 15.7 0.92 d (7.1) 15.7 0.93 d (6.7) 18 95.8 6.72 t (1.6) 95.7 6.73 t (1.6) 19 97.1 6.50 s 97.0 6.51 s 20 25.0 0.80 s 25.0 0.81 s 1' 175.9 176.0 2' 41.3 2.44 m 41.2 2.46 m 3' 27.2 1.69 m 27.2 1.69 m 4' 11.7 0.96 t (7.6) 11.7 0.97 t (7.3) 5' 16.7 1.17 d (6.9) 16.7 1.18 d (7.1)
Acetyl Me 21.3b 1.93 s 21.3b 1.93 s 21.5b 2.06 s 21.6b 2.08 s
CO 169.5c 169.5c 170.2c 170.2c aRecorded in CDCl3. b, c Values with the same superscript are interchangeable within their respective column.
2.2.3 Structure Elucidation of Compound B
Compound B was isolated as an amorphous solid. The HRFAB mass spectrum gave a
molecular ion formed as a sodium ion adduct of m/z 541.27783, which corresponded to the
18
molecular formula C29H42O8 + Na. This molecular formula indicated nine units of unsaturation
in the molecule.
The 1H NMR spectrum of compound B in CDCl3 showed the presence of signals for two
methyl groups (δ 0.84 s; δ 0.92 d, J = 6.6 Hz); two oxymethine protons (δ 4.00 m; δ 5.61 m);
two acetal-acyloxy methine protons (δ 6.46 s; δ 6.70 m); and a trisubstituted olefinic proton (δ
5.89 br s) all indicative of the basic skeleton of a clerodane diterpene. The 1H NMR spectrum
also contained the signals for two methyl groups (δ 1.94 s; δ 2.09 s) corresponding to the
methyls of two acetate units. The signals for two additional methyl groups (δ 0.92 t, J = 7.4 Hz;
δ 1.16 d, J = 6.9 Hz) and one of the previously mentioned oxymethine protons (δ 5.61 m)
indicated the presence of a 2-methylbutanoyloxy chain located at C-2. Also observed in the 1H
NMR spectrum was a signal for an allylic methyl (δ 1.65 s); a saturated methylene (δ 1.64 m; δ
2.20 dd, J = 8.4 Hz, 17.1 Hz); a terminal unsaturated methylene (δ 4.94 d, J = 10.6 Hz; δ 5.09 d,
J = 17.4 Hz); and two vinyl protons (δ 5.37 br d, J = 7.8 Hz; δ 6.30 dd, J = 10.9 Hz, 17.2 Hz) all
suggesting the presence of a six carbon diene side chain.
The 13C NMR spectrum of compound B in CDCl3 was also consistent with the structure
observed in the 1H NMR spectrum. The HSQC data for compound B was helpful in determining
the number and type of carbons present in the molecule as well as assigning which protons were
associated with which carbons. The basic clerodane diterpene structure was supported by the
presence of signals for two methyl groups (δ 15.7; δ 25.1); two oxymethines (δ 70.5; δ 74.2);
two acetal-acyloxy methines (δ 95.2; δ 96.7); an unsaturated methine (δ 124.4); and an
unsaturated quaternary carbon (δ 144.3) in the 13C NMR spectrum. The 13C NMR spectrum also
contained signals for two methyl groups (δ 21.3; δ 21.7) and two carbonyl groups (δ 169.6; δ
170.2) corresponding to two acetate units. The signals for two additional methyl groups (δ 11.8;

19
δ 16.6); a carbonyl group (δ 176.9); and one of the oxymethines (δ 70.5) mentioned above
suggested the presence of a 2-methylbutanoyloxy chain located at C-2. Also observed in the 13C
NMR spectrum was a signal for an allylic methyl (δ 12.0); a saturated methylene (δ 30.1); a
terminal unsaturated methylene (δ 111.2); two unsaturated methines (δ 128.8; δ 141.2); and an
unsaturated quaternary carbon (δ 135.9) which were constant with the presence of a diene side
chain in the molecule.
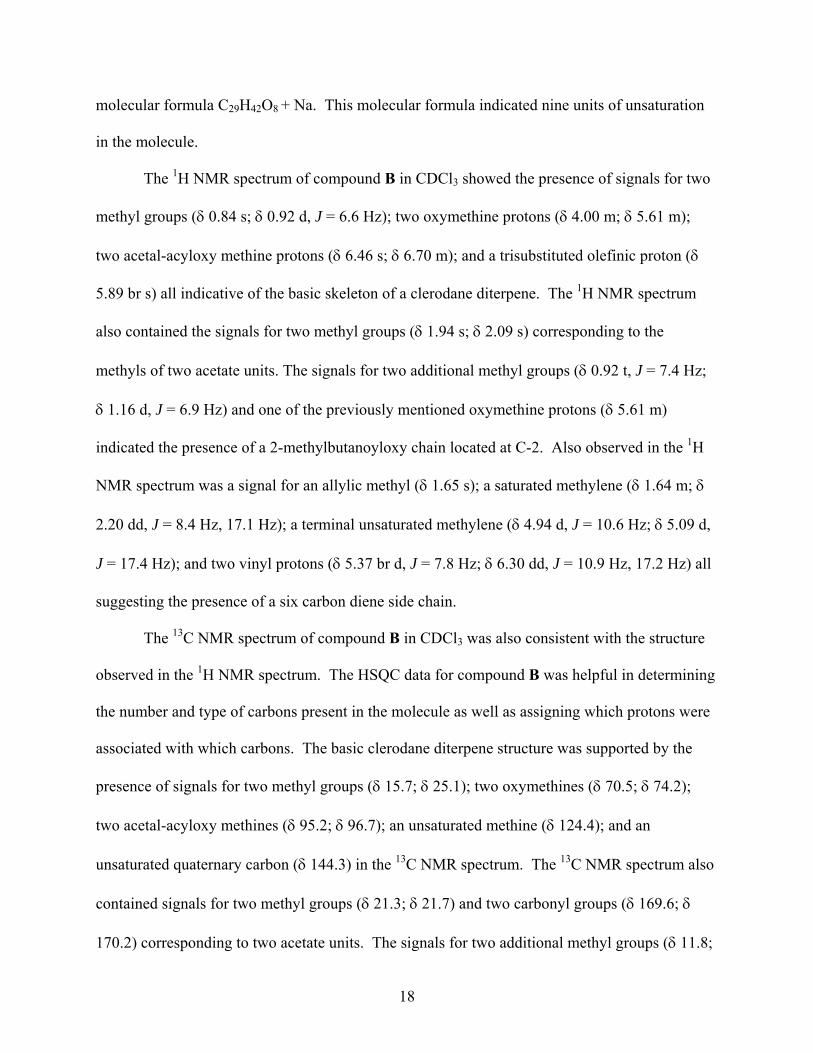
When the 1H NMR data and the 13C NMR data for compound B was compared to the
spectral data for casearlucin A (compound A), many similarities were observed (Figure 2.1).
However, there were two significant differences observed in both the proton and carbon spectra
for these two compounds (Table 2.2). In casearlucin A the 2-methylbutanoyloxy chain was β,
with the signal for the oxymethine proton of C-2 at δ 5.44 ppm and the carbon at δ 66.2 ppm.
The alcohol was also β in casearlucin A with the signal for the oxymethine proton of C-6 at δ
3.80 ppm and the carbon at δ 73.0 ppm. In compound B the signal for the oxymethine proton of
C-2 was at δ 5.61 ppm and the carbon was at δ 70.5 ppm, while the signal for the oxymethine
proton of C-6 was at δ 4.00 ppm and the carbon was at δ 74.2 ppm. These differences indicated
a possible difference in stereochemistry of these two compounds particularly at C-2 and C-6.
20
OOH
O
OH
O
O O
O
OOH
O
OH
O
O O
O
Casearlucin A(Compound A)
2
6
Compound B
2
6
Figure 2.1 Comparison of casearlucin A (compound A) and compound B.

21
Table 2.2 1H NMR and 13C NMR data for casearlucin A (compound A) and compound B.
Casearlucin A
(Compound A)a Compound Ba Position 13C NMR data 1H NMR data 13C NMR data 1H NMR data
1 26.8 1.89 m 26.2 2.14 m 2 66.2 5.44 m 70.5 5.61 m 3 122.0 6.01 dd (1.8, 4.4) 124.4 5.89 br s 4 145.4 144.3 5 53.6 53.5 6 73.0 3.80 m 74.2 4.00 m 7 37.5 1.62 m 37.8 1.64 m 1.74 m 1.76 m
8 36.9 1.76 m 36.9 1.84 m 9 37.7 38.5
10 36.8 2.37 br t (8.6) 41.5 2.37 m 11 30.4 1.63 m 30.1 1.64 m
2.23 dd (8.0, 16.7) 2.20 dd (8.4, 17.1) 12 129.0 5.36 br d (6.2) 128.8 5.37 br d (7.8) 13 135.8 135.9 14 141.3 6.26 dd (10.7, 17.0) 141.2 6.30 dd (10.9, 17.2) 15 111.2 4.93 d (10.6) 111.2 4.94 d (10.6)
5.10 d (17.4) 5.09 d (17.4) 16 12.1 1.66 s 12.0 1.65 s 17 15.7 0.93 d (6.7) 15.7 0.92 d (6.6) 18 95.7 6.73 t (1.6) 95.2 6.70 m 19 97.0 6.51 s 96.7 6.46 s 20 25.0 0.81 s 25.1 0.84 s 1' 176.0 176.9 2' 41.2 2.46 m 41.2 2.37 m 3' 27.2 1.69 m 26.9 1.68 m 1.49 m
4' 11.7 0.97 t (7.3) 11.8 0.92 t (7.4) 5' 16.7 1.18 d (7.1) 16.6 1.16 d (6.9)
Acetyl Me 21.3 1.93 s 21.3 1.94 s 21.6 2.08 s 21.7 2.09 s
CO 169.5 169.6 170.2 170.2
aRecorded in CDCl3.

22
To ensure that the basic structure of compound B was correct, the COSY and HMBC data
for compound B were obtained. The COSY data for compound B obtained in CDCl3 indicated
correlations between H-10/H-1; H-1/H-2; H-2/H-3; H-6/H-7; H-7/H-8; and H-8/H-17, which
supported the basic clerodane diterpene structure. Correlation H-8/H-17 showed that one of the
methyl groups was attached to C-8. Other correlations in the COSY spectra (H-2'/H-3', H-5'; H-
3'/H-4') supported the presence of the 2-methylbutanoyloxy chain. The presence of the diene
side chain was supported by the correlations between H-11/H-12 and H-14/H-15. All the
expected COSY correlations for compound B were observed (Figure 2.2).
OOH
O
OH
O
O O
O
1
3 6
178
15
14
12115'
2'4'
Figure 2.2 COSY correlations observed for compound B shown in bold. (Recorded in CDCl3.)
The results from the HMBC spectrum (Figure 2.3) for compound B further supported the
findings of the 1H NMR, 13C NMR, and COSY spectra. The HMBC data also helped identify the
position of attachment of the side chains. The basic clerodane diterpene structure was supported
by the following HMBC correlations: H-1/C-2; H-2/C-3; H-3/C-5; H-7/C-6, C-8; H-10/C-1, C-9.
The COSY data indicated that one methyl group was attached to the ring at C-8; the HMBC
correlation H-20/C-9 supported the attachment of a second methyl group to the ring at C-9. As
suggested by the proton and carbon spectra, two acetate units were identified. The presence of

23
the acetate unit was supported by two H-MeCO/C-COO HMBC correlations. The connectivity
of the acetate units to the ring was supported by the H-18/C-COO and H-19/C-COO correlations
in the HMBC spectra. The HMBC correlations H-2'/C-1', C-5'; H-3'/C-2', C-4'; H-4'/C-3';
H-5'/C-2' supported the presence of the 2-methylbutanoyloxy side chain and the HMBC
correlation H-2/C-1' supports the connectivity of the 2-methylbutanoyloxy side chain to C-2.
The presence of the diene side chain was supported by the correlations H-11/C-12; H-12/C-14;
H-14/C-13; H-15/C-14; H-16/C-12. The HMBC correlation H-11/C-9 supported the connection
of the diene side chain to the ring at C-9.
O
HO
O
O
OHOO
O
1
3
20
8
15
16
115'
4'
19
Figure 2.3 HMBC correlations observed for compound B. (Recorded in CDCl3.)
The MS, 1H NMR, 13C NMR, COSY, and HMBC data supported the proposed structure
for compound B; however, the stereochemistry of the compound was unclear. NOESY
correlations would give an indication of the stereochemistry in the molecule. To obtain a better
idea of the expected NOESY correlations Spartan calculations were done. In order to execute
the Spartan calculations stereochemistry must be assigned for each compound. Based on the
previously discussed spectral results in which casearlucin A and compound B differed in the
chemical shifts of the protons and carbons at position 2 and 6 two of the three possible structures

24
were proposed for compound B, compound B-1 and compound B-2. Compound B-1 was
assigned the β-C-2 and α-C-6 stereochemistry, while compound B-2 was assigned α-C-2 and β-
C-6 stereochemistry. The three compounds differed in stereochemistry at C-2 and C-6 (Figure
2.4).
OOH
O
OH
O
O O
O
OOH
O
OH
O
O O
O
OOH
O
OH
O
O O
O
Casearlucin A
2
6
Compound B-1
2
6
Compound B-2
2
6
Figure 2.4 Stereochemistry in casearlucin A, compound B-1, and compound B-2 analyzed using Spartan.
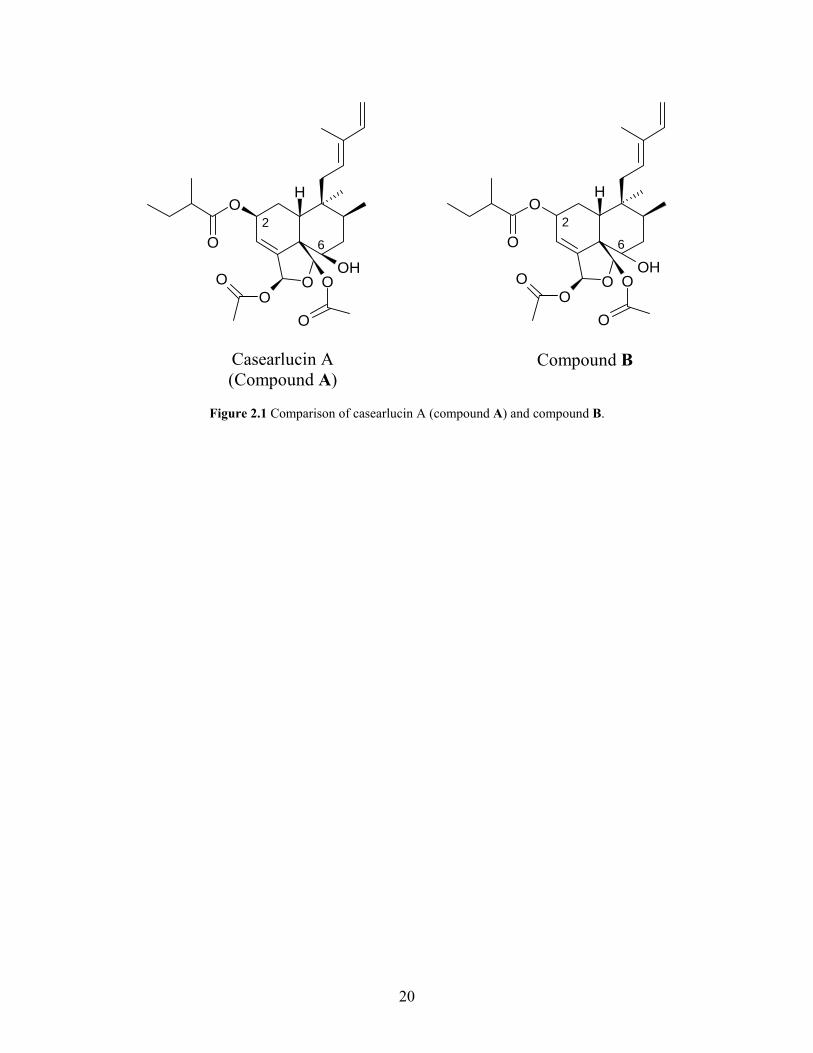
The equilibrium conformer at the ground state and the conformation distribution for each
compound was found using MMFF calculations in Spartan. The low energy conformers for each
compound were analyzed. NOESY data shows a correlation for pairs of protons that are close in
space. Therefore, the conformers that were found using Spartan were analyzed for pairs of
protons that were less than 3Å apart in space (Figure 2.5).
From the Spartan calculations for all three compounds there was an expected correlation
between H-10 and H-12, since the stereochemistry was expected to be the same for all three
compounds, specifically H-10 is β and the diene side chain at C-9 is also β. There was also an
expected correlation between H-11 and H-19 for all three compounds, since the stereochemistry
for the diene side chain at C-9 is β and H-19 is α for all three compounds. The Spartan
calculations suggested a NOESY correlation between H-6 and H-8 in casearlucin A and
25
compound B-2 since these protons were diaxial in these two compounds. However, in the
structure of compound B-1 the alcohol group was α. Therefore, H-6 and H-8 cannot be diaxial
and thus were too far apart to show a NOESY correlation as suggested by the Spartan
calculations. Spartan calculations suggested that only in compound B-2 was there a NOESY
correlation between H-2 and H-10 since the 2-methylbutanoyloxy side chain at C-2 was α,
making H-2 and H-10 diaxial. This correlation was only seen in compound B-2 because it was
the only one of the three compounds in which the 2-methylbutanoyloxy side chain at C-2 was α.
O
OAc
CH3CH2CH(CH3)COO
OH
H OAc
H
H
HH
HH
O
OAc
CH3CH2CH(CH3)COO
OH
H OAc
H
H HH
HH
O
OAc
OH
OOC(CH3)CHCH2CH3H
H
OAcH
HH
HH
H
Casearlucin A
Compound B-1
Compound B-2
10
12 19
86
11
10
12 19
86
11
2
10
1219
11
Figure 2.5 Correlations suggested by Spartan calculations.
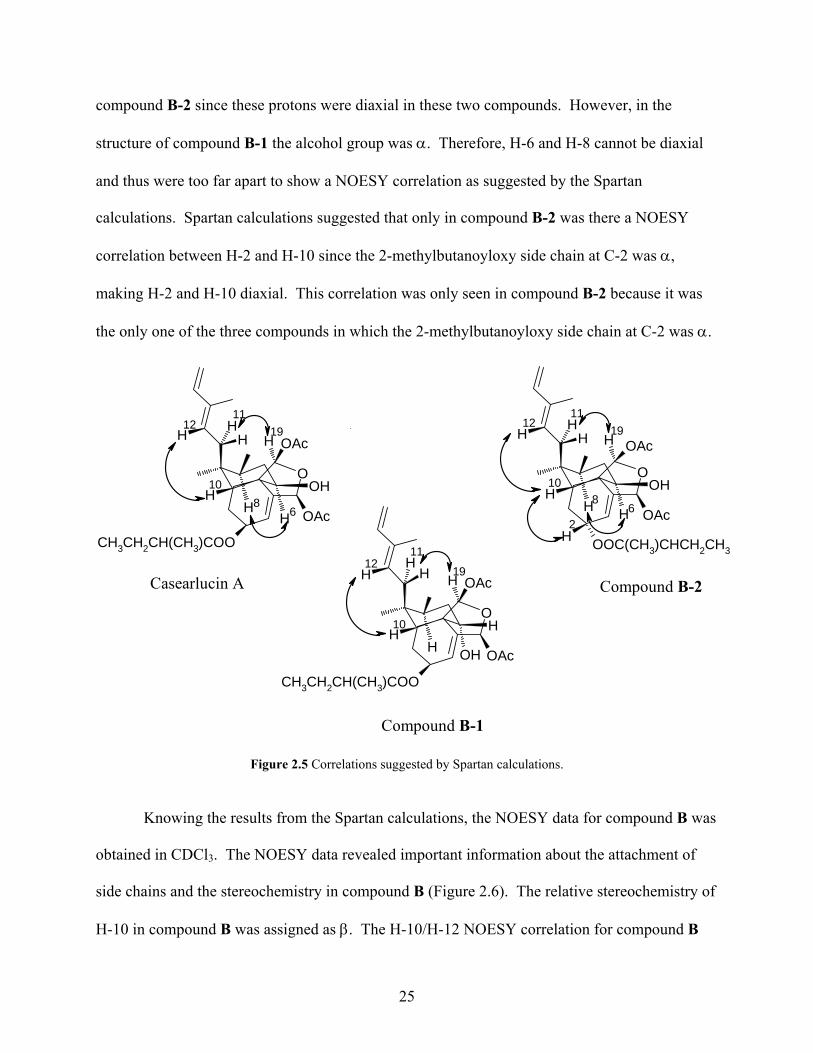
Knowing the results from the Spartan calculations, the NOESY data for compound B was
obtained in CDCl3. The NOESY data revealed important information about the attachment of
side chains and the stereochemistry in compound B (Figure 2.6). The relative stereochemistry of
H-10 in compound B was assigned as β. The H-10/H-12 NOESY correlation for compound B

26
suggested that the diene side chain attached to C-9 was also β in orientation. The NOESY
correlations H-11/H-16; H-12/H-14; H-14/H-15; H-15/H-15; H-15/H-16 supported the
connectivity of the diene side chain and the correlation H-12/H-14 indicated that the
conformation of the diene side chain was E. Other correlations (H-11/H-17; H-12/H-20) were
consistent with the presence of two methyl groups in the molecule. The H-11/H-17 correlation
indicated that the methyl group attached to C-8 was β since the diene side chain was β in
orientation. The H-12/H-20 correlation indicated that the methyl group attached to C-9 was α
since the diene side chain was β in orientation. The correlation between H-11 and H-19, which
was expected from Spartan calculations, indicated that H-19 must be α, since the diene side
chain at C-9 was β. The NOESY data showed a correlation between H-2 and H-3; however, this
correlation did not give conclusive evidence of the stereochemistry at C-2 since H-3 was a vinyl
proton and therefore was planar. NOESY data was also obtained for casearlucin A (compound
A) for comparison purposes. The NOESY data indicated a strong correlation between H-6/H-8.
This was consistent with the structure in which the alcohol group was β and H-6 and H-8 were
diaxial. When the NOESY data for casearlucin A (compound A) was compared to the NOESY
data for compound B a clear H-6/H-8 correlation was not readily observed. A 1D NOESY
experiment in which H-6 was excited indicated a strong correlation with H-7, but still gave only
a questionable correlation to H-8. The lack of similarity between the NOESY data for
casearlucin A (compound A) and compound B as well as the very questionable H-6/H-8 NOESY
correlation for compound B led to the following conclusions. If there is not a H-6/H-8
correlation, it may be because the protons were diaxial and the correlation did not significantly
show up in the NOESY spectrum, or it may be because the protons were not diaxial in which
case no correlation would be expected.
27
OCH3
OAc
CH3
H
OH
CH3
H OAc
H
H HH
HH
HH
H
OOC(CH3)CHCH2CH3
HHH
10
1219
86
16
2
15
20
Figure 2.6 NOESY correlations observed for compound B. (Recorded in CDCl3.)
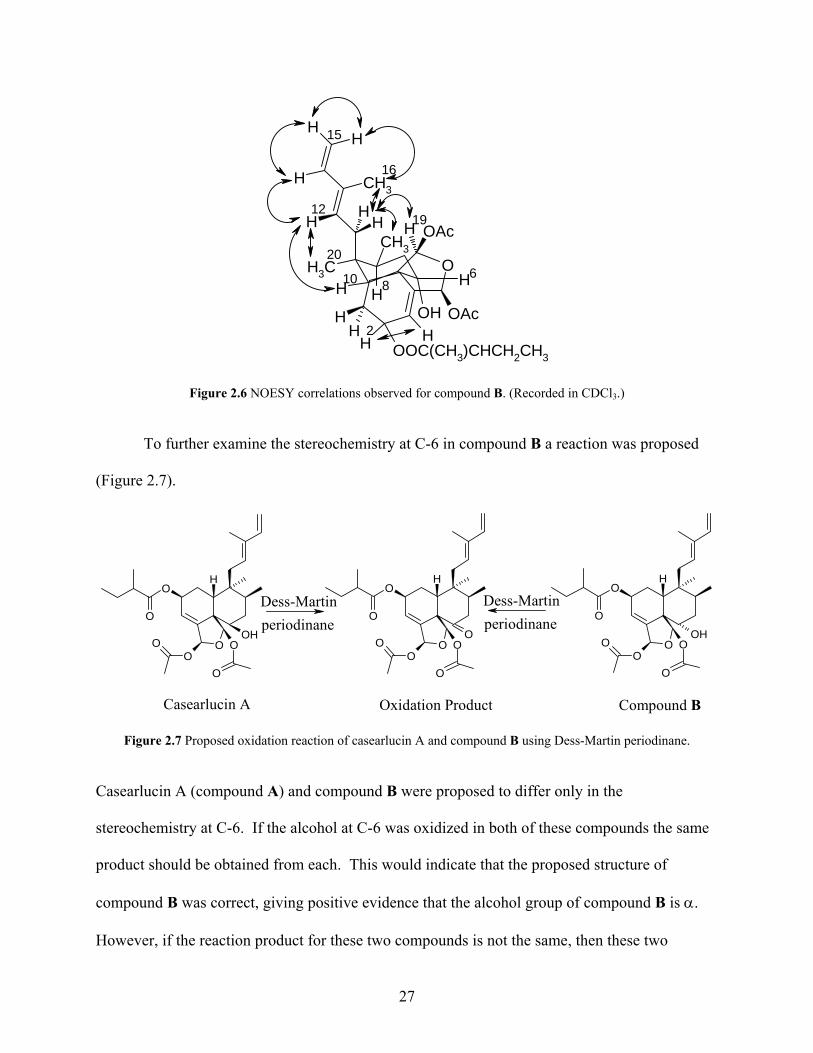
To further examine the stereochemistry at C-6 in compound B a reaction was proposed
(Figure 2.7).
OO
OH
O
O O
O
OO
OH
O
OH
O
O O
O
OOH
O
OH
O
O O
O
Dess-Martinperiodinane
Dess-Martinperiodinane
Casearlucin A Oxidation Product Compound B
Figure 2.7 Proposed oxidation reaction of casearlucin A and compound B using Dess-Martin periodinane.
Casearlucin A (compound A) and compound B were proposed to differ only in the
stereochemistry at C-6. If the alcohol at C-6 was oxidized in both of these compounds the same
product should be obtained from each. This would indicate that the proposed structure of
compound B was correct, giving positive evidence that the alcohol group of compound B is α.
However, if the reaction product for these two compounds is not the same, then these two

28
compounds must differ in stereochemistry at another position. The oxidation reaction was done
using Dess-Martin periodinane. The reactants and products were analyzed using 1H NMR
spectra. Prior to oxidation the 1H NMR spectrum for casearlucin A showed a peak at δ 3.80
ppm, which corresponded to α-H-6. Following oxidation the peak at δ 3.80 ppm was gone,
indicating that oxidation of the alcohol occurred. The 1H NMR spectrum of the oxidation
product of casearlucin A also showed a peak at δ 5.43 ppm corresponding to α-H-2. For
compound B the 1H NMR spectrum prior to oxidation showed a peak at δ 4.00 ppm, which
corresponded to β-H-6. Following oxidation of compound B, the peak at δ 4.00 ppm in the 1H
NMR spectrum was gone indicating that oxidation of the compound took place. Also in the 1H
NMR spectrum of the oxidation product of compound B there was a peak at δ 5.53 ppm, which
corresponded to H-2. Since the 1H NMR spectrum for the oxidation products for these two
compounds were not the same, and since the major difference occurred in the shift of the peak
corresponding to H-2, it was hypothesized that these two compounds differed in their
stereochemistry at C-2 as well as at C-6. The NOESY data was re-evaluated and a correlation
between H-2 and H-10 for compound B was noted, which indicated that H-2 and H-10 must be
diaxial, making the 2-methylbutanoyloxy side chain at C-2 α. Based on the data obtained a
structure was initially proposed for compound B (Figure 2.8).
29
O
HO
O
O
OHOO
O
1
3
20
8
15
16
115'
4'
19
17
Figure 2.8 Initially proposed structure of compound B.
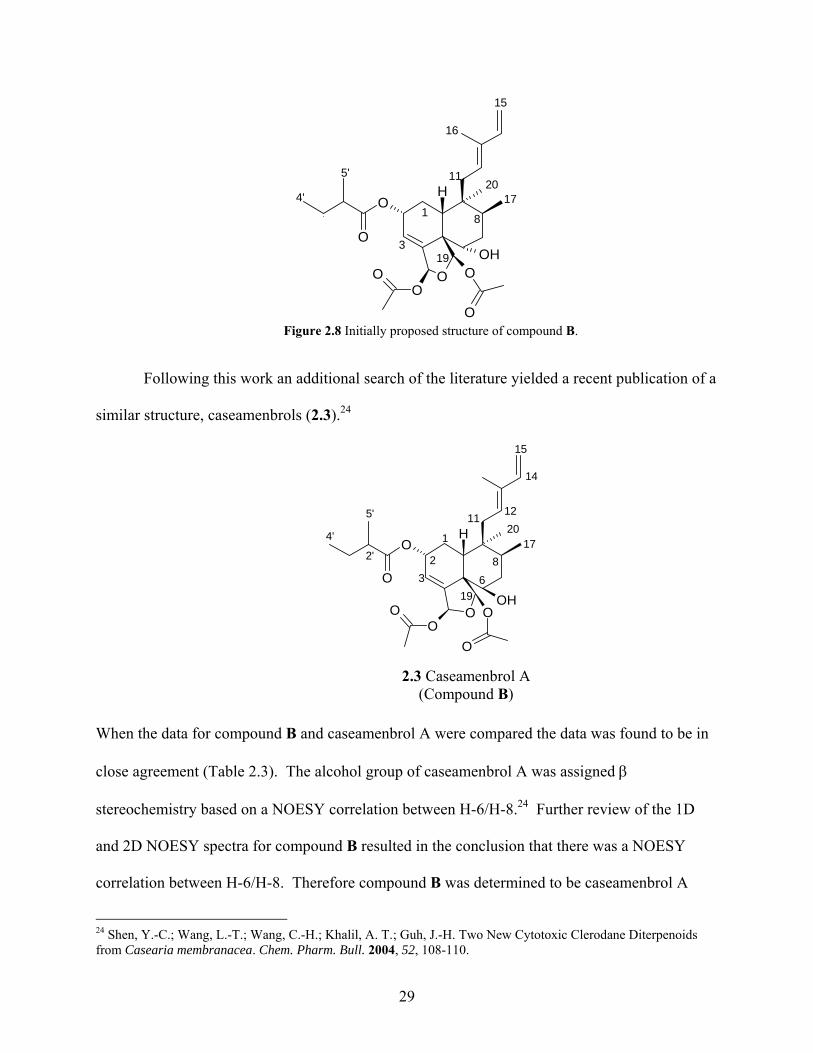
Following this work an additional search of the literature yielded a recent publication of a
similar structure, caseamenbrols (2.3).24
OOH
O
OH
O
O O
O
1
3 6
178
15
14
12115'
2'
4'
2
2.3 Caseamenbrol A(Compound B)
19
20
When the data for compound B and caseamenbrol A were compared the data was found to be in
close agreement (Table 2.3). The alcohol group of caseamenbrol A was assigned β
stereochemistry based on a NOESY correlation between H-6/H-8.24 Further review of the 1D
and 2D NOESY spectra for compound B resulted in the conclusion that there was a NOESY
correlation between H-6/H-8. Therefore compound B was determined to be caseamenbrol A
24 Shen, Y.-C.; Wang, L.-T.; Wang, C.-H.; Khalil, A. T.; Guh, J.-H. Two New Cytotoxic Clerodane Diterpenoids from Casearia membranacea. Chem. Pharm. Bull. 2004, 52, 108-110.
30
(2.3). The identity of compound B was further supported by the MS, optical rotation, UV, and
IR data which were in agreement with the literature values for caseamenbrol A.24
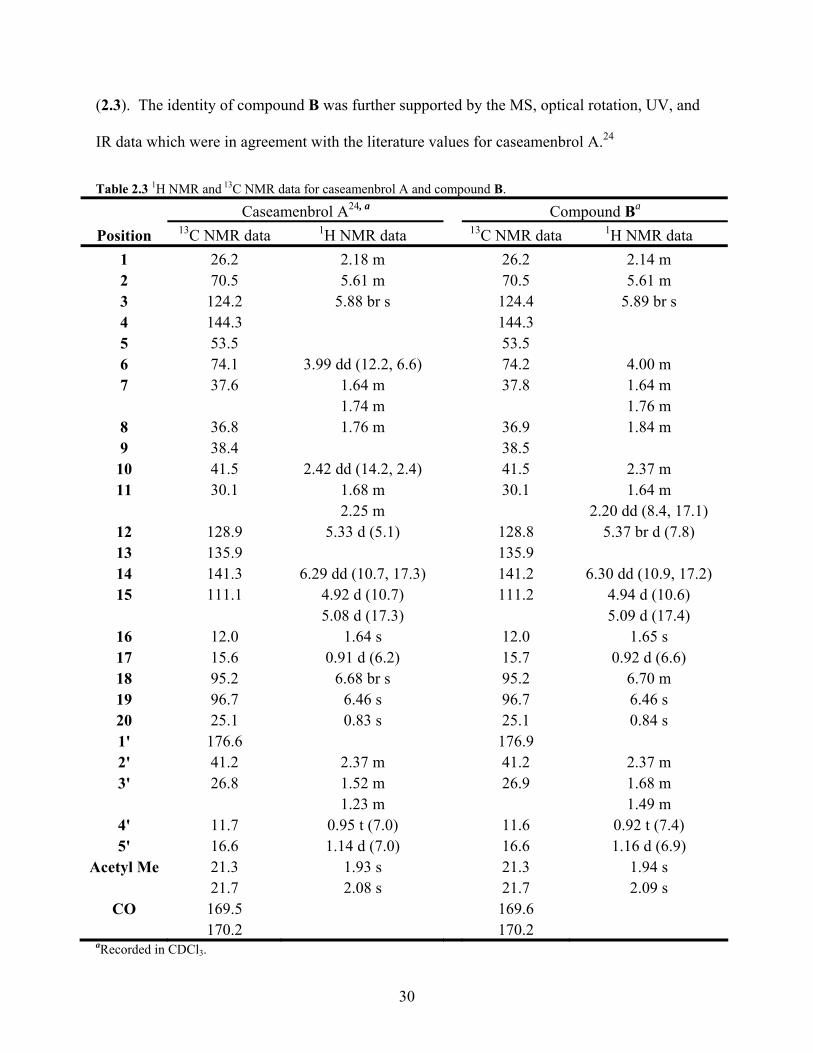
Table 2.3 1H NMR and 13C NMR data for caseamenbrol A and compound B.
Caseamenbrol A24, a Compound Ba Position 13C NMR data 1H NMR data 13C NMR data 1H NMR data
1 26.2 2.18 m 26.2 2.14 m 2 70.5 5.61 m 70.5 5.61 m 3 124.2 5.88 br s 124.4 5.89 br s 4 144.3 144.3 5 53.5 53.5 6 74.1 3.99 dd (12.2, 6.6) 74.2 4.00 m 7 37.6 1.64 m 37.8 1.64 m 1.74 m 1.76 m
8 36.8 1.76 m 36.9 1.84 m 9 38.4 38.5
10 41.5 2.42 dd (14.2, 2.4) 41.5 2.37 m 11 30.1 1.68 m 30.1 1.64 m
2.25 m 2.20 dd (8.4, 17.1) 12 128.9 5.33 d (5.1) 128.8 5.37 br d (7.8) 13 135.9 135.9 14 141.3 6.29 dd (10.7, 17.3) 141.2 6.30 dd (10.9, 17.2) 15 111.1 4.92 d (10.7) 111.2 4.94 d (10.6)
5.08 d (17.3) 5.09 d (17.4) 16 12.0 1.64 s 12.0 1.65 s 17 15.6 0.91 d (6.2) 15.7 0.92 d (6.6) 18 95.2 6.68 br s 95.2 6.70 m 19 96.7 6.46 s 96.7 6.46 s 20 25.1 0.83 s 25.1 0.84 s 1' 176.6 176.9 2' 41.2 2.37 m 41.2 2.37 m 3' 26.8 1.52 m 26.9 1.68 m 1.23 m 1.49 m
4' 11.7 0.95 t (7.0) 11.6 0.92 t (7.4) 5' 16.6 1.14 d (7.0) 16.6 1.16 d (6.9)
Acetyl Me 21.3 1.93 s 21.3 1.94 s 21.7 2.08 s 21.7 2.09 s
CO 169.5 169.6 170.2 170.2
aRecorded in CDCl3.

31
2.2.4 Structure Elucidation of Compound C
Compound C was isolated as a viscous oil. The HRFAB mass spectrum gave a
molecular ion formed as a sodium ion adduct of m/z 541.2766, which corresponded to the
molecular formula C29H42O8 + Na. This molecular formula indicated nine units of unsaturation
in the molecule.
Comparison of the 1H NMR and 13C NMR data of compound C to casearlucin A
(compound A) indicated that the two compounds were identical except for the configuration of
the double bonds in the diene side chain (Table 2.4 & Table 2.5). The 1H NMR spectrum of
compound C in CDCl3 showed the presence of signals for two saturated methylenes (δ 1.26 m &
δ 1.50 m; δ 2.08 m); two terminal unsaturated methylenes (δ 4.93 s & δ 5.04 s ; δ 5.02 d, J =
11.00 Hz & δ 5.16 d, J = 17.40 Hz); and one vinyl protons (δ 6.44 dd, J = 10.75 Hz, 17.65 Hz)
all suggesting the presence of a six carbon diene side chain, but with a different double bond
configuration than was observed in casearlucin A (compound A). The 13C NMR spectrum of
compound C in CDCl3 was also consistent with the observed differences in the double bond
configuration of the diene side chain as compared to casearlucin A (compound A). The 13C
NMR spectrum contained signals for two saturated methylenes (δ 23.8; δ 28.0); two terminal
unsaturated methylenes (δ 112.3; δ 115.6); one unsaturated methine (δ 140.5); and an
unsaturated quaternary carbon (δ 145.1).
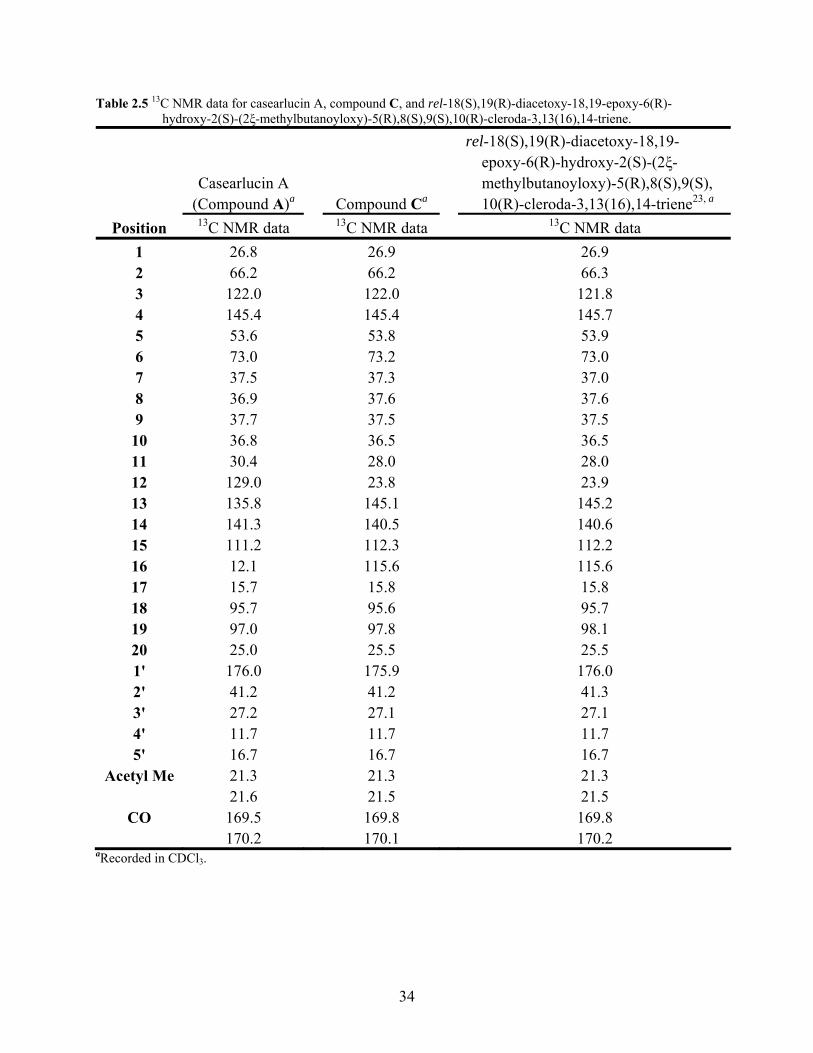
The data from the 1H NMR and the 13C NMR spectra in CDCl3 when compared to the
literature were found to be in close agreement with the data for the known compound rel-
18(S),19(R)-diacetoxy-18,19-epoxy-6(R)-hydroxy-2(S)-(2ξ-methylbutanoyloxy)-
5(R),8(S),9(S),10(R)-cleroda-3,13(16),14-triene16, 23 (2.4) (Table 2.4 & Table 2.5). Based on the
similarity of the experimental and literature data of the 1H NMR and 13C NMR spectra

32
compound C was determined to be rel-18(S),19(R)-diacetoxy-18,19-epoxy-6(R)-hydroxy-2(S)-
(2ξ-methylbutanoyloxy)-5(R),8(S),9(S),10(R)-cleroda-3,13(16),14-triene. The identity of
compound C was further supported by the MS, optical rotation, UV, and IR data which were in
agreement with the literature values for rel-18(S),19(R)-diacetoxy-18,19-epoxy-6(R)-hydroxy-
2(S)-(2ξ-methylbutanoyloxy)-5(R),8(S),9(S),10(R)-cleroda-3,13(16),14-triene.23
OOH
O
OH
O
O O
O
1
3 6
178
15
14
12115'
2'
4'
2
2.4 rel-18(S),19(R)-diacetoxy-18,19-epoxy-6(R)-hydroxy- 2(S)-(2ξ-methylbutanoyloxy)-5(R),8(S),9(S),10(R)- cleroda-3,13(16),14-triene
16
1819
20

33
Table 2.4 1H NMR data for casearlucin A, compound C, and rel-18(S),19(R)-diacetoxy-18,19-epoxy-6(R)- hydroxy-2(S)-(2ξ-methylbutanoyloxy)-5(R),8(S),9(S),10(R)-cleroda-3,13(16),14-triene.
rel-18(S),19(R)-diacetoxy-18,19- epoxy-6(R)-hydroxy-2(S)-(2ξ- Casearlucin A methylbutanoyloxy)-5(R),8(S),9(S), (Compound A)a Compound Ca 10(R)-cleroda-3,13(16),14-triene23, a
Position 1H NMR data 1H NMR data 1H NMR data
1 1.89 m 1.92 m 1.90 m 2 5.44 m 5.42 m 5.40 br s 3 6.01 dd (1.8, 4.4) 5.98 d (4.2) 5.96 d (4.1) 6 3.80 m 3.80 dd (3.9, 11.9) 3.78 br t (8.4) 7 1.62 m 1.72 m 1.70 m 1.74 m
8 1.76 m 1.77 m 1.75 m 10 2.37 br t (8.6) 2.33 m 2.31 dd (6.1, 10.8) 11 1.63 m 1.26 m 1.25 m
2.23 dd (8.0, 16.7) 1.50 m 1.48 m 12 5.36 br d 2.08 m 2.06 m 14 6.26 dd (10.7, 17.0) 6.44 dd (10.8, 17.7) 6.42 dd (11.0, 17.7) 15 4.93 d (10.6) 5.02 d (11.0) 4.95 d (10.3)
5.10 d (17.4) 5.16 d (17.4) 5.14 br d (17.7) 16 1.66 s 4.93 s 4.93 s
5.04 s 5.01 s 17 0.93 d (6.7) 0.92 d (7.0) 0.90 d (6.0) 18 6.73 t (1.6) 6.72 m 6.69 br s 19 6.51 s 6.46 s 6.46 br s 20 0.81 s 0.91 s 0.89 s 2' 2.46 m 2.44 m 2.42 m 3' 1.69 m 1.65 m 1.63 m 4' 0.97 t (7.3) 0.96 t (7.5) 0.94 t (7.4) 5' 1.18 d (7.1) 1.17 d (6.9) 1.15 d (7.0)
Acetyl Me 1.93 s 1.87 s 1.85 s 2.08 s 2.05 s 2.03 s
aRecorded in CDCl3.
34
Table 2.5 13C NMR data for casearlucin A, compound C, and rel-18(S),19(R)-diacetoxy-18,19-epoxy-6(R)- hydroxy-2(S)-(2ξ-methylbutanoyloxy)-5(R),8(S),9(S),10(R)-cleroda-3,13(16),14-triene.
rel-18(S),19(R)-diacetoxy-18,19- epoxy-6(R)-hydroxy-2(S)-(2ξ- Casearlucin A methylbutanoyloxy)-5(R),8(S),9(S), (Compound A)a Compound Ca 10(R)-cleroda-3,13(16),14-triene23, a
Position 13C NMR data 13C NMR data 13C NMR data 1 26.8 26.9 26.9 2 66.2 66.2 66.3 3 122.0 122.0 121.8 4 145.4 145.4 145.7 5 53.6 53.8 53.9 6 73.0 73.2 73.0 7 37.5 37.3 37.0 8 36.9 37.6 37.6 9 37.7 37.5 37.5
10 36.8 36.5 36.5 11 30.4 28.0 28.0 12 129.0 23.8 23.9 13 135.8 145.1 145.2 14 141.3 140.5 140.6 15 111.2 112.3 112.2 16 12.1 115.6 115.6 17 15.7 15.8 15.8 18 95.7 95.6 95.7 19 97.0 97.8 98.1 20 25.0 25.5 25.5 1' 176.0 175.9 176.0 2' 41.2 41.2 41.3 3' 27.2 27.1 27.1 4' 11.7 11.7 11.7 5' 16.7 16.7 16.7
Acetyl Me 21.3 21.3 21.3 21.6 21.5 21.5
CO 169.5 169.8 169.8 170.2 170.1 170.2
aRecorded in CDCl3.

35
2.2.5 Structure Elucidation of Compound D
Compound D was isolated as an amorphous solid. The HRFAB mass spectrum gave a
molecular ion formed as a sodium ion adduct of m/z 541.27386, which corresponded to the
molecular formula C29H42O8 + Na. This molecular formula indicated nine units of unsaturation
in the molecule.
Due to the small quantity of material isolated a 1H NMR spectrum was the only type of
NMR data obtained for this compound. Based on the 1H NMR data a novel structure was
proposed for this compound. Comparison of the 1H NMR data of compound D to rel-
18(S),19(R)-diacetoxy-18,19-epoxy-6(R)-hydroxy-2(S)-(2ξ-methylbutanoyloxy)-
5(R),8(S),9(S),10(R)-cleroda-3,13(16),14-triene (compound C) suggested that these two
compounds were identical except for the stereochemistry at C-2 and C-6. In rel-18(S),19(R)-
diacetoxy-18,19-epoxy-6(R)-hydroxy-2(S)-(2ξ-methylbutanoyloxy)-5(R),8(S),9(S),10(R)-
cleroda-3,13(16),14-triene (compound C) the 2-methylbutanoyloxy chain was β, with the signal
for the oxymethine proton of C-2 at δ 5.42 ppm. The alcohol was also β in rel-18(S),19(R)-
diacetoxy-18,19-epoxy-6(R)-hydroxy-2(S)-(2ξ-methylbutanoyloxy)-5(R),8(S),9(S),10(R)-
cleroda-3,13(16),14-triene (compound C) with the signal for the oxymethine proton of C-6 at δ
3.80 ppm. In compound D the signal for the oxymethine proton of C-2 was at δ 5.60 ppm, while
the signal for the oxymethine proton of C-6 was at δ 4.01 ppm. The 1H NMR data of compound
D was also compared to the 1H NMR data of caseamenbrol A (compound B), paying particular
attention to the chemical shifts of the peaks corresponding to the protons of C-2 and C-6. In
caseamenbrol A (compound B) the 2-methylbutanoyloxy chain was α, with the signal for the
oxymethine proton of C-2 at δ 5.61 ppm. The alcohol was β in caseamenbrol A (compound B)
with the signal for the oxymethine proton of C-6 at δ 4.00 ppm. The similarity in chemical shift

36
of the peaks corresponding to the protons of C-2 and C-6 in caseamenbrol A (compound B) and
compound D suggested that the stereochemistry of the 2-methylbutanoyloxy chain was α and the
stereochemistry of the alcohol was β in compound D.
Based on the 1H NMR data a novel structure was proposed for compound D (2.5). This
novel compound was named casearlucin L. The proposed structure of compound D was
supported by comparison of the 1H NMR data to the 1H NMR data for rel-18(S),19(R)-
diacetoxy-18,19-epoxy-6(R)-hydroxy-2(S)-(2ξ-methylbutanoyloxy)-5(R),8(S),9(S),10(R)-
cleroda-3,13(16),14-triene (compound C) and caseamenbrol A (compound B) (Table 2.6).
OOH
O
OH
O
O O
O
2.5 Casearlucin L
1
3
1819
6
1720
15
1613
115'
1'4'

37
Table 2.6 1H NMR data for rel-18(S),19(R)-diacetoxy-18,19-epoxy-6(R)-hydroxy-2(S)-(2ξ-methylbutanoyloxy)- 5(R),8(S),9(S),10(R)-cleroda-3,13(16),14-triene (compound C), compound D, and caseamenbrol A (compound B). rel-18(S),19(R)-diacetoxy-18,19- epoxy-6(R)-hydroxy-2(S)-(2ξ- methylbutanoyloxy)-5(R),8(S),9(S), 10(R)-cleroda-3,13(16),14-triene Casearlucin L Caseamenbrol A (Compound C)a (Compound D) a (Compound B) a
Position 1H NMR data 1H NMR data 1H NMR data 1 1.92 m 2.15 m 2.14 m 2 5.42 m 5.60 m 5.61 m 3 5.98 d (4.2) 5.87 br s 5.89 br s 6 3.80 dd (3.9, 11.9) 4.01 m 4.00 m 7 1.72 m 1.72 m 1.64 m 1.76 m
8 1.77 m 1.80 m 1.84 m 10 2.33 m 2.37 m 2.37 m 11 1.26 m 1.50 m 1.64 m
1.50 m 2.20 dd (8.4, 17.1) 12 2.08 m 2.08 m 5.37 br d (7.8) 14 6.44 dd (10.8, 17.7) 6.42 dd (10.7, 17.8) 6.30 dd (10.9, 17.2) 15 5.02 d (11.0) 5.04 d (10.4) 4.94 d (10.6)
5.16 d (17.4) 5.21 d (17.9) 5.09 d (17.4) 16 4.93 s 4.91 s 1.65 s
5.02 s 5.04 s 17 0.92 d (7.0) 0.92 d (6.9) 0.92 d (6.6) 18 6.72 m 6.70 m 6.70 m 19 6.46 s 6.41 s 6.46 s 20 0.91 s 0.91 s 0.84 s 2' 2.44 m 2.37 m 2.37 m 3' 1.65 m 1.66 m 1.68 m
1.49 m 4' 0.96 t (7.5) 0.94 t (7.6) 0.92 t (7.4) 5' 1.17 d (6.9) 1.16 d (7.1) 1.16 d (6.9)
Acetyl Me 1.87 s 1.89 s 1.94 s 2.05 s 2.07 s 2.09 s
aRecorded in CDCl3.

38
2.2.6 Structure Elucidation of Compound E
Compound E was isolated as a viscous oil. The HRFAB mass spectrum gave a molecular
ion formed as a sodium ion adduct of m/z 513.24579, which corresponded to the molecular
formula C27H38O8 + Na. This molecular formula indicated nine units of unsaturation in the
molecule.
Comparison of the MS, 1H NMR data, and 13C NMR data of compound E to rel-
18(S),19(R)-diacetoxy-18,19-epoxy-6(R)-hydroxy-2(S)-(2ξ-methylbutanoyloxy)-
5(R),8(S),9(S),10(R)-cleroda-3,13(16),14-triene (compound C) (Table 2.4 & Table 2.5)
indicated that compound E did not contain a 2-methylbutanoyloxy chain, but instead contained
an additional acetate unit as well as a methoxy group instead of an alcohol. The 1H NMR
spectrum of compound E in CDCl3 showed the presence of signals for three methyl groups that
were part of acetate units (δ 1.87 s; δ 2.06 s; δ 2.09 s) and a methyl group corresponding to a
methoxy group (δ 3.33 s). Based on the chemical shifts of H-2 (δ 5.58 m) and H-6 (δ 3.49 dd, J
= 4.00 Hz, 12.25 Hz) it appeared that the additional acetate unit was attached to C-2 and the
methoxy group was attached to C-6.
The 13C NMR spectrum of compound E in CDCl3 was also consistent with the presence
of an additional acetate unit as well as the presence of a methoxy group instead of an alcohol as
compared to rel-18(S),19(R)-diacetoxy-18,19-epoxy-6(R)-hydroxy-2(S)-(2ξ-
methylbutanoyloxy)-5(R),8(S),9(S),10(R)-cleroda-3,13(16),14-triene (compound C) (Table 2.4
& Table 2.5). The 13C NMR spectrum of compound E contained signals for three methyl groups
(δ 21.3; δ 21.4; δ 21.8) and three carbonyl groups (δ 169.9; δ 170.2; δ 171.0) that were part of
acetate units and a methyl group corresponding to a methoxy group (δ 57.6). The 13C NMR data

39
also supported the attachment of the additional acetate unit to C-2 (δ 71.0) and the methoxy
group to C-6 (δ 83.1) based on the chemical shifts of C-2 and C-6.
The data from the 1H NMR and the 13C NMR spectra in CDCl3 when compared to the
literature were found to be in close agreement with the data for the known compound casearlucin
B16 (2.6) (Table 2.7). Based on the similarity of the experimental and literature data of the 1H
NMR and 13C NMR spectra compound E was determined to be casearlucin B. The identity of
compound E was further supported by the MS, optical rotation, UV, and IR data which were in
agreement with the literature values for casearlucin B.16
OO
OH
O
O O
O
OMe
1
3 6
178
15
14
1211
2
2.6 Casearlucin B
16
1819
20

40
Table 2.7 1H NMR and 13C NMR data for casearlucin B and compound E.
Casearlucin B16, a Compound Ea
Position 13C NMR data 1H NMR data 13C NMR data 1H NMR data 1 26.7 1.66 m 26.6 1.66 m 2.14 m 2.15 m
2 71.0 5.58 br t (6.9) 71.0 5.58 m 3 123.6 5.82 br s 123.6 5.82 br s 4 145.4 145.1 5 53.2 53.1 6 83.2 3.48 dd (3.9, 12.1) 83.1 3.49 dd (4.0, 12.3) 7 31.4 1.72 m 31.4 1.72 m 8 37.1 1.86 m 37.1 1.87 m 9 41.3 41.2
10 38.4 2.34 dd (4.6, 13.0) 38.3 2.34 dd (3.0, 14.0) 11 27.6 1.26 m 27.5 1.26 m
1.46 m 1.46 m 12 23.8 2.08 m 23.8 2.08 m 13 145.9 145.5 14 140.4 6.42 dd (11.0, 17.6) 140.4 6.42 dd (11.0, 17.6) 15 112.6 5.01 d (10.8) 112.6 5.02 d (10.6)
5.18 d (17.6) 5.20 d (17.9) 16 115.6 4.90 s 115.6 4.91 s
5.02 s 5.03 s 17 15.9 0.92 d (6.8) 16.0 0.93 d (6.7) 18 95.8 6.62 t (1.6) 95.8 6.62 t (1.6) 19 98.0 6.27 s 98.0 6.37 s 20 25.7 0.93 s 25.7 0.94 s
Acetyl Me 21.3b 1.86 s 21.3b 1.87 s 21.4b 2.06 s 21.4b 2.06 s 21.6b 2.09 s 21.8b 2.09 s
CO 169.8c 169.9c 170.2c 170.2c
170.3c 171.0c OMe 57.6 3.30 s 57.6 3.33 s
aRecorded in CDCl3. b, c Values with the same superscript are interchangeable within their respective column.
41
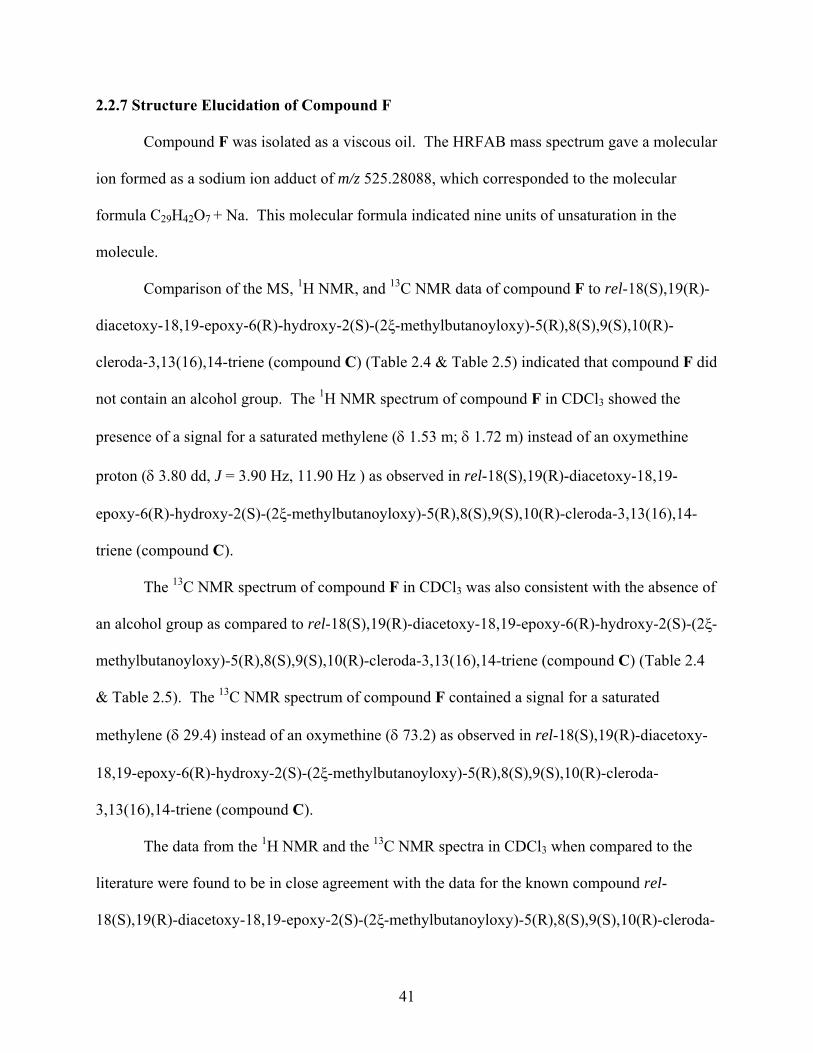
2.2.7 Structure Elucidation of Compound F
Compound F was isolated as a viscous oil. The HRFAB mass spectrum gave a molecular
ion formed as a sodium ion adduct of m/z 525.28088, which corresponded to the molecular
formula C29H42O7 + Na. This molecular formula indicated nine units of unsaturation in the
molecule.
Comparison of the MS, 1H NMR, and 13C NMR data of compound F to rel-18(S),19(R)-
diacetoxy-18,19-epoxy-6(R)-hydroxy-2(S)-(2ξ-methylbutanoyloxy)-5(R),8(S),9(S),10(R)-
cleroda-3,13(16),14-triene (compound C) (Table 2.4 & Table 2.5) indicated that compound F did
not contain an alcohol group. The 1H NMR spectrum of compound F in CDCl3 showed the
presence of a signal for a saturated methylene (δ 1.53 m; δ 1.72 m) instead of an oxymethine
proton (δ 3.80 dd, J = 3.90 Hz, 11.90 Hz ) as observed in rel-18(S),19(R)-diacetoxy-18,19-
epoxy-6(R)-hydroxy-2(S)-(2ξ-methylbutanoyloxy)-5(R),8(S),9(S),10(R)-cleroda-3,13(16),14-
triene (compound C).
The 13C NMR spectrum of compound F in CDCl3 was also consistent with the absence of
an alcohol group as compared to rel-18(S),19(R)-diacetoxy-18,19-epoxy-6(R)-hydroxy-2(S)-(2ξ-
methylbutanoyloxy)-5(R),8(S),9(S),10(R)-cleroda-3,13(16),14-triene (compound C) (Table 2.4
& Table 2.5). The 13C NMR spectrum of compound F contained a signal for a saturated
methylene (δ 29.4) instead of an oxymethine (δ 73.2) as observed in rel-18(S),19(R)-diacetoxy-
18,19-epoxy-6(R)-hydroxy-2(S)-(2ξ-methylbutanoyloxy)-5(R),8(S),9(S),10(R)-cleroda-
3,13(16),14-triene (compound C).
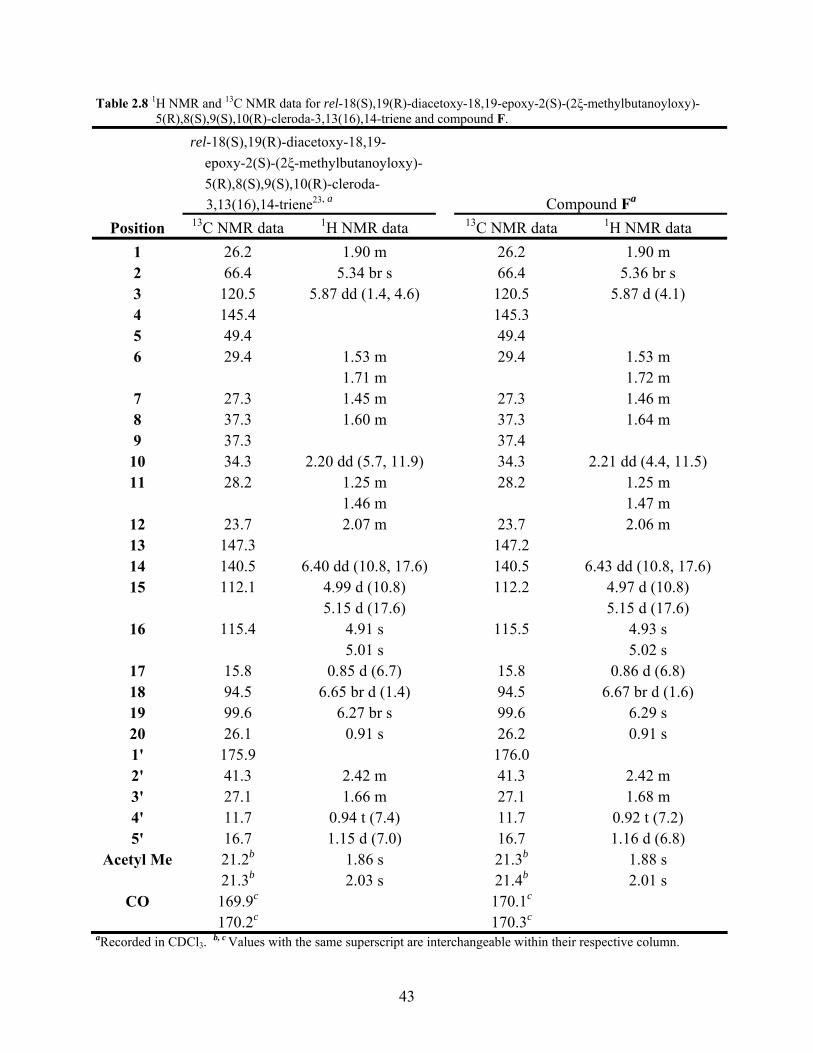
The data from the 1H NMR and the 13C NMR spectra in CDCl3 when compared to the
literature were found to be in close agreement with the data for the known compound rel-
18(S),19(R)-diacetoxy-18,19-epoxy-2(S)-(2ξ-methylbutanoyloxy)-5(R),8(S),9(S),10(R)-cleroda-

42
3,13(16),14-triene16, 23 (2.7) (Table 2.9). Based on the similarity of the experimental and
literature data of the 1H NMR and 13C NMR spectra compound F was determined to be rel-
18(S),19(R)-diacetoxy-18,19-epoxy-2(S)-(2ξ-methylbutanoyloxy)-5(R),8(S),9(S),10(R)-cleroda-
3,13(16),14-triene. The identity of compound F was further supported by the MS, optical
rotation, UV, and IR data which were in agreement with the literature values for rel-18(S),19(R)-
diacetoxy-18,19-epoxy-2(S)-(2ξ-methylbutanoyloxy)-5(R),8(S),9(S),10(R)-cleroda-3,13(16),14-
triene.23
OO
OH
O
O O
O
1
3 6
178
15
14
12115'
2'
4'
2
2.7 rel-18(S),19(R)-diacetoxy-18,19-epoxy-2(S)- (2ξ-methylbutanoyloxy)-5(R),8(S),9(S),10(R)- cleroda-3,13(16),14-triene
16
1819
20
43
Table 2.8 1H NMR and 13C NMR data for rel-18(S),19(R)-diacetoxy-18,19-epoxy-2(S)-(2ξ-methylbutanoyloxy)- 5(R),8(S),9(S),10(R)-cleroda-3,13(16),14-triene and compound F.
rel-18(S),19(R)-diacetoxy-18,19- epoxy-2(S)-(2ξ-methylbutanoyloxy)- 5(R),8(S),9(S),10(R)-cleroda- 3,13(16),14-triene23, a Compound Fa
Position 13C NMR data 1H NMR data 13C NMR data 1H NMR data 1 26.2 1.90 m 26.2 1.90 m 2 66.4 5.34 br s 66.4 5.36 br s 3 120.5 5.87 dd (1.4, 4.6) 120.5 5.87 d (4.1) 4 145.4 145.3 5 49.4 49.4 6 29.4 1.53 m 29.4 1.53 m 1.71 m 1.72 m
7 27.3 1.45 m 27.3 1.46 m 8 37.3 1.60 m 37.3 1.64 m 9 37.3 37.4
10 34.3 2.20 dd (5.7, 11.9) 34.3 2.21 dd (4.4, 11.5) 11 28.2 1.25 m 28.2 1.25 m
1.46 m 1.47 m 12 23.7 2.07 m 23.7 2.06 m 13 147.3 147.2 14 140.5 6.40 dd (10.8, 17.6) 140.5 6.43 dd (10.8, 17.6) 15 112.1 4.99 d (10.8) 112.2 4.97 d (10.8)
5.15 d (17.6) 5.15 d (17.6) 16 115.4 4.91 s 115.5 4.93 s
5.01 s 5.02 s 17 15.8 0.85 d (6.7) 15.8 0.86 d (6.8) 18 94.5 6.65 br d (1.4) 94.5 6.67 br d (1.6) 19 99.6 6.27 br s 99.6 6.29 s 20 26.1 0.91 s 26.2 0.91 s 1' 175.9 176.0 2' 41.3 2.42 m 41.3 2.42 m 3' 27.1 1.66 m 27.1 1.68 m 4' 11.7 0.94 t (7.4) 11.7 0.92 t (7.2) 5' 16.7 1.15 d (7.0) 16.7 1.16 d (6.8)
Acetyl Me 21.2b 1.86 s 21.3b 1.88 s 21.3b 2.03 s 21.4b 2.01 s
CO 169.9c 170.1c 170.2c 170.3c
aRecorded in CDCl3. b, c Values with the same superscript are interchangeable within their respective column.

44
2.2.8 Biological Evaluation of Isolated Compounds
As previously mentioned extracts from Casearia species showed biological activity as
anti-cancer, anti-fungal, anti-ulcer, anti-hyperglycemic, analgesic, and anti-inflammatory agents,
and were able to neutralize several types of snake venom.25 The clerodane diterpenes that were
isolated from Casearia nigrescens were tested for anti-cancer activity in the A2780 assay. The
compounds had IC50 values ranging from 0.4 to 2.6 µg/mL (Table 2.9). However, there are only
slight differences in the structures of these compounds; therefore, the activity of the compound
can not be assigned on the basis of the chemical structure.
Table 2.9 IC50 values for compounds A-F tested in the A2780 assay.
Casearlucin A (compound A) IC50 = 2.2 µg/mL Caseamenbrol A (compound B) IC50 = 1.0 µg/mL rel-18(S),19(R)-diacetoxy-18,19-epoxy-6(R)-hydroxy- 2(S)-(2ξ-methylbutanoyloxy)-5(R),8(S),9(S),10(R)- cleroda-3,13(16),14-triene (compound C) IC50 = 2.0 µg/mL Casearlucin L (compound D) IC50 = 0.4 µg/mL Casearlucin B (compound E) IC50 = 2.6 µg/mL rel-18(S),19(R)-diacetoxy-18,19-epoxy-2(S)-(2ξ- methylbutanoyloxy)-5(R),8(S),9(S),10(R)-cleroda- 3,13(16),14-triene (compound F) IC50 = 1.2 µg/mL
2.3 Experimental Section
2.3.1 General Experimental Procedures
High resolution FABMS for all compounds was obtained using a JEOL HX-110
instrument. 1D NMR and 2D NMR data were obtained on the JEOL Eclipse instrument at 500
MHz for proton and 125 MHz for carbon and on the Varian Inova instrument at 400 MHz for
proton and 100 MHz for carbon. The optical rotation was obtained using a Perkin-Elmer 241
polarimeter. A Shimadzu UV-1201 spectrophotometer was used to obtain UV spectra. IR
25 Chapter II Section 2.1.2 Bioactivity of Casearia species extracts.

45
spectra were obtained using a Midac M-Series FTIR spectrophotometer. Fractions were
separated using a Supelco Discovery DSC-18 6 mL tube (1 g) followed by further separation
using a Shimadzu LC-10AT Liquid Chromatogram with a Varian Dynamax C-18 column (250 x
10.0 mm) or a Varian Dynamax CN column (250 x 10.0 mm).
2.3.2 Cytotoxic Bioassay
All compounds were tested for cytotoxicity in the A2780 human ovarian cancer cell line
assay as discussed previously.26
2.3.3 Plant Material
The root and bark of Casearia nigrescens Tul. (Flacourtiaceae) were collected by N. M.
Andrianjafy and others in Toamasina, Madagascar (Coordinates 17.45.28S 048.45.40E;
Elevation 815 m) in November 2001. The extracts were collected from two trees, one 10 m tall
with a diameter at breast height (DBH) of 16 cm and the other 12 m tall with a DBH of 16 cm.
The collection was assigned collection numbers Andrianjafy 254 and Andrianjafy 257. A root
and bark extract were taken from each tree and assigned ICBG numbers MG1147 (root),
MG1149 (bark), MG1156 (root), and MG1158 (bark). A voucher specimen was deposited at the
Missouri Botanical Garden, St. Louis, MO.
2.3.4 Extract Preparation
The dried plant material was ground and extracted overnight at room temperature with a
1:1 mixture of dichloromethane and methanol. The solvent was removed from the plant
material. The plant material was then extracted with methanol for 30 minutes. The 1:1
dichloromethane:methanol and methanol fractions were combines and concentrated on a rotary
26 Chapter I Section 1.5.3 A2780 assay.

46
evaporator below 40º C to give a thick concentrate. The concentrate was dried overnight under
high vacuum to give the crude extract.
2.3.5 Bioassay Guided Fractionation and Isolation of Compounds
A portion of the crude extract (1.00 g) from Casearia nigrescens was subjected to
fractionation. First liquid-liquid partitioning was used. The crude extract was dissolved in
aqueous methanol (90%), which was extracted with hexane. The aqueous methanol was then
diluted (60%) and extracted with dichloromethane. The hexane, dichloromethane, and aqueous
methanol fractions were concentrated. The fractions were tested in the A2780 assay and the
dichloromethane fraction was found to be most active (IC50 4.0 µg/mL). Further separation of
the dichloromethane fraction on a reverse-phase C18 open column using a gradient elution of
50% aqueous methanol to 100% methanol resulted in the collection of four fractions. When
tested in the A2780 assay the second fraction was most active (IC50 3.2 µg/mL). This active
fraction was then subjected to further separation on HPLC using reverse-phase C18 with an
isocratic elution of aqueous methanol (80%). Eight fractions were collected from the HPLC
separation and when tested five fractions were found to be active in the A2780 assay. When the
five active fractions were further investigated three were found to be pure compounds: Fraction
2—casearlucin B (compound E) [5.4 mg; IC50 2.6 µg/mL], Fraction 5—caseamenbrol A
(compound B) [9.2 mg; IC50 1.0 µg/mL], and Fraction 8—rel-18(S),19(R)-diacetoxy-18,19-
epoxy-2(S)-(2ξ-methylbutanoyloxy)-5(R),8(S),9(S),10(R)-cleroda-3,13(16),14-triene (compound
F) [3.0 mg; IC50 1.2 µg/mL]. The other two fractions (Fraction 4—IC50 3.0 µg/mL and Fraction
6—IC50 3.2 µg/mL) required further purification. Fraction 4 was further purified using a normal
phase cyano column on HPLC with an isocratic elution of hexane:isopropanol (95:5). This
resulted in the collection of four fractions. When tested two fractions were active in the A2780

47
assay and upon further investigation these two fractions were found to be pure compounds:
casearlucin A (compound A) [7.6 mg; IC50 2.2 µg/mL] and rel-18(S),19(R)-diacetoxy-18,19-
epoxy-6(R)-hydroxy-2(S)-(2ξ-methylbutanoyloxy)-5(R),8(S),9(S),10(R)-cleroda-3,13(16),14-
triene (compound C) [7.6 mg; IC50 2.0 µg/mL]. Fraction 6 was also further purified using a
normal phase cyano column on HPLC with an isocratic elution of hexane:isopropanol (95:5).
This resulted in the collection of five fractions, two of which were pure. One of the pure
fractions resulted in the additional isolation of novel caseamenbrol A (compound B) [0.5 mg;
IC50 1.0 µg/mL] and the other pure fraction resulted in the isolation of novel casearlucin L
(compound D) [0.9 mg; IC50 0.4 µg/mL].
Casearlucin A (compound A) (2.2): viscous oil; [α]D25.0º +26.3 (c 0.08, CHCl3); [α]D
25.0º +32.5
(c 0.08, MeOH); [literature16: [α]D +10.6 (c 0.52, MeOH); literature22: [α]D
+38.7 (c 3.2,
MeOH)]; UV (MeOH) λmax 223 nm (ε 10250); [literature16: UV (MeOH) λmax 226 nm (ε 12400);
literature22: UV (MeOH) λmax 228 nm (ε 11748)]; IR νmax 3459.0, 2959.6, 1746.8, 1727.6,
1449.6, 1363.4, 1229.1, 965.5 cm-1; [literature16: IR νmax 3455, 2960, 1755, 1735, 1645, 1453,
1128, 1065, 753 cm-1; literature22: IR (neat) νmax 3449, 1754, 1734, 1373, 1229 cm-1]; 1H NMR
data, see Table 2.1; 13C NMR data, see Table 2.1; HRFABMS m/z 541.27765 [M+Na]+ (calcd
for C29H42O8 + Na, 541.27786).
Caseamenbrol A (compound B) (2.3): amorphous solid; [α]D23.5 -56.9 (c 0.197, CHCl3);
[literature24: [α]D25 -8.3 (c 0.38, MeOH)]; UV (MeOH) λmax 229 nm (ε 10789); [literature24: UV
(MeOH) λmax 234 nm (shoulder)]; IR νmax 3496.4, 2968.6, 1756.2, 1727.7, 1454.3, 1368.2,
1224.2, 1176.3, 960.5 cm-1; [literature24: IR (neat) νmax 3433, 2967, 2934, 1735, 1720, 1645
48
cm-1]; 1H NMR data, see Table 2.2; 13C NMR data, see Table 2.3; HRFABMS m/z 541.27783
[M+Na]+ (calcd for C29H42O8 + Na, 541.27786).
rel-18(S),19(R)-diacetoxy-18,19-epoxy-6(R)-hydroxy-2(S)-(2ξ-methylbutanoyloxy)-
5(R),8(S),9(S),10(R)-cleroda-3,13(16),14-triene (compound C) (2.4): viscous oil; [α]D25.0
+14.0 (c 0.129, CHCl3); [literature23: [α]D +13 (c 0.24, CHCl3)]; UV (MeOH) λmax 223 nm (ε
7127); IR νmax 3501.4, 2964.5, 2940.6, 1746.8, 1727.6, 1459.0, 1373.0, 1219.5, 1066.2, 999.0
cm-1; [literature23: IR νmax (KBr) 3300-3695 broad OH, 3008, 2970, 2938, 2879, 1757, 1726,
1639, 1463, 1374, 1227, 1151, 1082, 1053, 979, 945, 601 cm-1]; 1H NMR data, see Table 2.4;
13C NMR data, see Table 2.5; HRFABMS m/z 541.2766 [M+Na]+ (calcd for C29H42O8 + Na,
541.27786).
Casearlucin L (compound D) (2.5): amorphous solid; [α]D23.5 -54.2 (c 0.024, CHCl3); UV
(MeOH) λmax 223 nm (ε 8464); IR νmax 3463.0, 2945.3, 1746.8, 1727.6, 1454.5, 1373.0, 1224.2,
1109.2, 998.9 cm-1; 1H NMR data, see Table 2.6; HRFABMS m/z 541.27386 [M+Na]+ (calcd for
C29H42O8 + Na, 541.27786).
Casearlucin B (compound E) (2.6): viscous oil; [α]D25.0 -54.5 (c 0.123, CHCl3); [α]D
25.0 -25.2 (c
0.123, MeOH); [sample27: [α]D26.0 -27.0 (c 0.063, MeOH)]; UV (MeOH) λmax 223 nm (ε 9700);
[literature16: UV (MeOH) λmax 232 nm (ε 11310)]; IR νmax 2954.9, 1751.5, 1732.6, 1723.0,
1459.0, 1219.5, 1095.0, 1023.1, 888.8 cm-1; [literature16: IR νmax 2956, 1753, 1728, 1723, 1642,
27 Casearlucin B was previously isolated by another group member. A sample of the compound was obtained in
order to measure the optical rotation of casearlucin B as a point of comparison.

49
1451, 1120, 1065, 748 cm-1]; 1H NMR data, see Table 2.7; 13C NMR data, see Table 2.7;
HRFABMS m/z 513.24579 [M+Na]+ (calcd for C27H38O8 + Na, 513.24654).
rel-18(S),19(R)-diacetoxy-18,19-epoxy-2(S)-(2ξ-methylbutanoyloxy)-5(R),8(S),9(S),10(R)-
cleroda-3,13(16),14-triene (compound F) (2.7): viscous oil; [α]D25.0 -5.2 (c 0.058, CHCl3);
[literature23: [α]D -6 (c 0.14, CHCl3)]; UV (MeOH) λmax 222 nm (ε 8067); IR νmax 2959.6,
2921.4, 2854.2, 1751.5, 1727.6, 1459.2, 1373.0, 1224.4, 1056.6, 941.4, 888.8 cm-1; [literature23:
IR νmax (KBr) 2968, 2939, 2878, 1757, 1730, 1692, 1618, 1462, 1375, 1229, 1114, 1067, 1005,
958, 933, 888, 601, 406 cm-1]; 1H NMR data, see Table 2.8; 13C NMR data, see Table 2.8;
HRFABMS m/z 525.28088 [M+Na]+ (calcd for C29H42O7 + Na, 525.28296).
50
III. Conclusion
As part of the continuing work of the International Cooperative Biodiverisity Group
(ICBG) in search of anti-cancer compounds the plant extract from Casearia nigrescens was
found to be cytotoxic in the A2780 human ovarian cancer cell line assay. The crude extract of
Caseaia nigrescens was fractionated and yielded five known compounds (casearlucin A,
caseamenbrol A, rel-18(S),19(R)-diacetoxy-18,19-epoxy-6(R)-hydroxy-2(S)-(2ξ-
methylbutanoyloxy)-5(R),8(S),9(S),10(R)-cleroda-3,13(16),14-triene, casearlucin B, and rel-
18(S),19(R)-diacetoxy-18,19-epoxy-2(S)-(2ξ-methylbutanoyloxy)-5(R),8(S),9(S),10(R)-cleroda-
3,13(16),14-triene) and one new compound (Casearlucin L) that were responsible for the
cytotoxicity of the extract. The structure of these compounds was elucidated using 1D and 2D
NMR techniques.

51
7 6 5 4 3 2 1 PP
1H NMR spectrum of casearlucin A (compound A) in CDCl3.
Appendix

52
180 160 140 120 100 80 60 40 20 PP
13C NMR spectrum of casearlucin A (compound A) in CDCl3.

53
7 6 5 4 3 2 1PPM Direct Dimension
76
54
32
10
PP
M In
dire
ct D
imen
sion
1
NOESY spectrum of casearlucin A (compound A) in CDCl3.

54
7 6 5 4 3 2 1 PP
1H NMR spectrum of caseamenbrol A (compound B) in CDCl3.

55
160 140 120 100 80 60 40 20 PP
13C NMR spectrum of caseamenbrol A (compound B) in CDCl3.
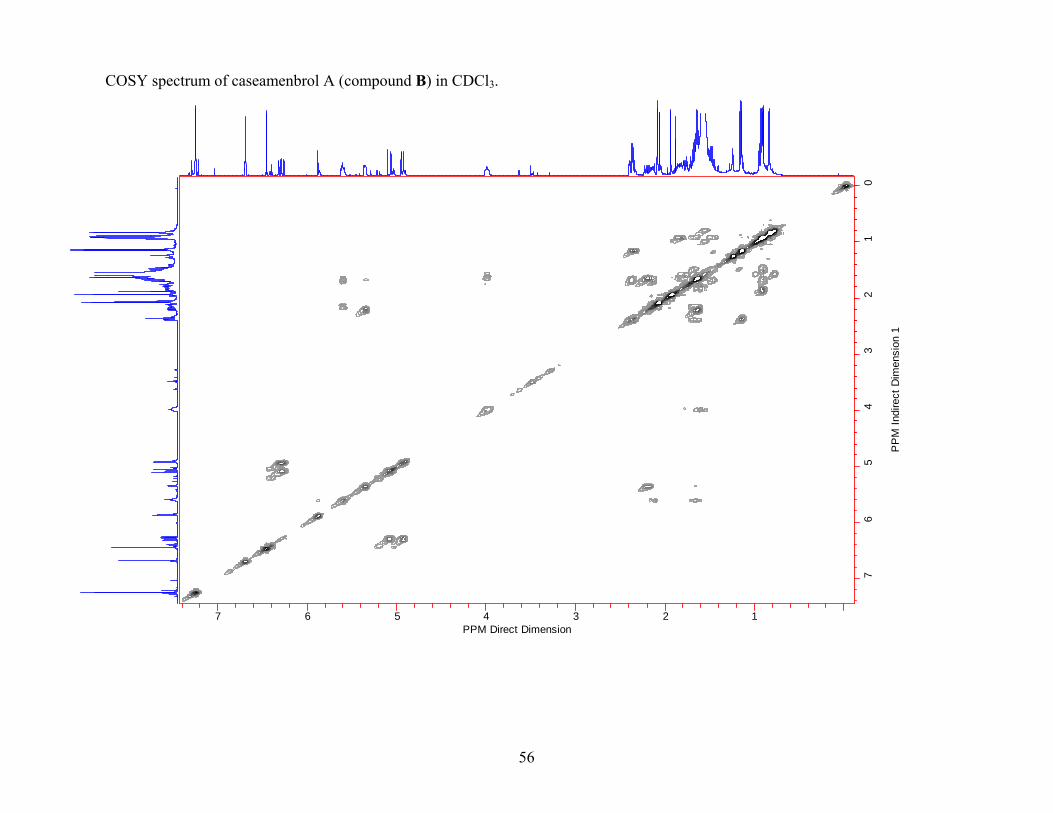
56
7 6 5 4 3 2 1PPM Direct Dimension
76
54
32
10
PP
M In
dire
ct D
imen
sion
1
COSY spectrum of caseamenbrol A (compound B) in CDCl3.

57
6 5 4 3 2 1PPM Direct Dimension
180
160
140
120
100
8060
4020
PP
M In
dire
ct D
imen
sion
1
HMBC spectrum of caseamenbrol A (compound B) in CDCl3.
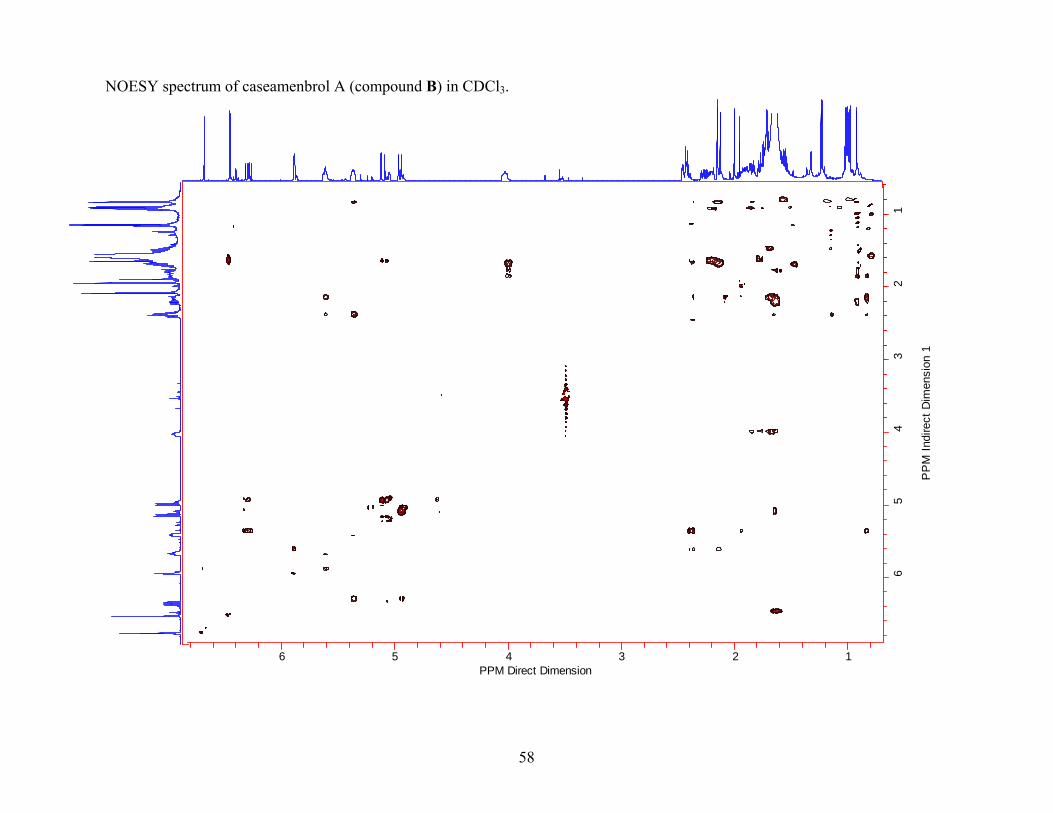
58
6 5 4 3 2 1PPM Direct Dimension
65
43
21
PP
M In
dire
ct D
imen
sion
1
6 5 4 3 2 1PPM Direct Dimension
65
43
21
PP
M In
dire
ct D
imen
sion
1
NOESY spectrum of caseamenbrol A (compound B) in CDCl3.

59
7 6 5 4 3 2 1 PP
1D NOESY spectrum of caseamenbrol A (compound B) in CDCl3.
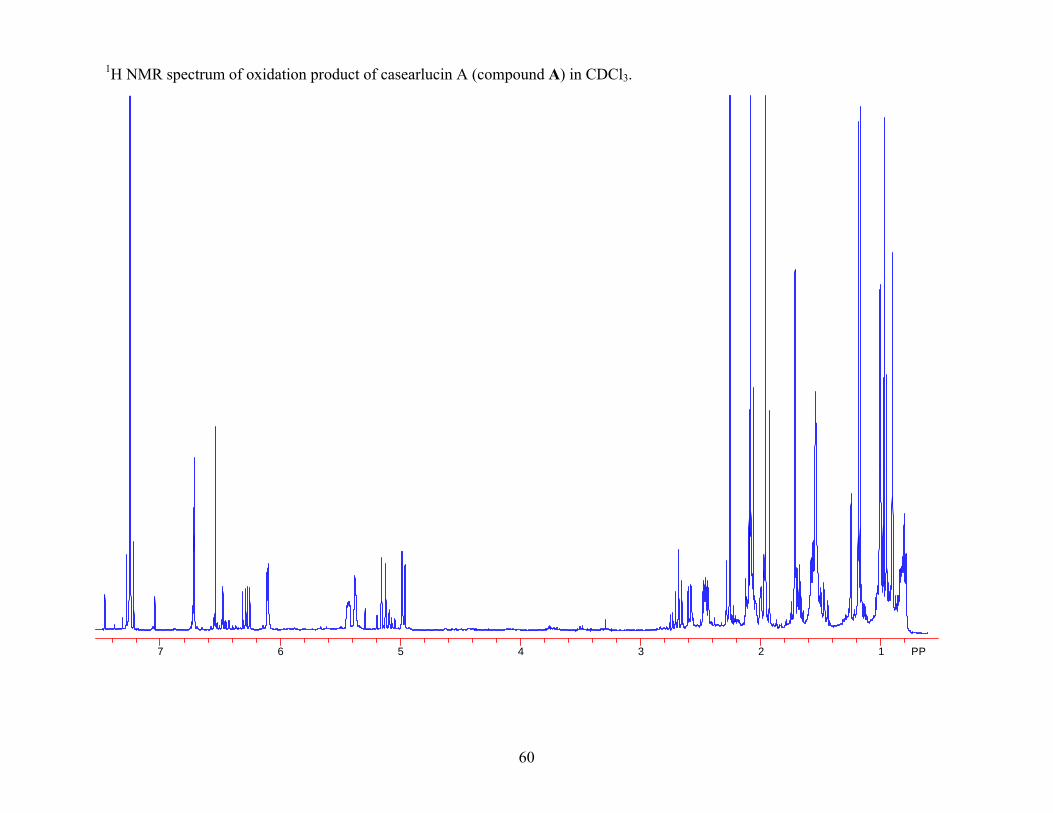
60
7 6 5 4 3 2 1 PP
1H NMR spectrum of oxidation product of casearlucin A (compound A) in CDCl3.
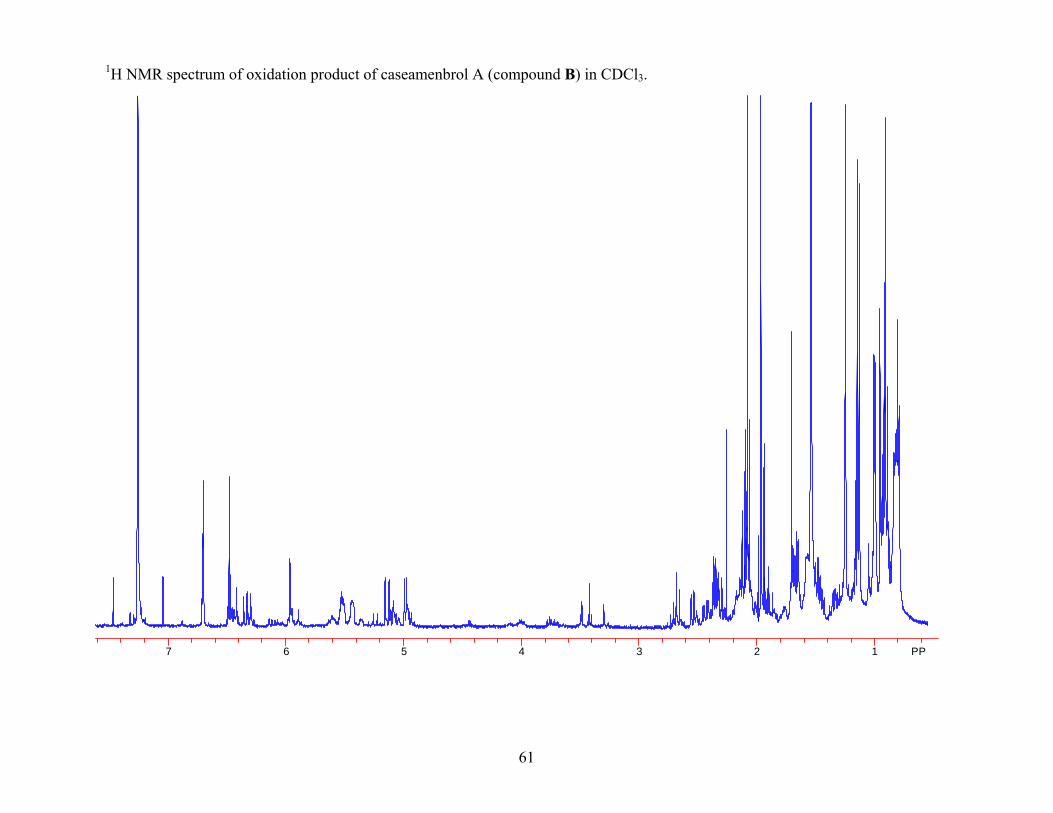
61
7 6 5 4 3 2 1 PP
1H NMR spectrum of oxidation product of caseamenbrol A (compound B) in CDCl3.

62
7 6 5 4 3 2 1 PP
1H NMR spectrum of rel-18(S),19(R)-diacetoxy-18,19-epoxy-6(R)-hydroxy-2(S)-(2ξ-methylbutanoyloxy)- 5(R),8(S),9(S),10(R)-cleroda-3,13(16),14-triene (compound C) in CDCl3.

63
160 140 120 100 80 60 40 20 PP
13C NMR spectrum of rel-18(S),19(R)-diacetoxy-18,19-epoxy-6(R)-hydroxy-2(S)-(2ξ-methylbutanoyloxy)- 5(R),8(S),9(S),10(R)-cleroda-3,13(16),14-triene (compound C) in CDCl3.

64
7 6 5 4 3 2 1 PP
1H NMR spectrum of casearlucin L (compound D) in CDCl3.
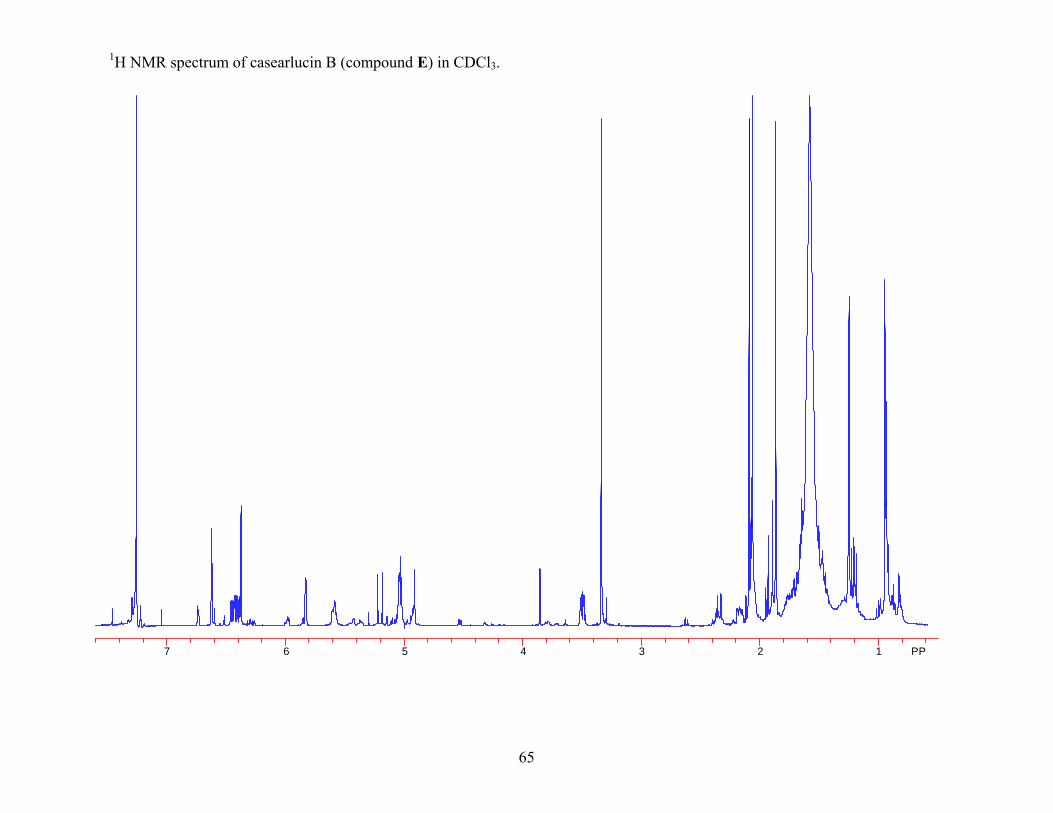
65
7 6 5 4 3 2 1 PP
1H NMR spectrum of casearlucin B (compound E) in CDCl3.

66
160 140 120 100 80 60 40 20 PP
13C NMR spectrum of casearlucin B (compound E) in CDCl3.
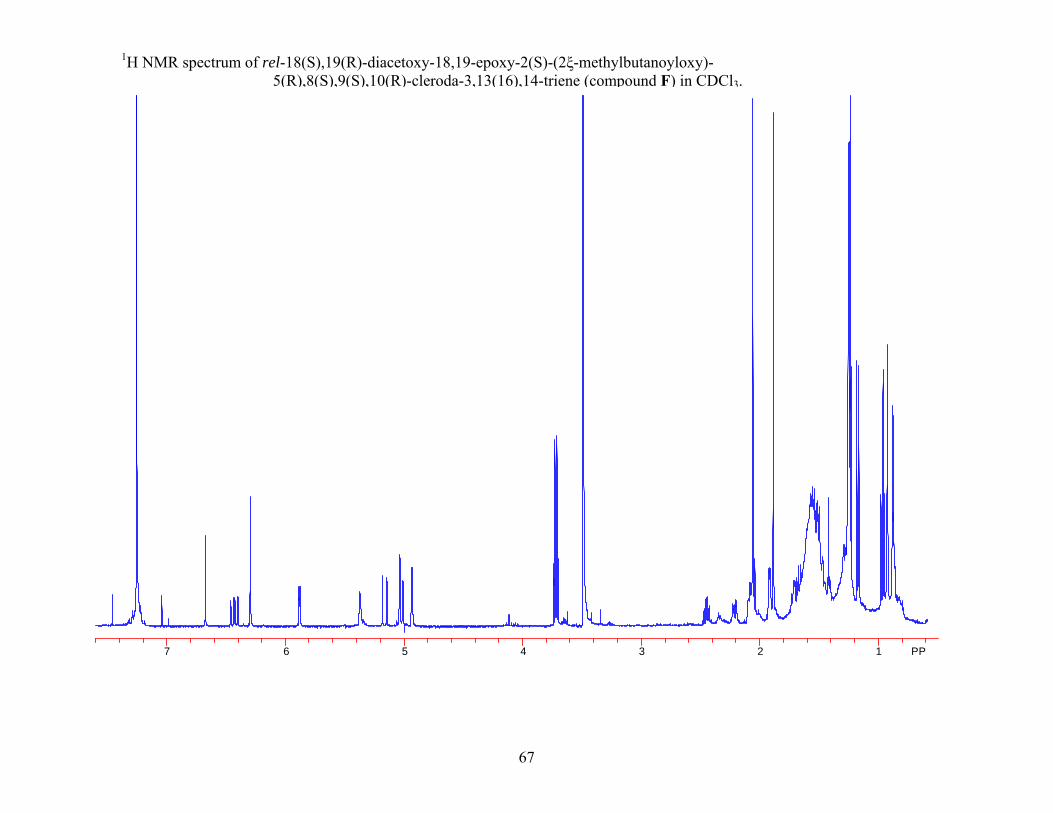
67
7 6 5 4 3 2 1 PP
1H NMR spectrum of rel-18(S),19(R)-diacetoxy-18,19-epoxy-2(S)-(2ξ-methylbutanoyloxy)- 5(R),8(S),9(S),10(R)-cleroda-3,13(16),14-triene (compound F) in CDCl3.

68
180 160 140 120 100 80 60 40 20 PP
13C NMR spectrum of rel-18(S),19(R)-diacetoxy-18,19-epoxy-2(S)-(2ξ-methylbutanoyloxy)- 5(R),8(S),9(S),10(R)-cleroda-3,13(16),14-triene (compound F) in CDCl3.


![Isolation, Purification and Characterization of Glucanase ... · PDF fileIsolation, Purification and Characterization of Glucanase Enzyme from ... Mukesh Srivastava, ... et al. [26]](https://img.pdfslide.net/doc/110x75/5a84639b7f8b9a882e8b7c28/isolation-purification-and-characterization-of-glucanase-purification-and-characterization.jpg)