Embed Size (px)
DESCRIPTION
Isospin dependence of the nuclear phase transition near the critical point. Zhiqiang Chen Institute of Modern Physics (Lanzhou) Chinese Academy of Sciences. IWND09 Shanghai, China, August 23-25, 2009. collaboration. R. Wada 1 , A. Bonasera 1,3,4 , T. Keutgen 5 , K. hagel 1 , - PowerPoint PPT Presentation
Citation preview

Isospin dependence of the nuclear phase transition near the critical point
Zhiqiang ChenInstitute of Modern Physics (Lanzhou)
Chinese Academy of Sciences
IWND09 Shanghai, China, August 23-25, 2009
collaborationR. Wada1, A. Bonasera1,3,4, T. Keutgen5, K. hagel1, M. Huang1,2, J. Wang2, L. Qin1, J. B. Natowitz1,
T. Materna1, S. Kowalski6, P. K. Sahu1 and T. akagawa7
1 Cyclotron Institute, Texas A&M University, College Station, Texas 77843, USA2 Institute of Modern Physics, Chinese Academy of Sciences, Lanzhou 730000,
China 3 Laboratori Nazionali del Sud, INFN, via Santa Sofia, 62, 95123 Catania, Italy4 Libera Universita Kore di Enna, 94100 Enna, Italy 5 Institut de Physique Nuclea´ire and FNRS, Universite Catholique de Louvain, B-
1348 Louvain-la-Neuve, Belgium 6 Institute of Physics, Silesia University, Katowice, Poland 7 Riken, 2-1 Hirosawa, Wako-shi, Saitama, Japan 351-0198

Outline• Introduction
background: Liquid-gas phase transition in nuclear matter
• Isospin dependence of nuclear phase transition
Experimental evidence AMD model calculation
• Summary
Phase transitions and critical phenomenaThe Landau free energy description

Introduction• Phase transitions and critical phenomena
Phase Diagram
Coexistence curves for a typical pure PVT system. Point A is the tripe point and point C is the critical point. The dashed line is an example of fusion curve with negative slope.
Textbook: L. E. REICHL <<A Modern Course in Statistical Physics>> 2nd Edition

Liquid He4
The coexistence curves for He4
Liquid He3
The coexiste nce curves for superfluid phases of He3 when
no magnetic field is applied

Liquid He3-He4 Mixtures
The phase diagram for a liquid He3-He4 mixture plotted as a
function of temperature T and mole fraction x3 of He3
λ-line extended from T=2.19K for x3=0 to about T=1.56K for
x3=0.282. Later experiments extended the λ-line down to
T=0.87K for x3=0.67.

• Landau free energy
kTmHcmbmamHm /61
41
21),( 642
In the late 1930s, Ginzburg and Landau proposed a mean field theory of continuous phase transitions which relates the order parameter to underlying symmetries of the system.
Ψ is Landau free energy, m is order parameter,H is its conjugate variable, a-c are variable parametes.
Textbook: Kerson Huang, <<statistical mechanics>>

Phase diagram of the m6 model
For simplicity we take c to be a positive fixed constant; but a and b are variable parameters.
This is a line of first-order transitions, there are three minima.
3/4 cab
• Phase transition in nuclear matter Recent time a large body of experimental evidence has been interpreted
as demonstrating the occurrence of a phase transition in finite nuclei at temperatures(T) of the order of 10MeV and at densities, ρ,less than half of the normal ground state nuclear density. Even though strong signals for a first and a second-order phase transition have been found.
Remain questions:The Equation of State of Nuclear matter (NEOS) near the critical point.The roles of Coulomb, symmetry, pairing and shell effects.

Isospin dependence of nuclear phase transition
• Our experimentThe experiment was performed at the K-500 superconducting cyclotron facility at Texas A&M University. Quadrant Si+CsI detector telescope, θ = 17.5o ± 2.5o and θ = 22.5o± 2.5o.
IMFs (3≤Z ≤18) typically 6-8 isotopes
I
projectile N/Z target N/Z64Ni 1.28 58Ni 1.0764Zn 1.13 64Ni 1.2870Zn 1.33 112Sn 1.24
124Sn 1.48197Au 1.49232Th 1.58
A. Bonasera, et al., Phys. Rev. Lett. 101, 122702 (2008)

Z=6 Z=12
ZReal
Typical linearized isotope spectra are shown for Z=6 and 12 cases. The number at the top of each peak is the mass number assigned. Linear back ground is assumed from valley to valley for a given Z. Each Gaussian indicates the yield of the isotope above the back ground.

Mass distribution for the 64Ni + 124Sn system at 40 MeV/nucleon for I=0. The line are power law fits with exponents 2.32±0.02 (odd-odd nuclei, dashed line), 3.86±0.04 (even-even nuclei, full line) respectively.
Data analysis
Odd-odd (open symbols) and even-even(closed symbols) different which suggests that pairing is playing a role in the dynamics.

The observance of this power law suggests that the mass distributions may be disscussed in terms of a modified Fisher model.
AeAYAY 0)(
A. Bonasera et al., Rivista Nuovo Cimento, 23(2000) 1.
Where y0 is a normalization constant,τ=2.3 is one critical exponent, β is the inverse temperature, and Δμ=F(I/A) is the difference in chemical potential between neutron and proton, i.e., the Gibbs free energy per particle, F, near the critical point.
AeCYAAYRatio
12)()(
12
3/12
)1(7.0)(25
AZZEAZNEsy c,

Ratio versus symmetry energy for the 64Ni + 64Ni case at 40 MeV/nucleon. The dashed lines are fits using a ground state symmetry energy, and a ‘‘temperature’’of 6 MeV. The I < 0 and I > 0 isotopes are indicated bythe open circles and the full circles, respectively. The I =0isotopes are given by the full square
Ratio vs symmetry energy

AeAYAY 0)(
12)()(
12CYAAYratio
TF
TAratio
)ln(
AZN
AI )(
(1)
(2)
(3)
(4)
New order parameter for IMF isotope distributions
Free energy versus symmetry term
64Ni + 58Ni
64Ni + 232Th

kTmHcmbmamHm /61
41
21),( 642

Free energy versus symmetry term for the case 64Ni+232Th. The full line is a free fit based on Landau O(m6) free energy. The dashed-dotted line is obtained imposing in the fit b = −sqrt(16/3ac) and it is located on a lineof first order phase transition. The dotted line correspondsto b = −sqrt(4ac), i.e. superheating.

• Isospin dependence of the nuclear phase transition
‘‘apparent temperature’’ versus I/A of the compound nuleus.
H/T versus (I/A) of the compound nucleus obtained from the data fit to the Landau free energy,

AMD Calculation
• AMD (Antisymmetrized Molecular Dynamics)Akira Ono (Tohoku University,Japan)AMD-3.4 version,Gogny force, Gogny-AS forceA. Ono, H. Horiuchi, T. Maruyama, and A. Ohnishi, Phys. Rev.Lett. 68, 2898 (1992).A. Ono and H. Horiuchi, Prog. Part. Nucl. Phys. 53, 501 (2004).
• Modified GEMINI model for secondary decay: Discrete levels of the excited states of light fragments with Z≤15 are taken
into account. The Hauser-Feshbach formalism is extended to the particle decay of these
fragments when the excitation energy is below 50 MeV.R. J. Charity et al., Nucl. Phys. A483, 371 (1988).R. Wada et al., Phys. Rev. C 69, 044610 (2004).
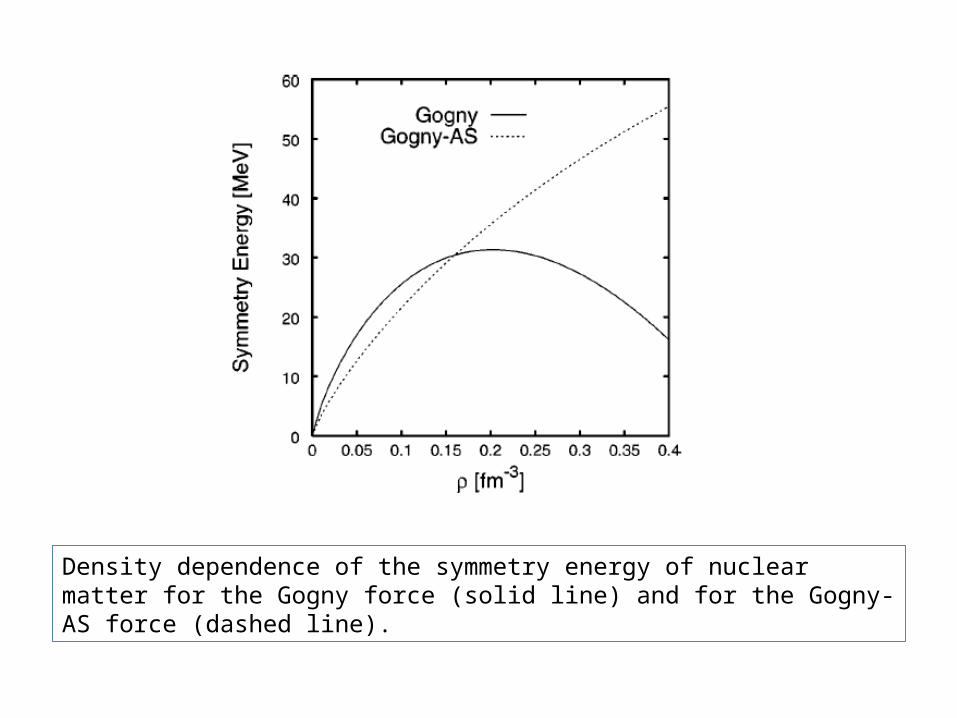
Density dependence of the symmetry energy of nuclear matter for the Gogny force (solid line) and for the Gogny-AS force (dashed line).

F/T vs I/A for 40 AMeV 64Ni + 64Ni
before decay after decay

Summary• Experimental evidence for isospin dependence of the
nuclear phase transition was observed.The properties of the critical point depend on asymmetry of the system.The nuclear phase transition is analogous to the well known superfluid λ transition in He3-He4 mixtures.
• AMD calculation shows that secondary decay effects and a corresponding loss of information on the primary fragmenting system are very important.