Embed Size (px)
Citation preview
1TlrSsrt(lgt
is2
ob2t
si
vnsn
splotmcts
2628 J. Opt. Soc. Am. B/Vol. 27, No. 12 /December 2010 Wasowicz et al.
Isotope shifts of multipole lines of Pb I and Pb II
Tomasz Jaroslaw Wasowicz,1,2 Slawomir Werbowy,1 Jerzy Kwela,1,* and Ryszard Drozdowski1
1Institute of Experimental Physics, University of Gdansk, ul. Wita Stwosza 57, 80-952 Gdansk, Poland2Present address: Department of Physics of Electronic Phenomena, Gdansk University of Technology, ul. Gabriela
Narutowicza 11/12, 80-233 Gdansk, Poland*Corresponding author: [email protected]
Received July 2, 2010; revised September 17, 2010; accepted September 17, 2010;posted October 8, 2010 (Doc. ID 131031); published November 11, 2010
Studies of isotope shifts of three multipole lines between levels of the ground configuration 6s26p2 of Pb I, i.e.:461.9 nm �1S0→ 3P1�, 531.5 nm �1S0→ 3P2� and 733.2 nm �1D2→ 3P1�, as well as 710.2 nm line �6s26p 2P3/2→6s26p 2P1/2� of Pb II are presented. We determined the isotope shifts between four stable isotopes: 204, 206,207, 208. By the use of King plot analysis we were able to separate the mass and the field shifts. We found thatfor the studied lines the contribution of the mass effect to the total isotope shifts is smaller than 6%. © 2010Optical Society of America
OCIS codes: 020.3260.
2Tw
erFZ(Clttav1
hu
b
wtimctsrAsast
. INTRODUCTIONhe 6s26p2 ground configuration of Pb I gives rise to five
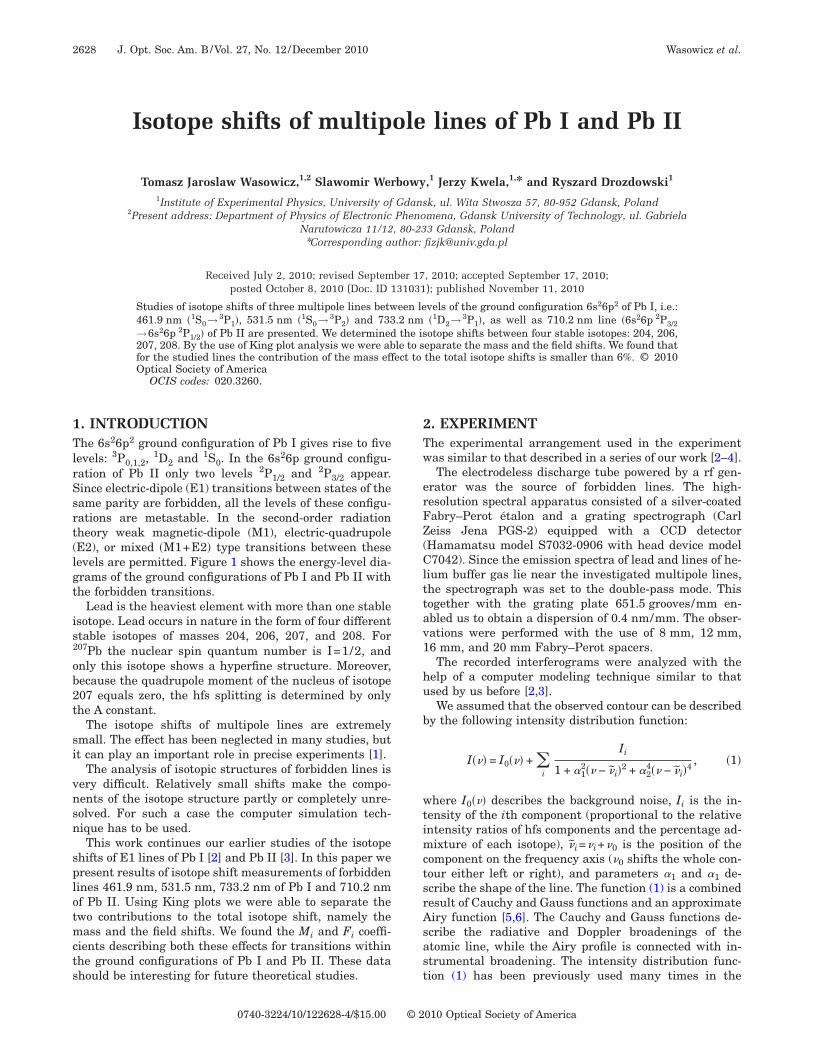
evels: 3P0,1,2, 1D2 and 1S0. In the 6s26p ground configu-ation of Pb II only two levels 2P1/2 and 2P3/2 appear.ince electric-dipole (E1) transitions between states of theame parity are forbidden, all the levels of these configu-ations are metastable. In the second-order radiationheory weak magnetic-dipole (M1), electric-quadrupoleE2), or mixed �M1+E2� type transitions between theseevels are permitted. Figure 1 shows the energy-level dia-rams of the ground configurations of Pb I and Pb II withhe forbidden transitions.
Lead is the heaviest element with more than one stablesotope. Lead occurs in nature in the form of four differenttable isotopes of masses 204, 206, 207, and 208. For07Pb the nuclear spin quantum number is I=1/2, andnly this isotope shows a hyperfine structure. Moreover,ecause the quadrupole moment of the nucleus of isotope07 equals zero, the hfs splitting is determined by onlyhe A constant.
The isotope shifts of multipole lines are extremelymall. The effect has been neglected in many studies, butt can play an important role in precise experiments [1].
The analysis of isotopic structures of forbidden lines isery difficult. Relatively small shifts make the compo-ents of the isotope structure partly or completely unre-olved. For such a case the computer simulation tech-ique has to be used.This work continues our earlier studies of the isotope
hifts of E1 lines of Pb I [2] and Pb II [3]. In this paper weresent results of isotope shift measurements of forbiddenines 461.9 nm, 531.5 nm, 733.2 nm of Pb I and 710.2 nmf Pb II. Using King plots we were able to separate thewo contributions to the total isotope shift, namely theass and the field shifts. We found the Mi and Fi coeffi-
ients describing both these effects for transitions withinhe ground configurations of Pb I and Pb II. These datahould be interesting for future theoretical studies.
0740-3224/10/122628-4/$15.00 © 2
. EXPERIMENThe experimental arrangement used in the experimentas similar to that described in a series of our work [2–4].The electrodeless discharge tube powered by a rf gen-
rator was the source of forbidden lines. The high-esolution spectral apparatus consisted of a silver-coatedabry–Perot étalon and a grating spectrograph (Carleiss Jena PGS-2) equipped with a CCD detectorHamamatsu model S7032-0906 with head device model7042). Since the emission spectra of lead and lines of he-
ium buffer gas lie near the investigated multipole lines,he spectrograph was set to the double-pass mode. Thisogether with the grating plate 651.5 grooves/mm en-bled us to obtain a dispersion of 0.4 nm/mm. The obser-ations were performed with the use of 8 mm, 12 mm,6 mm, and 20 mm Fabry–Perot spacers.The recorded interferograms were analyzed with the
elp of a computer modeling technique similar to thatsed by us before [2,3].We assumed that the observed contour can be described
y the following intensity distribution function:
I��� = I0��� + �i
Ii
1 + �12�� − �̃i�2 + �2
4�� − �̃i�4, �1�
here I0��� describes the background noise, Ii is the in-ensity of the ith component (proportional to the relativentensity ratios of hfs components and the percentage ad-
ixture of each isotope), �̃i=�i+�0 is the position of theomponent on the frequency axis (�0 shifts the whole con-our either left or right), and parameters �1 and �1 de-cribe the shape of the line. The function (1) is a combinedesult of Cauchy and Gauss functions and an approximateiry function [5,6]. The Cauchy and Gauss functions de-cribe the radiative and Doppler broadenings of thetomic line, while the Airy profile is connected with in-trumental broadening. The intensity distribution func-ion (1) has been previously used many times in the
010 Optical Society of America
alsptpf[
3AIp�→→4c
ses5t
srllrm
st7top=tT=us
at
Paw
ltt
Fa
FcFtc
FcFtc
Wasowicz et al. Vol. 27, No. 12 /December 2010 /J. Opt. Soc. Am. B 2629
nalysis of spectra of heavy atoms, e.g., [7–9]. Finally, theeast-square-fitting procedure was used to match theimulated contour to the experimental one. In the com-uter simulations the hfs constants and theoretical rela-ive intensity ratios of hfs components were used as fixedarameters. In the analysis we used experimental resultsrom the measurements of hfs of 207Pb obtained in10–12].
. RESULTS AND DISCUSSION. Isotope Shift Study
n this experiment we measured isotope shifts of multi-ole lines 461.9 nm �6s26p2 1S0→6s26p2 3P1�, 531.5 nm6s26p2 1S0→6s26p2 3P2�, 733.2 nm �6s26p2 1D2
6s26p2 3P1� of Pb I and 710.2 nm �6s26p 2P3/26s26p 2P1/2� of Pb II. An attempt was made to detect the
66 nm �6s26p2 1D2→6s26p2 3P0� transition; however,areful search led to negative results.
The percentage abundance of lead isotopes in theample used in the experiment was determined in ourarlier studies [2]. The isotopic composition of the leadample was the following: 1.4(0.2), 26.0(2.6), 16.0(2.1) and6.6(3.0)% for 204, 206, 207, and 208 isotopes, respec-ively.
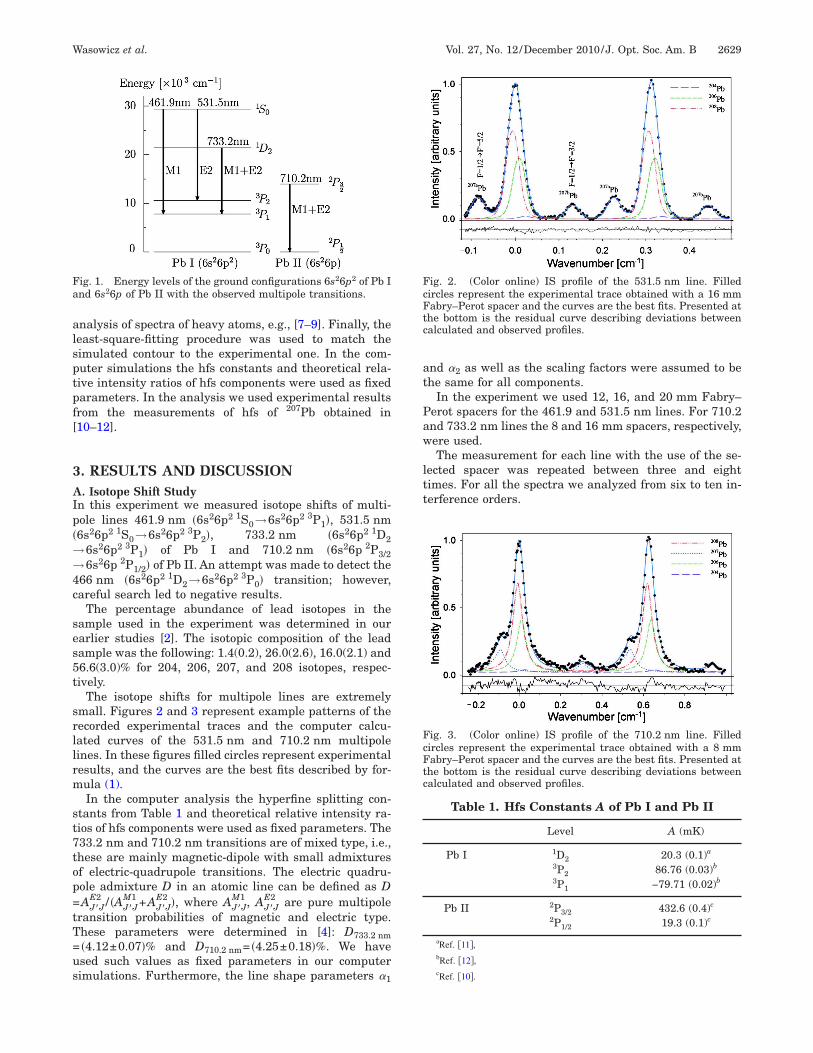
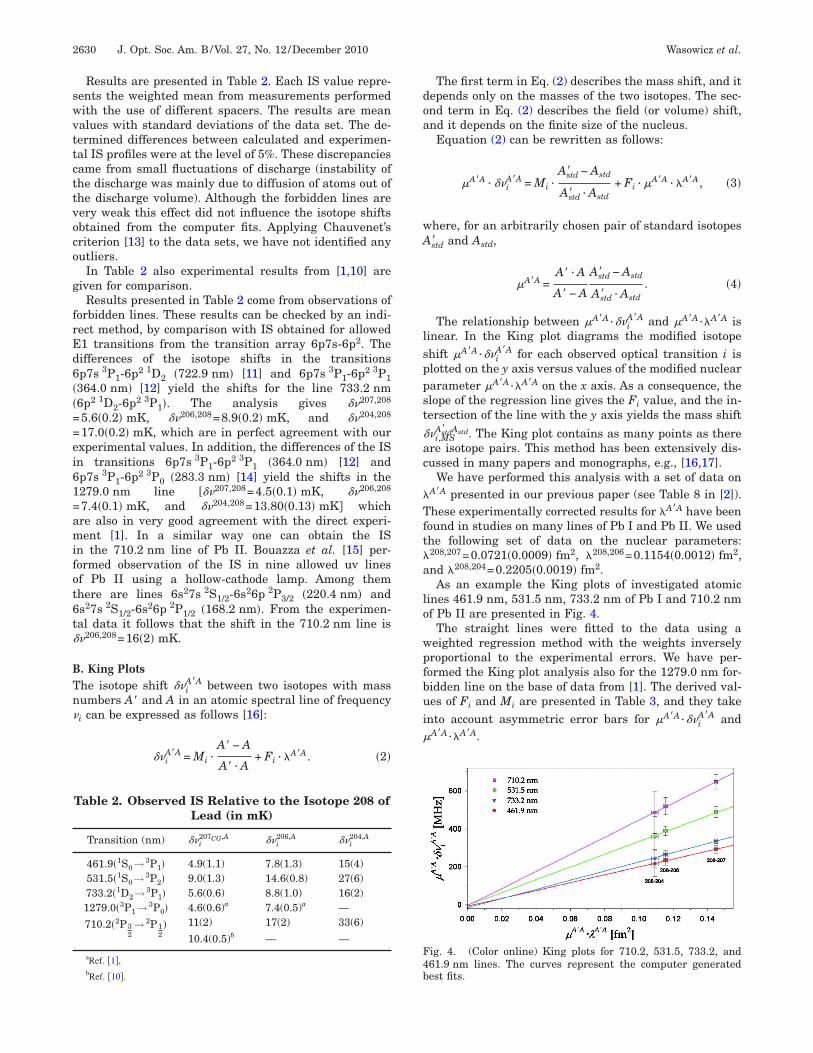
The isotope shifts for multipole lines are extremelymall. Figures 2 and 3 represent example patterns of theecorded experimental traces and the computer calcu-ated curves of the 531.5 nm and 710.2 nm multipoleines. In these figures filled circles represent experimentalesults, and the curves are the best fits described by for-ula (1).In the computer analysis the hyperfine splitting con-
tants from Table 1 and theoretical relative intensity ra-ios of hfs components were used as fixed parameters. The33.2 nm and 710.2 nm transitions are of mixed type, i.e.,hese are mainly magnetic-dipole with small admixturesf electric-quadrupole transitions. The electric quadru-ole admixture D in an atomic line can be defined as DAJ�J
E2 / �AJ�JM1 +AJ�J
E2 �, where AJ�JM1 , AJ�J
E2 are pure multipoleransition probabilities of magnetic and electric type.hese parameters were determined in [4]: D733.2 nm�4.12±0.07�% and D710.2 nm= �4.25±0.18�%. We havesed such values as fixed parameters in our computerimulations. Furthermore, the line shape parameters �
ig. 1. Energy levels of the ground configurations 6s26p2 of Pb Ind 6s26p of Pb II with the observed multipole transitions.
1
nd �2 as well as the scaling factors were assumed to behe same for all components.
In the experiment we used 12, 16, and 20 mm Fabry–erot spacers for the 461.9 and 531.5 nm lines. For 710.2nd 733.2 nm lines the 8 and 16 mm spacers, respectively,ere used.The measurement for each line with the use of the se-
ected spacer was repeated between three and eightimes. For all the spectra we analyzed from six to ten in-erference orders.
ig. 2. (Color online) IS profile of the 531.5 nm line. Filledircles represent the experimental trace obtained with a 16 mmabry–Perot spacer and the curves are the best fits. Presented athe bottom is the residual curve describing deviations betweenalculated and observed profiles.
ig. 3. (Color online) IS profile of the 710.2 nm line. Filledircles represent the experimental trace obtained with a 8 mmabry–Perot spacer and the curves are the best fits. Presented athe bottom is the residual curve describing deviations betweenalculated and observed profiles.
Table 1. Hfs Constants A of Pb I and Pb II
Level A (mK)
Pb I 1D2 20.3 (0.1)a
3P2 86.76 (0.03)b
3P1 −79.71 (0.02)b
Pb II 2P3/2 432.6 (0.4)c
2P1/2 19.3 (0.1)c
aRef. �11�,bRef. �12�,cRef. �10�.
swvttcttvoco
g
frEd6��==ei61=amifot6t�
BTn�
doa
wA
lsppst
�ac
�
Tft�a
lo
wpfbui�
F4b
2630 J. Opt. Soc. Am. B/Vol. 27, No. 12 /December 2010 Wasowicz et al.
Results are presented in Table 2. Each IS value repre-ents the weighted mean from measurements performedith the use of different spacers. The results are meanalues with standard deviations of the data set. The de-ermined differences between calculated and experimen-al IS profiles were at the level of 5%. These discrepanciesame from small fluctuations of discharge (instability ofhe discharge was mainly due to diffusion of atoms out ofhe discharge volume). Although the forbidden lines areery weak this effect did not influence the isotope shiftsbtained from the computer fits. Applying Chauvenet’sriterion [13] to the data sets, we have not identified anyutliers.
In Table 2 also experimental results from [1,10] areiven for comparison.
Results presented in Table 2 come from observations oforbidden lines. These results can be checked by an indi-ect method, by comparison with IS obtained for allowed1 transitions from the transition array 6p7s-6p2. Theifferences of the isotope shifts in the transitionsp7s 3P1-6p2 1D2 �722.9 nm� [11] and 6p7s 3P1-6p2 3P1364.0 nm� [12] yield the shifts for the line 733.2 nm6p2 1D2-6p2 3P1�. The analysis gives ��207,208
5.6�0.2� mK, ��206,208=8.9�0.2� mK, and ��204,208
17.0�0.2� mK, which are in perfect agreement with ourxperimental values. In addition, the differences of the ISn transitions 6p7s 3P1-6p2 3P1 �364.0 nm� [12] andp7s 3P1-6p2 3P0 �283.3 nm� [14] yield the shifts in the279.0 nm line [��207,208=4.5�0.1� mK, ��206,208
7.4�0.1� mK, and ��204,208=13.80�0.13� mK� whichre also in very good agreement with the direct experi-ent [1]. In a similar way one can obtain the IS
n the 710.2 nm line of Pb II. Bouazza et al. [15] per-ormed observation of the IS in nine allowed uv linesf Pb II using a hollow-cathode lamp. Among themhere are lines 6s27s 2S1/2-6s26p 2P3/2 �220.4 nm� ands27s 2S1/2-6s26p 2P1/2 �168.2 nm�. From the experimen-al data it follows that the shift in the 710.2 nm line is�206,208=16�2� mK.
. King Plotshe isotope shift ��i
A�A between two isotopes with massumbers A� and A in an atomic spectral line of frequencyi can be expressed as follows [16]:
��iA�A = Mi ·
A� − A
A� · A+ Fi · �A�A. �2�
Table 2. Observed IS Relative to the Isotope 208 ofLead (in mK)
Transition (nm) ��i207CG,A ��i
206,A ��i204,A
461.9�1S0→ 3P1� 4.9(1.1) 7.8(1.3) 15(4)531.5�1S0→ 3P2� 9.0(1.3) 14.6(0.8) 27(6)733.2�1D2→ 3P1� 5.6(0.6) 8.8(1.0) 16(2)1279.0�3P1→ 3P0� 4.6(0.6)a 7.4(0.5)a —
710.2�2P32→ 2P1
2� 11(2) 17(2) 33(6)
10.4(0.5)b — —
aRef. �1�,bRef. �10�.
The first term in Eq. (2) describes the mass shift, and itepends only on the masses of the two isotopes. The sec-nd term in Eq. (2) describes the field (or volume) shift,nd it depends on the finite size of the nucleus.Equation (2) can be rewritten as follows:
�A�A · ��iA�A = Mi ·
Astd� − Astd
Astd� · Astd+ Fi · �A�A · �A�A, �3�
here, for an arbitrarily chosen pair of standard isotopes
std� and Astd,
�A�A =A� · A
A� − A
Astd� − Astd
Astd� · Astd. �4�
The relationship between �A�A ·��iA�A and �A�A ·�A�A is
inear. In the King plot diagrams the modified isotopehift �A�A ·��i
A�A for each observed optical transition i islotted on the y axis versus values of the modified nucleararameter �A�A ·�A�A on the x axis. As a consequence, thelope of the regression line gives the Fi value, and the in-ersection of the line with the y axis yields the mass shift
�i,MSAstd� Astd. The King plot contains as many points as there
re isotope pairs. This method has been extensively dis-ussed in many papers and monographs, e.g., [16,17].
We have performed this analysis with a set of data onA�A presented in our previous paper (see Table 8 in [2]).hese experimentally corrected results for �A�A have been
ound in studies on many lines of Pb I and Pb II. We usedhe following set of data on the nuclear parameters:208,207=0.0721�0.0009� fm2, �208,206=0.1154�0.0012� fm2,nd �208,204=0.2205�0.0019� fm2.As an example the King plots of investigated atomic
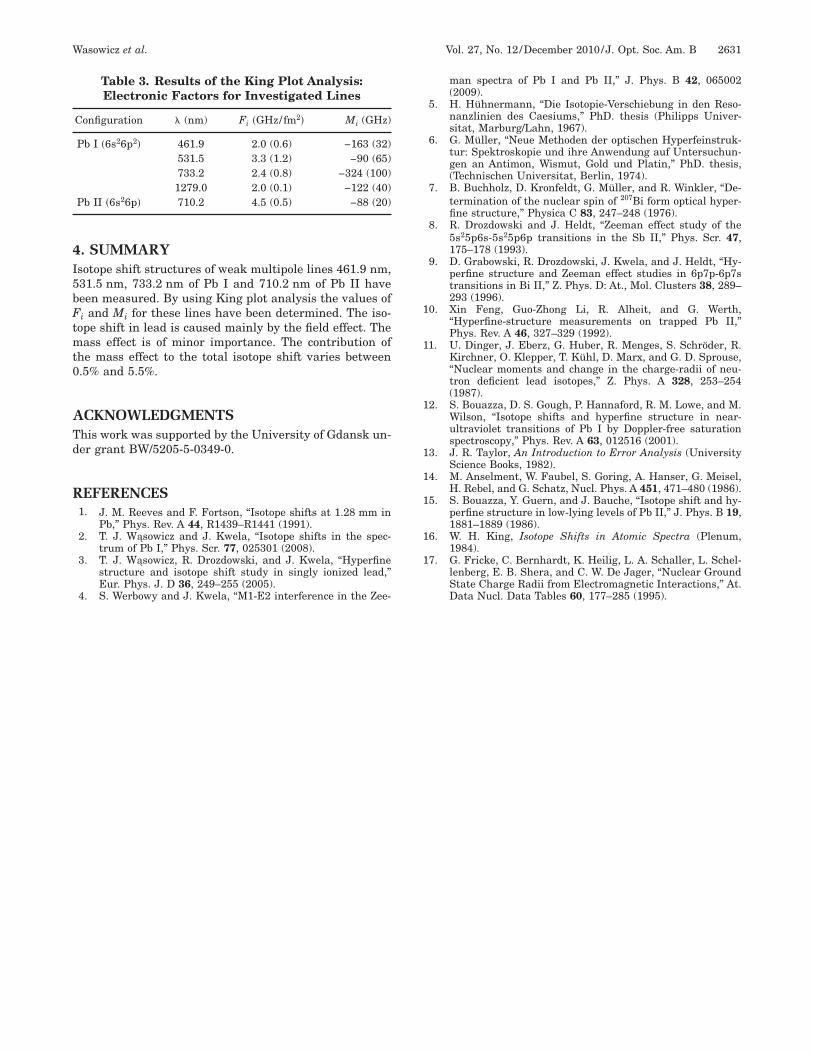
ines 461.9 nm, 531.5 nm, 733.2 nm of Pb I and 710.2 nmf Pb II are presented in Fig. 4.
The straight lines were fitted to the data using aeighted regression method with the weights inverselyroportional to the experimental errors. We have per-ormed the King plot analysis also for the 1279.0 nm for-idden line on the base of data from [1]. The derived val-es of Fi and Mi are presented in Table 3, and they take
nto account asymmetric error bars for �A�A ·��iA�A and
A�A ·�A�A.
ig. 4. (Color online) King plots for 710.2, 531.5, 733.2, and61.9 nm lines. The curves represent the computer generatedest fits.
4I5bFtmt0
ATd
R
1
1
1
1
1
1
1
1
Wasowicz et al. Vol. 27, No. 12 /December 2010 /J. Opt. Soc. Am. B 2631
. SUMMARYsotope shift structures of weak multipole lines 461.9 nm,31.5 nm, 733.2 nm of Pb I and 710.2 nm of Pb II haveeen measured. By using King plot analysis the values ofi and Mi for these lines have been determined. The iso-
ope shift in lead is caused mainly by the field effect. Theass effect is of minor importance. The contribution of
he mass effect to the total isotope shift varies between.5% and 5.5%.
CKNOWLEDGMENTShis work was supported by the University of Gdansk un-er grant BW/5205-5-0349-0.
EFERENCES1. J. M. Reeves and F. Fortson, “Isotope shifts at 1.28 mm in
Pb,” Phys. Rev. A 44, R1439–R1441 (1991).2. T. J. Wąsowicz and J. Kwela, “Isotope shifts in the spec-
trum of Pb I,” Phys. Scr. 77, 025301 (2008).3. T. J. Wąsowicz, R. Drozdowski, and J. Kwela, “Hyperfine
structure and isotope shift study in singly ionized lead,”Eur. Phys. J. D 36, 249–255 (2005).
4. S. Werbowy and J. Kwela, “M1-E2 interference in the Zee-
Table 3. Results of the King Plot Analysis:Electronic Factors for Investigated Lines
Configuration � (nm) Fi �GHz/fm2� Mi (GHz)
Pb I �6s26p2� 461.9 2.0 (0.6) −163 (32)531.5 3.3 (1.2) −90 (65)733.2 2.4 (0.8) −324 (100)1279.0 2.0 (0.1) −122 (40)
Pb II �6s26p� 710.2 4.5 (0.5) −88 (20)
man spectra of Pb I and Pb II,” J. Phys. B 42, 065002(2009).
5. H. Hühnermann, “Die Isotopie-Verschiebung in den Reso-nanzlinien des Caesiums,” PhD. thesis (Philipps Univer-sitat, Marburg/Lahn, 1967).
6. G. Müller, “Neue Methoden der optischen Hyperfeinstruk-tur: Spektroskopie und ihre Anwendung auf Untersuchun-gen an Antimon, Wismut, Gold und Platin,” PhD. thesis,(Technischen Universitat, Berlin, 1974).
7. B. Buchholz, D. Kronfeldt, G. Müller, and R. Winkler, “De-termination of the nuclear spin of 207Bi form optical hyper-fine structure,” Physica C 83, 247–248 (1976).
8. R. Drozdowski and J. Heldt, “Zeeman effect study of the5s25p6s-5s25p6p transitions in the Sb II,” Phys. Scr. 47,175–178 (1993).
9. D. Grabowski, R. Drozdowski, J. Kwela, and J. Heldt, “Hy-perfine structure and Zeeman effect studies in 6p7p-6p7stransitions in Bi II,” Z. Phys. D: At., Mol. Clusters 38, 289–293 (1996).
0. Xin Feng, Guo-Zhong Li, R. Alheit, and G. Werth,“Hyperfine-structure measurements on trapped Pb II,”Phys. Rev. A 46, 327–329 (1992).
1. U. Dinger, J. Eberz, G. Huber, R. Menges, S. Schröder, R.Kirchner, O. Klepper, T. Kühl, D. Marx, and G. D. Sprouse,“Nuclear moments and change in the charge-radii of neu-tron deficient lead isotopes,” Z. Phys. A 328, 253–254(1987).
2. S. Bouazza, D. S. Gough, P. Hannaford, R. M. Lowe, and M.Wilson, “Isotope shifts and hyperfine structure in near-ultraviolet transitions of Pb I by Doppler-free saturationspectroscopy,” Phys. Rev. A 63, 012516 (2001).
3. J. R. Taylor, An Introduction to Error Analysis (UniversityScience Books, 1982).
4. M. Anselment, W. Faubel, S. Goring, A. Hanser, G. Meisel,H. Rebel, and G. Schatz, Nucl. Phys. A 451, 471–480 (1986).
5. S. Bouazza, Y. Guern, and J. Bauche, “Isotope shift and hy-perfine structure in low-lying levels of Pb II,” J. Phys. B 19,1881–1889 (1986).
6. W. H. King, Isotope Shifts in Atomic Spectra (Plenum,1984).
7. G. Fricke, C. Bernhardt, K. Heilig, L. A. Schaller, L. Schel-lenberg, E. B. Shera, and C. W. De Jager, “Nuclear GroundState Charge Radii from Electromagnetic Interactions,” At.Data Nucl. Data Tables 60, 177–285 (1995).