Embed Size (px)
Citation preview

Isotopic evidence for processes of sulfur retention/release in
13 forested catchments spanning a strong pollution gradient
(Czech Republic, central Europe)
Martin NovakDepartment of Geochemistry, Czech Geological Survey, Prague, Czech Republic
James W. KirchnerDepartment of Earth and Planetary Science, University of California, Berkeley, California, USA
Daniela Fottova, Eva Pr�echova, Iva J�ackova, Pavel Kram, and Jakub Hru�skaDepartment of Geochemistry, Czech Geological Survey, Prague, Czech Republic
Received 25 October 2004; revised 1 July 2005; accepted 16 August 2005; published 10 November 2005.
[1] Sulfur isotope systematics were studied in 13 small catchments in the CzechRepublic, similar in topography (V-shaped valley) and vegetation (Norway spruce). Thesites differed in elevation, rainfall, bedrock, soil type and S pollution. Across the sites,d34S values decreased in the order: bulk deposition > runoff > spruce throughfall >C-horizon soil > A/B-horizon soil > O-horizon soil > bedrock (means of 5.5, 4.8, 4.7, 4.6,4.2, 3.1 and 1.5%, respectively). Some of the sites had a net export of S, whileothers accumulated S. Sites exporting S were located in the polluted north whereatmospheric S input started to decrease in 1987. Sites retaining S were located in therelatively unpolluted south. Sulfur isotope composition of runoff depended on whetherthe catchment accumulated or released S. Sites releasing S had runoff d34S valueslower than deposition. In contrast, sites retaining S had runoff d34S values higher thandeposition. Across the sites, the d34S values of runoff were not correlated with d34S valuesof bedrock, indicating that the contribution of bedrock to S in runoff was negligible.The d34S values of runoff were strongly positively correlated with the d34S values of soil.Sulfur present in the C-horizon of soils was mainly derived from atmospheric deposition,not bedrock. Sulfur isotope mass balances were constructed for each catchment,making it possible to quantify the difference between d34S values of the within-catchmentsource/sink of S and runoff S. Sulfur isotope mass balances indicated that the sink for theretained S at unpolluted sites and the source of the released S at polluted sites wereisotopically fractionated by the same amount relative to runoff S. Inorganic and organicprocesses were considered as possible causes for this observation. Biological S cyclinginvolves a variety of reactions, some of which fractionate S isotopes. In contrast,adsorption/desorption of inorganic sulfate in soil and weathering of S-containing mineralsdo not fractionate S isotopes. Therefore the within-catchment source/sink of S mustbe largely a result of biological S cycling. Organic S cycling played an important roleover a wide range of atmospheric S inputs from 13 to 130 kg S ha�1 yr�1.
Citation: Novak, M., J. W. Kirchner, D. Fottova, E. Pr�echova, I. J�ackova, P. Kram, and J. Hru�ska (2005), Isotopic evidence for
processes of sulfur retention/release in 13 forested catchments spanning a strong pollution gradient (Czech Republic, central Europe),
Global Biogeochem. Cycles, 19, GB4012, doi:10.1029/2004GB002396.
1. Introduction
[2] The Black Triangle, comprising the northern CzechRepublic, southeastern Germany and southwestern Poland,has been one of the most polluted industrial regions of theworld [Cerny and Paces, 1995; Wesselink et al., 1995;
Alewell et al., 1997; Vile et al., 2000; Jedrysek et al.,2002; Knoller et al., 2004]. Between 1975 and 1995, sulfuremissions from burning of high-sulfur coal in two dozenpower plants contributed to massive spruce die-back on anarea of more than 1000 km2 [Innes, 1993; Hunova et al.,2004; B. Moldan, unpublished data, 2004]. Since 1987, i.e.,in less than 20 years, industry restructuring and installationof scrubbers in power plants have reduced industrial Semission rates by more than 90% [Dostalova et al.,
GLOBAL BIOGEOCHEMICAL CYCLES, VOL. 19, GB4012, doi:10.1029/2004GB002396, 2005
Copyright 2005 by the American Geophysical Union.0886-6236/05/2004GB002396$12.00
GB4012 1 of 14

2004]; by comparison, elsewhere in Europe and NorthernAmerica, industrial emission rates have decreased by 40 to60% over the past 30 years [Ambuster et al., 2003; Likens etal., 2002; Eimers and Dillon, 2002; Moldan et al., 2004]. Inaddition to the temporal gradient of easing pollution, asizable geographical S pollution gradient has been reportedin Central Europe [Fottova, 2003]. In 1987, a record highannual atmospheric S deposition of 130 kg ha�1 yr�1
occurred in the northern Czech Republic [Cerny, 1993],while ecosystems in the Southern Czech Republic, just150 km southward, received only ca. 13 kg S ha�1 yr�1,i.e., 10 times less [Santroch et al., 1988]. Here we discussthe fate of anthropogenic S in 13 forested catchments in theCzech Republic spanning this sharp deposition gradient.[3] Currently, many catchments in the industrial world are
losing more S via stream water than they are receiving fromatmospheric S inputs [Mitchell et al., 2001; Hruska andKram, 2003; Schulz et al., 2004; Novak et al., 2005a]. Netsulfate export from catchments delays the recovery of acid-
impacted surface waters [Prechtel et al., 2001; Prietzel etal., 2001]. The excess S exported from forested catchmentsmay originate from desorption of soil sulfate, mineralweathering or mineralization of organic S [Driscoll et al.,1998]. If the excess S in stream discharge is derived frombedrock weathering, it will persist for the indefinite future,but if it is derived from release of stored pollutant S, it willgradually decline as the S stored in the catchment is slowlydepleted. A S isotope mass balance can constrain the originof the excess S in stream water, assuming that the mixingend-members are isotopically distinct [Finley et al., 1994;Novak et al., 1995; Mayer et al., 1995, 2001; Alewell andGiesemann, 1996; Morth et al., 1999]. We measured Sfluxes and isotope compositions of bulk deposition, spruce/beech canopy throughfall, and stream discharge over a12-month period in 13 small catchments. The d34S valuesof three main soil horizons and fresh bedrock in eachcatchment were known. Our first objective was to evaluatewhether S fluxes and S pools within the catchments hadcontrasting isotope compositions. Our second objective wasto construct sulfur mass balances and sulfur isotope massbalances for individual catchments for the hydrological year1997. We used these mass balances to study the relationshipbetween net retention/release of S and the pollution level.We further investigated whether S isotope composition ofthe discharge depended on net accumulation/release of Sfrom the catchment. Using S isotopes, we identified the sinkfor the retained S and the source of the released S atindividual sites. The relationship between the S isotopesystematics and S mass balances across our 13 catchmentsallowed us to test whether the sinks for the retained S werethe same as the sources of the released S.
2. Material and Methods
2.1. Study Sites
[4] Nine of the 13 study sites (JEZ, UHL, MOD, UDL,CER, SPA, LIZ, LYS and PLB) are located in the moun-tainous border regions of the Czech Republic. Four sites(LES, GEM, SAL and POM) are located in a highlandsoutheast of Prague (Figure 1) [Fottova, 2003]. The sites aresimilar in topography (V-shaped valleys) and, for the past200 years, also in vegetation (predominantly Norwayspruce, Picea abies). Elevation, aspect, annual precipitation,bedrock, soil type and the stage of pedogenesis all varyamong the sites (Table 1). Between 1975 and 1995, mostmature spruce stands at JEZ, UDL and UHL, situated in theindustrial north, died back owing to atmospheric pollutionand were harvested (Table 2). By 1997, the clearings beganto be regenerated by European birch (Betula verrucosa) andmountain ash (Sorbus aucuparia) [Peters et al., 1999].Intact Norway spruce stands covering 100% of the catch-ment’s surface area survived at SAL and PLB. At LES andJEZ, undamaged European beech (Fagus sylvatica) standscovered a significant portion of the catchment’s area (42 and29%, respectively), mostly at lower elevations. At theremaining nine sites, more than 60% of the area was stillcovered by closed-canopy spruce stands (Table 2). Anthro-pogenic S deposition greatly exceeded other atmosphericsources; the contribution of sea-spray derived S to total
Figure 1. Spatial variability of sulfur bulk deposition andspruce throughfall fluxes (kg S ha�1 yr�1, ±1 standarderror) for the 13 study catchments. Shading indicatesapproximate regions of average S deposition <15, 15–25,and >25 kg S ha�1 yr�1 (white, light gray, and dark gray,respectively), according to Fiala et al. [1998]. Both bulkdeposition and spruce throughfall are highest in the north(JEZ, UHL and UDL) and lowest in southwest (LYS, PLB,LIZ, SPA, SAL, GEM and LES). LYS and PLB share thesame bulk deposition collector.
GB4012 NOVAK ET AL.: S ISOTOPES IN 13 CATCHMENTS
2 of 14
GB4012

atmospheric S was between 2 and 14%, and the natural Sdeposition in pre-industrial times did not exceed 2 kg ha�1
yr�1 [Novak et al., 2001b]. In 1997, mean water fluxes instreams draining the catchments ranged between 0.5 L s�1
(GEM), and 136 L s�1 (MOD; mean of 30 L s�1 across thesites). On the basis of d18O values of water inputs andoutputs, the mean residence time of atmospheric water inthe catchments was between 0.5 and 1.5 years [Buzek et al.,1991, 1995]. The contribution of the rainfall component tostream runoff was about 20% and soil water contributed onaverage 40%, while the rest of stream runoff was formed bygroundwater (data for LYS and JEZ). Detailed descriptionsand/or hydrochemical mass balances for individual siteswere given by Paces [1985], Kram and Hruska [1994],Novak et al. [1995], Cerny [1995], Kram et al. [1997],Fottova and Skorepova [1998], Hruska et al. [2002],Fottova [2003], and Shanley et al. [2004]. Stable S isotopesystematics were previously reported by Novak et al. [1995,1996, 2000, 2001a], and Groscheova et al. [1998]. Soilincubation experiments using the artificial radioisotope 35Swere performed by Novak and Prechova [1995] and Novaket al. [2004]. Sulfate oxygen isotope data were reported byNovak et al. [2005b].
2.2. Sampling
[5] Each of the 13 catchments were monitored monthlybeginning 1 November 1996 and ending 31 October 1997(hydrological year 1997). Cumulative samples of bulkdeposition (13 sites), spruce canopy throughfall (13 sites)and beech canopy throughfall (two sites, JEZ and LES)were complemented by monthly grab samples of runoff(13 sites). Two samplers installed 5 m apart in a clearingwere used to sample bulk (i.e., open canopy) deposition. Asingle composite sample was prepared for analysis bycombining these two samples. For the collection of sprucethroughfall (all sites), and beech throughfall (JEZ and LES),an array of nine samplers in a regular 10 � 10 m gridunderneath the closed forest canopy was used [Mayer andUlrich, 1974]. The nine throughfall samples were combinedto yield a single composite sample. The samplers werepolyethylene (PE) funnels (122 cm2) fitted to PE 1-L bottlesplaced 120 cm above the ground. Snow (circa November toMarch) was sampled using plastic vessels (380 cm2) withPE bags. About 1 L of stream water was taken at thecatchment outlet at the end of each monthly interval.[6] Sulfur concentrations and d34S values of soils from
6 catchments (CER, JEZ, LIZ, LYS, PLB and SAL) aretaken from Novak et al. [1996]. The soils were sampled in1994. S concentration and isotope values were measured inthree separate soil pits for each of three soil horizons (O,A/B, C). Soil from horizons Oi, Oe, and Oa, representing onaverage the top 12 cm of the profiles, was pooled by mass.The thickness of the A/B and C horizons averaged 30 and40 cm, respectively. The distance between the three soil pitsin each catchment was at least 50 m. For JEZ, S concen-tration and d34S data from another 12 soil pits were fromNovak et al. [2000]. Soil horizons O, A/B and C weresampled in each pit in 1997. For the current paper, soilhorizons O, A/B and C were sampled in the seven remain-ing catchments (GEM, LES, MOD, POM, SPA, UDL andT
able
1.StudySiteCharacteristics
Site
Location
Elevation
(ma.s.l)
Mean
slope,
deg
Aspect
Catchment
Area,
ha
Bedrock
SoilType
Prevailing
Wind
Direction
Mean
Tem
perature,
�C
Annual
Precipitation,
mm
CERCervik
49�270N,18�230E
640–961
15
east
185
flysh-istebnan
sandstone
dystriccambisol
west
+6.2
1155
GEM
Anenskypotok
49�340E,15�050E
480–540
5.5
north
27
sillim
anite-biotite
paragneiss
dystriccambisol
west
+6.9
644
JEZJezeri
50�320N,13�280E
475–924
10
south
261
two-m
icagneiss
dystriccambisol
west
+5
934
LESLesnipotok
49�580N,14�490E
400–495
3.5
north
70
biotite
granite
dystriccambisol
west
+7
613
LIZ
NaLizu
49�040N,13�410E
828–1024
8east
99
sillim
anite-biotite
paragneiss
dystriccambisol
west
+4.9
905
LYSLysina
50�030N,12�400E
829–949
6east
27
leucocratic
granite
spodo-dystriccambiosol
west
+5
934
MOD
Modry
potok
50�420N,15�420E
1010–1554
13
south-east
262
muscovitemica-schist
cambic
podzol
west
+2.9
1666
PLBPluhuvBor
50�040N,12�460E
690–804
6.5
east
22
serpentinite
eutrophic
cambisol
west
+6
934
POM
Polomka
49�470N,15�450E
512–640
6.5
north
69
migmatite-orthogneiss,paragneiss
dystriccambisol,stagno-gleyic
cambisol
west
+6.3
695
SALSalacovaLhota
49�310N,14�590E
557–744
5.5
south
168
sillim
anite-biotite
paragneiss
dystriccambisol,stagno-gleyic
cambisol
west
+6
572
SPA
Spalenec
48�550N,13�590E
795–858
3.5
west
53
granulite
gneiss
dystriccambisol
west
+5.5
816
UDLU
dvouloucek
50�130N,16�290E
880–950
6south-w
est
33
two-m
icagneiss
spodo-dystriccambiosol,cambic
podzol
west
+5
1308
UHLUhlirska
50�490N,15�080E
780–870
2.5
south
187
granite
spodo-dystriccambiosol,cambic
podzol
west
+4
1231
GB4012 NOVAK ET AL.: S ISOTOPES IN 13 CATCHMENTS
3 of 14
GB4012

UHL) in 1998. Each entire soil horizon was collected at10 different locations throughout the catchment, the samplespooled by horizon and a subsample taken for analysis. Thed34S values of bedrock are from M. Novak et al. (Temporalvariation in d34S values, S fluxes and mass balances in13 Central European forest catchments, manuscript, inpreparation, 2005) (hereinafter referred to as Novak et al.,manuscript in preparation, 2005). An average whole rockd34S value was obtained by pooling 10 kg of samples
from bedrock and boulders that had been collected at�30 locations throughout each catchment.
2.3. Analytical Procedures
[7] Water samples (bulk deposition, spruce throughfall,beech throughfall, and runoff) were filtered and kept at 2�C.Water fluxes via bulk deposition and throughfall weremeasured by weighing the sampler contents. Runoff fluxeswere measured by means of a gauging station. Sulfate
Table 2. Fluxes and Isotopic Compositions of S at Study Catchments, Water Year 1997
Site Flux Typea Area, % Water Flux, mm yr�1 SO4-S, mg L�1 S Flux, kg ha�1 yr�1 d34S,b %
CER bulk dep 15 1505 ± 354 1.05 ± 0.24 15.7 ± 3.2 4.4 ± 0.3spruce TF 85 1088 ± 341 2.81 ± 0.91 30.5 ± 6.3 3.6 ± 0.4avg depc 100 1151 ± 343 2.39 ± 0.75 29.3 ± 6.2 3.7 ± 0.4runoff 100 971 ± 356 6.14 ± 0.05 59.7 ± 21.7 3.1 ± 0.2
GEM bulk dep 6 638 ± 160 1.14 ± 0.07 7.3 ± 1.8 5.1 ± 0.3spruce TF 94 337 ± 82 5.49 ± 0.74 18.5 ± 3.1 4.5 ± 0.3avg dep 100 355 ± 87 5.02 ± 0.67 17.8 ± 3.0 4.5 ± 0.3runoff 100 61 ± 13 16.09 ± 1.41 9.9 ± 2.9 4.5 ± 0.2
JEZ bulk dep 3 705 ± 94 2.07 ± 0.51 14.6 ± 4.2 6.0 ± 0.2spruce TF 7 577 ± 92 10.55 ± 1.67 60.9 ± 8.9 3.5 ± 0.4beech TFd 90 380 ± 69 5.28 ± 1.20 20.1 ± 5.8 5.4 ± 0.3avg dep 100 404 ± 64 5.64 ± 1.11 22.8 ± 5.5 5.0 ± 0.2runoff 100 315 ± 67 17.91 ± 0.57 56.5 ± 12.8 3.4 ± 0.2
LES bulk dep 5 621 ± 133 1.22 ± 0.09 7.6 ± 1.4 5.6 ± 0.2spruce TF 53 324 ± 78 6.39 ± 0.85 20.7 ± 3.4 4.5 ± 0.3beech TF 42 381 ± 68 1.75 ± 0.13 6.7 ± 1.0 5.6 ± 0.2avg dep 100 363 ± 75 3.90 ± 0.38 14.2 ± 2.1 4.8 ± 0.2runoff 100 159 ± 32 25.28 ± 1.21 43.3 ± 9.0 4.3 ± 0.3
LIZ bulk dep 37 825 ± 151 0.80 ± 0.13 6.6 ± 1.6 4.8 ± 0.3spruce TF 63 417 ± 103 2.86 ± 0.56 11.9 ± 2.5 4.6 ± 0.3avg dep 100 568 ± 120 1.75 ± 0.27 9.9 ± 2.1 4.6 ± 0.2runoff 100 387 ± 43 3.85 ± 0.29 14.9 ± 2.6 4.7 ± 0.3
LYS bulk dep 30 649 ± 106 0.96 ± 0.06 6.2 ± 1.0 5.2 ± 0.3spruce TF 70 482 ± 93 4.70 ± 0.51 22.7 ± 4.1 5.4 ± 0.4avg dep 100 532 ± 93 3.33 ± 0.28 18.8 ± 3.1 5.4 ± 0.4runoff 100 326 ± 97 6.07 ± 0.21 19.8 ± 5.7 5.4 ± 0.2
MOD bulk dep 38 2506 ± 869 0.86 ± 0.11 23.3 ± 7.4 6.6 ± 0.6spruce TF 62 1649 ± 313 1.58 ± 0.15 26.0 ± 4.6 6.2 ± 0.2avg dep 100 1974 ± 504 1.29 ± 0.15 25.4 ± 5.5 6.5 ± 0.3runoff 100 1633 ± 528 1.38 ± 0.03 22.6 ± 6.9 5.9 ± 0.1
PLB bulk dep 0 649 ± 106 0.96 ± 0.06 6.2 ± 1.0 5.2 ± 0.3spruce TF 100 408 ± 67 3.82 ± 0.39 15.6 ± 3.1 5.0 ± 0.4avg dep 100 408 ± 67 3.82 ± 0.39 15.6 ± 3.1 5.0 ± 0.4runoff 100 222 ± 82 11.38 ± 0.54 25.3 ± 9.6 5.1 ± 0.5
POM bulk dep 7 847 ± 131 2.85 ± 1.09 24.1 ± 7.7 4.3 ± 0.2spruce TF 93 648 ± 111 5.83 ± 1.34 37.8 ± 5.9 4.2 ± 0.3avg dep 100 661 ± 111 5.57 ± 1.29 36.8 ± 5.9 4.2 ± 0.3runoff 100 320 ± 89 16.41 ± 0.55 52.5 ± 14.8 4.1 ± 0.3
SAL bulk dep 0 489 ± 137 1.44 ± 0.20 7.0 ± 1.6 5.4 ± 0.3spruce TF 100 308 ± 74 6.62 ± 0.97 20.4 ± 4.3 3.5 ± 0.2avg dep 100 308 ± 74 6.62 ± 0.97 20.4 ± 4.3 3.5 ± 0.2runoff 100 170 ± 14 5.06 ± 0.37 8.6 ± 1.1 4.5 ± 0.1
SPA bulk dep 5 1242 ± 215 0.60 ± 0.07 7.5 ± 1.6 5.2 ± 0.4spruce TF 95 552 ± 108 4.04 ± 0.94 22.3 ± 4.5 3.8 ± 0.1avg dep 100 587 ± 113 3.67 ± 0.83 21.6 ± 4.3 3.8 ± 0.1Runoff 100 397 ± 56 3.54 ± 0.06 14.1 ± 2.0 5.5 ± 0.3
UDL Bulk dep 87 1480 ± 311 1.44 ± 0.22 21.3 ± 2.7 5.6 ± 0.3Spruce TF 13 972 ± 196 4.21 ± 0.86 40.9 ± 8.7 5.0 ± 0.2Avg dep 100 1414 ± 294 1.69 ± 0.26 23.9 ± 3.1 5.4 ± 0.2Runoff 100 1187 ± 290 3.19 ± 0.10 37.8 ± 8.8 5.2 ± 0.2
UHL Bulk dep 85 1379 ± 305 1.31 ± 0.12 18.1 ± 3.6 7.7 ± 0.4Spruce TF 15 1316 ± 309 5.43 ± 0.69 71.5 ± 13.5 7.1 ± 0.7Avg dep 100 1369 ± 306 1.91 ± 0.16 26.1 ± 4.8 7.4 ± 0.2Runoff 100 1058 ± 227 4.70 ± 0.16 49.7 ± 11.5 6.8 ± 0.2
aTF denotes throughfall.bSulfur isotope values are mass-weighted averages, and reported as means ± standard errors.cAverage deposition values calculated by area-weighting deposition for each vegetation type (spruce, beech, or bulk deposition in clearings).dBeech throughfall fluxes are assumed to also apply to areas of spruce dieback at JEZ.
GB4012 NOVAK ET AL.: S ISOTOPES IN 13 CATCHMENTS
4 of 14
GB4012

concentrations were determined on a Shimadzu LC 6Aliquid chromatograph. Sulfur for d34S determinations wasprecipitated from water as BaSO4 and converted to SO2
[Yanagisawa and Sakai, 1983]. Total S was extracted fromsieved (<2 mm), dried and homogenized soils by digestionwith Eschka mixture, precipitated as BaSO4 and convertedto SO2 [Chakrabarti, 1978; Novak et al., 1994]. Theconcentration of S in soils was determined gravimetricallyfollowing the Eschka digestion. The d34S values of watersand soils were determined on a Finnigan MAT 251 massspectrometer with a reproducibility of 0.3%. The resultswere expressed as a per mil deviation of the 34S/32S ratio inthe sample from the Canon Diablo Troilite (CDT) standard.Ten kilograms of bedrock and boulders from each catch-ment (Novak et al., manuscript in preparation, 2005) wereground to <0.1 mm, and a 200-g split was subjected toJohnson-Nishita distillation [Johnson and Nishita, 1952].The sample was treated with Cr2+ in a N2 atmosphere for45 min [Canfield et al., 1986]. All sulfide S present in therock was quantitatively converted to H2S and trapped in Zn-acetate; the resulting ZnS2 was converted to Ag2S, oxidizedto SO2 and analyzed for d34S [Hall et al., 1988]. Thereproducibility of the entire bedrock S extraction procedurewas 0.4% (Novak et al., manuscript in preparation, 2005).Annual sulfate fluxes via atmospheric deposition and streamrunoff were calculated from monthly sulfate concentrationsand water fluxes. Deposition fluxes from different groundcover types (spruce throughfall, beech throughfall, andbulk deposition) were area-weighted to calculate averagedeposition for each catchment. Reported d34S values aremass-weighted averages. First-order, second-moment errorpropagation was employed throughout the analysis; uncer-tainties are reported as ±1 standard error in all cases.
3. Results and Discussion
3.1. Sulfate Deposition
[8] Spruce throughfall was richer in S than bulk deposi-tion sampled in nearby clearings by a factor of 1.1 (MOD)to 4.2 (JEZ; Table 2). Across the 13 sites, the average Senrichment factor for spruce throughfall relative to bulkdeposition was 2.6. Thus if half of a typical catchment in theCzech Republic were covered by spruce, while the otherhalf had been clearcut following pollution-related die-back,more than 70% of atmospheric S input into the catchmentwould still occur via the surviving spruce stand. Coniferforests intercept more airborne sulfur dioxide than clearingsbecause of their greater surface roughness, which is relatedto the leaf area index and the shape of the needles. Theenhancement of S deposition under forests is stronger closeto industrial sources, because about 98% of industrial S isemitted in the form of SO2, a gas which is scavenged byfoliage [Kellog et al., 1972]. The efficiency of SO2 scav-enging is affected by local aerodynamics and tree density.The windward margin of a closed-canopy forest interceptslarge quantities of SO2, deflecting most of the remainingSO2 upward. As a result, the uppermost branches in the treecanopy capture more S than lower branches [Fowler et al.,1990; Krouse et al.,1984]. Sulfur dioxide is oxidized onneedle surfaces to sulfate and neutralized by Ca2+ leachedfrom plant tissues [Ferm and Hultberg, 2004]. In small
amounts, S compounds can also enter the stomata, or bereleased by the stomata [Krouse et al., 1984]. Duringtransport, several per cent of SO2 per hour are oxidized tosulfate, which then dominates wet deposition [Novak et al.,2001b].
3.2. The Continuing Pollution Gradient
[9] In 1997, dry-deposited S (estimated from the differ-ence of fluxes between canopy throughfall and bulk depo-sition) formed up to 76% of total S deposition underneathspruce (JEZ). The contribution of dry-deposited S to total Sdeposition in spruce stands averaged 56% across the13 Czech sites (Table 2). This was much higher than, forexample, the 15% contribution of dry deposited S to total Sdeposition in southern Sweden [Forsius et al., 2001], or the21% contribution of dry deposited to total S over the34 years of observations at Hubbard Brook [Likens et al.,2002] . Overall, the highest catchment-scale atmospheric Sinputs in the present study (37 and 29 kg S ha�1 yr�1,Table 2) occurred at POM and CER, sites with few clear-ings. However, much higher atmospheric S inputs wereobserved in patches of surviving spruce farther north(Figure 1). The highest spruce throughfall S fluxes wererecorded at UHL and JEZ (72 and 61 kg S ha�1 yr�1). Eventhough these 1997 values followed 10 years of steadilydecreasing pollution in central Europe, they were still higherthan the highest annual S depositions ever measured in thenortheastern United States [Howarth et al., 1992]. Thelowest atmospheric S deposition rates in the present study(i.e., in water year 1997) occurred in the western CzechRepublic, upwind from recent major industrial polluters(LYS and PLB with 6 kg S ha�1 yr�1 in clearings;Figure 1). Data in Figure 1 reveal a sharp continuingpollution gradient: In 1997, the ground surface underneathspruce at UHL received 12 times more S than the groundsurface in clearings at LYS. Within a single vegetation type(spruce), the pollution gradient was seven-fold (markedlypolluted UHL versus relatively unpolluted LIZ). Within asingle site (over a distance of tens of meters), the S inputgradient was the largest at JEZ (4.2 times more S depositedin spruce forests than in clearings).
3.3. Isotope Composition of S Input
[10] Figure 2 contrasts S fluxes and d34S values in bulkdeposition and spruce throughfall across the 13 sites. As aresult of scavenging of SO2 by the tree canopy, sprucethroughfall fluxes were significantly higher than bulkdeposition (Figure 2a). By contrast, at almost all of the13 catchments, average mass-weighted d34S values werelower in spruce throughfall than in bulk deposition, i.e.,sulfur in spruce throughfall was enriched in the lighterisotope 32S (Figure 2b). All data points in Figure 2a lieabove the 1:1 line, whereas nearly all data points inFigure 2b lie below the 1:1 line. Across the 13 sites, thed34S value of spruce throughfall was 0.7% lower thanthat of bulk deposition (4.7 and 5.5%, respectively;Table 2). The underlying process was again related toelevated dry deposition of SO2 in the canopies of conifers.Local coal contains isotopically relatively light S (mean of1.6% [Mach et al., 1999]) and its combustion releases
GB4012 NOVAK ET AL.: S ISOTOPES IN 13 CATCHMENTS
5 of 14
GB4012

low-d34S SO2 to the atmosphere [Novak et al., 2001a]. Alarge portion of this isotopically light SO2 is captured byspruce canopies as dry deposition. The remaining SO2 isconverted to sulfate by atmospheric oxidation and washedout from the air by rain. The isotope selectivity of thisreaction depends upon kinetics, some steps are associatedwith a negative effect, while other steps cause a positiveeffect. Field evidence implies that the negative effect islarger than the positive effect. The heavier isotope 34S ispreferentially concentrated in the resulting liquid phase(SO4), while the residual gaseous phase (SO2) becomesenriched in the lighter isotope 32S [Saltzman et al., 1983].The magnitude of the overall isotope fractionation is 0 to4% [Novak et al., 2001a]. The wet-deposited sulfate hashigher d34S values than dry-deposited SO2, resulting inisotopically heavier bulk deposition S compared to canopythroughfall S.
3.4. Comparison of S Inputs and Outputs
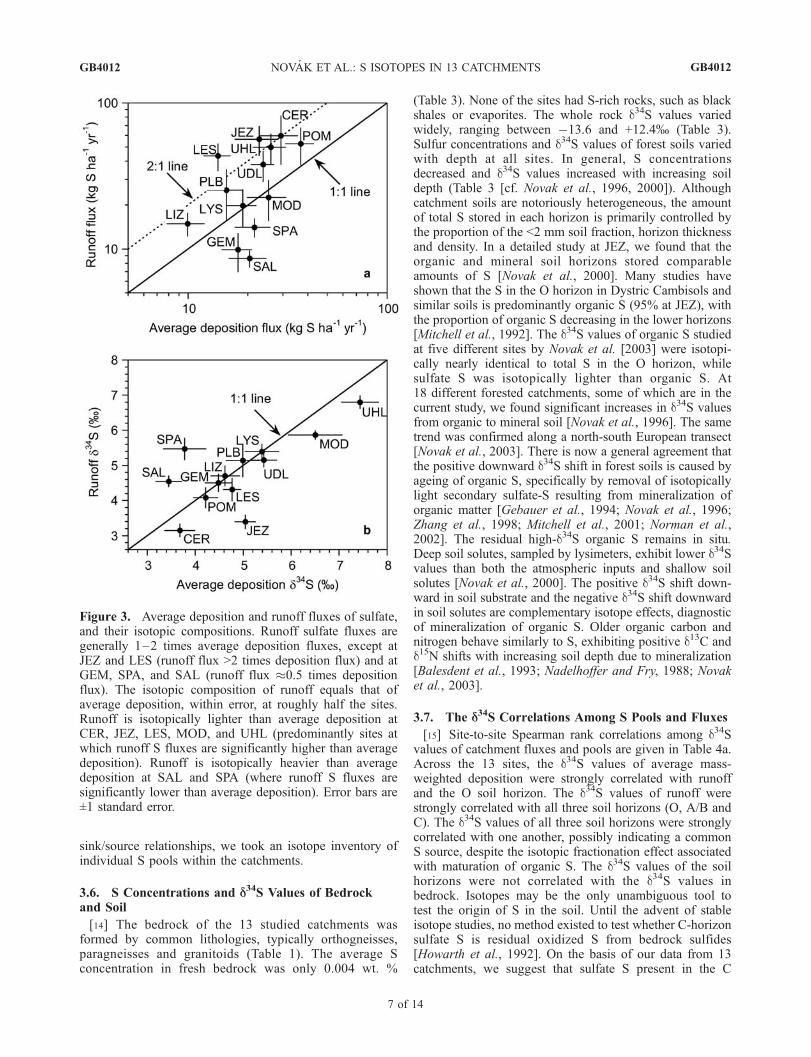
[11] Catchment outputs of S via surface runoff in thehydrological year 1997 are given in Table 1. The lowestrunoff flux, 9 kg S ha�1 yr�1, was measured at SAL. Thelargest runoff flux, 60 kg S ha�1 yr�1, was observed at theeasternmost catchment CER, followed by JEZ, POM andUHL (56, 53 and 50 kg S ha�1 yr�1, respectively). At JEZ,we had monitored S runoff fluxes between 1994 and 1996[Fottova and Skorepova, 1998; Peters et al., 1999; Novak etal., 2000], arriving at a time series of extremely high annualoutputs of 52, 58 and 85 kg S ha�1 yr�1. It appears that the56 kg of S ha�1 exported from JEZ in 1997 was notanomalous, following earlier years of even higher S exports.Runoff may not be the only S output from forest catch-ments. Highly polluted catchments with aerated soils canrelease additional S back to the atmosphere in the form ofbiogenic gaseous emissions [Andreae and Jaeschke, 1992].Incubations of JEZ soil labeled with 35S and 34S showedthat, following precipitation events, dissimilatory sulfatereduction in anaerobic domains can release as much as13 kg S ha�1 yr�1 in the form of H2S [Novak et al., 2001a,2004].[12] Comparisons of average S deposition fluxes and d34S
values with those of runoff are shown in Figure 3. Sulfurfluxes for individual catchments plot on both sides of the1:1 line (Figure 3a). Similarly, the d34S values of individualsites plot on both sides of the 1:1 line (Figure 3b). Some ofthe study sites exhibited a net export of S, while other siteswere still accumulating S. Some of the sites exportedisotopically lighter S (lower d34S) than they were currentlyreceiving from the atmosphere. Other sites exported isoto-pically heavier S (higher d34S) compared to current atmo-spheric S deposition.
3.5. Links Between Site Histories and S Budgets
[13] In the Czech Republic, the simplest dividing linebetween contrasting S pollution histories is an east-west linethrough the center of the country, with an extremelypolluted north and a relatively unpolluted south. A numberof confounding factors exist, such as the presence of smallbut locally important point sources of pollution in otherwiseunpolluted regions, or higher precipitation totals and S
fluxes close to mountain peaks relative to lowlands. Com-paring Figures 1 and 3, one can see that the sites releasingS are situated in the polluted north. By contrast, theunpolluted sites in the south, which have not experiencedthe same drastic decrease in S deposition after 1987 as thosein the north [Kopacek et al., 2001], were continuing toretain S. Sites releasing the largest amounts of S tend tohave low runoff d34S values relative to deposition (e.g., JEZ,LES, CER and UHL; Figure 3). In contrast, sites retainingthe largest amounts of S tend to have high runoff d34Svalues relative to deposition (SPA and SAL). This impliesthat the source of S in sites releasing S must be isotopicallylighter than the input, in order to produce a low-d34S output,and that one or more S-retaining processes at sites that arenet sinks of S must favor light isotopes, in order to producea high-d34S output. For a more specific evaluation of the
Figure 2. Bulk deposition and spruce throughfall fluxes ofsulfate, and their isotopic compositions. Spruce throughfallfluxes are correlated with bulk deposition (open canopy)fluxes, but are higher by roughly a factor of 3 (dottedline). Spruce throughfall is isotopically lighter than bulkdeposition by approximately 0.5%, except at SPA, SAL,and JEZ, where it is lighter by roughly 2%. Error bars are±1 standard error.
GB4012 NOVAK ET AL.: S ISOTOPES IN 13 CATCHMENTS
6 of 14
GB4012
sink/source relationships, we took an isotope inventory ofindividual S pools within the catchments.
3.6. S Concentrations and D34S Values of Bedrock
and Soil
[14] The bedrock of the 13 studied catchments wasformed by common lithologies, typically orthogneisses,paragneisses and granitoids (Table 1). The average Sconcentration in fresh bedrock was only 0.004 wt. %
(Table 3). None of the sites had S-rich rocks, such as blackshales or evaporites. The whole rock d34S values variedwidely, ranging between �13.6 and +12.4% (Table 3).Sulfur concentrations and d34S values of forest soils variedwith depth at all sites. In general, S concentrationsdecreased and d34S values increased with increasing soildepth (Table 3 [cf. Novak et al., 1996, 2000]). Althoughcatchment soils are notoriously heterogeneous, the amountof total S stored in each horizon is primarily controlled bythe proportion of the <2 mm soil fraction, horizon thicknessand density. In a detailed study at JEZ, we found that theorganic and mineral soil horizons stored comparableamounts of S [Novak et al., 2000]. Many studies haveshown that the S in the O horizon in Dystric Cambisols andsimilar soils is predominantly organic S (95% at JEZ), withthe proportion of organic S decreasing in the lower horizons[Mitchell et al., 1992]. The d34S values of organic S studiedat five different sites by Novak et al. [2003] were isotopi-cally nearly identical to total S in the O horizon, whilesulfate S was isotopically lighter than organic S. At18 different forested catchments, some of which are in thecurrent study, we found significant increases in d34S valuesfrom organic to mineral soil [Novak et al., 1996]. The sametrend was confirmed along a north-south European transect[Novak et al., 2003]. There is now a general agreement thatthe positive downward d34S shift in forest soils is caused byageing of organic S, specifically by removal of isotopicallylight secondary sulfate-S resulting from mineralization oforganic matter [Gebauer et al., 1994; Novak et al., 1996;Zhang et al., 1998; Mitchell et al., 2001; Norman et al.,2002]. The residual high-d34S organic S remains in situ.Deep soil solutes, sampled by lysimeters, exhibit lower d34Svalues than both the atmospheric inputs and shallow soilsolutes [Novak et al., 2000]. The positive d34S shift down-ward in soil substrate and the negative d34S shift downwardin soil solutes are complementary isotope effects, diagnosticof mineralization of organic S. Older organic carbon andnitrogen behave similarly to S, exhibiting positive d13C andd15N shifts with increasing soil depth due to mineralization[Balesdent et al., 1993; Nadelhoffer and Fry, 1988; Novaket al., 2003].
3.7. The D34S Correlations Among S Pools and Fluxes
[15] Site-to-site Spearman rank correlations among d34Svalues of catchment fluxes and pools are given in Table 4a.Across the 13 sites, the d34S values of average mass-weighted deposition were strongly correlated with runoffand the O soil horizon. The d34S values of runoff werestrongly correlated with all three soil horizons (O, A/B andC). The d34S values of all three soil horizons were stronglycorrelated with one another, possibly indicating a commonS source, despite the isotopic fractionation effect associatedwith maturation of organic S. The d34S values of the soilhorizons were not correlated with the d34S values inbedrock. Isotopes may be the only unambiguous tool totest the origin of S in the soil. Until the advent of stableisotope studies, no method existed to test whether C-horizonsulfate S is residual oxidized S from bedrock sulfides[Howarth et al., 1992]. On the basis of our data from 13catchments, we suggest that sulfate S present in the C
Figure 3. Average deposition and runoff fluxes of sulfate,and their isotopic compositions. Runoff sulfate fluxes aregenerally 1–2 times average deposition fluxes, except atJEZ and LES (runoff flux >2 times deposition flux) and atGEM, SPA, and SAL (runoff flux �0.5 times depositionflux). The isotopic composition of runoff equals that ofaverage deposition, within error, at roughly half the sites.Runoff is isotopically lighter than average deposition atCER, JEZ, LES, MOD, and UHL (predominantly sites atwhich runoff S fluxes are significantly higher than averagedeposition). Runoff is isotopically heavier than averagedeposition at SAL and SPA (where runoff S fluxes aresignificantly lower than average deposition). Error bars are±1 standard error.
GB4012 NOVAK ET AL.: S ISOTOPES IN 13 CATCHMENTS
7 of 14
GB4012

horizon of soils that are developed on common S-poorrocks (�40 ppm S, Table 3) is mainly derived from theatmosphere.
3.8. S Isotope Systematics of Potential MixingEnd-Members for Runoff
[16] Statistically significant differences existed among theS isotope compositions of several S fluxes and pools,averaged across the 13 sites (Table 4b). Sulfur in bulkdeposition was isotopically significantly heavier than allother S fluxes and pools, with the exception of some ofthe bedrock. Sulfur in the O horizon of the soils wasisotopically significantly lighter than all other S fluxesand pools, again except some bedrock. Sulfur in runoffwas isotopically similar to the average atmospheric deposi-tion and the C soil horizon. At the same time, S in runoffwas isotopically significantly lighter than S in bulk deposi-tion and significantly heavier than S in the O and A/Bhorizons. Sulfur in the A/B and C horizons was statisticallyindistinguishable. In general, d34S values decreased acrossthe sites in the order (mean d34S values in brackets): bulkdeposition (5.5%) > runoff (4. 8%) � spruce throughfall(4.7%) � soil (4.6, 4.2 and 3.1% for the horizons C, A/Band O, respectively) > bedrock (1.5%).
3.9. Delayed Export of Atmospheric S FromCatchments
[17] We have previously seen that d34S values of runoffwere positively correlated with those of the average atmo-spheric deposition (Table 4a). For many years, runoff ofsulfate originating from instantaneous rainfall was consid-ered to form a major proportion of stream runoff (seeMitchell and Fuller [1988] for a review). Recently, thistraditional view has been challenged by studies usingactivities of the cosmogenic isotope 35S in catchment inputsand outputs [Michel et al., 2000; Kester et al., 2003; Novaket al., 2004]. These studies have shown that the residencetime of the incoming S in non-alpine catchments exceedsseveral months. We will further consider such delayedatmospheric S to be one mixing end-member for runoff
generation. What other S mixing end-members play a rolein runoff generation at the 13 studied catchments?
3.10. Role of Soil and Bedrock S in Runoff Generation
[18] Sulfur isotope compositions are used in Figure 4 toconstrain the role of within-site sources in S runoff gener-ation. The d34S value of runoff, as we have already seen inTable 4a, was strongly correlated with all three soil hori-zons. Figure 4a shows a systematic offset relative to a 1:1relationship between d34S of the O horizon and runoff.Across the sites, S in the O horizon was isotopically lighterthan S in runoff by an average of 1.7%. The isotopic offsetbetween the deeper A/B horizon and runoff was smaller(0.7%; Figure 4b), while that between the C horizon andrunoff (0.3%; Figure 4c) was statistically insignificant(Table 4b). The d34S values of the O horizon were lighterthan deposition by almost 2%, suggesting that the reactionsbetween deposited S and the O horizon were associatedwith an isotope effect. This �2% d34S offset from atmo-spheric input to O-horizon S may have been caused byisotope fractionation upon assimilation (uptake) of sulfate Sby spruce, previously documented across an east-westEuropean transect [Novak et al., 2001b]. It is not wellknown whether S uptake by fine roots also fractionates Sisotopes. Our preliminary data from JEZ indicate statisti-cally insignificant differences among d34S values of finesoil, fine roots and mycorrhizae (means of 2.2, 2.6 and3.1%, respectively; number of replicates n = 3).[19] Figure 4d clearly shows that, across the sites, the d34S
values of bedrock did not correlate with runoff. The scatterin Figure 4d contrasts with clear-cut positive correlationsbetween d34S values in runoff and each of the soil horizons(Figures 4a–4c, Table 4a), as discussed above. Sulfurisotope data from our 13 catchments thus imply thatwhereas the bedrock S contribution to runoff was negligi-ble, soil S, largely of anthropogenic origin, was a majorcomponent of runoff. Most previous studies have focusedon one or just a few catchments, with the usefulness of theisotope data depending on whether or not the d34S ofbedrock was sufficiently different from the d34S of the
Table 3. Sulfur Isotope Mass Balance and Composition of Potential Catchment Sources/Sinks, Water Year 1997
Site
Soil Horizon OSoil Horizon
A/B Soil Horizon C Bedrock Average Deposition Runoff Internal Source/Sink
S,wt %
d34S,%
S,wt %
d34S,%
S,wt %
d34S,%
S,wt %
d34S,%
S Flux,kg ha�1 yr�1
d34S,%
S Flux,kg ha�1 yr�1
d34S,%
S Flux,kg ha�1 yr�1
d34S,%
CER 0.09 1.7 ± 0.8 0.05 2.5 ± 1.4 0.04 4.7 ± 2.1 0.03 2.4 29.3 ± 6.2 3.7 ± 0.4 59.7 ± 21.7 3.1 ± 0.2 30.4 ± 22.2 2.6 ± 0.6GEM 0.11 1.3 ± 0.6 0.01 3.3 ± 1.1 0.005 4.5 ± 1.4 0.002 �5.1 17.8 ± 3.0 4.5 ± 0.3 9.9 ± 2.9 4.5 ± 0.2 �8.0 ± 3.1 4.5 ± 0.6JEZ 0.16 1.4 ± 0.4 0.02 2.4 ± 0.9 0.01 3.6 ± 1.6 <0.003 5.8 22.8 ± 5.5 5.0 ± 0.2 56.5 ± 12.8 3.4 ± 0.2 33.7 ± 16.2 2.3 ± 0.7LES 0.05 2.2 ± 0.6 0.01 3.0 ± 1.1 0.005 2.1 ± 1.4 <0.001 3.4 14.2 ± 2.1 4.8 ± 0.2 43.3 ± 9.0 4.3 ± 0.3 29.2 ± 8.0 4.1 ± 0.5LIZ 0.12 2.4 ± 0.5 0.03 2.9 ± 0.7 0.04 2.8 ± 0.9 <0.001 3.2 9.9 ± 2.1 4.6 ± 0.2 14.9 ± 2.6 4.7 ± 0.3 4.9 ± 2.5 4.9 ± 0.9LYS 0.13 3.2 ± 0.6 0.02 3.3 ± 1.6 0.01 3.9 ± 1.3 <0.001 �13.6 17.7 ± 3.1 5.4 ± 0.4 19.8 ± 5.7 5.4 ± 0.2 2.1 ± 5.9 5.4 ± 3.1MOD 0.13 4.8 ± 0.6 0.02 5.1 ± 1.1 0.02 6.6 ± 1.4 0.01 3.7 25.4 ± 5.5 6.5 ± 0.3 22.6 ± 6.9 5.9 ± 0.1 �2.9 ± 4.5 11.5 ± 42.2a
PLB 0.12 4.2 ± 1.0 0.02 5.1 ± 0.8 0.02 5.2 ± 1.0 <0.001 n.d.b 15.6 ± 3.1 5.0 ± 0.4 25.3 ± 9.6 5.1 ± 0.5 9.7 ± 7.5 5.3 ± 1.5POM 0.08 1.7 ± 0.6 0.01 4.7 ± 1.1 0.01 4.7 ± 1.4 <0.001 1.5 36.8 ± 5.9 4.2 ± 0.3 52.5 ± 14.8 4.1 ± 0.3 15.7 ± 16.7 3.8 ± 1.1SAL 0.1 3.1 ± 0.1 0.04 3.6 ± 0.8 0.02 3.8 ± 0.7 0.003 12.4 20.4 ± 4.3 3.5 ± 0.2 8.6 ± 1.1 4.5 ± 0.1 �11.8 ± 3.5 2.7 ± 0.4SPA 0.06 3.6 ± 0.6 0.01 4.0 ± 1.1 0.01 4.9 ± 1.4 <0.001 5.6 21.6 ± 4.3 3.8 ± 0.1 14.1 ± 2.0 5.5 ± 0.3 �7.5 ± 3.9 0.6 ± 1.8UDL 0.15 5.3 ± 0.6 0.01 6.5 ± 1.1 0.01 6.2 ± 1.4 0.001 �3.3 23.9 ± 3.1 5.4 ± 0.2 37.8 ± 8.8 5.2 ± 0.2 14.0 ± 8.6 4.7 ± 0.7UHL 0.09 5.3 ± 0.6 0.01 7.1 ± 1.1 0.01 6.3 ± 1.4 0.004 2.1 26.1 ± 4.8 7.4 ± 0.2 49.7 ± 11.5 6.8 ± 0.2 23.6 ± 7.1 6.1 ± 0.4
aInput and output S fluxes at MOD nearly balance, nearly dividing by zero in the estimation of the d34S of the internal source/sink. Thus the estimate islarge and highly uncertain.
bThe concentration of S in bedrock at PLB was too low to permit d34S to be measured.
GB4012 NOVAK ET AL.: S ISOTOPES IN 13 CATCHMENTS
8 of 14
GB4012

atmospheric input [Bottrell and Novak, 1998;Mitchell et al.,2001]. Studies employing data from multiple catchmentswith various bedrock d34S values, such as this one, maxi-mize the diagnostic power of S isotopes for distinguishingbetween natural (bedrock-derived) and pollutant (atmo-spherically derived) S in discharge. We suggest thatFigure 4d can be generalized to common igneous andmetamorphic bedrock types whose S contribution to runoffis also negligible. In contrast, S-rich bedrocks, such assulfidic black shales and coal, can yield a result differentfrom ours (Figure 4d), with bedrock S forming a measurableportion of the S in stream discharge [e.g., Wieder, 1989;Bailey et al., 2004].
3.11. S Isotope Mass Balances for ForestedCatchments
[20] In all, nine catchments had positive mass balances(net release of S), with five over 10 kg S ha�1 yr�1, whilethe remaining four sites had negative mass balances (netaccumulation of S; Figure 3). Table 3 also summarizes thesulfur isotope mass balances for each of the 13 catchments,including the associated uncertainties. The isotope massbalances use S input-output budgets from Figure 3. InTable 3, the internal (within-site) sources of S are expressedas positive values, and internal sinks as negative values. Theisotope mass balances allow us to infer the isotopic com-position of the catchments’ internal S sources/sinks(Table 3). If the output flux (‘‘out’’) is a mixture ofdeposition (‘‘in’’) and an unknown within catchmentsource/sink (‘‘x’’), then
Qx ¼ Qout � Qin; ð1Þ
where Q denotes S fluxes (the internal source Qx is negativeif the catchment is a net sink for S). The isotope massbalance is
dxQx ¼ doutQout � din � Qin; ð2Þ
where d denotes d34S values. These two equations can bere-arranged to yield the composition of the missing sourceor sink,
dx ¼ doutQout � dinQinð Þ= Qout � Qinð Þ: ð3Þ
[21] The missing S sources or sinks had d34S valuesranging from 0.6% (SPA) to 6.1% (UHL). At MOD themeasured S input and output fluxes nearly balanced leadingto a nearly divide-by-zero situation in equation (3).
3.12. An Isotope Source/Sink Model for Catchment S
[22] If the sulfur of the internal source or sink is isotopi-cally lighter than deposition S, we would expect runoff S tobe isotopically lighter than deposition S in catchments thatare net exporters of S, and we would expect runoff S to beisotopically heavier than deposition S in catchments that arenet retainers of S. This analysis can be made quantitative byrewriting equations (1) and (2) in the following form:
dout � dinð Þ ¼ dx � doutð Þ Qout � Qinð Þ=Qin: ð4Þ
[23] Equation (4) implies that if the internal source orsink is consistently isotopically different from runoff, thena graph with the isotopic shift between input and output(dout � din) on the y axis, and (Qout � Qin) /Qin on the x axis,
Table 4b. Differences Between Mean d34S of Catchment Fluxes and Poolsa
BulkDeposition
SpruceThroughfall
AverageDeposition Runoff
O HorizonSoils
A/B HorizonSoils
C HorizonSoils Bedrock
Bulk deposition �0.8 ± 0.2 �0.6 ± 0.2 �0.7 ± 0.2 �2.4 ± 0.3 �1.3 ± 0.3 �0.9 ± 0.3 �4.0 ± 1.8Spruce throughfall 0.8 ± 0.2 0.2 ± 0.1 0.1 ± 0.2 �1.6 ± 0.3 �0.6 ± 0.3 �0.1 ± 0.3 �3.2 ± 2.0Average deposition 0.6 ± 0.2 �0.2 ± 0.1 �0.1 ± 0.2 �1.8 ± 0.3 �0.8 ± 0.3 �0.4 ± 0.3 �3.4 ± 2.0Runoff 0.7 ± 0.2 �0.1 ± 0.2 0.1 ± 0.2 �1.7 ± 0.2 �0.7 ± 0.3 �0.3 ± 0.3 �3.3 ± 1.9O horizon soils 2.4 ± 0.3 1.6 ± 0.3 1.8 ± 0.3 1.7 ± 0.2 1.0 ± 0.2 1.5 ± 0.3 �1.6 ± 1.9A/B horizon soils 1.3 ± 0.3 0.6 ± 0.3 0.8 ± 0.3 0.7 ± 0.3 �1.0 ± 0.2 0.4 ± 0.2 �2.6 ± 1.9C horizon soils 0.9 ± 0.3 0.1 ± 0.3 0.4 ± 0.3 0.3 ± 0.3 �1.5 ± 0.3 �0.4 ± 0.2 �3.0 ± 1.9Bedrock 4.0 ± 1.8 3.2 ± 2.0 3.4 ± 2.0 3.3 ± 1.9 1.6 ± 1.9 2.6 ± 1.9 3.0 ± 1.9
aUnits are %, means ± standard errors. Table entries are signed differences calculated as column variable minus row variable. For example, sprucethroughfall is isotopically lighter on average than bulk deposition. Thus the average of spruce throughfall d34S minus bulk deposition d34S (first row,second column) is negative, whereas the average bulk deposition d34S minus spruce throughfall d34S (second row, first column) is positive. Bold indicatesdifferences that have significance level p < 0.05 by two-tailed t test.
Table 4a. Site-to-Site Rank (Spearman) Correlations Among d34S of Catchment Fluxes and Poolsa
BulkDeposition
SpruceThroughfall
AverageDeposition Runoff
O HorizonSoils
A/B HorizonSoils
C HorizonSoils Bedrock
Bulkdeposition 0.311 0.649 0.490 0.507 0.314 0.256 0.364Sprucethroughfall 0.311 0.775 0.753 0.701 0.610 0.528 �0.518Averagedeposition 0.649 0.775 0.577 0.578 0.429 0.434 �0.301Runoff 0.490 0.753 0.577 0.864 0.692 0.615 �0.089O horizon soils 0.507 0.701 0.578 0.864 0.795 0.685 �0.021A/B horizon soils 0.314 0.610 0.429 0.692 0.795 0.830 �0.217C horizon soils 0.256 0.528 0.434 0.615 0.685 0.830 �0.210Bedrock 0.364 �0.518 �0.301 �0.089 �0.021 �0.217 �0.210
aBold indicates significance level p < 0.05.
GB4012 NOVAK ET AL.: S ISOTOPES IN 13 CATCHMENTS
9 of 14
GB4012

will form a straight line with an intercept of zero and aslope of (dx � dout), the fractionation of the internal source/sink relative to runoff. Figure 5 depicts a conceptualdiagram of this relationship, as one of four alternativescenarios.[24] Scenario I is non-fractionating S exchange between
deposition, catchment pools, and runoff. Typically, thisscenario would correspond to the prevalence of abioticadsorption/desorption of atmospherically derived sulfate insoils. Van Stempvoort et al. [1990] showed that abioticphysico-chemical adsorption/desorption of sulfate producesno isotopic fractionation. If sulfate were adsorbed and re-released without organic cycling, d34S values similar tothose of atmospheric inputs would be expected in runoff.Scenario I is represented by a horizontal line in Figure 5. Inthis purely inorganic scenario mean annual d34S values ofatmospheric input did not change over time.[25] Scenario II is biological fractionation during organic
S cycling in soil. Isotope selectivity of some organicreactions involving S has been documented by Krouse etal. [1992], Gebauer et al. [1994], Novak et al. [1996, 2000,2001b], Norman et al. [2002], and others. If the internalsulfur source or sink is biologically fractionated with respectto runoff, we expect the catchments to fall along a down-ward-sloping line, in accordance with equation (4).
Figure 4. Site-to-site correlations between d34S in runoff and d34S of soils and bedrock. The d34S ofrunoff is strongly correlated with all three soil horizons, but not with bedrock (see Table 3). The d34S of Ohorizon soils is correlated with runoff, but is isotopically lighter, by an average of 1.72 ± 0.23 per mil(mean ± standard error) across the 13 sites. The dotted line in Figure 4a indicates this average isotopicoffset. The isotopic difference between soils and runoff is smaller in the A/B horizons (averaging 0.69 ±0.28 per mil), and is not statistically significant in the C horizon (averaging 0.25 ± 0.32 per mil). No errorbars are shown for bedrock d34S; these were measured on a single composited sample, and thusuncertainty estimates are unavailable.
Figure 5. Conceptual diagram illustrating sulfur isotopepatterns expected for four alternative scenarios of S retentionand release in catchments (see text for explanation).
GB4012 NOVAK ET AL.: S ISOTOPES IN 13 CATCHMENTS
10 of 14
GB4012

[26] In scenario III, if old pollutant S were isotopicallylighter than today’s atmospheric input, and were storedin the catchment and gradually released via runoff, thecatchments could fall within the lower gray polygon ofFigure 5. No within-catchment fractionation is invoked inthis inorganic scenario.[27] In scenario IV, if old pollutant S were isotopically
heavier than today’s atmospheric input, and were stored in
the catchment and gradually released via runoff, the catch-ments could fall within the upper gray polygon of Figure 5.No within-catchment fractionation is invoked in thisinorganic scenario.[28] On a mass basis, most pollution in central Europe
occurred after 1950. We have no evidence that d34S ofindustrial S emissions was changing from the 1950s to the1990s. A minor though statistically significant shift towardlower d34S of deposited S occurred in the northern part ofthe Czech Republic between 1993 and 1996 [Novak et al.,2001a], which might argue against scenario III, however,most of the S stored within the catchments probably comesfrom the period prior to 1993 (soil S pool size � yearlyatmospheric S input [Novak et al., 2000]).[29] Figure 6 shows the relationship between the isotopic
shift from deposition to runoff (dout � din) and the catchmentmass balance ratio (Qout � Qin) /Qin for the 13 studycatchments. Catchment S mass balances from 1997 wereused to calculate the x axis of Figure 6a, whereas a nine-yearlong time series of S mass balances from 1994–2002was used in Figure 6b [Fottova, 2003]. Either data set wasconsistent with a downward-sloping line, i.e., consistentwith scenario II. The data therefore suggest that biologicalprocesses that fractionate S isotopes controlled the reten-tion/release of S across the 13 catchments. The slope of theline was statistically significant at a confidence level of>99% in both figures, and was consistent between thetwo figures (0.71 ± 0.24 in Figure 6a and 0.76 ± 0.20 inFigure 6b). The intercept was not statistically significant ineither figure, consistent with equation (4). To the extent thatthe catchments conform to a single mixing line, equation (4)implies that the internal source or sink in each catchmentwas isotopically fractionated by the same amount (�0.7%)relative to runoff. This implies that the mechanisms ofretention/release of S are not site-specific. Rather, it sug-gests that organic S cycling of atmogenic, mainly pollutantS, occurring predominantly in the O and A/B soil horizon,plays a significant role across the sites. Collectively, theseresults suggest that catchments that were previouslyextremely polluted are releasing S from the same reservoirin which S is still being accumulated in low-pollution areas.This reservoir, complex in nature, is dominated by organicsoil S, but may also include adsorbed sulfate which itselfwas formed during oxidation of organic S.[30] The exact contribution of primary atmospheric
sulfate desorbed from soil Al and Fe sesquioxides to runoffis not known. This is because of large uncertainties in soilhorizon thickness and stoniness in the studied catchments(for within-site elevation spans, which affect the horizonthickness, see Table 1 [cf. Huntington et al., 1988]). At JEZ,where a soil mass inventory was taken using 15 soil pits,runoff contained about 60% of S cycled in soil and 40% ofunaltered atmospheric S [Novak et al., 2000]. The export ofsecondary sulfate containing organically cycled S fromcatchments is hydrology-driven, just like the export ofdesorbed atmogenic sulfate. More mineralized S (secondarysulfate) and desorbed atmogenic S (primary sulfate) arereleased in wet years than in dry years. Dry warm summersresult in enhanced rates of S mineralization supplying moresulfate for export by subsequent storm flow. This essentially
Figure 6. Sulfur isotopic shift between average depositionand runoff in 1997, as a function of the net release orretention of sulfur at 13 Czech catchments in (a) 1997 and(b) 1994 through 2002. Error bars are ±1 standard error. Netcatchment source or sink of sulfur, calculated from massbalance between deposition and runoff fluxes, is expressedas a ratio to the deposition flux. Plotted in this way, the dataare expected to fall along a single mixing line if the internalcatchment source or sink in each catchment is isotopicallyfractionated by the same amount relative to runoff (see text).The slope of the regression line indicates the average d34S ofthe internal source or sink, relative to the d34S of averagedeposition (see text). Thin dotted lines indicate 95%confidence envelope for the regression line.
GB4012 NOVAK ET AL.: S ISOTOPES IN 13 CATCHMENTS
11 of 14
GB4012

climatic control of catchment S dynamics has been recentlydescribed for Canadian catchments [Eimers and Dillon,2002]. In a similar manner, it may operate at the Czechsites. At JEZ, for example, a warm, dry year in 1998(570 mm of annual precipitation) was followed by a wetteryear in 1999 (950 mm). Over the same period, S exportincreased dramatically from 40 to 65 kg ha�1 yr�1, despitedecreasing air pollution.
3.13. Comparison of the Model With Isotope Data onD34S of S Forms in Soil
[31] The single S source and sink makes our model rathersimplified. In the future, a more detailed model may bedeveloped using multicompartment soil S reservoirs. Withthe exception of JEZ [Novak et al., 1995, 2000], theabundance of individual S forms in forest soils and theirisotope systematics has not been studied in the Czechcatchments. However, S speciation in a number of Europeanspruce forest soils exhibits common features [Mayer etal., 2001; Novak et al., 2003]: (1) sites near industrial Semission sources have higher O horizon Stotal pool thanunpolluted sites; (2) 75–95% of O horizon S is formedby organic C-bonded S, and the proportion of organicC-bonded S tends to increase with atmospheric S loads;(3) with an increasing soil depth the proportion of organicS decreases while that of inorganic sulfate S increases; and(4) ester-sulfate S is mostly less abundant than inorganicsulfate S, making up <20% of total S.[32] Sulfur isotope speciation in soil appears to be more
site-specific than concentration patterns. Most sites exhibitincreasing d34S values of organic C-bonded S with anincreasing depth, and these values are similar to the d34Svalues of total soil S [Novak et al., 1996, 2003]. At mostsites, d34S values of organic S are higher than d34S values ofinorganic soil sulfate [Chae and Krouse, 1987; Schoenauand Bettany, 1989; Mayer et al., 1995; Novak et al., 2003].The d34S values of ester-sulfate S are higher than d34Svalues of C-bonded S at relatively unpolluted sites, butlower than d34S values of all other S forms in soil at heavilypolluted sites [Novak et al., 2003]. At historically pollutedsites where d34S values of spruce throughfall, soil S formsand lysimeter solutes are known, the following isotopesystematics prevails: d34Slysimeters � d34Sadsorbed sulfate in soil
< d34Sorganic C-bonded S < d34Sspruce throughfall. It appears that Sof inorganic sulfate adsorbed in soils is isotopically system-atically lighter than both organic C-bonded S and atmo-spheric input. These limited data on soil S isotopespeciation are consistent with our catchment-level isotopesystematics at sites releasing S in two respects: (1) bothlysimeter solutes and runoff tend to contain isotopicallylight sulfate S, and (2) atmospheric sulfate S is isotopicallyheavier than sulfate leaving the soil profile. Both featurescorroborate the prevalence of secondary sulfate, containingorganically cycled S, in soils and runoff.
4. Conclusions
[33] We constructed S isotope mass balances for 13forested catchments spanning a 10-fold S deposition gradi-ent in Central Europe. From 1987, the year of maximumindustrial S emission rates, to 1997, the year of intensive S
isotope monitoring, anthropogenic S emission rates de-creased by 50% owing to industry restructuring and instal-lation of scrubbers in coal-burning power plants. In 1997,we found that catchments with a history of extreme pollu-tion were releasing 1–3 times more S than the contempo-rary atmospheric S input, whereas relatively unpollutedcatchments were still accumulating S. Using nearly 500d34S determinations of individual S pools and fluxes wewere able to show that the excess S in runoff at the pollutedsites was not bedrock-derived, but instead was older pol-lutant S which had been temporarily stored in soil. Isotopesprovided evidence that weathering of common rocks, suchas gneisses and granitoids, supplies a negligible amount of Sto stream runoff. Across the sites, the d34S values of runoffwere strongly correlated with the soil O horizon, whose Swas predominantly organic, and always isotopically lighterthan S in runoff. The sulfur isotopic composition of thedischarge depended on whether the catchment accumulatedor released S. The d34S values of runoff were lower than thed34S of average atmospheric deposition at sites releasing S,and higher than the d34S of the input at sites accumulating S.The sink for the retained S and the source of the releasedS was isotopically fractionated by the same amount relativeto runoff. It has been known from previous studies thatinorganic adsorption/desorption of sulfate does not frac-tionate S isotopes [Van Stempvoort et al., 1990], whereasbiological S cycling is isotopically selective [Novak et al.,1996, 2001b]. Thus the within-catchment source/sink ofS was mainly organically cycled soil S. We developed amodel to show that the sink and source of S within thecatchment was the same along a steep pollution gradient.The mechanisms of S storage in these forest catchmentswere not site-specific, but rather organic cycling played animportant role over a wide range of atmospheric S inputs(13 to 130 kg S ha�1 yr �1). Using isotopes, we hadpreviously demonstrated the importance of organic S cyclingat two sites in the highly polluted northern Czech Republic(JEZ, NAC [Novak et al., 2000]). Sulfur isotope data fromour 13 catchments show that these conclusions are applica-ble across a considerably wider pollution gradient.
[34] Acknowledgments. This research was supported by grants fromthe Czech Grant Agency (grant 526/02/1061), the Czech Geological Survey(grant 6605), and the U.S National Science Foundation (EAR-0125550).Final portions of this work were funded by the Scientific Center ‘‘AdvancedRemedial Technologies and Processes’’ of the Ministry of Education of theCzech Republic (1M4674788502). The authors thank Vladimir Blaha andMiroslav Tesar for field assistance. Special thanks go to Jaromir Sikl, VeraJanovska, Karel Zak, and Frantisek Buzek for their help in the laboratory.
ReferencesAlewell, C., and A. Giesemann (1996), Sulfate reduction in a forestedcatchment as indicated by delta S-34 values of sulfate in soil solutionsand runoff, Isotopes Environ. Health Stud., 32, 203–210.
Alewell, C., M. Bredemeier, E. Matzner, and K. Blanck (1997), Soilsolution response to experimentally reduced acid deposition in a forestecosystem, J. Environ. Qual., 26, 658–665.
Ambuster, M., M. Abyi, and K. H. Feger (2003), The biogeochemistryof two forested catchments in the Black Forest and the eastern OreMountains (Germany), Biogeochemistry, 65, 341–368.
Andreae, M. O., and W. A. Jaeschke (1992), Exchange of sulphur betweenbiosphere and atmosphere over temperate and tropical regions, in SulphurCycling on the Continents, SCOPE Ser., vol. 48, edited by R. W.Howarth, J. W. B. Stewart, and M. V. Ivanov, pp. 27–66, John Wiley,Hoboken, N. J.
GB4012 NOVAK ET AL.: S ISOTOPES IN 13 CATCHMENTS
12 of 14
GB4012

Bailey, S. W., B. Mayer, and M. J. Mitchell (2004), Evidence for influenceof mineral weathering on stream water sulphate in Vermont and NewHampshire (USA), Hydrol. Processes, 18, 1639–1653.
Balesdent, J., C. Girardin, and A. Mariotti (1993), Site-related d13C of treeleaves and soil organic matter in a temperate forest, Ecology, 74, 1713–1721.
Bottrell, S. H., and M. Novak (1998), Sulphur isotopic study of two pristineSphagnum bogs in the western British Isles, J. Ecol., 85, 125–132.
Buzek, F., J. Hanzlik, M. Hruby, and P. Tryzna (1991), Evaluation ofthe runoff components on the slope of an open-cast mine by means ofenvironmental isotopes 18O and T, J. Hydrol., 127, 23–36.
Buzek, F., J. Hruska, and P. Kram (1995), Three component model ofrunoff generation, Lysina catchment, Czech Republic, Water Air SoilPollut., 79, 391–408.
Canfield, D. E., R. Raiswell, J. T. Westrich, C. M. Reaves, and R. A. Berner(1986), The use of chromium reduction in the analysis of reducedinorganic sulfur in sediments and shales, Chem. Geol., 54, 149–155.
Cerny, J. (1993), Atmospheric deposition in the Krusne hory Mountains:Preliminary results of throughfall measurements, Acta Univ. CarolinaeGeol., 37, 29–44.
Cerny, J. (1995), Recovery of acidified watersheds in the extremelypolluted Krusne hory Mountains, Czech Republic, Water Air Soil Pollut.,85, 589–594.
Cerny, J., and T. Paces (1995), Acidification in the Black Triangle Region:Field Trip Guide, 96 pp., Czech Geol. Surv., Prague.
Chae, Y. M., and H. R. Krouse (1987), Alteration of sulfur-34 naturalabundance in soil by application of feedlot manure, Soil Sci. Soc. Am.J., 50, 1425–1430.
Chakrabarti, J. N. (1978), Analytical procedures for sulfur in coal desulfur-ization products, in Analytical Methods for Coal and Coal Products,edited by C. Karr Jr., pp. 279–323, Elsevier, New York.
Dostalova, Z., I. Hunova, V. Novak, J. Ostatnicka, J. Proskova, andJ. Sladecek (2004), Air Pollution and Atmospheric Deposition in theCzech Republic in 2003, 132 pp., Czech Hydrometeorol. Inst., Prague.
Driscoll, C. T., G. E. Likens, and M. R. Church (1998), Recovery of surfacewaters in the northeastern U.S. from decreases in atmospheric depositionof sulfur, Water Air Soil Pollut., 105, 319–329.
Eimers, M. C., and P. J. Dillon (2002), Climate effects on sulphate fluxfrom forested catchments in south-central Ontario, Biogeochemistry, 61,337–355.
Ferm, M., and H. Hultberg (2004), Neutralisation of sulphur dioxidedeposition in a coniferous canopy, Water Air Soil Pollut. Focus, 4,237–245.
Fiala, J., J. Ostatnicka, I. Hunova, V. Novak, and J. Sladecek (1998), AirPollution in the Czech Republic in 1997, 190 pp., Czech Hydrometeorol.Inst., Prague.
Finley, J. B., J. I. Drever, and J. T. Turk (1994), Sulfur isotope dynamics ina high-elevation catchment, West Glacier Lake, Wyoming, Water Air SoilPollut., 79, 227–242.
Forsius, M., S. Kleemola, J. Vuorenmaa, and S. Syri (2001), Fluxes andtrends of nitrogen and sulfur compounds at integrated monitoring sites inEurope, Water Air Soil Pollut., 130, 1641–1648.
Fottova, D. (2003), Trends in sulphur and nitrogen deposition fluxes in theGEOMON network, Czech Republic, between 1994 and 2000, Water AirSoil Pollut., 150, 73–87.
Fottova, D., and I. Skorepova (1998), Changes in mass element fluxes andtheir importance for critical loads: GEOMON network, Czech Republic,Water Air Soil Pollut., 105, 365–376.
Fowler, D., J. H. Duyzer, and D. D. Baldocchi (1990), Inputs of tracegases, particles and cloud droplets to terrestrial surfaces, Proc. R. Soc.Edinburgh Sect. B Biol., 97, 35–59.
Gebauer, G., A. Giesemann, E. D. Schulze, and J.-H. Jager (1994), Isotoperatios and concentrations of sulfur and nitrogen in needles and soils ofPicea abies stands as influenced by atmospheric deposition of sulfur andnitrogen compounds, Plant Soil, 164, 267–281.
Groscheova, H., M. Novak, M. Havel, and J. Cerny (1998), Effect ofaltitude and tree species on d34S of deposited sulfur (Jezeri catchment,Czech Republic), Water Air Soil Pollut., 105, 287–295.
Hall, G. E. M., J.-C. Pelchat, and J. Loop (1988), Separation and recoveryof various sulphur species in sedimentary rocks for stable sulphurisotopic determination, Chem. Geol., 67, 35–45.
Howarth, R. W., J. W. B. Stewart, and M. V. Ivanov (Eds.) (1992), SulphurCycling on the Continents, SCOPE Ser., vol. 48, 350 pp., John Wiley,Hoboken, N. J.
Hruska, J., and P. Kram (2003), Modelling long-term changes in streamwater and soil chemistry in catchments with contrasting vulnerability toacidification (Lysina and Pluhuv Bor, Czech Republic), Hydrol. EarthSyst. Sci., 4, 525–539.
Hruska, J., F. Moldan, and P. Kram (2002), Recovery from acidificationin Central Europe—Observed and predicted changes of soil and streamwater chemistry in the Lysina catchment, Czech Republic, Environ.Pollut., 120, 261–274.
Hunova, I., J. Santroch, and J. Ostatnicka (2004), Ambient air quality anddeposition trends at rural stations in the Czech Republic during 1993-2001, Atmos. Environ., 38, 887–898.
Huntington, T. G., D. F. Ryan, and S. P. Hamburg (1988), Estimating soilnitrogen and carbon pools in a northern hardwood forest ecosystem, Soil.Sci. Soc. Am. J., 52, 1162–1167.
Innes, J. (1993), Forest Health: Its Assessment and Status, 677 pp., CABInt., Wallingford, UK.
Jedrysek, M. O., A. Kaluzny, and J. Hoefs (2002), Sulphur and oxygenisotope ratios in spruce needles as a tracer of atmospheric pollution,J. Geophys. Res., 107(D18), 4353, doi:10.1029/2001JD000527.
Johnson, C. M., and H. Nishita (1952), Microestimation of sulfur in plantmaterials, soils and irrigation waters, Anal. Chem., 24, 736–742.
Kellog, W. W., R. D. Cadle, E. R. Allen, A. L. Azrus, and E. Martell(1972), Atmospheric S cycle, Science, 175, 587.
Kester, C. L., J. S. Baron, and J. T. Turk (2003), Isotopic study of sulfatesources and residence times in a subalpine watershed, Environ. Geol., 43,606–613.
Knoller, K., A. Fauville, B. Mayer, G. Strauch, K. Friese, and J. Veizer(2004), Sulfur cycling in an acid mining lake and its vicinity in Lusatia,Germany, Chem. Geol., 204, 303–323.
Kopacek, J., J. Vesely, and E. Stuchlik (2001), Sulphur and nitrogen fluxesand budgets in the Bohemian Forest and Tatra Mountains during theIndustrial Revolution (1850–2000), Hydrol. Earth Syst. Sci., 5, 391–405.
Kram, P., and J. Hruska (1994), Influence of bedrock geology on elementalfluxes in two forested catchments affected by high acidic deposition,Appl. Hydrogeol., 2, 50–58.
Kram, P., J. Hruska, B. S. Wenner, C. T. Driscoll, and C. E. Johnson (1997),The biogeochemistry of basic cations in two acid-impacted forestcatchments with contrasting lithology, Biogeochemistry, 37, 173–202.
Krouse, H. R., A. H. Legge, and H. M. Brown (1984), Sulphur gas emis-sions in the boreal forest: West Whitecourt case study V. Stable sulphurisotopes, Water Air Soil Pollut., 22, 321–347.
Krouse, H. R., A. Giesemann, and P. Staniaszek (1992), Sulphur isotopecomposition of co-existent sulphate and organic S in vegetation, paperpresented at Sulphur Transformations in Soil Ecosystems Workshop,Univ. of Calgary, Saskatoon, Sask., Canada.
Likens, G. E., C. T. Driscoll, D. C. Buso, M. J. Mitchell, G. M. Lovett, S. W.Bailey, T. G. Siccama, W. A. Reiners, and C. Alewell (2002), Thebiogeochemistry of sulfur at Hubbard Brook, Biogeochemistry, 60,235–316.
Mach, K., K. Zak, and I. Jackova (1999), Sulphur speciation and isotopiccomposition in a vertical profile of the main coal seam of the NorthBohemian brown coal basin and their paleogeographic interpretation,Bull. Czech Geol. Surv., 74, 51–66.
Mayer, B., K. H. Feger, A. Giesemann, and H.-J. Jager (1995), Interpreta-tion of sulfur cycling in two catchments in the Black Forest (Germany)using stable sulfur and oxygen isotope data, Biogeochemistry, 30, 321–358.
Mayer, B., J. Prietzel, and H. R. Krouse (2001), The influence of sulfurdeposition rates on sulfate retention patterns and mechanisms in aeratedforest soils, Appl. Geochem., 16, 1003–1019.
Mayer, R., and B. Ulrich (1974), Conclusions on filtering action of forestsfrom ecosystem analysis, Oecol. Plant., 9, 157–168.
Michel, R. L., D. Campbell, D. Clow, and J. T. Turk (2000), Timescales formigration of atmospherically derived sulphate through an alpine/subal-pine watershed, Loch Vale, Colorado, Water Resour. Res., 36, 27–36.
Mitchell, M. J., and R. D. Fuller (1988), Models of sulfur dynamics inforest and grass ecosystems with emphasis on soil processes, Biogeo-chemistry, 5, 133–163.
Mitchell, M. J., M. B. David, and R. B. Harrison (1992), Sulphur dynamicsin forest ecosystems, in Sulphur Cycling on the Continents, SCOPE Ser.,vol. 48, edited by R. W. Howarth, J. W. B. Stewart, and M. V. Ivanov,pp. 215–260, John Wiley, Hoboken, N. J.
Mitchell, M. J., B. Mayer, S. W. Bailey, J. W. Hornbeck, C. Alewell, C. T.Driscoll, and G. E. Likens (2001), Use of stable isotope ratios for eval-uating sulfur sources and losses at the Hubbard Brook ExperimentalForest, Water Air Soil Pollut., 130, 75–86.
Moldan, F., V. Kronnas, A. Wilander, E. Karltun, and B. J. Cosby (2004),Modelling acidification recovery of Swedish lakes, Water Air Soil Pollut.Focus, 4, 139–160.
Morth, C. M., P. Torssander, M. Kusakabe, and H. Hultberg (1999), Sulfurisotope values in a forested catchment over four years: Evidence foroxidation and reduction processes, Biogeochemistry, 44, 51–71.
GB4012 NOVAK ET AL.: S ISOTOPES IN 13 CATCHMENTS
13 of 14
GB4012
Nadelhoffer, K. J., and B. Fry (1988), Controls on natural nitrogen-15 andcarbon-13 abundances in forest soil organic matter, Soil Sci. Soc. Am. J.,52, 1633–1640.
Norman, A. L., A. Giesemann, H. R. Krouse, and H. J. Jager (2002),Sulphur isotope fractionation during sulphur mineralization: Results ofan incubation-extraction experiment with a Black Forest soil, Soil Biol.Biochem., 34, 1425–1438.
Novak, M., and E. Prechova (1995), Movement and transformation of 35S-labelled sulfate in the soil of a heavily polluted site in the Northern CzechRepublic, Environ. Geochem. Health, 17, 83–94.
Novak, M., R. K. Wieder, and W. R. Schell (1994), Sulfur during earlydiagenesis in Sphagnum peat: Insights from d34S ratio profiles in 210Pb-dated peat cores, Limnol. Oceanogr., 39, 1172–1185.
Novak, M., S. H. Bottrell, H. Groscheova, F. Buzek, and J. Cerny (1995),Sulfur isotope characteristics of two North Bohemian forest catchments,Water Air Soil. Pollut., 85, 1641–1646.
Novak, M., S. H. Bottrell, D. Fottova, F. Buzek, H. Groscheova, and K. Zak(1996), Sulfur isotope signals in forest soils of Central Europe along anair pollution gradient, Environ. Sci. Technol., 30, 3473–3476.
Novak, M., J. W. Kirchner, H. Groscheova, M. Havel, J. Cerny, R. Krejci,and F. Buzek (2000), Sulfur isotope dynamics in two Central Europeanwatersheds affected by high atmospheric deposition of SOx, Geochim.Cosmochim. Acta, 64, 367–383.
Novak, M., I. Jackova, and E. Prechova (2001a), Temporal trends in theisotope signature of air-borne sulfur in Central Europe, Environ. Sci.Technol., 35, 255–260.
Novak, M., S. H. Bottrell, and E. Prechova (2001b), Sulfur isotope inven-tories of atmospheric deposition, spruce forest floor and living Sphagnumalong a NW-SE transect across Europe, Biogeochemistry, 53, 23–50.
Novak, M., F. Buzek, A. F. Harrison, E. Prechova, I. Jackova, andD. Fottova (2003), Similarity between C, N and S stable isotope profilesin European spruce forest soils: Implications for the use of d34S as atracer, Appl. Geochem., 18, 765–779.
Novak, M., R. L. Michel, E. Prechova, and M. Stepanova (2004), Themissing flux in a 35S budget for the soils of a small polluted catchment,Water Air Soil Pollut. Focus, 4, 517–529.
Novak, M., M. Adamova, R. K. Wieder, and S. H. Bottrell (2005a), Sulfurmobility in peat, Appl. Geochem., 20, 673–681.
Novak, M., M. A. Vile, S. H. Bottrell, M. Stepanova, I. Jackova, F. Buzek,E. Prechova, and R. J. Newton (2005b), Isotope systematics of sulfateoxygen and sulfate-sulfur in six European peatlands, Biogeochemistry, inpress.
Paces, T. (1985), Sources of acidification in central Europe estimated fromelemental budgets in small basins, Nature, 315, 31–36.
Peters, N. E., J. Cerny, M. Havel, and R. Krejci (1999), Temporal trends ofbulk precipitation and stream water chemistry (1977–1997) in a smallforested area, Krusne hory, northern Bohemia, Czech Republic, Hydrol.Processes, 13, 2721–2741.
Prechtel, A., et al. (2001), Response of sulphur dynamics in Europeancatchments to decreasing sulphate deposition, Hydrol. Earth Syst. Sci.,5, 311–325.
Prietzel, J., C. Weick, J. Korintenberg, G. Seybold, T. Thumerer, andB. Treml (2001), Effects of repeated (NH4)2SO4 application on sulfurpools in soil, soil microbial biomass, and ground vegetation of two water-sheds in the Black Forest (Germany), Plant Soil, 230, 287–305.
Saltzman, E. S., G. W. Brass, and D. A. Price (1983), The mechanismof sulfate aerosol formation: Chemical and sulfur isotopic evidence,Geophys. Res. Lett., 10, 513–516.
Santroch, J., J. Honzak, M. Mitosinkova, and J. Skoda (1988), Quality ofprecipitation on the territory of Czechoslovakia (in Czech), Meteorol.Bull., 42, 144–189.
Schoenau, J. J., and J. R. Bettany (1989), 34S natural abundance variationsin prairie and boreal forest soils, J. Soil Sci., 40, 397–413.
Schulz, H., A. Giesemann, and M. Gehre (2004), Influence of reduced Sinputs on the sulfate pool in the humus layer and sulfate uptake in Pinussylvestris L. as indicated by natural isotope variations of sulfur and oxy-gen, J. Appl. Bot. Food Qual., 78, 18–24.
Shanley, J. B., P. Kram, J. Hruska, and T. D. Bullen (2004), A biogeochem-ical comparison of two well-buffered catchments with contrastinghistories of acid deposition, Water Air Soil Pollut. Focus, 4, 517–529.
Van Stempvoort, D. R., E. J. Reardon, and P. Fritz (1990), Fractionation ofsulfur and oxygen isotopes in sulfate by soil sorption, Geochim. Cosmo-chim. Acta, 54, 2817–2826.
Vile, M. A., R. K. Wieder, and M. Novak (2000), 200 years of Pb deposi-tion throughout the Czech Republic: Patterns and sources, Environ. Sci.Technol., 34, 12–20.
Wesselink, L. G., K. J. Meiwes, E. Matzner, and A. Stein (1995), Long-term changes in water and soil chemistry in spruce and beech forests,Solling, Germany, Environ. Sci. Technol., 29, 51–58.
Wieder, R. K. (1989), A survey of constructed wetlands for acid minedrainage treatment in the eastern United States, Wetlands, 9, 299–315.
Yanagisawa, F., and H. Sakai (1983), Precipitation of SO2 for sulphurisotope ratio measurements by the thermal decomposition of BaSO4-V2O5-SiO2 mixtures, Anal. Chem., 55, 985–987.
Zhang, Y., M. J. Mitchell, M. Christ, G. E. Likens, and H. R. Krouse(1998), Stable sulfur isotopic biogeochemistry of the Hubbard BrookExperimental Forest, New Hampshire, Biogeochemistry, 41, 259–275.
�������������������������D. Fottova, J. Hru�ska, I. J�ackova, P. Kram, M. Novak, and E. Pr�echova,
Department of Geochemistry, Czech Geological Survey, Geologicka 6, 15200 Prague 5, Czech Republic. ([email protected])J. W. Kirchner, Department of Earth and Planetary Science, University
of California, Berkeley, CA 94720-4767, USA.
GB4012 NOVAK ET AL.: S ISOTOPES IN 13 CATCHMENTS
14 of 14
GB4012


![Applicability of bed load transport models for mixed‐size ...seismo.berkeley.edu/~kirchner/reprints/2015_126...mann, 2001, 2012; Yager et al., 2007, 2012a]. Bed load transport in](https://img.pdfslide.net/doc/110x75/60237d044cbd7d03851d5c4a/applicability-of-bed-load-transport-models-for-mixedasize-kirchnerreprints2015126.jpg)