Embed Size (px)
Citation preview

THIS REPORT CONTAINS ASSESSMENTS OF COMMODITY AND TRADE ISSUES MADE BY
USDA STAFF AND NOT NECESSARILY STATEMENTS OF OFFICIAL U.S. GOVERNMENT
POLICY
Date:
GAIN Report Number:
Approved By:
Prepared By:
Report Highlights:
Israel is a technologically advanced, market-oriented economy. Consumers are sophisticated and enjoy
cosmopolitan food tastes. Since 2011 there has been increasing public pressure to decrease the high cost
of living. As such, the government of Israel has begun to take steps to allow for greater imports of food
and agricultural products. Currently, 16.7 percent of household expenditures are dedicated to food
products. In spite of some continued barriers to trade with the United States, Israel remains a promising
market for U.S. exporters.
Jessica Shay, Agricultural Marketing Specialist and Bret Tate, Regional Agricultural Attaché
Mariano J. Beillard, Senior Regional Agricultural Attaché
2017 Annual
Exporter Guide
Israel
12/21/2017
Required Report - public distribution

2
SECTION I: MARKET OVERVIEW
Overall Business Climate Israel is a parliamentary democracy of approximately 8.75 million people (September 2017 estimate).
Of that population, around 75 percent are Jewish and 25 percent are non-Jewish, mostly Arab (Muslims
and Christians). The country’s area is 20,330 square kilometers, making it slightly smaller than the U.S.
state of New Jersey. Current population growth is 1.8 percent per annum. Israel is a sophisticated,
industrialized free-market economy, with a diversified manufacturing sector. Israel’s main export
market is the European Union (EU-28).
Israel’s gross domestic product (GDP) growth in recent years has ranged from two to five percent per
annum. Israeli GDP increased by four percent in 2016. The Bank of Israel is projecting that in 2017 the
GDP will increase by 3.1 percent and in 2018 to 3.3 percent. Much of Israel’s recent economic growth
can be attributed to the growth of start-up firms. The Bank of Israel’s prime rate is expected to remain at
its current level of 0.1 percent during much of the coming year. Israel’s unemployment rate decreased
significantly in recent years, reaching 4.1 in September 2017; the lowest rate in twenty years. This is
down from 4.8 percent in 2016 and 5.3 percent in 2015. Current projections expect it to decrease to 3.5
percent in the coming year.
In 2016, Israeli imports increased by 9.4 percent, while the county’s export increased by a mere 2.5
percent. The Bank of Israel forecasts a 2.6 percent increase in Israeli imports and a 3.1 percent increase
in exports in 2017.
Israel has a 120-member unicameral legislature, known as the Knesset. For the fourth consecutive time,
Prime Minister Benjamin Netanyahu’s Likud Party won a plurality in the March 2015 elections. The
Likud Party was able to form a government with 30 of the 120 parliamentary seats. The party’s primary
rival, the center-left Zionist Union Alliance, won 24 seats. The government coalition holds only a one
seat majority in the Knesset (61 seats), and may face challenges in the passage of legislation.
Currently, there are heightened tensions in Israel with regard to security. There is concern that the war in
Syria could spill over, posing a threat to Israel and other neighboring countries. Concurrently, the
protracted peace process with the Palestinian Authority remains at an impasse, creating potential for
ongoing security concerns.
The U.S. Department of State recently published the 2017 Investment Climate Statement. That report
contains additional information on Israeli economics, politics, legal and regulatory systems, dispute
resolution, corruption, labor, and intellectual property rights.
Israel’s Market Characteristics
Israel is a technologically advanced, market-oriented economy. Consumers are sophisticated and enjoy
cosmopolitan food tastes. Despite recent popular protests over food prices and the high cost of living,
Israelis remain willing to pay more for high-value products.
Israel’s limited land and water resources preclude a high level of agricultural self-sufficiency; this
affects local production costs and consumer prices. The country posts sizeable trade deficits in food and

3
agricultural products, importing large volumes of feed grains and sizable volumes of consumer oriented
products.
Cost of Living Israeli consumers in 2011 began to protest the high cost of living, which was well above the average for
countries in the Organization for Economic Cooperation and Development (OECD). The Israeli
government responded by creating a number of committees to study the issue and make policy
recommendations.
One specific set of recommendations impacting dry food imports was approved in 2014 and entered into
force September 30, 2016. The new policy, known as the “Cornflakes Law,” opened up some food
imports to independent traders operating outside of the manufacturer’s distribution system or what are
referred to as parallel imports. Products such as pasta, breakfast cereals, cookies, crackers, snacks, rice
and beans can now be imported into Israel by independent traders, increasing competition and
decreasing prices. This measure currently does not apply to sensitive food products (i.e., eggs, milk,
beef, and infant formula), for which the requirement of individual permits remains. The list of sensitive
foods is periodically updated (see, Appendix II). Under this system, imports of non-sensitive foods will
be unrestricted, provided that they meet predetermined standards.
In 2015, the Israeli Ministries of Agriculture and Economy began to take significant steps to reduce the
prices of staple food for Israeli consumers. Duty-free quotas and reduced import fees for a number of
food products, such as fish and cheese, were put in place. A number of the quotas are being allocated
through a competitive process based on a maximum consumer price; aiming to ensure that the benefit
from duty-free imports is carried from importers to consumers.
Food and Agricultural Product Consumption According to the latest Israeli Household Expenditure Survey, there were 2.49 million households in
Israel with an average of 3.3 people per household. The monthly average household expenditures in
2016 totaled about New Israeli Shekels (Shekel – NIS) 15,805 (approximately $4,160), up 2.6 percent
from 2015. Of total expenditures in 2016, 16.7 percent were allocated to food and agricultural products,
making a total of $8,336 annually spent on food and agricultural products per household. This is up 0.4
percent from 16.3 percent in 2015. Food, excluding fruit and vegetables, accounted for 13.4 percent of
purchases. Fruits and vegetables accounted for the remaining 3.3 percent. The largest single expenditure
in 2015 on food was meals away from home, at 2.8 percent, followed by meats and poultry, at 2.6
percent.
The Israeli food industry is expanding rapidly and consumer habits are changing accordingly. Over the
recent past, Israelis are eating out more frequently and to selecting premium foods. Table 1 shows food
as a percentage of total household expenditures, clearly demonstrating the increased expenditures on
meals away from home and the concomitant decrease in spending on staple goods, such as bread, dairy
products and eggs. Meals away from home, and meat and poultry make up the highest percentages,
followed by near equal percentages of dairy, cereals, and fruits or vegetables. These trends are
indicative of higher-income consumers with the purchasing power to eat away from home and to
consume increasing levels of animal protein.
Table 1: Israel, Monthly Consumption Expenditures (as a percentage), 2000-2015

4
Source: Israeli Central Bureau of Statistics, FAS Tel Aviv office research.
Table 2 further illuminates the correlation between food consumption and income. In this chart, the
population is ranked according to income and divided into deciles, where the tenth decile represents the
highest 10 percent of incomes and the first decile represents the lowest 10 percent of incomes.
Table 2: Monthly Expenditures in Deciles of Israeli Households, 2015
Source: Household Expenditure Survey, 2015, Israeli Central Bureau of Statistics, FAS Tel Aviv office research.
Surprisingly, spending on food is reasonably steady amongst the bottom half of incomes, while overall

5
consumption decreases as incomes decrease. Higher income deciles tend to spend more on animal
proteins (meats, fish, and dairy), alcohol, fruits and vegetables. Similarly, the higher income deciles
greatly outspend their peers on food away from home.
Israel’s Trade Agreements
Israel is a member of the World Trade Organization (WTO) and party to a number of free trade
agreements (FTA). In addition to the United States–Israel Free Trade Agreement, it has FTAs with
Canada, Mexico, Turkey, the European Union, EFTA (Iceland, Liechtenstein, Norway, and
Switzerland), and the MERCOSUR countries (i.e., Argentina, Brazil, Paraguay, Uruguay, and
Venezuela). Agreements with India, Panama, Vietnam, South Korea, Ukraine, and China are under
discussion and a FTA with Colombia is awaiting ratification by Colombia. Israel also participates in
qualified industrial zone (QIZ) programs with Jordan and Egypt; these grant third-party countries access
to the U.S.-Israel FTA for products containing a minimum percentage of Israeli content.
Following the 1985 U.S.-Israel FTA, a bilateral Agreement on Trade in Agricultural Products (ATAP)
was signed in 1996. In 2004 a successor agreement was signed, effective through 2008. Since then,
annual extensions have been issued to allow the parties to negotiate a permanent agreement. Under the
current FTA-ATAP regime, virtually any product produced in Israel that can be competitive in the U.S.
market can enter the U.S. duty-free. In contrast, U.S. products continue to face high tariffs in many
sectors limiting their access or penetration into the Israeli market. The current ATAP regime provides
U.S. food and agricultural products access to the Israeli market under one of three different categories:
1) unlimited duty-free access; 2) duty-free tariff rate quotas (TRQ); or 3) preferential tariffs set at least
10 percent below Israel’s Most Favored Nation (MFN) rates. The U.S. government and industry
continue to pressure for negotiation of a permanent agreement in agricultural products.
Israel’s Imports of Food and Agricultural Products
In 2016, imports of food and agricultural products (Harmonized Tariff Schedule Chapters 1-24) to Israel
totaled around $5.6 billion, a six percent increase compared to 2015. The EU-28, Israel’s main trading
partner, held a 41 percent share, while the United States captured just nine percent of the market. Food
and agricultural product imports account for nine percent of Israel’s total import bill.
Table 3: U.S. Supplier Strengths and Weaknesses

6
Advantages Challenges The U.S.-Israel FTA offers the United States tariff
rate quotas for some products and reduced duties for a
number of others.
Most quotas are for products for which the United States has no
comparative advantage or for which Israel has no import needs.
The average U.S. quota fill use is only 32 percent. Some fresh
produce lacking risk assessments cannot enter Israel. Israel is
unwilling to phase-out tariffs.
Kosher products have a high market share in Israel;
large supermarket chains and hotels buy only kosher
products. Over 10,000 American companies produce
kosher products; U.S. products have a comparative
advantage.
Many U.S. firms are unresponsive to Israeli requests to do
business.
Israel is adopting EU-28 standards, which, in many cases, are
more restrictive than international standards.
High living costs are forcing a reconsideration of
tariffs and quotas. Temporary duty-free quotas for
some fresh fruits and vegetables and dairy products,
are possible.
The EU-28 is Israel’s main trading partner; a new agricultural
agreement was signed in November 2009, resulting in greater
market access on both sides.
After a 13 year ban on U.S. beef, the Israeli
veterinary services lifted the ban in February 2016.
Most frozen beef imported by Israel originates from South
America and Eastern Europe, both of which have strong price
advantages over U.S. beef products.
The Israeli consumer is already familiar with U.S.
products and is receptive to additional products.
Kosher requirements are strict; consumers are demanding high-
level kosher certification for their food products.
Israeli and Palestine’s economies are linked. U.S.
exporters can use Israel as a gateway to the
Palestinian market.
The recent upsurge in violence could hurt trade.
Import requirements are strict, new-to-market products are
often detained at port.
Israel’s per capita consumption of fresh fruits and
vegetables is high.
Israel refuses the U.S. request for a complete tariff phase-out
under the agreement on agricultural products.
Israelis are health-conscious, preferring to eat a
balanced diet. Supermarkets are carrying more
products that were once only available at specialty
stores. U.S. products are known for their high quality
and wholesomeness.
The hotel, restaurant, and institutional sector generally prefer
imports from nearby countries.
Israel is almost completely dependent on imports to
meet its grain, oilseeds, and feed needs and the
United States is one of the largest worldwide
suppliers.
Many Israeli traders consider the Black Sea region a natural
source for grains due to its proximity and the convenience of
small- and medium-sized cargoes.
SECTION II: EXPORTER BUSINESS TIPS
Potential U.S. exporters should establish business relationships with reliable and efficient Israeli
importers and distributers. These will help identify the appropriate distribution and sales channels.
Exporters are encouraged to meet with Israeli importers in person to explore business opportunities.
Face-to-face meetings tend to build confidence and facilitate communication. FAS Tel Aviv can
facilitate exchanges of U.S. exporters to Israel or of Israeli buyers to U.S. food shows or conventions.
Exporters able to supply in large quantities should approach large Israeli food retail chains. Food
retailers like Shufersal and Rami Levi have their own purchasing and importing divisions. Suppliers
should contact the purchasing or importing divisions of these large food chains, especially for new-to-

7
market food products as they have the most experience with branding and distribution. FAS Tel Aviv
has a list of local importers and can help with contact information. Exporters should consider customers’
price sensitivity, product requirements, purchasing policies, and volumes.
Additional Marketing Tips:
Direct marketing is common through mail, phone, email, etc.
Telephone marketing is increasingly common, but with mixed results.
The internet is widely used in Israel, and an increasingly direct marketing avenue as Israel has a
very competitive and dynamic telecommunications market with one of the highest mobile and
household broadband penetration rates in the world.
Israel has an extensive road network that connects the entire country, as well as advanced inland
and international transport facilities. Rental cars, taxis and limousines with drivers are readily
available for visitors. U.S. drivers may rent cars with a valid U.S. or international driver’s
license. One of the most notable advances in transport in Israel in recent years is the
modernization of the train system. Commuter trains run from Tel Aviv to most of the large cities,
including Jerusalem and Ben Gurion Airport. Extensive freight services are available and most
often used between Haifa, the main port in the north, and Ashdod, Israel’s primary port in the
south.
Ben Gurion International Airport offers connections to major international destinations. Ben
Gurion is the country’s center of air passenger and cargo operations. Several companies still
provide internal flights between Tel Aviv, Haifa, and Eilat from Sde Dov airport.
Roughly 40 percent of Israel's 8.5 million people are concentrated in the greater Tel Aviv
metropolitan area, Israel's commercial and financial center. Other major concentrations of
population are the Haifa metropolitan area (15 percent), a major port city and center for the
petrochemical and high tech industries, and Jerusalem (11 percent).
For first-time exporters, it is important to note that distinct cultural differences between Israel
and the United States may in some cases dictate changes in selling, advertising, and marketing.
Although many strategies used by firms in the United States can be equally effective in Israel,
U.S. companies should understand that selling in Israel is not the same as selling in the domestic
U.S. market.
Israel's tariff classification is based on the Harmonized Tariff System (HS). Israel’s Customs and
Purchase Tax Tariff is the main instrument used for the classification of goods. The correct
classification of goods is the key to determining tax rates, as well as obtaining various
authorizations, permits and licenses. It is recommended to contact a professional customs broker
prior to export.
Almost all goods are imported through Israel's two Mediterranean ports, Haifa in the north and
Ashdod in the south, and through Ben Gurion International Airport. These ports have good
transportation links to the rest of the country. While most companies are headquartered in the Tel
Aviv or Haifa metropolitan areas, a growing number of firms maintain branches, showrooms, or
service facilities in Jerusalem and Be'er Sheva.
El Al Airlines, United Airlines and Delta Airlines operate daily direct flights from Tel Aviv to
New York, Philadelphia, and Los Angeles.
A visa is not required for U.S. citizens traveling for tourism or short-term business projects.
Visitors are entitled to remain in Israel up to three months from the date of their arrival, in
accordance with the conditions of the visa issued to them upon their entrance to Israel.

8
U.S. travelers can refer to the Department of State’s International Travel Information for the
most up-to-date information on Travel Warnings and Visa Requirements for Israel.
Local Business Practices and Customs Hebrew and Arabic are the two official languages of Israel. English is the third and principal
international language; the use of Russian is also prevalent. Many signs in public places are in all three
languages and most Israelis are multilingual.
Business hours are Sunday through Thursday from 8:00 a.m. to 5:00 p.m. for most businesses and
government offices. Occasionally, business people will be willing to hold meetings on Friday mornings.
Most business and restaurants close on the Jewish Sabbath, Friday sundown until Saturday sundown.
Jewish Holidays in Israel are mainly in September, October, and April. Exporters should take note of
Israeli holidays, as their Israeli counterparts will be closed on those dates. Additionally, there is no
public transportation on the Jewish Sabbath and some Jewish holidays.
General Consumer Tastes and Preferences Israeli consumers tend to demand kosher products and many of the larger supermarket chains only carry
kosher foods. Similarly, many hotels, restaurants and industrial buyers only source kosher products. As
Israeli incomes have increased, consumers have also become more health-conscious thereby further
shifting food demand toward products considered wholesome or healthy.
During the last decade, an increasing share of consumers, as many as 61 percent, preferred to buy their
products through supermarket chains, instead of through the traditional channels of open markets and
small grocery stores. This trend is combined with marked improvements in price competition, resulting
from the 2011 consumer protests.
Israeli consumers identify private label brands good quality at a lower price. Supermarket chains tout
private labeling as a growth engine and as a way to compete with well-known brands. The total market
share of private label products is increasing. Shufersal is Israel’s largest supermarket chain, private
brand products accounted for 20 percent of all its retail sales in 2016 compared to 15 percent in 2015.
Online shopping is continuing to gain popularity, as retailers improve websites and create more user-
friendly platforms. Due to consumer price-sensitivity, some websites, such as Shufersal, offer a button
to present more affordable alternatives to selected products. A second button allows consumers to see
healthier alternatives in terms of calories, fat or sodium to those selected. These advances, along with
improved distribution and delivery are encouraging growth in online shopping.
Kosher Certification Since December 1994, Israel has banned the import of non-kosher meat and meat products. The Chief
Rabbinate of Israel retains exclusive jurisdiction over the Kashrut law and kosher certification,
including the recognition of kosher certifying bodies outside of Israel. Kosher certifications are costly
and drive up retail beef prices. While kosher certification poses a significant challenge to many U.S.
beef exporters, imports of non-kosher beef offal are permissible. With the exception of meat (beef,
poultry, mutton and products thereof) there is no legal requirement that imported food and agricultural
products to be kosher. However, non-kosher products struggle to make inroads into the local market

9
since Israel’s large supermarket chains and hotels normally opt to not to carry such items.
Tariff Protection Over the years the OECD has found that Israeli consumers are paying higher than global average prices
for food and agricultural products. Indirect support programs designed to help Israeli farmers and
ranchers are based on trade protectionism. These measures needlessly drive up local food prices. Many
of the OECD Review of Agricultural Policies: Israel 2010 report’s conclusions still hold. Although
government supports have fallen over time, some market distorting policies remain.
FAS Tel Aviv finds that Israel’s tariff profile for some agricultural products (i.e., dairy, meat, eggs, and
some fruits and vegetables) continues to remain prohibitively high on many product lines. Indicative of
the uneven nature of Israel’s tariff profile are the low tariffs, even sometimes duty-free status, for certain
coarse grains and oilseeds.
Israel Import Documentation and Requirements and Food Standards and Regulations Specifics on Israel’s import documentation requirements are in the latest FAIRS – Israel 2017 reports.
Customs Procedures: Valuation and the VAT
1. Customs Valuation and Tax: Israel has implemented the WTO Customs Valuation Agreement.
Under WTO regulations, the basis for valuation is the transaction value. In most cases the cost,
insurance, and freight (CIF) price are included.
Israel's tariff classification is based on the Harmonized Tariff System. Israel’s Customs and
Purchase Tax Tariff is the main instrument used for classifying imports. The correct
classification of goods is the key to determining correct duty rates. It is utilized for obtaining
authorizations, permits, licenses, and meeting all other conditions for the import of goods.
2. Value Added Tax: As of October 1, 2015, the value added tax (VAT) was lowered from 18
percent to 17 percent. The tax is imposed on all products and services, with the exception of
fresh vegetables and fruits.
Recommendations for U.S. Food and Agricultural Product Exporters Exporters that adhere to following recommendations will stand a better chance of success in accessing
the Israeli agricultural and food market:
1. A U.S. Certificate of Free Sale, obtained from the U.S. Food and Drug Administration (FDA),
facilitates the Israeli Ministry of Health’s import licensing procedures.
2. Given that Israel is adopting EU-28 standards, U.S. exporters already familiar with EU-28 import
requirements will have better success in gaining entry to the Israeli market.
3. Products certified as being manufactured under Good Manufacturing Practices (GMP) or Hazard
Analysis and Critical Control Points (HACCP) will have greater ease of access to the Israeli
market.
4. Being included on the FDA’s list of registered facilities is viewed favorably by Israel’s import
licensing authority. It provides confirmation that the exporting manufacturer’s facility has been
inspected by the FDA and or U.S. Department of Agriculture.
5. Products must have a minimum shelf life of six months upon port arrival.

10
SECTION III: MARKET SECTOR STRUCTURE AND TRENDS
Retail Food Market In 2016, over 60 percent of the sales of the total retail food market were from supermarket chains. The
food retail market is made up of supermarket chains, as well as urban convenience stores and gas
stations, neighborhood grocery stores; and markets. Convenience stores generally operate with
continuous opening hours, throughout the entire week.
There are ten leading supermarket retailers. Large supermarket facilities are located in the outskirts of
the large cities near major roads and tend to offer parking. Smaller neighborhood supermarkets are
conveniently located, but tend to be more expensive.
The leading retail supermarkets in Israel are: Shufersal, Yenot Bitan, Rami Levi, Hasikma Distribution,
and Osher Add. Israel’s largest retail producer and seller of pork and non-kosher products is Tiv Ta’am.
Online Food Market E-commerce in Israel has grown 25 percent over the past three years. The online food market is the
largest online market in Israel. The Israeli online food market is expected to grow 20 percent annually
until 2020. E-commerce food sales total $631 million today.
Food Processing Industry The Israeli food processing industry is innovative; marketing approximately 5,000 new products per
year. The industry includes a number of technologically sophisticated companies. Many of these have
joined forces with international companies to improve access to raw materials and overseas markets.
Many also operate in foreign markets on their own. Multi-national food manufacturers like Nestlé,
Unilever, Danone, and Pepsi partner with well-known Israeli food companies such as Osem and Strauss.
These partnerships capitalize on the size and sophistication of the Israeli market. They utilize the local
market and its manufacturing practices to gauge the commercial viability of new product and health
developments. The local food processing industry is dominated by four groups (Tnuva, Osem-Nestlé,
Unilever, and Straus). Limited competition in the food processing sector has increased consumer food
prices.
Leading Food and Beverages Suppliers The leading food and beverages suppliers in Israel are Tnuva Ltd., Strauss Group Ltd. and Osem,
controlling nearly one third of the market. The top ten suppliers’ market share accounts for over 56
percent of the total market.

11
Table 4: Israel, Top 10 Food and Beverages Suppliers, (YTD October 2017)
Food Supplier Market Share 2016
YTD
Market Share 2017
YTD
Tnuva Ltd. 13.6% 13.7%
Strauss Group Ltd 9.9% 10.0%
Osem 8.6% 8.4%
Central Company for Beverage Distribution
Ltd. 6.4%
6.3%
Unilever Israel Diplomat 4.4% 4.3%
Neto Trade Ltd. (ex. fresh meat and fish) 3.1% 3.3%
Diplomat 3.1% 3.0%
Sano 2.8% 2.8%
Hogla Kimberly 2.4% 2.4%
Tempo 2.1% 2.0%
Source: FAS Tel Aviv office research.
Israeli Market Trends The food service industry is expanding and consumer habits are changing. Israelis are dining out more
frequently and choosing more premium food products.
Culinary Traditions: Israel’s food culture is as diverse as its inhabitants. The country is a melting pot of
different culinary traditions, which ranges from Eastern European to North African traditional Jewish
cooking. Additionally, there are strong Arab and Mediterranean influences, making Middle Eastern
foods very popular.
Beef and Seafood: Israelis are increasingly demanding high-quality beef and seafood products when
dining out. This has spurred the opening of more high-end beef and seafood restaurants. Many of these
restaurants can be located through Israel’s restaurant guide, the country’s restaurant and food sector’s
major internet portal. The online guide has the most up-to-date information on restaurants, bars, cafes,
and kosher restaurants in Israel.
Health Trend: Israeli consumers are increasingly health-conscious and aware of the need to eat a
balanced diet. Local food manufacturers, importers, retailer and restaurants are adjusting product lines
and menus for a growing population of vegans, vegetarians, and the gluten-sensitive. Supermarkets are
beginning to carry gluten-free rolls, organic products and whole wheat pastas that were once available at
specialty stores. Cafes have also followed this trend – starting from low-calorie servings and onward to
vegetarian menus and vegan dishes.
In spite of these trends, many people still struggle to find the right balance between health and
indulgence, unwilling to compromise on taste. Many local manufacturers are pitching the notion of
balanced health and indulgence in their marketing campaigns.
Private Labeling: Adoption of private labels is increasing as consumers demand lower retail prices with
guarantees of product quality. Consumers are increasingly identifying private labeling with lower prices
and reasonable product quality. Supermarket chains hail private labeling as a growth engine and as a
tool to fight the market power of the major manufacturers.

12
Israeli Consumer Priorities: Based on a survey conducted by Nielsen Israel in March 2016, “taste” is
the most influential factor in purchasing food, followed by “health” and “price,” at 34 percent, 28
percent and 27 percent, respectively. Six percent of survey participants indicated that the country of
origin is an influential factor; four percent indicated that the brand is an influential factor, and only one
percent indicated that the “packaging design” is an influential factor.
This survey finds that 50 percent of consumers prefer to buy locally produced products; three percent
prefer imported products, while the remaining 47 percent do not hold a preference. Of the participants
87 percent stated that they prefer Israeli products for nationalist reasons, 41 percent find that the taste
and quality of Israeli products is superior, and 17 percent buy Israeli products out of habit.
Food Service - Hotel Restaurant Institutional According to the most recent publications, the value of Israel’s service sector in 2015 stood at $136
billion. Israel’s hotel, restaurant and institutional (HRI) accounts for nine percent, or $12.2 billion, of
that service sector.
The Israeli HRI food service sector is highly complex and diverse. Setting local culinary trends is Tel
Aviv, Israel’s food and cultural hub. The city benefits from a young urban population, with 25-29 year-
olds representing eight percent of the total, while 30-34 year-olds make up nine percent of the city’s
population.
In Israel there are approximately 20,000 companies active in the HRI sector. The sector includes
accommodation services (hotels, guesthouses, rural lodging) and food services (restaurants, coffee
shops, catering companies and pubs). This includes 383 hotels with around 51,316 rooms and an
additional 6,434 rooms in the rural lodging sub-category. The larger hotel chains tend to have central
purchasing offices, as do large caterers.
Sources indicate that roughly 35 percent of food service businesses are kosher certified. Nevertheless
many of the non-kosher certified restaurants utilize only kosher ingredients.
The Israeli Defense Force (IDF), the Israeli Police, and Israeli Prison Service are a significant
component of the HRI sector; they count with central purchasing offices. Their purchases are usually
handled through a competitive bidding system. Foreign companies can bid to supply the sector using a
local representative.
FAS Tel Aviv recommends that U.S. exporters focus on establishing business relationships with a
reliable and efficient importer, agent, distributor or the final HRI customer. It is advisable to identify
efficient distribution and sales channels.
Firsthand visits by U.S. exporters, manufacturers, and investors to explore opportunities and meet with
Israeli importers and investors strengthen confidence with local partners. Visiting local HRI shows and
exhibiting at the main food shows in Europe (i.e., ANUGA, SIAL), which leading Israeli firms attend, is
a quick means of obtaining a broad overview of the sector. Such visits also assist in establishing a broad
network of contacts.
13
Large HRI firms have their own purchasing or importing division to handle food imports directly.
Suppliers from the United States should initially contact the purchasing or importing divisions of these
large hotel and restaurants chains.
Well-known American brands are present in Israel under a franchise agreement including McDonalds,
Pizza Hut, Domino’s Pizza, Ben and Jerry’s, and others. Israel’s franchise industry has been developing
rapidly in recent years. The franchisees are local companies. Interested U.S. companies who are
considering entering the Israeli market should contact FAS Tel Aviv for further information.
Israel has no official centralized legislation for franchises. The industry’s rules and regulations are
primarily derived from Israeli contract law and intellectual property legislation. In 2006, the Franchise
Promotion Center, a public institution that promotes franchising in Israel, published a ‘Code of Ethics’
for the franchise industry. Though not a binding law, many franchisees have already provided their
support and have used it to set new standards in the franchise industry.
Israel does not have specific regulations applicable exclusively to foreign companies. Nevertheless,
there are important cultural and religious factors which foreign firms must consider, including kosher
and Sabbath regulations. Sources indicate that Starbucks and Dunkin’ Donuts met with limited success
in Israel due to differences in consumer tastes and pricing issues. Locale ambiance is extremely
important. An establishment’s management and product variety must be tailored to blend in with the
local environment and consumer preferences.
Venues Shopping malls and centers are popular in Israel. Over 200 shopping centers exist and others are
planned. American specialty shops, chain stores, and franchises have outlets in malls and shopping
centers. When marketing to these venues, the key to success is offering a variety of new products that
meet Israeli taste preferences.
The average floor size of a supermarket is 600 square meters. Some of the larger stores have areas of
1,000 - 3,000 square meters. Typical Middle Eastern-style open-air markets and small groceries serve
the remainder of the food market. In recent years, specialty food stores have developed in all of the main
metropolitan centers.

14
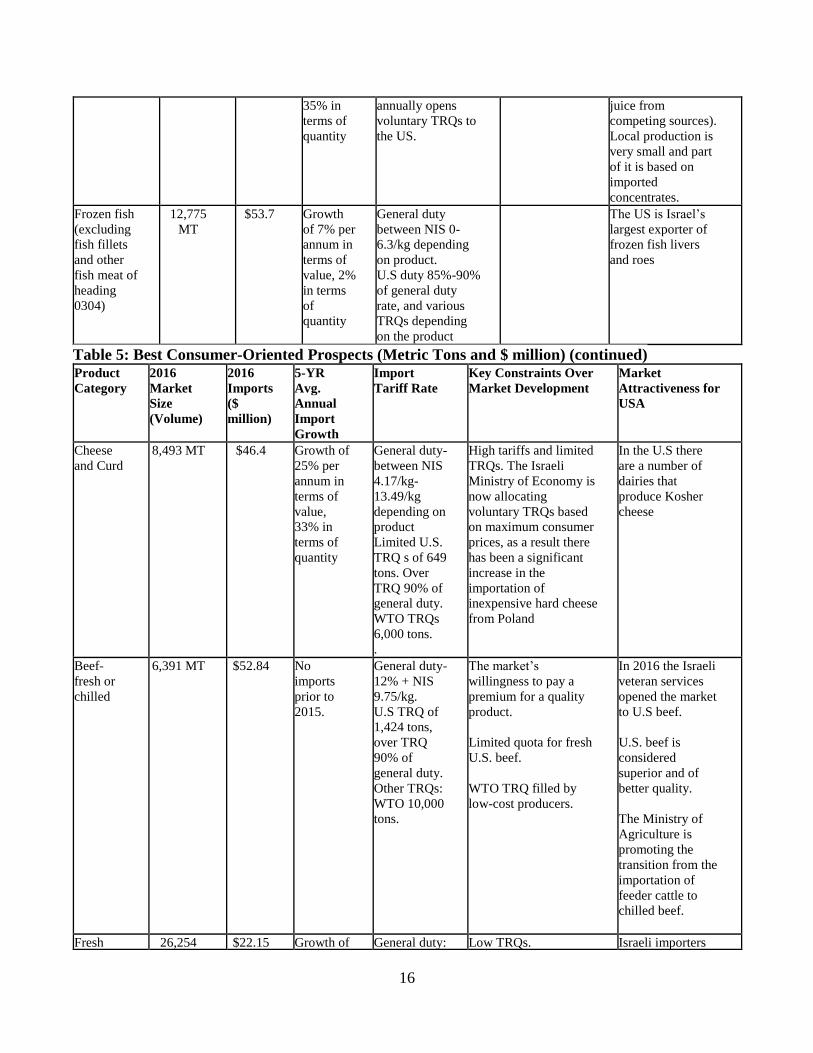
SECTION IV: BEST HIGH-VALUE PRODUCT PROSPECTS
Table 5: Best Consumer-Oriented Prospects (Metric Tons and $ million) Product
Category
2016
Market
Size
(Volume)
2016
Imports
($
million)
5-YR Avg.
Annual
Import
Growth
Import Tariff
Rate
Key
Constraints
Over Market
Development
Market
Attractiveness for
USA
Pistachios
(Shelled &
in shell)
3,204 MT $31.5 Growth of
8% per
annum in
terms of
value, 3%
in terms of
quantity
Pistachios from the
U.S face no import
duties.
Competition
mainly from
Turkey.
Demand for U.S.-
pistachios is strong
due to Turkish
imports facing high
import levies. U.S.
pistachios enter duty
free.
Almonds
(Shelled &
in shell)
3,577 MT $27.6 Growth of
76% per
annum in
terms of
value, 65%
in terms of
quantity
WTO TRQ of
1,700 MT for
shelled almonds
where a 100% duty
is paid on the first
container and 0%
on the second.
U.S. duty on
shelled almonds is
NIS 6.91/kg. The
U.S duty on in-
shell almonds is
NIS 5.21/kg, while
worldwide the duty
is NIS 8.52/kg.
Local
production is
protected by
high duties
Lower duties then
worldwide duties,
U.S almond
production industry
is strong
Cashew
(Shelled &
in shell)
3,805 MT $29.3 Growth of
7% per
annum in
terms of
value, 7%
in terms of
quantity
Duty is 4%. The
U.S. EU-28, Brazil,
Uruguay, Paraguay
and Argentina are
exempt from duty
Competition
mainly from
Vietnam and
India.
U.S. cashew enter
duty free
Walnuts
(Shelled &
in shell)
5,921 MT $33.2 Growth of
2% per
annum in
terms of
value, 13%
in terms of
quantity
Duty is 4%. U.S.
walnuts enter duty
free.
U.S. walnuts enter
duty free
Raisins 2,393 MT $6.7 Growth of
-3% per
annum in
terms of
value, 1%
in terms of
quantity
General duty for
bulk is NIS 6.62/
kg, but no more
than 340%.
WTO TRQ 600
tons. US 90% of
general duty.
General duty for
non-bulk is NIS
6.62/ kg, but no
Local
production is
protected by
high duties

15
more than 340%.
US TRQ of 1,294
tons. Over the U.S
TRQ no less than
NIS 2/kg.
Table 5: Best Consumer-Oriented Prospects (Metric Tons and $ million) (continued) Product
Category
2016
Market
Size
(Volume)
2016
Imports
($
million)
5-YR
Avg.
Annual
Import
Growth
Import Tariff
Rate
Key
Constraints
Over Market
Development
Market
Attractiveness for
USA
Prunes 2,154 MT $7.6 Growth
of 13%
per
annum in
terms of
value, 2%
in terms
of
quantity
The general duty
for bulk is NIS
0.98/ kg but no
more than 30%.
The general duty
for non-bulk is NIS
4.17/kg but no
more than 102%.
WTO of 1,500
tons, over the TRQ
NIS 2/kg. The U.S.
is granted a duty-
free TRQ of 2,000
tons which applies
to all prunes.
Over the U.S TRQ.
90% of general
duty.
Argentina and
Chile are
offering
significantly
lower prices
Ice Cream 2,769 MT $8.4 Growth
of 18%
per
annum in
terms of
value,
21% in
terms of
quantity
General duty is
4%.
The U.S. is granted
a duty-free TRQ of
113 tons. Above
the quota the tariff
is no less than NIS
0.55/kg.
Local ice cream
industry is very
strong.
There is a growing
demand for high
quality ice cream.
The US is a good
source for special
quality ice cream
products
Wine 6,880
thousand
liters
$29.7 Growth
of 5% per
annum in
terms of
value, 4%
in terms
of
quantity
General duty varies
according to wine:
NIS 1.15-3.59/liter.
The U.S. has a
TRQ of 200,000
liters.
80% of
consumption is
from local
production, and
the rest is
mainly from
France, Italy,
Spain, and the
U.S.
This market is likely
to become more
dynamic
Grape Juice 6,310 MT $6.14 Growth
of 14%
per
annum in
terms of
value,
General duty- 12-
30% f
U.S. duty 85% of
general duty.
The Israeli
Government
High tariffs There is a big
demand for grape
juice from the US
(the US grape juice
is considered better
in quality than the
16
35% in
terms of
quantity
annually opens
voluntary TRQs to
the US.
juice from
competing sources).
Local production is
very small and part
of it is based on
imported
concentrates.
Frozen fish
(excluding
fish fillets
and other
fish meat of
heading
0304)
12,775
MT
$53.7 Growth
of 7% per
annum in
terms of
value, 2%
in terms
of
quantity
General duty
between NIS 0-
6.3/kg depending
on product.
U.S duty 85%-90%
of general duty
rate, and various
TRQs depending
on the product
The US is Israel’s
largest exporter of
frozen fish livers
and roes
Table 5: Best Consumer-Oriented Prospects (Metric Tons and $ million) (continued) Product
Category
2016
Market
Size
(Volume)
2016
Imports
($
million)
5-YR
Avg.
Annual
Import
Growth
Import
Tariff Rate
Key Constraints Over
Market Development
Market
Attractiveness for
USA
Cheese
and Curd
8,493 MT $46.4 Growth of
25% per
annum in
terms of
value,
33% in
terms of
quantity
General duty-
between NIS
4.17/kg-
13.49/kg
depending on
product
Limited U.S.
TRQ s of 649
tons. Over
TRQ 90% of
general duty.
WTO TRQs
6,000 tons.
.
High tariffs and limited
TRQs. The Israeli
Ministry of Economy is
now allocating
voluntary TRQs based
on maximum consumer
prices, as a result there
has been a significant
increase in the
importation of
inexpensive hard cheese
from Poland
In the U.S there
are a number of
dairies that
produce Kosher
cheese
Beef-
fresh or
chilled
6,391 MT $52.84 No
imports
prior to
2015.
General duty-
12% + NIS
9.75/kg.
U.S TRQ of
1,424 tons,
over TRQ
90% of
general duty.
Other TRQs:
WTO 10,000
tons.
The market’s
willingness to pay a
premium for a quality
product.
Limited quota for fresh
U.S. beef.
WTO TRQ filled by
low-cost producers.
In 2016 the Israeli
veteran services
opened the market
to U.S beef.
U.S. beef is
considered
superior and of
better quality.
The Ministry of
Agriculture is
promoting the
transition from the
importation of
feeder cattle to
chilled beef.
Fresh 26,254 $22.15 Growth of General duty: Low TRQs. Israeli importers

17
Apples MT 30% per
annum in
terms of
value,
37% in
terms of
quantity
NIS 1.88/kg
though no
more than
553%.
U.S TRQ of
4,000 tons,
over TRQ
90% of
general duty.
The EU-28 has lower
shipping than the U.S.
In 2014 a fungal disease
was discovered in U.S.
apples and pears by the
Israeli Plant and
Protection Services.
like U.S.-origin
apple varieties.
SECTION V: KEY CONTACTS AND FURTHER INFORMATION
USDA/FAS/Office of Agricultural Affairs U.S. Embassy Tel Aviv
Foreign Agriculture Service
71 Hayarkon Street
Tel Aviv, Israel 63903
The Central Bureau of Statistics www.cbs.gov.il
Tel: +972-2-6592666
Fax: +972-2-6521340
66 Kanfei Nesharim Street
P.O. Box 34525
91342 Jerusalem, Israel
Food Control Service - Ministry of Health www.health.gov.il/english/Pages/HomePage.aspx
Tel: +972-3-6270100
Fax: +972-3-5619549
12 Ha’arba’a Street
64739 Tel Aviv, Israel
Israel Veterinary and Animal Health Services P.O. Box 12
50250 Bet Dagan, Israel
Plant Protection and Inspection Service Tel: +972-3-9681560
Fax: +972-3-9681582
P.O. Box 78
50250 Bet Dagan, Israel
Standards Institution of Israel

18
Tel: +972-3-6465154
Fax: +972-3-6419683
42 H. Levanon Street
69977 Tel Aviv, Israel
Ministry of Agricultural and Rural Development www.moag.gov.il
Tel: +972-3-9485436
Fax: +972-3-9485782
Maccabim Road, Rishon le Zion, P.O. Box 30
50250 Beit Dagan, Israel
Appendix I: STATISTICAL DATA
Table A: Israel, Key Trade and Demographic Information
Agricultural Imports from all Countries ($Mil) / US
Market Share (%)*
$5,630/8.64%
Consumer Food Imports from all Countries ($Mil) / US
Market Share (%)*
$2,971/9.24%
Edible Fishery imports from all Countries ($Mil) / US
Market Share*
$403/0.99%
Total Population (Millions) / Annual Growth Rate (%) 8.75/1.8%
Urban Population (Millions) / Annual Growth Rate (%) 7.98/1.8%
Number of Major Metropolitan Areas 4
Size of the Middle Class** (Millions) / Growth Rate (%) 2.62/1.8%
Per Capita Gross Domestic Product (US Dollars)* $37,292
Unemployment Rate (%) 4.1%
Per Capita Annual Food Expenditures (US Dollars)* $2,868
Percent of Female Population Employed 59.2%
Exchange Rate
Average exchange rate in 2016, $1.00 = ~NIS 3.84
Average exchange rate in 2017 [1] $1
= ~NIS 3.6 *2016 figure
**Population whose income is between 75-125 percent than the median income
Source: Israeli Central Statistics Bureau, FAS Tel Aviv office research.
Table B: Israel, Consumer Food & Edible Fishery Product Imports ($ million) Product
code
Product label Israel's imports from the
world
Israel's imports from the
United States
U.S.
share
2014 2015 2016 2014 2015 2016 2016
'02 Meat and edible meat offal 428.7 455.2 577.0 0.0 0.5 0.44 0.08%
'03 Fish and crustaceans,
mollusks and other aquatic
invertebrates
368.7 355.7 403.0 4.0 3.1 4.00 0.99%
'04 Dairy produce; birds' eggs;
natural honey; edible
products of animal origin,
not elsewhere
104.9 106.7 107.3 15.4 11.0 7.91 7.37%
'07 Edible vegetables and
certain roots and tubers
103.4 145.8 140.3 3.7 5.9 5.85 4.17%

19
'08 Edible fruit and nuts; peel of
citrus fruit or melons
271.3 267.1 260.4 143.7 143.3 119.52 45.89%
'09 Coffee, tea, mate and spices 133.1 146.8 145.4 2.3 1.8 2.06 1.41%
'16 Preparations of meat, of fish
or of crustaceans, mollusks
or other aquatic invertebrates
104.5 80.2 97.4 6.9 6.6 7.27 7.46%
'17 Sugars and sugar
confectionery
293.0 246.4 276.8 3.9 4.9 4.90 1.77%
'18 Cocoa and cocoa
preparations
182.9 185.4 200.3 2.7 3.5 3.76 1.88%
'19 Preparations of cereals,
flour, starch or milk; pastry
cooks' products
251.3 245.0 275.0 15.6 20.0 20.22 7.35%
'20 Preparations of vegetables,
fruit, nuts or other parts of
plants
216.4 224.5 256.4 36.2 40.1 35.29 13.76%
'21 Miscellaneous edible
preparations
362.5 337.0 335.6 51.8 51.7 52.81 15.74%
'22 Beverages, spirits and
vinegar
252.3 273.6 298.8 9.5 9.2 14.49 4.85%
Total 3,072.8 3,069.3 3,373.7 295.5 301.7 278.50 8.26%
Source: Israeli Central Statistics Bureau, FAS Tel Aviv office research. Table C: Israel, 15 Suppliers of Consumer Foods & Edible Fishery Products ($ million)
2013 2014 2015 2016
U.S. 266 296 302 279
United Kingdom 254 265 245 259
Italy 146 164 157 184
Netherlands 144 151 165 179
Uruguay 145 141 135 155
Poland 78 85 101 154
Norway 89 118 123 154
China 158 146 136 148
Turkey 94 110 121 135
Argentina 170 123 137 133
Germany 95 105 94 104
Paraguay 93 86 87 99
Brazil 78 86 70 98
France 79 83 96 95
Belgium 71 69 79 81
Total from the top 15 suppliers 1,960 2,028 2,048 2,258 Source: UN Comtrade Database, FAS Tel Aviv office research.

20
Appendix II: SENSITIVE FOOD PRODUCTS
1. Milk products, and milk products substitutes, including canned products
2. Meat and poultry products, and their substitutes, including canned products
3. Fish products and their substitutes, sea food, including canned products
4. Food supplements: vitamins, minerals and herbs
5. Baby food, including; infant formula, follow-up formula, baby porridge, puree baby food,
biscuits baby food and fruit juice baby food
6. Food products for people with metabolic disorders (for people with PKU; Gluten-free food
products; Lactose-free food products; Low calorie food products; Free of sugar food
products)
7. Canned food (pH >= 4.5)
8. Eggs products, including confectionery products that contain eggs
9. Gelatin products, including products that contain gelatin
10. Honey products according to the Israeli Honey Standards (SI 373)
11. Other food products that have to be storage in low temperature
12. Mineral water and other bottled water
13. Beverages that are based on mineral water
14. Mushroom products, which mushroom is a main ingredient
15. Food products for athletes
16. Color additives for the retail market
17. Mayonnaise and spreads that contain eggs
18. Food products containing caffeine above 150 ppm (excluding coffee and tea)
19. Fresh fruit and vegetables
20. Vitamins, minerals and amino acids, which is consumed by the food industry
21. Other kind of foods that the food and nutrition services decided that it’s a “sensitive” food
product Source: Israeli Ministry of Health, FAS Tel Aviv office research.

21