Embed Size (px)
Citation preview
THIS REPORT CONTAINS ASSESSMENTS OF COMMODITY AND TRADE ISSUES MADE BY
USDA STAFF AND NOT NECESSARILY STATEMENTS OF OFFICIAL U.S. GOVERNMENT
POLICY
Date:
Approved By:
Prepared By:
Report Highlights:
There are some 2.49 million households in Israel, averaging 3.3 persons. The annual average household
food expenditure (including fresh fruits and vegetables) in 2016 reached $8,429. Large food retail
chains have their own purchasing or importing division to handle food imports. Major supermarkets are
now importing directly from foreign suppliers to reduce costs. Over sixty-one percent of consumers buy
their food at supermarkets. Israel has passed a number of regulations concerning food consumption.
The Protection of Public Health Regulations (Food),"known as the "Cornflakes Law,” opens up of the
food import market to importers that do not have direct contact with foreign food manufacturers. The
Protection of Public Health Regulations (Food) (Nutritional Labeling encourages healthier food
consumption (effective January 2020).
Jessica Sullum Shay, Marketing Specialist and Bret Tate, Regional Agricultural Attaché
Mariano J. Beillard, Senior Regional Agricultural Attaché
Retail Foods 2017
Israel
12/27/2017
Required Report - public distribution

SECTION I. MARKET SUMMARY
Israel is a parliamentary democracy of approximately 8.75 million people (September 2017 estimate).
Of that population, around 75 percent are Jewish and 25 percent are non-Jewish, mostly Arab (Muslims
and Christians). The country’s area is 20,330 square kilometers, making it slightly smaller than the U.S.
state of New Jersey. Current population growth is 1.8 percent per annum. Israel is a sophisticated,
industrialized free-market economy, with a diversified manufacturing sector. Israel’s main export
market is the European Union (EU-28).
Israel’s gross domestic product (GDP) growth in recent years has ranged from two to five percent per
annum. Israeli GDP increased by four percent in 2016. Israel experienced deflation of 0.6 percent in
2015 and 0.5 percent in 2016. The deflation was due to a slowdown in global commodity prices and
relatively low economic activity. The inflation over the past year was 0.3 percent. The country’s
unemployment rate decreased significantly in recent years, reaching 4.1 in September 2017; the lowest
rate in twenty years. This is down from 4.8 percent in 2016 and 5.3 percent in 2015. Current projections
expect it to decrease to 3.5 percent in the coming year.
In 2016, Israeli imports increased by 9.4 percent, while the county’s export increased by a mere 2.5
percent. The Bank of Israel forecasts a 2.6 percent increase in Israeli imports and a 3.1 percent increase
in exports in 2017.
Table 1: Key Trade & Demographic Information
Total Population (millions) 8.75
Annual Growth Rate (%) 1.8%
Per Capita Gross Domestic Product (U.S. dollars) $37,292
Unemployment Rate (%) 4.1%
Per Capita Annual Food Expenditures (U.S. dollars) $2,868
Exchange Rate
Average exchange rate in 2016, $1.00 = ~NIS 3.84
Average exchange rate in 2017 $1 = ~NIS 3.6
Source: Israeli Central Statistics Bureau and Bank of Israel, FAS Tel Aviv office research.
Israel has a 120-member unicameral legislature, known as the Knesset. For the fourth consecutive time,
Prime Minister Benjamin Netanyahu’s Likud Party won a plurality in the March 2015 elections. The
Likud Party was able to form a government with 30 of the 120 parliamentary seats. The party’s primary
rival, the center-left Zionist Union Alliance, won 24 seats. The government coalition holds only a one
seat majority in the Knesset (61 seats), and may face challenges in the passage of legislation.
Currently, there are heightened tensions in Israel with regard to security. There is concern that the war in
Syria could spill over, posing a threat to Israel and other neighboring countries. Concurrently, the
protracted peace process with the Palestinian Authority remains at an impasse, creating potential for
ongoing security concerns.
The U.S. Department of State recently published the 2017 Investment Climate Statement. That report
contains additional information on Israeli economics, politics, legal and regulatory systems, dispute
resolution, corruption, labor, and intellectual property rights.
Israel’s Market Characteristics
Israel is a technologically advanced, market-oriented economy. Consumers are sophisticated and enjoy
cosmopolitan food tastes. Despite recent popular protests over food prices and the high cost of living,
Israelis remain willing to pay more for high-value products.
Israel’s limited land and water resources preclude a high level of agricultural self-sufficiency; this
affects local production costs and consumer prices. The country posts sizeable trade deficits in food and
agricultural products, importing large volumes of feed grains and sizable volumes of consumer oriented
products.
Cost of Living
In 2011 Israeli consumers began to protest the high cost of living, which was well above average for
countries in the Organization for Economic Cooperation and Development (OECD). The Israeli
government responded by creating a number of committees to study the issue and make policy
recommendations. One specific set of recommendations impacting dry food imports approved in 2014
(but entered into force September 30, 2016). The new policy, known as the “Cornflakes Law,” opened
up some food imports to independent traders operating outside of the manufacturer’s distribution
system. These are referred to as parallel imports. Products such as pasta, breakfast cereals, cookies,
crackers, snacks, rice and beans are now imported into Israel by independent traders, increasing
competition and decreasing prices (see, FAIRS – Israel 2016).
In 2015, the Israeli Ministries of Agriculture and Economy began to take significant steps to reduce the
prices of staple food for Israeli consumers. Duty-free quotas and reduced import fees for a number of
food products, such as fish and cheese, were put in place. A number of the quotas are being allocated
through a competitive process based on a maximum consumer price; aiming to ensure that the benefit
from duty-free imports is carried from importers to consumers.
Food and Agricultural Product Consumption
According to the latest Israeli Household Expenditure Survey, there were 2.49 million households in
Israel with an average of 3.3 people per household. The monthly average household expenditures in
2016 totaled about New Israeli Shekels (Shekel – NIS) 15,805 (approximately $4,160), up 2.6 percent
from 2015. Of total expenditures in 2016, 16.7 percent were allocated to food and agricultural products,
making a total of $8,336 annually spent on food and agricultural products per household. This is up 0.4
percent from 16.3 percent in 2015. Food, excluding fruit and vegetables, accounted for 13.4 percent of
purchases. Fruits and vegetables accounted for the remaining 3.3 percent. The largest single expenditure
in 2015 on food was meals away from home, at 2.8 percent, followed by meats and poultry, at 2.6
percent.
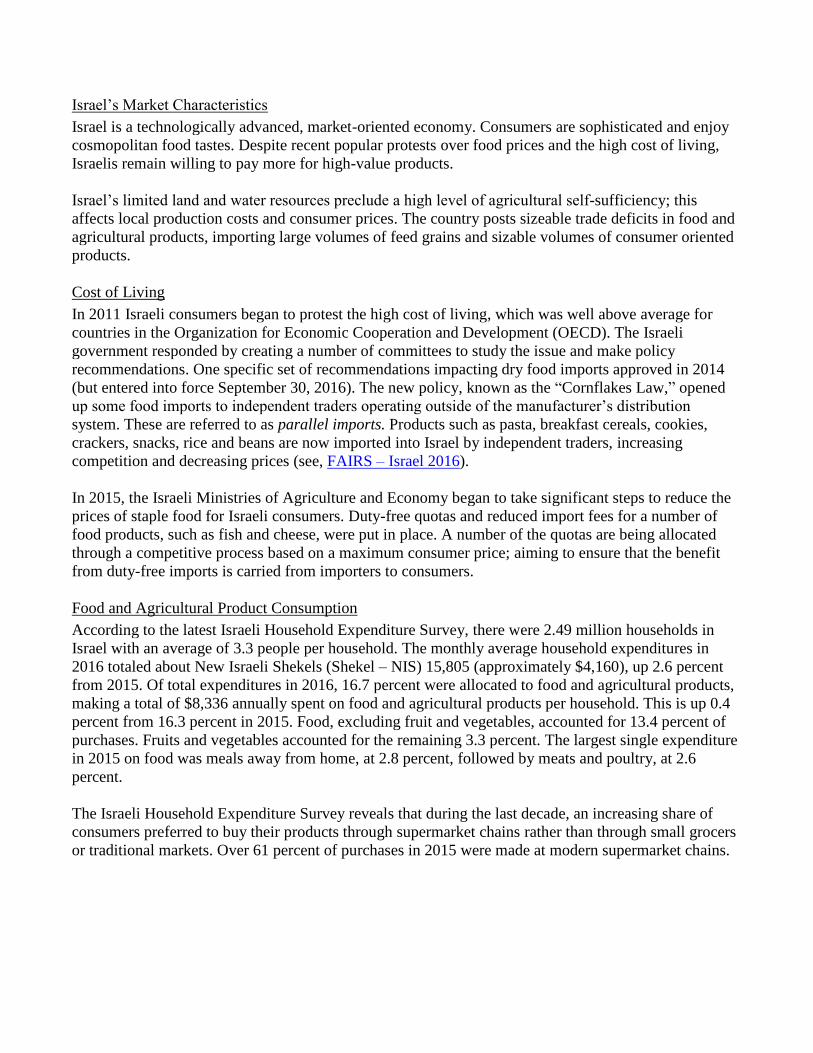
The Israeli Household Expenditure Survey reveals that during the last decade, an increasing share of
consumers preferred to buy their products through supermarket chains rather than through small grocers
or traditional markets. Over 61 percent of purchases in 2015 were made at modern supermarket chains.
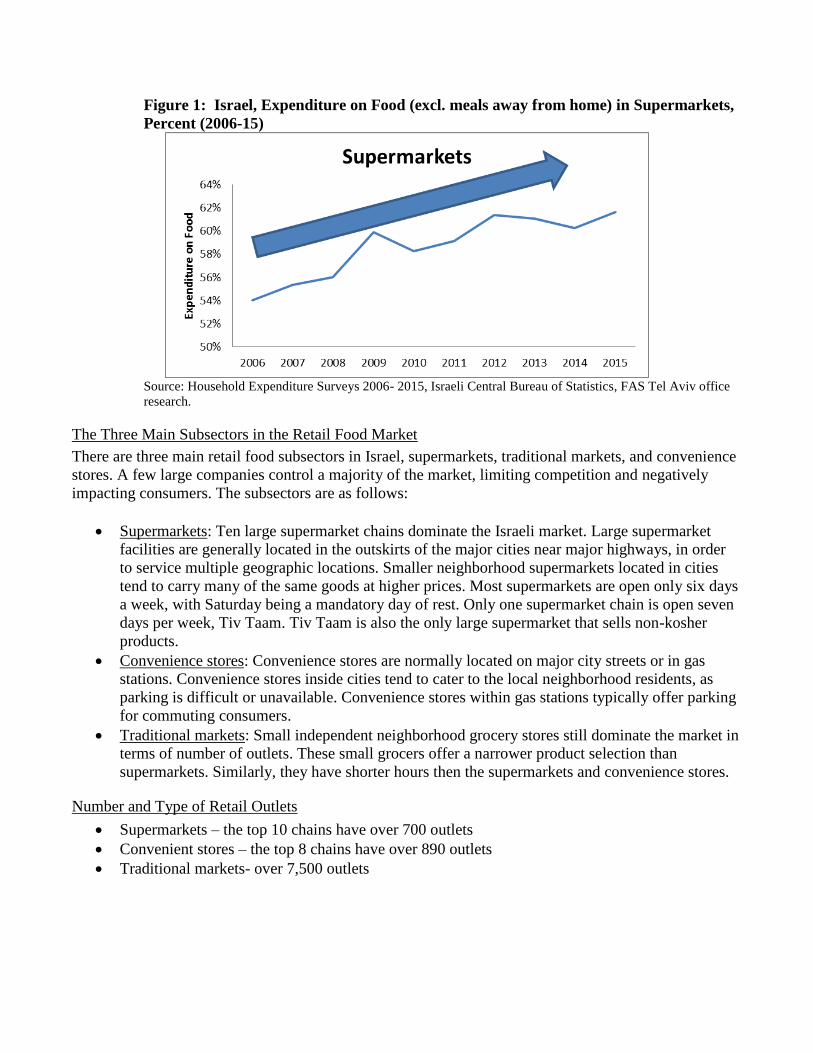
Figure 1: Israel, Expenditure on Food (excl. meals away from home) in Supermarkets,
Percent (2006-15)
Source: Household Expenditure Surveys 2006- 2015, Israeli Central Bureau of Statistics, FAS Tel Aviv office
research.
The Three Main Subsectors in the Retail Food Market
There are three main retail food subsectors in Israel, supermarkets, traditional markets, and convenience
stores. A few large companies control a majority of the market, limiting competition and negatively
impacting consumers. The subsectors are as follows:
Supermarkets: Ten large supermarket chains dominate the Israeli market. Large supermarket
facilities are generally located in the outskirts of the major cities near major highways, in order
to service multiple geographic locations. Smaller neighborhood supermarkets located in cities
tend to carry many of the same goods at higher prices. Most supermarkets are open only six days
a week, with Saturday being a mandatory day of rest. Only one supermarket chain is open seven
days per week, Tiv Taam. Tiv Taam is also the only large supermarket that sells non-kosher
products.
Convenience stores: Convenience stores are normally located on major city streets or in gas
stations. Convenience stores inside cities tend to cater to the local neighborhood residents, as
parking is difficult or unavailable. Convenience stores within gas stations typically offer parking
for commuting consumers.
Traditional markets: Small independent neighborhood grocery stores still dominate the market in
terms of number of outlets. These small grocers offer a narrower product selection than
supermarkets. Similarly, they have shorter hours then the supermarkets and convenience stores.
Number and Type of Retail Outlets
Supermarkets – the top 10 chains have over 700 outlets
Convenient stores – the top 8 chains have over 890 outlets
Traditional markets- over 7,500 outlets
Value of Consumer Sales
According to Storenext, Israel’s largest consumer market database, the Fast-Moving Consumer Goods
(FMCG) segment is in its fourth year of sales stagnation. Sales in 2017are estimated at 41.6 billion
shekels ($11.5 billion), while 2016 sales were 41 billion shekels ($10.8 billion), a marginal increase of
1.4 percent. The marginal increase in sales is well below the annual population increase of 1.8 percent.
Retailers are registering a clear decrease in sales per capita.
The sales in food products are the primary cause for the decline in FMCG sales. The stagnation is
explained both by changes in the composition of the products purchased by the consumer and by the
transition to private labels. Facing high food costs since 2011, Israeli consumers are opting for more
affordable products.
Figure 2: Value of Overall FMCG Sales (New Israeli Shekels –NIS)
Source: Storenext Data, FAS Tel Aviv office research.
Sales According to Retail Outlet Type
Independent small grocery stores struggle to compete with the supermarkets. In general, consumers
choose to shop at supermarkets over traditional markets due to more competitive prices and longer
operating hours. Supermarkets account for 64 percent of FMCG sales, followed by traditional markets at
33 percent and convenience stores at mere three percent.

Figure 3: Israel, Percent of FMCG Sales According to Retail Outlet Type
Source: Based on data from Storenext, FAS Tel Aviv office research.
Growth in Food Imports
Israel is experiencing an increase in food and beverage product imports. From April 2015 to April 2016,
there was a six percent increase in imports. The growth in imports is explained by a strong Shekel, as
well as the new policies designed to increase imports while expanding the number of importers.
The Government of Israel is pursuing lower custom fees and increasing import quotas for specific food
products, with the goal of increasing competition to help mitigate a high local cost of living. This
initiative is supported through the Protection of Public Health Regulations (Food), known as the
"Cornflakes Law.” The measure allows firms to import food products to Israel without having direct
contact with the manufacturer. This channel is termed parallel imports, and functions much as a
shipping consolidator would in other markets. The new measure eases importation of a variety of dried
foods, such as breakfast cereals, crackers, biscuits, pasta, and rice. More details on the measure are in
the FAIRS - Israel 2016 report.
Major supermarkets are increasingly importing directly from foreign suppliers in order to reduce costs.
Although this growth is noticeable, Israel is still behind its OECD peers in terms of food imports. In
Israel food imports account for 11 percent household food expenditures. The OECD average is near 30
percent. The high market concentration of food importers and distributors explains the low percentage of
imports.
Figure 4: Food and Beverages Imports to Israel April 2015 – April 2016

Source: Leumi Bank, FAS Tel Aviv office research.
Government Regulation to Encourage Healthier Products
The new food regulation, Protection of Public Health Regulations (Food) (Nutritional Labeling) 5777-
2017 is designed to encourage healthier eating habits. The new regulation requires products considered
high in sugar, saturated fats and sodium to carry a red label on the front of the packaging. Industry
groups vehemently opposed the measure; however, it easily passed in the Knesset, in late 2017. The new
regulations will take effect in January 2020.
Government Regulation to Promote Competition between Food Retailers
The Israeli government promotes competition between food retailers. The Protection of Public Health
(Food), known as the "Cornflakes Law” notes the following in regards to the food retailer section:
1. Transparency: food retail chains with sales in excess of $66 million must advertise online,
hourly.
2. Small vendor protection: suppliers with more than annual $263 million in revenues will be
limited to 50 percent of shelf space in retail chain stores, limiting their ability to push out smaller
suppliers.
3. Fair competition: the antitrust commissioner will be able to order distributing chains to refrain
from opening or closing branches in geographic areas with limited competition.
4. Large suppliers will not be able to state a recommended consumer price or interfere with shelf
location of products.
5. Conditional pricing is prohibited: selling a product below cost or linking the purchase of an
unpopular product to that of a popular product is prohibited.
Trends in Distribution Channels
Supermarkets are gaining efficiencies over small stores. In the past few years, large retail food
chains are focusing on expansion through acquisitions. Multiple small retail chains sold to larger
retail chains as they became less profitable. For example, the Israel chain, Mega, recently sold to
a larger competitor. In an increasingly competitive market, retailers are seeking efficiencies and
opportunities to gain market share. Acquisition of competitors and added scale offers increasing
efficiencies.
Convenience stores are growing. Convenience stores in gas stations have become common food
and beverage providers. According to consumer behavior experts, the number of convenience
stores is expected to grow as consumption behavior continues to change. Israelis households are
shrinking and consumers are increasingly pressed for time. As such, Israeli consumers are
buying less, more frequently, and closer to their homes, making convenience stores a convenient
option.
E-commerce is expanding. Internet retailing sales continued to increase as consumers enjoy the
ease and convenience of shopping from their homes. E-commerce in Israel had an annual growth
of 25 percent, during the past 3 years. Food products sold online reached $631 million in the last
year, making online food sales the largest online market in Israel. The Israeli online food market
is expected to grow by an annual rate of 20 percent through 2020.
Trends in Services by Retailers
Online food sales are gaining popularity. During 2016, online food purchasing continued to
expand as retailers improved their websites, providing a more user-friendly and smarter shopping
experience.
Delivery areas are expanding. With the increase in online shopping, retailers are expanding the
areas where grocery delivery is available.
Healthy and organic foods are on the rise. Increasingly, Israeli consumers are willing to pay a
premium for organic and healthier food items. As a result, supermarkets are giving greater
priority to healthy and organic foods. Organic products are gaining larger shares of shelf space
than in the past and the variety of products is expanding. In some cases, supermarkets have
opened healthy and organic sections, or specialty health stores within supermarkets.
Sales in private label products are growing. More supermarket chains are offering private label
branded products. In the case of Israel’s largest food retailer, Shufersal, the share held by private
label products increased by five percent in 2016, accounting for 20 percent of all retail sales.
This is compared to only 15 percent in 2015. Another leading food retailer, Rami Levi,
introduced a private label brand in 2015, which accounted for 12 percent of sales by the end of
2016. Many of the large chains offering private label products are importing directly to access
prices that are more competitive.
Fruits and Vegetables remain a staple in the Israeli diet. Even with growth in other retail sectors,
supermarkets are still dedicating a large portion of their sales area to fruits and vegetables. Most
are grown locally, with limited imports during the September and April holiday seasons.
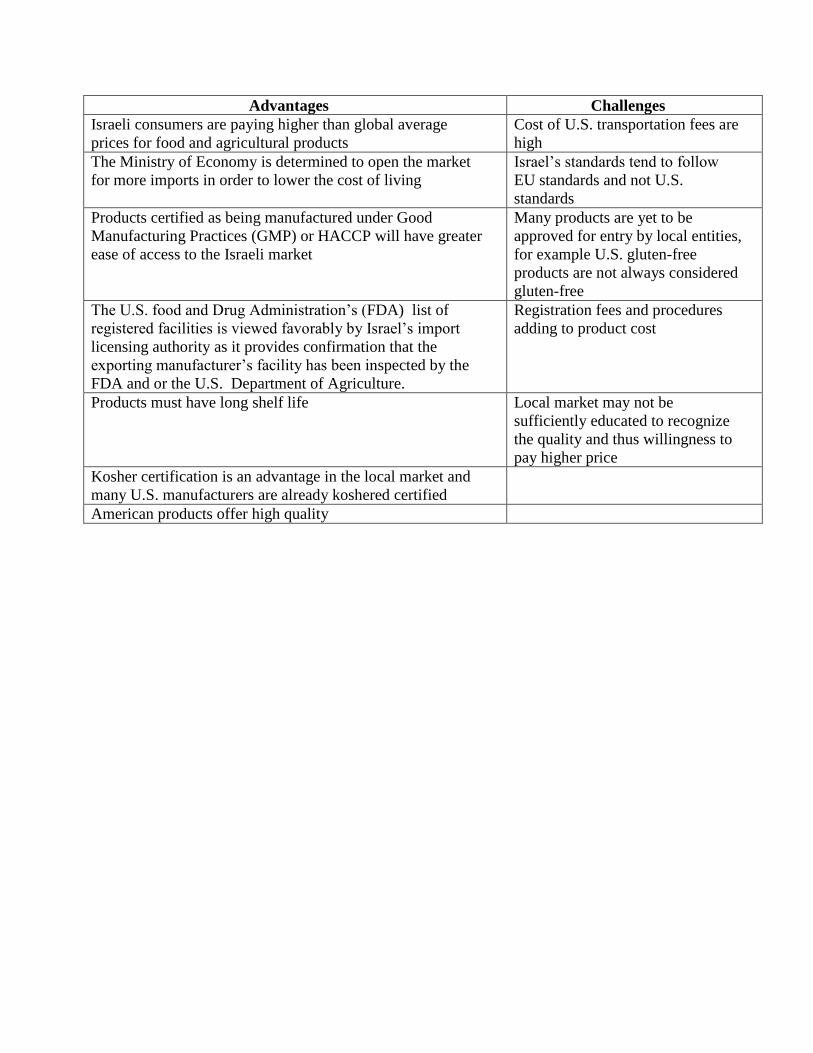
Table 2: Advantages (Sector Strengths and Market Opportunities) and Challenges Sector
Weaknesses and Competitive Threats)
Advantages Challenges
Advantages Challenges
Israeli consumers are paying higher than global average
prices for food and agricultural products
Cost of U.S. transportation fees are
high
The Ministry of Economy is determined to open the market
for more imports in order to lower the cost of living
Israel’s standards tend to follow
EU standards and not U.S.
standards
Products certified as being manufactured under Good
Manufacturing Practices (GMP) or HACCP will have greater
ease of access to the Israeli market
Many products are yet to be
approved for entry by local entities,
for example U.S. gluten-free
products are not always considered
gluten-free
The U.S. food and Drug Administration’s (FDA) list of
registered facilities is viewed favorably by Israel’s import
licensing authority as it provides confirmation that the
exporting manufacturer’s facility has been inspected by the
FDA and or the U.S. Department of Agriculture.
Registration fees and procedures
adding to product cost
Products must have long shelf life Local market may not be
sufficiently educated to recognize
the quality and thus willingness to
pay higher price
Kosher certification is an advantage in the local market and
many U.S. manufacturers are already koshered certified
American products offer high quality
SECTION II: ROAD MAP FOR MARKET ENTRY
Entry Strategy
U.S. exporters should review FAS Tel Aviv policy and market reports and private sector analyses.
Find a Local Partner
U.S. exporters should establish business relationships with reliable, experienced and professional
importers and distributers. These will offer advice on issues related to the product positioning,
packaging, labeling, and custom clearance procedures. Face-to-face meeting or visits of U.S. firms to
Israeli facilities will build relationships and explore business opportunities firsthand.
Exporters able to supply sufficient quantities should consider approaching large Israeli food retail
chains. Food retailers like Shufersal and Rami Levi have their own purchasing and importing divisions
to handle food imports. U.S. suppliers should first contact the purchasing or importing divisions of these
large food chains, especially for new-to-market food products as they have the most experience with
branding and distribution. FAS Tel Aviv has a list of local importers and can help with contact
information. U.S. exporters should consider the price sensitivity of their customers, product
requirements, purchasing policies, and purchase volumes.
Learn Regulations and Market Requirements
Israeli regulations, standards and market requirements have to be considered (see, FAIRS - Israel
Country Report). Exporters need to consider kashrut or kosher certification. Certification is not a legal
requirement for importing food into Israel (except for meat, and meat products). However, non-kosher
products have a smaller market; most supermarkets and hotels refuse to carry them.
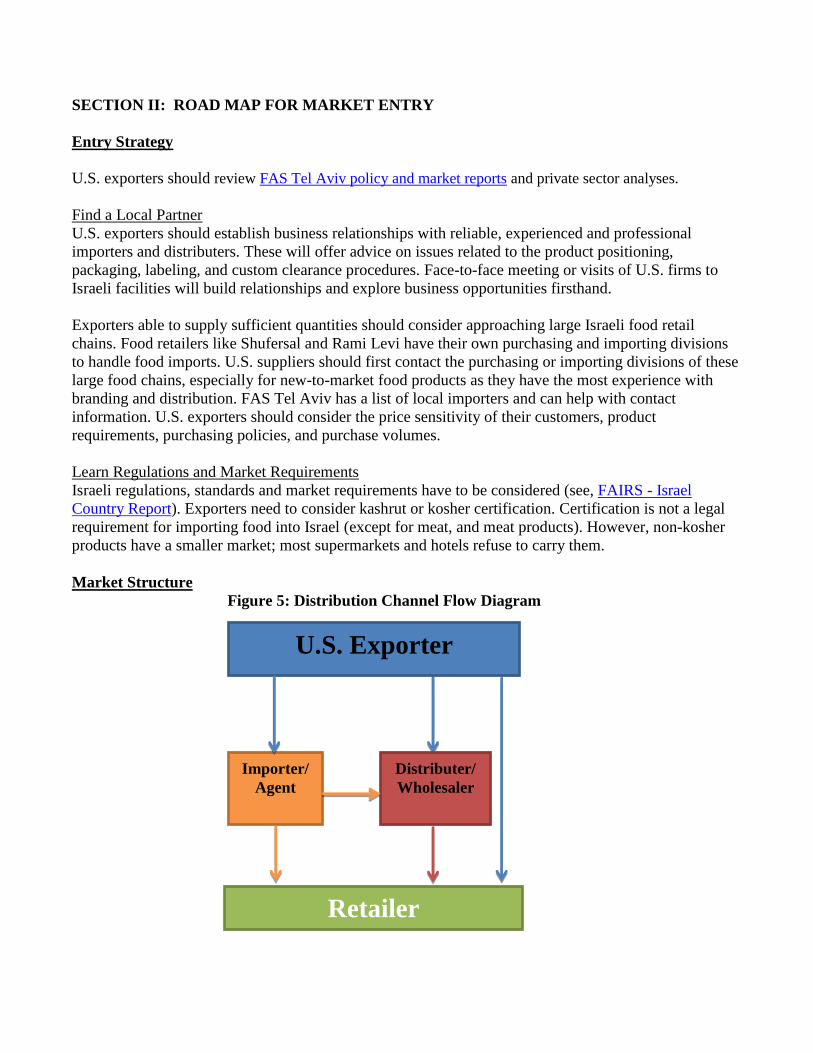
Market Structure
Figure 5: Distribution Channel Flow Diagram
U.S. Exporter
Importer/
Agent
Distributer/
Wholesaler
Retailer
The large supermarket chains import directly, as well as buy from importers or wholesalers. Others
usually buy only through importers or wholesalers. In addition to large supermarket chains, which
import directly, there are about 300 importers. These food importers buy kosher and non-kosher food
products.
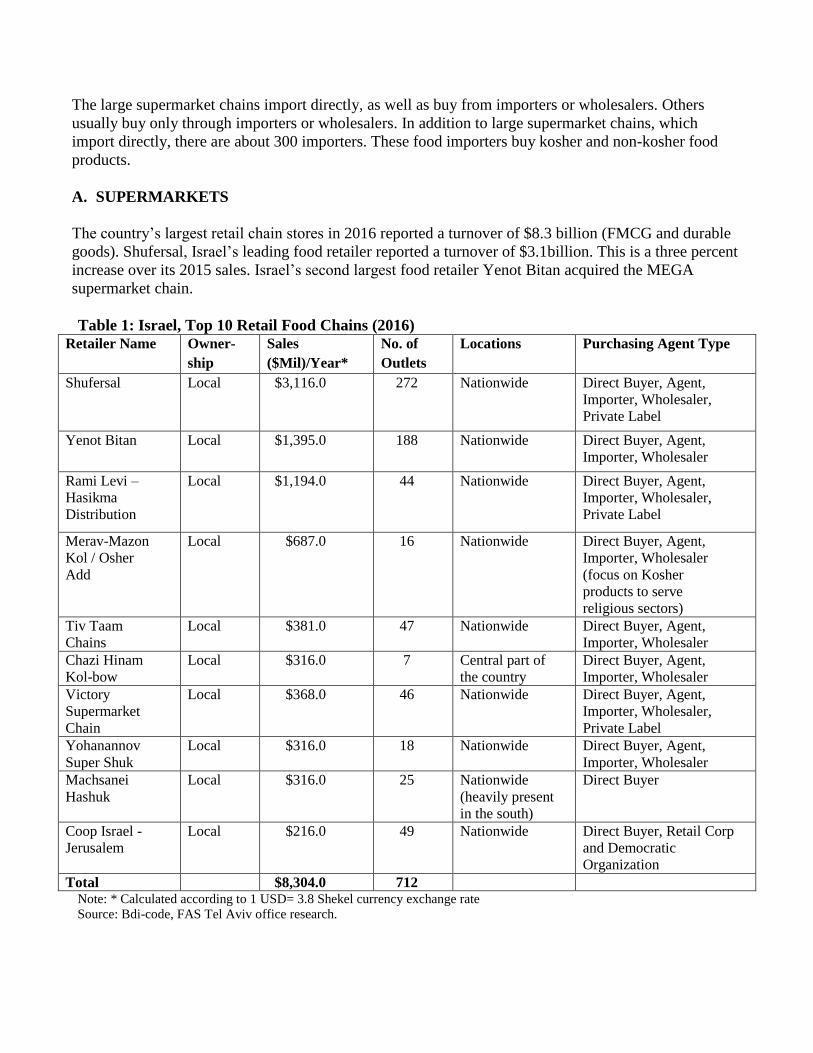
A. SUPERMARKETS
The country’s largest retail chain stores in 2016 reported a turnover of $8.3 billion (FMCG and durable
goods). Shufersal, Israel’s leading food retailer reported a turnover of $3.1billion. This is a three percent
increase over its 2015 sales. Israel’s second largest food retailer Yenot Bitan acquired the MEGA
supermarket chain.
Table 1: Israel, Top 10 Retail Food Chains (2016)
Retailer Name Owner-
ship
Sales
($Mil)/Year*
No. of
Outlets
Locations Purchasing Agent Type
Shufersal Local $3,116.0 272 Nationwide Direct Buyer, Agent,
Importer, Wholesaler,
Private Label
Yenot Bitan
Local $1,395.0 188 Nationwide Direct Buyer, Agent,
Importer, Wholesaler
Rami Levi –
Hasikma
Distribution
Local $1,194.0 44 Nationwide Direct Buyer, Agent,
Importer, Wholesaler,
Private Label
Merav-Mazon
Kol / Osher
Add
Local $687.0 16 Nationwide Direct Buyer, Agent,
Importer, Wholesaler
(focus on Kosher
products to serve
religious sectors)
Tiv Taam
Chains
Local $381.0 47 Nationwide Direct Buyer, Agent,
Importer, Wholesaler
Chazi Hinam
Kol-bow
Local $316.0 7 Central part of
the country
Direct Buyer, Agent,
Importer, Wholesaler
Victory
Supermarket
Chain
Local $368.0 46 Nationwide Direct Buyer, Agent,
Importer, Wholesaler,
Private Label
Yohanannov
Super Shuk
Local $316.0 18 Nationwide Direct Buyer, Agent,
Importer, Wholesaler
Machsanei
Hashuk
Local $316.0 25 Nationwide
(heavily present
in the south)
Direct Buyer
Coop Israel -
Jerusalem
Local $216.0 49 Nationwide Direct Buyer, Retail Corp
and Democratic
Organization
Total $8,304.0 712 Note: * Calculated according to 1 USD= 3.8 Shekel currency exchange rate
Source: Bdi-code, FAS Tel Aviv office research.
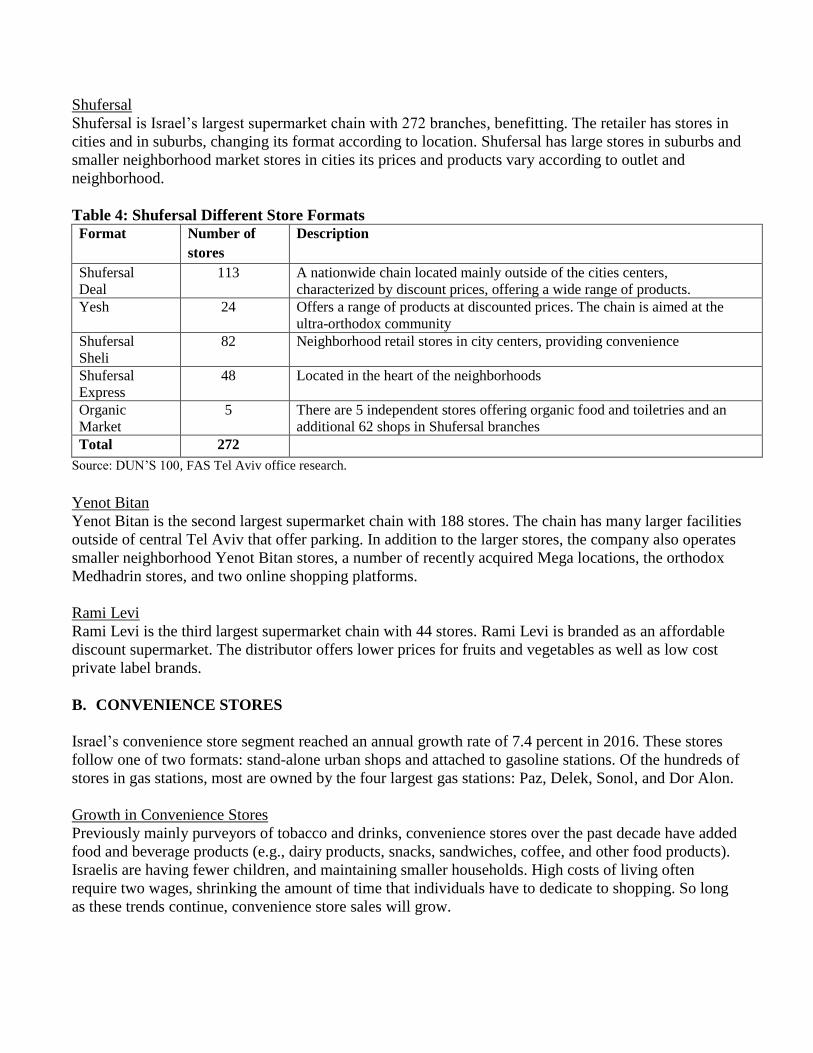
Shufersal
Shufersal is Israel’s largest supermarket chain with 272 branches, benefitting. The retailer has stores in
cities and in suburbs, changing its format according to location. Shufersal has large stores in suburbs and
smaller neighborhood market stores in cities its prices and products vary according to outlet and
neighborhood.
Table 4: Shufersal Different Store Formats Format Number of
stores
Description
Shufersal
Deal
113 A nationwide chain located mainly outside of the cities centers,
characterized by discount prices, offering a wide range of products.
Yesh 24 Offers a range of products at discounted prices. The chain is aimed at the
ultra-orthodox community
Shufersal
Sheli
82 Neighborhood retail stores in city centers, providing convenience
Shufersal
Express
48 Located in the heart of the neighborhoods
Organic
Market
5 There are 5 independent stores offering organic food and toiletries and an
additional 62 shops in Shufersal branches
Total 272
Source: DUN’S 100, FAS Tel Aviv office research.
Yenot Bitan
Yenot Bitan is the second largest supermarket chain with 188 stores. The chain has many larger facilities
outside of central Tel Aviv that offer parking. In addition to the larger stores, the company also operates
smaller neighborhood Yenot Bitan stores, a number of recently acquired Mega locations, the orthodox
Medhadrin stores, and two online shopping platforms.
Rami Levi
Rami Levi is the third largest supermarket chain with 44 stores. Rami Levi is branded as an affordable
discount supermarket. The distributor offers lower prices for fruits and vegetables as well as low cost
private label brands.
B. CONVENIENCE STORES
Israel’s convenience store segment reached an annual growth rate of 7.4 percent in 2016. These stores
follow one of two formats: stand-alone urban shops and attached to gasoline stations. Of the hundreds of
stores in gas stations, most are owned by the four largest gas stations: Paz, Delek, Sonol, and Dor Alon.
Growth in Convenience Stores
Previously mainly purveyors of tobacco and drinks, convenience stores over the past decade have added
food and beverage products (e.g., dairy products, snacks, sandwiches, coffee, and other food products).
Israelis are having fewer children, and maintaining smaller households. High costs of living often
require two wages, shrinking the amount of time that individuals have to dedicate to shopping. So long
as these trends continue, convenience store sales will grow.
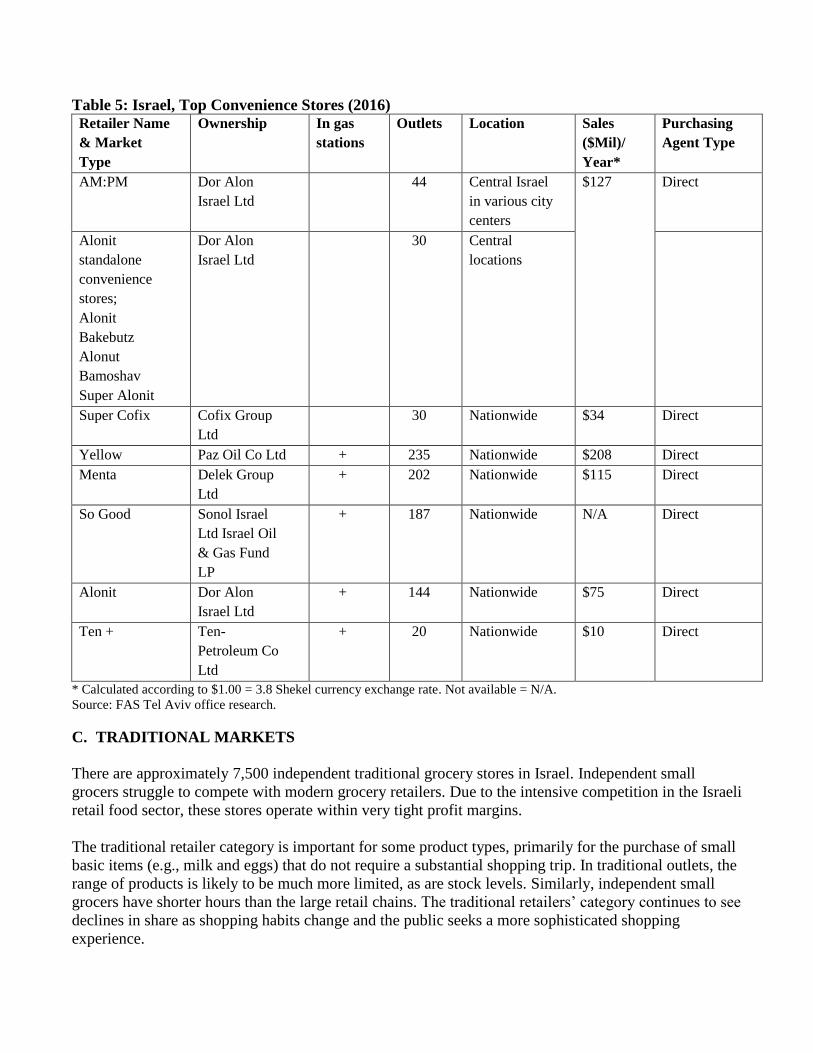
Table 5: Israel, Top Convenience Stores (2016) Retailer Name
& Market
Type
Ownership In gas
stations
Outlets Location Sales
($Mil)/
Year*
Purchasing
Agent Type
AM:PM Dor Alon
Israel Ltd
44 Central Israel
in various city
centers
$127 Direct
Alonit
standalone
convenience
stores;
Alonit
Bakebutz
Alonut
Bamoshav
Super Alonit
Dor Alon
Israel Ltd
30 Central
locations
Super Cofix Cofix Group
Ltd
30 Nationwide $34 Direct
Yellow Paz Oil Co Ltd + 235 Nationwide $208 Direct
Menta Delek Group
Ltd
+ 202 Nationwide $115 Direct
So Good Sonol Israel
Ltd Israel Oil
& Gas Fund
LP
+ 187 Nationwide N/A Direct
Alonit Dor Alon
Israel Ltd
+ 144 Nationwide $75 Direct
Ten + Ten-
Petroleum Co
Ltd
+ 20 Nationwide $10 Direct
* Calculated according to $1.00 = 3.8 Shekel currency exchange rate. Not available = N/A.
Source: FAS Tel Aviv office research.
C. TRADITIONAL MARKETS
There are approximately 7,500 independent traditional grocery stores in Israel. Independent small
grocers struggle to compete with modern grocery retailers. Due to the intensive competition in the Israeli
retail food sector, these stores operate within very tight profit margins.
The traditional retailer category is important for some product types, primarily for the purchase of small
basic items (e.g., milk and eggs) that do not require a substantial shopping trip. In traditional outlets, the
range of products is likely to be much more limited, as are stock levels. Similarly, independent small
grocers have shorter hours than the large retail chains. The traditional retailers’ category continues to see
declines in share as shopping habits change and the public seeks a more sophisticated shopping
experience.

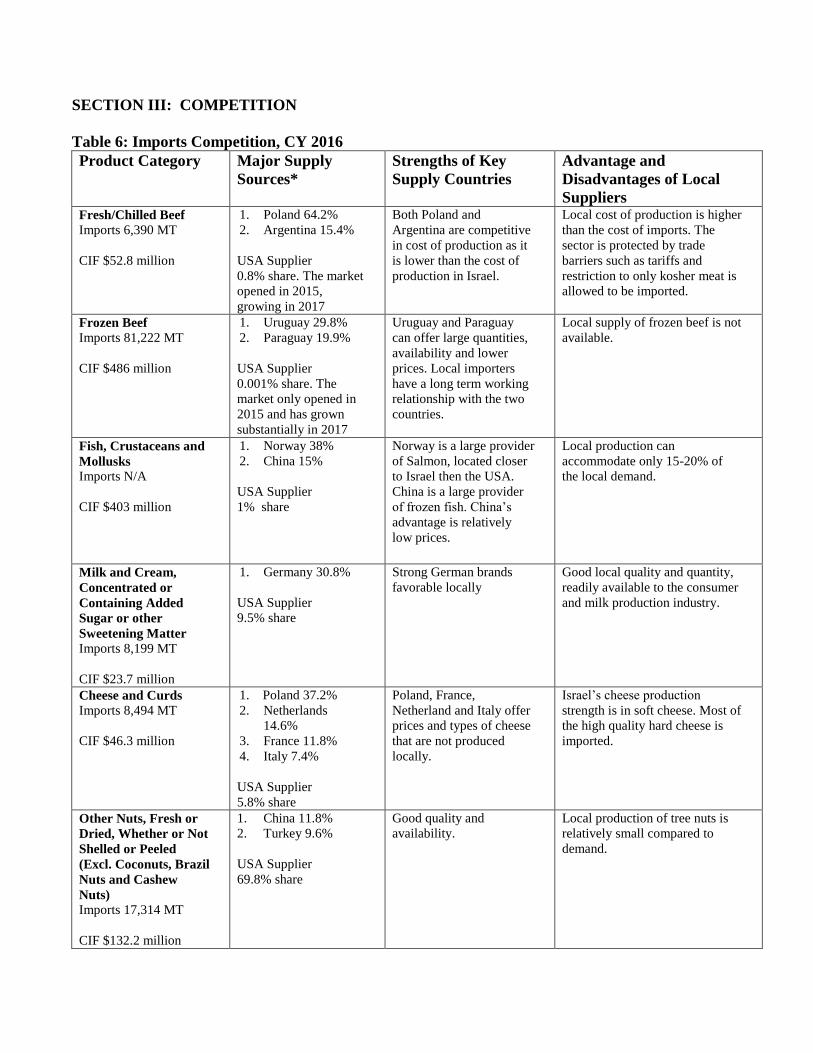
SECTION III: COMPETITION
Table 6: Imports Competition, CY 2016
Product Category Major Supply
Sources*
Strengths of Key
Supply Countries
Advantage and
Disadvantages of Local
Suppliers Fresh/Chilled Beef
Imports 6,390 MT
CIF $52.8 million
1. Poland 64.2%
2. Argentina 15.4%
USA Supplier
0.8% share. The market
opened in 2015,
growing in 2017
Both Poland and
Argentina are competitive
in cost of production as it
is lower than the cost of
production in Israel.
Local cost of production is higher
than the cost of imports. The
sector is protected by trade
barriers such as tariffs and
restriction to only kosher meat is
allowed to be imported.
Frozen Beef
Imports 81,222 MT
CIF $486 million
1. Uruguay 29.8%
2. Paraguay 19.9%
USA Supplier
0.001% share. The
market only opened in
2015 and has grown
substantially in 2017
Uruguay and Paraguay
can offer large quantities,
availability and lower
prices. Local importers
have a long term working
relationship with the two
countries.
Local supply of frozen beef is not
available.
Fish, Crustaceans and
Mollusks
Imports N/A
CIF $403 million
1. Norway 38%
2. China 15%
USA Supplier
1% share
Norway is a large provider
of Salmon, located closer
to Israel then the USA.
China is a large provider
of frozen fish. China’s
advantage is relatively
low prices.
Local production can
accommodate only 15-20% of
the local demand.
Milk and Cream,
Concentrated or
Containing Added
Sugar or other
Sweetening Matter
Imports 8,199 MT
CIF $23.7 million
1. Germany 30.8%
USA Supplier
9.5% share
Strong German brands
favorable locally
Good local quality and quantity,
readily available to the consumer
and milk production industry.
Cheese and Curds
Imports 8,494 MT
CIF $46.3 million
1. Poland 37.2%
2. Netherlands
14.6%
3. France 11.8%
4. Italy 7.4%
USA Supplier
5.8% share
Poland, France,
Netherland and Italy offer
prices and types of cheese
that are not produced
locally.
Israel’s cheese production
strength is in soft cheese. Most of
the high quality hard cheese is
imported.
Other Nuts, Fresh or
Dried, Whether or Not
Shelled or Peeled
(Excl. Coconuts, Brazil
Nuts and Cashew
Nuts)
Imports 17,314 MT
CIF $132.2 million
1. China 11.8%
2. Turkey 9.6%
USA Supplier
69.8% share
Good quality and
availability.
Local production of tree nuts is
relatively small compared to
demand.
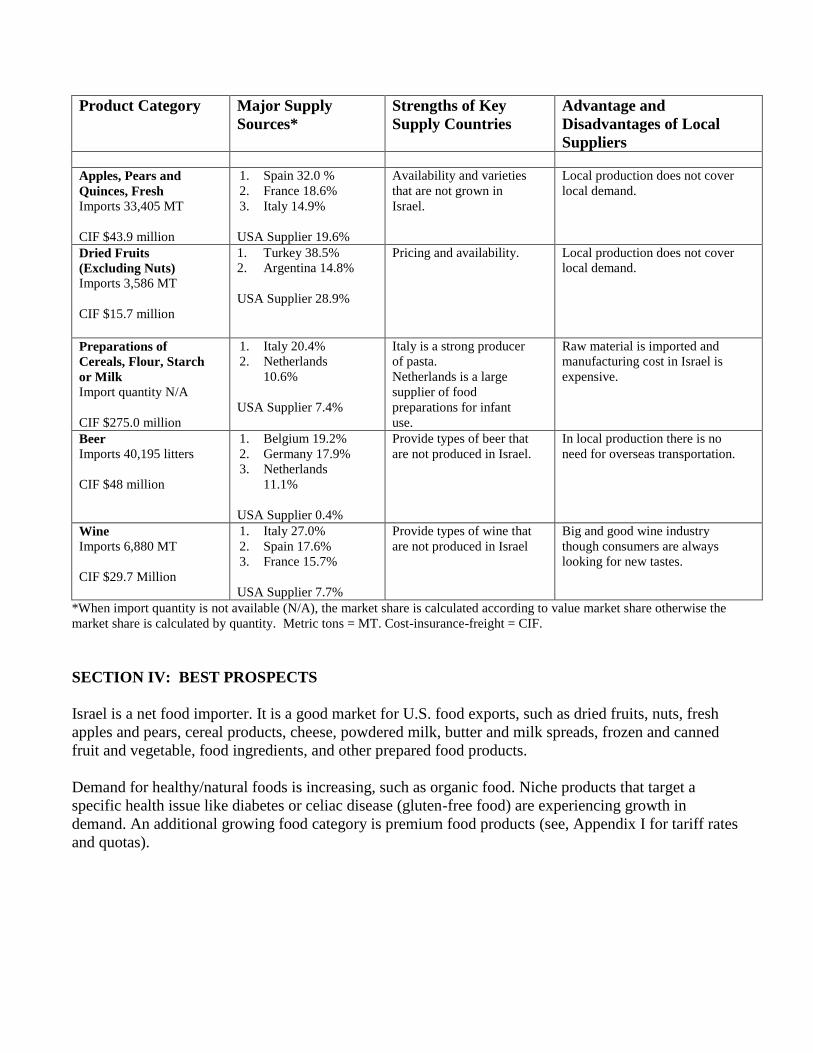
Product Category Major Supply
Sources*
Strengths of Key
Supply Countries
Advantage and
Disadvantages of Local
Suppliers
Apples, Pears and
Quinces, Fresh
Imports 33,405 MT
CIF $43.9 million
1. Spain 32.0 %
2. France 18.6%
3. Italy 14.9%
USA Supplier 19.6%
Availability and varieties
that are not grown in
Israel.
Local production does not cover
local demand.
Dried Fruits
(Excluding Nuts)
Imports 3,586 MT
CIF $15.7 million
1. Turkey 38.5%
2. Argentina 14.8%
USA Supplier 28.9%
Pricing and availability. Local production does not cover
local demand.
Preparations of
Cereals, Flour, Starch
or Milk
Import quantity N/A
CIF $275.0 million
1. Italy 20.4%
2. Netherlands
10.6%
USA Supplier 7.4%
Italy is a strong producer
of pasta.
Netherlands is a large
supplier of food
preparations for infant
use.
Raw material is imported and
manufacturing cost in Israel is
expensive.
Beer
Imports 40,195 litters
CIF $48 million
1. Belgium 19.2%
2. Germany 17.9%
3. Netherlands
11.1%
USA Supplier 0.4%
Provide types of beer that
are not produced in Israel.
In local production there is no
need for overseas transportation.
Wine
Imports 6,880 MT
CIF $29.7 Million
1. Italy 27.0%
2. Spain 17.6%
3. France 15.7%
USA Supplier 7.7%
Provide types of wine that
are not produced in Israel
Big and good wine industry
though consumers are always
looking for new tastes.
*When import quantity is not available (N/A), the market share is calculated according to value market share otherwise the
market share is calculated by quantity. Metric tons = MT. Cost-insurance-freight = CIF.
SECTION IV: BEST PROSPECTS
Israel is a net food importer. It is a good market for U.S. food exports, such as dried fruits, nuts, fresh
apples and pears, cereal products, cheese, powdered milk, butter and milk spreads, frozen and canned
fruit and vegetable, food ingredients, and other prepared food products.
Demand for healthy/natural foods is increasing, such as organic food. Niche products that target a
specific health issue like diabetes or celiac disease (gluten-free food) are experiencing growth in
demand. An additional growing food category is premium food products (see, Appendix I for tariff rates
and quotas).
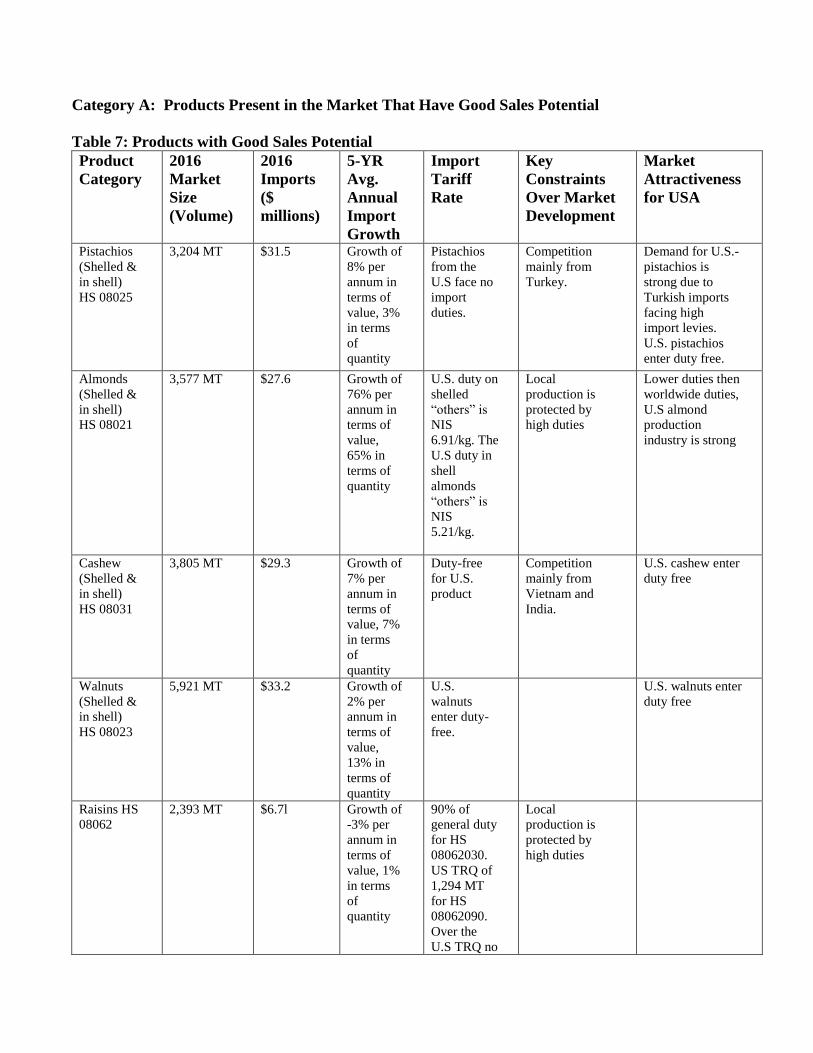
Category A: Products Present in the Market That Have Good Sales Potential
Table 7: Products with Good Sales Potential
Product
Category
2016
Market
Size
(Volume)
2016
Imports
($
millions)
5-YR
Avg.
Annual
Import
Growth
Import
Tariff
Rate
Key
Constraints
Over Market
Development
Market
Attractiveness
for USA
Pistachios
(Shelled &
in shell)
HS 08025
3,204 MT $31.5 Growth of
8% per
annum in
terms of
value, 3%
in terms
of
quantity
Pistachios
from the
U.S face no
import
duties.
Competition
mainly from
Turkey.
Demand for U.S.-
pistachios is
strong due to
Turkish imports
facing high
import levies.
U.S. pistachios
enter duty free.
Almonds
(Shelled &
in shell)
HS 08021
3,577 MT $27.6 Growth of
76% per
annum in
terms of
value,
65% in
terms of
quantity
U.S. duty on
shelled
“others” is
NIS
6.91/kg. The
U.S duty in
shell
almonds
“others” is
NIS
5.21/kg.
Local
production is
protected by
high duties
Lower duties then
worldwide duties,
U.S almond
production
industry is strong
Cashew
(Shelled &
in shell)
HS 08031
3,805 MT $29.3 Growth of
7% per
annum in
terms of
value, 7%
in terms
of
quantity
Duty-free
for U.S.
product
Competition
mainly from
Vietnam and
India.
U.S. cashew enter
duty free
Walnuts
(Shelled &
in shell)
HS 08023
5,921 MT $33.2 Growth of
2% per
annum in
terms of
value,
13% in
terms of
quantity
U.S.
walnuts
enter duty-
free.
U.S. walnuts enter
duty free
Raisins HS
08062
2,393 MT $6.7l Growth of
-3% per
annum in
terms of
value, 1%
in terms
of
quantity
90% of
general duty
for HS
08062030.
US TRQ of
1,294 MT
for HS
08062090.
Over the
U.S TRQ no
Local
production is
protected by
high duties

Product
Category
2016
Market
Size
(Volume)
2016
Imports
($
millions)
5-YR
Avg.
Annual
Import
Growth
Import
Tariff
Rate
Key
Constraints
Over Market
Development
Market
Attractiveness
for USA
less than
NIS 2/kg.
Prunes HS
08132
2,154 MT $7.6 Growth of
13% per
annum in
terms of
value, 2%
in terms
of
quantity
U.S. TRQ
2,000 MT
applies to
all prunes.
Over the
U.S TRQ
90% of
general
duty.
Argentina and
Chile are
offering
significantly
lower prices
Ice Cream
HS 210500
2,769 MT $8.4 Growth of
18% per
annum in
terms of
value,
21% in
terms of
quantity
U.S. TRQ
of 113 tons.
Above the
quota the
tariff is no
less than
NIS
0.55/kg.
Local ice cream
industry is very
strong.
There is a
growing demand
for high quality
ice cream. The
US is a good
source for special
quality ice cream
products
Wine
HS 2204
6,880
thousand
liter
$29.7 Growth of
5% per
annum in
terms of
value, 4%
in terms
of
quantity
U.S.
TRQ of
200,000
liters.
Sparkling
wine is not
included in
the TRQ.
Sparkling
wine 75%
of general
duty. U.S.
duty over
the TRQ;
“Containers
holding 2
liters or
less” 12%+
, NIS
1.35/liter,
no more
than 50%,
“Other
grape must”
12%+ NIS
1.15/liter,
no more
than 50%.
80% of
consumption is
from local
production, and
the rest is
mainly from
France, Italy,
Spain, and the
U.S.
This market is
likely to become
more dynamic
Product
Category
2016
Market
Size
(Volume)
2016
Imports
($
millions)
5-YR
Avg.
Annual
Import
Growth
Import
Tariff
Rate
Key
Constraints
Over Market
Development
Market
Attractiveness
for USA
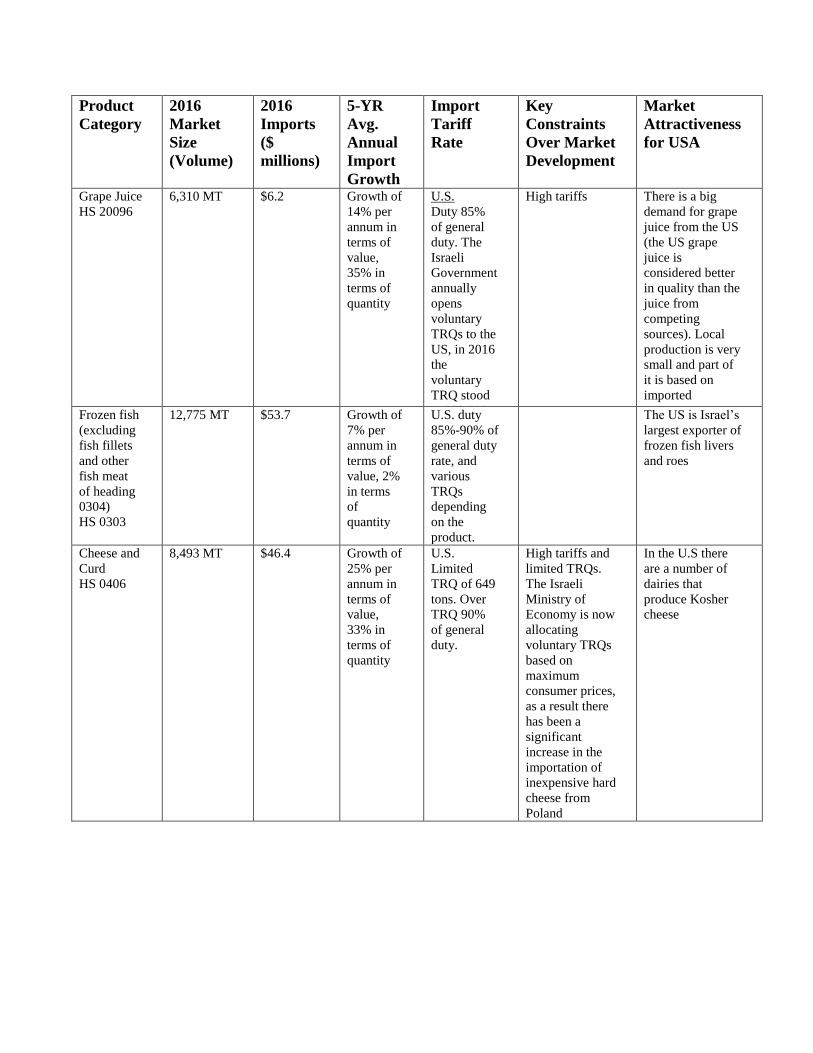
Grape Juice
HS 20096
6,310 MT $6.2 Growth of
14% per
annum in
terms of
value,
35% in
terms of
quantity
U.S.
Duty 85%
of general
duty. The
Israeli
Government
annually
opens
voluntary
TRQs to the
US, in 2016
the
voluntary
TRQ stood
at 200,000
liters.
EU
TRQ 230
tons.
High tariffs There is a big
demand for grape
juice from the US
(the US grape
juice is
considered better
in quality than the
juice from
competing
sources). Local
production is very
small and part of
it is based on
imported
concentrates. Frozen fish
(excluding
fish fillets
and other
fish meat
of heading
0304)
HS 0303
12,775 MT $53.7 Growth of
7% per
annum in
terms of
value, 2%
in terms
of
quantity
U.S. duty
85%-90% of
general duty
rate, and
various
TRQs
depending
on the
product.
The US is Israel’s
largest exporter of
frozen fish livers
and roes
Cheese and
Curd
HS 0406
8,493 MT $46.4 Growth of
25% per
annum in
terms of
value,
33% in
terms of
quantity
U.S.
Limited
TRQ of 649
tons. Over
TRQ 90%
of general
duty.
High tariffs and
limited TRQs.
The Israeli
Ministry of
Economy is now
allocating
voluntary TRQs
based on
maximum
consumer prices,
as a result there
has been a
significant
increase in the
importation of
inexpensive hard
cheese from
Poland
In the U.S there
are a number of
dairies that
produce Kosher
cheese
Product
Category
2016
Market
Size
(Volume)
2016
Imports
($
millions)
5-YR
Avg.
Annual
Import
Growth
Import
Tariff
Rate
Key
Constraints
Over Market
Development
Market
Attractiveness
for USA
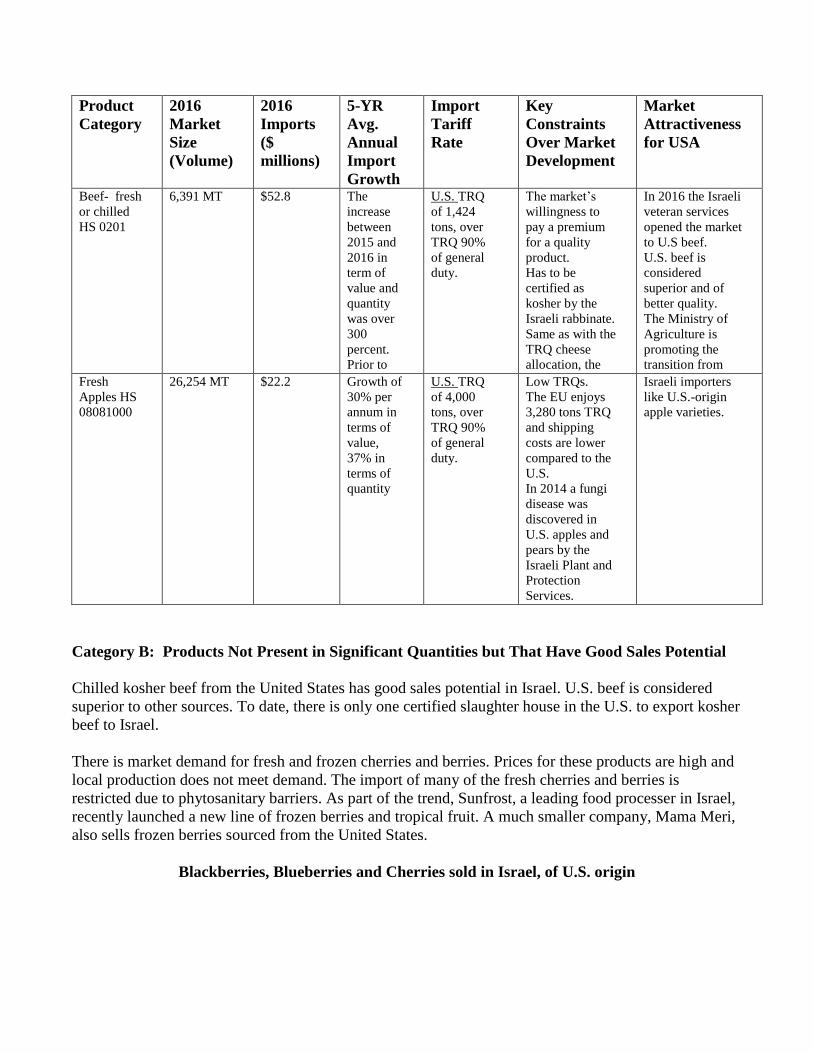
Beef- fresh
or chilled
HS 0201
6,391 MT $52.8 The
increase
between
2015 and
2016 in
term of
value and
quantity
was over
300
percent.
Prior to
2015 the
import
was
practically
non
existing
U.S. TRQ
of 1,424
tons, over
TRQ 90%
of general
duty.
The market’s
willingness to
pay a premium
for a quality
product.
Has to be
certified as
kosher by the
Israeli rabbinate.
Same as with the
TRQ cheese
allocation, the
Ministry of
Economy is now
allocating TRQs
based on
maximum
consumer prices;
this process does
not include the
USA TRQ. As a
result the WTO
voluntary TRQs
will be sourced
from countries
that offer
inexpensive
chilled beef.
In 2016 the Israeli
veteran services
opened the market
to U.S beef.
U.S. beef is
considered
superior and of
better quality.
The Ministry of
Agriculture is
promoting the
transition from
the importation of
feeder cattle to
chilled beef.
Fresh
Apples HS
08081000
26,254 MT $22.2 Growth of
30% per
annum in
terms of
value,
37% in
terms of
quantity
U.S. TRQ
of 4,000
tons, over
TRQ 90%
of general
duty.
Low TRQs.
The EU enjoys
3,280 tons TRQ
and shipping
costs are lower
compared to the
U.S.
In 2014 a fungi
disease was
discovered in
U.S. apples and
pears by the
Israeli Plant and
Protection
Services.
Israeli importers
like U.S.-origin
apple varieties.
Category B: Products Not Present in Significant Quantities but That Have Good Sales Potential
Chilled kosher beef from the United States has good sales potential in Israel. U.S. beef is considered
superior to other sources. To date, there is only one certified slaughter house in the U.S. to export kosher
beef to Israel.
There is market demand for fresh and frozen cherries and berries. Prices for these products are high and
local production does not meet demand. The import of many of the fresh cherries and berries is
restricted due to phytosanitary barriers. As part of the trend, Sunfrost, a leading food processer in Israel,
recently launched a new line of frozen berries and tropical fruit. A much smaller company, Mama Meri,
also sells frozen berries sourced from the United States.
Blackberries, Blueberries and Cherries sold in Israel, of U.S. origin
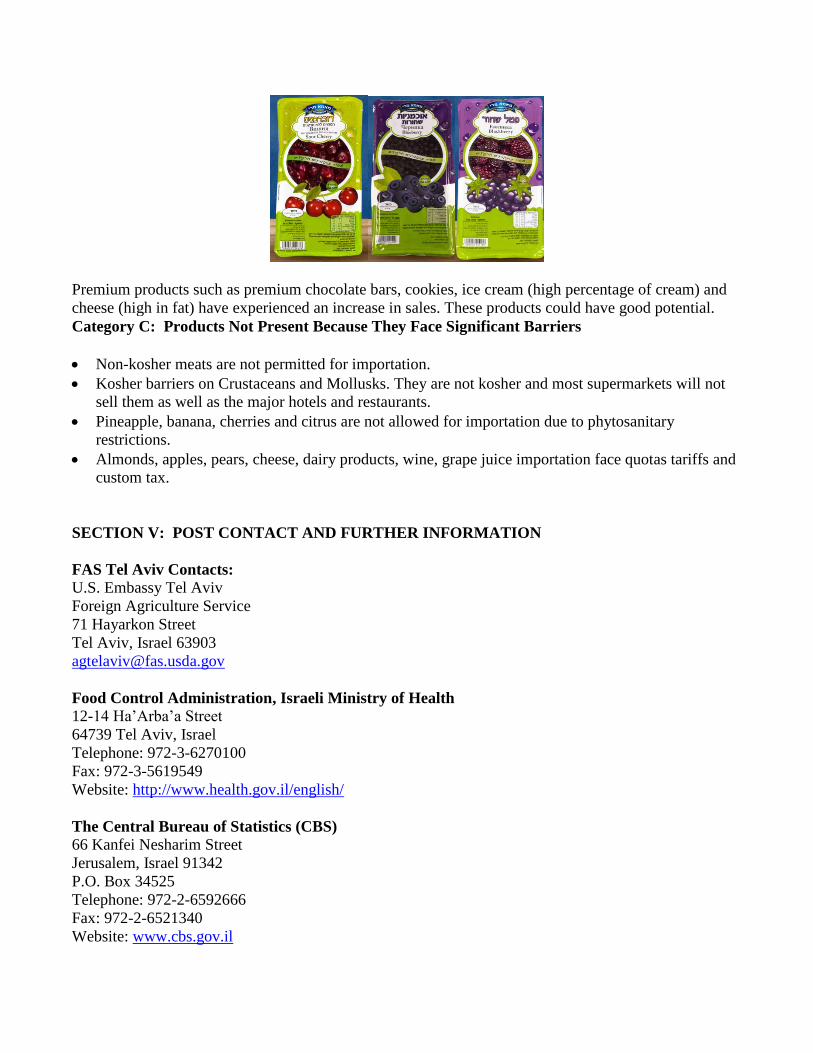
Premium products such as premium chocolate bars, cookies, ice cream (high percentage of cream) and
cheese (high in fat) have experienced an increase in sales. These products could have good potential.
Category C: Products Not Present Because They Face Significant Barriers
Non-kosher meats are not permitted for importation.
Kosher barriers on Crustaceans and Mollusks. They are not kosher and most supermarkets will not
sell them as well as the major hotels and restaurants.
Pineapple, banana, cherries and citrus are not allowed for importation due to phytosanitary
restrictions.
Almonds, apples, pears, cheese, dairy products, wine, grape juice importation face quotas tariffs and
custom tax.
SECTION V: POST CONTACT AND FURTHER INFORMATION
FAS Tel Aviv Contacts:
U.S. Embassy Tel Aviv
Foreign Agriculture Service
71 Hayarkon Street
Tel Aviv, Israel 63903
Food Control Administration, Israeli Ministry of Health
12-14 Ha’Arba’a Street
64739 Tel Aviv, Israel
Telephone: 972-3-6270100
Fax: 972-3-5619549
Website: http://www.health.gov.il/english/
The Central Bureau of Statistics (CBS)
66 Kanfei Nesharim Street
Jerusalem, Israel 91342
P.O. Box 34525
Telephone: 972-2-6592666
Fax: 972-2-6521340
Website: www.cbs.gov.il


Appendix I: Israel, Tariff Rate Details
Product Category Import Tariff Rate Pistachios (Shelled & in
shell)
HS 08025
Pistachios from the U.S face no import duties. Turkey has a 100 ton TRQ, above the TRQ
it faces a 23% duty of not less than NIS 3.45/kg. Turkey imports above their TRQ.
Almonds (Shelled & in shell)
HS 08021 General Duty HS 08021110 and 08021210
“Almonds regarding which the director general of the ministry of industry and trade has
approved them to be intended for the manufacture of chocolate, confectionary” are duty
free for all countries.
General Duty HS 08021190
In shell “others”: NIS 8.52/kg though no more than 102%.
General Duty HS 08021290
Shelled “others”: NIS 15.14/kg though no more than 102%.
U.S.
U.S. duty on shelled “others” is NIS 6.91/kg. The U.S duty in shell almonds “others” is
NIS 5.21/kg,
WTO
TRQ of 1,700 MT for shelled almonds where a 100% duty is paid on the first container
and 0% on the second.
Cashew (Shelled & in shell)
HS 08031
General duty is 4%. The U.S, EU, Brazil, Uruguay, Paraguay and Argentina are exempt
from duty
Walnuts (Shelled & in shell)
HS 08023
General duty is 4%. U.S. walnuts enter duty free.
Raisins HS 08062 General Duty HS 08062030
“Raisins in packages whose weight exceeds 200 kg for which the director general of the
ministry of agriculture has approved that they are intended for processing and manufacture
of raisins”: NIS 6.62/ kg but no more than 340%.
General Duty HS 08062090
“Others NIS 6.62/ kg but no more than 340%.
U.S.
90% of general duty for HS 08062030. US TRQ of 1,294 tons for HS 08062090. Over the
U.S TRQ no less than NIS 2/kg.
EU
TRQ 120 tons applied to all raisins. Over EU TRQ NIS 5.67/ kg but no more than 340%
for HS 08062030 and NIS 6.91/ kg but no more than 150% for HS 08062090.
WTO
TRQ 600 tons for HS 08062030.
Prunes HS 08132 General Duty HS 08132010
“Prunes that their moisture level is lower than 24% in packages that contain 30 kg or more
and approved by the director general of the ministry of agriculture”: NIS 0.98/ kg but no
more than 30%.
General Duty HS 08132090
“Others”: NIS 4.17/kg but no more than 102%.
U.S.
TRQ of 2,000 tons which applies to all prunes. Over the U.S TRQ 90% of general duty.
EU
TRQ 730.96 tons which applies to all prunes. Over EU TRQ 100% of general duty.
WTO
TRQ 1,500 tons which applies to “others”, over the TRQ NIS 2/kg.
Ice Cream
HS 210500 General Duty
General duty is 4%.
U.S.
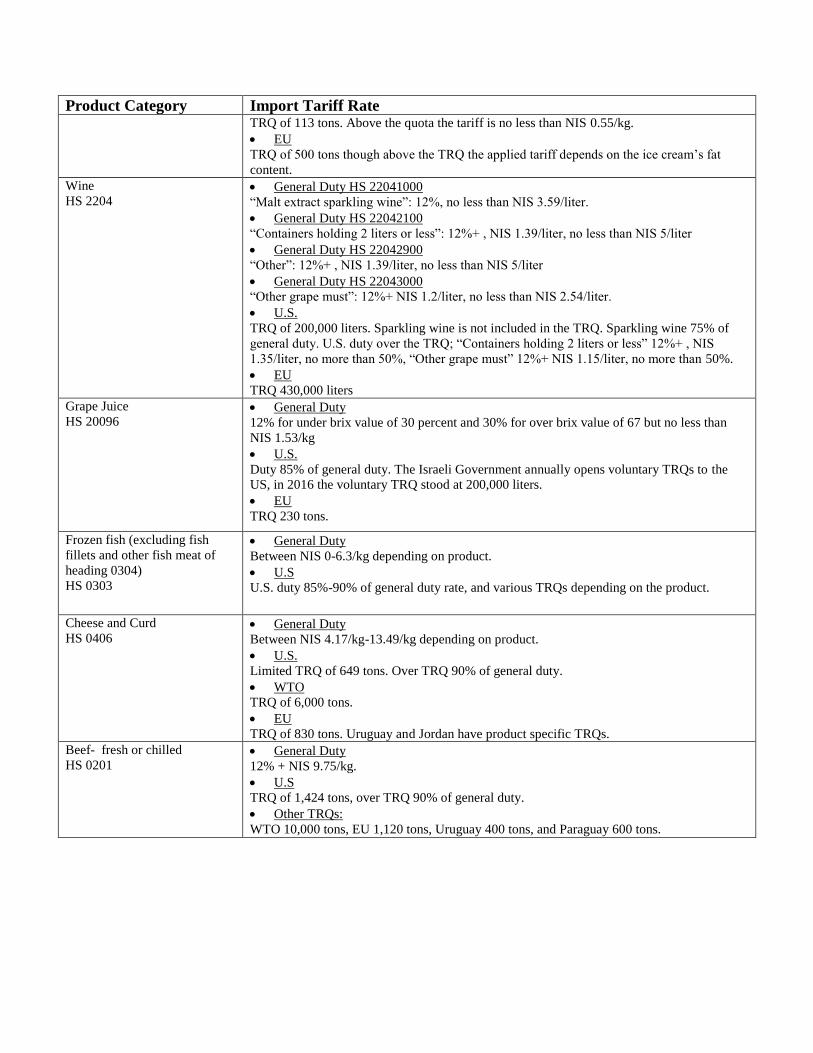
Product Category Import Tariff Rate TRQ of 113 tons. Above the quota the tariff is no less than NIS 0.55/kg.
EU
TRQ of 500 tons though above the TRQ the applied tariff depends on the ice cream’s fat
content.
Wine
HS 2204 General Duty HS 22041000
“Malt extract sparkling wine”: 12%, no less than NIS 3.59/liter.
General Duty HS 22042100
“Containers holding 2 liters or less”: 12%+ , NIS 1.39/liter, no less than NIS 5/liter
General Duty HS 22042900
“Other”: 12%+ , NIS 1.39/liter, no less than NIS 5/liter
General Duty HS 22043000
“Other grape must”: 12%+ NIS 1.2/liter, no less than NIS 2.54/liter.
U.S.
TRQ of 200,000 liters. Sparkling wine is not included in the TRQ. Sparkling wine 75% of
general duty. U.S. duty over the TRQ; “Containers holding 2 liters or less” 12%+ , NIS
1.35/liter, no more than 50%, “Other grape must” 12%+ NIS 1.15/liter, no more than 50%.
EU
TRQ 430,000 liters
Grape Juice
HS 20096 General Duty
12% for under brix value of 30 percent and 30% for over brix value of 67 but no less than
NIS 1.53/kg
U.S.
Duty 85% of general duty. The Israeli Government annually opens voluntary TRQs to the
US, in 2016 the voluntary TRQ stood at 200,000 liters.
EU
TRQ 230 tons.
Frozen fish (excluding fish
fillets and other fish meat of
heading 0304)
HS 0303
General Duty
Between NIS 0-6.3/kg depending on product.
U.S
U.S. duty 85%-90% of general duty rate, and various TRQs depending on the product.
Cheese and Curd
HS 0406 General Duty
Between NIS 4.17/kg-13.49/kg depending on product.
U.S.
Limited TRQ of 649 tons. Over TRQ 90% of general duty.
WTO
TRQ of 6,000 tons.
EU
TRQ of 830 tons. Uruguay and Jordan have product specific TRQs.
Beef- fresh or chilled
HS 0201 General Duty
12% + NIS 9.75/kg.
U.S
TRQ of 1,424 tons, over TRQ 90% of general duty.
Other TRQs:
WTO 10,000 tons, EU 1,120 tons, Uruguay 400 tons, and Paraguay 600 tons.