Embed Size (px)
Citation preview

New Zealand Science Review Vol 63 (3–4) 2007
Official Journal of the New Zealand Association of ScientistsP O Box 1874, Wellington
www.nzas.rsnz.org
A forum for the exchange of views on science and science policy.
Guest Editor: John McKoyEditor: Allen Petrey
Production Editor: Geoff GregoryContents
ISSN 0028-8667
Editorial and foreword ............................................................................................................................53
President’s column .....................................................................................................................................................54ArticlesFisheries and fisheries research in New Zealand – John McKoy ..................................................................................56
Ageing a fish – how and why? – Peter Horn .................................................................................................................58
Assessing Antarctic toothfish stocks in the southernmost fishery in the world – Stuart Hanchet and Alistair Dunn ......61
New Zealand applications of new tagging technology to track migratory marine fish and birds –
Don Jellyman, Malcolm Francis, and Paul Sagar ..............................................................................................65
Orange roughy. What might the future hold? – Matthew Dunn .....................................................................................70
Ocean variability and declining hoki stocks: an hypothesis as yet untested – Janet Bradford-Grieve,
MaryLivingston,PhilipSutton,andMarkHadfield .............................................................................................76
PoemA lament for a fishery – Stuart Hanchet .........................................................................................................................81
President’s Report for 2005/06 ...................................................................................................................................82New Zealand Association of Scientists 2006 Awards ..............................................................................................84Statement of financial performance for the year ended 31 July 2006 ....................................................................86
Instructions to AuthorsNew Zealand Science Review provides a forum for the discussion of science policy. It covers science and technology in their broad-est sense and their impacts on society and the environment, both favourable and adverse. It also covers science education, science planning, and freedom of information. It is aimed at all scientists and decision makers, and the interested public. Readability and absence of jargon are essential.
Manuscripts on the above topics are welcome, two copies of which should be sent to: The Editor
NZ Association of Scientists P O Box 1874 WellingtonAs well as full papers, short contributions, reports on new
developments and conferences, and reviews of books, all in the general areas of interest of the journal, are invited. The journal also accepts reviews of a general nature and research reports.
Full manuscripts (with author’s name removed) will be evaluated and authors will be sent copies of the reviewer’s comments and a decision on publication. Manuscripts should not normally have appeared in print elsewhere but already published results discussed in the different, special context of the journal will be considered. They should preferably not exceed 2500 words.
To facilitate anonymous review, author’s names on manuscripts and any acknowledgement of assistance should be on a detachable
cover page. Manuscripts should be accompanied by biographies of not more than 100 words on each author’s personal history and current interests. Authors are also expected to supply a suitable passport-size photograph of themselves.
Manuscripts should be typed double-spaced with wide margins on one side of the page. Articles may be submitted in Word for PC, rich text format, or plain text, by e-mail, or on floppy disk or CD-R, but a hardcopy should also be sent so that fidelity may be confirmed. Diagrams and photographs should be on separate files (preferably eps, tif, jpg, all at 300 dpi), not embedded in the text.
All tables and illustrations should be numbered separately – Tables 1, 2, 3, 4, etc., and Figures 1, 2, 3, 4, etc. – and be referred to in the text. Footnotes should be eliminated as far as possible. Diagrams and photographs will be printed in black and white, so symbols should be readily distinguishable without colour, and hatching should be used rather than block shading.
References should preferably be cited by the author–date (Harvard) system as described in the Lincoln University Press Write Edit Print: Style Manual for Aotearoa New Zealand (1997), which is also used as the standard for other editorial conventions. This system entails citing each author’s surname and the year of publication in the text and an alphabetical listing of all author’s cited at the end. Alternative systems may be acceptable provided that they are used accurately and consistently.
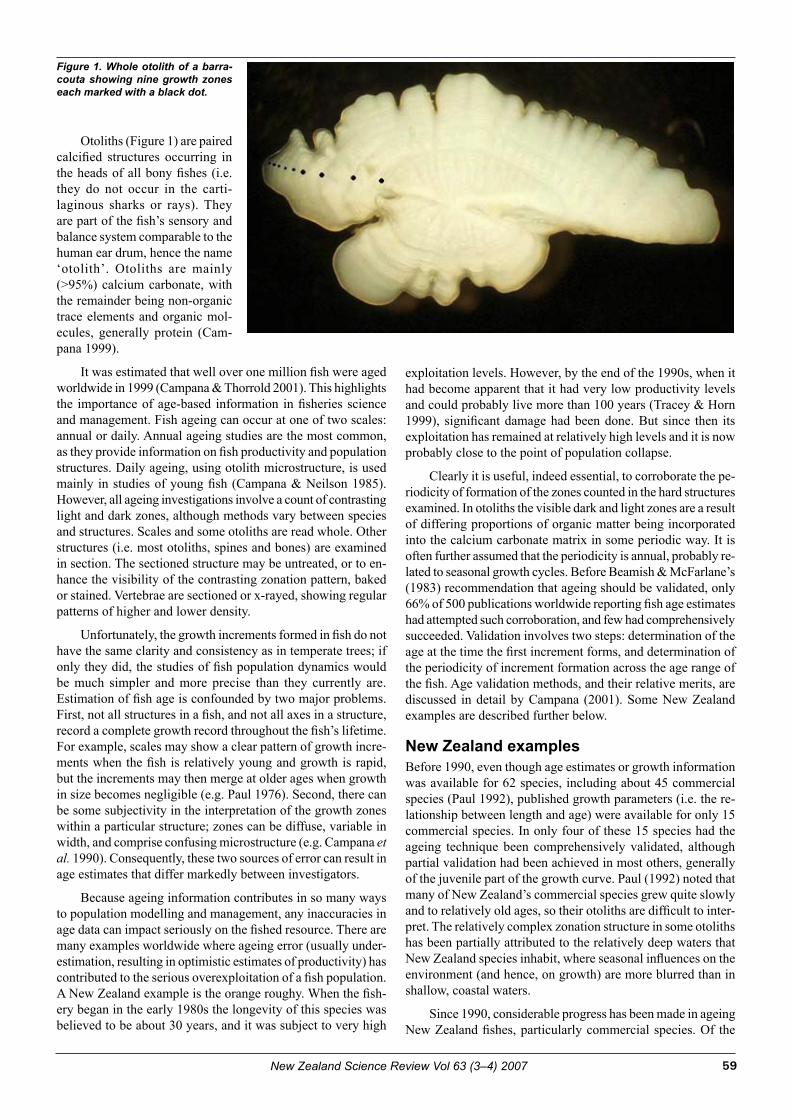
Cover photo: A spawning aggregation of orange roughy on a seamount on the north Chatham Rise. Although the New Zealand orange roughy fisheries have been going for nearly 30 years, their future now looks especially uncertain.

New Zealand Science Review Vol 63 (3–4) 2007 53
Editorial and forewordFisheries research has an important role to play in the rational sustainable management of marine living resources so that future generations are not disadvantaged by our present activities.
Fisheries scientists all round the world are often caught in a difficult bind, caught between their roles as dispassionate sci-entists, their role as citizens who might advocate for, or against, certain levels of current harvest, and the often politicised use that is made of their work by the fisheries management system.
Professor Daniel Pauly, Fisheries Centre, University of British Columbia, who was awarded the International Cosmos Prize in October 2005, highlighted this dilemma is his accept-ance speech. This prize is a prestigious award granted by the Expo ’90 Foundation of Japan, for research excellence with a global perspective. The following is an edited extract from his speech.1
People have good reason to be worried about the fate of life in the ocean, as we now engage our whole industrial might in chasing and catching, for our food, the top predators of marine ecosystems. Increasingly, these predators are being depleted, and we now turn to their prey, smaller fishes and invertebrates, some highly valuable. This phenomenon is now known as ‘fishing down marine food webs’, and it ex-plains a vast number of observations which before remained unconnected. Fisheries have been able to move easily from larger to smaller targets, aided by high technology—such as echolocation and GPS (Global Positioning System)—and abetted by process technologies which can turn even the most improbable sea creatures into tasty morsels.
Life in the ocean, though, was not designed to be ground up by a transoceanic food production machine. In fact, it was not designed at all, but evolved over the eons. Its ability to produce a surplus that we can share, year for year, is an emergent property of marine ecosystems, contingent on their continued existence as complex entities. If the species we target are depleted, and the ecosystems in which they are embedded are drastically simplified, this surplus is reduced, and eventually vanishes. This is the situation we have now in many parts of the world ocean. I wish to emphasise this: global catches from marine fisheries are declining in spite of, or rather because of, increasing fishing effort.
There are those who believe that the problems of fisheries do not justify speaking of a crisis, and that various technological fixes will suffice for solving these problems. Among these fixes are updated versions of our traditional management schemes, jazzed up to include explicit laying out of the costs and benefits of various options on fishing levels, and the pre-sumed risk attached to each. This would enable ‘managers’ to make rational choices under a given set of economic and political constraints. Presently, this approach, which seeks to lay out options as if this is all that scientists can do, and which therefore limits our role to that of vending machines, is very popular in fisheries sciences.
However, our inability to tackle another, much bigger prob-lem—global warming—indicates that we are, as a species, are hardly able to make rational decisions to avert long-term harm to ourselves, even if the risks can be estimated, espe-cially if these decisions involve short-term sacrifices. The recent tsunami in south and southeast Asia, and the even more recent flooding of New Orleans, underline this. In both cases, planning for an eventual catastrophe and working with nature, not against her, would have saved thousands of lives, and avoided immense material damage. Yet, the managers had no plans, and the populations concerned, when they could vote, elected politicians who at best had other priorities, and at worst actively campaigned against such investment for the public good.
This situation has been similar in all the great collapses of fisheries, where after the catastrophe, in virtually all cases, the voice of prudence—usually that of scientists—was shown to have been ignored by the managers, in favor of the voices of short-term interests. Where does this put me—one person amidst a cacophony of voices? I understand the award of this wonderful prize to be a vindication, and an encour-agement to raise the stakes. And the stakes must be raised. We scientists working on environment-related issues have been too meek when managers, lobbyists and politicians have twisted the results of our work to fit their agenda. The main tool they have used to silence us, and to reduce us to vending machines, is the notion that our engagement for the environment would compromise our scientific objectivity. Yet this argument is never evoked in medicine. Indeed, pas-sionate engagement for the patients against disease-causing agents is not only the norm, but also an essential element of doctors’ professional ethics.
This is not the case for environmental scientists, probably because many of us work for governments, and can be easily silenced, or even made to serve a short-term political agenda. Universities, however, are less constrained, and we should expect university researchers to make themselves heard when science is not put to use for the public good. The pub-lic good it must be, because science is a collective venture, ultimately funded by the public, our ultimate master.
We must learn to combine scientific integrity with taking firm positions, not only on the conservation of the plants and animals about which we have expertise, but also for the continued existence of the ecosystems of which they are part. Humans have become the major ecological force on earth, but we can secure continued services from these plants and animals and ecosystems only if we give them the space they need, and the time they need. Most people don’t know that. It is the job of scientists working on ecosystems and on wild flora and fauna to remind politicians and the public of that, and being silent when this is not taken into account is unethical.
The experience of New Zealand scientists is not so different from their colleagues round the world. In this issue, we present a suite of papers that shows the complexity of the research re-quired to reduce uncertainty, often undertaken at sea, often in 1 http://www.seaaroundus.org/NewsletterF.htm, Issue 32

New Zealand Science Review Vol 63 (3–4) 200754
physically difficult circumstances. These papers include those aimed directly at the fisheries as well as interactions with their environment. They give but a flavour of the kinds of research that are being carried out to aid in decision-making about the sustainable use of New Zealand’s marine living resources.
John McKoy shows how the ongoing operation of the Quota Management System is affecting researchers’ ability to make an optimum contribution to the management of New Zealand’s fisheries. Peter Horn takes us through different methods of age-ing fish and the essential reasons for doing this work. He shows how the provision of comprehensive, validated, fish age (and, by extension, growth) information is a key factor in successful management of fishery resources. Stuart Hanchet and Alistair Dunn summarise the ground-breaking work undertaken in the Ross Sea sector of the Antarctic to estimate the stocks of Ant-arctic toothfish. This work has served as a model for estimating
other toothfish stocks in the Convention for the Conservation of Antarctic Marine Living Resources (CCAMLR) forum. Matt Dunn chronicles the fortunes of orange roughy—a cautionary tale. Don Jellyman, Malcom Francis, and Paul Sagar show us how new tagging technology has facilitated interesting, impor-tant insights into the migration and behaviour of marine fish and birds as well as the potential of such techniques. Finally, Janet Bradford-Grieve, Mary Livingston, Philip Sutton, and Mark Hadfield show how oceanographic information may be important to future understanding of how climate variability impacts individual stocks of fish. But first we need to have carried out enough work on the fish and the links between the environment and the fish—an area that has suffered from more recent resource limitations.
Janet Bradford-Grieve fortheCouncilofthe
NewZealandAssociationofScientists
Thoughts on the NZAS PresidencyWhat a privilege it is to assume the role of President of the New Zealand Association of Scientists (NZAS) for two years! Taking on a challenge of this kind presents real opportunities to make a positive difference for science in New Zealand, and both I and NZAS Council are keen to make that difference because we value excellent science. Two years is not a lot of time to make your mark, but I feel strongly that significant gains stand to be made. Overseeing a survey of scientists is the main task for NZAS during 2007, and this project has kept Council quite busy in recent months (more of that below). However, for me it is particularly important that NZAS plays its part in fostering enhanced working relationships across the science sector. Research is full of people who are extremely commit-ted to their own research fields and who hold strong views on science and how it should be organised. Sometimes this means that individuals and organisations find themselves in disagree-ment. However, often even diametrically opposed views can be equally meritorious, and the constructive contributions of diverse groups to the mix of ideas, both in pure research and in policy-setting, should always be welcomed and taken on their own merits. We are all in it for the good of science, and the way forward is through partnership.
Another area of interest to NZAS is the topical question of climate change. On assuming the Presidency, I expressed the hope that NZAS can agree on a definite position on climate change. Perhaps this a rather belated ambition, but we now live in a world that is reacting to climate change and focusing more than ever on sustainable development. Many national science
academies and government organisations around the world have long since stated their own positions on climate change, generally accepting the significance of anthropogenic causes and indicating their intent to work towards mitigation and adapta-tion. My personal view is that this is the only rational position, given the increasingly strong preponderance of scientific evi-dence and, accordingly, climate change has already emerged as a topic of heated debate within Council. I believe strongly that New Zealand’s climate change policy and research communi-ties are of the highest quality, and their work deserves ongoing recognition and support. Further climate change debate within Council is on the agenda, but I hope that NZAS will form a clear view and articulate its position publicly this year.
Meanwhile, I do hope that you enjoy this theme issue about New Zealand fisheries research. Managing our fisheries is a very demanding business that relies heavily on research excellence. This issue explains some of that research and its role in the rational sustainable management of marine living resources so that future generations are not disadvantaged by our present activities.
Now—before saying a few words on the survey—I wish to record my thanks to Dr Hamish Campbell, NZAS President during 2005 and 2006, for his leadership and for his contribu-tions to New Zealand’s wider science environment through his most engaging public lectures. It is great that Hamish continues on NZAS Council as Past President. I am also very pleased that Dr Kate McGrath, physical chemist at Victoria University, has accepted my invitation to take on the role of Vice-President. Kate has been very active in getting the 2007 survey up and running.
President’s column
New Zealand Science Review Vol 63 (3–4) 2007 55
However, many thanks are due to all members of Council for their tireless contributions to NZAS and for making the role of President so easy and enjoyable!
Anyway – on to the survey!
The 2007 Survey of Scientists This year NZAS runs a nationwide survey of scientists in or-der to gain insight into scientists’ perceptions of, and attitudes towards, their careers and towards New Zealand’s science environment. Running a survey of this kind requires the buy-in and support of all research organisations and other key stake-holders, careful survey (questionnaire) design, and access to a comprehensive database (or ‘frame’) of scientists, with the necessary details to permit robust random sampling. Thus, in recent months an NZAS Subcommittee (Ross Moore, Janet Grieve, Kate McGrath, Mike Berridge and myself) has worked hard to ensure that the survey addresses the key issues facing scientists in New Zealand, and that all technical requirements of database development have been addressed. In particular, Council consulted widely during March and April to elicit stakeholder input to the survey and to ensure that the key issues for scientists are reflected in the questionnaire.
In implementing the survey, NZAS will work in partnership with key stakeholders, including the Royal Society of New Zealand, the Ministry of Research, Science and Technology, the Association of Crown Research Institutes, the New Zealand Vice Chancellors Committee, and all research organisations and their scientific staff. We are very pleased that Professor Jack Sommer, of the University of North Carolina (at Charlotte), has been able to come to New Zealand to oversee this survey. Professor Sommer has great experience in administering such surveys, both in the United States and here in New Zealand, and his expertise and independence are crucial. We are most grateful to Dr Lesley Hunt, of Lincoln University, for her expert assistance. We are also very grateful to the Ministry of Research, Science and Technology and the Royal Society of New Zealand, both for financial support and for input to survey design. Their contributions will enable us to develop a robust and relevant survey that we hope to implement through the Internet.
Survey scopeThe survey will include masters degree and doctoral-level scientists at Crown Research Institutes, the Universities, the Research Associations and private research organisations, using updated scientist databases held by Professor Sommer and the Royal Society of New Zealand, and additional information held within other institutions. A representative stratified random sam-ple will be selected independently in order to ensure sufficient numbers of respondents across all research fields and across the relevant demographic categories. Analysis and reporting of the survey will be undertaken by research field, organisational type and demographics (age, years of service, gender, etc.). We
will include both first-time respondents (young scientists) and a representative number of respondents to the previous survey(s) in order to identify any changes in attitudes on their part.
Continuity with previous surveysSurveys of New Zealand scientists were conducted in 1993, 1996 and 2000, the results of which were reported widely, both within New Zealand and internationally. Professor Sommer designed and implemented the 1996 and 2000 surveys, with the assistance of the Royal Society of New Zealand and other organisations.
The three previous surveys focused on the attitudes and per-ceptions of scientists at Crown Research Institutes, Universities and other public and private research organisations. The 2007 survey will also examine scientists’ attitudes and perceptions in order to maintain consistency with the prior surveys, but will also elicit scientists’ views on science policy and on how the value of science can be optimised. Scientists’ attitudes are recognised as key indicators of system health, and therefore the survey is fully consistent with Government’s stated intention, following the science reforms of 1992, to monitor the health of the science system.
Benefits of the survey to New Zealand Potentially, the survey will bring benefits to a range of stake-holders. We hope that the survey findings will be of interest to Government, New Zealand’s political parties, and the public and private research sectors. The survey findings could assist decision-making within our policy and funding organisations and provide important input to future policy design. NZAS expects to determine whether or not attitudes to the science system have changed as the demographics of the scientific community have changed. The availability of such data could contribute to improved funding policy, more effective research organisations and sound science priorities to be developed with the cooperation of working scientists. NZAS sees the survey as providing long-term benefits to New Zealand’s economy, environment and society, through contributions to science policy and priority-setting.
Please support the survey!The survey depends on the cooperation of scientists if it is to produce reliable, policy-relevant findings of use to decision-makers. If you wish to provide input to survey design, please e-mail me at: [email protected]
or telephone me at: 04-470-5801.
If you are selected to participate in the survey, please take the time to complete the questionnaire in full and record your views. We value your contribution!
David LillisPresidentNZAS

New Zealand Science Review Vol 63 (3–4) 200756
Fisheries and fisheries research in New ZealandJohn McKoy
NationalInstituteofWaterandAtmosphericResearch,POBox14-901,Kilbirnie,Wellington
John McKoy is General Manager Fisheries Research for the National Institute of Water andAtmosphericResearch(NIWA).HeisamarinezoologistwithaPhDfromVictoriaUniversityofWellington. He has contributed in a range of roles to fisheries research in New Zealand since 1973, inthethenMinistryofAgricultureandFisheries,MAFFisheries,andsince1995,NIWA.He has worked in crustacean and molluscan aquaculture, fisheries biology and research man-agement in New Zealand, Australia, the Pacific and the Middle East. He may be contacted at [email protected]
At the time that the New Zealand fisheries Quota Manage-ment System (QMS) was introduced in 1986 it was hailed as a “world leading” approach to fisheries management—and in some respects it was. That self-congratulation has evolved over the last two decades, especially when elements of the fisher-ies management system in New Zealand have been criticised, into an oft-repeated statement that we have “the best-managed fisheries in the world”.
There is also a clear perception among many stakeholders that the system is strongly based on science and that “resource sustainability is assured through the QMS and companies can securely invest in adding value to export products ….” (Seafood Industry Council, SeaFIC 2006). In the Ministry of Fisheries 2000 Annual Report the Chief Scientist was quoted as saying (rather boldly) “New Zealand is respected worldwide as a leader in science-based fisheries management, so I believe we can all feel confident that our fishery will be there for future generations’.
However, serious doubt can be cast on the extent to which our fisheries management is in fact science-based and whether the science on which it is based is appropriate and adequate.
Successful fisheries management depends on good informa-tion, adequate institutional arrangements and responsible stake-holder behaviour, all aimed at sustainable use. Nevertheless, as more stocks are coming under pressure from exploitation, coupled with pressure from environmental variability, the flaws in the New Zealand QMS are becoming evident.
Fisheries around New Zealand have become an important industry, and are the fourth largest exporter behind the dairy, meat and forestry industries (SeaFIC 2006). At a recent confer-ence I reviewed the development and effectiveness of the New Zealand fisheries management system from a research perspec-tive (McKoy in press). I argued that the effectiveness of this system in meeting resource management objectives is question-able. Good use of such management tools requires a reasonable knowledge of the state of the resources being ‘managed’ and of the ecological impacts of fishing activity. Our success has been limited by a lack of definition of fisheries management
objectives, ineffective processes for determining key research questions, and inadequate research funding.
Statistics about landings of fish in New Zealand since 1960, export earnings since 1975, and research expenditure reveal much about the scale of the problems (Figures 1–3). Before 1970, New Zealand fisheries landings were based mainly on the use of inshore resources by locally owned and operated vessels. Offshore fishing had until this time been confined to Japanese snapper fishers and deepwater activities of countries such as the Soviet Union, Japan, Korea, and Poland. This foreign activity picked up markedly in the mid 1970s just before the declaration of the New Zealand EEZ in 1978. After 1978, there was a brief period of consolidation, then rapid expansion into middle depth and deepwater fisheries through to 1990. Since then, overall landings have fluctuated around a mean of about 550 000 tonnes per year and brought increasing export revenues peaking at more than $1.5 billion in 2002.
In 1986, New Zealand introduced a tool for the manage-ment of commercial fisheries based on Individual Transferable Quotas (ITQ), generally known as the QMS. The system was introduced with the primary objectives of bringing a form of economic rationality to commercial fishing and providing a better basis for the conservation and sustainability of fisheries resources. The prevailing environment at the time was one of concern about over-fishing and a perception there was an ir-rational race for fish (too many fishers chasing too few fish). A concept that was introduced at this time was the idea of ‘property rights’. In my view, the administration of these rights came to disproportionately dominate the administration, management and politics of commercial fisheries over the next 20 years at the expense of other important objectives such as sustainability. The system of recovering most of the costs of managing fisher-ies from quota holders (known as the cost recovery system) has diverted attention away from the status of the stocks and the research required to establish a useful understanding of their status. Related processes have also provided active incentives for quota owners to argue against research to improve our un-derstanding of those resources.

New Zealand Science Review Vol 63 (3–4) 2007 57
The rights-based approach has been accompanied by a call for rights holders to take on the main responsibility for manage-ment of ‘their’ resources, with the Government merely setting and monitoring appropriate standards. One of the important assumptions made by many supporters of this approach is that rights holders will act in a way that maintains the long-term value of their asset and that they will not undermine this, par-ticularly in relation to sustainability issues. While this is clearly an important message, 20 years of stock assessment discussions have shown that there are clearly other pressures and incentives for quota owners, particularly economic ones, that do not have a long-term focus. Such a conclusion was flagged more than 30 years ago in a model of the impact of the profit motive on the continued existence of certain animal species (Clark 1973). These economic pressures often result in a high degree of risk-taking in uncertain situations and, sometimes, active resistance to research, or interpretations of research, which might result in reductions in Total Allowable Catch or increases in costs to rights holders.
The cost recovery system provides a particularly powerful perverse incentive which has directly impacted fisheries research capability. This is illustrated in the trajectory of fisheries research expenditure (Figures 3 and 4). Before 1995, nearly all research expenditure was from the Government. Since the implementa-tion of cost recovery there has been a steady decline in the dollar value of fisheries research expenditure (not even taking into account the decline in real terms), apart from the injection of ‘biodiversity’ funds (not applied directly to fisheries research)
in about 2003. When plotted relative to export earnings, fisher-ies research expenditure declines from more than 3% of export earning to about 1%.
This decline in expenditure has taken place even though the system of fisheries management in New Zealand is based on total allowable catches, oriented around the concept of maximum sustainable yield, which is hungry for information. However, the development of the expertise and knowledge about our resources has nowhere near kept up with the pressure on the resources. The QMS system, when introduced, had a record number of 29 species groups and about 60 ‘stocks’ to manage, a number that has since increased. So it is not surprising that only 29% of stocks have assessments available that indicate a current biomass that is greater than the biomass at which maximum sustainable yield would be maintained (Table 1).
Figure 1. Estimated annual landings of fish from the New Zealand area, including aquaculture production.
Figure 2. Estimated annual fish export values for New Zealand 1975–2004
Figure 3. Estimated total (Government and cost-recovered from fishing industry) annual fisheries research expenditure 1981–2005. This includes a significant amount of ‘biodiversity’ funding from about 2003.
Figure 4. Annual research expenditure (as in Figure 3) as a propor-tion of export dollars from fisheries.
Table 1. Status of demersal New Zealand stocks with annual landings greater than 500 t (from Ministry of Fisheries, Science Group 2006) (McKoy in press). Bcurr = current biomassBmsy = biomass at which maximum sustainable yield can be maintained
Stock status No. of stocks Percentage 2004/05 relative to Bmsy of stocks landings (t)
Bcurr>Bmsy 24 29 176,000Bcurr<Bmsy 5 6 55,000Uncertain 55 65 213,000Total 84 100 444,000

New Zealand Science Review Vol 63 (3–4) 200758
Overall, I conclude that our science has clearly not delivered a good service for the management and development of fisher-ies in New Zealand. Our system is not strongly science based, and even if our fisheries management system can be described as world leading, it still remains in need of serious attention to avoid history judging us as simply the blind leading the blind.
ReferencesClark, C.W. 1973: Profit maximization and the extinction of animal
species. Journal of Political Economy 81: 950-961.McKoy, J. L. in press. Fisheries resource knowledge, management,
and opportunities: Has the Emperor got no clothes? Proceedings
of Royal Society of New Zealand Conference on New Zealand’s Ocean and its Future – knowledge, opportunities, and management, Auckland, November 2006.
Ministry of Fisheries, Science Group (Comps) 2006. Report from the fishery assessment plenary, May 2006: stock assessments and yield estimates. 875 p. (Unpublished report held in NIWA Library, Wellington.
Seafood Industry Council (SeaFIC) 2003. The Seafood Manifesto.http://www.seafood.co.nz/news centre/publications/
Seafood Industry Council (SeaFIC) 2006. http://www.seafood.co.nz/business/ecotrade/
Considerable research effort is expended in studies that age commercial fish. The reasons for this are described, and meth-ods used to develop and validate the age data are outlined. The state of fish ageing research in New Zealand is summarised, and some species-specific examples are provided.
Why age fish?Age-related studies are a major component of the science con-tributing to the monitoring and management of fishery resources in New Zealand and elsewhere. But why age a fish? Simply because age information ranks as probably the most useful of biological variables contributing information on:• Calculation of growth rates: By ageing numerous individuals
over the full range of sizes in a population it is possible to generate a mean growth curve (i.e. mean length at age) for that population.
• Calculation of mortality rates: By ageing a random sample of individuals from a population, and noting how the fre-quency of fish in each year class declines with increasing age, it is possible to estimate the rate of natural mortality (if the sample is from an essentially unfished population) or the combined rate of mortality attributable to natural causes and fishing (if the population has been significantly fished).
• Estimation of population age structures: The aged random sample described above also shows what age classes the population is composed of, or, if the sample is from a particu-lar fishery, what group of age classes that fishery exploits.
• Estimation of annual spawning success: Again, an aged ran-dom sample can indicate the relative strengths of individual year classes (after accounting for mortality over time), and show, relatively, how successful spawning was in each year. The more estimates that can be derived for the strength of a particular year class (e.g. from consistent sampling in con-secutive years), the greater the confidence in that estimated relative strength.
• Stock structure: Numerous fish species in New Zealand waters are represented by two or more stocks (i.e. distinct populations of the same species with little or no genetic or physical mixing). Differences in growth rates or population age structures between areas can indicate (but do not prove) that multiple stocks occur.
How are fish aged?In biological science, tree rings are the most well known periodic growth increments (generally annual). In the animal kingdom, probably the most well known patterns visible externally are on the shells of bivalve molluscs and tortoises, but numerous other groups have also been shown to produce annual or daily growth increments (e.g. some coral, cricket, and starfish skeletons, and some mammalian teeth). However, fish are notable in that they produce growth increments in various calcified structures, most notably in their otoliths (or ‘ear stones’), but also in scales, spines, vertebrae and other bones.
Ageing a fish — how and why?Peter Horn
NationalInstituteofWaterandAtmosphericResearch,POBox14-901,Kilbirnie,Wellington
Peter HornisascientistwiththeMiddleDepthandDeepwaterFisheriesgroupattheNationalInstitute of Water and Atmospheric Research (NIWA). He has been a fishery scientist for 23 years with involvement in fish stock assessments, resource surveys and fish ageing studies, and has conducted or contributed to ageing investigations on more that 40 fish species in New Zealand and elsewhere. He is looking forward to a time when fish can be routinely aged by a method other thancountsofmicroscopiczonesinhardparts.Hemaybecontactedatp.horn@niwa.co.nz
New Zealand Science Review Vol 63 (3–4) 2007 59
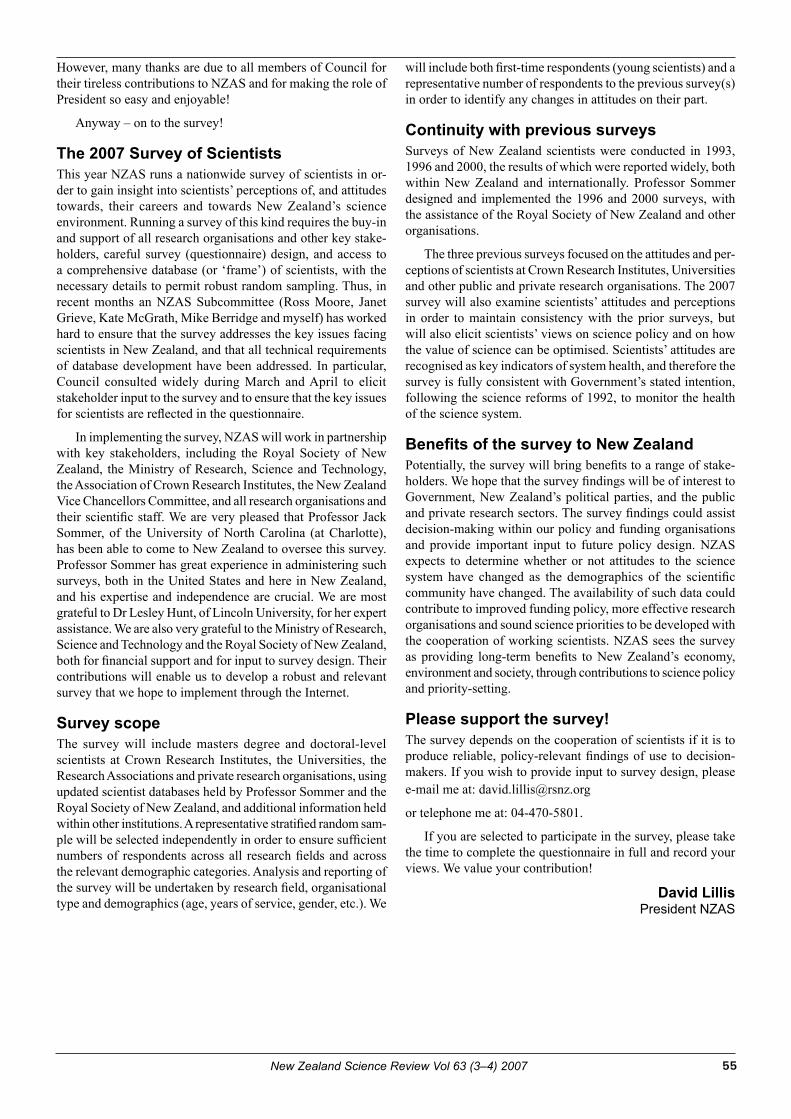
Figure 1. Whole otolith of a barra-couta showing nine growth zones each marked with a black dot.
Otoliths (Figure 1) are paired calcified structures occurring in the heads of all bony fishes (i.e. they do not occur in the carti-laginous sharks or rays). They are part of the fish’s sensory and balance system comparable to the human ear drum, hence the name ‘otolith’. Otoliths are mainly (>95%) calcium carbonate, with the remainder being non-organic trace elements and organic mol-ecules, generally protein (Cam-pana 1999).
It was estimated that well over one million fish were aged worldwide in 1999 (Campana & Thorrold 2001). This highlights the importance of age-based information in fisheries science and management. Fish ageing can occur at one of two scales: annual or daily. Annual ageing studies are the most common, as they provide information on fish productivity and population structures. Daily ageing, using otolith microstructure, is used mainly in studies of young fish (Campana & Neilson 1985). However, all ageing investigations involve a count of contrasting light and dark zones, although methods vary between species and structures. Scales and some otoliths are read whole. Other structures (i.e. most otoliths, spines and bones) are examined in section. The sectioned structure may be untreated, or to en-hance the visibility of the contrasting zonation pattern, baked or stained. Vertebrae are sectioned or x-rayed, showing regular patterns of higher and lower density.
Unfortunately, the growth increments formed in fish do not have the same clarity and consistency as in temperate trees; if only they did, the studies of fish population dynamics would be much simpler and more precise than they currently are. Estimation of fish age is confounded by two major problems. First, not all structures in a fish, and not all axes in a structure, record a complete growth record throughout the fish’s lifetime. For example, scales may show a clear pattern of growth incre-ments when the fish is relatively young and growth is rapid, but the increments may then merge at older ages when growth in size becomes negligible (e.g. Paul 1976). Second, there can be some subjectivity in the interpretation of the growth zones within a particular structure; zones can be diffuse, variable in width, and comprise confusing microstructure (e.g. Campana et al. 1990). Consequently, these two sources of error can result in age estimates that differ markedly between investigators.
Because ageing information contributes in so many ways to population modelling and management, any inaccuracies in age data can impact seriously on the fished resource. There are many examples worldwide where ageing error (usually under-estimation, resulting in optimistic estimates of productivity) has contributed to the serious overexploitation of a fish population. A New Zealand example is the orange roughy. When the fish-ery began in the early 1980s the longevity of this species was believed to be about 30 years, and it was subject to very high
exploitation levels. However, by the end of the 1990s, when it had become apparent that it had very low productivity levels and could probably live more than 100 years (Tracey & Horn 1999), significant damage had been done. But since then its exploitation has remained at relatively high levels and it is now probably close to the point of population collapse.
Clearly it is useful, indeed essential, to corroborate the pe-riodicity of formation of the zones counted in the hard structures examined. In otoliths the visible dark and light zones are a result of differing proportions of organic matter being incorporated into the calcium carbonate matrix in some periodic way. It is often further assumed that the periodicity is annual, probably re-lated to seasonal growth cycles. Before Beamish & McFarlane’s (1983) recommendation that ageing should be validated, only 66% of 500 publications worldwide reporting fish age estimates had attempted such corroboration, and few had comprehensively succeeded. Validation involves two steps: determination of the age at the time the first increment forms, and determination of the periodicity of increment formation across the age range of the fish. Age validation methods, and their relative merits, are discussed in detail by Campana (2001). Some New Zealand examples are described further below.
New Zealand examplesBefore 1990, even though age estimates or growth information was available for 62 species, including about 45 commercial species (Paul 1992), published growth parameters (i.e. the re-lationship between length and age) were available for only 15 commercial species. In only four of these 15 species had the ageing technique been comprehensively validated, although partial validation had been achieved in most others, generally of the juvenile part of the growth curve. Paul (1992) noted that many of New Zealand’s commercial species grew quite slowly and to relatively old ages, so their otoliths are difficult to inter-pret. The relatively complex zonation structure in some otoliths has been partially attributed to the relatively deep waters that New Zealand species inhabit, where seasonal influences on the environment (and hence, on growth) are more blurred than in shallow, coastal waters.
Since 1990, considerable progress has been made in ageing New Zealand fishes, particularly commercial species. Of the

New Zealand Science Review Vol 63 (3–4) 200760
approximately 80 species managed under the Quota Manage-ment System (Ministry of Fisheries, Science Group 2006), growth curves have been calculated for 55, and some growth information is available for a further 13 species. Usually a sin-gle growth curve is not sufficient to describe growth patterns for a single species. Growth generally differs between sexes, with females generally growing faster and to a larger size than males. Also, many species comprise distinct biological stocks (i.e. geographically and/or genetically distinct) and growth can vary between stocks. For example, there are at least five stocks of ling in New Zealand waters, each with significantly different growth rates (Horn 2005). Individual stocks of a resource should be managed individually. Of the 55 species with growth curves, 16 are considered fully validated, while 20 further species are partially validated.
Several different methods for validating the periodicity of otolith growth zones have been successfully used for snapper, hoki, and bluenose. Snapper, highly sought-after by commer-cial and recreational fishers in New Zealand, is an example of a species with a comprehensively validated ageing method (Francis et al. 1992). Over 4600 fish covering a wide range of sizes (and ages) were caught, marked with an external numbered tag, measured, injected with oxytetracycline, and released. Over the following 3 years, 1113 of these fish were recaptured and their ages at death estimated from counts of zones in sectioned otoliths. Oxytetracycline is an antibiotic, and it is deposited in bones and otoliths at the time of injection, leaving a layer that is visible under fluorescent light. It is clearly visible in sectioned otoliths, and consequently, if the number of dark zones in the otolith formed outside the fluorescent band is the same as the number of years since injection, then annual formation of zones is indicated. This was the case for snapper. Additional informa-tion from the study further strengthened the validation of the ageing method. Lengths at the times of tagging and recapture were known for all fish, so these data could corroborate the growth curve calculated from the otolith counts.
The validation of the ageing method for hoki, New Zea-land’s largest commercial fishery, was achieved using two meth-ods (Horn & Sullivan 1996). The juvenile growth section of the otolith is difficult to interpret because the zones are often diffuse with complex micro-banding, and are sometimes split, i.e. a single dark annual zone may be split into two or three distinct dark bands. However, the growth of hoki in its first three years is fast enough to produce distinct modes in length-frequency distributions. Hence, by examining otoliths from fish in these distinct modes it was possible to decipher and validate the early growth patterns in the otoliths. Mean radial measurements to the first three zones were calculated, and these values are now used to help interpret any complicated structure in the juvenile section of routinely read otoliths. Validation of annual zones in otoliths for ages four to eight years was achieved by following the progression of strong year classes in population age struc-tures (i.e. the number of fish in each year class) calculated in each of seven consecutive years. Similar patterns of strong and weak year classes were identified in each distribution (i.e. fish ‘born’ in 1983, 1984, and 1987 were always abundant, while those from 1986 were rare), showing that the counted zones were formed annually.
One of the more complicated age validation studies is of bluenose, a species spending its juvenile life in surface waters, but living near the bottom after about three years. Bluenose otoliths have a very complex structure with two possible inter-pretations. Initial growth is clearly rapid, but after about three years the zones can be interpreted as either abundant and narrow, or relatively broad but composed of complex microstructure.
Consequently, maximum age is estimated to be about 12 years or in excess of 45 years, dependent upon interpretation method. Validation of this species’ age is in progress by analysing levels of 14C in otolith cores. Atmospheric testing of nuclear bombs resulted in an abrupt increase in atmospheric radiocarbon from the late 1950s, and this was incorporated into corals, fish, and other organisms living at the time. The 14C levels increased steadily to peak in 1965, and have since slowly declined, but are still higher than pre-bomb levels (Kalish 1993). Analyses of otolith cores from large fish collected in 1980 showed that they had pre-bomb 14C levels strongly indicative of a pre-1955 birth, and hence, ages in excess of 25 years. So the correct otolith interpretation method has been indicated, but further analyses of samples extracted at particular points along otolith cross-sections are in progress to confirm that the narrow bands are formed annually.
Fish ageing (including the development of initial growth curves and their validation, and the routine ageing to provide information for resource assessments) will continue to be an important component of fisheries research. The provision of comprehensive and accurate growth information is a key factor in successful management of fishery resources.
ReferencesBeamish, R.J.; McFarlane, G.A. 1983. The forgotten requirement for
age validation in fisheries biology. Transactions of the American Fisheries Society 112: 735–743.
Campana, S.E. 1999. Chemistry and composition of fish otoliths: pathways, mechanisms and applications. Marine Ecology Progress Series 188: 263–297.
Campana, S.E. 2001. Accuracy, precision and quality control in age determination, including a review of the use and abuse of age validation methods. Journal of Fish Biology 59: 197–242.
Campana, S.E.; Neilson, J.D. 1985. Microstructure of fish otoliths. Canadian Journal of Fisheries and Aquatic Sciences 42: 1014–1032.
Campana, S.E.; Thorrold, S.R. 2001. Otoliths, increments and elements: keys to a comprehensive understanding of fish populations? Canadian Journal of Fisheries and Aquatic Sciences 58: 30–38.
Campana, S.E.; Zwanenburg, K.C.T.; Smith, J.N. 1990. 210Pb/226Ra determination of longevity in redfish. Canadian Journal of Fisheries and Aquatic Sciences 47: 163–165.
Francis, R.I.C.C.; Paul, L.J.; Mulligan, K.P. 1992. Ageing of adult snapper (Pagrus auratus) from otolith annual ring counts: Validation by tagging and oxytetracycline injection. Australian Journal of Marine and Freshwater Research 43: 1069–1089.
Horn, P.L. 2005. A review of the stock structure of ling (Genypterus blacodes) in New Zealand waters. New Zealand Fisheries Assessment Report 2005/59. 41 p.
Horn, P.L.; Sullivan, K.J. 1996. Validated aging methodology using otoliths, and growth parameters for hoki (Macruronus novaezelandiae) in New Zealand waters. New Zealand Journal of Marine and Freshwater Research 30: 161–174.
Kalish, J.M. 1993. Pre- and post-bomb radiocarbon in fish otoliths. Earth and Planetary Science Letters 114: 549–554.
Ministry of Fisheries, Science Group (Comps) 2006. Report from the Fishery Assessment Plenary, May 2006: stock assessments and yield estimates. 875 p. (Unpublished report held in NIWA library, Wellington.)
Paul L.J. 1976. A study on age, growth, and population structure of the snapper, Chrysophrys auratus (Forster), in the Hauraki Gulf, New Zealand. New Zealand Ministry of Fisheries, Fisheries Research Bulletin 13, 62 p.
Paul, L.J. 1992. Age and growth studies of New Zealand marine fishes, 1921–90: A review and bibliography. Australian Journal of Marine and Freshwater Research 43: 879–912.
Tracey, D.M.; Horn, P.L. 1999. Background and review of ageing orange roughy (Hoplostethus atlanticus, Trachichthyidae) from New Zealand and elsewhere. New Zealand Journal of Marine and Freshwater Research 33: 67–86.

New Zealand Science Review Vol 63 (3–4) 2007 61
A small exploratory longline fishery for Antarctic toothfish (Dissostichus mawsoni) started in the late 1990s in the Ross Sea. Because of New Zealand’s historic interest in the Ross De-pendency, and also because this fishery was initially discovered and developed by New Zealand longline vessels, New Zealand took on the responsibility of assessing the size and sustainable yields from this toothfish stock. However, this was not an easy matter because the fishery was being carried out between lati-tudes 70ºS and 75ºS—a distance of about 3500 km from New Zealand—and at depths of 1000 to 2000 m. To make matters worse, the location of spawning grounds, eggs and larvae and juvenile fish are unknown, the adult fish typically live on rough areas unsuitable for traditional research methods such as trawl surveys, and the region is covered by thick ice for much of the year. This paper examines the development of the research programme for Antarctic toothfish, the problems identified and overcome, the results of the first stock assessment of this species, and plans for further scientific work.
Toothfish and the toothfish fisheryToothfish are large predatory fish occurring on banks, ridges, and seamounts throughout most of the Southern Ocean. There are two main species, Antarctic and Patagonian toothfish, both of which can grow to over 2.3 m in length and weigh more than 130 kg (Figure 1).
Antarctic toothfish are found exclusively in Antarctic waters between the Polar Convergence (at about 60°S) and the Antarctic continent. The better known Patagonian toothfish or Chilean sea bass (D. eleginoides) is confined to subantarctic waters (north
of 65ºS), where it has been the target of both legal and illegal fishers since the early 1990s. It only occurs in the northern part of the Ross Sea region, and makes up only a small proportion of the catch in that area.
The toothfish fisheries in Antarctic waters are managed by the Commission for the Conservation of Antarctic Marine Living Resources (CCAMLR). CCAMLR takes a precaution-ary approach to the management of these fisheries and also has a strong mandate from its members to take into account the ecosystem effects of fishing. In conjunction with the Ministry of Fisheries, NIWA scientists have been involved in the devel-opment of research programmes to help ensure that fishing is both sustainable and has minimal impact on the surrounding ecosystem.
To date, most of the fishing for Antarctic toothfish has taken place in the Ross Sea (Figure 2). The exploratory longline fishery was initiated by a New Zealand longline vessel in 1997. Since then, New Zealand vessels, and more recently vessels from other countries, have returned during the summer to fish in this area. The catch from the fishery has steadily increased over the past 10 years, first exceeding 1000 t in 2002 and reaching the catch limit of about 3000 t for the first time in 2005. In addition to a catch limit for the total area, there are sub-catch limits for each of the small-scaled research units used to manage the fishery (Figure 2).
Toothfish biologyAlthough considerable research has been carried out on Patago-nian toothfish, little was known about the biology of Antarctic
Alistair Dunn joined the fisheries modelling group of NIWA in 1996 after completing a Masters degreeinAppliedStatisticsatOxfordUniversity.Heinitiallyfocusedonarangeofmiddledepthspeciesincludinghokiandhake,buthassincedevelopedstockassessmentmodelsforawiderange of New Zealand’s fish and shellfish species. He now specialises in fisheries modelling, statisticalmethods,andstockassessments,andisbasedinWellington.HeisPrincipalScientistof the Middle Depths fisheries group and has been NIWA’s National Centre Leader for Fisheries since 2005. He has been a New Zealand delegate to CCAMLR for the past four years.
Stuart Hanchet is a Nelson-based fisheries scientist with the National Institute of Water and At-mosphericResearch(NIWA),whereheistheleaderoftheFisheriesandHydrologyGroups.AftercompletinghisPhDattheUniversityofOtagoin1986,DrHanchetjoinedtheFisheriesResearchDivisionofthethenMinistryofAgricultureandFisheriestodeveloparesearchprogrammeforsouth-ernbluewhiting.Hehassincecarriedoutresearchonawiderangeofinshoreandmiddledepth(200–800 m) fish species and has more recently managed and carried out research programmes on the developing Antarctic toothfish fishery in the Ross Sea. He has been a New Zealand delegate to the Commission for the Conservation of Antarctic Marine Living Resources (CCAMLR) since the mid1990sandiscurrentlytheconvenorofitsWorkingGrouponFishStockassessment.Hemaybecontactedats.hanchet@niwa.co.nz
Assessing Antarctic toothfish stocks in the southernmost fishery in the world
Stuart Hanchet1 and Alistair Dunn2 1NationalInstituteofWaterandAtmosphericResearch,POBox,893,Nelson
2NationalInstituteofWaterandAtmosphericResearch,POBox14-901,Kilbirnie,Wellington

New Zealand Science Review Vol 63 (3–4) 200762
toothfish before 1999. With the help of scientists from the USA, NIWA scientists developed and validated a method for ageing Antarctic toothfish by counting growth rings in the fish’s otoliths (fish ear bones) – the first time any toothfish species had been accurately aged (Horn et al. 2003). The fish used to validate the ageing came from a US tagging programme. For over 20 years, US scientists, based at McMurdo Sound in the Ross Sea, had captured Antarctic toothfish through holes in the Ice Shelf and, before release, injected the fish with oxytetracycline. This chemical is deposited in the hard parts of the fish ear bones and acts as a date marker of when the fish are released. The recapture
and analysis of six fish (including one that had been at liberty for 7 years) confirmed that growth rings were formed annually. Toothfish grow quite fast – at a similar rate to temperate-water species such as hoki and hake common around the coast of New Zealand. Toothfish reach a length of about 60 cm after 5 years, about 100 cm after 10 years, and about 150 cm after 20 years. The maximum age recorded is almost 50 years, but few fish older than 35 years are caught in the fishery.
Fish are thought to mature and then go to spawn after the fish turn about 10 years old, but we do not know the exact timing and location as the Ross Sea area is ice-covered at that time. Some ‘ripe’ fish (i.e. fish that have fully developed eggs and are about to spawn) have been found on the northern seamounts in May and again in December, so it is possible that spawning occurs from early winter through to late spring. Larvae and juvenile fish have not been found in the Ross Sea, but elsewhere are pelagic (until at least 15 cm), after which they start to spend more time on the sea bottom.
Adult toothfish are primarily piscivorous (i.e. they feed mostly on other fish), but the importance of prey items varies geographically (Fenaughty et al. 2003). In the coastal waters around McMurdo Sound, they feed on Antarctic silverfish, on the continental slope of the Ross Sea they feed mainly on ice-fish and rattails, in the northern seamounts they feed on rattails and violet cod, whilst in the open oceanic waters they feed on small squid.
Development of stock assessment modelThe first catch limits for the fishery were derived by comparing catch rates between fishing vessels in the Ross Sea and other, similar, vessels in the Patagonian toothfish fisheries in the CCAMLR area, but as the catch increased there was an urgent need to develop better estimates of current abundance and the long-term yields for the stock.
Figure 2: The greater Ross Sea area showing the CCAMLR boundaries used for managing the Antarctic toothfish fishery. The assessment is based on the area marked on the map as the Ross Sea Dependency.
Figure 1: Antarctic toothfish get very big. This one was 1.75 m long and weighed 75 kg.

New Zealand Science Review Vol 63 (3–4) 2007 63
CCAMLR rules require two scientific observers to be present on every longline vessel fishing for toothfish. In addition to monitoring fishing activity and catches, these observers collect length and sex measurements for all target and bycatch fish species, and also collect otoliths for routine age determination. The length and age data collected by these observers have since been used to develop a time series of catch and age composition of toothfish from the fishery.
While catch-at-age population models have become com-mon practice for assessing stocks when time series of catch and age compositions are available (Hillborn & Walters 1992), these data by themselves are rarely sufficient to adequately model a fish population. Such models often require auxiliary abundance information, and survey-based relative or absolute abundance have typically been used. In the absence of such fishery-independent data, relative changes in catch-per-unit-effort (CPUE) statistics from fisheries are often the only other information available. The use of CPUE data requires the as-sumption that the change in indices is proportional to changes in stock abundance, an assumption which is often violated (Hillborn & Walters 1992). Indeed, in the Antarctic toothfish fishery there is some evidence that changes in CPUE reflect annually varying ice cover and vessel interactions, rather than indexing any changes in abundance.
Unfortunately, research surveys to Antarctic waters are expensive and the rough ground and depth inhabited by adult toothfish mean these methods were very unlikely to work. An alternative method for estimating stock abundance is mark- recapture experiments (Ricker 1975; Seber 1982). Mark-recap-ture experiments can provide an estimate of stock size as long as three numbers are known: (i) the number of fish tagged in the release phase, (ii) the number of fish scanned for tags in the recapture phase, and (iii) the number of those scanned fish which have tags. Mark-recapture analyses also require independent estimates of tag loss rates, tag-induced mortality rates, and tag reporting rates because these can confound estimates of stock abundance.
An experiment in tagging Pategonian toothfish was carried out around Macquarie Island during the mid-1990s, and the in-formation from the recaptured fish used to estimate of abundance of that (Tuck et al. 2003). Those fish were mainly sub-adults (40–100 cm long) and were caught by trawling in relatively shallow waters (400–800 m depth). However, within the Ross Sea fishery, toothfish are primarily adults (100–200 cm long) and are hauled up on a longline from 1000 to 2000 m depth, so there was concern that these fish would not survive long after being captured, tagged, and released. However, in 2001, New Zealand toothfish vessels initiated an experimental tagging programme, tagging 260 fish in the first year and 680 the next. The recapture of three tagged fish in 2002 (including one at liberty for over 12 months) showed that at least some tagged fish were likely to survive. Following the further recapture of 11 more fish in 2003, and the results of a simulation study that showed the potential of a tagging experiment to estimate stock sizes (Sullivan et al. 2003), CCAMLR made tagging a requirement for all vessels fishing in the exploratory toothfish fisheries in CCAMLR waters. Since 2004, vessels have been required to tag toothfish at the rate of 1 toothfish per tonne of green weight toothfish caught. That translates to a rate of about 1 in every 30 fish caught.
Traditionally, estimates of marine fish abundance from tag data involve a single tagging event, where a large number of tagged fish are released, followed by a short recovery phase. By doing this, the effects of tag loss, long-term fish movement, and changes in fish growth or natural mortality with time or age do not need to be taken account of within the estimation proc-ess. So, the next step of our research was aimed at developing a population modelling approach which could explicitly deal with the multi-year tag data from the Ross Sea toothfish fishery. We also hoped to develop an approach which was sufficiently flexible to deal with the range of CCAMLR toothfish fisheries and also allowed the inclusion of other ancillary data where they were available.
Assessment results In 2004, NIWA scientists presented their first attempt at develop-ing a model to a meeting of the technical fish modelling group of CCAMLR in Sienna, Italy (Dunn et al. 2004). The model was essentially a sex- and age-structured Bayesian population dynamics model which specifically dealt with multi-year tag-release and tag-recapture data, as well as allowing other ancillary fishery data or observations (e.g. catch-age and catch and effort data) to be included. Since then, NIWA scientists have continued to work on the model, and by October 2005 it had been reviewed and accepted by the Fish Stock Assessment Working Group of CCAMLR, who used it to calculate the catch limits for the Ross Sea Antarctic toothfish fishery (Dunn & Hanchet 2006). By October 2006, New Zealand’s model had been adopted by UK and Australia scientists and was used by them to estimate biomass and catch limits for the Patagonian toothfish fisheries at South Georgia and Heard Island, respectively.
The speed of uptake of the modelling approach and its use for setting catch limits for the first CCAML exploratory fishery has been quite remarkable and is a testament to the quality of the stock assessment work done in New Zealand. However, the research is also unusual in that the entire assessment is based on data collected from industry vessels. The success of the research is therefore in no small part due to the excellent cooperation with the fishing companies involved and the large amount of effort put in by the observers and industry representatives involved in the sampling and tagging of fish.
The tag data used in the Ross Sea toothfish model are given in Table 1. A total of over 4000 fish have been released by New Zealand vessels, of which 73 fish have been recaptured after at least one year at liberty. From these and catch-at-age data, the best estimate of initial (pre-exploitation) spawning stock biomass (B0) was 80 510 t (95% C.I.s 59 920–119 920 t) with the current spawning stock biomass estimated as 87% B0 (Figure 3). Appling the CCAMLR decision rules for long-term
Table 1. Numbers of Antarctic toothfish with tags released for the years 2001–05 recaptured in 2002–06 by New Zealand vessels.
Tagged fish released Tagged fish recaptured Year Number 2002 2003 2004 2005 2006 Total2001 259 1 1 0 0 0 22002 684 – 5 3 5 5 182003 858 – – 7 7 0 142004 864 – – – 16 11 272005 1518 – – – – 12 12Total 4183 1 6 10 28 28 73

New Zealand Science Review Vol 63 (3–4) 200764
precautionary yields within the model resulted in an annual catch limit of 3046 t.
Future workWork over the next 3–5 years will focus on three key areas. The first is the further improvement and development of the toothfish population model—incorporating better information on the spatial distribution and abundance of toothfish. The second is to develop monitoring methods and stock assessment models for the key bycatch species from the fishery—the grenadiers (rattails) and rajids (skates). The third is the development of integrated ecosystem models to determine potential effects of the removal of this key predator from the Ross Sea marine eco-system. Work on this latter project began two years ago initially under a Ministry of Fisheries project and subsequently as part of a 4-year FRST programme.
AcknowledgmentsThe development of the Antarctic fisheries research programme has been a collaborative effort between NIWA scientists and Ministry of Fisheries staff, in particular Neville Smith and Kevin Sullivan, and has had support and cooperation from scientific observers, fishing company staff, Ministry of Foreign Affairs and Trade, Te Papa, and other CCAMLR member countries. The programme has been funded under various New Zealand Ministry of Fisheries projects.
ReferencesDunn, A.; Hanchet, S.M. 2006. Assessment models for Antarctic
toothfish (Dissostichus mawsoni) in the Ross Sea including data from the 2005–06 season. WG-FSA-06/60. 26 p. National Institute of Water and Atmospheric Research. Unpublished manuscript presented to the Fish Stock Assessment Working Group of CCAMLR
Dunn, A.; Gilbert D.J.; Hanchet, S.M.; Bull. B. 2004. Development of an Antarctic toothfish (Dissostichus mawsoni) stock model for CCAMLR Subarea 88.1 for the years 1997–98 to 2003–04. WG-FSA-04/36. 39 p. National Institute of Water and Atmospheric Research. Unpublished manuscript presented to the Fish Stock Assessment Working Group of CCAMLR
Fenaughty, J.M.; Stevens, D.W.; Hanchet, S.M. 2003. Diet of the Antarctic toothfish (Dissostichus mawsoni) from the Ross Sea, Antarctica (Subarea 88.1). CCAMLR Science 10: 113–123.
Hillborn, R.; Walters, C.J. 1992. Quantitative fisheries stock assessment. Chapman and Hall, New York.
Horn, P.L.; Sutton, C.P.; De Vries, A.L. 2003. Evidence to support the annual formation of growth zones in otoliths of Antarctic toothfish (Dissostichus mawsoni). CCAMLR Science 10: 125–138.
Ricker, W.E. 1975. Computation and interpretation of biological statistics of fish populations. Bulletin of the Fisheries Research Board of Canada 191: 29–73.
Seber, G.A.F. 1982. The estimation of animal abundance and related parameters. Macmillan Publishing, New York. 654 p.
Sullivan, K.J.; Smith, N.W.M.; McKenzie, J.; Hanchet, S.M. 2003. A feasibility study for stock assessment of D. mawsoni in the Ross Sea (subareas 88.1 and 88.2) using a tag and recapture experiment. WG-FSA-SAM-03/10. 22 p. Ministry of Fisheries. Unpublished manuscript presented to the Stock Assessment Methods subgroup of the Fish Stock Assessment Working Group of CCAMLR.
Tuck, G.N.; de la Mare, W.K.; Hearn, W.S.; Williams, R.; Smith, A.D.M.; He, X.; Constable, A. 2003. An exact time of release and recapture stock assessment model with an application to Macquarie Island Patagonian toothfish (Dissostichus eleginoides). Fisheries Research 63: 179–191.
Figure 3: Estimated distributions of spawning stock biomass for the Ross Sea Antarctic toothfish stock. Horizontal lines indicate the medians.

New Zealand Science Review Vol 63 (3–4) 2007 65
The advent of data storage tags is providing exciting opportuni-ties to explore the behaviour and movements of migratory ani-mals. These tags are capable of measuring parameters such as temperature and depth, and from measurements of daylight and length, scientists are able to calculate latitude and longitude, and hence track animals in the open ocean. Both types of storage tag (those that need to be retrieved, and those that download data to satellites) have been used in New Zealand. Retrieved tags from sooty shearwaters have shown that these birds undergo migra-tions of about 64 000 km, the most extensive migrations known for any bird. Results from 3 transmitting “pop-up” tags attached to great white sharks at the Chatham Islands showed that the sharks moved extensive distances to tropical waters north of New Zealand, and were capable of making dives to 600 m. These tags have also been used to track offshore movements of migrating freshwater eels with the hope of finding their marine spawning grounds. Results to date have indicated a definite migration to the tropics, but also a regular daytime diving behaviour to depths of 800 m or more, probably to avoid predators. Further miniaturisation of tags will enable correspondingly smaller fish and birds to be tracked in future.
IntroductionIn ecology, mark and recapture studies are fundamental tools for measuring parameters at both an individual organism level (growth rates, movements), and a population level (population size, stock discreteness). The use of tags of various types has a long history in New Zealand, especially for fish and birds. For fish, mark-recapture studies have been used to study growth of individuals (e.g. school shark, flounders; rock lobster; freshwater eels), movements (e.g. rig, flounders, hapuku; rainbow trout, rock lobster), stock structure (e.g. bluenose), and population size (snapper). Likewise, banding of birds has a long history in New Zealand and has been used to study movements, (e.g. southern royal albatrosses), breeding success (e.g. sooty shear-water, Buller’s albatross, northern royal albatross), and adult survival (e.g. sooty shearwater, Buller’s albatross, northern royal albatross, Campbell albatross, grey-headed albatross). This article reviews New Zealand applications of new overseas tagging technology.
New Zealand has an extensive Exclusive Economic Zone (EEZ) that is seasonally home to a variety of migratory fish and
Paul SagarjoinedFisheriesResearchDivision(FRD,nowNIWA)in1978.HisundergraduateandgraduatestudiesattheUniversityofCanterburyinvolvedhiminresearchinAntarcticaandatthesubantarcticSnaresIslands,andhehasbeenfortunatetocontinuehisinterestsinthesefascinat-ingareas.DuringhistimeinFRDhewasmainlyinvolvedwithassessmentsoftheenvironmentalimpact of irrigation and hydro power schemes on freshwater fish and invertebrates. However, since theestablishmentofNIWAin1992hehasspentanincreasingamountofresearcheffortexaminingthe effects of climate change and the impact of fisheries on seabird populations.
New Zealand applications of new tagging technology to track migratory marine fish and birds
Don Jellyman1, Malcolm Francis2, and Paul Sagar1
1NationalInstituteofWaterandAtmosphereResearch,POBox8602,Riccarton,Christchurch2NationalInstituteofWaterandAtmosphericResearch,POBox14-901,Kilbirnie,Wellington
Don JellymanisleaderoftheFreshwaterFishGroupoftheNationalInstituteofWaterandAtmos-phereResearch(NIWA).NowbasedinChristchurch,hecompletedhisundergraduatestudiesandPhDat Victoria University in 1974. Most of his research has been on the ecology of native fish, especially freshwater eels. He has also investigated headwater trout fisheries, and the impacts of hydro and irrigation schemes on fish and fisheries. He may be contacted at [email protected]
Malcolm Francis isPrincipalScientistforInshoreandPelagicFisheriesatNIWAWellington.HecompletedMastersdegreesattheUniversitiesofAucklandandCanterbury,andaPhD(onjuvenilesnapperbiology)attheUniversityofAuckland.HisresearchforNIWA(andformerlyMAFFisheries)has focused on the population biology of coastal and pelagic fishes, and he has particular interests in cartilaginous fishes (sharks, skates, and chimaeras), estuarine fishes, and age and growth.

New Zealand Science Review Vol 63 (3–4) 200766
birds. A common problem in fisheries research and management is understanding the timing of such migrations, as this deter-mines their availability to both commercial and recreational fishers in New Zealand. Furthermore, New Zealand has obliga-tions under the Convention on the Conservation of Migratory Species of Wild Animals (CMS) to manage highly migratory species sustainably while they are in our waters. Species like billfish (marlins and swordfish) and tunas undertake extensive migrations—for example, tagged skipjack tuna are known to have travelled 9500 km, bluefin tuna at least 7700 km, and black marlin over 10 000 km (Joseph et al. 1988). The world record distance travelled by a tagged fish appears to be held by a great white shark tagged in South Africa—it travelled to Western Australia and then back to South Africa, a distance of about 22 000 km (Bonfil et al. 2005). New Zealand is home to about eight species of tunas and six species of billfish, and these too have been found to migrate over extensive distances (Holds-worth & Saul 2006). Tag returns from other pelagic species like kahawai and trevally have indicated that while these species may move extensively around New Zealand inshore waters, they have not been recorded moving offshore to Australia, although the same species are found there. In contrast, 10% of school sharks (Galeorhinus galeus) tagged in New Zealand travelled over 1700 km to Southern Australia, and after two years at lib-erty the proportion jumped to 23% (Hurst et al. 1999).
New research into the foraging areas of seabirds has been stimulated by the incidental mortality of seabirds in various fisheries worldwide. Consequently, it has become important to know just when and where there are significant overlaps in the occurrence of particular seabird species and fisheries so that mitigation measures to avoid or, at least, reduce the impact of fisheries may be implemented
History of tagsHistorically, tracking of migratory fish used a variety of indi-vidually numbered tags, usually plastic disc tags and plastic tubular “spaghetti” tags. For juvenile fish, small (2 mm) binary-coded wire tags (CWT) became available in the 1970s and are now available as individually numbered tags. Such tags have been used on juvenile fish in both salt water (snapper) and fresh water (Chinook salmon and eels). More recently, visual implant tags (VI) have become available—these are small (1 × 2.5 mm) and are inserted in unpigmented tissue and can be read from captured fish without having to be surgically removed (unlike CWT tags). VI tags have been used to study movements and growth rates in a range of species including the rare shortjaw kokopu, blue cod, and marine invertebrates like rock lobsters. Likewise, the movements and longevity of birds have histori-cally involved extensive leg banding programmes, usually with specific colour combinations so that observers could report birds without the necessity to recapture individuals.
Modern tagging technologyThe advent of electronic tags has led to huge advances in our understanding of the behaviour and migrations of migratory fish and birds. Although there are numerous electronic tags, they can be broadly classified into three types: transponding tags, transmitting tags, and data storage tags (Figure 1).
With transponder tags, the power source is external to the tag, resulting in small size of tags. The most commonly used
transponding tags are PIT tags (Passive Integrated Transpond-ing tags) that consist of a small glass or plastic encapsulated electro-magnetic coil and microchip that is usually inserted into the body cavity of a fish. The tag is inert until activated inductively by a tag reader which provides the power for the tag to transmit its unique alphanumeric code. Being small, im-pacts on animals are minor, and the animal does not have to be restrained or killed for the tag number to be read. The principal disadvantage with these tags is that the detection range is quite short, typically < 0.5 m. Within New Zealand, they have been used to differentiate broodstock of salmon and trout, and to mark creatures as diverse as snapper, seahorses and migratory eels (e.g. Boubée & Williams 2006).
There is a wide range of transmitting tags, although the most commonly used are radio and acoustic tags. These tags have an internal battery to power the transmitter, meaning the life of the tag is often a trade-off between transmitter size, battery size, required transmission range, and rate of signals. Transmission of radio waves is rapidly attenuated in salt water, but in fresh water, tagged fish can often be detected at distances of a kilo-metre, meaning tracking from the air is possible (to augment bankside or boat tracking). An important feature of acoustic tags is that in addition to providing position, signal strength can also be used to determine swimming depth. For fish that move between fresh and salt water (like many of New Zealand’s na-tive fish and introduced salmon), dual radio-acoustic tags are now available.
Initial studies of foraging seabirds in New Zealand involved the use of radio tags on penguins (e.g. yellow-eyed penguins) However, a major drawback of this method of tracking was the relative short distance offshore over which the birds could be tracked before they were out of range. This limitation was over-come with the development of lightweight satellite transmitters during the early 1990s. Each device transmits an individually identifiable signal which may be detected by orbiting ARGOS satellites, and transmitted to receiving stations. It is possible to obtain 20–30 locations per day from each satellite transmit-ter, and so follow the movements of the bird anywhere in the world. Initially, satellite transmitters could be attached only to the larger seabirds, such as albatrosses and penguins, but recent miniaturisation of satellite transmitting devices has enabled the tracking of smaller seabirds, such as petrels and shearwaters.
A major limitation of satellite transmitters is the weight of the batteries required to power the devices. Archival or data storage tags (DST) do not require such a large and consistent power supply, and so are markedly lighter in weight than satel-lite transmitters.
Figure 1. Types of electronic tags.

New Zealand Science Review Vol 63 (3–4) 2007 67
There are two types of data storage tags (DST)—those where the animal needs to be recaptured (or at least the tag retrieved) for the data to be obtained, or transmitting tags where the accumulated data are transmitted to satellites. Retrieved DSTs can be programmed to record such data as temperature, salinity, depth, light and various physiological features like respiration and heart rates, and stomach temperatures (as a fall in temperature accompanies feeding in seabirds, thus enabling feeding frequency to be estimated). Such tags are well suited to species that “home” to a spawning or nesting site when tags can be recovered, otherwise recovery is mainly reliant upon random recaptures from commercial fisheries. Data storage tags include miniature Global Positioning System (GPS) devices that can be used to track the movements of seabirds. Such tags can pinpoint the location of a bird to within a few metres at intervals down to one second! Thus, birds may be tracked as they follow indi-vidual fishing vessels, which also use GPS. The main limitation of these tags is their data storage capacity, but memory, too, is becoming increasingly miniaturised.
Transmitting tags overcome the need for tag recovery. Be-cause UHF radio waves are rapidly attenuated in salt water, the initial transmitting tags were limited to large sharks and marine mammals that surfaced sufficiently often for transmissions to be detected by a passing satellite. However, “pop up” tags are a recent advance, being tags that detach from the fish at prede-termined times, float to the surface and transmit data to ARGOS satellites. In addition to information on temperature and depth, these tags record day length and times of sunrise and sunset, from which daily latitude and longitude can be estimated. In this way, swimming tracks can be obtained. In New Zealand, pop-up tags have been used to study movements of white sharks, migratory freshwater eels, marlins and swordfish, while recov-erable data storage tags have been used to study migrations of seabirds—sooty shearwaters, and white-capped albatrosses.
Thus, the type of tag used to track the movements of fish and seabirds depends initially upon the questions being asked, the accuracy of the data required, and the time period over which the data are recorded. The following case studies illustrate some of the exciting potential that data storage tags offer, and give some preliminary results from studies currently under way.
Great white sharksIn April 2005, an expedition to the Chatham Islands deployed pop-up satellite tags on four great white sharks. The sharks were attracted to the boat using “berley” made of fish oil and minced tuna, and whole albacore tuna tied on to ropes (Figure 2). Using a long tagging pole, tags are inserted into the muscle just below the first dorsal fin. Our tags were programmed to release after 3–6 months. One tag came off prematurely after only a week, but the other three tags ran their full course and transmitted data.
The three successfully tagged sharks remained near the Chatham Islands for 2–5 months after tagging. They probably stayed close to seal colonies, feeding on young seals as they learnt to swim. Two of the sharks departed from the Chathams within a week of each other, and the third departed several months later. They all headed north or northwest. One tag popped up near the Louisville Seamount Chain northeast of East Cape, about 1000 km from the Chathams. The other two sharks, carrying 5- and 6-month tags respectively, travelled almost 3000 km into tropical waters north of New Zealand.
These results were a revelation—white sharks have not pre-viously been reported from the Louisville Seamount area, and although they have been seen in tropical waters, sightings there are rare. The reasons for these major migrations are unknown, although several theories are being examined. Intriguingly, all three migrating sharks began making deep dives to greater than 600 m while crossing ocean basins. This was in stark contrast to their behaviour while at the Chathams, when they rarely ventured deeper than 75 m over a period of months. Again we are unable to explain this diving behaviour, but feeding on deepwater animals such as squid has been shown in some tunas and swordfish.
We have only a small sample size so far, but it is clear that moves to protect white sharks in New Zealand waters may not extend far enough offshore. The three tagged sharks all moved outside the New Zealand EEZ and away from New Zealand’s legal jurisdiction. This suggests that white sharks should be protected in the areas they visit frequently during their migra-tory movements, as well as in New Zealand.
Freshwater eelsScientists from NIWA and the University of Tokyo are coop-erating in a programme using pop-up tags, in an endeavour to trace migrating female longfin eels (Anguilla dieffenbachii) to their spawning grounds. The classical means of determining spawning grounds of freshwater eels has been to collect progres-sively smaller larvae, but to date, no larvae of the longfin eel have been captured. Four tagged eels (8–11 kg) were released into the ocean from Lake Ellesmere in May 2000, with two tags programmed to ascend after 2 months, and two after 3 months. We received sufficient daily location data to construct swim-ming tracks for all four eels, and all four showed an eastward movement along the Chatham Rise. While information from these eels did not shed much light on possible spawning areas, there were indications from the daily temperature variations that eels were moving significant vertical distances through the water column, and we were able to calculate that they swam at speeds ranging from 26–31 km per day.
A second batch of 10 tagged eels was released from Lake Ellesmere in May 2001. These tags included a pressure sensor to record swimming depth. Unfortunately, significant informa-tion was received from only three of the tags, which stayed attached for periods ranging from 26–161 days. The last tag surfaced 160 km northeast of New Caledonia, indicting that the spawning grounds for longfins is indeed in the tropics. All three eels swam too deep for the tags to record surface light, meaning we were unable to reconstruct swimming tracks, but we did obtain detailed information on swimming depths (Jellyman & Tsukamoto 2005). Surprisingly, all three eels showed regular daily vertical movements through the water column—2 of the 3 frequently swam to depths of 800 m or greater, with the greatest depth recorded being 980 m (Figure 3). As eels do not feed dur-ing their migration, we assume this regular diving behaviour is a means of avoiding predation from sharks, swordfish and toothed whales, which can all dive to similar depths. However, even in the tropics, water temperatures encountered by the eels at these depths were only 5–6oC, too low for efficient metabolism, so it seemed likely that eels then ascended during the evening to shallower waters to warm up.
Sooty shearwaters

New Zealand Science Review Vol 63 (3–4) 200768
Scientists from NIWA, the University of Otago, the University of California, and the New Zealand Department of Conservation collaborated to study the migration of sooty shearwaters (mut-ton birds) from their breeding grounds on Codfish Island (off Stewart Island) and Mana Island (off Wellington). During the period January to March 2005, geolocator tags weighing about 10 g were strapped to the birds’ legs. These are a new generation of small electronic archival tags which record diving depth and environmental temperature, as well as latitude and longitude. The information on latitude and longitude can be stored in the tag for up to 2 years, and was retrieved when the birds returned to their breeding colonies between October 2005 and February 2006 (Shaffer et al. 2006).
Before heading off on their migration, the birds foraged as
Figure 3. The maximum and minimum daily swimming depths (verti-cal lines), and minimum (o) and maximum water temperatures (●) recorded from a pop-up tag attached to a migratory longfin female eel. The tag ascended east of New Caledonia.
far south as 65°S, diving to depths of 70 m to catch food for their chick back on the breeding island. The birds began their epic journey in late April, heading first east, then northwest to reach wintering grounds in the North Pacific (off Japan or California; Figure 4) by late May. Some of the birds even vis-ited the coast of Chile before heading northwest. By October, they made their return journey, heading southwest to their New Zealand breeding grounds in a highly synchronised movement through a narrow corridor within a period of just 5 days. Each bird covered about 64 000 km in 200 days in completing this figure-of-eight migration across the Pacific, making it the long-est migration recorded to date.
ConclusionsAdvances in electronic tag technology over the past decade have been enormous—currently there is a large effort going into further miniaturisation of tags making it possible to study the movements of ever smaller migratory fish and birds. For example, new generation data storage tags are now available that weigh only 1 g in water, and have memory capable of storing a million readings (of water temperature and depth).
Advances in acoustic tags have led to proposals for an in-ternational array of listening stations to be deployed. Such tags include ones where unique acoustic signals are transmitted from moored sound sources and stored on an archival tag—retrieval of tags and triangulation of sound data would enable fish swimming tracks to be constructed. It is anticipated that such tags could be applied to fish as small as 50 cm, but detection ranges could exceed 100 km. Deployment of satellites in stationary orbits will be another significant development, as present pop-up tags rely upon a somewhat “hit-and-miss” system of orbiting satellites
Figure 2. Great white shark feeding on bait after tagging. The pop-up tag can be seen at the base of the dorsal fin. (Photo: H. Fener/WCS)

New Zealand Science Review Vol 63 (3–4) 2007 69
coming within range. No doubt the next decade will see new technology coupled with greater miniaturisation of electronic tags, with a resultant vast increase in our understanding of short- and long-term movements of fish and birds.
ReferencesBonfil, R.; Meyer, M.; Scholl, M.C.; Johnson, R.; O’Brien, S.;
Oosthuizen, H.; Swanson, S.; Kotze, D.; Paterson, M. 2005. Transoceanic migration, spatial dynamics, and population linkages of white sharks. Science 310: 100–103.
Boubée, J.A.T., Williams, E.K. 2006. Downstream passage of silver eels at a small hydroelectric facility. Fisheries Management and Ecology 13: 165–176.
Holdsworth, J.; Saul, P. 2006. New Zealand billfish and gamefish tagging, 2004–05. New Zealand Fisheries Assessment Report 2006/18. 28 p.
Hurst, R.J.; Bagley, N.W.; McGregor, G.A.; Francis, M.P. 1999. Movements of the New Zealand school shark, Galeorhinus galeus, from tag returns. New Zealand Journal of Marine and Freshwater Research 33: 29–48.
Jellyman, D.J.; Tsukamoto, K. 2005. Swimming depths of offshore migrating longfin eels, Anguilla dieffenbachii. Marine Ecology Progress Series 286: 261–267.
Joseph, J.; Klawe, W.; Murphy, P. 1988. Tuna and billfish – fish without a country. Inter-American Tropical Tuna Commission. 69 p.
Shaffer, S.A.; Tremblay, Y.; Weimerskirch, H.; Scott, D.; Thompson, D.R.; Sagar, P.M. Moller, H.; Taylor, G.A.; Foley, D.G.; Block, B.A.; Costa, D.P. 2006. Migratory shearwaters integrate oceanic resources across the Pacific Ocean in an endless summer. Proceeding of the National Academy of Sciences USA. 103: 12799–12802.
Figure 4. Migrations of sooty shearwaters fitted with geolocation loggers during the breeding season in New Zealand. Different-coloured dots indicate birds tagged from different colonies (Snares, Codfish, and Mana Islands). The concentration of locations off the Ross Sea, Antarctica, indicates where the birds were obtaining food to take back to New Zealand to feed their chick. After breeding, the birds migrated to the Northern Hemisphere and concentrated their feeding either off Japan or the western USA.

New Zealand Science Review Vol 63 (3–4) 200770
Understanding the biology and ecology of deep-sea fishes such as orange roughy presents serious scientific challenges. This paper illustrates some of the techniques used and some of the questions being addressed, and considers what the future may hold for orange roughy fisheries. The orange roughy fishery on the northeast Chatham Rise of New Zealand has been the largest and most persistent in the world. The observational data used in the stock assessment are described, including commercial catch-per-unit-effort, scientific trawl surveys, and combined acoustic and trawl surveys. The results of the 2006 stock as-sessment indicated that the northeast Chatham Rise stock had been rebuilding since catches were substantially reduced in the early 1990s, but this appeared to be largely driven by model as-sumptions about stock productivity, rather than actual data. Stock productivity is determined by natural mortality rate and recruit-ment, about which there is little information, and therefore the current stock assessments are considered very uncertain, and may be misleading. Although the New Zealand orange roughy fisheries have been going for nearly 30 years, their future now looks especially uncertain.
Deep-sea fisheries scienceThe primary role of fisheries science is to inform fishery man-agers about the sustainability of commercially exploited fish populations (known as ‘stocks’). This requires understanding the species’ biology, ecology, and fisheries. Understanding the biology and ecology of deep-sea fishes such as orange roughy presents serious challenges, because many techniques that would be used to study shallow-water fishes cannot be applied. Deepwater fishes cannot easily be observed in their natural environment, nor captured alive and studied in the laboratory, and working offshore in the deep sea requires large, expensive, research vessels. Consequently it should come as no surprise to find that our current knowledge of deep-sea fishes lags behind that of many inshore, easily studied species. For example, the movements of inshore flatfish in the Irish Sea have been studied using tags since 1908 (Dunn & Pawson 2002), but the technology to successfully tag deep-sea fishes, which has to be done at depth because they cannot survive being brought to the surface, has only just become available (Sigurdsson et al. 2006). The New Zealand deep-sea fisheries are the best studied in the world, and in this paper I will use the recent assessment of the orange roughy stock on the northeast Chatham Rise (recently also referred to as the ‘east Chatham Rise’) to illustrate some of
the techniques that are used and some of the science questions that are being addressed, and also to consider what the future might hold for the orange roughy fisheries.
Orange roughy fisheriesFishing for deep-sea fishes is a relatively new occurrence. The New Zealand fishery for orange roughy (Hoplostethus atlanticus) was the first to develop in 1979, and was the only substantial orange roughy fishery for several years. Other fish-eries have developed off Australia in the late 1980s (Kailola et al. 1993), in the north Atlantic in 1989 (International Council for Exploitation of the Sea, ICES 2006), off southwest Africa in 1995 (Branch 2001), off Chile in 1998 (Payá et al. 2006), and in the Indian Ocean in 1999 (Francis & Clark 2005). All fish-ing for orange roughy has used bottom trawls. Orange roughy occur at depths of 700–1500 m, and are believed to be found worldwide, with the most recent new reports in the southwest Atlantic (Laptikhovsky 2006; Wöhler & Scarlato 2006).
The New Zealand commercial fisheries started on the north-east Chatham Rise, off the east coast of the South Island (Figure 1). During the 1980s other fisheries started off Wairarapa, on the Challenger Plateau, other areas of the Chatham Rise, and on the Ritchie Bank. Fisheries have now developed all around New Zealand, and although some were subsequently closed or have now largely disappeared, the original fishery on the northeast Chatham Rise continues. It has been the largest and most persistent orange roughy fishery in New Zealand and the world (Francis & Clark 2005; Anderson & Dunn 2007).
Biology of orange roughyPerhaps the most surprising aspect of the biology of orange roughy, and many other deep-sea animals, is their extreme longevity. Orange roughy have been confirmed to live to over 100 years, with some individuals aged at over 150 years (Tracey & Horn 1999; Dunn 2006). They grow very slowly, reaching maturity at a length of around 30 cm and about 30 years of age. Females grow larger than males, reaching up to around 50 cm in length. In order to achieve such high ages, the rate of natural mortality (e.g. from predation) must be, and has been estimated to be, exceptionally low (Doonan 1994). Orange roughy produce a relatively small number of eggs (Clark et al. 1994). They form
Orange roughy. What might the future hold?Matthew Dunn
NationalInstituteofWaterandAtmosphericResearch,PrivateBag14-901,Wellington.
Matt Dunn is a fisheries scientist at the NationalInstituteofWaterandAtmosphericResearch(NIWA),studying the biology, ecology and fisheries of deepwater fishes. Matt studied at the University of Wales forhisBScandMScinmarinebiology,beforeattendingtheUniversityofPortsmouth,UK,wherehegained his PhD in fisheries in 1999. He subsequently worked in fisheries economics at the University of Portsmouth, and then on fish stock assessments at the Centre for Environment, Fisheries and Aquaculture Science (CEFAS), UK. He has been at NIWA since 2003, where he has focused on [email protected]

New Zealand Science Review Vol 63 (3–4) 2007 71
Figure 1. The New Zealand region, show-ing the distribution of the main orange roughy fishing grounds (grey areas), Quota Management Areas (italicised) and boundaries (solid lines) for orange roughy. The northeast Chatham Rise is in Quota Management Area ORH3B, and includes the Spawning Box and eastern end of the Chatham Rise. Catch limits are set for each Quota Management Area separately, although some, including the Chatham Rise, are further subdivided by agreement with the fishing industry.
large aggregations (“plumes”) for spawning during winter, and also occasionally when feeding, and are often associated with seamounts or other underwater topographical features (Figure 2). The biology of orange roughy makes them very unproduc-tive, and their aggregation behaviour makes them particularly vulnerable to fishing (Clark 2001).
Assessment of the northeast Chatham Rise stockThe process of evaluating the status of a stock, including esti-mating sustainable catches, is known as stock assessment. The most recent stock assessment for the northeast Chatham Rise was completed in 2006 (Ministry of Fisheries, Science Group 2006; Dunn 2007). This stock forms huge and predictable spawning plumes on flat areas of seabed on the north Rise, and smaller spawning and also feeding aggregations on seamount complexes on the east Rise. The commercial catch averaged over 20 000 t/year through the 1980s, and then declined to about 4000 t in the mid-1990s following a series of catch limit (Total Allowable Commercial Catch) reductions. The area of flat sea bed where the plumes form (the ‘Spawning Box’) was closed to fishing in 1992, after declining catch rates and an apparent reduction in the spawning plumes caused concern about pos-sible over-fishing. The Spawning Box was re-opened a couple of years later, and in recent years about 7000 t/year has been caught from the northeast Rise.
As an aside, a rapid decline in catch rates or fish abundance at the start of a fishery is sometimes cited as an alarming indica-tor of over-fishing. However, this decline is often intentional, and associated with removing the old, slow-growing fish so that the stock is dominated by younger, fast-growing fish, but at the same time keeping the stock size large enough that it remains sustainable. This is referred to as fishing down in order
to achieve maximum sustainable yield. Getting to this point rapidly, by initially taking relatively large catches and caus-ing abundance to decline rapidly, is therefore not necessarily indicative of over-fishing.
There are more data available for the assessment of the northeast Chatham Rise stock than for any other orange roughy stock in the world. The 2006 assessment used five catch rate indices derived from commercial fishery data (these are com-monly referred to as ‘catch-per-unit-effort’ or ‘CPUE’ indices), relative stock biomass estimates from 9 scientific trawl surveys and 8 acoustic surveys, and information from several years describing the age and length structure of the stock (Dunn 2006, 2007). These observational data were combined using a mathematical model of the stock. The model creates a virtual population, complete with processes such as growth, maturity and fishing mortality, and modifies the model parameters until predicted observations from the model are as close to the real observations as possible (Figure 3). This fitted model provides estimates of how big the stock was and currently is, and can be used to predict the effect of different future catch levels and calculate the maximum sustainable yield. Of course, if the specified model is wrong, for example if the assumed stock boundary or growth rate were wrong, then the best fit of the model might not fit the observational data well at all, and pre-dictions made using the model might not only be wrong, but substantially misleading.
CPUE dataCommercial CPUE are used as an index of the size of the stock, and have been a focus of research in recent years. On the northeast Chatham Rise, the CPUE from the seamount fisheries have been found to decline much faster at the start of the fishery than can possibly be accounted for by the catches. It has been
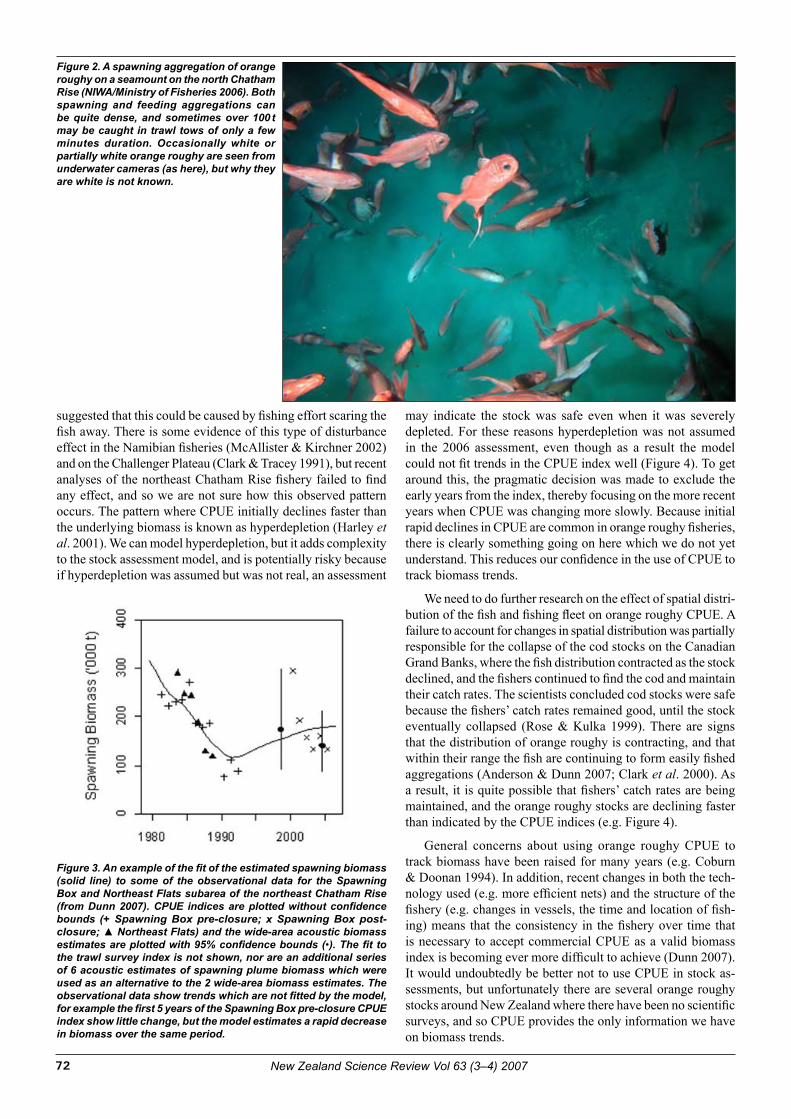
New Zealand Science Review Vol 63 (3–4) 200772
suggested that this could be caused by fishing effort scaring the fish away. There is some evidence of this type of disturbance effect in the Namibian fisheries (McAllister & Kirchner 2002) and on the Challenger Plateau (Clark & Tracey 1991), but recent analyses of the northeast Chatham Rise fishery failed to find any effect, and so we are not sure how this observed pattern occurs. The pattern where CPUE initially declines faster than the underlying biomass is known as hyperdepletion (Harley et al. 2001). We can model hyperdepletion, but it adds complexity to the stock assessment model, and is potentially risky because if hyperdepletion was assumed but was not real, an assessment
may indicate the stock was safe even when it was severely depleted. For these reasons hyperdepletion was not assumed in the 2006 assessment, even though as a result the model could not fit trends in the CPUE index well (Figure 4). To get around this, the pragmatic decision was made to exclude the early years from the index, thereby focusing on the more recent years when CPUE was changing more slowly. Because initial rapid declines in CPUE are common in orange roughy fisheries, there is clearly something going on here which we do not yet understand. This reduces our confidence in the use of CPUE to track biomass trends.
We need to do further research on the effect of spatial distri-bution of the fish and fishing fleet on orange roughy CPUE. A failure to account for changes in spatial distribution was partially responsible for the collapse of the cod stocks on the Canadian Grand Banks, where the fish distribution contracted as the stock declined, and the fishers continued to find the cod and maintain their catch rates. The scientists concluded cod stocks were safe because the fishers’ catch rates remained good, until the stock eventually collapsed (Rose & Kulka 1999). There are signs that the distribution of orange roughy is contracting, and that within their range the fish are continuing to form easily fished aggregations (Anderson & Dunn 2007; Clark et al. 2000). As a result, it is quite possible that fishers’ catch rates are being maintained, and the orange roughy stocks are declining faster than indicated by the CPUE indices (e.g. Figure 4).
General concerns about using orange roughy CPUE to track biomass have been raised for many years (e.g. Coburn & Doonan 1994). In addition, recent changes in both the tech-nology used (e.g. more efficient nets) and the structure of the fishery (e.g. changes in vessels, the time and location of fish-ing) means that the consistency in the fishery over time that is necessary to accept commercial CPUE as a valid biomass index is becoming ever more difficult to achieve (Dunn 2007). It would undoubtedly be better not to use CPUE in stock as-sessments, but unfortunately there are several orange roughy stocks around New Zealand where there have been no scientific surveys, and so CPUE provides the only information we have on biomass trends.
Figure 2. A spawning aggregation of orange roughy on a seamount on the north Chatham Rise (NIWA/Ministry of Fisheries 2006). Both spawning and feeding aggregations can be quite dense, and sometimes over 100 t may be caught in trawl tows of only a few minutes duration. Occasionally white or partially white orange roughy are seen from underwater cameras (as here), but why they are white is not known.
Figure 3. An example of the fit of the estimated spawning biomass (solid line) to some of the observational data for the Spawning Box and Northeast Flats subarea of the northeast Chatham Rise (from Dunn 2007). CPUE indices are plotted without confidence bounds (+ Spawning Box pre-closure; x Spawning Box post-closure; ▲ Northeast Flats) and the wide-area acoustic biomass estimates are plotted with 95% confidence bounds (•). The fit to the trawl survey index is not shown, nor are an additional series of 6 acoustic estimates of spawning plume biomass which were used as an alternative to the 2 wide-area biomass estimates. The observational data show trends which are not fitted by the model, for example the first 5 years of the Spawning Box pre-closure CPUE index show little change, but the model estimates a rapid decrease in biomass over the same period.

New Zealand Science Review Vol 63 (3–4) 2007 73
Trawl surveys of the Spawning BoxEstimates of biomass from trawl surveys are also used as an index of the size of the stock, and are better than commercial CPUE because they are consistent from year to year, and de-liberately cover a wider area. The scientific trawl surveys on the northeast Chatham Rise ran between 1984 and 1994, and were designed to monitor changes in the relative abundance of spawning orange roughy. The results showed a steady de-cline in biomass through the 1980s, combined with a spatial contraction of the spawning plume (Clark et al. 2000). The survey was abandoned after 1994, largely because the 1994 estimate had such high uncertainty (variance) that it was of lit-tle use in tracking biomass change. A survey in 1995 could not resolve this problem. The high variance was a result of most survey catches being small (i.e. dispersed fish), but punctuated with occasional very large catches (i.e. aggregated fish). It is believed that this effect only became pronounced in the early 1990s because before then the fishing activity had broken up the main spawning plume into a number of smaller plumes that were encountered more often.
Combined trawl and acoustic surveysThe current stock monitoring method of choice is to use com-bined trawl and acoustic surveys (Doonan et al. 2007). Acous-tics are better than trawls for surveying the plumes of orange roughy, but are less effective for measuring dispersed fish in the background areas. In the combined survey, acoustics are used to survey the plumes, and the background areas are surveyed using both acoustic and trawl methods.
New Zealand has led the way in the application of acoustic methods to estimate the abundance of deepwater fish. The acoustic method measures the amount of sound reflected back from a ship-mounted or towed echosounder, and after removing the echo caused by the seabed, converts the remaining echoes, or acoustic “back-scatter”, into fish biomass. It has the potential of being able to give an absolute estimate of biomass, rather than only tracking trends in biomass as in the trawl survey or CPUE indices, it is non-destructive, and can survey large areas relatively quickly. The method relies on knowing what
proportion of the acoustic back-scatter comes from fish, and of this, what amount comes from each species. In the case of spawning plumes this allocation is relatively easy, as they are composed almost entirely of one species. However, outside of spawning plumes there may be a considerable mix of species (the 2004 survey of the northeast Chatham Rise counted about 140), and so the allocation of backscatter to species is less easy to determine. It is achieved by using the species mix estimated from catches in the trawl survey. The trawl survey is also used to provide a second, alternative, relative biomass index for the background area.
Orange roughy is not an ideal species for surveying using acoustics. The majority of bony fish maintain neutral buoyancy by using air-filled swim bladders, but in orange roughy the swim bladder is filled with oil. An oil-filled bladder produces much less acoustic back-scatter than an air-filled bladder, and so when orange roughy are surrounded by fish with air-filled bladders, the back-scatter they produce is easily masked. In addition, when fish are close to the seabed their back-scatter is masked by the echo from the seabed itself, and orange roughy are thought to have a close affinity with the seabed. Despite these problems, acoustic methods doubtless provide good results when used prudently, and improvements in technology are constantly being made which may further improve our ability to use this technique for orange roughy (e.g. Kloser et al. 2002).
Assessment model resultsDuring the northeast Chatham Rise stock assessment a number of alternative model runs were completed, covering a range of different model hypotheses, and including or excluding different sets of observational data. All of the model runs predicted that the stock biomass had been rebuilding since the catches were substantially reduced in the early 1990s. However, the most concerning aspect of the 2006 assessment was that this rebuild was insensitive to the recent observational data: when all of the data after 1994 were excluded, i.e. all of the acoustic surveys and one CPUE index, the model gave an almost identical result to when they were included (Figure 5). From this result, it be-came clear that the rebuild was largely being driven by model assumptions about stock productivity, rather than actual data. In other words, the stock could have doubled in size since 1993, or alternatively increased by only a few percent, but the data could not tell us which was true: the result we got depended on our productivity assumptions.
Stock productivityStock productivity is determined by natural mortality rate and recruitment. The term recruitment here refers to the arrival of young fish into the fishery, which is also assumed to be when they mature. We know something about natural mortality rates from studying lightly-fished populations (Doonan 1994), but little about recruitment, or the relationship between recruitment and the spawning stock.
Determining the spatial boundaries of the stock helps us understand the relationship between recruitment and the spawn-ing stock, and is of key importance in stock assessment. No experiments tracking individual fish distribution and movement have been carried out for orange roughy, so the information we do have on stock boundaries is all inferred, for example from genetic studies, or using differences in the size and shape of
Figure 4. The fit of the estimated spawning biomass (solid line) to the CPUE index (x with 95% confidence intervals shown) for the Andes subarea of the northeast Chatham Rise. Why the CPUE drops so rapidly over the first four years, but then declines only slowly, is not known.

New Zealand Science Review Vol 63 (3–4) 200774
fish from different areas (e.g. Smith et al. 2002). Results from these studies have been equivocal, and it is therefore quite possible that the assumed stock structure is incorrect. For the northeast Chatham Rise there is some evidence of fine-scale structure in the stock (Dunn 2006), which is one reason why the most recent assessment actually split the area into three separate substocks.
Juvenile, or pre-recruit, orange roughy have never been found in large densities, and it has been suggested that the absence of juveniles “is a worldwide characteristic of orange roughy fisheries” (Payá et al. 2006). This absence might be at-tributed to the juveniles being in areas poorly sampled to-date, such as in mid-water, or at abyssal depths. However, it has also been suggested that high longevity can be associated with highly episodic recruitment, in other words a population of a long-lived species would be quite capable of persisting despite long-term reproductive failure (Longhurst 2002). Therefore the apparent absence of juvenile orange roughy might simply be the conse-quence of extended reproductive failure. The stock assessment model runs chosen to advise fisheries management for orange roughy do not include this possibility, and usually assume that recruitment has been constant, simply because of lack of infor-mation to the contrary (Bull et al. 2001; Ministry of Fisheries, Science Group 2006). Note that poor recruitment, if it occurs, would not be a consequence of the fishery reducing spawning success, because the fish which just recruited in 2006 would have been spawned in about 1976, before the fishery started. Understanding stock structure, natural mortality, and especially recruitment, should be a high priority for future research.
What might the future hold?Hilborn et al. (2006) recently concluded that ‘the management of the New Zealand orange roughy stocks has been close to economically optimal and produced near maximum sustainable yield from the resource’. However, their analysis assumed that the results from the stock assessment models were correct, and they also averaged model runs rather than considering the often quite different implications of the different model runs. The truth is that the current stock assessments for orange roughy are very uncertain. One thing noticeable about the recent northeast Chatham Rise stock assessment is that the model does not fit any of the observational data well (Dunn 2007), and given this, the assessment of stock status is likely to be incorrect, and may well be misleading.
The title of this paper was deliberately chosen to be the same as that used by Malcolm Clark in 1993 (Clark 1993), because despite many advances, most of the challenges and uncertainties that Clark described in 1993 still remained in 2001 (Clark 2001), and still remain today. Understanding and managing orange roughy fisheries has been a steep learning curve. There are still challenges caused by over-fishing (the northeast Chatham Rise is actually the only large stock in the world believed to be in good shape), uncertain scientific stock assessment advice, fishery management systems, and a growing international con-cern about the impact trawling has on the deep-sea ecosystem (e.g. Clark et al. 2006). Indeed, the Australian fisheries were effectively closed in December 2006 after orange roughy was nationally designated as a threatened species (see Anon 2006). The New Zealand orange roughy fisheries have been going for nearly 30 years, but because of all of these current challenges, I believe that the future viability of large-scale orange roughy fisheries may be decided within the next decade.
ReferencesAnon 2006. Threatened species and ecological communities.
Australian Government Department of the Environment and Water Resources. http://www.deh.gov.au/biodiversity/threatened/index.html
Anderson, O.; Dunn, M.R. (2007). Descriptive analysis of catch and effort data from New Zealand orange roughy fisheries in ORH 1, 2A, 2B, 3A, 3B and 7B to the end of the 2004-05 fishing year. New Zealand Fisheries Assessment Report (in press). 72 p.
Branch, T.A. 2001. A review of orange roughy Hoplostethus atlanticus fisheries, estimation methods, biology and stock structure. In: Payne, A.I.L.; Pillar, S.C.; Crawford, R.J.M. (Eds) A decade of Namibian fisheries science. South African Journal of Marine Science 23: 181–203.
Bull, B.; Francis, R.I.C.C.; Tracey, D.M. 2001. Estimation of orange roughy recruitment using age- and length-based methods. New Zealand Fisheries Assessment Report 2001/4. 26 p.
Clark, M. 1993. Orange roughy. What might the future hold? New Zealand Professional Fisherman 7(2): 49–54.
Clark, M.R. 2001. Are deepwater fisheries sustainable? The example of orange roughy. Fisheries Research 51: 123–135.
Clark, M.R.; Tracey, D.M. 1991. Trawl survey of orange roughy on the Challenger Plateau July 1990. New Zealand Fisheries Technical Report 26. 20 p.
Clark, M.R.; Fincham, D.J.; Tracey D.M. 1994. Fecundity of orange roughy (Hoplostethus atlanticus) in New Zealand waters. New Zealand Journal of Marine and Freshwater Research 28: 193–200.
Figure 5. The spawning biomass trajectories estimated for the Spawning Box and Northeast Flats sub-area model runs with (solid line) or without (dotted line) the recent (after 1994) observational data. The stock assessment model was allowed to scale-up the recent acoustic survey biomass estimates (within limits) to fit the estimated biomass trend (these scaled-up estimates are indicated as •), but the actual biomass estimates (e.g. Doonan et al. 2007) were substantially lower (indicated as o). The scaled-up estimates were actually two and a half times the survey estimates. This implies that the surveys measured only 40% of the mature orange roughy, which seems unlikely. This raises further concerns about the validity of the model, and the scale of the predicted rebuild.

New Zealand Science Review Vol 63 (3–4) 2007 75
Clark, M.R.; Anderson, O.F.; Francis, R.I.C.; Tracey, D.M. 2000. The effects of commercial exploitation on orange roughy (Hoplostethus atlanticus) from the continental slope of the Chatham Rise, New Zealand, from 1979 to 1997. Fisheries Research 45: 217–238.
Clark, M.R.; Tittensor, D.; Rogers, A.D.; Brewin, P.; Schlacher, T.; Rowden, A.; Stocks, K.; Consalvey, M. 2006. Seamounts, deep-sea corals and fisheries: vulnerability of deep-sea corals to fishing on seamounts beyond areas of national jurisdiction. UNEP-WCMC, Cambridge, UK.
Coburn, R.P.; Doonan, I.J. 1994. Orange roughy on the northeast Chatham Rise: a description of the commercial fishery, 1979–88. New Zealand Fisheries Technical Report 38, 49 p.
Doonan, I.J. 1994. Life history parameters of orange roughy: estimate for 1994. New Zealand Fisheries Assessment Research Document 1994/19 13 p.
Doonan, I.J.; Dunn, M.R.; Dunford, A.: Hart, A.C.; Tracey. D. 2007. Acoustic estimates of orange roughy abundance in the Northeastern and Eastern Chatham Rise, July 2004: wide-area survey and hill survey. New Zealand Fisheries Assessment Report (in press) 44 p.
Dunn, M.R. 2006. CPUE analysis and assessment of the Northeast Chatham Rise orange roughy stock (part of ORH3B) to the end of the 2003-04 fishing year. New Zealand Fisheries Assessment Report 2006/59 67 p.
Dunn, M.R. 2007. CPUE analysis and assessment of the East Chatham Rise orange roughy stock (part of ORH 3B) to the end of the 2004–05 fishing year. New Zealand Fisheries Assessment Report 2007/8 75 p.
Dunn, M.R.; Pawson, M.G. 2002. The stock structure and migrations of plaice populations on the west coast of England and Wales. Journal of Fish Biology 61: 360–393.
Francis, R.I.C.C.; Clark, M.R. 2005. Sustainability issues for orange roughy fisheries. Bulletin of Marine Science 76(2): 337–351.
Harley, S.J.; Myers, R.A.; Dunn, A. 2001. Is catch-per-unit-effort proportional to abundance? Canadian Journal of Fisheries and Aquatic Sciences 58: 1760–1772.
Hilborn, R.; Annala, J.; Holland, D.S. 2006. The cost of overfishing and management strategies for new fisheries on slow-growing fish: orange roughy (Hoplostethus atlanticus) in New Zealand. Canadian Journal of Fisheries and Aquatic Sciences 63: 1–5.
ICES 2006. Orange roughy (Hoplostethus atlanticus) in all areas. Available from http://www.ices.dk/advice/icesadvice.asp
Kailola, P.J.; Williams, M.J.; Stewart, P.C.; Reichelt, R.E.; McNee, A.; Grieve, C. 1993. Australian fisheries resources. Bureau of Resource Sciences and the Fisheries Research Development Corporation, Australia.
Kloser, R.J.; Ryan, T.; Sakov, P.; Williams, A.; Koslow, J.A. 2002. Species identification in deep water using multiple acoustic frequencies. Canadian Journal of Fisheries and Aquatic Sciences 59: 1065–1077
Laptikhovsky, L. 2006. The first record of orange roughy (Hoplostethus atlanticus) in the southwest Atlantic. JMBA2 Biodiversity Records, Published on-line.
Longhurst, A. 2002. Murphy’s law revisited: longevity as a factor in recruitment to fish populations. Fisheries Research 56: 125–131.
McAllister, M.K.; Kirchner, C.H. 2002. Accounting for structural uncertainty to facilitate precautionary fishery management: illustration with Namibian orange roughy. In: Mangel, M.(Ed.) Targets, Thresholds, and the Burden of Proof in Fisheries Management. Bulletin of Marine Science 70(2): 499–540.
Ministry of Fisheries, Science Group (Comps). 2006. Report from the Fishery Assessment Plenary, May 2006: stock assessments and yield estimates. 875 p. (Unpublished report held in NIWA library, Wellington.)
Payá, I.; Montecinos, M.; Ojeda, V.; Cid, L. 2006. An overview of the orange roughy (Hoplostethus sp.) fishery off Chile. In: Shotton, R. (Ed.) Deep Sea 2003: Conference on the Governance and Management of Deep-sea fisheries. Part 2: Conference poster papers and workshop papers. Queenstown. New Zealand, 1–5 December 2003 and Dunedin, New Zealand 27–29 November 2003. FAO Fisheries Proceedings No. 3/2. Rome, FAO. 487 p.
Rose, G.A.; Kulka, D.W. 1999. Hyperaggregation of fish and fisheries: how catch-per-unit-effort increased as the northern cod (Gadus morhua) declined. Canadian Journal of Fisheries and Aquatic Sciences 56 (suppl. 1): 118–127.
Sigurdsson, T.; Thorsteinsson, V.; Gústafsson, L. 2006. In situ tagging of deep-sea redfish: application of an underwater, fish-tagging system. ICES Journal of Marine Science 63: 523–531.
Smith, P.J.; Robertson, S.G.; Horn, P.L.; Bull, B.; Anderson, O.F.; Stanton, B.R.; Oke, C.S. 2002. Multiple techniques for determining stock relationships between orange roughy, Hoplostethus atlanticus, fisheries in the eastern Tasman Sea. Fisheries Research 58: 119–140.
Tracey, D.M.; Horn, P.L. 1999. Background and review of ageing orange roughy (Hoplostethus atlanticus, Trachichthyidae) from New Zealand and elsewhere. New Zealand Journal of Marine and Freshwater Research 33: 67–86.
Wöhler, O.C.; Scarlato, N. 2006. Occurrence of orange roughy, Hoplostethus atlanticus (Trachichthyidae) off Argentina. Cybium 30(3): 285–286.

New Zealand Science Review Vol 63 (3–4) 200776
Hoki (Macruronus novaezelandiae) is one of New Zealand’s largest fish stocks. Hoki migrate to spawn in winter off the west coast of South Island and in past years supported a large fishery there. An extended period of low recruitment from 1995 to 200 t combined with continued annual catches of around 200 000 t or more within the same period resulted in the western stock hoki biomass decreasing to unacceptably low levels (about 20% of the virgin biomass). Much of the period of low recruitment coincided with a warming of the Tasman Sea. Research off Westland in the 1980s was revisited to develop a more comprehensive hypoth-esis of a mechanism through which the ocean environment may be influencing hoki larval survival. Nitrate concentrations affect
the abundance of planktonic food in surface waters off West-land in winter where hoki larvae hatch after spawning. Physical oceanographic processes that occur locally, such as deep-water mixing over the hoki spawning grounds, or on a larger scale, such as the recent Tasman Sea warming, influence the quantity of nitrate available. Because of the close link between oceanic processes and the food supply of hoki, we hypothesise that one of the main factors affecting fish abundance in the western stock is the availability of dissolved inorganic nutrients off Westland during the hatching phase of hoki larvae. Scientists and fisheries managers are continuously under pressure to explain and predict fluctuations in fish abundance. Without understanding some of the underlying processes and the range of natural fluctuations we can expect under different environmental conditions it is difficult to ensure sustainability in a declining resource.
Ocean variability and declining hoki stocks: an hypothesis as yet untested*
Janet Bradford-Grieve1, Mary Livingston2, Philip Sutton1, Mark Hadfield1
1NationalInstituteofWaterandAtmosphericResearch,POBox14-901,Wellington2MinistryofFisheries,POBox1020,Wellington
Mark HadfieldisascientistwiththeMarinePhysicsgroupatNIWAWellington.Hetrainedinatmos-phericscience,concentratingondispersionandmixingnearthesurface,butthesedaysheworksonmodellingtheocean,withanemphasisondispersionandmixingnearthesurface.
Dr Janet Grieve isretiredbutremainsactiveattheNationalInstituteofWaterandAtmosphericRe-search(NIWA)asanemeritusresearcher.SheobtainedaPhDfromtheUniversityofCanterburyinbiologicaloceanographyfromazoologicaltrainingandhasspecialistresearchinterestsincopepodtaxonomyandtheinteractionofthephysicalandbiologicalenvironments.SheisaFellowoftheRoyalSocietyofNewZealand.Shemaybecontactatj.grieve@niwa.co.nz
Mary Livingston is a Principal Scientist in the Aquatic Environment and Biodiversity Science Group attheMinistryofFisheries,Wellington.ShecompletedherhonoursandmastersdegreesintheUK,andaPhDatVictoriaUniversityin1981.Priorto2005,shewasascientistatNIWA(andformerlyMAFFisheries)wheremostofherresearchfocusedonthepopulationbiologyofhokiandothermiddle-depth fish. Her position at MFish concerns managing research projects on biodiversity and the effects of fishing on the environment. She maintains an ongoing interest in the assessment of hokistocksandthedriversofhokiabundance.
Phil SuttonisaphysicaloceanographeratNIWA,studyingthephysicsoftheocean,rangingfromsmall-scalemixing,wavesandtidestooceancirculationandclimatechange.PhilstudiedattheUniversityofAucklandforhisBScandMScinphysicsbeforeattendingScrippsInstitutionofOceanographyinSanDiegowherehegainedhisPhDinPhysicalOceanography.HehasbeenwithNIWAsince1993wherehehasfocusedonlarge-scaleoceanvariability,i.e.thenatureof,reasonsfor,andimpactsofchangesintheocean.
* This article is an updated and extended version that was first published in Water&Atmosphere12(4) 2004.

New Zealand Science Review Vol 63 (3–4) 2007 77
IntroductionHoki inhabit mid-latitude waters around New Zealand. It is an Australasian species with close relatives in South American and South African waters. Hoki live at continental slope depths around the New Zealand Plateau and form one of New Zealand’s largest fish stocks (Ministry of Fisheries, Science Group 2006). Fish 3 years or older live near the seabed in depths of 300–800 m, while younger fish usually occur at shallower depths (Francis et al. 2002). When they are not spawning, adult fish are mostly found on the Southern Plateau in subantarctic waters or on the Chatham Rise under the Subtropical Front (Hurst et al. 2000). Hoki aggregate to spawn in winter, either off the west coast of South Island or in eastern Cook Strait, with smaller spawning areas in other locations (Dunn & Livingston 2004). Historically, it is these spawning aggregations that formed most of the annual catch. Commercial fishing vessels track spawning migrations of adult fish from the Southern Plateau to the west coast of South Island during April–May each year. Growth and morphometric differences between Southern Plateau and Chatham Rise ma-ture-size hoki (Livingston & Schofield 1996; Horn & Sullivan 1996) indicate that there are at least two different adult popu-lations that are treated separately for annual stock assessment purposes—western and eastern stocks. Most hoki become sexu-ally mature from 4 to 6 years old, can live to a maximum of 25 years old and grow up to 1.2 m in length (Ministry of Fisheries, Science Group 2006). Not all fish within the adult size range spawn in any given year (Livingston et al. 1997).
Declining hoki stocksSince 2001, fisheries managers and fishers have become increas-ingly worried about the ongoing status of the western stock of hoki, which has been estimated at around 20% of the virgin biomass for the past 2–3 years (Ministry of Fisheries,Science Group 2006). The aspect of greatest concern is the extended period of poor recruitment in the western stock since 1995 (Figure 1), as new recruitment is the only means by which the
stock can rebuild. Although there have been some indications of improved juvenile abundance since 2000, adult stocks, particu-larly the western stock, are showing little sign of recovery. The decline led to cuts in the Total Allowable Catch from 250 000 t to 200 000 t in 2001/02; then down to 180 000 t in 2003/04 and further again to 100 000 t since 2004/05.
The Hokitika Canyon seems to be a prime location for spawning activity by western stock hoki off Westland, with the largest and most fecund fish aggregating densely to spawn in the canyon (Langley 1993). Western stock females carry 0.4–4 million eggs each (Schofield & Livingston 1998) that are released into the water column. The fertilised eggs (about 1 mm diameter) are positively buoyant and float up towards the surface (Figure 2) and take about 3 days to hatch into yolk-sac larvae (Patchell et al. 1987). After 5 days the yolk sac is almost completely absorbed and the mouth and intestinal tract opened. These small, 4 mm-long fish, are then capable of feeding in-dependently (Murdoch 1992; Murdoch & Quigley 1994). The preferred food of these tiny fish is a small planktonic copepod, Calocalanus (Figure 3) (Murdoch 1990). Calocalanus is an oceanic species that thrives on the hoki spawning grounds off Westland under specific conditions in winter (Bradford-Grieve et al. 1996). It follows that in years of high Calocalanus con-centrations, the survival of hoki larvae (and therefore year class abundance) might be greater.
Figure 1. Biomass of the western hoki stock (left panel) and year class strength index (right panel) (from Fishery Assessment Ple-nary Report, May 2004, p. 270, updated to the most recent one from 2006). The horizontal line represents average YCS.
Figure 2. Key stages in the develop-ment of hoki larvae (from Patchell et al. 1987).
Figure 3. The favoured food of hoki larvae: the copepod Calocalanus (Murdoch 1990).
In this paper we explore aspects of the environment that promote survival of the first feeding larvae whilst acknowl-edging that a range of other factors (e.g. offshore transport and predation on juveniles) may influence the year class strength* (YCS) of a cohort as it recruits into the fishery.
* “Year class strength” refers to the proportions of animals of specific ages that make up a population.

New Zealand Science Review Vol 63 (3–4) 200778
Hoki food supplySo what are the conditions that favour growth of Calocalanus populations off Westland? Studies exploring correlations be-tween environmental conditions and model estimates of hoki YCS 1980–1996 led to hypotheses that periods of cool westerly winds may promote optimal survival conditions for hoki larvae, including an abundant food supply, early onset of mixing in winter and transportation inshore (Livingston 2000; Bull & Livingston 2001). In more recent years, scientists noticed that the extended period of low recruitment in hoki coincided with a warming of the Tasman Sea (Sutton et al. 2005). Therefore, we revisited work done off Westland in the 1980s to integrate it with more recent information and develop a more compre-hensive hypothesis of how environmental variability influences hoki larval survival.
In order to grow, phytoplankton depends on rapid recycling of nutrients from dead organic matter to inorganic form (e.g. ammonia, nitrate, etc.). During summer, the surface waters of the Tasman Sea off Westland become depleted in these nutrients (Bradford & Chang 1987). When surface waters cool and sink in autumn and winter, mixing occurs to greater depths, bringing unused recycled nutrients from the deeper layers up into surface waters (Chang & Bradford 1985). The deeper the water mixes the more nutrients are brought into the sunlit surface layers. On the other hand, the deeper the water mixes below the decreas-ing level of light penetration as winter approaches, the more phytoplankton growth is inhibited. Thus, depending on the timing and rate of progression of deep mixing, phytoplankton production can be either enhanced or inhibited.
Under optimum conditions of higher nutrients early in autumn combined with an adequately lit mixed layer, phyto-plankton production increases in autumn early enough to allow tiny animal grazers to increase their growth rates. Small plank-tonic organisms such as Calocalanus then graze this increased supply of phytoplankton, dramatically increasing their total population sizes.
Analyses of the variability in the density of preferred larval hoki food off Westland in winter (Bradford-Grieve et al. 1996) indicated that starvation might be a very real issue for the larvae. At locations over the continental slope where mixed layers were deeper than 75 m and nitrate nitrogen concentrations were higher than 3 µM, copepod nauplii, and Calocalanus spp. were in con-centrations of 10 000–16 000/m3 and 288–577/m3, respectively. Whereas at slope stations with mixed layers shallower than 85 m and nitrate nitrogen less than 2 µM, copepod nauplii, and Calocalanus spp. were in much lower concentrations (3000–6000/m3 and 53–86/m3 respectively). Therefore, depending on where and when hoki eggs are laid, the hatched larvae would find widely differing concentrations of their preferred food. In early August 1987, hoki were found in concentrations of up to 20/m3 at 70 m (Murdoch & Quigley 1994) where conditions had the first-mentioned characteristics (high numbers of copepod nauplii and Calocalanus). These conditions were clearly suitable for the survival and growth of hoki larvae in 1987. We surmise that it may be more than a coincidence that the 1987 year class subsequently proved to be very strong.
Larval hoki food and environmental variabilityThus, it seems that hoki spawning coincides with a set of special but variable conditions over the continental slope off Westland in winter. Under specific conditions, as the autumn / winter deep-mixing process progresses, Calocalanus can attain large numbers that appear to favour larval survival and growth.
The winter mixed layer not only varies spatially but temporally both within season and between years (Hadfield & Sharples 1996). Can a relationship between the observed spatial and temporal variability in mixed layer depth on the feeding environment of hoki larvae and the abundance of hoki larvae therefore be seen? Since direct measures of mixing and of hoki larvae abundance have not been made, we used a modelling approach to investigat-ing this question.
The link between mixing, nutrient levels and primary pro-duction was explored using a mixed layer model driven by the observed winds (Hadfield & Sharples 1996). The abundance of hoki larvae (YCS) was estimated in the hoki stock assessment model which uses a wide range of data on the abundance of juvenile and adult hoki to backdate relative abundance of hoki at age 0 years and estimate the relative strength of individual year classes in each of the western and eastern stocks (Francis 2005). Hindcasts of the depth of mixing off Westland are considered here for years with contrasting YCSs in the adult western stock population. In 1987 and 1988, years that yielded strong year classes in the hoki fishery, the early and gradual onset of winter mixing off Westland was associated with the replenishment of nitrate in the surface mixed layer to 1 µM by the end of June (Bradford et al. 1996) (Figure 4).
Figure 4. Annual modelled mixed layer variation off Westland (up-per panels), modelled surface dissolved inorganic nitrogen (lower panels) in 1987 and 1990 (black spots are actual measurements) (adapted from Hadfield & Sharples 1996).
In 1990, when the hoki year class was weak, the winter mix-ing began later, and nitrate replenishment did not reach 1 µM until the end of July. Mixing then progressed to depths greater than 200 m (Bradford et al. 1996), possibly at such a rapid speed that net primary production was curtailed through light-limitation at those depths. The early, extra primary production, mediated by the increased nitrate which occurred in 1987 and 1988, would have then flowed into the rest of the planktonic food web in time for the peak of hoki spawning in late July early August (Zeldis et al. 1998). Thus, the earlier and more gradual mixed-layer deepening that took place in 1987 and 1988 resulted in more nitrate, more phytoplankton and greater densities of Calocalanus. Fish spawned in 1987 were so numerous that they are still being caught in low numbers 20 years later.
In addition to this inter-annual variability, recent physical oceanographic studies of the Tasman Sea show that there is another source of variability in the ocean that may have far-reaching effects on hoki and their survival.
From 1996 to 2002, the Tasman Sea was much warmer than usual (Figure 5) (Sutton et al. 2005). A joint project between NIWA, Scripps Institution of Oceanography, USA and CSIRO Australia has revealed that warming down to at least 800 m occurred in the Tasman Sea between 1996 and 2002. This was ascribed to a Pacific-wide phenomenon (Bowen et al. 2006; Roemmich et al. in press). Here, we show the average tempera-ture from the surface down to 400 m between 167 and 168oE on a line between Sydney and Wellington. This warming coincided with the extended period of low hoki year class abundance.

New Zealand Science Review Vol 63 (3–4) 2007 79
Because temperature and nitrate levels at a given depth are closely linked in subtropical waters (Conk-right et al. 1998), we can deduce that nitrate concentrations available to be mixed into surface waters in autumn and winter were probably lower during the warming period.
Our hypothesisOne of the likely factors affecting the abundance of the western hoki stock is the availability of dis-solved inorganic nutrients, such as nitrate, to the food supply of newly hatched hoki larvae off Westland. Our hypothesis is that survival of hoki larvae depends on an adequate, subsurface supply of nitrate and an early start (beginning of July) to deep mixing in winter.
A recent attempt to test this hypothesis produced inconclu-sive results (Francis et al. 2006). The study found that annual fluctuations in model estimates of nitrate concentrations did not correlate with model estimates of hoki YCSs (Figure 6). The results were really quite unexpected, with a strong negative cor-relation in the first part of the time series and a strong positive correlation in the second part. Francis et al. (2006) suggested that the ocean model should be reconsidered to determine if there is some explanation for the switch that affected its performance in predicting nitrate concentrations. One explanation could be that there was an interplay between the timing and trajectory of autumn / winter mixing and the absolute concentrations of nitrate below the seasonal thermocline that were not captured with the nitrate parameter used in the statistical test.
But it may also be appropriate to reflect on the model used to estimate western hoki YCS. Hoki YCSs cannot be measured directly for western and eastern hoki juvenile fish. This is be-cause egg and larval surveys are not conducted on spawning grounds and juvenile hoki from each of the spawning stocks appear to mix together on the Chatham Rise. These are surveyed annually but the two stocks cannot be physically distinguished as juveniles. Model estimates of YCS are therefore used as indicators of year class success in individual stocks and are influenced strongly by the estimation procedure, assumptions about how the data are treated in (e.g. fishing selectivity, matur-ing and migration ogives) the model, and the underlying stock structure of hoki. New or updated modelling approaches result in different results and the new model estimates of YCS used by Francis et al. (2006) were quite different from those used by Bull & Livingston (2001). For example, the weak 1989 year class in the data set used by Bull & Livingston was much stronger in the dataset used by Francis et al. (2006). It is likely that neither set of YCS data provides an accurate estimation of larval survival in individual hoki stocks.
Figure 5. Average temperature in the Tasman Sea 167–168oE between Sydney and Wellington 1992–2004, 0–400 m (from Sutton et al. 2005).
Figure 6. Comparison between the predictand ‘western stock year class strength’(left axis) and the predictor ‘5-month time integral of nitrate concentration (mmol m-3)’ (right axis). (from Francis et al. 2006).
There are also questions about stock structure. Since 1990, the models used have assumed 100% ‘stock fidelity’, that is the two stocks of hoki operate separately, with larvae spawned in a particular location, such as the west coast, returning as adults to the same location to spawn. However, if they do not have fidel-ity (and there is no conclusive evidence for either way) and the two stocks ‘exchange’ fish at some early point in their life cycle such as during their juvenile stage on the Chatham Rise east of New Zealand, this creates a problem for testing our hypothesis. In the latter case, hoki larvae might have just as good a chance of ending up in the western or eastern stock, irrespective of spawning origin. If in reality, hoki do not have a high level of stock fidelity, then we cannot assume that western stock adults were necessarily exposed to west coast conditions as larvae and we are unable definitively to investigate our hypothesis. Thus, a more complete understanding of hoki stock structure would contribute to confidence that estimates of western YCS relate to fish exposed to west coast conditions.
Scientists and fisheries managers are continuously under pressure to explain and predict fluctuations in fish abundance.

New Zealand Science Review Vol 63 (3–4) 200780
Without understanding some of the underlying processes and the natural fluctuations we can expect under different environmental conditions it is difficult to ensure sustainability in a declining resource. Marine science in New Zealand is poorly placed at present to acquire long-term baseline data about the ocean envi-ronment and its productivity or to investigate analytical methods to elucidate fundamental biological properties of fish, such as their stock structure. Plausible hypotheses cannot, therefore, be rigorously tested and developed for use as predictive tools for resource management. Instead, we are forced to investigate general relationships between fish stocks and environmental variables, which more often than not, eventually prove to be statistically flawed—an inevitable conclusion where only lim-ited data sets are available as inputs to models.
A strong case can be made for learning much more about hoki stock structure and stock fidelity as well as the geographic and temporal variability in the supply of dissolved inorganic nu-trients to New Zealand surface waters and other possible drivers of recruitment variability. It is only by doing this type of research that the risk that climate poses to fish stocks and investment in the fishing industry will be properly appreciated.
References Bowen, M.M.; Sutton, P.J.H.; Roemmich, D. 2006. Wind-driven and
steric fluctuations of sea surface height in the southwest Pacific. Geophysical Research Letters 33(14), L14617.
Bradford, J.M.; Chang, F.H. 1987. Standing stocks and productivity of phytoplankton off Westland, New Zealand, February 1982. New Zealand Journal of Marine and Freshwater Research 21: 71–90.
Bradford-Grieve, J.M.; Murdoch, R.C.; James, M.R.; Oliver, M.; Hall, J. 1996. Vertical distribution of zooplankton > 39 µm in relation to the physical environment off the west coast of South Island, New Zealand. New Zealand Journal of Marine and Freshwater Research 30: 285–300.
Bull, B.; Livingston, M.E. 2001. Links between climate variation and year class strength of New Zealand hoki (Macruronus novaezelandiae): an update. New Zealand Journal of Marine and Freshwater Research 35: 871–880.
Chang, F.H.; Bradford, J.M. 1985. Standing stocks and productivity of phytoplankton off Westland, New Zealand, June 1979. New Zealand Journal of Marine and Freshwater Research 19: 193–211.
Conkright, M.E.; Levitius, S.; O’Brien, T. et al. 1998. World Ocean Database 1998: documentation and quality control. Ocean Climate Laboratory, National Oceanographic Data Center Internal Report 14, 70 p.
Dunn, A.; Livingston, M.E. 2004. Updated catch-per-unit-effort indices for hoki (Macruronus novaezealandiae) on the west coast South Island, Cook Strait, Chatham Rise and sub-Antarctic for the years 1990–2002. New Zealand Fisheries Assessment Report 2004/35. 55 p.
Francis, M.P.; Hurst, R.J.; McArdle, B.H. et al. 2002. New Zealand demersal fish assemblages. Environmental Biology of Fishes 65(2): 215–234.
Francis, R.I.C.C. 2005. Assessment of hoki (Macruronus novaezelandiae) in 2004. New Zealand Fisheries Assessment Report 2005/35, 97 p.
Francis, R.I.C.C.; Hadfield, M.G.; Bradford-Grieve, J.M.; Renwick, J.A.; Sutton, P.J.H. 2006. Links between climate and recruitment
of New Zealand hoki (Macruronus novaezelandiae) now unclear. New Zealand Journal of Marine and Freshwater Research 40(4): 547–560.
Hadfield, M.G.; Sharples, J. 1996. Modelling mixed layer depth and plankton biomass off the west coast of South Island, New Zealand. Journal of Marine Systems 8: 1–29.
Horn, P.L.; Sullivan, K.J. 1996. Validated aging methodology using otoliths, and growth parameters for hoki (Macruronus novaezelandiae) in New Zealand waters. New Zealand Journal of Marine and Freshwater Research 30: 161–174.
Hurst, R.J.; Bagley, N.W.; Anderson, O.F.; Francis, M.P.; Griggs, L.H.;Clark, M.R.; Paul, L.J.; Taylor, P.R. 2000. Atlas of juvenile and adult fish and squid distributions from bottom and midwater trawls and tuna longlines in New Zealand waters. NIWA Technical Report 84. 162 p. https://www.nabis.govt.nz
Langley, A.D. 1993. Spawning dynamics of hoki in the Hokitika Canyon. New Zealand Fisheries Technical Report 34: 1–29.
Livingston, M.E. 2000. Links between the year class strength of hoki (Macruronus novaezelandiae) and environmental variables in New Zealand. New Zealand Journal of Marine and Freshwater Research 34. 55–69.
Livingston, M.E.; Schofield, K.A. 1996. Stock discrimination of hoki (Macruronus novaezelandiae Merlucciidae) in New Zealand waters, using morphometrics. New Zealand Journal of Marine and Freshwater Research 30: 197–208.
Livingston, M.E.; Vignaux, M.; Schofield, K.A. 1997. Estimating the annual proportion of non-spawning adults in the New Zealand hoki, Macruronus novaezelandiae Hector. Fishery Bulletin 95: 99–113.
Ministry of Fisheries, Science Group (Comps.) 2006. Report from the Fishery Assessment Plenary, May 2006: stock assessments and yield estimates. 875 p. (Unpublished report held in NIWA library, Wellington.)
Murdoch, R.C. 1990. Diet of hoki larvae (Macruronus novaezelandiae) off Westland. N.Z.J. Mar. Freshwater Res., 24, 519–527.
Murdoch, R.C. 1992. A review of the ecology of hoki Macruronus novaezelandiae (Hector), larvae in New Zealand waters. Bureau of Rural Resources Proceedings 15: 3–16.
Murdoch, R.C.; Quigley, B. 1994. A patch study of mortality, growth and feeding of the larvae of the southern gadoid Macroronus novaezelandiae. Marine Biology 121: 23-33.
Patchell, G.J.; Allen, M.S.; Dreadon, D.J. 1987. Egg and larval development of the New Zealand hoki Macruronus novaezelandiae. New Zealand Journal of Marine and Freshwater Research 21: 301–313.
Roemmich, D.; Gilson, J.; David, R.; Sutton, P.; Wijffels, S.; Riser, S. in press. Decadal spin-up of the South Pacific Subtropical Gyre. Journal of Physical Oceanography
Schofield, K.A.; Livingston, M.E. 1998. Ovarian development and the potential annual fecundity of western stock hoki (Macruronus novaezelandiae). New Zealand Journal of Marine and Freshwater Research 32(1): 147–159.
Sutton, P.J.H.; Bowen, M.M.; Roemmich, D. 2005. Decadal temperature changes in the Tasman Sea. New Zealand Journal of Marine and Freshwater Research 39: 1321–1329.
Zeldis, J.R.; Murdoch, R.C.; Cordue, P.L.; Page, M.J. 1998. Distribution of hoki (Macruronus novaezelandiae) eggs, larvae and adults off Westland, New Zealand, and the design of an egg production survey to estimate hoki biomass. Canadian Journal of Fisheries and Aquatic Sciences 55: 1682–1694.

New Zealand Science Review Vol 63 (3–4) 2007 81
OncetherewasavirginstockLike a rich gold seam in old quartz rockHiddenawaykeptwelloutofsightAnaturalbounty,unawareofitsplight
ButthenonedayafteranexploratorycruiseFishermencamebackwithstartlingnewsThere’s heaps of fish, a new resource -A fishery developed as a matter of course
Afewyearslater,stillgoingstrongSendinmoreboats,there’snothingwrongDollars flowing, exports riseThisisthelatestindustryprize
AtlastthestocksizeisassessedVirginbiomassandyieldsareguessedThoughuncertain,theydoseemhighThere’senoughforall,theirpieceofthepie
But later on as the stock’s fished downAndresearchleviespaidtotheCrownScientific advice suggests more cautionBut quotas are set, each fisherman’s portion
Bycatchissues,marinemammalsdrownAlbatrosscaughtandgetdraggeddownCatchratesdrop,gettingrightoutofhandFishpriceisrising—they’renolongercanned
Where have they gone? The fishermen cryIt’s the foreigners fault—they made the fish dieOravirus,orseal,ormarinemammalpestOrtoanMPA*somewhereinthewest!
That’srubbishtheWorkingGroupmembersrepliedThere’snocrypticbiomass—orplacetheycanhideButwhatweneedtogetoutofthisjamIs to have an experimental fishing program
We’llsetasidequotajustforthispurposeAndtestthehypotheses,forbetterorworseWe’llhiresomeconsultantstoreviewtheresultsTo find out the problems and where lay the faults
Andafterthat’sdoneandtheblameslaintorestThescientistssackedandforeignerssentwestOurthoughtsturnagaintothestateofthestockWhilstsecondscountdownonthefaceoftheclock
Isthestockrising?Dowehavegoodrecruits?TheassessmentresultssuggestacoupleofbeautsOr is the stock falling, as the fishers let ripAndthestocksattheendofalongone-waytrip
WilltheGovernmentendupinareallybadstateAs it is left to ponder the last fishes’ fate’Causeinsteadoftheprizeandtheexporters’dreamIt’sleftwiththecostofabuy-backscheme
Stuart Hanchet 2Mar07
A lament for a fishery
* MPA: Marine Protected Area

New Zealand Science Review Vol 63 (3–4) 200782
New Zealand Association of Scientists 65th Annual report
President’s Report for 2005/06It is my pleasure to present this report to the 65th AGM of the Association.
New Zealand Science Review has again been the Associa-tion’s principal activity, and it has been a bumper year, with four issues produced, as discussed in more detail below. The conferring of medals and awards in recognition of excellence is the other major activity of NZAS and the 2006 NZAS medallist awardees are also presented here.
This has been another successful year for NZAS with timely responses and commentary on a number of aspects of science policy and funding developments within New Zealand during 2006. At times I have been called upon by the media to comment on matters and have responded accordingly, but there have not been any major issues or demands. Details of the activities of Council are well documented in Council Minutes and will not be elaborated upon here.
Council meetingsThe Council had seven well-attended meetings between Febru-ary and October 2006.
In addition there was a general meeting held on 24 Novem-ber 2005 at which three of our 2005 awardees spoke: Dr Kevin Tate—Marsden Medal; and Dr Alison Campbell and Dr Penny Cooke—Communicator Award.
I thank all the members for their attendance and invaluable support at, and following, those meetings.
First up, I would particularly like to thank our Patron, Neil Curtis.
Next up, our officers:Euan Smith, Past-President.
David Lillis, my most able and conscientious Vice-President.
Janet Grieve, our able computerised treasurer and member-ship secretary.
Fiona MacDonald, our executive secretary, who has once again provided great support throughout the year from afar in Dunedin.
And now I wish to thank those with specific functions as de-cided by Council: Ross Moore, Minutes Secretary for much of the year, with
Vince Gray standing in on occasion. Allen Petrey, our wonderful Editor. Ken Aldous and David Penny, for organising and judging
our awards, George Jones for maintaining email contact with members,
and for securing new medals. Vanessa Sherlock who has managed our website despite
momentous developments in her life.
(Check us out on http://nzas.rsnz.org/ )
I wish to also acknowledge other members of the 2005/06 NZAS Council including Mike Berridge, John Clare, Dennis Gordon, Vince Gray, David Heath, George Jones, Kate McGrath,
Chris Sissons and Mike Staines. Of these, three were elected at the 2005 AGM: John Clare, Kate McGrath and Mike Staines.
Thanks also to Steve Thompson (RSNZ) for his presence and support at so many of our meetings in his capacity as an ex-officio invited member of Council.
New Zealand Science ReviewFour publications were produced during the past year, all gen-eral issues.
Volume 62(3) featured five articles relating to: (1) career prospects for contract academic staff, by Laura Bennet, Lou-ise Nicholson, and Alistair Gunn (all at Auckland Univ.); (2) the pros and cons of nitrogen management in agriculture, by Surinder Saggar (Landcare) and Nanthi Bolan, Jagrati Singh, and Adeline Blard (all Massey Univ.); (3) Austronesian pre-history and Polynesian genetics, by Stephen Marshall, Adele Whyte, Frances Hamilton, and Geoffrey Chambers (all at Vic-toria Univ. of Wellington); (4) the contribution of Royce Elliott to agricultural decision-making by William Smith (Auckland Univ.); and (5) how best to discuss controversial science, by Juliet Roper, Kay Weaver and Ted Zorn (all at Waikato Univ.). NZAS also published a discussion document entitled: ‘There is a better way: eight recommendations on the science system in New Zealand.’
Volume 62(4) featured three articles addressing: (1) the im-plications of modern computing technology on research, by John Maindonald (Australian National Univ.); (2) ion beam physics at the Inst. of Geological & Nuclear Sciences (GNS), by Andreas Markwitz and John Kennedy (GNS); and (3) the contribution of the social sciences to understanding human behaviour, by Sally Casswell (Massey Univ.) and Louise Munro (Ministry of Research, Science & Technology). Ian Graham reviewed the book ‘Harold Wellman: a man who moved New Zealand’. NZAS presented: an update on the NZAS Science Policy Paper of May 2005; a perspective on workplace bullying; and reports on the 2004/05 year, including the President’s Report, Financial Report, and citations for the 2005 NZAS Awards.
Volume 63(1) was a general issue with five thought-provok-ing articles (some slightly depressing) including: one on the declining importance of CRIs in the present funding system, by Graham Weir (Industrial Research Ltd); three that deal with aspects of science policy and the lot of scientists, by ag-riculturalists Jacqueline Rowarth (Univ. Melbourne), Stephen Goldson (AgResearch), and Tom Lambie (Lincoln Univ.); and a benchmark paper on ‘kaupapa Mäori research methodology’, by psychologists Dannette Marie (Otago Univ.) and Brian Haig (Canterbury Univ.). David Lillis presented a viewpoint on the role of government in R & D and also reviewed a book ‘The elegant universe of Albert Einstein’. Two submissions relating to the December 2005 MoRST consultation paper ‘A More Stable Funding Environment-Sector Engagement Paper’ were also presented, one from NZAS and the other from Doug Edmeades.

New Zealand Science Review Vol 63 (3–4) 2007 83
Finally, Volume 63(2) featured a well-considered contribu-tion to the science policy debate entitled ‘Finding a Better Way’, by Geoffrey Chambers (VUW), and two articles that examined some of the key factors affecting the choice of science as a ca-reer for young people, the first written by Jacqueline Rowarth (Univ. Melbourne) and Virginia Goldblatt (Massey Univ.), and the second by Rachel Bolstad, Josie Roberts, and Rosemary Hipkins (all New Zealand Council for Educational Research). There were two book reviews, one by David Penny on ‘Darwin: the Indelible Stamp’ and one by Mike Berridge on ‘Are Angels OK?’ Lastly, there was a perspective on the Marsden Fund and allocation issues by Garth Carnaby (Chair of the Marsden Fund Council).
The point of listing the contents of these issues of New Zealand Science Review is to highlight the diversity and spread of participation in the journal and hence NZAS. Many thanks to the many authors who have contributed over the past year. They are greatly appreciated.
Many thanks also to those who have been involved in the New Zealand Science Review production process, and especially for maintaining such a high standard of content and presentation. Our editor Allen Petrey continues his magic and he has been assisted by the editorial committee comprising David Lillis, Janet Grieve, Mike Berridge, and Hamish Campbell. Lastly, special thanks to Geoff Gregory, production editor.
MembershipOnce again, membership has dropped slightly over the past year and this is of growing concern.
Accordingly, Council has established a specific Member-ship Secretary role that is separate from that of the Treasurer. Traditionally, these roles have been managed by the one indi-vidual.
During the year, subscription rates were increased and as a consequence revenue has remained reasonably steady compared with previous years.
Awards and Medals*This year, following on from the success of the past 3 years, Council again agreed that the Association would participate in a collective awards ceremony for New Zealand science socie-ties and organisations, planned and run by the Royal Society of New Zealand (RSNZ). This year, NZAS was granted the opportunity to present two awards there: the Research Medal
and the Marsden Medal. The awards ceremony took place at the Science Honours Dinner held at The Hilton, Princes Wharf, in Auckland on Thursday 15 November. Once again this was a glamorous occasion (a sit-down dinner) with in excess of 300 guests from the wider science community. Radio NZ presenter and celebrity Kim Hill acted as MC. NZAS President Ham-ish Campbell presented the Research Medal and the Marsden Medal.
It was decided that the Shorland Medal and the Science Communicator Award should be presented at the Association’s AGM, but prior to the official business of the meeting.
The Marsden Medal is awarded to recognise scientists who have made an outstanding contribution to the cause or profession of science in New Zealand. The recipient of this medal for 2006 is Dr Tim Haskell of Industrial Research Limited, Wellington, for outstanding contributions and leadership in a broad range of applied physics, from solar heating, to IT, novel optical devices and Antarctic sea ice formation and decay. He also developed test procedures and equipment for the base isolators installed at Te Papa.
The Shorland Medal is awarded in recognition of a personal lifetime of research that has resulted in advances in knowledge or significant benefits to society. The 2006 medal was awarded to Professor David Parry, of the Institute of Fundamental Sci-ences, Massey University, for his outstanding contributions to biophysics.
The Research Medal is awarded to a young scientist for outstanding fundamental or applied research in the physical, natural or social sciences published during the preceding 3 years. The winner of the 2006 medal is Dr Jamin Halberstadt of the Department of Psychology, University of Otago, for his outstanding social psychological research over this period, on how emotional responses influence social cognition (the representation and use of social information), and vice versa. His innovative research includes notable contributions to the fields of reasoning, intuition, and decision making.
The Science Communicator Award is presented to practising scientists for excellence in communicating to the general public in any area of science or technology. The 2006 winner is Dr Liz Carpenter of AgResearch Ruakura. Her research on hyper-immune milk has generated significant media interest and she has skilfully communicated her findings to the public in diverse ways.
Hamish CampbellPresident
29 November2006
* This part of the President’s report is somewhat abridged as details of the Association’s awards and medals are given below. Editor

New Zealand Science Review Vol 63 (3–4) 200784
Marsden MedalNew Zealand Association of Scientists Marsden Medal is awarded to recognise scientists who have made an outstanding contribution to the cause or profession of science in New Zea-land. The recipient of this medal for 2006 was Dr Tim Haskell of Industrial Research Limited (IRL), Wellington.
Dr Haskell has conceptualised, initiated and led a number of novel research programmes over a 35-year period and is an outstanding advocate for science in New Zealand.
His scientific interests have covered a broad range of areas, from solar heating to IT, novel optical devices and Antarctic sea ice formation and decay. He also developed the test procedures and equipment for the testing of the base isolators installed in Te Papa —one of the largest commercial contracts undertaken by IRL.
Tim’s outstanding leadership and work with the Antarctic Research Programme has spanned nearly 30 years, during which time he has kept together a team of researchers from the universities of Auckland and Otago, Victoria University of Wellington, IRL, and NIWA, as well as a number of overseas institutions.
One of his most significant leadership roles integrated signal processing, communications, optics and synthetic organic chem-istry into an applied research programme. This work arises from collaboration between IRL and the universities of Auckland and Otago, as well as interactions with a number of commercial companies. The team is developing ‘all-optical’ infrastructure components such as routers, switches, laser sources and ampli-fiers, for optical networks. Without his initiative, this integration of diverse skills would not have happened. Hitherto unknown materials and techniques have been discovered which it is ex-pected will eventually lead to new industries for New Zealand. In the mid-70s he was instrumental in developing hardware for the DSIR computer communications network. This has led to the creation of one of New Zealand’s most successful com-munications research and development companies.
Dr Haskell was awarded a Royal Society Science and Technology Medal in 1996. He has chaired the Environmental Assessment and Review Panel advising the Minister of Foreign Affairs and Trade on Antarctic environmental matters, has also
served on the Marsden Fund Physical Sciences Panel, and provides advice to the US National Science Foundation on logistics matters relating to sea ice in McMurdo Sound.
In education he has been directly involved with around 20 postgraduate students in both optics and Antarctic research, as well as a number of undergraduate projects. He is an author on approximately 100 publications as well as numerous industry reports.
Shorland MedalNew Zealand Association of Scientists Shorland Medal is awarded in recognition of a personal lifetime of research that has resulted in advances in knowledge or significant benefits to society. The 2006 medal was awarded to Professor David Parry, of the Institute of Fundamental Sciences, Massey University, for his contributions to biophysics.
Professor Parry, who is now retired, has had a most distin-guished career in biophysics. His research focused particularly on the analysis of the ultrastructure of fibrous proteins and thus has been of high relevance to New Zealand. The fibrous proteins he has studied include those in hair, collagen, muscle, tendon, skin, and the cornea. His work is marked by a deep understanding of the fundamental biophysics, including the assembly of protein complexes. David’s work has also been recognised internationally, with a result that he has over 50 publications that are cited over 50 times each, and nearly 6000 different publications have referred to his work, usually more than once. In addition to his outstanding research contributions he undertook a full administrative role as Head of the Institute of Fundamental Sciences.
In 2000, Professor Parry was awarded the Hercus Medal from the Royal Society of New Zealand for his studies of the chemistry, physics, biochemis-try, ultrastructure and biological function of fibrous proteins, and in 2004, he received the Mas-sey University Research Medal for an outstanding individual researcher.
On the international level he has contributed substantially as President of the International Un-ion of Pure & Applied Biophysics (IUPAB) and as Vice-President (Scientific Planning & Review)
New Zealand Association of Scientists 2006 AwardsKen Aldous
The Association’s Marsden and Research Medals were presented at the 2006 Science Honours Dinner, held at the Hilton Hotel in Auckland on 15 November. The Royal Society of New Zealand organised and hosted this annual event, at which achievements across the whole of the New Zealand science community are celebrated.
The Shorland Medal and the Communicator Award were presented at the Association’s 2006 Annual General Meeting, on 30 November, at Science House in Wellington.

New Zealand Science Review Vol 63 (3–4) 2007 85
of the International Council for Science, ICSU. He is the first New Zealander to be appointed to this position. ICSU incor-porates 27 Scientific Unions from 103 countries and covers all areas of science.
Finally, during his long and busy career, Professor Parry has always been accessible to staff and students. On the research, human, and administrative levels, David has made a major com-mitment and contribution to science in New Zealand.
Research MedalNew Zealand Association of Scientists Research Medal is awarded to a young scientist for outstanding fundamental or applied research in the physical, natural or social sciences published during the preceding three years. The winner of the 2006 medal was Dr Jamin Halberstadt of the Department of Psychology, University of Otago, for his outstanding social psychological research over the last 3 years.
Dr Halberstadt’s primary research interests are in the how emotional responses influence social cognition (the representa-tion and use of social information), and vice versa. His inno-vative research includes notable contributions to the fields of reasoning, intuition, and decision making. He has characterised intuition as the direct use of brief emotional responses to make decisions and argued that analytic thought—trying to determine and explain the reasons for a decision—may be incompatible with such use. As a result, analytic thought can paradoxically
produce a worse decision. For example, Dr Halberstadt has shown that reasoned predictions about basketball games are less accurate, relative to the actual outcomes of the games, than pre-dictions based on ‘gut feelings’. Dr Halberstadt is developing a theoretical framework for when analytic approaches to decisions might be helpful and when they might be harmful.
Dr Halberstadt’s work on the effects of cognition on emo-tion is equally ground-breaking. For example, he has shown that a surprisingly strong predictor of attractiveness in a wide variety of social and non-social categories is simply how good an example something is of its group. For example, if people judge a sparrow as a good example of a ‘bird’, but a penguin as a poor example, Dr Halberstadt finds that people like the spar-row better than the penguin, and has observed the same effect in nearly all categories, from human faces, to horses, dogs, and fish, to cars, wristwatches, and handguns. The reasons for this ‘prototypicality bias’, which include the fact that good category members feel familiar, and that they can be easily perceived and cognitively processed, shed light on the fundamental relation-ship between cognition and emotion, as well as the evolutionary origins of the attractiveness of humans and objects.
As observed by his nominator, Dr Halberstadt is not only an able and disciplined experimentalist, but he is also a gifted com-municator, able to explain the significance of his findings and place them in a broader theoretical context. His research has
been published in the very top journals in Social and Cognitive Psychology and has already been extensively acknowledged by other researchers. In less than a decade since his doctorate he has established himself internationally as a leading researcher in his field.
Science Communicator AwardThe Association’s Science Communicator Award is presented to practising scientists for excellence in communicating to the general public in any area of science or technology. The 2006 winner was Dr Liz Carpenter of AgResearch Ruakura.
Dr Carpenter is an immunol-ogist within the Dairy Science & Technology Section, at AgRe-search Ruakura, where she leads a group working on hyper-immune milk. Her recent presentations on this work over the past 12 months have generated significant media interest, including interviews by print journalists and on local and national radio. She has also appeared on TV One’s Rural Delivery.
Dr Carpenter trained as a high school teacher prior to em-barking on a scientific research career. Her passion for teach-ing and sharing her love of science is evident from her various activities while working at AgResearch.
Over the last five years, Liz has made presentations, pitched at the appropriate level, to community and academic groups, primary and secondary school classes and to several farmers groups, who are the end-users of hyper-immune milk technol-ogy. She has frequently organised science lab visits and seminars for high school students and teachers to stimulate their interest in science as a career. In her school and lab visits Dr Carpenter involves the audience by giving them the chance to perform an activity to reinforce the theme of the presentation. This ‘hands-on’ approach is well appreciated by the teachers.
Within the AgResearch community, Liz is highly regarded as a skilled communicator and widely supportive of others. She organises the monthly seminar series, ‘Ruakura Research Revealed’, with speakers from throughout the Ruakura campus. In addition, she contributes regularly to the annual AgResearch `Knowledge Week’, with presentations for the general AgRe-search staff on a range of science topics, including a ‘Beginners Guide to Immunology’ and ‘GE on the doorstep’. These were so popular that she has been asked to present the talks for a third year.
Dr Carpenter also plays an active role in the Association for Women in the Sciences, having been convener of the national executive and the Waikato Branch, and has recently run the Association’s annual conference. She frequently acts as a judge at school science fairs, and has given several presentations to school groups on ‘How to do a good Science Fair project’.

New Zealand Science Review Vol 63 (3–4) 200786
New Zealand Association of Scientists (Inc.)Statement of financial performance for the year ended 31 July 2006 2006 2005Incomewasderivedfrom: Subscriptionsreceived 10,730 13,554 Interestreceived 1,221 1,051 Donationsandsundry 0 3 _______ _______ $11,951 $14,608
From which Expenses were deducted: AccountancyandAudit 600 550 Councillors’expenses 268 30 Depreciationonprinter 65 16 AGMandConferenceexpenses 114 285 Postboxrent 125 125 Postageandstationery 0 5 Royal Society affiliation 669 644 Awardsandcosts 145 239 ______ _______ $1,986 $1,894
Excess Income over Expenditure 9,965 12,714Appropriation–SubsidyforNZ Science Review 9,397 7,195 ______ ______Surplusfortheyear $568 $5,519
New Zealand Science Review 2006 2005
Expenses of production and administration:
AccountancyandAudit 75 69 Production Printing,etc. 10,073 13,165 Distribution 1,565 1,477 _______ _______ 11,638 14,642 Last year stock adjustment 3,423 – 3,423 _______ _______ 15,061 11,219 _______ _______ Totalexpenses $15,136 $11,288
Expenses recovered from:
Library subscriptions and other revenue 5,739 4,093 SubsidyfromNZAS 9,397 7,195 _______ _______ Totalrecoveries $15,136 $11,288

New Zealand Science Review Vol 63 (3–4) 2007 87
Statement of financial position as at 31 July 2006
Accumulated funds 2006 2005Generalfunds Balance at 1 August beginning of financial year 28,378 22,859
add Surplusfortheyear 568 5,462 _______ _______Totalfunds $28,946 $28,378
Representedby:Assets Fixedassets– Printeratcost 1,639 1,639 lesscumulativedepreciation 1,638 1,573 1 66 Currentassets– BNZcurrentaccount 9,083 4,377 BNZshort-termdeposits 17,898 16,700 _______ _______ 26,981 21,077
Subscriptionsinarrears 2,105 2,200 StockofNZScienceReview 0 3,423 Stockofmedalsatcost 543 576 _______ _______ 29,629 28,986 _______ _______ Totalassets 29,630 29,052
less Liabilities Currentliabilities GraemeCooteFundDonations 414 414 Subscriptionsinadvance 270 260 _______ _______ Totalliabilities 684 674 _______ _______Totalnetassets $28,946 $28,378
Auditor’s report to membersIhaveobtainedalltheinformationandexplanationsIhaverequired.
In my opinion, the financial report:• Complieswithgenerallyacceptedaccountingpractice;• Gives a true and fair view of the financial position of the New Zealand Association of Scientists (Inc) as at 31July2006andtheresultsofitsoperationsfortheyearendedonthatdate.
My audit was completed on 20 September 2006 and my unqualified opinion is expressed at that date.
Peter WillisChartered Accountant, Lower Hutt

New Zealand Science Review Vol 63 (3–4) 200788
New Zealand Association of Scientists(NZAS)
What can we do for you?What do you think are the major issues currently facing
New Zealand science and scientists?What should NZAS be doing about them?
As an organisation, NZAS wants to effectively address issues facing New Zealand science and its scientists.To help achieve this we want members (and non-members) to tell us what you believe are the major issues weshould be tackling.We are also exploring the possibility of conducting a survey to update the information gathered in the 1996 and2000 Sommer surveys of New Zealand scientists and reported in New Zealand Science Review.Below are just a few examples of what you might consider important issues:
• The proportion of GDP allocated to New Zealand science• The role of fundamental science in New Zealand and how it should be funded• Long-term sustainability of science in New Zealand• Meshing long-term science with short-term politics• Career paths for scientists• Linkages between CRIs, universities, private institutions and industry• Making science valued for itself and as an economic platform by the general public and politicians• The importance of maintaining an adequate science infrastructure (people and equipment) within New
Zealand• The management and allocation of research funding in New Zealand• The cost and effectiveness of institutional separation of policy and funding for research, science and
technology• How to better raise public awareness of the value of research, science and technology• Tax incentives for private investment in research, science and technology• Providing a balanced perspective towards the use of animals in research• Providing a balanced perspective of the value and acceptability of genetic modification of plants and
animals in New Zealand.
Which of these are important to you?Are there other science issues you think need addressing?
Email your ideas and comments to Hamish Campbell, [email protected] orJanet Grieve, [email protected]
The NZAS wishes to be truly representative of the New Zealand science landscape –
Are you a member? If not, think about becoming one – contact, Janet Grieve, membership secretary, [email protected]
http://nzas.rsnz.org/