Embed Size (px)
Citation preview
The Journal of Amity Business SchoolThe Journal of Amity Business School
Volume 21, No. 1, January - June 2020ISSN: 0972-2343ASI-SCORE : 1.3Indian Citation Indexhttp://amity.edu/abs/abr
Job Automation, Employee Turnover and Organizational Performance:
A Study of Deposit Money Banks (DMBs) in Anambra State
Egbunike, Francis Chinedu PhD, Enemuo-Uzozie, Chuka & Anekwe, Rita Ifeoma
Relevance of IFRS to A Developing Country: Evidence From Nigeria
Agbata, Amaka Elizabeth, Ekwueme, Chizoba Marcella & Ndum, Ngozi Blessing
Efficiency of Managing Working Capital of Selected Companies in
Indian Power Sector during he Post-Liberalization Era
Rupesh Yadav & Debasish Sur
Financial Therapy: Eliciting the Fine Points and Professional Preconditions of An Evolving Field
Shivam Shukla, Sudhir Kumar Shukla & Asha Ram Tripathi
Big Data Analytics in Residential Property Buying Decisions in India
Shiv Prasad Singh, Nitesh Rohilla & Dr Amit Kumar
Book Review
• Supriti Agarwal

AMITY BUSINESS REVIEWVol. 21, No. 1, January - June 2020
Bi-annual Single-blind Refereed Journal of Amity Business School
ISSN: 0972-2343ASI-SCORE : 1.3
Indian Citation Index
Chief Patron : DR ASHOK K CHAUHAN
Patron : DR ATUL CHAUHAN
Desk Advisor : DR BALVINDER SHUKLA
Editor-in-chief : DR SANJEEV BANSAL
Editor : Dr AMIT KUMAR PANDEY
KeysAcademicUNLOCKING ACADEMIC CAREERS
DR ABDUL AZIZ ANSARIJamia Millia Islamia, New Delhi
DR J.K. SHARMAAmity School of Business, Amity University, Noida
DR ANITA KUMARUniversity of Coventry, UK
DR SANDEEP KUMAR GARGUniversity of Delhi
PROF MAHESH SHARMASBSC, University of Delhi
DR DHARMENDRAJhambeshwar University, Hisar
PROF. AWADHESH KUMAR TIWARI Dean, Commerce and Management, Deen Dayal Upadhyaya Gorakhpur University, U.P
DR TRIVENI SINGHSP STF, Uttar Pradesh Police
PROF S.K. GARGPro Vice Chancellor, Delhi Technical University
PROF DR AJAY KUMAR SINGHVice Chancellor, Sri Sri University, CuttackDelhi School of Economics, Delhi University
PROF GARIMA GUPTAUniversity of Delhi
DR S.K. LAROIYAFormerly University of Delhi
DR SANJAY SAPROOCEO, HAMILTON Medical, AG
DR DILIP KUMAR BANDHOPADHYAYFormer Vice Chancellor, GGSIP
PROF DR SUDHIR KUMAR SHUKLAHOD Commerce, Mahatma Gandhi Kashi Vidyapith, Varanasi
DR N.K. AHUJAVice Chancellor, Subharti University, Meerut
DR K.K. DEWANVice Chancellor, Noida International University
PROF JAVED AKHTARAligarh Muslim University, Aligarh
PROF T.K. CHATTERJEEIMT Nagpur
PROF A.H. ANSARIDirector CMS, Jamia Milia Islamia
PROF JAGDEESHDean Management, Amity University, Mumbai
Doc. Dring. ELENA HORSKASlovak University of Agriculture, NITRA, Slovak Republic
Mr SANTOSH K SRIVASTAVAINDOIL, MONTNEY Ltd. Calgary, Canada
DR T. K. SINGHALSymbiosis International University, Pune
Board of Editors

ContentsVol. 21, No. 1
ARTICLES1 Job Automation, Employee Turnover and Organizational Performance:
A Study of Deposit Money Banks (DMBs) in Anambra State
Egbunike, Francis Chinedu PhD, Enemuo-Uzozie, Chuka & Anekwe, Rita Ifeoma
Relevance of IFRS to A Developing Country: Evidence From Nigeria
Agbata, Amaka Elizabeth, Ekwueme, Chizoba Marcella & Ndum, Ngozi Blessing
Efficiency of Managing Working Capital of Selected Companies in
Indian Power Sector during he Post-Liberalization Era
Rupesh Yadav & Debasish Sur
Financial Therapy: Eliciting the Fine Points and Professional Preconditions of An Evolving Field
Shivam Shukla, Sudhir Kumar Shukla & Asha Ram Tripathi
Big Data Analytics in Residential Property Buying Decisions in India
Shiv Prasad Singh, Nitesh Rohilla & Dr Amit Kumar
Book Review
• Supriti Agarwal
19
33
44
52
66
Amity Business ReviewVol. 21, No. 1, January - June, 2020
Editor-in-ChiefFrom the Desk of the
“Victory comes from finding opportunities in problems.”Sun Tzu
Since December 2019 we have seen 18 months of unpredictability. 18 months of uncertainty. 18 months of
deadly Coronavirus. The resurge of Covid after invention of vaccines across the world has affected
everything including industry, Socio-economic and education sector. Though GoI took many progressive
decisions to save the nation from this pandemic in a war-like situation yet situation is not totally under
control. Time is tough but it taught us several lessons of life. There is cascading effect of pandemic on
education sector from school education to HEIs especially in assessment and evaluation of students.
It is also true that challenges are always associated with the opportunities. As always research has
proven to be saviour for the society and mankind with new inventions and innovations in all the sectors.
This issue of Amity Business Review is a collection of such quality research papers from India and
abroad.
Have a thoughtful reading. Looking forward for your continued support and constructive feedback.
Sanjeev Bansal
Amity Business ReviewVol. 21, No. 1, January - June, 2020
EditorFrom the Desk of the
The ongoing COVID-19 pandemic is having a profound impact on organizations across the world, leadership
during the COVID-19 crisis has been brought to the fore in both political and organizational settings.
Technology played an integral role and forced many organizations to undergo significant transformation,
rethinking key elements of their business processes and use of technology to maintain operations whilst
adhering to a changing landscape of guidelines and new procedures. Thousands of research papers have been
published during pandemic on topics like online learning, digital strategy, artificial intelligence, information
management, social interaction, cyber security, big data, block chain, privacy, mobile technology and strategy
through the lens of the current crisis and impact on these specific areas
The purpose of ABR is to promote quality publication, build management theories and contribute to
management practices. We appreciate empirical, fundamental, pedagogical research including field,
laboratory and theoretical contributions in the area of management. ABR is committed to enhance the
quality of research through intellectual contribution of researchers across the globe. Since the inception of
the journal, we have focused upon the various components of Marketing, Finance, Human resources,
Operations, economy, behavioural sciences and information technology. In the current issue of ABR,
contemporary research papers have been included after the extensive review at various levels by our peer
review team. A diverse subject of management has been entertained by the researchers and this issue is
now before the readers for their intellectual reading.
I am sure that this issue will be another milestone in the journey of ABR.
Dr. Amit Kumar Pandey

BACKGROUND OF THE STUDYThe 21st century has witnessed tremendous
developments with breakthrough technologies
such as artificial intelligence (AI), data science, etc.
enabling advanced applications such as robotics,
virtual assistants, etc. (Vermeulen, Kesselhut, Pyka,
& Saviotti, 2018). These developments led to
several aspects of traditional tasks performed by
humans to be replaced by machines, thus,
gradually the automation of several human related
tasks. According to Makridakis (2017) the
revolution in AI was directed to “substitute,
supplement and amplify practically all tasks
currently performed by humans, becoming in
effect, for the first time, a serious competitor to
them”. Automation mainly affected routinized
work in stationary, predictable environments
(Ford, 2015; Wolfgang, 2016); particularly, where
tasks mainly concern executing rules rather using
cognitive processes (Levy & Murnane, 2007).
Automation involves a broad range of technologies
including robotics and expert systems, telemetry
and communications, electro-optics, sensors,
wireless applications, systems integration, and
The study explores the interrelationship between job automation, employee turnover and organizational performance of Deposit Money Banks in Anambra State, Nigeria. The study adopted the descriptive survey research design. The population comprised of eighty (80) senior staff in eight (8) Deposit Money Banks (DMBs) in Anambra state. The study utilized the complete enumeration method; because the total identifiable respondents were less a hundred. Simple random sampling technique was used to select the respondents for the study. The study focused on primary data collected using a structured questionnaire. The questionnaire was pilot tested on a sample of 20 respondents from four DMBs. The reliability of the instrument was tested using Cronbach Alpha. The data were analyzed using Pearson Correlation, simple linear regression technique, and SEM. The results showed a significant positive relationship between job automation and employee dismissal; secondly, a significant positive relationship between job automation and customer satisfaction; and, lastly, employee dismissal mediates the relationship between job automation and customer satisfaction. Based on this, the study recommends that managers of contemporary organizations embrace technological adoption as a strategic response to competitive forces in the business environment. In this regard, managers are advised to adopt a complementary perspective during automation of business processes.
Keywords: job automation, employee turnover, performance, Customer satisfaction
1Amity Business ReviewVol. 21, No. 1, January - June, 2020
Job Automation, Employee Turnover and Organizational Performance:
A Study of Deposit Money Banks (DMBs) in Anambra State
Egbunike, Francis Chinedu PhD Enemuo-Uzozie, Chuka & Anekwe, Rita Ifeoma1 Senior Lecturer, Department of Accountancy, Faculty of Management Sciences, Nnamdi Azikiwe University
2 Lecturer, Department of Business Administration, Faculty of Management Sciences, Nnamdi Azikiwe University3 Lecturer, Department of Business Administration, Faculty of Management Sciences, Nnamdi Azikiwe University
1 2 3,
2
Job Automation, Employee Turnover and Organizational Performance: A Study of Deposit Money Banks (DMBs) in Anambra State
many more (International Society of Automation
[ISA], 2020). In the banking sector, technological
advancements caused tremendous changes, such
as e-banking, etc. in the ways banks render their
services (Atiku, Genty, & Akinlabi, 2011).
Presently, it is estimated that over ninety percent of
businesses are conducted via online platforms
(Ojeka & Ikpefan, 2012).
However, the catalytic effect of automation
revolves around two opposite perspectives
(Martens & Tolan, 2018). The first perspective finds
a complementarity between men and machines.
Therefore, the labor-saving impact of automation is
counterbalanced by higher wages, economic
growth and more employment in other sectors. In
contrast, the substitutive perspective finds that
automation led to job displacement causing
polarization, de-skilling and possibly creating a
jobless economy (Autor, 2015; Agrawal, Gans, &
Goldfarb, 2019). In support of this view, the study
by Brynjolfsson and McAffee (2014), argued that
unemployment was mainly caused by rapid
technological advancements that outpace growth
in demand. In Nigeria, several studies have argued
that automation of several bank processes, such as
the use of Automated Teller Machines (ATMs) led
to redundancy and retrenchment of employees
(Atiku, Genty, & Akinlabi, 2011; Agboola, 2003).
This led to a high rate of involuntary turnover in
the banking sector. In this regard, turnover refers
to the number or percentage of employees in the
banks that exit during the period. This was mainly
because the banks consider services of such
employees no longer relvent (Fisher, Schoenfeldt,
& Shaw, 2003). The issue of organizational
performance has dominated the business and
management literature for several decades (Bititci,
Garengo, Dörfler, & Nudurupati, 2012; Hamann,
Schiemann, Bellora, & Guenther, 2013; de Oliveira
Lacerda, Ensslin, & Ensslin, 2011; Miller,
Washburn, & Glick, 2012). According to Elena-
Iuliana and Maria (2016) performance is a
‘subjective perception of reality, which explains the
multitude of critical reflections on the concept and
its measuring instruments’. Organizational
performance comprises of the actual output or
results of an organization as measured against its
intended outputs (or goals and objectives) (Msafiri,
2013).
Statement of the Problem
The banking industry has undergone a lot of
changes brought about by the advent of
automation (Camara, Rahim, Yusof, Tambi, &
Magassouba, 2019). In Nigeria and many African
countries, the automation of several jobs is not
without its attending problems. Several authors
have noted that of particular interest is the extent
to which technology will displace, modify or create
future jobs (Arntz, Gregory, & Zierahn, 2017;
Autor, 2015; Autor, Dorn, & Hanson, 2015; Frey &
Osborne, 2017). This is often expressed in
statements such as “Robots will destroy our jobs –
and we’re not ready for it” (Shewan, 2017) and
“The long-term jobs killer is not China. It’s
automation”. (Miller, 2016), A survey of Deposit
Money Banks (DMBs) in Lagos by Atiku, Genty,
and Akinlabi (2011), found that the adoption of
ATMs and other e-payment platforms have led to
job instability and employee turnover in the
Nigerian banking sector.
A high turnover rate is problematic and has an
impact on organization’s performance and
competitiveness (Asamoah, Doe, & Amegbe, 2014).
Thus, the debate among labor economists has been
“What are the real effects of technology on
employment in particular?” (Vermeulen,
Kesselhut, Pyka, & Saviotti, 2018). Scholars have
shown a direct effect of automation on customers’
satisfaction and sustainable competitive advantage
w h i c h d i r e c t l y t r a n s l a t e s t o i m p r o v e d
organizational performance (Atiku, Genty, &
Akinlabi, 2011). However existing studies have
failed to address the issue of employee turnover
that arises from automation and its consequent
effect on organizational performance. However,
Amity Business ReviewVol. 21, No. 1, January - June, 2020

3
Job Automation, Employee Turnover and Organizational Performance: A Study of Deposit Money Banks (DMBs) in Anambra State
high turnover rate is contradictory to high
performance because it shows that one of the core
conditions of high performance – i.e. a highly
committed workforce – is not met (Glebbeek &
Bax, 2002). This was further elucidated by Ahmed,
Sabir, Khosa, Ahmad, and Bilal (2016, p. 88), when
they stated that ‘economic, psychological and
organizational consequences are symptomatic of
the complexity of employee turnover’. Therefore,
t h e l i n k b e t w e e n j o b a u t o m a t i o n a n d
organizational performance may be due to
intervening variables and therefore requires a
broader analysis of potential mediating effect of
employee turnover. Few studies have examined
the possibility that employees are usually
apprehensive about technological change and
encroachment into work life (McClure, 2018).
Objectives of the Study
The primary objective of this study is to examine
the interrelationship between job automation,
e m p l o y e e t u r n o v e r a n d o r g a n i z a t i o n a l
performance of Deposit Money Banks in Anambra
State, Nigeria. The specific objectives of the study
are therefore as follows:
1. To examine the relationship between job
automation and employee dismissal by the
banks.
2. To determine the relationship between job
automation and customer satisfaction by the
banks.
3. To evaluate the mediating effect of employee
dismissal on the relationship between job
automation and customer satisfaction by the
banks.
Research Questions
The following research questions were raised in
line with the objectives stated above:
1. What is the nature of the relationship between
job automation and employee dismissal by the
banks?
2. What is the nature of the relationship between
job automation and customer satisfaction by
the banks?
3. To what extent does employee dismissal
mediate the effect of job automation on
customer satisfaction by the banks?
Hypotheses of the Study
The following hypotheses were formulated to
guide the researcher in line with the objectives
stated above:
H : There is a significant relationship between job 1
automation and employee dismissal by the
banks.
H : There is a significant relationship between job 2
automation and customer satisfaction bythe banks.
H : Employee dismissal mediates the relationship 3
between job automation and customer satisfaction
by the banks.
Significance of the Study
The study would be beneficial to several
stakeholder groups both within and outside the
organization; such as, the Business (Academic)
Literature: The findings of this study are expected
to contribute to available literature on job
automation, employee turnover and organizational
performance nexus of bank employees. The study
is expected to serve as a source of vital and useful
information for other researchers who might wish
to embark on similar studies.
Policy makers: Tackling the bane of unemployment
has been at the heart of several policy frameworks
in most African countries. The study by elucidating
the impact of job automation on rate of employee
turnover shall enable policy makers in developing
frameworks to regulate business practices and
human resource strategies across different
industries.
Managers: The findings of the study shall be
beneficial to managers in understanding how job
Amity Business ReviewVol. 21, No. 1, January - June, 2020

4
Job Automation, Employee Turnover and Organizational Performance: A Study of Deposit Money Banks (DMBs) in Anambra State
automation which causes employee turnover may
transcend to organizational performance either by
decreasing employee morale or causing customer
boycott of products.
REVIEW OF RELATED LITERATUREConceptual Review
Job Automation
According to the International Society of
Automation [ISA] (2020) automation may be
defined as “the creation and application of
technology to monitor and control the production
and delivery of products and services”. In the
words of Groover (2007) automation refers to the
technology via which a procedure or process is
executed without the intervention of human (or
minimal human intervention). In the banking
sector, examples of ICT processes being utilised by
banks include: mobile telephony, facsimile,
wireless radio phone, Very Small Aperture
Terminal satellite (VSAT), Automated Teller
Machine (ATM), internet banking and Local Area
Network (LAN) among other (Idowu, Aliu &
Adagunodo, 2002; Salawu & Salawu, 2007; Ugwu,
1999).
The International Society of Automation [ISA]
(2020) notes that automation provided several
benefits to industries, such as:
• M a n u f a c t u r i n g , i n c l u d i n g f o o d a n d
pharmaceutical, chemical and petroleum, pulp
and paper;
• Transportation, including automotive,
aerospace, and rail;
• Utilities, including water and wastewater,
o i l a n d g a s , e l e c t r i c p o w e r , a n d
telecommunications;
• Facility operations, including security,
environmental control, energy management,
safety, and other building automation; and,
many others.
According to Agboola (2003) automation in
Nigeria’s banking industry has been reflected in
areas, such as:
1. Bankers Automated Dreaming Services. This
involves the use of Magnetic Ink Character
Reader (MICR) for cheques processing. It is
capable of encoding, reading and sorting
cheques.
2. Automated Payment System: Devices used
here include Automated Teller Machine
(ATM), Plastic Cards, and Electronic Fund
Transfer.
3. Automated Delivery Channels: These include
interactive television and the internet.
Employee Turnover
Employee turnover refers to the rate of change in
the workforce of an organization over a given
period of time (Msafiri, 2013). According to Radzi,
Ramley, Salehuddin, Othman, and Jalis (2009)
employee turnover refers to an individual’s
perception of the possibility of leaving an
organization or withdrawing from an organization
permanently. Armstrong (2006) defined it as the
time-to-time changes in the composition of the
workforce that result from hiring, release and
replacement of employees. Employee turnover is a
measure of the extent to which employees leave
and new employees enter the service of concern
(Gupta, 2003). Muntaner, Benach, Hadden,
Gimeno, and Benavides (2006) offered a concise
explanation of employee turnover:
“Employee turnover occurs when workers leave
their positions in organizations. Their reasons for
leaving jobs are a measure of employee morale.
The rate of employee turnover is one measure of
the commitment of employees to organizational
goals. Turnover is determined partly by
organizational policy and management through
factors such as salary, benefits, promotions,
training and work schedules, and partly by
personal factors that are largely beyond employer’s
Amity Business ReviewVol. 21, No. 1, January - June, 2020
5
Job Automation, Employee Turnover and Organizational Performance: A Study of Deposit Money Banks (DMBs) in Anambra State
control – for example, an employee’s desire to
relocate”.
Labor turnover refers to the rate of change in the
workforce of an enterprise during a given period.
It has been defined as the time-to-time changes in
the composition of the workforce that result from
hiring, release and replacement of employees M,
Armstrong (2006). C.B Gupta (2003) defined
Labour turnover as a measure of the extent to
which employees leave and new employees enter
the service of concern. According to Schultz (2008)
employee turnover refers to the movement of
employees in and out of the boundaries of an
organization. The author further distinguished
between controllable and uncontrollable turnover.
Controllable turnover includes both voluntary
res ignat ions and d ismissa ls . Voluntary
resignations are controllable because management
can offer better wages, working conditions and
opportunities to retain employees, while dismissals
are controllable because management can use more
constructive strategies, such as training,
unambiguous policies on discipline and coaching,
to shape an employee’s behavior to a desired level
rather than dismissing the employee. While
Uncontrollable staff turnover refers to turnover
which is outside the control of management, such
as turnover as a result of death, retrenchments and
incapacity. Involuntary turnover occurs when an
organization dismisses or retrenches its employees
because their services are no longer needed (Fisher,
Schoenfeldt, & Shaw, 2003).
Costs/Consequences of Employee Turnover
Generally, all costs related to the leaving and
replacement of employees can be considered to be
costs of labour turnover (Glebbeek & Bax, 2002).
Mungumi (2002) in her study outlined the
following as the consequences of labor turnover.
Hiring costs involving time and facilities for
recruitment, interviewing and examining a
replacement, secondly, the scrap and waste rates
climb when new employees are involved, thirdly,
over time pay may result from excessive number of
separations, causing trouble in meeting contract
delivery dates. Fourthly, training cost involving
the time of supervisor’s, personnel department and
trainees.
Other reasons include; higher accident rates for
new employees, loss of production in the interval
between separation of the old employees and
replacement, lack of utilizing the production
equipment during the hiring interval and the
training period, administrative costs of removing
from and adding to payroll, loss of highly qualified
employees, decreased commitment to those
employees remaining in the organization and loss
of employees who have the potential for
advancement deprives the organization of future
opportunities for promotion from within.
The positive consequences of labor turnover are;
less stress and better use of skills and renewed
interest in work for those who leave, financial
advantage; increased innovation, cross breeding
between old and new employees, separation
creates opportunities to hire from diverse
background and to redistribute the cultural and
gender composition of the workforce, career
opportunities elsewhere for those who leave,
reduced labor costs, replacement of poor
performance, infusion of new knowledge by new
employees, stimulates change in bad policies and
increased satisfaction for those who stay.
Organizational Performance
Organizational performance comprises of the
actual output or results of an organization as
measured against its intended outputs (or goals
and objectives) (Msafiri, 2013). Richard, McMillan-
Capehart, Bhuian, and Taylor (2009) opined that it
involves the recurring activities to establish
organizational goals, monitor progress towards
such goals, and make adjustments to achieve those
goa l s more e f fec t ive ly and e f f i c i en t ly .
Organizational performance comprises the actual
output or results of an organization as measured
Amity Business ReviewVol. 21, No. 1, January - June, 2020

Job Automation, Employee Turnover and Organizational Performance: A Study of Deposit Money Banks (DMBs) in Anambra State
against its intended outputs (or goals and
objectives) (Richard, McMillan-Capehart, Bhuian,
& Taylor, 2009).
Richard, Devinney, Yip, and Johnson (2009)
posited that performance “encompasses three
specific areas of firm outcomes: (1) financial
performance (profits, return on assets, return on
investment, etc.); (2) market performance (sales,
market share, etc.); and (3) shareholder return
(total shareholder return, economic value added,
etc.).” According to Moullin (2003), performance
refers to “the value the organization delivers for
customers and other stakeholders”; while, Combs,
Crook, and Shook (2005) view performance as “the
economic outcomes resulting from the interplay
among an organization’s attributes, actions, and
environment.
However, despite the multiplicity of definitions, a
more comprehensive definition was offered by
Tang and Liou (2010). According to them,
performance entails the extent a firm achieves both
financial and non-financial goals relative to its
competitors (Tang & Liou, 2010). Organizational
performance is influenced by the skills, ability,
knowledge, competencies, and experiences of the
available workforce in the organization (Msafiri,
2013).
Amity Business ReviewVol. 21, No. 1, January - June, 2020
6
The Figure shown above provides a summary of
the conceptual framework for the study, where by
the arrows indicates two variables i.e. Independent
variable-labour turnover with its impacts, and
dependent variable that is organizational
performance with its criteria’s. Thus the end result
of independent variable (labour turnover) has a
direct negative impact on dependent variable
(organizational performance). Each performance
criteria is directly linked to a certain impact of
labour turnover as shown by the arrow in the
sketch above. Labour turnover is commonly
measured by staff turnover rate (LTR). The LTR
gives an indication of the percentage of employees
that leave the organization over a period of time.
The study is further guided by the systems theory.
And organizations are open systems which take
inputs “from the environment (output from other
system) and through a series of activities transform
or convert these inputs into output (input to other
systems) to achieve some objectives” (Atiku,
Genty, & Akinlabi, 2011).
Empirical Review
Studies on Job Automation
McClure (2018) conducted a study titled ‘The rise
of automation in the workplace, technophobes, and
Conceptual Framework
Source: Authors Conceptualisation (2020)
Employee Turnover
Job Automation
Organisational Performance
7
Job Automation, Employee Turnover and Organizational Performance: A Study of Deposit Money Banks (DMBs) in Anambra State
fears of unemployment’. The study utilised a
survey approach. The sample and primary data
were obtained from Wave 2 of the Chapman
Survey of American Fears (N = 1,541). The results
showed that technophobes were more likely than
nontechnophobes to report experiencing anxiety-
r e l a t e d m e n t a l h e a l t h i s s u e s a n d f e a r
unemployment and financial insecurity.
Kimutai and Kwambai (2017) conducted a study
titled ‘Effect of office automation on organizational
effectiveness of public universities in Kenya’.
The study adopted the survey research design.
The sample comprised of 65 senior staff members
in the University of Eldoret. The study relied on
pr imary data co l lec ted v ia the use o f
questionnaires. The data were analyzed using
descriptive statistics and multiple regression
analysis. The results showed a significant positive
relationship between office automation and
organizational effectiveness.
Sirohey, Hunjra, and Khalid (2012) undertook a
study titled ‘Impact of business process
automation on employees’ efficiency’. The sample
comprised of 265 employees in Accountant
General of Pakistan Revenues [AGPR] and the
Ministry of Finance, the Controller General of
Accounts and Line Ministries. The study relied on
primary data; obtained from a structured
questionnaire. The data were analysed using
descriptive, Pearson correlation and regression
analysis. The results showed that business process
automation (i.e., understanding of new system,
response to change, adaptation to new technology,
and conformity to standards) have a significant
association with employee efficiency.
Atiku, Genty, and Akinlabi (2011) conducted a
study titled ‘Effect of electronic banking on
employees’ job security in Nigeria’. The study
adopted the descriptive survey research design.
The sample comprised of 400 employees randomly
selected from four DMBs in Lagos State. The study
relied on primary data; generated via a structured
questionnaire administered to the respondents.
The data were analysed using descriptive statistics
and the hypothesis tested using Chi-square test of
independence. The results proved that the
adoption of e-banking in the banks led to loss of
job and early retirement of employees.
Agboola (2003) undertook a study titled
‘Information technology, bank automation, and
attitude of workers in Nigerian banks’. The study
utilised a survey approach. The primary data were
collected from six commercial banks randomly
chosen from Lagos. The author distributed a total
of 60 questionnaires to the staff of the six banks.
The study also relied on oral interview to
corroborate and augment information generated
from the questionnaires. The data were analysed
using descriptive and inferential statistics. The
results showed that the application of Information
Technology (IT) has greatly affected personnel
requirements in the banks. Sixty six percent of the
employees (66%) claimed that automation of
banking services has altered the required skill in
favour of those that are computer literate in the
banking environment. This has heightened the fear
of redundancy and retrenchment among workers
from fields that are less related to banking.
Studies on Employee Turnover
Kwame, Mahama, Boahen, and Denu (2017)
conducted a study titled ‘The effect of employee
turnover on the performance of Zoomlion Ghana
Limited’. The study employed the descriptive cross
sectional survey approach. The sample comprised
of 120 employees purposively chosen from
Zoomlion Ghana Limited. The study utilized
primary data; obtained via questionnaires. The
data were analyzed using descriptive and
inferential statistics. The results showed that lack
of motivation, lack of good working conditions,
and lack of recognition of one’s effort were top
three causes of labour turnover in Zoomlion Ghana
Limited. Secondly, factors such as loss of
Amity Business ReviewVol. 21, No. 1, January - June, 2020

8
Job Automation, Employee Turnover and Organizational Performance: A Study of Deposit Money Banks (DMBs) in Anambra State
productivity, reduced profitability, and high cost
of training and recruiting new employees were
among several effects of labour turnover on
organizational performance.
Ahmed, Sabir, Khosa, Ahmad, and Bilal (2016)
conducted a study titled ‘Impact of employee
turnover on organizational effectiveness in
telecommunication sector of Pakistan’. The study
utilized a survey research design. The sample
comprised of 250 respondents from 25 telecom
centers situated in District D.G. Khan and Multan
in Pakistan. The primary data was obtained via
administering a structured questionnaire. The data
were analyzed using Pearson correlation
coefficient and multiple regression technique. The
results showed that employee turnover depending
upon factors such as (firm stability, pay level,
industry, work situation, training and supervision)
h a v e a s i g n i f i c a n t p o s i t i v e i m p a c t o n
organizational effectiveness.
Asamoah, Doe, and Amegbe (2014) conducted
a study titled ‘The effect of employee turnover
on the performance and competitiveness of banks
in Ghana’. The study adopted the cross sectional
survey research design. The sample comprised
of 480 employees from 15 selected banks in
Ghana. The study relied on primary data. The
data were analyzed using descriptive, independent
samples t-test and Pearson product moment
correlation analysis. The results showed that
banks with low employee turnover perform
better and more competitive than banks with
high employee turnover. Secondly, highly
motivated employees have a lower turnover
intention than less motivated employees; and, job
rank had a significant impact on employee
turnover intentions. Lastly, gender, age and job
tenure have no significant effect on turnover
intentions.
Glebbeek and Bax (2002) undertook a study titled
‘Labor turnover and its effects on performance: An
empirical test using firm data’. The study used
secondary data from official statistical records of
110 offices. The data was obtained from a
temporary job agency, located in the Netherlands
over the years 1995 to 1998. The data were
analyzed using multiple regression technique. The
results showed that labor turnover is related to
office performance in a curvilinear pattern.
METHODOLOGYResearch Design
The study adopts the descriptive survey research
design. This research design is concerned with
gathering information on prevailing conditions
or situations of interest for the purpose
of description and interpretation (Salaria, 2012).
The design is considered appropriate because the
study used a questionnaire to obtain data in order
to describe and draw inferences on the
relationships, between the variables of job
automation, employee turnover and organizational
performance.
Area of the Study
The study was conducted in Anambra State.
Anambra State is one of the five states in
South-East geo-political zone of Nigeria. The state
shares borders with Enugu and Imo States with a
total of one hundred and eighty-one (181) towns.
Population of the Study
The population is a group of elements or cases,
which could be individuals, objects, or events, that
conform to specific criteria and to which we intend
to generalize the results of the research (McMillan
& Schumacher, 2001). The population for the study
comprised of eighty (80) senior staff in eight (8)
Deposit Money Banks (DMBs) in Nnamdi Azikiwe
University, Awka.
Amity Business ReviewVol. 21, No. 1, January - June, 2020
9
Job Automation, Employee Turnover and Organizational Performance: A Study of Deposit Money Banks (DMBs) in Anambra State
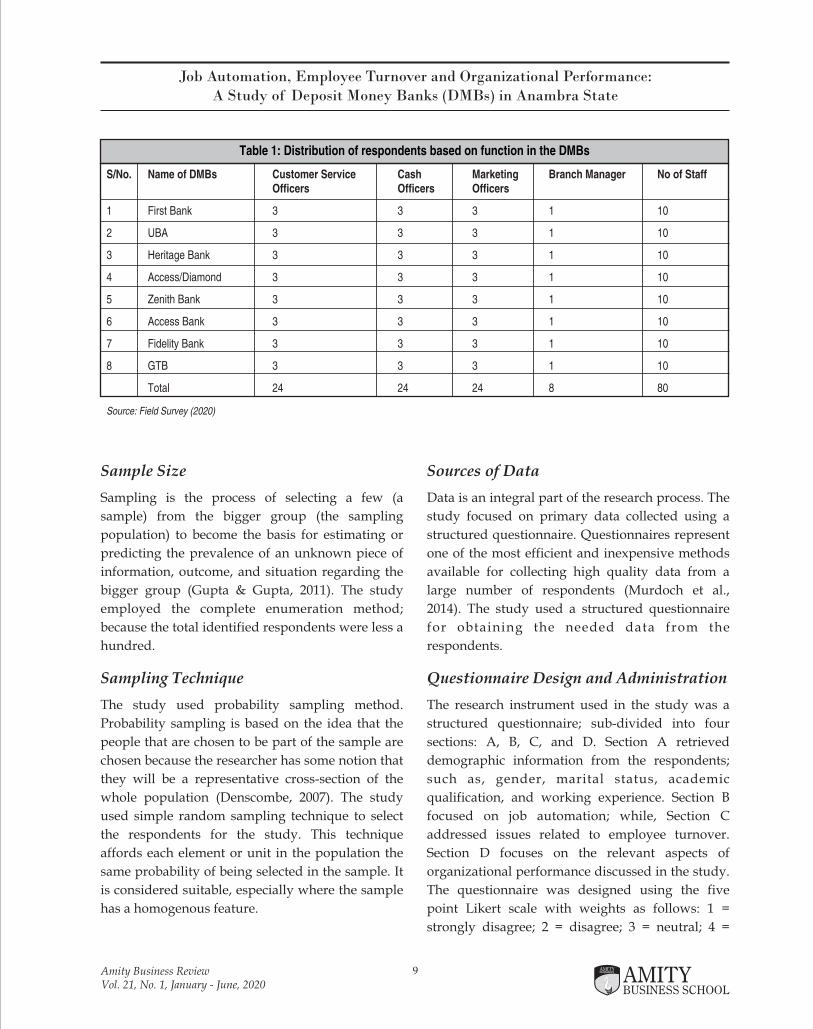
Sample Size
Sampling is the process of selecting a few (a
sample) from the bigger group (the sampling
population) to become the basis for estimating or
predicting the prevalence of an unknown piece of
information, outcome, and situation regarding the
bigger group (Gupta & Gupta, 2011). The study
employed the complete enumeration method;
because the total identified respondents were less a
hundred.
Sampling Technique
The study used probability sampling method.
Probability sampling is based on the idea that the
people that are chosen to be part of the sample are
chosen because the researcher has some notion that
they will be a representative cross-section of the
whole population (Denscombe, 2007). The study
used simple random sampling technique to select
the respondents for the study. This technique
affords each element or unit in the population the
same probability of being selected in the sample. It
is considered suitable, especially where the sample
has a homogenous feature.
Sources of Data
Data is an integral part of the research process. The
study focused on primary data collected using a
structured questionnaire. Questionnaires represent
one of the most efficient and inexpensive methods
available for collecting high quality data from a
large number of respondents (Murdoch et al.,
2014). The study used a structured questionnaire
for obtaining the needed data from the
respondents.
Questionnaire Design and Administration
The research instrument used in the study was a
structured questionnaire; sub-divided into four
sections: A, B, C, and D. Section A retrieved
demographic information from the respondents;
such as, gender, marital status, academic
qualification, and working experience. Section B
focused on job automation; while, Section C
addressed issues related to employee turnover.
Section D focuses on the relevant aspects of
organizational performance discussed in the study.
The questionnaire was designed using the five
point Likert scale with weights as follows: 1 =
strongly disagree; 2 = disagree; 3 = neutral; 4 =
Amity Business ReviewVol. 21, No. 1, January - June, 2020
Table 1: Distribution of respondents based on function in the DMBs
S/No. Name of DMBs Customer Service Cash Marketing Branch Manager No of StaffOfficers Officers Officers
1 First Bank 3 3 3 1 10
2 UBA 3 3 3 1 10
3 Heritage Bank 3 3 3 1 10
4 Access/Diamond 3 3 3 1 10
5 Zenith Bank 3 3 3 1 10
6 Access Bank 3 3 3 1 10
7 Fidelity Bank 3 3 3 1 10
8 GTB 3 3 3 1 10
Total 24 24 24 8 80
Source: Field Survey (2020)
10
Job Automation, Employee Turnover and Organizational Performance: A Study of Deposit Money Banks (DMBs) in Anambra State
agree; 5 = strongly agree. The instrument was
administered to the employees of the selected
Deposit Money Banks (DMBs) in Awka metropolis.
Pilot Testing
The questionnaire was pilot tested on a sample of
20 respondents from four DMBs located in Nnamdi
Azikiwe University, Awka, Anambra State. The
individuals were selected based on their familiarity
with the research objectives and did not partake in
the final research (Frazer & Lawley, 2000). Having
received feedback, changes were made in the
wording of questions, layout, sequential methods
and validity before the final copy of the
questionnaire was administered (Collis & Hussey,
2009).
Reliability of Instrument
Reliability ensures that a measure is free from error
and has consistent result (Zikmund, 2003). The
reliability of the instrument was determined using
Cronbach Alpha. The Cronbach Alpha (α) is one
the most popular measures of reliability in survey
studies and measures how closely related a set of
items are as a group. By way of reducing method
bias, different scales were used to measure the
items. The formula of α is given as follows: X = Y1
+ Y2……. + YK
Cronbach alpha a is defined as a =
Where a2 X the variance of the observed total
test scores and
a2 Y The variance of component I for the
current sample of persons.
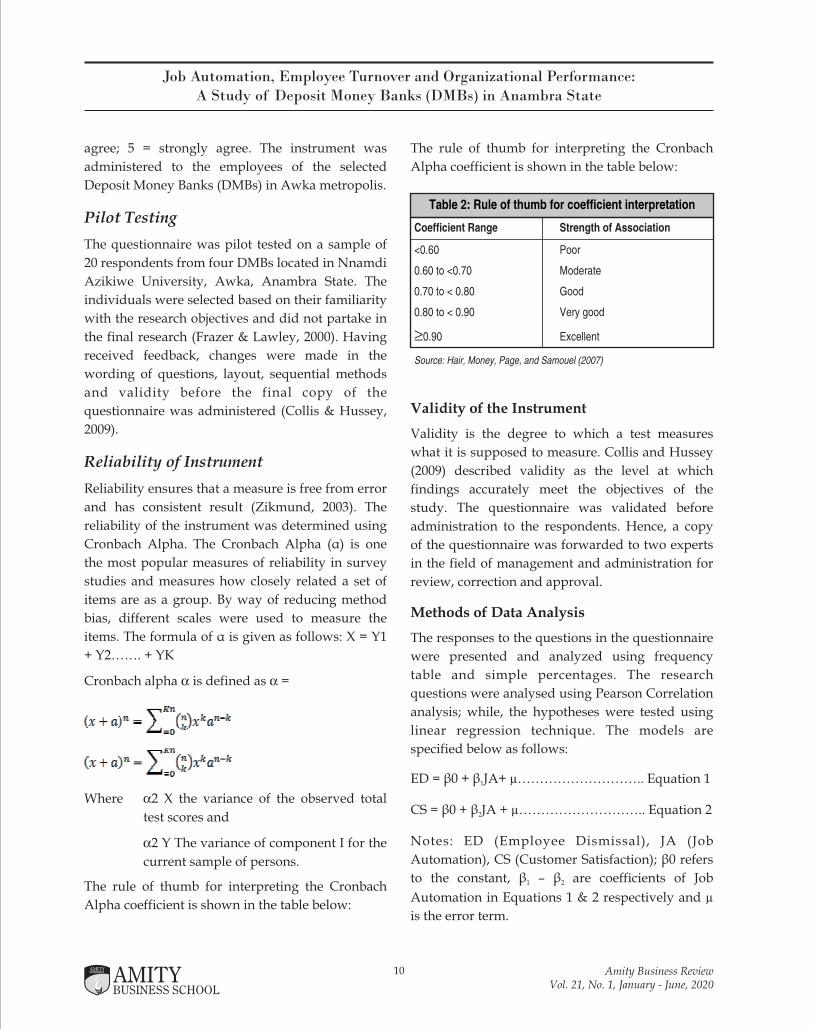
The rule of thumb for interpreting the Cronbach
Alpha coefficient is shown in the table below:
The rule of thumb for interpreting the Cronbach
Alpha coefficient is shown in the table below:
Amity Business ReviewVol. 21, No. 1, January - June, 2020
Table 2: Rule of thumb for coefficient interpretation
Coefficient Range Strength of Association
<0.60 Poor
0.60 to <0.70 Moderate
0.70 to < 0.80 Good
0.80 to < 0.90 Very good
³0.90 Excellent
Source: Hair, Money, Page, and Samouel (2007)
Validity of the Instrument
Validity is the degree to which a test measures
what it is supposed to measure. Collis and Hussey
(2009) described validity as the level at which
findings accurately meet the objectives of the
study. The questionnaire was validated before
administration to the respondents. Hence, a copy
of the questionnaire was forwarded to two experts
in the field of management and administration for
review, correction and approval.
Methods of Data Analysis
The responses to the questions in the questionnaire
were presented and analyzed using frequency
table and simple percentages. The research
questions were analysed using Pearson Correlation
analysis; while, the hypotheses were tested using
linear regression technique. The models are
specified below as follows:
ED = β0 + β JA+ µ……………………….. Equation 11
CS = β0 + β JA + µ……………………….. Equation 22
Notes: ED (Employee Dismissal), JA (Job
Automation), CS (Customer Satisfaction); β0 refers
to the constant, β – β are coefficients of Job 1 2
Automation in Equations 1 & 2 respectively and µ
is the error term.

11
Job Automation, Employee Turnover and Organizational Performance: A Study of Deposit Money Banks (DMBs) in Anambra State
DATA PRESENTATION AND ANALYSIS The total number of questionnaire distributed was
eighty (80); of this a total of seventy five were
retrieved (75). This represented approximately
ninety-four (93.75%) percent success rate; and, was
considered sui table for the s tudy. The
demographic information of the respondents is
shown in the table below.
Table 3 above shows that 54.7% of the respondents
who participated in the study were males and
45.3% were females. Of the total respondents,
28.0%, were below 30 years of age, 36.0% were
between 31-45 years of age, 25.3% were between
46-55 years of age, and 10.7% were above 56 years
of age respectively. The marital status of the
respondents showed that 25.3% were single, 64.0%
were married; while, 10.7% were divorced /
deceased. The highest educational level of the
respondents showed that majority of them had first
degree, giving 61.3%. The MSc holders were 25.3%;
while, PhD holders were nil. Lastly, the OND
holders were 13.3%. The last demographic variable
was years of work experience of the respondents,
this showed that 25.3% worked for the DMBs
between 1-5 years; 48.0% worked between 6 – 10
years, 14.7% worked for the DMBs between 11 – 15
years; while, 12.0% worked for the company for 16
years and above.
The reliability of the instrument was tested using
Cronbach Alpha (α), it reveals how reliable are the
components of the questionnaire. The result of
reliability test is known as the Cronbach's Alpha
derived by Cronbach in 1951.
Amity Business ReviewVol. 21, No. 1, January - June, 2020
Table 3: Demographic profile of the respondents
Characteristic Frequency Percentage
Gender: Male 41 54.7%Female 34 45.3%
Age: Under 30 years 21 28.0%31 – 45 years 27 36.0%46 – 55 years 19 25.3%56 & Above 8 10.7%
Marital status: Single 19 25.3%Married 48 64.0%Divorced/Deceased 8 10.7%
Highest Academic Qualification: OND 10 13.3%HND/BSc (First degree) 46 61.3%MSc 19 25.3%PhD - -
Years of work experience: 1 - 5 years 19 25.3%6 – 10 years 36 48.0%11 – 15 years 11 14.7%16 & Above 9 12.0%
Source: Field Survey (2020)
Table 4: Reliability coefficient of the instrument
N Cronbach Alpha (α)
Job automation: 5 .701Employee dismissal: 5 .706Customer satisfaction: 5 .740
Source: SPSS Ver. 24
12
Job Automation, Employee Turnover and Organizational Performance: A Study of Deposit Money Banks (DMBs) in Anambra State
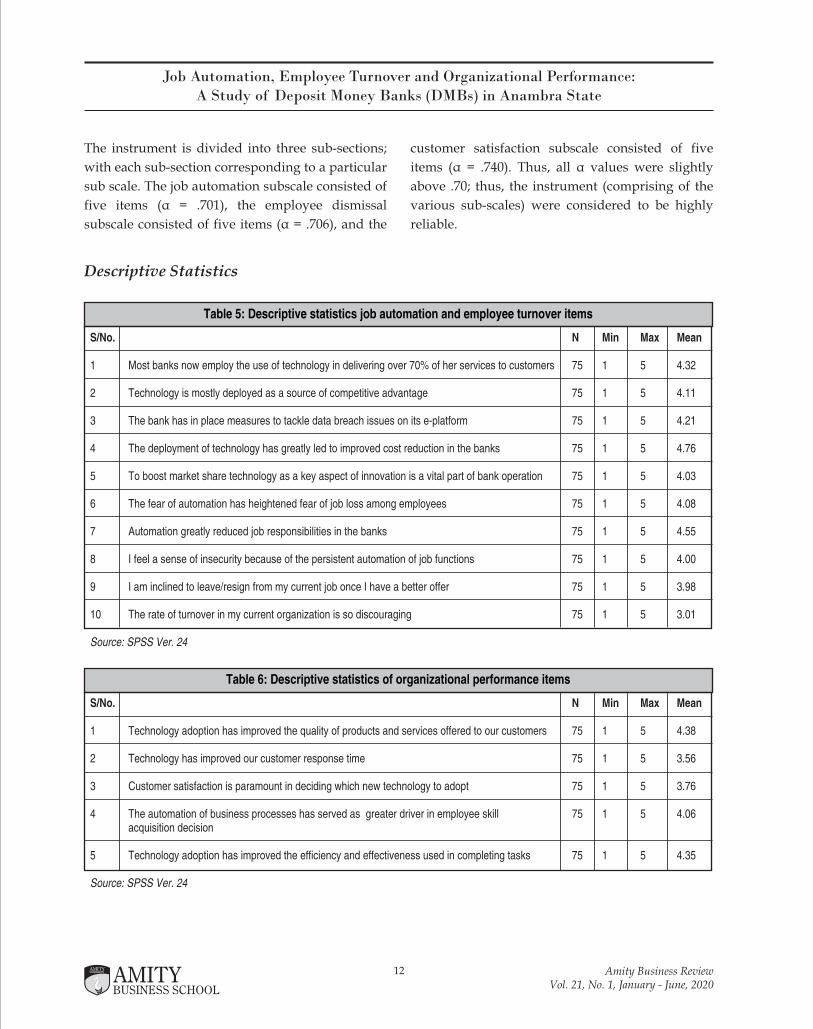
The instrument is divided into three sub-sections;
with each sub-section corresponding to a particular
sub scale. The job automation subscale consisted of
five items (α = .701), the employee dismissal
subscale consisted of five items (α = .706), and the
customer satisfaction subscale consisted of five
items (α = .740). Thus, all α values were slightly
above .70; thus, the instrument (comprising of the
various sub-scales) were considered to be highly
reliable.
Amity Business ReviewVol. 21, No. 1, January - June, 2020
Descriptive Statistics
Table 5: Descriptive statistics job automation and employee turnover items
S/No. N Min Max Mean
1 Most banks now employ the use of technology in delivering over 70% of her services to customers 75 1 5 4.32
2 Technology is mostly deployed as a source of competitive advantage 75 1 5 4.11
3 The bank has in place measures to tackle data breach issues on its e-platform 75 1 5 4.21
4 The deployment of technology has greatly led to improved cost reduction in the banks 75 1 5 4.76
5 To boost market share technology as a key aspect of innovation is a vital part of bank operation 75 1 5 4.03
6 The fear of automation has heightened fear of job loss among employees 75 1 5 4.08
7 Automation greatly reduced job responsibilities in the banks 75 1 5 4.55
8 I feel a sense of insecurity because of the persistent automation of job functions 75 1 5 4.00
9 I am inclined to leave/resign from my current job once I have a better offer 75 1 5 3.98
10 The rate of turnover in my current organization is so discouraging 75 1 5 3.01
Source: SPSS Ver. 24
Table 6: Descriptive statistics of organizational performance items
S/No. N Min Max Mean
1 Technology adoption has improved the quality of products and services offered to our customers 75 1 5 4.38
2 Technology has improved our customer response time 75 1 5 3.56
3 Customer satisfaction is paramount in deciding which new technology to adopt 75 1 5 3.76
4 The automation of business processes has served as greater driver in employee skill 75 1 5 4.06acquisition decision
5 Technology adoption has improved the efficiency and effectiveness used in completing tasks 75 1 5 4.35
Source: SPSS Ver. 24

Table 9: Mediating effect of employee dismissal
Parameter Estimate Lower Upper
Estimand 1 W1*W2 JAàEDàCS -.451 -.842 1.218
Source: IBM SPSS Amos ver. 22
The mediating effect of employee dismissal [Estimand 1], showed a negative coefficient.
13
Job Automation, Employee Turnover and Organizational Performance: A Study of Deposit Money Banks (DMBs) in Anambra State
Analysis of Research Questions
Research question one: What is the nature of the relationship between job automation and employee
dismissal by the banks?
Amity Business ReviewVol. 21, No. 1, January - June, 2020
Table 7: Relationship between job automation and employee dismissal
Correlation Coefficient
Job automation and employee dismissal: .698**
N 75
Source: SPSS Ver. 24
**. Correlation is significant at the 0.01 level (2-tailed).
The Pearson Correlation Coefficient had a significant positive value .698 (p<.05); thus, the nature of
relationship between job automation and employee dismissal is significant and positive. Therefore, as
banks automate more of their job processes the likelihood of employee dismissal rises simultaneously.
Research question two: What is the nature of the relationship between job automation and customer
satisfaction by the banks?
Table 8: Relationship between job automation and customer satisfaction
Correlation Coefficient
Job automation and customer satisfaction: .887**
N 75
Source: SPSS Ver. 24
**. Correlation is significant at the 0.01 level (2-tailed).
The Pearson Correlation Coefficient had a significant positive value .887 (p<.05); thus, the nature of
relationship between job automation and customer satisfaction is significant and positive. Therefore, the
automation of several bank processes improved the satisfaction of customers with the banks products and
services.
Research question three: To what extent does employee dismissal mediate the effect of job automation on
customer satisfaction by the banks?
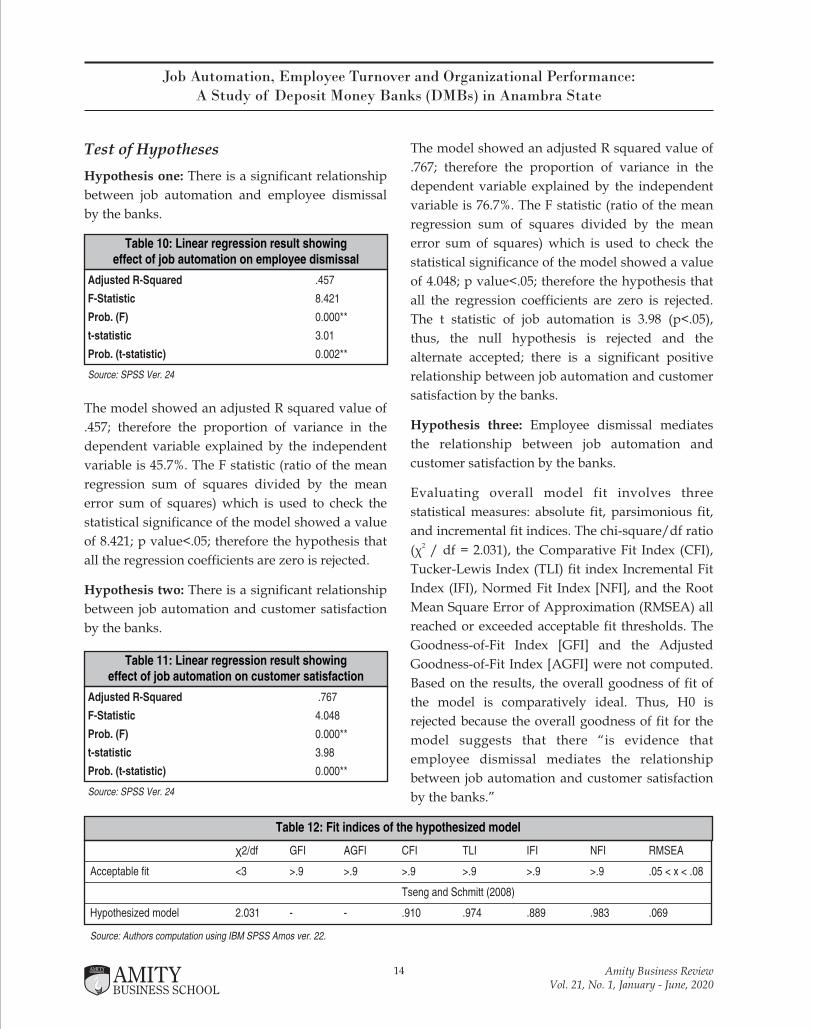
Table 12: Fit indices of the hypothesized model
χ2/df GFI AGFI CFI TLI IFI NFI RMSEA
Acceptable fit <3 >.9 >.9 >.9 >.9 >.9 >.9 .05 < x < .08
Tseng and Schmitt (2008)
Hypothesized model 2.031 - - .910 .974 .889 .983 .069
Source: Authors computation using IBM SPSS Amos ver. 22.
14
Job Automation, Employee Turnover and Organizational Performance: A Study of Deposit Money Banks (DMBs) in Anambra State
Test of Hypotheses
Hypothesis one: There is a significant relationship
between job automation and employee dismissal
by the banks.
Amity Business ReviewVol. 21, No. 1, January - June, 2020
Table 10: Linear regression result showing effect of job automation on employee dismissal
Adjusted R-Squared .457
F-Statistic 8.421
Prob. (F) 0.000**
t-statistic 3.01
Prob. (t-statistic) 0.002**
Source: SPSS Ver. 24
The model showed an adjusted R squared value of
.457; therefore the proportion of variance in the
dependent variable explained by the independent
variable is 45.7%. The F statistic (ratio of the mean
regression sum of squares divided by the mean
error sum of squares) which is used to check the
statistical significance of the model showed a value
of 8.421; p value<.05; therefore the hypothesis that
all the regression coefficients are zero is rejected.
Hypothesis two: There is a significant relationship
between job automation and customer satisfaction
by the banks.
Table 11: Linear regression result showing effect of job automation on customer satisfaction
Adjusted R-Squared .767
F-Statistic 4.048
Prob. (F) 0.000**
t-statistic 3.98
Prob. (t-statistic) 0.000**
Source: SPSS Ver. 24
The model showed an adjusted R squared value of
.767; therefore the proportion of variance in the
dependent variable explained by the independent
variable is 76.7%. The F statistic (ratio of the mean
regression sum of squares divided by the mean
error sum of squares) which is used to check the
statistical significance of the model showed a value
of 4.048; p value<.05; therefore the hypothesis that
all the regression coefficients are zero is rejected.
The t statistic of job automation is 3.98 (p<.05),
thus, the null hypothesis is rejected and the
alternate accepted; there is a significant positive
relationship between job automation and customer
satisfaction by the banks.
Hypothesis three: Employee dismissal mediates
the relationship between job automation and
customer satisfaction by the banks.
Evaluating overall model fit involves three
statistical measures: absolute fit, parsimonious fit,
and incremental fit indices. The chi-square/df ratio 2(χ / df = 2.031), the Comparative Fit Index (CFI),
Tucker-Lewis Index (TLI) fit index Incremental Fit
Index (IFI), Normed Fit Index [NFI], and the Root
Mean Square Error of Approximation (RMSEA) all
reached or exceeded acceptable fit thresholds. The
Goodness-of-Fit Index [GFI] and the Adjusted
Goodness-of-Fit Index [AGFI] were not computed.
Based on the results, the overall goodness of fit of
the model is comparatively ideal. Thus, H0 is
rejected because the overall goodness of fit for the
model suggests that there “is evidence that
employee dismissal mediates the relationship
between job automation and customer satisfaction
by the banks.”
15
Job Automation, Employee Turnover and Organizational Performance: A Study of Deposit Money Banks (DMBs) in Anambra State
Discussion of Findings
The first hypothesis showed that there is a
significant positive relationship between job
automation and employee dismissal in the banks.
This supports the study by Atiku, Genty, and
Akinlabi (2011) in Lagos State, Nigeria that found
that the adoption of e-banking in various banks led
to loss of job and/or early retirement of employees.
More so, studies have shown that an increase in
automation cause greater employee anxiety and
fear of unemployment as documented in the study
by McClure (2018) in the U.S.A. This was also
supported in the study by Agboola (2003) on a
survey of employees of six commercial banks
located in Lagos, reported that automating banking
services heightened the fear of redundancy and
retrenchment among workers.
The second hypothesis revealed a significant
positive relationship between job automation and
customer satisfaction by the banks. This is because
studies have proven that automation increases the
efficiency of employees and assists organizations
in rendering their objectives. This finding supports
the study by Kimutai and Kwambai (2017) in
Kenya; that found a significant positive effect of
office automation on organizational effectiveness.
Yet another study by Sirohey, Hunjra, and Khalid
(2012) in Pakistan showed that business process
automation had a significant association with
employee efficiency.
The third hypothesis showed that employee
dismissal mediates the relationship between job
automation and customer satisfaction by the banks.
The study by Asamoah, Doe, and Amegbe (2014)
on a sample of banks in Ghana showed that banks
that had low employee turnover performed better
and more competitive than banks with high
employee turnover. This is consistent with the
results as the direct effect of X on Y showed a
positive coefficient; while, the indirect effect of X
on Y (path A= + and path B= -) showed a negative
coefficient. The direct effect is consistent with prior
studies, such as Atiku, Genty, and Akinlabi (2011),
that found a direct effect of automation on
customers’ satisfaction and sustainable competitive
advantage.This is because automation increases
efficiency of employees and assists organizations to
achieve their objectives. Kimutai and Kwambai
(2017) in Kenya found a significant positive effect
o f o f f i ce automat ion on organizat ional
effectiveness.
CONCLUSION AND RECOMMENDATIONSSummary of Findings
The empirical results are briefly summarised below
as follows:
1. There is a significant positive relationship
between job automation and employee
dismissal by the banks (p<.05);
2. There is a significant positive relationship
between job automation and customer
satisfaction by the banks (p<.05) and,
3. Employee dismissal mediates the relationship
between job automation and customer
satisfaction by the banks.
Conclusion
The study examined the interrelationship among
job automation, employee turnover and
organizational performance in Deposit Money
Banks in Awka, Anambra State. Job automation
has been at the center of the 21st century
with many traditional functions been replaced
by machines and robots. The study evaluates
the direct and indirect effect of job automation
on organizational performance. The results
showed that job automation has a significant
positive effect on employee dismissal and
customer satisfaction. The mediation result
showed that employee dismissal mediates the
relationship between job automation and customer
satisfaction of DMBs.
Amity Business ReviewVol. 21, No. 1, January - June, 2020

16
Job Automation, Employee Turnover and Organizational Performance: A Study of Deposit Money Banks (DMBs) in Anambra State
Recommendations
The study makes the following recommendations
based on the major findings from the research:
1. Automation as a necessity: The managers of
contemporary organizations should embrace
technological adoption as a strategic response
to competitive forces in the business
environment. Managers are advised to adopt
technological changes that lower costs and
increase customer satisfaction in comparison
with competitors.
2. Automation should be managed: Managers are
advised to adopt a complementary perspective
during automation of business processes; this,
is because the decline in employee morale that
usually result from workers retrenchment or
displacement may serve as a deterrent to
worker productivity as workers secretly carry
the fear of lay-offs.
3. Managers should encourage employees to
engage in further advanced training and skill
acquisition process in order to avoid the
likelihood of redundancy and out-datedness in
this era of rapid technological advancement.
With advances in robotics and AI, the threat of
technological unemployment is to be
countered with the requisite skill acquisition.
REFERENCESAgboola, A. A. (2003). Information technology, bank
automation, and attitude of workers in Nigerian banks. Journal
of Social sciences, 7(3), 215-222.
Agrawal, A., Gans, J., & Goldfarb, A. (2019). Economic policy
for artificial intelligence. Innovation Policy and the Economy,
19(1), 139-159.
Ahmed, Z., Sabir, S., Khosa, M., Ahmad, I., & Bilal, M. A. (2016).
Impact of employee turnover on organizational effectiveness in
telecommunication sector of Pakistan.IOSR Journal of Business
and Management (IOSR-JBM), 18(11), 88-96.
Armstrong, M. (2006). A Handbook of Human Resource
Management Practice (10th Ed.). London: Kogan Page
Publishers.
Arntz, M., Gregory, T., & Zierahn, U. (2017). Revisiting the risk
of automation. Economics Letters, 1 5 9 ( S u p p l e m e n t
C), 157–160. https://doi.org/10.1016/j.econlet.2017.07.001
Asamoah, E. S., Doe, F., & Amegbe, H. (2014). The effect of
employee turnover on the performance and competitiveness of
banks in Ghana. International Journal of Cotemporary
Management, 13(4), 8-26.
Atiku, S. O., Genty, K. I., & Akinlabi, B. H. (2011). Effect of
electronic banking on employees’ job security in Nigeria.
European Journal of Humanities and Social Sciences, 4(2), 69-84.
Autor, D. H. (2015). Why are there still so many jobs? The
history and future of workplace automation. Journal of
Economic Perspectives, 29(3), 3-30.
https://doi.org/10.1257/jep.29.3.3.
Autor, D. H., Dorn, D., & Hanson, G. H. (2015). Untangling
trade and technology: Evidence from local labour markets. The
Economic Journal, 125(584), 621–646. https://doi.org/
10.1111/ecoj.12245
Bititci, U., Garengo, P., Dörfler, V., & Nudurupati, S. (2012).
Performance measurement:
Challenges for tomorrow. International Journal of Management
Reviews, 14(3), 305-327.
Brynjolfsson, E., & McAfee, A. (2011). Race against the
Machine.” Lexington, MA: Digital Frontier Press.
Camara, A., Rahim, M. Z. B. A., Yusof, Y. B., Tambi, A. M. B. A.,
& Magassouba, S. M. (2019). The effect of automation and
workload on staff productivity in under developing country in
Guinea: A conceptual study. International Journal of Academic
Research in Business and Social Sciences, 9(3), 902-914.
Collis, J., & Hussey, R. (2009). Business Research: A practical
guide for undergraduate and postgraduate students (3rd Ed.)
Hampshire, U.K.: Palgrave Macmillan.
Combs, J. G., Crook, T. R., & Shook, C. L. (2005). The
dimensionality of organizational
performance and its implications for strategic management
research. In D. J. Ketchen
(Eds.), Research methodology in strategy and management, 2
(pp.259-286). Amsterdam: Elsevier.
Denscombe, M. (2007). The Good Research Guide: For Small-
Scale Social Research Projects (3rd Ed.). London: Open
University Press.
de Oliveira Lacerda, R. T., Ensslin, L., & Ensslin, S. R. (2011). A
performance
measurement framework in portfolio management: A
constructivist case. Management
Decision, 49(4), 648-668.
Elena-Iuliana, I., & Maria, C. (2016). organizational
performance-A concept that self-seeks to find itself. Annals of
'Constantin Brancusi' University of Targu-Jiu. Economy Series,
(4), 179-183.
Amity Business ReviewVol. 21, No. 1, January - June, 2020

17
Job Automation, Employee Turnover and Organizational Performance: A Study of Deposit Money Banks (DMBs) in Anambra State
Ford, M. (2015). The Rise of the Robots: Technology and the
Threat of Mass Unemployment. Oxford, UK: Oneworld
Publications.
Frazer, L., & Lawley, M. (2000). Questionnaire Design and
Administration: A Practical Guide. Queensland, Australia: John
Wiley & Sons.
Frey, C. B., & Osborne, M. A. (2017). The future of employment:
How susceptible are jobs to computerisation? Technological
Forecasting and Social Change, 114, 254– 280. https://doi.org/
10.1016/j.techfore.2016.08.019
Glebbeek, A. C., & Bax, E. H. (2002). Labour turnover and its
effects on performance: an empirical test using firm data. (SOM
Research Reports). Groningen: University of Groningen, SOM
research school.
Groover, M. P. (2007). Fundamentals of Modern Manufacturing:
Materials Processes, and Systems. John Wiley & Sons.
Gupta, C. B. (2003). Human Resource Management (6th Ed.).
New Delhi.
Gupta, M., & Gupta, D. (2011). Research Methodology (Eastern
Economy Edition). New Delhi: PHI Learning.
Hair, J., Money, A., Samouel, P., & Page, M. (2007). Research
Methods for Business. John Wiley & Sons, Ltd.
Hamann, P. M., Schiemann, F., Bellora, L., & Guenther, T. W.
(2013). Exploring the
dimensions of organizational performance: A construct validity
study. Organizational
Research Methods, 16(1), 67-87.
Idowu, P. A., Aliu, A. O., & Adagunodo, E. R. (2002). The effect
of information
technology on the growth of the banking industry in Nigeria.
The Electronic Journal on Information system in Development
Countries, EJISDC, 10(2), 1-8.
International Society of Automation [ISA], (2020). [Online]
Available from:
https://www.isa.org/about-isa/what-is-automation/
Kimutai, K. S., & Kwambai, M. (2017). Effect of office
automation on organizational effectiveness of public
universities in Kenya. International Journal of Academic
Research in Business and Social Sciences, 7(12), 1061-1071.
Kwame, K. E., Mahama, F., Boahen, P. A. N., & Denu, M. K. W.
(2017). The effect of employee turnover on the performance of
Zoomlion Ghana Limited. Journal of Business and Economic
Development, 2(2), 116.
Levy, F., & Murnane, R. J. (2007). How Computerized Work and
Globalization Shape Human Skill Demands. In M. Suarez-
Orozco (Ed.), Learning in the Global Era: International
Perspectives on Globalization and Education (pp.158-174).
Berkeley, CA, USA: University of California Press.
Makridakis, S. (2017). The forthcoming Artificial Intelligence
(AI) revolution: Its impact on society and firms. Futures, 90,
46–60. https://doi.org/10.1016/j.futures.2017.03.006
Martens, B., & Tolan, S. (2018). Will this time be different? A
review of the literature on the Impact of Artificial Intelligence
on Employment, Incomes and Growth. Digital Economy
Working Paper 2018-08; JRC Technical Reports. European
Union.
McClure, P. K. (2018). “You’re fired,” says the robot: The rise of
automation in the workplace, technophobes, and fears of
unemployment. Social Science Computer Review, 36(2), 139-
156.
McMillan, J., & Schumacher, S. (2001). Research in Education: A
Conceptual Introduction (5th Ed.). New York, NY: Longman.
Miller, C. C., Washburn, N. T., & Glick, W. H. (2012).
Perspective--The Myth of firm
performance. Organization Science, 24(3), 948-964.
Moullin, M. (2003). Defining performance measurement.
Perspectives on Performance,
2(2), 3-4.
Msafiri, A. (2013). Impacts of Labour Turnover on
Organizational Performance: A Case of Mtwara Regional
Administrative Office (Unpublished Thesis). Open University of
Tanzania, Tanzania.
Mungumi, R. L. (2002). Employees’ Perception of Factors that
influence Labour Turnover in the Micro Finance Institutions in
Kenya (Unpublished MBA Project).
Muntaner, C., Benach, J., Hadden, W. C., Gimeno, D., &
Benavides, F. G. (2006). A glossary for the social epidemiology
of work organization: part 2 Terms from the sociology of work
and organizations. Journal of Epidemiology & Community
Health, 60(12), 1010-1012.
Murdoch, M., Simon, A. B., Polusny, M. A., Bangerter, A. K.,
Grill, J. P., Noorbaloochi, S., & Partin, M. R. (2014). Impact of
different privacy conditions and incentives on survey response
rate, participant representativeness, and disclosure of sensitive
information: a randomized controlled trial. BMC medical
research methodology, 14, 90. doi:10.1186/1471-2288-14-90
Nel, P., Werner, A., Haasbroek, G., Poisat, P., Sono, T., &
Schultz, H. (2008). Human Resources Management (7th Ed.).
Cape Town: Oxford Southern Africa
Ojeka, S. A., & Ikpefan, O. A. (2012). Electronic commerce,
automation and online banking in Nigeria: challenges and
benefits. International Journal of Innovation in the Digital
Economy (IJIDE), 3(1), 11-26.
Radzi, S. M., Ramley, S. Z. A., Salehuddin, M., Othman, Z., &
Jalis, M. H. (2009). An empirical assessment of hotel
departmental managers’ turnover intentions: The impact of
organizational justice. International Journal of Business and
Management, 4(8), 173–183.
Richard, O. C., McMillan-Capehart, A., Bhuian, S. N., & Taylor,
Amity Business ReviewVol. 21, No. 1, January - June, 2020
18
Job Automation, Employee Turnover and Organizational Performance: A Study of Deposit Money Banks (DMBs) in Anambra State
E. C. (2009). Antecedents and consequences of psychological
contracts: Does organizational culture really matter? Journal of
Business Research, 62, 818-825.
Richard, P. J., Devinney, T. M., Yip, G. S., & Johnson, G. (2009).
Measuring
organizational performance: Towards methodological best
practice. Journal of
Management, 35(3), 718-804.
Salaria, N. (2012). Meaning of the term descriptive survey
research method. International Journal of Transformations in
Business Management, 1(6), 1-7.
Salawu, R. O., & Salawu, M. K. (2007). The emergence of
internet banking in Nigeria: An appraisal. Information
Technology Journal, 6(4), 490-496.
Sirohey, S. A., Hunjra, A. I., & Khalid, B. (2012). Impact of
business process automation on employees’ efficiency. Bulletin
of Business and Economics, 1(1), 1-12.
Tang, Y. C., & Liou, F. M. (2010). Does firm performance reveal
its own causes? The role of Bayesian inference. Strategic
Management Journal, 31(1), 39-57.
Ugwu, L. O. (1999). Assessment of Impact of Information
Technology on Selected
Service Industries in South Western Nigeria (Unpublished
Thesis).Obafemi Awolowo University, Nigeria.
Wolfgang, M. (2016). The Robotics Market-Figures and
Forecasts. Boston,
MA, USA: RoboBusiness, Boston Consulting Group.
Vermeulen, B., Kesselhut, J., Pyka, A., & Saviotti, P. P. (2018).
The impact of automation on employment: Just the usual
s tructural change?. Sustainabi l i ty , 10(1661) , 1-27 .
doi:10.3390/su10051661
Zikmund, W. G. (2003). Business Research Methods: A Practical
Guide (7th Ed.). New York: South-Western/Thomson.
Amity Business ReviewVol. 21, No. 1, January - June, 2020

19Amity Business ReviewVol. 21, No. 1, January - June, 2020
INTRODUCTIONThe disparity in the national accounting standards
of developing nations with that of developed
countries makes it too hard for prospective
international investors to access the exact financial
performance of the companies in the emerging
nations as well as in making sound investment
decisions. However the quality of financial
statements of the developing economies stands a
chance of being enhanced by means of better
accounting standard. It is believed that the
adoption of IFRS will improve the accounting
quality of companies resulting in increased
r e l e v a n c e , r e l i a b i l i t y , c o n s i s t e n c y a n d
comparability of information included in the
financial statements. According to International
Accounting Standard Board - IASB (2010)
Accounting information has the quality of
relevance when it makes a difference in the
business decision, provides information that has
predictive and confirmatory value. Proponents of
IFRS such as Daske et al (2008) posit that
implementing IFRS improves the quality of
accounting information and is beneficial to
investors.
Studies have also disclosed that Foreign Direct
Investments (FDI) encourages economic growth
and development particularly in developing
countries by way of transferring technologies and
developing human resources, thus implementing
The study examined the relevance of IFRS to Nigeria as a developing country with a view to determine the extent it has significantly improved accounting quality and profitability of Nigerian companies as well as the extent it has significantly increased FDI in Nigeria. A sample of 66 firms was selected from non-financial companies quoted on the Nigerian Stock Exchange (NSE). Ex-post facto research design was adopted. Data were gathered from the audited annual reports and accounts of the sampled companies covering a period of 7 years from 2012 to 2018. Data analysis was carried out using descriptive statistics and Ordinary Least Square (OLS) regression. Findings revealed that accounting quality and profitability improved in the post IFRS periods but the improvement was not statistically significant. However, FDI significantly increased in the post IFRS and the improvement was statistically significant. The researchers based on the findings recommended that the Financial Reporting Council of Nigeria (FRCN) should put in more efforts in monitoring firms’ total compliance/ensuring full implementation of IFRS by all companies quoted on the Nigerian Stock Exchange so as to achieve significant improvement in the areas of accounting quality and profitability as well as attain other benefits associated with adoption and full implementation of IFRS.
Keywords: IFRS, Developing Country, Accounting Quality, Profitability and Foreign Direct Investment (FDI)
Relevance of IFRS to A Developing Country: Evidence From Nigeria
Agbata, Amaka Elizabeth , 1 Lecturer in the Department of Accountancy, Nnamdi Azikiwe University, PMB 5025, Awka, Nigeria
2 Professor of Accounting Department of Accountancy, Nnamdi Azikiwe University, PMB 5025, Awka, Nigeria3 Lecturer in the Department of Accountancy, Nnamdi Azikiwe University, PMB 5025, Awka, Nigeria
1 2 3Ekwueme, Chizoba Marcella & Ndum, Ngozi Blessing
20
Relevance of IFRS to A Developing Country: Evidence From Nigeria
IFRS seems a means of attracting FDI. Even though
IFRS has received wider adoption and acceptance
by many countries and have been propagated by
many scholars on how it will improve accounting
quality and other benefits, Beuren and Klann
(2015) had an opposing view. Their argument was
based on the fact that since IFRS is based on
principles, it will give access for manipulation of
accounting numbers by financial managers and as
a result will reduce the relevance, reliability,
comparability and transparency of financial
reporting information. Several researchers doubt
the relevance of IFRS to developing nations.
Murtala (2017) affirms that IFRS is not relevant to
shareholders, short and long term lenders of fund.
Despite the fact that IFRS has gained wider
acceptance/adoption among many nations, very
few research has been carried out on its relevance
on Nigeria as a developing nation with a view to
determine the extent it has significantly improved
accounting quality and profitability of Nigerian
Companies as well as the extent it has significantly
increased FDI in Nigeria. Moreover, related studies
on this used qualitative data and majority of the
researches on the relevance of IFRS on accounting
quality were carried out mostly in foreign
countries especially developed nations. Previous
studies reviewed were based on theories such as
Agency theory, Stakeholders’ theory, Efficient
Market Hypothes is , Legi t imacy theory ,
Conservative Method theory, which differ clearly
from the theory used by this study. Besides the
previous studies also used proxies such as ROE,
ROA and so on to measure profitability which also
differ clearly from the proxy used by this study in
measuring profitability. The foregoing problems
and gaps necessitated this study.
Research Objectives
The study sought to determine the relevance of
IFRS to Nigeria as a developing country. It
addressed the following specific objectives:
1) Determine the extent accounting quality has
significantly improved in the post IFRS
periods.
2) Ascertain the extent profitability has
significantly improved in the post IFRS
periods.
3) Find out the extent Foreign Direct Investment
(FDI) has significantly increased in the post
IFRS periods.
Research Hypotheses
The following null hypotheses were formulated to
guide the study
1. Accounting quality has not significantly
improved in the post IFRS periods.
2. Profitability has not significantly improved in
the post IFRS periods.
3. Foreign Direct Investment (FDI) has not
significantly increased in the post IFRS
periods.
Review of Related Literature
Conceptual review
Accounting quality
Accounting quality according to Barth, Landsman
and Lang (2008) is the capacity of accounting
information to show the economic position and
performance of a company. Accounting quality
indicates the way in which information in the
financial statement presents an accurate and flaxen
position/performance of a business (Umobong &
Akani, 2015).
Earnings Management
Earnings Management is defined as a “situation
where managers use judgment in financial
reporting either to mislead some users about the
underlying economic performance of the company
or to influence contractual outcomes that depend
on reported accounting numbers” (Rudra &
Bhattacharjee, 2012, p.3)
Amity Business ReviewVol. 21, No. 1, January - June, 2020

21
Relevance of IFRS to A Developing Country: Evidence From Nigeria
International Financial Reporting Standards
(IFRS)
According to Tendeloo and Vanstraelen (2005),
IFRS is a set of conventions and guiding principles
which guides and directs global businesses on how
to attain the objective of keeping proper records,
uniformity, transparency, comparability and
improved public trust in financial reporting. In the
views of Abata (2015), IFRSs are the outcome of the
ideas of the private sector to harmonize and
internationalize financial reporting to meet the
demands arising due to globalization and regional
convergence of businesses. Zaiyol, Egwu and
Udende (2017) posit that companies that fail to
implement the tenets of IFRS would experience
inconsistencies, lack of transparency and
accountabi l i ty , a l terat ion of account ing
information which will bring about inferior
financial reporting custom and diffusion of low
quality financial information to the public.
Reasons for Nigeria’s Adoption of IFRS
Nigerian government gave a directive that all
public quoted companies should effective from
January 2012 prepare and present their financial
statements in accordance with IFRS. The motives
for the directive were for easy comparability of
financial statements of Nigerian companies with
that of global business communities, easy
understandability of financial statements of
multinational companies, for the Nigerian capital
markets to compete with other global capital
markets and attract foreign investors, increase the
influx of FDI in Nigeria, reduce cost of preparation
and presentation of group financial reports, makes
easy the consolidation of financial statements of
group companies and so on. In summary, the aim
for Nigeria’s adoption of IFRS was to improve
levels of disclosure and quality of financial
reporting.
Amity Business ReviewVol. 21, No. 1, January - June, 2020
Figure 1: Conceptual Framework
Independent Variable
Dependent Variables
IFRS
ACCOUNTING QUALITY
PROFITABILITY
FDI
Source: Researchers' Conceptualization (2020)
22
Relevance of IFRS to A Developing Country: Evidence From Nigeria
The conceptual framework of the study variables
as shown in figure 1 above portrayed IFRS as the
independent variable and Accounting Quality,
Profitability and Foreign Direct Investment (FDI)
as the dependent variables.
IFRS and Accounting Quality
Christensen, Lee and Walker (2008) in their study
found out that adoption of IFRS doesn’t enhance
accounting quality on its own. But Chai, et al
(2010) discovered that most of measures of
accounting quality were enhanced in the post IFRS
periods in European Union. However, the result of
the study by Umobong and Akani (2015)
confirmed that the IFRS adoption does not result in
higher accounting quality. This result suggested
that there were no improvement in financial
reporting over the first two years of post IFRS
adoption.
IFRS and Profitability
L a t r i d i s ( 2 0 1 0 ) c o n c l u d e d t h a t I F R S
implementation has favourably affected financial
performance of firms (measured by profitability
and growth potentials). Amahalu et al (2015) found
that IFRS has an effect on the reported net income
and equity of selected quoted Nigerian banks. It
also has a positive effect on the reported
profitability of banks. The results of the study by
Adeuja (2015) revealed no statistically significant
difference on profitability due to IFRS adoption.
The study by Uyar et al (2016) disclosed that
profitability is not significant determinant of IFRS
compliance. Akinleye (2016) found out that IFRS
adoption has positive impact on profitability (i.e.
ROA and ROE) of money deposit banks.
IFRS and Foreign Direct Investment
Irvine and Lucas (2006) found that countries that
adopted IFRS have massive rise in flow of Direct
Foreign Investment. According to Espetein (2009),
the adoption of IFRS lowers cost of capital and
facilitates international capital formation and
flows. Marquez-Ramos (2011) found out that
converging accounting processes in Europe helped
in reducing financial information asymmetry and
unfamiliarity among businesses of different
nations, reduced information costs, which
stimulates the surge of FDI as well as international
trade. Okpala (2012) found a significant
relationship between IFRS adoption by companies
and FDI in Nigeria. Akpomi and Nnadi (2017)
found that adoption of IFRS has positive effect on
the flow of FDI and its adoption by African nations
will improve the flow of FDI through enhancing
comparability.
Theoretical Framework
This study was anchored on Institutional theory.
Institutional theory was propounded by John
Meyer and Brian Rowan in 1977. The theory
considered the processes by which structures,
schemes, rules and norms are authoritatively
established as guidelines for social conduct. The
theorists affirm that the institutional environment
can strongly influence the development of formal
structures in an organization, often more
profoundly than market pressures. They insisted
that institutional mythologies are merely accepted
ceremoniously to enable the organization gain or
maintain legit imacy in the inst i tutional
environment. Legitimacy in the institutional
environment helps ensure organization survival.
Furthermore, Scott (1995) stated that for businesses
to stay alive, they must comply with the
regulations and credence existing in the society.
This theory is related to this study as the
International Accounting Standard Board (IASB) is
like institutional environment/authority that
issue/develop accounting standards globally. The
board issues IFRSs which are standards that guide
the conduct of businesses in terms of their
preparation and presentation of financial reports
worldwide. Thus businesses that adopt and
implement this IFRS stands a chance of surviving
as their financial reports will attain international
Amity Business ReviewVol. 21, No. 1, January - June, 2020
23
Relevance of IFRS to A Developing Country: Evidence From Nigeria
comparability and they will also achieve
improvement in their levels of disclosure and
quality of reporting among others, which are the
aims of IFRS.
Empirical Review
Irvine and Luca (2006) examined the rationale and
impact of the adoption of IFRS on the developing
nations: The case of the United Arab Emirates. The
results of the findings revealed that countries that
adopted IFRS experienced huge increases in
Foreign Direct Investment (FDI) flows across
countries. Christensen, Lee and Walker (2008)
studied the impact of mandatory IFRS adoption on
accounting quality. It aimed at determining
whether improvement in accounting quality is due
to the standards or incentives to adopt. Findings
showed that compulsory adoption of IFRS has no
effect on the accounting quality of companies
without motivations to adopt. The study
concluded that improvement in accounting quality
in terms of applying new standards does not
depend on whether the new standards are of
higher quality but on the motivations of the
account preparers. The study on IFRS adoption
and financial statements effects: The UK case by
Latridis (2010) was based on data collected from
firms listed on the London Stock Exchange. The
study found out that IFRS implementation has
favourably affected the financial performance
(measured by profitability and growth potentials).
Chai, et al (2010) examined the role of IFRS in
accounting quality, evidence from European Union
(EU). The study derived data from the financial
data of public listed companies in 15 member
states of the EU before and after full adoption of
IFRS in 2015. Findings showed that majority of
accounting quality indicators improved after the
adoption of IFRS in European Union. Umobong
and Akani (2015) researched on IFRS adoption and
accounting quality of quoted manufacturing firms
in Nigeria: A cross sectional study of brewery and
cement manufacturing firms. The study examined
the disparity in accounting information quality of
pre and post IFRS periods of manufacturing
companies in Nigeria for a period of five years.
Analyses were carried out on accounting quality
indicators using multiple regressions. T-test was
performed for mean equality for comparing of the
pre and post periods. Findings revealed a fall in
accounting quality measured by earnings
management, value relevance and timely loss
recognition. Earnings, Book Value of Equity and
Timely loss recognition are less value relevant in
post IFRS period than in pre period. Measuring the
effects of IFRS adoption on accounting quality: A
review, was studied by Pascan (2015). The paper
analyzed the effects of transiting from national
accounting standards to IFRS on accounting
quality in Europe. The study observed that
accounting standards, legal/political systems and
financial reporting inducements affected
accounting quality. IFRS adoption and Foreign
Direct Investment (FDI): Evidence from Nigerian
quoted firms, was carried out by Jinadu, Ojeka and
Ibidunmi (2016). The paper examined whether
IFRS adoption has significant positive impacts on
FDIs in Nigeria. Primary data was used and
regression analysis was employed in analyzing
data. Result showed that adoption of IFRS was
positively and significantly associated with Foreign
Direct Investments. Effect of IFRS adoption on the
performance of money deposit banks in Nigeria
was studied by Akinleye (2016). The study adopted
ratio analysis in investigating the association
between IFRS and bank performance. 10 banks
were randomly selected out of 21 quoted banks.
Data were collected from the financial statements
of the selected banks for the period covering 2009
to 2014. Panel data analysis involving pooled OLS
analysis among others was employed. Findings
showed that IFRS has positive impact on bank
performance measured by ROA and ROE.
Financial ratios for example, liquidity ratio, current
ratio as well as investment ratio have significant
effect on bank’s performance. Akpomi and Nnadi
Amity Business ReviewVol. 21, No. 1, January - June, 2020

24
Relevance of IFRS to A Developing Country: Evidence From Nigeria
(2017) studied the impact of IFRS adoption on
Foreign Direct Investment (FDI): Evidence from
Africa and implications for managers of education.
The study using a sample of 48 countries in Africa
and a fixed effect model for the regression found
that adoption of IFRS has a positive effect on the
flow of FDIs. Regulatory qualities are motivation
for complying with International Financial
Reporting Standards. Does International Financial
Reporting Standards (IFRS) impact profitability
ratios of listed banks in Nigeria? This was studied
by Erin, Oduwole, Olojede and Arumona (2018).
The paper provided empirical analysis of the
impact of IFRS on profitability ratios of 11 banks in
Nigeria. Wilcoxon Signed Rank test and Normality
test were used in data analysis. Result showed that
the adoption of IFRS does not have significant
effect on profitability ratios of quoted Nigerian
banks. Vanparys (2018) researched on the
relationship between IFRS and development in
developing countries. The aim was to find out
whether IFRS rules help developing nations in
their development. The study as a conceptual work
concluded that if IFRS is well implemented and it
receives support through well developed legal and
political systems as well as strong financial
markets, it can play vital developmental roles in
developing nations. Gingrich, Kratz and Faraci
(2018) studied IFRS adoption in developing
countries: What is the impact? The study explored
perceptions of business leaders on the entire
accounting and financial environment. Survey data
from the World Economic Forum’s Global
Competitiveness Report was adopted. 8 countries
that have adopted IFRS were sampled. Findings
revealed that IFRS adoption have positive impacts
on the accounting environment in four cases. The
effects of International Financial Reporting
Standards on Reporting Quality of financial
Institutions in Ghana, was studied by Amissah and
Hammond (2020). The paper examined the
reporting quali ty of Ghanaian f inancial
instruments after the adoption of IFRS. Sampled
companies comprised 51 financial institutions
(banks and insurance companies). Fixed effect
logistic regression was used in hypotheses testing.
Result showed that there was decline in the
financial reporting quality of Ghanaian financial
institutions in the post adoption period.
METHODOLOGYEx-post facto research design was used by this
study. The period was 7 years (2012 – 2018).
Population comprised all the non-financial
companies quoted on the Nigerian Stock Exchange.
Purposive sampling was used to select 66
companies as the sample size of the study.
Secondary data were used which were collected
from the sampled companies’ annual reports.
Descriptive statistics and Ordinary Least Square
(OLS) regressions were adopted in analysing data
with the aid of E-view version 9.
Measurement of Variables
IFRS is the independent variable while accounting
quality, profitability and FDI are the dependent
variables. IFRS is measured using content analysis
– involving IFRS adoption, First time adoption and
audit quality. Accounting quality is measured by
earnings management. In consistent with previous
studies (Uwalomwa et al 2016, Nnadi and Nwobu
2016), this study proxies earnings management by
earnings smoothing. Earnings smoothing “is
measured by the variability of changes in net
income and the variability of changes in net
income relative to variability of changes in
operating cash flows” (Barth Landsman & Lang,
2007, p. 23). Profitability is measured by Gross
Profit Margin (GPM). GPM is measured as gross
profit divided by revenue multiplied by 100%. FDI
is measured by increase in FDI. Firm age and
leverage are also included as control variables.
Model Development
The study estimated the following models for
Amity Business ReviewVol. 21, No. 1, January - June, 2020
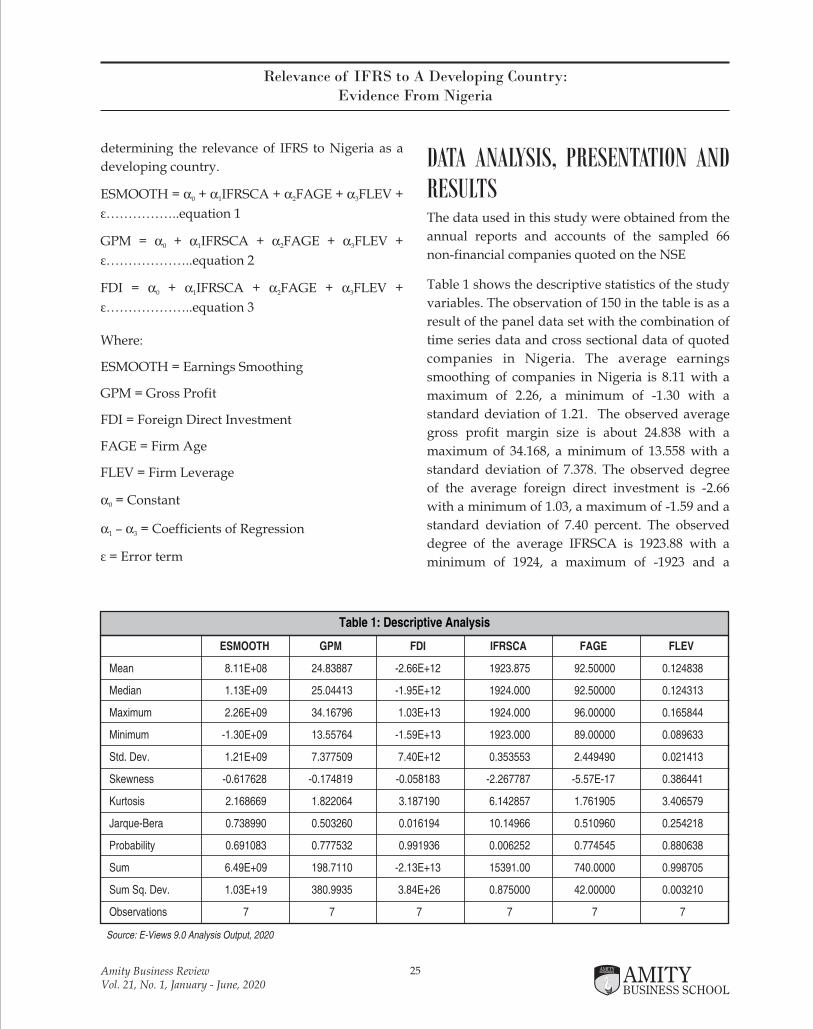
25
Relevance of IFRS to A Developing Country: Evidence From Nigeria
determining the relevance of IFRS to Nigeria as a
developing country.
ESMOOTH = a + a IFRSCA + a FAGE + a FLEV + 0 1 2 3
ε……………..equation 1
GPM = a + a IFRSCA + a FAGE + a FLEV + 0 1 2 3
ε………………..equation 2
FDI = a + a IFRSCA + a FAGE + a FLEV + 0 1 2 3
ε………………..equation 3
Where:
ESMOOTH = Earnings Smoothing
GPM = Gross Profit
FDI = Foreign Direct Investment
FAGE = Firm Age
FLEV = Firm Leverage
a = Constant0
a – a = Coefficients of Regression1 3
ε = Error term
DATA ANALYSIS, PRESENTATION AND RESULTS The data used in this study were obtained from the
annual reports and accounts of the sampled 66
non-financial companies quoted on the NSE
Table 1 shows the descriptive statistics of the study
variables. The observation of 150 in the table is as a
result of the panel data set with the combination of
time series data and cross sectional data of quoted
companies in Nigeria. The average earnings
smoothing of companies in Nigeria is 8.11 with a
maximum of 2.26, a minimum of -1.30 with a
standard deviation of 1.21. The observed average
gross profit margin size is about 24.838 with a
maximum of 34.168, a minimum of 13.558 with a
standard deviation of 7.378. The observed degree
of the average foreign direct investment is -2.66
with a minimum of 1.03, a maximum of -1.59 and a
standard deviation of 7.40 percent. The observed
degree of the average IFRSCA is 1923.88 with a
minimum of 1924, a maximum of -1923 and a
Amity Business ReviewVol. 21, No. 1, January - June, 2020
Table 1: Descriptive Analysis
ESMOOTH GPM FDI IFRSCA FAGE FLEV
Mean 8.11E+08 24.83887 -2.66E+12 1923.875 92.50000 0.124838
Median 1.13E+09 25.04413 -1.95E+12 1924.000 92.50000 0.124313
Maximum 2.26E+09 34.16796 1.03E+13 1924.000 96.00000 0.165844
Minimum -1.30E+09 13.55764 -1.59E+13 1923.000 89.00000 0.089633
Std. Dev. 1.21E+09 7.377509 7.40E+12 0.353553 2.449490 0.021413
Skewness -0.617628 -0.174819 -0.058183 -2.267787 -5.57E-17 0.386441
Kurtosis 2.168669 1.822064 3.187190 6.142857 1.761905 3.406579
Jarque-Bera 0.738990 0.503260 0.016194 10.14966 0.510960 0.254218
Probability 0.691083 0.777532 0.991936 0.006252 0.774545 0.880638
Sum 6.49E+09 198.7110 -2.13E+13 15391.00 740.0000 0.998705
Sum Sq. Dev. 1.03E+19 380.9935 3.84E+26 0.875000 42.00000 0.003210
Observations 7 7 7 7 7 7
Source: E-Views 9.0 Analysis Output, 2020
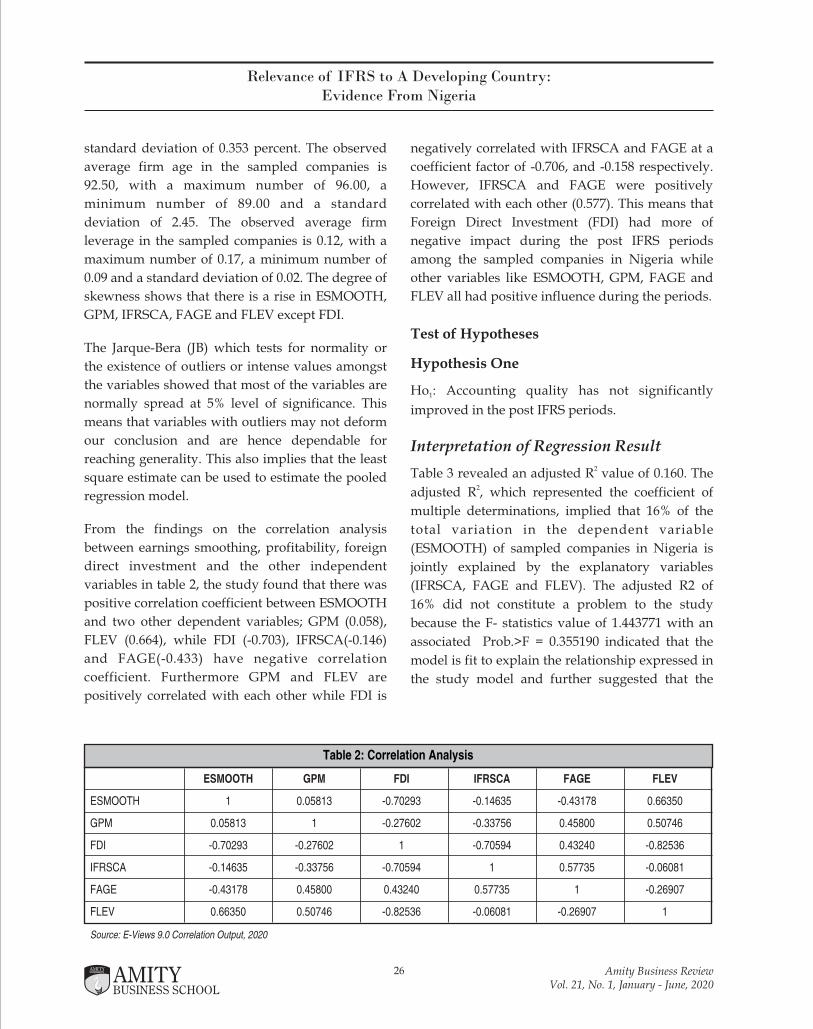
26
Relevance of IFRS to A Developing Country: Evidence From Nigeria
standard deviation of 0.353 percent. The observed
average firm age in the sampled companies is
92.50, with a maximum number of 96.00, a
minimum number of 89.00 and a standard
deviation of 2.45. The observed average firm
leverage in the sampled companies is 0.12, with a
maximum number of 0.17, a minimum number of
0.09 and a standard deviation of 0.02. The degree of
skewness shows that there is a rise in ESMOOTH,
GPM, IFRSCA, FAGE and FLEV except FDI.
The Jarque-Bera (JB) which tests for normality or
the existence of outliers or intense values amongst
the variables showed that most of the variables are
normally spread at 5% level of significance. This
means that variables with outliers may not deform
our conclusion and are hence dependable for
reaching generality. This also implies that the least
square estimate can be used to estimate the pooled
regression model.
From the findings on the correlation analysis
between earnings smoothing, profitability, foreign
direct investment and the other independent
variables in table 2, the study found that there was
positive correlation coefficient between ESMOOTH
and two other dependent variables; GPM (0.058),
FLEV (0.664), while FDI (-0.703), IFRSCA(-0.146)
and FAGE(-0.433) have negative correlation
coefficient. Furthermore GPM and FLEV are
positively correlated with each other while FDI is
negatively correlated with IFRSCA and FAGE at a
coefficient factor of -0.706, and -0.158 respectively.
However, IFRSCA and FAGE were positively
correlated with each other (0.577). This means that
Foreign Direct Investment (FDI) had more of
negative impact during the post IFRS periods
among the sampled companies in Nigeria while
other variables like ESMOOTH, GPM, FAGE and
FLEV all had positive influence during the periods.
Test of Hypotheses
Hypothesis One
Ho : Accounting quality has not significantly 1
improved in the post IFRS periods.
Interpretation of Regression Result2Table 3 revealed an adjusted R value of 0.160. The
2adjusted R , which represented the coefficient of
multiple determinations, implied that 16% of the
total variation in the dependent variable
(ESMOOTH) of sampled companies in Nigeria is
jointly explained by the explanatory variables
(IFRSCA, FAGE and FLEV). The adjusted R2 of
16% did not constitute a problem to the study
because the F- statistics value of 1.443771 with an
associated Prob.>F = 0.355190 indicated that the
model is fit to explain the relationship expressed in
the study model and further suggested that the
Amity Business ReviewVol. 21, No. 1, January - June, 2020
Table 2: Correlation Analysis
ESMOOTH GPM FDI IFRSCA FAGE FLEV
ESMOOTH 1 0.05813 -0.70293 -0.14635 -0.43178 0.66350
GPM 0.05813 1 -0.27602 -0.33756 0.45800 0.50746
FDI -0.70293 -0.27602 1 -0.70594 0.43240 -0.82536
IFRSCA -0.14635 -0.33756 -0.70594 1 0.57735 -0.06081
FAGE -0.43178 0.45800 0.43240 0.57735 1 -0.26907
FLEV 0.66350 0.50746 -0.82536 -0.06081 -0.26907 1
Source: E-Views 9.0 Correlation Output, 2020
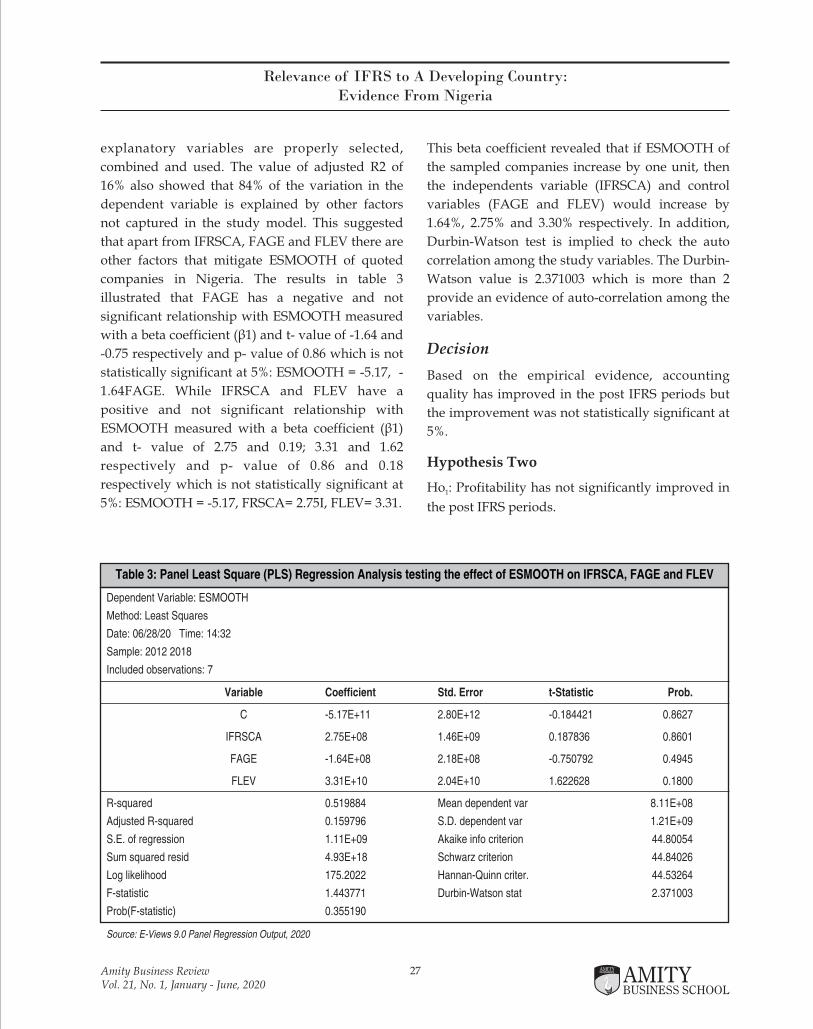
27
Relevance of IFRS to A Developing Country: Evidence From Nigeria
Amity Business ReviewVol. 21, No. 1, January - June, 2020
Table 3: Panel Least Square (PLS) Regression Analysis testing the effect of ESMOOTH on IFRSCA, FAGE and FLEV
Dependent Variable: ESMOOTH
Method: Least Squares
Date: 06/28/20 Time: 14:32
Sample: 2012 2018
Included observations: 7
Variable Coefficient Std. Error t-Statistic Prob.
C -5.17E+11 2.80E+12 -0.184421 0.8627
IFRSCA 2.75E+08 1.46E+09 0.187836 0.8601
FAGE -1.64E+08 2.18E+08 -0.750792 0.4945
FLEV 3.31E+10 2.04E+10 1.622628 0.1800
R-squared 0.519884 Mean dependent var 8.11E+08
Adjusted R-squared 0.159796 S.D. dependent var 1.21E+09
S.E. of regression 1.11E+09 Akaike info criterion 44.80054
Sum squared resid 4.93E+18 Schwarz criterion 44.84026
Log likelihood 175.2022 Hannan-Quinn criter. 44.53264
F-statistic 1.443771 Durbin-Watson stat 2.371003
Prob(F-statistic) 0.355190
Source: E-Views 9.0 Panel Regression Output, 2020
explanatory variables are properly selected,
combined and used. The value of adjusted R2 of
16% also showed that 84% of the variation in the
dependent variable is explained by other factors
not captured in the study model. This suggested
that apart from IFRSCA, FAGE and FLEV there are
other factors that mitigate ESMOOTH of quoted
companies in Nigeria. The results in table 3
illustrated that FAGE has a negative and not
significant relationship with ESMOOTH measured
with a beta coefficient (β1) and t- value of -1.64 and
-0.75 respectively and p- value of 0.86 which is not
statistically significant at 5%: ESMOOTH = -5.17, -
1.64FAGE. While IFRSCA and FLEV have a
positive and not significant relationship with
ESMOOTH measured with a beta coefficient (β1)
and t- value of 2.75 and 0.19; 3.31 and 1.62
respectively and p- value of 0.86 and 0.18
respectively which is not statistically significant at
5%: ESMOOTH = -5.17, FRSCA= 2.75I, FLEV= 3.31.
This beta coefficient revealed that if ESMOOTH of
the sampled companies increase by one unit, then
the independents variable (IFRSCA) and control
variables (FAGE and FLEV) would increase by
1.64%, 2.75% and 3.30% respectively. In addition,
Durbin-Watson test is implied to check the auto
correlation among the study variables. The Durbin-
Watson value is 2.371003 which is more than 2
provide an evidence of auto-correlation among the
variables.
Decision
Based on the empirical evidence, accounting
quality has improved in the post IFRS periods but
the improvement was not statistically significant at
5%.
Hypothesis Two
Ho : Profitability has not significantly improved in 1
the post IFRS periods.
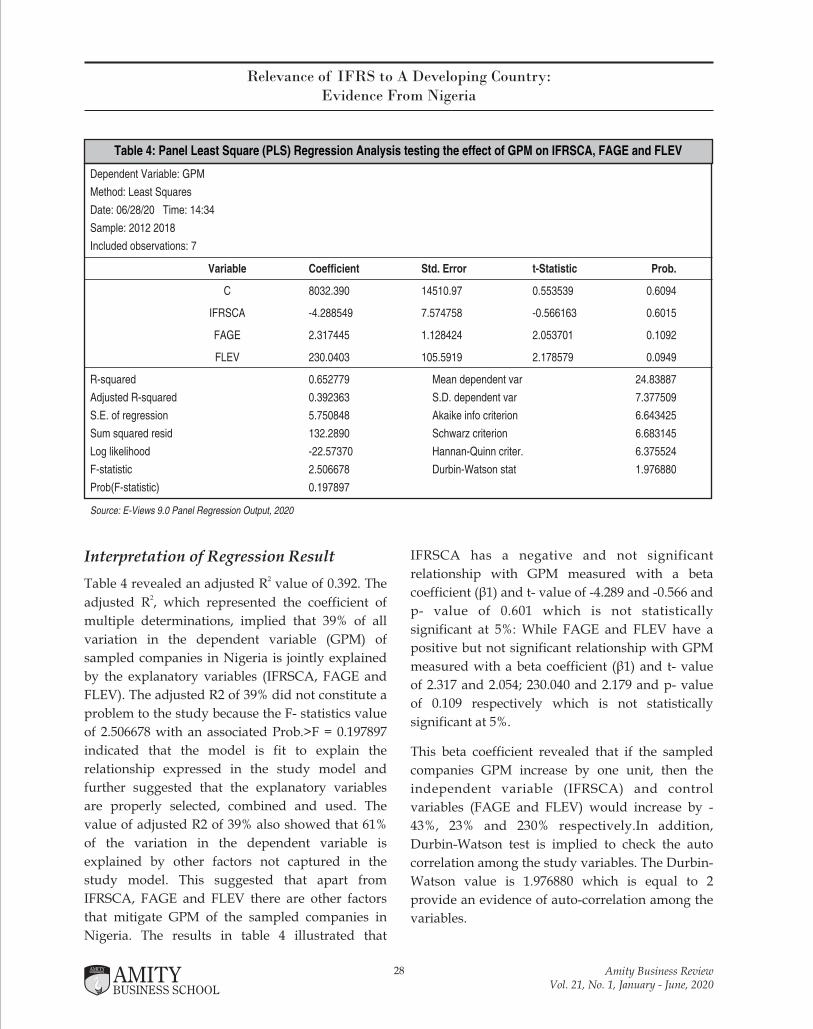
28
Relevance of IFRS to A Developing Country: Evidence From Nigeria
Amity Business ReviewVol. 21, No. 1, January - June, 2020
Table 4: Panel Least Square (PLS) Regression Analysis testing the effect of GPM on IFRSCA, FAGE and FLEV
Dependent Variable: GPM
Method: Least Squares
Date: 06/28/20 Time: 14:34
Sample: 2012 2018
Included observations: 7
Variable Coefficient Std. Error t-Statistic Prob.
C 8032.390 14510.97 0.553539 0.6094
IFRSCA -4.288549 7.574758 -0.566163 0.6015
FAGE 2.317445 1.128424 2.053701 0.1092
FLEV 230.0403 105.5919 2.178579 0.0949
R-squared 0.652779 Mean dependent var 24.83887
Adjusted R-squared 0.392363 S.D. dependent var 7.377509
S.E. of regression 5.750848 Akaike info criterion 6.643425
Sum squared resid 132.2890 Schwarz criterion 6.683145
Log likelihood -22.57370 Hannan-Quinn criter. 6.375524
F-statistic 2.506678 Durbin-Watson stat 1.976880
Prob(F-statistic) 0.197897
Source: E-Views 9.0 Panel Regression Output, 2020
Interpretation of Regression Result2Table 4 revealed an adjusted R value of 0.392. The
2adjusted R , which represented the coefficient of
multiple determinations, implied that 39% of all
variation in the dependent variable (GPM) of
sampled companies in Nigeria is jointly explained
by the explanatory variables (IFRSCA, FAGE and
FLEV). The adjusted R2 of 39% did not constitute a
problem to the study because the F- statistics value
of 2.506678 with an associated Prob.>F = 0.197897
indicated that the model is fit to explain the
relationship expressed in the study model and
further suggested that the explanatory variables
are properly selected, combined and used. The
value of adjusted R2 of 39% also showed that 61%
of the variation in the dependent variable is
explained by other factors not captured in the
study model. This suggested that apart from
IFRSCA, FAGE and FLEV there are other factors
that mitigate GPM of the sampled companies in
Nigeria. The results in table 4 illustrated that
IFRSCA has a negative and not significant
relationship with GPM measured with a beta
coefficient (β1) and t- value of -4.289 and -0.566 and
p- value of 0.601 which is not statistically
significant at 5%: While FAGE and FLEV have a
positive but not significant relationship with GPM
measured with a beta coefficient (β1) and t- value
of 2.317 and 2.054; 230.040 and 2.179 and p- value
of 0.109 respectively which is not statistically
significant at 5%.
This beta coefficient revealed that if the sampled
companies GPM increase by one unit, then the
independent variable (IFRSCA) and control
variables (FAGE and FLEV) would increase by -
43%, 23% and 230% respectively.In addition,
Durbin-Watson test is implied to check the auto
correlation among the study variables. The Durbin-
Watson value is 1.976880 which is equal to 2
provide an evidence of auto-correlation among the
variables.
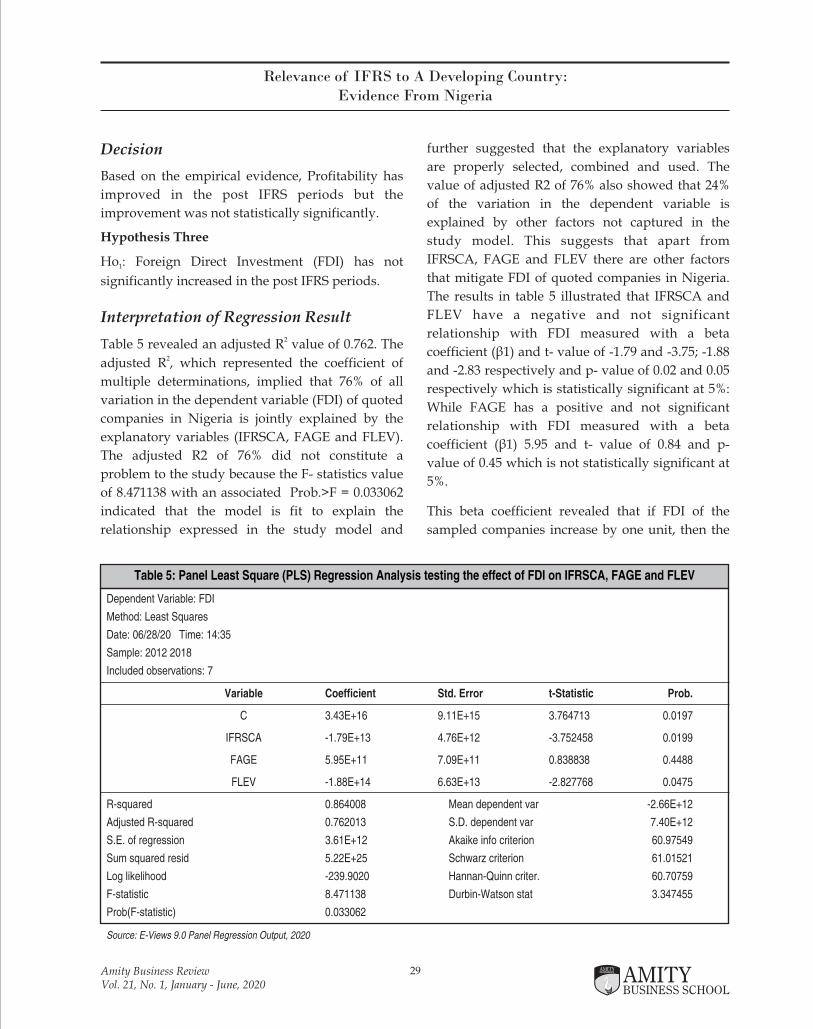
Table 5: Panel Least Square (PLS) Regression Analysis testing the effect of FDI on IFRSCA, FAGE and FLEV
Dependent Variable: FDI
Method: Least Squares
Date: 06/28/20 Time: 14:35
Sample: 2012 2018
Included observations: 7
Variable Coefficient Std. Error t-Statistic Prob.
C 3.43E+16 9.11E+15 3.764713 0.0197
IFRSCA -1.79E+13 4.76E+12 -3.752458 0.0199
FAGE 5.95E+11 7.09E+11 0.838838 0.4488
FLEV -1.88E+14 6.63E+13 -2.827768 0.0475
R-squared 0.864008 Mean dependent var -2.66E+12
Adjusted R-squared 0.762013 S.D. dependent var 7.40E+12
S.E. of regression 3.61E+12 Akaike info criterion 60.97549
Sum squared resid 5.22E+25 Schwarz criterion 61.01521
Log likelihood -239.9020 Hannan-Quinn criter. 60.70759
F-statistic 8.471138 Durbin-Watson stat 3.347455
Prob(F-statistic) 0.033062
Source: E-Views 9.0 Panel Regression Output, 2020
29
Relevance of IFRS to A Developing Country: Evidence From Nigeria
Decision
Based on the empirical evidence, Profitability has
improved in the post IFRS periods but the
improvement was not statistically significantly.
Hypothesis Three
Ho : Foreign Direct Investment (FDI) has not 1
significantly increased in the post IFRS periods.
Interpretation of Regression Result2Table 5 revealed an adjusted R value of 0.762. The
2adjusted R , which represented the coefficient of
multiple determinations, implied that 76% of all
variation in the dependent variable (FDI) of quoted
companies in Nigeria is jointly explained by the
explanatory variables (IFRSCA, FAGE and FLEV).
The adjusted R2 of 76% did not constitute a
problem to the study because the F- statistics value
of 8.471138 with an associated Prob.>F = 0.033062
indicated that the model is fit to explain the
relationship expressed in the study model and
further suggested that the explanatory variables
are properly selected, combined and used. The
value of adjusted R2 of 76% also showed that 24%
of the variation in the dependent variable is
explained by other factors not captured in the
study model. This suggests that apart from
IFRSCA, FAGE and FLEV there are other factors
that mitigate FDI of quoted companies in Nigeria.
The results in table 5 illustrated that IFRSCA and
FLEV have a negative and not significant
relationship with FDI measured with a beta
coefficient (β1) and t- value of -1.79 and -3.75; -1.88
and -2.83 respectively and p- value of 0.02 and 0.05
respectively which is statistically significant at 5%:
While FAGE has a positive and not significant
relationship with FDI measured with a beta
coefficient (β1) 5.95 and t- value of 0.84 and p-
value of 0.45 which is not statistically significant at
5%.
This beta coefficient revealed that if FDI of the
sampled companies increase by one unit, then the
Amity Business ReviewVol. 21, No. 1, January - June, 2020
30
Relevance of IFRS to A Developing Country: Evidence From Nigeria
independent variable (IFRSCA) and control
variables (FAGE and FLEV) would increase
by 1.79%, 1.88% and 5.95% respectively. In
addition, Durbin-Watson test is implied to
check the auto correlation among the study
variables. The Durbin-Watson value is 3.347455
which is more than 2 provide an evidence of
auto-correlation among the variables.
Decision
Based on the empirical evidence, Foreign Direct
Investment (FDI) has significantly increased in
the post IFRS periods at 5% level of significance.
Discussion of Findings
Findings of hypothesis one is in line with
the finding of Chai et al (2010) who established
that many accounting quality proxies became
enhanced in the pos t IFRS per iods in
European Union. However, the finding of
Umobong and Akani did not support the
finding of this study as it revealed a drop in
accounting quality measured by earnings
management, value relevance and timely loss
recognition. The study by Latridis (2010) found
out that implementing IFRS positively affects
financial performance (proxied by profitability
and growth indicators). Similarly, the result
of Akinleye (2016) study showed that IFRS
has positive impact on performance Nigerian
banks measured in terms of ROA and ROE.
These two results agree with the finding
of hypothesis two of this study. The finding
of hypothesis three is in agreement with that
of Irvine and Luca (2006) whose study
disclosed that countries that adopted IFRS
experienced huge increases in Foreign Direct
Investment (FDI) flows across countries. It is
also in line with that of Akpomi and Nnadi (2017),
who found that IFRS has positive effect on the
flow of FDIs.
SUMMARY OF FINDINGS, CONCLUSION AND RECOMMENDATION Summary of findings
The following findings emanated from the study:
1) Accounting quality improved in the post IFRS
periods but the improvement was not
statistically significant at 5% level of
significance.
2) Profitability has improved in the post IFRS
periods but the improvement was not
statistically significantly at 5% level of
significance.
3) Foreign Direct Investment (FDI) has
significantly increased in the post IFRS periods
at 5% level of significance.
Conclusion and Recommendation
In conclusion, IFRS has been found to be relevant
to Nigeria as a developing nation. This is evident
in the improved accounting quality and
profitability of Nigerian companies as well
increase in the flow of foreign direct investment in
Nigeria. Though the first two findings showed
improvement which is not statistical significant,
but IFRS has come to stay in Nigeria as it is
international best practice for corporate financial
reporting and Nigeria cannot disassociate herself
from international best practices. The study
recommended that the Financial Reporting Council
of Nigeria (FRCN) should put in more efforts in
monitoring firms’ total compliance/ensuring full
implementation of IFRS by all companies quoted
on the Nigerian Stock Exchange so as to achieve
significant improvement in the areas of accounting
quality and profitability as well as attain other
benefits associated with adoption and full
implementation of IFRS.
Contribution to Knowledge
This study brought newness to accounting
Amity Business ReviewVol. 21, No. 1, January - June, 2020

31
Relevance of IFRS to A Developing Country: Evidence From Nigeria
literature by exploring a different theory i.e.
institutional theory which is not consistent with
prior studies. It added empirical literature on the
relevance of IFRS on Nigerian as a developing
country using quantitative data. It also developed
models for determining the relevance of IFRS to
Nigeria as a developing nation. The study also
used gross profit margin as a measure of
profitability which is different from the proxies
used by previous studies to measure profitability.
It showed the relevance of IFRS on Nigeria using a
sample of quoted non-financial firms as many
related previous studies were done on developed
countries.
REFERENCES Abata, A. M. (2015). The impact of International Financial
Reporting Standards (IFRS) on financial reporting practice in
the Nigerian banking sector. Journal of policy and development
studies. 9(2) 169-184
Adeuja, Y. O. (2015). A comparative approach to the impact of
IFRS (International Financial Reporting Standards) on the
performance of Banks in Nigeria. unpublished M.Sc Thesis
Banking and Finance
Akinleye, G. T. (2016). Effect of International Financial
Reporting Standard (IFRS) adoption on the performance of
money deposit banks in Nigeria. European journal of Business,
Economics and Accountancy. 4(4)
Akpomi, M. E., & Nnadi, M. A. (2017). The impact of
International Financial Reporting Standards (IFRS) adoption on
Foreign Direct Investments (FDI): Evidence from Africa and
Implications for managers of Education. Journal of Accounting
and Financial Management. 3(2)
Amahalu, N. N., Obi, C. J., Abiahu, M. C., & Okosuogwe, O. A.
(ND). Effect of the adoption of International Financial Reporting
Standard (IFRS) on the financial performance of selected banks
quoted on the Nigeria Stock Exchange
Amissah, E., & Hammond, P. (2020). The effects of International
Financial Reporting Standards on Reporting Quality of
Financial Institutions in Ghana. International Journal of
Accounting and Financial Reporting. 10(2) 94-118
Barth, M., Landsman, W., Lang, M. (2007). International
Accounting Standards and accounting quality. Working papers,
Stanford Graduate School of Business.
Barth, M., Landsman, W., Lang, M. (2008). International
Accounting Standards and accounting quality. Journal of
Accounting Research.46(3) 467- 496
Beuren, M. I., & Klann, C. R. (2015). Effect of the convergence to
International Financial Reporting Standards in Earnings
Management. International journal of Finance and Accounting.
4(1) 8-20
Chai, H., Tang, Q., Jiang, Y., Lin, Z. (2010). The role of
International Financial Reporting Standards in accounting
quality. Evidence from the European Union. Journal of
International Financial Management and Accounting.
Christensen, B. H., Lee, E., & Walker, M. (2008). Incentives or
Standards: What determines accounting quality changes around
IFRS adoption? Working paper, Manchester Business School
Daske, H., Hail, L., Leuz, C., & Verdi, S. (2008). Mandatory IFRS
reporting around the world: Early evidence on the Economic
Consequences. Journal of Accounting Research 46(12) 1085-1142
Epstein, B. J. (2009). The economic effect of IFRS adoption. The
CPA journal. 79(2) 26-31
Erin, O., Oduwole, F., Olojede, P., & Arumona, J. (2018). Does
International Financial Reporting Standards (IFRS) impact
profitability ratios of listed banks in Nigeria? Journal of
Accounting, Business and Finance Research. 2(2) 79-90
Gingrich, C. D., Kratz, L., & Faraci, R. (2018). IFRS adoption in
developing countries: What is the impact? International journal
of Accounting and Financial Reporting. 8(2) 278-
International Accounting Standard Board – (IASB). The
conceptual framework for financial reporting. London
Irvine, H. J., & Lucas, N. (2006). The rationale and impact of the
adoption of International Financial Reporting Standards on
developing nations: The case of the United Arab Emirates.
Proceedings of the 18th Asian – Pacific conferences on
International Accounting Issues.1-22
Jinadu, O., Ojeka, S., & Ibidunmi, O. (2016). IFRS adoption and
Foreign Direct Investment: Evidence from Nigerian Quoted
firms. Mediterranean Journal of Social Sciences. 7(2) 99-105
Latridis, G. (2010). IFRS adoption and financial statements
effects: The UK case. International Research Journal of Finance
and Economics. 38 165-172
Marquez-Ramos , L . (2011) . European account ing
harmonization: Consequences of IFRS adoption on trade in
goods and FDIs. Emerging markets financial and trade, 47(4) 42-
57
Meyer, J., & Brian, R. (1977). Institutionalized Organizations:
Formal Structure as Myth and Ceremony. American journal of
Sociology. 83(2) 340-363
Murtala, Z. (2017). International Financial Reporting Standard
(IFRS) adoption and its impact on financial reporting: Evidence
from listed Nigeria oil and gas companies. Asian journal of
finance and accounting. 9(1) 464-474
Nnadi, M., & Nwobu, O., A. (2016). The impact of International
Financial Reporting Standards Adoption and Banking Reforms
Amity Business ReviewVol. 21, No. 1, January - June, 2020
32
Relevance of IFRS to A Developing Country: Evidence From Nigeria
on Earnings Management: Evidence from Nigerian Banks.
African journal of Accounting, Auditing and Finance. 5(3)
Okpala, K. E. (2012). Adoption of IFRS and financial statements
effects: The perceived implications on FDI and Nigerian
economy. Australian journal of Business and Management
Research. 2(5) 76-83
Pascan, I. (2015). Measuring the effects of IFRS adoption on
accounting quality: A review. Procedia Economics and Finance.
32(2015) 580-587
Rudra, T., & Bhattacharjee, D. (2012). Does IFRS influence
earnings management? Evidence from India. Journal of
Management Research. 4(11) 1-13
Scott, W. R. (1995). Institutions and Organizations. Thousand
O a k s , C A : S a g e . D o w n l o a d e d f r o m :
https//en.m.wikipedia.org/wiki/institutional_theory
Tendeloo, V., & Vanstraelen, B. A. (2005). Earnings
Management under German GAAP versus European. European
Accounting Review, 14(1)
Umobong, A. A., & Akani, D. (2015). IFRS adoption and
accounting quality of quoted manufacturing firms in Nigeria: A
cross sectional study of brewery and cement manufacturing
firms. European Centre for Research Training and Development
UK. 3(6) 61-77
Ujar, A., Kilic, M., & Gokcen, B. A. (2016). Compliance with
IAS/IFRS and firm characteristics: Evidence from the emerging
capital market of Turkey. Economic Research 29(1) 148-161
Uwalomwa, U., Emeni, F. K., Uwuigbe, O. R., & Ataiwrehe, C.
M. (2016). IFRS adoption and accounting quality: Evidence from
the corporate ownership and control. 14(1)
Vanparys, S. (2018). The relationship between IFRS and
development in developing countries. Unpublished Masters
Dissertation in Business Economics, Gent University, Dutch.
Zaiyol, P. I., Egwu, A. A., Udende, B. M. (2017). Impact of IFRS
adoption on accountability of Nigerian Organizations. IOSR
Journal of Economics and Finance. 8(1) 60-72.
Amity Business ReviewVol. 21, No. 1, January - June, 2020

33Amity Business ReviewVol. 21, No. 1, January - June, 2020
INTRODUCTIONIn today’s chal lenging and competi t ive
environment efficient management of working
capital (WC) is an integral component of the
overall corporate strategy to create shareholders
value. To dominate over the operating cycle odds,
not only the corporate giants but almost all the
business enterprises, irrespective of their sizes,
have been concentrating much on the efficient
management of WC. Due to the changes brought
out by the liberalization of economy, a large
number of companies in India which had grown
exponentially over the years in a virtually non-
competitive environment have started facing
increasingly severe competition (Jafar& Sur, 2006).
Therefore, a paradigm change in the Indian power
sector has also become inevitable to meet the new
challenges. The companies operating in this sector
have been forced to reorient their strategies for
managing their WC in the post-liberalisation era.
Some of them have been able to adopt themselves
to the new situation while others could not so
reorient. In this backdrop, the present paper
attempts to analyse the efficiency of working
capital management (WCM) in the Indian power
sector during the period 2004-05 to 2018-19.
The remainder of the paper is organized as follows.
Section II deals with review of related literature.
With the spectacular changes in the business milieu in
the post liberalization era, the working capital
management (WCM) practices in the Indian corporate
sector have also changed radically. Consequently, the
efficiency of managing working capital (WC) of the
companies in the Indian power sector has witnessed
notable changes. In this backdrop, the present study
seeks to analyze the efficiency of WCM in the Indian
power sector during the period 2003-04 to 2018-19. The
sample size of the study consists of five companies which
have been selected on the basis of availability of the data
for the entire study period from the top seven companies
based on market capitalization as per BSE on
13.03.2020. The performance index of WCM, WC
utilization index and efficiency index of WCM of the
selected companies have been measured using the
Bhattacharya Model (1995).While tackling the issue
relating to such indices analyzed in this study relevant
statistical tools and techniques have been applied.
Keywords : Working Capi ta l Management ,
Performance Index of Working Capital Management,
Working Capital Utilisation Index, Efficiency Index of
Working Capital Management, Indian Power Sector.
Efficiency of Managing Working Capital of Selected Companies in Indian Power Sector during
the Post-Liberalization EraRupesh Yadav & Debasish Sur
1 Research Scholar, Ph.D Programme, Department of Commerce, The University of Burdwan, Burdwan -713104, West Bengal2 Professor, Department of Commerce, The University of Burdwan, Burdwan -713104, West Bengal
1 2
34
Efficiency of Managing Working Capital of Selected Companies in Indian Power Sector during the Post-Liberalization Era
Section III narrates the objectives of the study.
Section IV explains the methodology adopted in
this study. Section V discusses the empirical
results. In section VI concluding observations are
presented.
REVIEW OF RELATED LITERATUREBefore setting the objectives of a study it is
necessary to review the existing literature on the
issue connected with the study and to ascertain the
research gaps. The following paragraphs in this
section present a brief description of some of the
notable studies carried out in the recent past in
India and abroad on the topic addressed in the
present paper and the last paragraph in this section
deals with the identification of the research gaps.
Shanthi and Eslavat (2014) conducted a study on
the liquidity management of Andhra Pradesh
Power Generation Corporation Limited for the
period 2000-01 to 2011-12 using ratio analysis
technique. The study revealed that the liquidity of
the company failed to make any notable
contribution towards the ability of the company to
meet its short term obligation during the period
under study.
Satapathy and Panda (2015) in their study analysed
the efficiency of WCM of Odisha Power
Transmission Corporation Limited by using
conventional ratios for the period 2007-08 to 2011-
12. The study observed that the company was able
to achieve efficiency in its WCM during the study
period.
Azhar (2015) in his study examined the impact of
liquidity and managerial efficiency on profitability
of 23 selected power distribution utilities in India
for the period 2004-05 to 2013-14. In this study
generalized least square regression was used
where return on capital employed representing
overall profitability was taken as the dependent
variable while current ratio, quick ratio, absolute
cash ratio, debtors turnover ratio, creditors
turnover ratio, collection efficiency, interest
coverage ratio was considered as the independent
variables. The study revealed that only debtors
turnover ratio, collection efficiency and interest
coverage ratio showed significant impact on the
profitability of the sample utilities during the study
period.
Dilli.et.al. (2016) in their study on the WCM of
Transmission Corporation Ltd. of Andhra Pradesh,
attempted to analyse each component of WC as
well as the impact of WC on the profitability of the
company during the period 2004-05 to 2013-14 by
using ratio analysis technique. The study showed
that positive impact of WC ratios of the company
on its profitability was noticed during the period
under study.
Kasiran et.al.(2016) in their study attempted to
analyze the efficiency of WCM in 24 small medium
sized companies listed in the Suruhanjaya Syarikat
Malaysia which were selected from the SME Corp
website for the period 2010 to 2013. While
analyzing the efficiency of WCM of the selected
companies three indices, namely performance
index of WCM, WC utilization index and efficiency
index of WCM were used. The study revealed that
the efficiency of managing WC of the selected
companies was not at all satisfactory during this
study period.
Azhar (2017) carried out a study to make a
comparison between private and state owned
power distribution utilities in terms of liquidity,
managerial efficiency, solvency and profitability
for the period 2004-05 to 2014-15 by using ratio
analysis technique. The study observed that the
performances of liquidity, managerial efficiency,
solvency and profitability of both the private and
state owned uti l i t ies were found to be
unsatisfactory during the period under study.
Another study conducted by Azhar (2017)
attempted to identify the factors influencing
working capital requirement of 23 selected power
Amity Business ReviewVol. 21, No. 1, January - June, 2020

35
Efficiency of Managing Working Capital of Selected Companies in Indian Power Sector during the Post-Liberalization Era
distribution utilities in India. While selecting the
companies judgmental sampling method was used.
The study was based on primary data which were
collected using questionnaire from two general
managers in finance and accounting department of
each of the sample power distribution utilities in
India. The study found that in the selected power
distribution utilities the industry effect, economic
environment, government rules & regulations,
credit policy, inventory management policy, and
payable policy were established as the major
influencing factors of WCM during the period
under study.
Islam and Mili (2018) in their study attempted to
evaluate the WCM practices of three selected
power sector companies in Bangladesh for the
period 2010 to 2015. It was found from the
descriptive statistics of the five selected WCM
indicators, such as quick ratio, cash to current
liability, inventory turnover, receivable turnover,
and cash conversion cycle as analyzed in this study
that the WCM practices of the selected companies
were more or less satisfactory over the study
period though there was a scope to make
investment of the excess working capital in
profitable investment opportunities. The outcomes
which were derived from the analysis of the
selected WCM indicators as made in the study by
applying t-test and ANOVA technique indicated
that the differences among the WCM practices of
the sample companies were significant over the
study period.
A good number of studies on the analysis of
various aspects of WCM were carried out in India
and abroad during the last few decades while a
considerable number of studies on the efficiency of
WCM relating to the corporate sector in India and
abroad were also made during the post-
liberalization era. By a careful scrutiny of the
studies as reviewed in this section it can be
inferred that though a very few studies on the
WCM of some selected firms belonging to the
power sector were conducted both in India and
abroad, no in-depth study on the efficiency of
WCM in the Indian power sector during the post-
liberalization period was made. In order to bridge
the gap, it is, therefore, high time to deal with the
issue relating to the analysis of efficiency in WCM
of the Indian power sector during the post-
liberalization era.
Objective of the study:
• The present study was conducted with the
following objectives:
• To study the performance index of WCM of the
selected companies.
• To evaluate the WC utilisation index of the
companies under study.
• To analyse the efficiency index of WCM of the
selected companies.
• To measure the degree of uniformity among
the companies under study in respect of each
of the selected WCM efficiency parameters,
such as performance index, utilisation index
and efficiency index of WCM.
• To examine whether the deviation of each of
the selected WCM efficiency parameters from
its industry average in each of the companies
under study was noticeable.
METHODOLOGY OF THE STUDYSelection of Sample: The present study was
conducted by taking five companies out of the top
seven companies in Indian power sector based on
Market Capitalisation as per BSE on 13th March,
2020. The top seven companies are (i) NTPC Ltd.,
(ii) Power Grid Corporation of India Ltd., (iii)
NHPC Ltd., (iv) Adani Transmission Ltd., (v)
Torrent Power Ltd., (vi) Adani Power Ltd., (vii)
Tata Power Company Ltd. Adani Transmission
Ltd. (incorporated on 9th December, 2013) and
Torrent Power Ltd. (incorporated on 1st October,
2015) are newly formed companies whereas the
Amity Business ReviewVol. 21, No. 1, January - June, 2020

36
Efficiency of Managing Working Capital of Selected Companies in Indian Power Sector during the Post-Liberalization Era
other five companies are old ones which were
incorporated in the last century. So, the data for the
entire study period relating to these two newly
constituted companies were not available. Thus, in
this study these two companies were excluded and
other five companies were considered at the time
of choosing the sample companies.
Period of Study: The period 2003-04 to 2018-19
was taken as the period under study. Though the
liberalization process started in India during the
financial year 1991-92, several reform measures
relating to the Indian power sector were initiated
by the Central Government during the period 1991
to 2003. The notable events of Indian power sector
reforms which took place during the period 1991 to
2003 are opening up of private investment in
power generation (1991), introduction of mega
power policy and competitive bidding process
(1992-95), issue of guidelines for establishment of
Regulatory Commission (1996), introduction of
Electricity Regulatory Commission Act and
Electricity Law (Amendment) Act to allow private
participation in transmission (1998-99), Electricity
Act, 2003 etc. Thus, in this study the financial year
2003-04 was considered as the initial year of the
study period.
Collection of Data: The data of the selected
companies for the period 2004-05 to 2018-19 used
in this study were collected from secondary
sources, i.e. ‘Capitaline Corporate Database’
published by Capital Market Publishers India Pvt.
Ltd., Mumbai.
Analysis of Data: While measuring the efficiency
of WCM of the companies under study the
Efficiency Index of WCM (EI ) as developed by WCM
Bhattacharya (1995) was applied. According to the
Bhattacharya Model, EI represents the product WCM
of Performance Index of WCM (PI ) and WCM
Working Capital Utilisation Index (UI ), i.e. WCM
EI = PI x UI . This formula was followed in WCM WCM WCM
the present study to arrive at the EI of the WCM
selected companies. In this study PI of each of WCM
the companies was ascertained by applying the
following formula:
Amity Business ReviewVol. 21, No. 1, January - June, 2020
Performance Index (PI ) = WCM
Working capital utilisation index (UI ) = WCM
At-1
At
Where I = Sales index = St/s
(St-1)
Wi= Individual group of current assets
N= Number of current asset group
i = 1, 2, 3……., N.
Similarly, UI of each of the selected companies WCM
was measured in this study using the following
formula:
Where A= Current assets/Sales.
In this study, the current assets group of each of
the companies under study was divided into seven
different components, namely debtor, store and
spares, goods-in-transit, other inventory, advances
to suppliers, cash and other current assets.
For the purpose of analyzing the performance
index of WCM, WC utilization index and efficiency
index of WC, simple statistical tools like arithmetic
mean and consistency coefficient (i.e. ratio of
arithmetic mean to standard deviation), statistical
techniques like linear trend analysis, analysis of
Kendall’s coefficient of concordance and statistical
tests like t-test, Chi-square test and Sandler’s A test
were used at appropriate places. In this study, the
average value of each of the selected efficiency
parameters of the companies under study was
considered as its industry average.
EMPIRICAL RESULTS AND DISCUSSIONPerformance Index of WCM (PI ): It indicates the WCM
average value of the performance indices of the
37
Efficiency of Managing Working Capital of Selected Companies in Indian Power Sector during the Post-Liberalization Era
different components of current assets. This index
measures the overall performance of a company in
managing the different components of its current
assets. If the value of PI exceeds 1, then it WCM
implies that the performance of the company in
managing its current assets is considered
satisfactory. So, the higher the value of PI , the WCM
better is the performance of current assets of the
company.
In Table 1, an attempt was made to analyse the
performance of WCM of the selected companies
using PI . This table shows that the PI values WCM WCM
of NTPC and Power Grid were greater than one in
all the years under study and in NHPC the values
of PI were greater than one in almost all the WCM
years (except in 2013-14) of the study period.
However, in Adani Power and Tata Power the
PI values were less than one in seven years and WCM
four years under study respectively. The mean
PI was the highest in Power Grid (2.136) and it WCM
was followed by NHPC (1.724), NTPC (1.702), Tata
Power (1.541) and Adani Power (1.331)
respectively in that order whereas the consistency
coefficient (CC) of NTPC was the maximum
(3.066), followed by Power Grid (3.042), NHPC
(3.066), Adani Power (2.173) and Tata Power
(2.036) respectively in that order. Based on both
average and consistency aspects of PI , Power WCM
Grid captured the top-most position and it was
followed by NTPC and NHPC respectively in that
order. However, both Adani Power and Tata
Power were placed on the last bench. Table 1 also
discloses that the slope of trend line of PI was WCM
positive and found to be statistically significant in
Adani Power only while it was negative and found
to be statistically significant in NHPC and Tata
Power. However, the slopes of the trend lines of
PI of NTPC and Power Grid were negative WCM
which were not found to be statistically significant.
Working Capital Utilisation Index (UI ): It WCM
measures the degree of WC that has been utilised
by a company to generate its sales revenue. A
value of UI greater than one is desirable. The WCM
higher the value of UI , the higher is the WCM
company’s ability to generate sales revenue by
utilizing its current assets.
In Table 2, an effort was made to analyse the
utilization of WC of the companies under study
using the UIWCM. This table depicts that the
values of UIWCM were greater than one in almost
all the years (except in 2010-11 and 2015-16) under
study whereas in NTPC, NHPC, Adani Power and
Tata Power the values of UIWCM were less than
one in six years, seven years , eight years and seven
years respectively out of the fifteen years under
study. The mean UIWCM was the highest in
Power Grid (2.183) and it was followed by NTPC
(1.178), Adani Power (1.165), Tata Power (1.024)
and NHPC (0.952) respectively in that order while
the CC of UIWCM was the maximum in NTPC
(1.685), followed by Tata Power (1.625), NHPC
(1.481), Adani Power (1.352) and Power Grid
(1.109) respectively in that order. Considering both
the mean and CC of UIWCM, NTPC occupied the
highest rank, followed by Power Grid and Tata
Power (which jointly occupied the second rank),
Adani Power and NHPC respectively in that order.
Table 2 also shows that the slopes of the trend lines
of UIWCM were negative in NTPC, Power Grid
and NHPC whereas in Adani Power and Tata
Power the slopes of UIWCM lines were positive,
all of these positive and negative slopes were not
found to be statistically significant.
Efficiency Index of WCM (EI ): It measures the WCM
efficiency of managing WC of a company. It is the
product of PI and UI . If there is a more than WCM WCM
proportionate rise in current assets with the
increase in sales, the cost associated with the
company also goes up, both in terms of blockage of
additional capital and the associated cost of capital.
A company cannot be said to have an efficient
WCM if the proportionate increase in current
assets is greater than proportionate increase in
sales revenue (Bhattacharya, 1995). The higher the
value of EI , the higher is the efficiency of WCM
Amity Business ReviewVol. 21, No. 1, January - June, 2020
38
Efficiency of Managing Working Capital of Selected Companies in Indian Power Sector during the Post-Liberalization Era
managing WC of the company.
In Table 3, it was attempted to analyse the
efficiency of WCM of the selected companies by
applying EI . This table discloses that the values WCM
of EI of NTPC varied between 0.05 (2015-16) WCM
and 3.65 (2011-12). On an average, it was 1.97 and
its CC was 1.83. The linear trend fitted to the EI WCM
series of NTPC exhibits a downward trend and the
slope of this line was not found to be statistically
significant. Similarly, the EI values of Power WCM
Grid ranged between 0.96 (2010-11) and 16.67
(2006-07). The average and CC of EI of the WCM
company were 4.28 and 1.09 respectively. The
straight line trend fitted to the EI series of WCM
Power Grid shows a declining trend which was not
found to be statistically significant. The EI WCM
values of NHPC, Adani Power and Tata Power
fluctuated between 0.04 (2016-17) and 4.28 (2004-
05), between 0.05 (2017-18) and 6.70 (2011-12) and
between 0.03 (2014-15) and 3.20 (2005-06)
respectively. The mean values of EI of these WCM
three companies were 1.64, 1.61 and 1.36
respectively and the CC values were 1.23, 0.92 and
1.78 respectively. The linear trend equations fitted
to the EI series of NHPC and Tata Power WCM
disclose downward trend whereas the same
relating to Adani Power reveals an upward trend.
Out of these three, only the slope of the EI line WCM
of NHPC was found to be statistically significant.
Table 3 also shows that in respect of the combined
score ascertained on the basis of both average and
CC of EI , NTPC captured the top-most position WCM
and it was followed by Power Grid, NHPC, Tata
Power and Adani Power respectively in that order.
In Table 4, for the purpose of measuring the degree
of uniformity among the selected companies in
respect of each of the selected parameters, such as
PIWCM, UIWCM and EIWCM, Kendall’s
Coefficient of concordance (W) was used. In order
to examine whether the computed values of W
were statistically significant or not Chi-square test
was used. This table shows that the computed
values of W (W in respect of PI ), WUI (W in PI WCM
respect of UI ) and W (W in respect of WI ) WCM EI WCM
were 0.3756, 0.3559 and 0.3392 respectively which
were found to be statistically significant at 0.05
level. It reveals that there was a close as well as
significant association among the selected
companies in respect of all the three parameters
such as PI , UI and EI during the study WCM WCM WCM
period.
In Table 5, in order to examine whether the
deviations between the PI and its industry WCM
average, the deviations between UI and its WCM
industry average and the deviations between EI WCM
and its industry average in each of the selected
companies were significant or not, Sandler’s A test
and ‘ sum of absolute deviations’ were applied.
This table shows that the computed values of
Sandler’s A were found to be statistically
significant at 0.05 level in all the three cases of
Power Grid only and in only one case (i.e. the
deviations between EI and its industry average) WCM
of Tata Power. In other cases, the computed values
of Sandler’s A were not found to be statistically
significant. Table 5 also discloses that the ‘sum of
absolute deviations of the PI from the industry WCM
average’ was the least in NTPC (0.226) and it was
followed by NHPC (0.556), Tata Power (2.184),
Adani Power (5.334) and Power Grid (6.736)
respectively in that order while the ‘sum of
absolute deviations of the UI from the industry WCM
average’ was the minimum in NTPC (1.836),
followed by Adani Power (2.036), Tata Power
(4.146), NHPC (5.226) and Power Grid (13.244)
respectively. This table also depicts that the ‘sum of
absolute deviations of the EI from the industry WCM
average’ was the lowest in NTPC (3.017), followed
by NHPC (7.954), Adani Power (8.417), Tata Power
(12.187) and Power Grid (31.576) respectively in
that order. It indicates that not only insignificant
variation between the efficiency of WCM and the
industry average in almost all the companies
(except in Power Grid) was observed but also
confirms that the highest efficiency in managing
Amity Business ReviewVol. 21, No. 1, January - June, 2020
39
Efficiency of Managing Working Capital of Selected Companies in Indian Power Sector during the Post-Liberalization Era
short term fund investment on the part of NTPC
was noticed during the period under study.
CONCLUDING OBSERVATIONSPower Grid established itself as the best performer
among the selected companies in Indian power
sector in respect of performance index of WCM
while Adani Power and Tata Power were placed
on the last bench in this respect during the period
under study. However, strong evidence of upward
trend in the performance of Adani Power in
managing the different components of its current
asset was noticed during the study period. A
notable declining trend in the performance of the
different components of current assets was
observed in both NHPC and Tata Power during
the period under study.
NTPC was recognized as the best performer
among the companies under study in respect of
efficient utilization of current assets whereas
NHPC was placed in the last rank during the study
period. No significant rising or downward trend
in the efficiency of utilizing current assets in any of
the selected companies was observed during the
period under study.
NTPC proved itself as the best performer among
the five selected companies in Indian power sector
in respect of efficiency in managing WC and it was
followed by Power Grid, NHPC, Tata Power and
Adani Power respectively in that order during the
study period. This study also reveals that there
was a noticeable declining trend in the efficiency of
managing WC of NHPC during the period under
study.
Another notable outcome of the study is that a
notable degree of uniformity among the selected
companies in respect of all the three selected
aspects of WCM as suggested in the Bhattacharya
Model, such as average performance of managing
the different components of current assets (as
reflected by PI ), efficiency of utilization of WCM
current assets (as indicated by UI ) and efficiency WCM
of managing WC (as shown by EI ) was WCM
observed during the study period.
The study not only discloses the insignificant
deviation of the efficiency of managing WC of
almost all the selected companies from the
industry average but also again confirms that the
highest efficiency in managing WC was achieved
by NTPC during the period under study.
REFERENCESAzhar, S. (2015). Impact of liquidity and management efficiency
on profitability: An empirical study of selected power
distribution utilities in India. Journal of Entrepreneurship,
Business and Economics, 3(1), 31-49.
Azhar, S. (2017).A comparative study of working capital
management, solvency and profitability of private and state
owned power distribution utilities using Mann Whitney U
test.In Proceedings of 13th IRF International Conference, 03rd
December.
Azhar, S. (2017). Factors Determining Working Capital
Requirements of Power Distribution Utilities in India. Available
at SSRN 3077956.
Bhattacharya, H. (1995). Total Management by Ratios – An
Integrated Approach.,Sage Publications India Pvt. Ltd., New
Delhi, pp. 223-227.
Dilli, D.S., Gurumurthy, N., & Reddy, D.K.J.(2016). Working
Capital Management in Transmission Corporation Ltd., of
Andhra Pradesh, BIMS International Journal of Social Science
Research,1(1),44-49.
Islam, M. N.&Mili, S. A. (2018). Working Capital Management
of Selected Power Sector Companies in Bangladesh: Evidence
from Dhaka Stock Exchange Ltd., Asian Business Review, 8(3),
91-96.
Kasiran, F. W., Mohamad, N. A., & Chin, O. (2016). Working
capital management efficiency: A Study on the Small Medium
Enterprise in Malaysia., Procedia Economics and Finance, 35,
297-303.
Satapathy, B.K.N. & Panda, S.R.(2015). A Study on Working
Capital Management at Odisha Power Transmission
Corporation Limited, Bhubaneswar, International Journal of
Research and Development - A Management Review,4(4),101-
107.
Shanthi, D. V.&Eslavat, S. (2014). Liquidity Management of
Andhra Pradesh Power Generation Corporation Limited
(APGENCO): A Study, International Journal of Information &
Computation Technology, 4(11), 1087-1096.
Amity Business ReviewVol. 21, No. 1, January - June, 2020
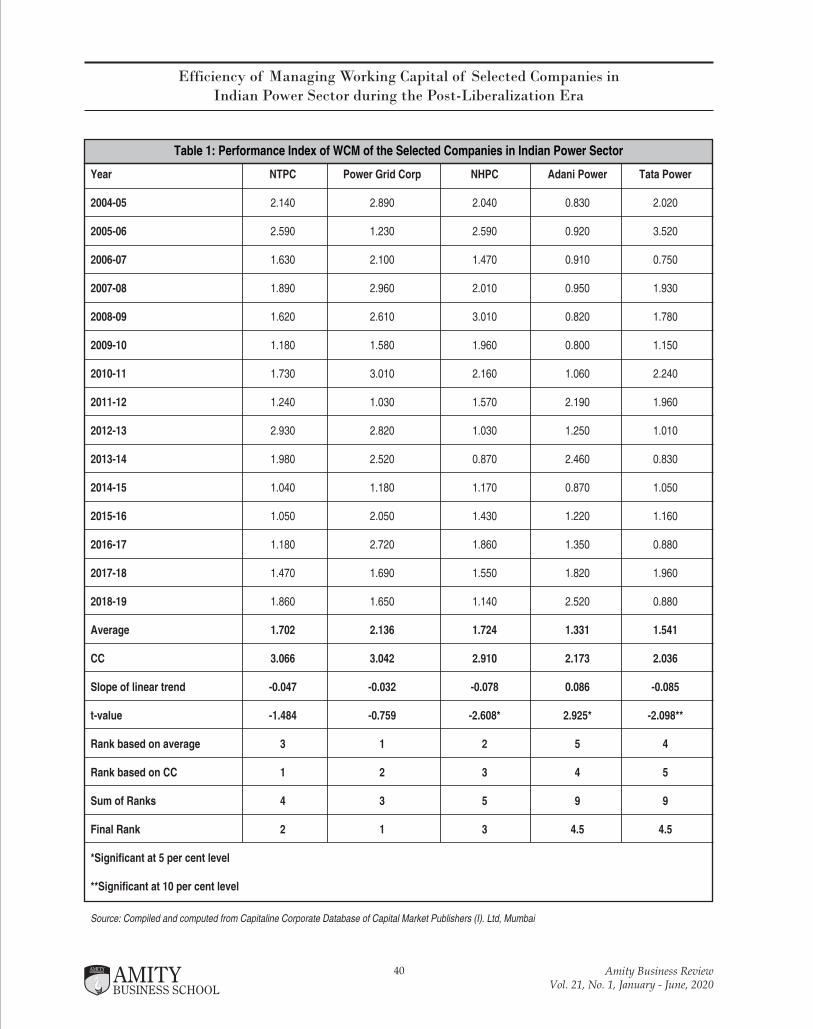
Table 1: Performance Index of WCM of the Selected Companies in Indian Power Sector
Year NTPC Power Grid Corp NHPC Adani Power Tata Power
2004-05 2.140 2.890 2.040 0.830 2.020
2005-06 2.590 1.230 2.590 0.920 3.520
2006-07 1.630 2.100 1.470 0.910 0.750
2007-08 1.890 2.960 2.010 0.950 1.930
2008-09 1.620 2.610 3.010 0.820 1.780
2009-10 1.180 1.580 1.960 0.800 1.150
2010-11 1.730 3.010 2.160 1.060 2.240
2011-12 1.240 1.030 1.570 2.190 1.960
2012-13 2.930 2.820 1.030 1.250 1.010
2013-14 1.980 2.520 0.870 2.460 0.830
2014-15 1.040 1.180 1.170 0.870 1.050
2015-16 1.050 2.050 1.430 1.220 1.160
2016-17 1.180 2.720 1.860 1.350 0.880
2017-18 1.470 1.690 1.550 1.820 1.960
2018-19 1.860 1.650 1.140 2.520 0.880
Average 1.702 2.136 1.724 1.331 1.541
CC 3.066 3.042 2.910 2.173 2.036
Slope of linear trend -0.047 -0.032 -0.078 0.086 -0.085
t-value -1.484 -0.759 -2.608* 2.925* -2.098**
Rank based on average 3 1 2 5 4
Rank based on CC 1 2 3 4 5
Sum of Ranks 4 3 5 9 9
Final Rank 2 1 3 4.5 4.5
*Significant at 5 per cent level
**Significant at 10 per cent level
Source: Compiled and computed from Capitaline Corporate Database of Capital Market Publishers (I). Ltd, Mumbai
40
Efficiency of Managing Working Capital of Selected Companies in Indian Power Sector during the Post-Liberalization Era
Amity Business ReviewVol. 21, No. 1, January - June, 2020
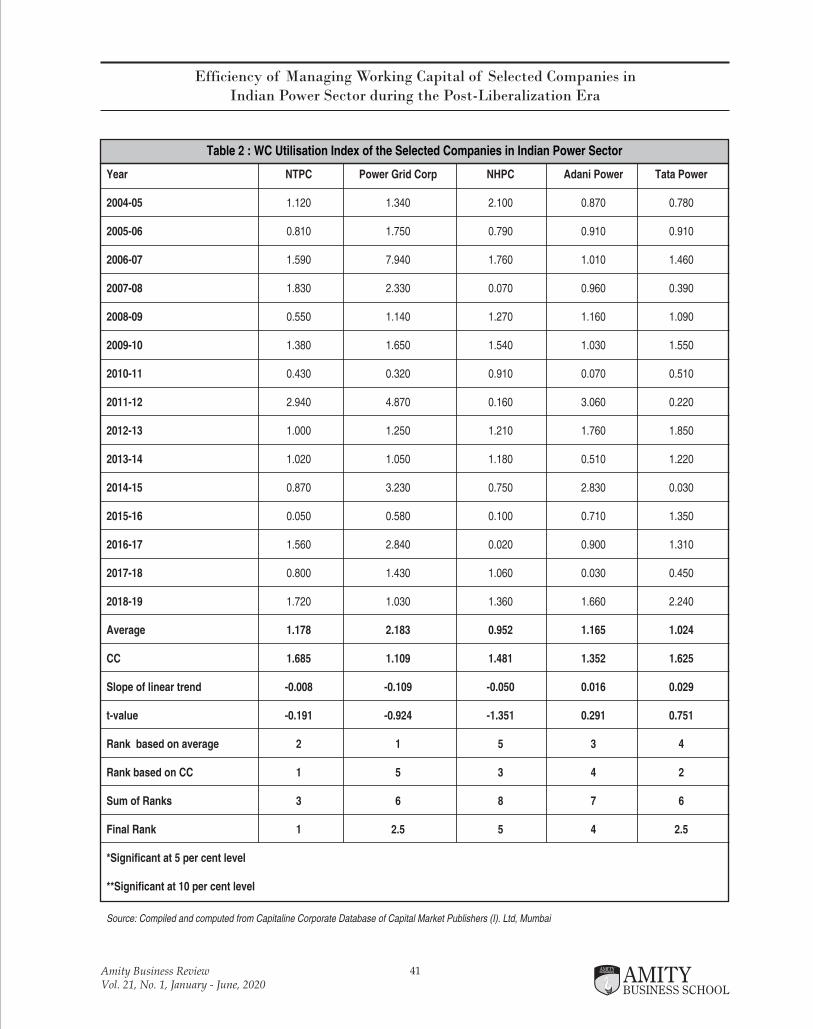
Table 2 : WC Utilisation Index of the Selected Companies in Indian Power Sector
Year NTPC Power Grid Corp NHPC Adani Power Tata Power
2004-05 1.120 1.340 2.100 0.870 0.780
2005-06 0.810 1.750 0.790 0.910 0.910
2006-07 1.590 7.940 1.760 1.010 1.460
2007-08 1.830 2.330 0.070 0.960 0.390
2008-09 0.550 1.140 1.270 1.160 1.090
2009-10 1.380 1.650 1.540 1.030 1.550
2010-11 0.430 0.320 0.910 0.070 0.510
2011-12 2.940 4.870 0.160 3.060 0.220
2012-13 1.000 1.250 1.210 1.760 1.850
2013-14 1.020 1.050 1.180 0.510 1.220
2014-15 0.870 3.230 0.750 2.830 0.030
2015-16 0.050 0.580 0.100 0.710 1.350
2016-17 1.560 2.840 0.020 0.900 1.310
2017-18 0.800 1.430 1.060 0.030 0.450
2018-19 1.720 1.030 1.360 1.660 2.240
Average 1.178 2.183 0.952 1.165 1.024
CC 1.685 1.109 1.481 1.352 1.625
Slope of linear trend -0.008 -0.109 -0.050 0.016 0.029
t-value -0.191 -0.924 -1.351 0.291 0.751
Rank based on average 2 1 5 3 4
Rank based on CC 1 5 3 4 2
Sum of Ranks 3 6 8 7 6
Final Rank 1 2.5 5 4 2.5
*Significant at 5 per cent level
**Significant at 10 per cent level
Source: Compiled and computed from Capitaline Corporate Database of Capital Market Publishers (I). Ltd, Mumbai
41
Efficiency of Managing Working Capital of Selected Companies in Indian Power Sector during the Post-Liberalization Era
Amity Business ReviewVol. 21, No. 1, January - June, 2020

Table 3 : Efficiency of WCM Index of the Selected Companies in Indian Power Sector
Year NTPC Power Grid Corp NHPC Adani Power Tata Power
2004-05 2.40 3.87 4.28 0.72 1.58
2005-06 2.10 2.15 2.05 0.84 3.20
2006-07 2.59 16.67 2.59 0.92 1.10
2007-08 3.46 6.90 0.14 0.91 0.75
2008-09 0.89 2.98 3.82 0.95 1.94
2009-10 1.63 2.61 3.02 0.82 1.78
2010-11 0.74 0.96 1.97 0.07 1.14
2011-12 3.65 5.02 0.25 6.70 0.43
2012-13 2.93 3.53 1.25 2.20 1.87
2013-14 2.02 2.65 1.03 1.25 1.01
2014-15 0.90 3.81 0.88 2.46 0.03
2015-16 0.05 1.19 0.14 0.87 1.57
2016-17 1.84 7.72 0.04 1.22 1.15
2017-18 1.18 2.42 1.64 0.05 0.88
2018-19 3.20 1.70 1.55 4.18 1.97
Average 1.97 4.28 1.64 1.61 1.36
CC 1.83 1.09 1.23 0.92 1.78
Slope of linear trend -0.051 -0.272 -0.171 0.101 -0.051
t-value -0.781 -1.172 -2.52* 0.968 -1.123
Rank based on average 2 1 3 4 5
Rank based on CC 1 4 3 5 2
Sum of Ranks 3 5 6 9 7
Final Rank 1 2 3 5 4
*Significant at 5 per cent level
**Significant at 10 per cent level
Source: Compiled and computed from Capitaline Corporate Database Of Capital Market Publishers (I). Ltd, Mumbai
42
Efficiency of Managing Working Capital of Selected Companies in Indian Power Sector during the Post-Liberalization Era
Amity Business ReviewVol. 21, No. 1, January - June, 2020
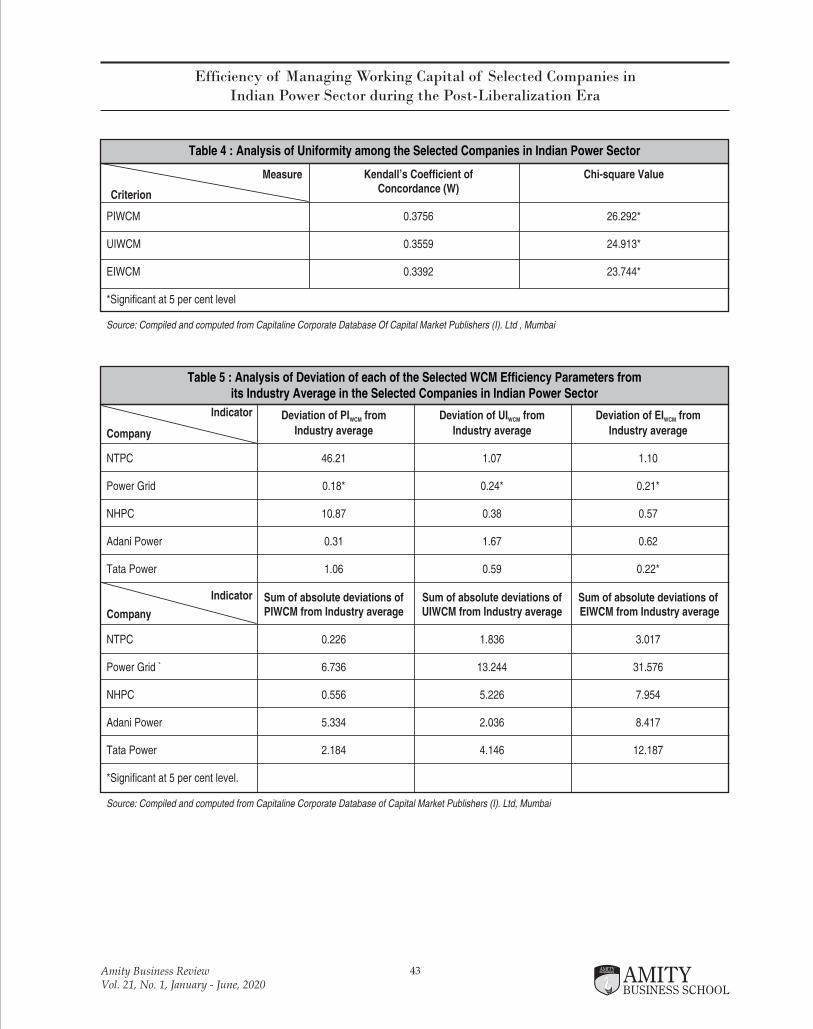
43
Efficiency of Managing Working Capital of Selected Companies in Indian Power Sector during the Post-Liberalization Era
Amity Business ReviewVol. 21, No. 1, January - June, 2020
Table 4 : Analysis of Uniformity among the Selected Companies in Indian Power Sector
Kendall’s Coefficient of Chi-square ValueConcordance (W)
PIWCM 0.3756 26.292*
UIWCM 0.3559 24.913*
EIWCM 0.3392 23.744*
*Significant at 5 per cent level
Source: Compiled and computed from Capitaline Corporate Database Of Capital Market Publishers (I). Ltd , Mumbai
Criterion
Measure
Table 5 : Analysis of Deviation of each of the Selected WCM Efficiency Parameters from its Industry Average in the Selected Companies in Indian Power Sector
Deviation of PI from Deviation of UI from Deviation of EI fromWCM WCM WCM
Industry average Industry average Industry average
NTPC 46.21 1.07 1.10
Power Grid 0.18* 0.24* 0.21*
NHPC 10.87 0.38 0.57
Adani Power 0.31 1.67 0.62
Tata Power 1.06 0.59 0.22*
Sum of absolute deviations of Sum of absolute deviations of Sum of absolute deviations ofPIWCM from Industry average UIWCM from Industry average EIWCM from Industry average
NTPC 0.226 1.836 3.017
Power Grid ` 6.736 13.244 31.576
NHPC 0.556 5.226 7.954
Adani Power 5.334 2.036 8.417
Tata Power 2.184 4.146 12.187
*Significant at 5 per cent level.
Source: Compiled and computed from Capitaline Corporate Database of Capital Market Publishers (I). Ltd, Mumbai
Company
Company
Indicator
Indicator

INTRODUCTIONThe sustained economic trepidation makes it
imperative for the professionals from the field of
commerce and management, especially under
learning programs, to educate scholars on ways to
harness their learning, exercitation and abilities to
encourage economic and social rectitude and to
generate enterprise level transformation on varied
magnitude, in diverse circumstances, and with
subscribers in numerous economic footing. In
order to create syllabus related components which
can assist faculties and disseminate information to
the marginalized populations, trainers and
faculties must first rightly comprehend the subject
of financial literacy particularly the scholars
belonging to the area of management education.
Everywhere around the globe, commonalty is
giving up even on the hours designated for their
lunch and speeding from the place of employment
to attend their appointment with a therapist. Yet in
present day’s precarious financial times, quite a
few of these sessions have now shifted their focus
upon an absolutely exclusive focal point which is
dealing with financial baggage. Financial therapy
modulates age-old financial consultation with a
more significant and familiar psychological
research regarding the driving force behind a
common man’s behavior with his money. The
accredited experts who provide solutions to these
type of problems by means of counseling are
Financial therapy is a swiftly evolving field of research and
application. Still only a handful amount of research is
presently available especially on the subject matter of
financial therapy. The term financial therapy is open to
multi-dimensional deliberations. As already mentioned
that literature on financial therapy is yet out-of-print
owing to the nascent phase of this area of knowledge and
research, the fact is that most of the literature currently
available is mostly concentrated on the procedures and
subjects associated to the notion of, but not truly the term
financial therapy, are more often accessible. The available
literature also varies in the thoughts and conclusions on
how financial therapy can be and should be looked. Many
professionals belonging to the field of financial and mental
health have figured out striking similarities between their
disciplines. Quite a few researches conducted over the
years reveal that financial planners dwell approximately
25% of their time finding solutions to non-financial
issues. According to the Financial Therapy Association
“Financial therapy is a process informed by both
therapeutic and financial competencies that helps people
think, feel, and behave differently with money to improve
overall well-being through evidence-based practices and
interventions. With this combined approach informed by
both therapeutic and financial competencies, financial
therapists are equipped to help people reach their financial
goals by thoughtfully addressing financial challenges,
while at the same time, attending to the emotional,
psychological, behavioral, and relational hurdles that are
intertwined”. In this research paper a candid attempt has
been made to come up with future prospects of the
emerging field called financial therapy in a country like
India and what are the prerequisites of becoming a
successful financial therapist.
Keywords : Financial Therapy, Financial Health,
Financial Coaching, Psychotherapy, Behavioral Finance
Financial Therapy: Eliciting the Fine Points and Professional Preconditions of An Evolving Field
44 Amity Business ReviewVol. 21, No. 1, January - June, 2020
Shivam Shukla , Sudhir Kumar Shukla & Asha Ram Tripathi1
2 Professor and Ex-Head, Faculty of Commerce and Management Studies, Mahatma Gandhi Kashi Vidyapith, Varanasi (U.P.)3 Ex-Head and Dean, Faculty of Commerce, Banaras Hindu University, Varanasi (U.P.)
1 2 3
Assistant Professor, Department of Commerce, Siddharth University, Kapilvastu, Siddharthnagar (U.P.)
45
Financial Therapy: Eliciting the Fine Points and Professional Preconditions of An Evolving Field
referred to as financial therapists, and they are
entrusted with figuring out the mental triggers and
psychological foundations that can force masses to
make erroneous—and more often than not
naturally so—money decisions. Self-destructive or
inefficacious financial behaviors have little to do
with how much money people have. Whether we
have a little money or a lot, our relationship with
money can be a source of grave pain and
pernicious disorder. At such a juncture financial
therapy can come to rescue. A lot of people still are
unaware of this curious branch of therapy. The
Financial Therapy Association came into existence
in 2010—although it could only assemble nearly
300 associates by 2011. Financial therapy can be
differentiated from routine psychotherapy through
the fact that financial therapy is centralized on
reforming the entire financial welfare situation
through the understanding and analysis of many
relevant cognitive, relational, economic and
integrative aspects of financial soundness. In
system, it assimilates financial referral and tactics
with personal admonishment, wedding and
household therapy, anthropology, social work,
and, most significantly, psychology. Further,
quality financial therapy occurs in complete
complicity with professionals from the field of
finance, for example tax specialists and investment
consultants.
The rapidly growing area of financial therapy
involves financial projection, financial consultancy,
family therapy, psychology, social work and life
coaching. Given that most of the defiance at some
level is unavoidable, it is highly significant to
ensure that generality realizes the very fact that
they have a say in the descent of this ever evolving
professional field. Further, it is also important to
lay adequate emphasis on the similarities and a
common vision, whereas still permitting all
involved professions to hold onto their eccentricity.
But it is also true that errors will be committed,
descriptions will emerge overtime and the
advancement proceedings will surely be time
consuming.
REVIEW OF LITERATURE• J Grable, S McGill, S Britt (2010) put forth a
brief historical review which highlights the
dreams of a few visionary thinkers came to
fruition by working together to jointly build a
structure to house the work of financial
therapists. Continuing to build a bridge of
collaboration between practitioners and
researchers will be an ongoing challenge, but
one well worth the effort. Given the positive
(and overwhelming) response to the
establishment of the FTA, both in the
practitioner and academic communities, bodes
well for the future of the Association. The
Board of Directors is excited to invite you, as a
reader of the Journal of Financial Therapy, to
join with your colleagues in building a new
professional home for financial therapists.
• J Gale, J Goetz, S Britt (2012) invite scrutiny
and deliberations to extend, and potentially
even expedite, the positive evolution of the
emerging profession of financial therapy and
the newly formed Financial Therapy
Association (FTA). Varying perspectives are
provided by reviewing another association’s
challenges when implementing cross-
disciplinary collaboration and a unique
identity. Ten considerations are provided in
the development of financial therapy as a
professional practice, which are designed to be
starting points for facilitating the strong
development of this emerging profession and
new association. Exercises are provided to
assist professionals in recognizing similarities
and differences between their profession and
others represented in the membership of FTA.
• B Klontz, SL Britt, J Mentzer (2011) argue that
as per the viewpoint of financial counselors,
financial therapists, financial coaches, and
educators, it seems that younger individuals in
particular are most likely to hold potentially
Amity Business ReviewVol. 21, No. 1, January - June, 2020

46
Financial Therapy: Eliciting the Fine Points and Professional Preconditions of An Evolving Field
destructive beliefs about money. This may
influence their ability to attain financial goals
a n d i n d e p e n d e n t f i n a n c i a l s e c u r i t y .
Practitioners may want to administer the
Klontz -MSI to clients as a quick screening tool
to identify potential problem areas with
money. As shown in the results, individuals
who adhere to the avoidance, worship, and/or
status subscales are more likely to have lower
levels of education, income, and net-worth. It is
not possible to determine whether the money
beliefs precede education and income
attainment or whether the lower levels of
education and income lead to certain beliefs
about money. It is simply known that there is
an association between them to be aware of in
working with clients around money.
• M Gillen & DN Loeffler (2012) conclude that
the financial and political situation of the initial
21st century has been full of clamour. Faced
with monetary downturn, rate cutbacks in
social processing, and an expanded insistence
on personal answerability, there is an increased
want for educational institutions to put
together graduates in human offerings and
economic undertakings to be proficient
financial professionals. Enlightening society
regarding the phenomenon of economic
administration and personal finance is an
essential element of this system. Moreover, by
enhancing choices for economic social work
program, certificates and syllabus related
material, there will be an elevated attention
and usage of f inancia l therapy and
professionals involved in financial planning; as
a result, giving rise to a unified multifarious
body of workers that can adequately meet the
requirements of clients.
• MA McCoy, DB Ross, JW Goetz (2013) point
out that there exists an urgent need for the
unfolding of greater structures and techniques
for conveying varied interventions pertaining
to financial therapy which are tailor-made to
upgrade financial demeanour and ability to
take decisions. There is also a vigorous
requirement to augment the information of the
emerging area called financial therapy by
ensuring expansion in financing, scripting and
research. A means of doing this can be by
equipping professionals with both models and
methods to carry out financial therapy related
interventions into their professional proceeding
to serve their clients in a more efficient way.
D e s c r i p t i v e f i n a n c i a l t h e r a p y i s a
comprehensible, combined, abstract-based, and
non-automated approach for psychic wellbeing
and also for professionals belonging to
financial planning so that they can use their
work for clients. Nonetheless, upcoming
research and experimental confirmation is
required to back this approach to further
rationalize its application.
• JP Dew & JJ Xiao (2013) have inferred that
their study contributes to the literature in a
number of ways. It is the first study that we are
aware of that used a national survey to
examine the associations among financial
problems during the 2007 – 2009 Recession,
financial management behaviours, and
relationship happiness. It also included both
married couples and cohabiting couples.
Further, it is one of the first studies to
demonstrate that financial behaviours are
associated with relationship happiness.
Hopefully future studies will continue to
examine the relationship between financial
behaviours and relationship quality. The
insights garnered from such studies would be
particularly useful both to researchers and to
practitioners who work with couples.
OBJECTIVES• To expound the notion called Financial
Therapy.
• To understand the reasons which damage the
Amity Business ReviewVol. 21, No. 1, January - June, 2020
47
Financial Therapy: Eliciting the Fine Points and Professional Preconditions of An Evolving Field
financial health of Indian people.
• To comprehend the global Financial Therapy
scenario.
• To clarify the difference between financial
therapy and financial coaching.
• To clarify the issues involved in expansion of
financial therapy as a profession.
RESEARCH METHODOLOGYMethodology is of great importance in any activity
related to research and research design represents
the plan of action for the research being carried
out. In the above context the current research
paper adapts an exploratory research design. The
author has made an in-depth literature review and
has particularly gone through various kinds of
literature like financial journals, investment related
blogs and websites available on varied platforms.
Although being a nascent subject literature on
financial therapy is still scarce. The author has also
consulted Financial Experts and Investment
Advisors of quality and caliber but as already
stated that since the subject is still in its nascent
stage from the standpoint of business research. The
thoughts and views of many experts have been
given a place in the paper at various places.
ISSUES DAMAGING THE FINANCIAL HEALTH OF INDIAN FAMILIES• Spouses don’t deliberate about their mutual
goals
Even today in most Indian family’s people
basically do not talk about the shared goals
with their spouses – and even if they do, it is
largely just knocking heads because their
objectives are rarely in calibration. Normally
both have unclear intentions regarding having
kids and possessing a house, but anything over
and above it – and anything exclusive to either
of these aforementioned issues – vary
markedly between both of them. Further,
people rarely deliberate with their partners and
discuss about where they wish to see
themselves in a time span of five years, ten
years or for that matter in twenty-five years.
Not very often do they gauge what they want
personally, and then take cognizance of the
fields where they extend beyond, although
what is actually needed here is to concede a
little and turn up with comprehensive plans for
things that are mutually desired by both and
for which both are willing to work in sync.
• Absence of a budget or consumption bar,
especially on immaterial items
In today’s world failure in keeping an imprint
of – and taking management of – one’s
expenditures on non-essential products are
nothing short of a financial crime. Quite a lot of
people naturally don’t take enough pain to
regularly check their disbursements on a lot of
objects in any way or form, and they are more
often perturbed at the huge quantity of money
measly spent at the time when credit card bill
becomes overdue. But they settle it and lose
sight of it yet again. While sticking to the
budget requires honesty and commitment from
all members, there always exists a need to
concede to a spending limit for all members of
the family and taking up any further spending
post that.
• No fund for emergency or disability
Quite a lot of people are oftentimes entirely
o b l i v i o u s t o e x p e n s e s b e y o n d t h e i r
expectations. It eventually turns into a
catastrophe if the vehicle they have bought
ceases to function or they give up on their
livelihood. The result is instant mode of
overwhelming fear. Now if we enquire with
any lay man on what will they do if the main
bread earner of the home abruptly passes away
or becomes seriously wrecked, what you will
Amity Business ReviewVol. 21, No. 1, January - June, 2020

48
Financial Therapy: Eliciting the Fine Points and Professional Preconditions of An Evolving Field
often see is a panicked “deer in the headlights”
look. Further we observe, almost everyone
hears from many people who are undergoing
severe troubles post the incompetence or
decease of a significant wage earner.
• Prevalence of anti-prudence i .e. pro-
consumerism perspective
Quite a few people figure themselves out
abstaining thrift. They mostly subscribe to the
thought which states “you only live once” and
that “settling” for the best available substitute
or the least costly alternative is not a plausible
option. People who give credence to this fact
are often put under strain from their peers to
undertake expenditures and then the same
people pass on the pressure to others for
behaving the same – one cannot survive
economically if he/she chooses to be live like
that of girls/boys. But while many do not
realize the repercussions of their extravagant
and flamboyant lifestyle earlier, later financial
distress begins to take a toll upon them. Now
if you are going through economic hardships,
getting over this lapse is definitely significant –
ultimately, when anybody is only some steps
away from shut out or insolvency, every penny
counts more than anything else.
• Most acquirements are financed through debt
and are often bought hastily without research
With increasing per capita income and
incremental job opportunities particularly in
the private sector the desire to lead a luxurious
lifestyle has also seen a rise manifold. This has
translated into the figures of rising sales of
millions of new automobiles every year,
although only a handful of buyers can actually
spare to pay for them in monetary terms.
Nonetheless, the failure to pay cash for a new
automobile signifies the impotence to sustain
the automobile. All in all, the ability to catch
up on the payment part does not actually
signify the capability to afford the automobile.
Moreover, by loaning funds to purchase an
automobile, the buyer has to pay interest on a
kind of asset which depreciates; this magnifies
the gap between the value derived from
automobile and the monetary price disbursed
for it. Worse yet, a lot of people transact in
vehicles every three or four years and
eventually end up losing money on all their
trades.
• Failure in Investment diversification
The last worry which is mostly heard is that
commoners are thoroughly panic stricken by
the slowdown in the global equity market and
have witnessed their savings reserved for
retirement lose 25-40% of its value over the
previous year. This is particularly correct for
those who are nearing their age of retirement –
losing 40% of the retirement fund in the years
just preceding retirement implies that they will
have to work for a longer span of time than
usual. In India particularly the retail investors
with relatively smaller savings are not so much
into the equity markets and their exposure to
financial instruments is still quite low when
compared with other countries while the major
chunk of investments going into the real estate.
This makes the overall investment picture in
India less diversified.
GLOBAL FINANCIAL THERAPY SCENARIOMoney has highly significant meanings to different
people such as security, peace of mind, well-being,
freedom, love, strength, power, control, anxiety,
helplessness, fear etc. Whether it is anxiety with
reference to payment of invoices and bills, remorse
at expenditures or feeling of insufficiency over our
salary earned, many recent researches have shown
money to be a prime cause of concern, and one of
the key reasons of arguments and discord between
couples and families.
Amity Business ReviewVol. 21, No. 1, January - June, 2020
49
Financial Therapy: Eliciting the Fine Points and Professional Preconditions of An Evolving Field
Even the affluent and elite do not stand immune,
going by the Capgemini’s annual World Wealth
Report, with major causes of concerns for
millionaires in 2018 ranging from measures
involving preservation of their lifestyle to whether
their descendants are capable enough to manage
their inheritances. Financial Therapy is a rapidly
growing area of practice in the U.S., here the
incumbent Financial Therapy Association(FTA)
has members in excess of 250, financial therapy
integrates classical financial consultation with a
more enthusiastic and emotional psychological
examination of what are the key drivers shaping a
client’s behaviour towards his money holdings.
“The obstacles that keep us from having more and
being more are rooted in the emotional,
psychological and spiritual conditions that have
shaped our thoughts,” this is what U.S. financial
expert Suze Orman writes in The Road to Wealth:
A Comprehensive Guide to Your Money. “In other
words, what we have begins with what we think”.
Although the practice called financial therapy has
yet to make a mark in U.K. – but Kristy Archuleta
who is the current president of the Financial
Therapy Association (FTA), admits it is only a
matter of time. Financial coaches such as Simonne
Gnessen tread similar ground, Gnessen who is the
co-author of Sheconomics and patron of Wise
Monkey Financial Coaching came to financial
therapy via a course in neurolinguistic
programming.
But amidst all this in the Indian context it can be
safely assumed that the advisor's job is more about
being a trusted hand to hold during times of
market stress. It's their job to keep clients calm and
confident for the times ahead, more so than it is
about specific market performance. Thus the final
conclusion can be that "The role of the financial
advisor may become more like a financial therapist
in the future."
Financial Therapy vs. Financial Coaching
To the extent that exercises concerned with the
eradication of perplexity, money disarray,
dysfunctions, all actions akin to the reinforcement
of well-being and flawless operation are
designated as two distinctive realms. In this
context it can be stated that there stands a
difference amid financial coaching and financial
therapy. Under his profession a financial therapist
is trained to accord with clients who are
undergoing both psychological money muddle and
those desiring economic growth and expedience.
For the purpose of illustration, Fairley and Stout
(2004) developed a model pertaining to the area of
traditional therapy which propounds that while
therapists are competent enough to understand
clients coming between 10 to +10, a coach is
confined to those clients from 0 to +10
(illustratively a normal problem).
In extension to dealing with money related
disorders, a field wherein financial therapists carry
a definite advantage over financial coaches is in the
area called psychometrics. Going by the central
idea, financial coaches do not carry out
psychological economic diagnosis or testing.
Coaching is an interposition focusing on toughness
and explanations and lays no emphasis on the
basis of the complication (Buckley, 2007; Williams
& Davis, 2007). Financial therapy is primarily
meant to target on the origin or reason behind a
problem, but it is also capable of being viewed
from a clarification-focused outlook as represented
by Archuleta, Grable, and Burr (2015).
Financial coaching is not dependent on definitions
of mental illness derived from models of medical
science. Truly speaking, coaching does not and
should not aim at eradicating health problems of
the mind and/or money related distortions. But
quite a few clients undergoing financial coaching
probably display elevated levels of apprehension,
incalculability, and stress owing to their economic
hardships; it may be an error to compare financial
issues with clinical pathologies (Delgadillo, 2015).
Amity Business ReviewVol. 21, No. 1, January - June, 2020
50
Financial Therapy: Eliciting the Fine Points and Professional Preconditions of An Evolving Field
Nonetheless, the major distinction lies in the fact
that financial therapists (if adequately skilled) have
the choice of depending on medical analysis of
money obsessions or muddle if they deem it fit for
remedy.
We can also differentiate financial coaching and
financial therapy on the basis of time orientation.
While operating with issues concerning the present
and future—similar to what is done by financial
coaching —financial therapy possesses the
capability to deal with traumatic situations of the
past. Relying on the various therapeutic
standpoints, financial therapists are poised to
tackle the past, present, and future of their clients.
If adequate training is provided, clinical analysis
and diagnoses may be the way out with
approaches to deal with dysfunctions.
FINANCIAL THERAPY AS A PROFESSIONEven today in most parts around the world
bringing up the topic of financial therapy tends to
leave people speechless most probably because it is
not that common a term. Moreover, it integrates
two concepts that most people prefer to dodge:
therapy and finance. In fact all one needs is to just
put them together, and the result is a real
conversation killer. In the words of New York-
based financial therapist Amanda Clayman
“Financial therapy differs from general
psychotherapy only in that it's focused on
enhancing financial well-being through the study
of the emotional, behavioural, cognitive, relational,
economic and integrative aspects of financial
health. In practice, it integrates financial
counsell ing and planning with personal
counselling, marriage and family therapy,
sociology, social work, and, of course, psychology.
Also, good financial therapy happens in
collaboration with finance professionals, such as
tax experts and investment advisers.”
As per Forbes, the Financial Therapy Association
(FTA) came into existence almost ten years ago.
And while financial therapy has grown as a
profession since then, the quantum of financial
therapists is still mostly exceeded by the numbers
of coaches and financial planners. The reason
behind this can be that the profession is lesser-
known, setting up oneself can definitely be a huge
task -- particularly given that there is no need for a
license or training to undertake the practice of
financial therapy.
Although, there are certain things a person can do
to position himself/herself for attaining
accomplishments in this emerging area. As per
financial therapist Bari Tessler, the initiating step
requires taking into cognizance the relationship
with your own money. “One must do his own
work prior to truly helping other people. (This
does not imply that you will ‘fix’ your relationship
with money once and for all — I accept the fact
that our relationship with money is always
flourishing and unfolding, and we can never be
“done” with it.). Doing our own work is the best
path to become more familiar with the issues,
emotions and tools and we need to uphold others,”
Tessler says. Additionally, just because a particular
degree or certification is not required does not
mean it is not significant. Financial therapists
normally are trained to be mental health
professionals, economic planners or social workers.
This means that those who do not act as financial
planners must possess some type of therapeutic
licensure, such as a progressive degree in
psychology, family therapy, marriage and or social
work.”
Finally, the economic and political landscape of the
early part of 21st century has been full of
commotion. Confronting the financial recession,
cutbacks in social programming and an enhanced
insistence on personal answerability, there exists
an enlarged requirement for scholastic institutions
to put students in a state of readiness for human
services and financial professions to ultimately
become proficient financial practitioners.
Amity Business ReviewVol. 21, No. 1, January - June, 2020

51
Financial Therapy: Eliciting the Fine Points and Professional Preconditions of An Evolving Field
Educating commerce and management graduates
regarding the phenomenon of f inancial
management and personal finance is an intrinsic
part and parcel of this process. Moreover, by
developing alternatives for financial and
economics graduates like certificates, courses and
curricular subject matter, there will be an
incremental understanding and application of
financial therapy and financial planning
professionals, thus giving rise to a more inclusive
multidisciplinary workforce which is tailor-made
to reconcile the needs of client.
REFERENCES
Kim J.H., GaleJ., GoetzJ.and Bermúdez J.M. (2011),Relational
financial therapy: An innovative and collaborative treatment
approach, Contemporary Family Therapy, Springer.
Grable J., McGill S.and Britt S. (2010),The financial therapy
assoc ia t ion : A br ie f h i s tory , Journa l o f F inanc ia l
Therapy,www.newprairiepress.org.
Gale J., Goetz J.andBritt S. (2012), Ten considerations in the
development of the financial therapy profession, Journal of
Financial Therapy, www.newprairiepress.org.
Archuleta K.L., Burr E.A. and Dale A.K., (2012), What is
financial therapy? Discovering mechanisms and aspects of an
e m e r g i n g f i e l d , J o u r n a l o f F i n a n c i a l T h e r a p y ,
www.newprairiepress.org.
Hays P., Klontz B.T. and Kemnitz R., (2015), Seven Steps to
Culturally Responsive Financial Therapy, Journal of Financial
Therapy, Springer
Klontz B., Britt S.L. and Mentzer J., (2011),Money beliefs and
financial behaviors: Development of the Klontz Money Script
I n v e n t o r y , J o u r n a l o f o f F i n a n c i a l T h e r a p y ,
www.newprairiepress.org.
Gillen M. and Loeffler D.N., (2012),Financial literacy and social
work students: Knowledge is power, Journal of Financial
Therapy, www.newprairiepress.org.
Collins J.M. and O'Rourke C.M., (2012),The application of
coaching techniques to financial issues,Journal of Financial
Therapy, www.newprairiepress.org.
McCoy M.A., Ross D.B. and Goetz J.W. (2013), Narrative
financial therapy: Integrating a financial planning approach
with therapeutic theory, Journal of Financial Therapy,
www.newprairiepress.org.
Dew J.P. and Xiao J.J., (2013), Financial declines, financial
behaviors, and relationship satisfaction during the recession,
Journal of Financial Therapy, www.newprairiepress.org.
Financial Coaching and Financial Therapy: Differences and
B o u n d a r i e s , ( 2 0 1 5 ) , h t t p s : / / w w w . r e s e a r c h g a t e . n e t
/publication/281608427.
Hamm T., (2018), The twelve biggest personal finance mistakes
people make over and over again, The Simple Dollar.
Amity Business ReviewVol. 21, No. 1, January - June, 2020
INTRODUCTIONEvery emerging economy has reaped the benefit of
real estate and construction sector since it
continues to be large employer as well as wealth
creator for every nation, and India is not an
exception to this economic phenomenon. "Based on
various reports the real estate sector looks fertile
for future growth and the Indian real estate market
may touch US$180 billion by 2020.” (Neerav
Merchant, 2016). Although past five years has not
been very encouraging for Indian Real Estate
Sector. Industry accepts that home buyer’s
confidence across the country is lowest in the past
10 years. Reasons for this discouraging scenario
are many i.e. increasing interest on project finance,
poor return on investments, grossly delayed
delivery of houses, substandard quality of
constructions and abysmal sector outlook.
Although a closer look would reveal little different
story for residential real estate collapse in India i.e.
erratic and irresponsible project planning as well
as purchase behaviour of buyers which is never on
sound backing of reliable research and data.
One of the core issues in all these aspects is the
information gap that runs wide in this sector. Both
builder and buyer are responsible for this situation
since closely held real estate business has a very
poor record of disclosures and customer is not very
demanding. No third party is providing reliable
data on real estate projects and the sector continues
to be under pressure due to information
As per estimate for majority households their most expensive purchase in lifetime is property, residential or otherwise, locking 15.8% of the world’s wealth in real estate (Capgemini World Wealth Report 2017). Often first property purchase by an individual is residential. In current times, Indian real estate market, despite the digital revolution, property purchase decisions are not yet based on data analytics. At best they are supported by a formal market research or valuation exercises, rather than a data-based decision. In Indian real estate market, property purchase decisions are influenced by heard behaviour, family and relatives, promotional offers and gut feel (Piyush, Bhatt,2016). This approach in decision making for the most expensive purchase of lifetime often backfires as it is nothing more than leaving everything to fate and prayers.
Indian real estate market has been questioned for its transparency, raking 34, (Global Real Estate Transparency Index, 2020) on several parameters including transaction processes, investment performance, data and regulations. Even though there are several digital property information platforms, it does not really help in residential property buying decision making for a customer, since these portal shave focused on structured information delivery rather than accuracy, the only duplicate developer provided information although in a structured manner. In such circumstances Big Data and protect is not yet enabling real estate buyers in decision making as it is effectively doing in other domains i.e. e-commerce, e-governance, financial markets etc.
Implementation of Real Estate Regulatory Authority (RERA) Act in July 2017 has been a disruptor in several ways for Indian real estate market, availability reliable data for under construction and new projects is one of them. As per regulations of RERA, every under construction or new real estate projects have to mandatorily register with concerned RERA Authority of their state and project information to RERA in the prescribed format that would be publicly available. This regulatory requirement is resulting in a large amount of reliable data with every state RERA which is currently unexplored.
This paper attempts to explore the potential use public data of RERA Authority for development of a digital platform using Big Data and GIS Applications to help customers in taking purchase decisions.
Keywords: Real Estate, Property, Big Data, Technology, RERA
Big Data Analytics in Residential Property Buying Decisions in India
52 Amity Business ReviewVol. 21, No. 1, January - June, 2020
1Shiv Prasad Singh , Nitesh Rohilla & Dr Amit Kumar1,2 & 3 Associate Professor, RICS School of Built Environment, Amity University Noida, Uttar Pradesh, India
2 3

53
Big Data Analytics in Residential Property Buying Decisions in India
asymmetry.
Property purchase in India is always a challenge
since often it is the most expensive purchase of a
lifetime for an individual buyer. Property buying
decisions rather than being a data-based, is marred
by herd behaviour, family and relatives’
influences, promotional offers and gut feel (Piyush,
2016). This approach in decision making for
property the most expensive purchase of lifetime
often backfires as it is nothing more than leaving
everything to fate and prayers. Data based decision
making is also difficult since property information
is either missing, incomplete, duplicate, or
fragmented. Typically, a property record consists
of numerous information like property maps,
layout and design, product specifications, legal
documentation, multiple taxes, statutory
approvals, compliance certificate etc. This data is
maintained by different stakeholders who do not
have a strong compliance system to maintain the
property data which results in data redundancy,
duplication or data gaps in real estate business that
creates access barriers for a prospective buyer
while conducting secondary research.
Although transparency, governance standards and
digitisation is increasing in real estate sector,
through availability of online web portals as well
as web sites of projects, consumers can now access
the data without being present at the site. Virtual
visit of the property is now becoming popular in
the market and many property transactions are
being executed online for capital and rental
transactions. All these digitisation efforts are
focused on better customer experience, but final
purchase decision behaviour is still not data based,
but there is strong anticipation that this purchase
behaviour in India shall change because of
implementation of Real Estate (Regulation &
Development) Act, 2016, as it is expected to bring
about radical changes in real estate sector.
LITERATURE REVIEWSince we are embarking to a relatively new
research area it is imperative to understand what is
the role of disruptive technology and what is ‘Big
Data’ prior to exploring its application in data-
based decision making in real estate residential
property purchase, following is the role of
disruptive technology and definition of Big Data
by leading technology pioneers is a good starting
point.
Within the real estate context, “technology” may be
construed in a broad sense to include innovative
software, hardware, materials, construction, and
design (The Real Comm Conference Group LLC,
2015)
Technology has the potential to allow countries
around the world to develop a comprehensive real-
time database of the use and ownership of
buildings. Countries such as Sweden, Ghana and
Georgia are already conducting trials on these
aspects. This could be transformational because
transparency in real estate markets has a profound
impact on both economic development and the
quality of life of citizens.(Couse, 2016)
(The Economic Times, 2019) “McKinsey influential
Report claimed that the range of data science will
be the number one catalyst for economic growth.
McKinney identified Big Data as one of the new
opportunities that contributed to the launch of the
Big Data era. A growing torrent of data, this
approach indicates that data seems to be coming
continuously and at a fast rate”.The report also
says that ‘‘India is one of the largest and fastest
growing markets for digital consumers, with 560
million internet subscribers in 2018, second only to
China. India will see internet users rise by about 40
per cent and the number of smartphones to double
by 2023”.
India is contributing significantly in Big Data
generation since in the past decade and a half,
Amity Business ReviewVol. 21, No. 1, January - June, 2020

54
Big Data Analytics in Residential Property Buying Decisions in India
several property portals have come into being and
providing digital information to the prospective
residential property buyer. These property portals
do not verify information and prospective property
buyers and Investors are expected to undertake
their own due diligence of available data. Since
before taking any investment decision investors
/buyers are expected to collect information from
multiple sources and analyse it themselves,
investors often do not take rational decision and
their decisions get influenced by emotional or non-
relevant factors. Naturally it ends up in an
dissatisfied customer.
Real estate purchases have now become
commoditised even though it is an investment
class asset. Like any other commodity customer
satisfaction is an important dimension of this high
value purchase for individuals. Quality of service,
transparency, ethical dealings, and customer
satisfaction have never been strength of real estate
sector even though it at centre of discussions for
other goods and service in public domain. It has
affected reputation of real estate business as well as
supply side stakeholders. Introduction of customer
satisfaction survey, which can provide an
opportunity to obtain information about the needs
of customers and control the quality of services
provided, is essential for the successful operation
of the company in order to maintain one of the core
values – customer service quality – at a high level
(Putniņš, 2007). Research has established (Basil &
Weber, 2006; Golob, Lah, & Jančič, 2008; Wang &
Juslin, 2012) that customer satisfaction approach
has g lobal appeal in posi t ive business
performance.
Research also shows that property purchase
behaviour in developed and developing economies
are comparable since it is not entirely data-based
rational decision but it dominated by perceived
value by customers (Raghubir, P & Corfman, K,
1999; Monroe, K. B., 1990; Monroe, K. B., Krishnan,
R. 1985). Although high value purchase such as
residential property cannot be purchased with
such sentiments. This situation presents us an
opportunity to further delve into this aspect and
explore if the technological solution may improve
the decision-making behaviour of residential
property purchase.
METHODOLOGYThis research paper is exploratory in nature. It can
be summarized from the above review that how
Big Data can play a significant role in consumers’
buying decisions and how Real Estate (Regulation
and Development) Act 2016 (RERA) can effectively
support decision making through Big Data or
availability of data. In India, data is available with
various stakeholders whereas data freely available
in public domain in unverified hence cannot be
relied upon. The emphasis of this paper is on the
effective use of information available with RERA
authority in the consumer buying decision.
Purpose of this study is to explore the potential use
of Big Data analytics in residential property buying
decision making since, in this process, decision
influencers are several and it is difficult to analyse
them adequately with the conventional approach.
The study is mainly based on secondary data that
has been collected from published journals, media
reports, web resources, industry reports and
annual reports. Since topic specific research is not
available in Indian context so far, literature review
has been undertaken to broadly understand high
value purchase behaviour of consumers and role of
big data in such decision making process.
BIG DATA AND ITS ROLE IN REAL ESTATEImportance of data is undisputable in present
times. We could make a planned decision if data is
accurate and authentic but all those muddled set of
numbers must be analysed before one could extract
a piece of valuable data from them or conclude on
a decision. Since the analysis of large dataset is an
impossible task for a human being, the computer
Amity Business ReviewVol. 21, No. 1, January - June, 2020

55
Big Data Analytics in Residential Property Buying Decisions in India
algorithm is a reliable alternative.
Big Data refers to the massive dataset which may
be structured or unstructured. Big Data analytics is
the process of examining the patterns of large data
sets and underline insights.
Structured data: Any type of data which has a
specified format and processed in a fixed
structured. There are several tools and techniques
working with such kind of data (Where the format
is well known in advance).
Example of structured data: An employee table in a
database is a good example of structured data
where employee_id, employee name, gender and
department is given.
Unstructured data: Any data which a specified
format doesn’t have, in addition to that size of such
data is huge and which is very difficult to process
for deriving value out of it.
Example of unstructured data: Heterogeneous data
source containing simple text files, images, videos
are the typical example of unstructured data. For
example, the output returned by ‘Google Search’ or
‘Amazon’.
These days Big Data analytics is being integrated
and used by almost all the industry and the real
estate sector is also not an exception to it. The term
“Big Data” is now commonly used to refer to all
digital data for a long time but now it is proving to
be a positive contributor for the growth of
businesses, governance and empowering citizens.
Availability of large quantum of data with
corporations can be utilized for logical analysis and
development strategies that may lead to the
betterment of citizens and society.
“Madden (2012) summarises Big Data as data that
is too big, too fast, or too hard for existing tools to
process since new technologies are required to
analyse it.” Older ways of analysing such large
quantity of data may not be productive, situation
becomes even more complex since often data is not
static and continuously changing due to sensor and
social media based sources. (Provost & Fawcett,
2013). “Clearly, only Big Data is not good news
since until it is not coupled with relevant analytical
tools (Ward & Barker, 2013), it would prove
worthless causing meaningless effort and expenses
of managing and storing it.”
“Big Data and the associated computational
techniques can be compared with system of mass
production devised by Henry Ford(Boyd &
Crawford, 2012). The information extracted from
Big Data, they propose, has the potential to change
the way we think about many different areas of
research, from economics to the social sciences to
medicine and disease.”
Disruptive technology can play a crucial role in
improving customer satisfaction and experience
because recent developments in technologies and
improved data gathering through Big Data and/or
other techniques have brought many changes in
the evolution of the Real Estate Industry. A
comprehensive analysis using Big Data by
superimposing spatial information, project and
promoter information, regulatory information and
information on the macro-economic environment
would help property purchasers in taking rational
decisions.
POSSIBILITIES OF DATA ANALYTICSBecause of rapid growth in emerging technologies,
it is now easy to capture, analyse and communicate
with data. It is being leveraged by businesses to
create digital applications where machine learning
applications analyse, multiple kinds of data which
is now available from city administrators,
infrastructure providers, public & private
businesses and citizens.
Matrix below represents shows the list of active
web portal and services offered by them in the real
estate sector.
Amity Business ReviewVol. 21, No. 1, January - June, 2020

56
Big Data Analytics in Residential Property Buying Decisions in India
Improved data quality, multi-faceted analytical
tools and superior visualisation techniques are
now making it possible to develop better insights
on urban issues and real estate markets. Real time
data and decision making based on that, for service
delivery, its management and optimisation is now
possible and can be correlated with real estate
values. This kind of analysis “provides an
unprecedented potential from enhancing real
estate property buying decisions, better forecasts
for building utilization, more accurate assessment
of the purchasing power of users of real estate and
by better risk assessment of real estate users”
(Herman Donner, 2018)
“Physical things are now creating an enormous
amount of Big Data through sensors across the
urban environment, on building, roads,
streetlights, infrastructure and various other
places. Smartphones, tablets, social media
platforms, and network connected vehicles are all
part of what is known as the internet of things
(IoT) that allows for collection and application of
knowledge on the environment and increasingly
using Big Data analysis to predict market trends”(S
Gregory Yovanof, 2009).
IMPACT OF RERA IN DATA DIGITISATIONAfter successful implementation of regulators in
different business sectors i.e. Capital Markets,
Telecom and Insurance it was imperative that real
estate sector also gets an effective regulator for
obvious reasons of improving consumer
protection, increasing transparency, imparting
professionalism and fixing responsibility of real
estate developers and property brokers. With these
noble intentions model Real Estate (Regulation and
Amity Business ReviewVol. 21, No. 1, January - June, 2020
Table 1:Digital Platforms & Service Offered in Real Estate Sector
B2B Operations • • • • • • • • •
B2C Operations • • • • • •
Property listing, Buy, Rent, Sell • • • • • •
Map Search Option •
Project Search through RERA ID •
Property Feedback • • • • • • •
Expert Opinion of legal/Vastu/Home Loan • • • • •
Home Loan Calculators • • •
Public database • • • • • •
Subscription based operation • • •
Publishes sector trends report • • •
Proprietary data • •
Professional analytics support • • • •
Interactive 4D view of project •
Service Offered
Web Portal
Mag
icb
rick
s
Lia
ses
Fo
ras
Pro
pst
ack
99 a
cers
.co
m
Pro
peq
uit
y
Ho
usi
ng
.co
m
Pro
pti
ger
Qu
icke
r H
om
es
Mak
aan
.co
m
Sources: Secondary research through web resources, 2019, such as (99acer.com, n.d.), (Magic Bricks, n.d.), (Liases Foras, n.d.)

57
Big Data Analytics in Residential Property Buying Decisions in India
Development) Act 2016 (RERA) was passed by
parliament. Since Land is part of state list for
legislation, respective state governments of India
had to adopt this model RERA through legislation
and ensure implementation from May 01, 2017.
Key provisions of RERA were primarily consumer-
centric that also necessitated mandatory
registration of all ongoing projects with RERA
Authority (Regulator), therefore significant
disclosures about promoter, project, statutory
approvals as well as associated stakeholders came
into public domain and project promoter was liable
for its factual sanctity. This was the first
breakthrough for Regulator, since prior to RERA
real estate project developers always retained right
for revision in published information even after the
transaction between property buyer and project
developer was concluded and agreements were
signed.
Although in India, several private businesses have
launched online property portals in the past one
and half decades (Table 1: Digital Platforms &
Service Offered in Real Estate Sector Sources:
Secondary research through web resources, 2019,
such as (99acer.com, n.d.), (Magic bricks), (Liases
Foras) in public domain, but none of them take
liability for accuracy of their data since most of
them has been organised asan internet media
business publishing classifieds for consumer
consumption and some value-added service to
increase consumer traffic. Such information is not
reliable even though it is part of Big Data. RERA
has changed this situation for good.
As per (Kimberly Winson-Geideman, 2016)real
estate traditionally generates three types of data –
1. Financial, 2. Transactional and 3. Physical.
Financial data represents capital market and listed
securities data of real estate assets. Transactional
data represents information on real estate
transactions, mortgages, taxes, expenses, leases
and financial returns. Physical data represents
information about land, project, structure, its
characteristics, typology and spatial information
(location, geography, neighbourhood).
Mandatory registration of projects is generating
limited Transactional Data and but significant
Physical data in real estate sector. A representative
table of these data sets for a project is presented in
the table below which is being currently captured
by RERA:
A typical residential property buyer while
undertaking market research to arrive at a
purchase decis ion in her/his identi f ied
neighborhoods/he is concerned with, is now
available with Regulator. This availability of
factual and reliable data is opening several
interesting Big Data Analytics possibilities that
would help all stakeholder in better decision
making. This analysis can be undertaken at core,
spatial and peripheral data level(Kimberly
Winson-Geideman, 2016).
SPATIAL DATA ANALYSISIn the Indian context, a typical residential property
buyer often concludes neighborhood for purchase
very quickly based on personal preferences and
rational. Often this decision is influenced by return
on investment, affordability, social group connect,
peer and family reasons or purely on a speculative
basis. In the National Capital Region (NCR), that
includes constellation of seven cities around Delhi,
primary market residential property purchase
decision in terms of choice of city is the easiest for
an aspiring buyer. So far, such decisions are
influenced by two key factors i.e. personal bias
about a city and affordability. Personal bias itself
may be influenced by one or several factors which
have a varying degree of importance for an
individual such as proximity to work, better
educational facilities for children, quality urban
infrastructure, conducive social, safe urban
environment etc. Clearly tangible aspects of
property purchase such as investment rationale,
return on investment, total stock in a micro-
market, demand supply scenario, available social
Amity Business ReviewVol. 21, No. 1, January - June, 2020
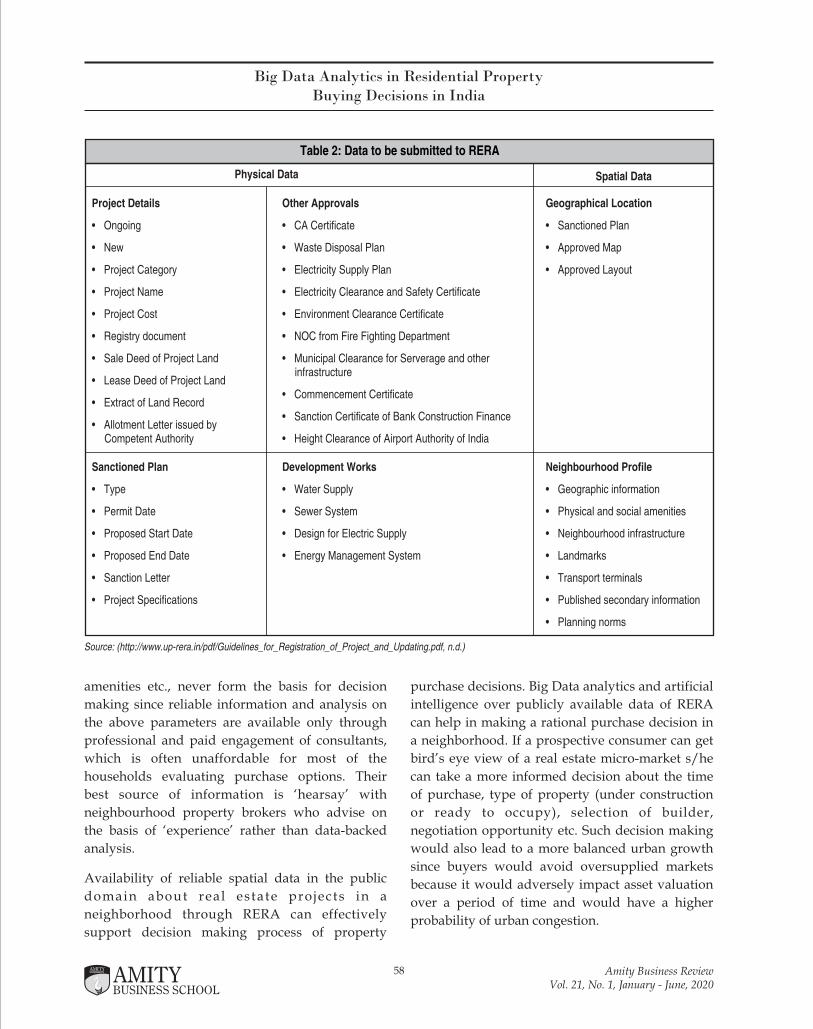
58
Big Data Analytics in Residential Property Buying Decisions in India
amenities etc., never form the basis for decision
making since reliable information and analysis on
the above parameters are available only through
professional and paid engagement of consultants,
which is often unaffordable for most of the
households evaluating purchase options. Their
best source of information is ‘hearsay’ with
neighbourhood property brokers who advise on
the basis of ‘experience’ rather than data-backed
analysis.
Availability of reliable spatial data in the public
domain about real estate projects in a
neighborhood through RERA can effectively
support decision making process of property
purchase decisions. Big Data analytics and artificial
intelligence over publicly available data of RERA
can help in making a rational purchase decision in
a neighborhood. If a prospective consumer can get
bird’s eye view of a real estate micro-market s/he
can take a more informed decision about the time
of purchase, type of property (under construction
or ready to occupy), selection of builder,
negotiation opportunity etc. Such decision making
would also lead to a more balanced urban growth
since buyers would avoid oversupplied markets
because it would adversely impact asset valuation
over a period of time and would have a higher
probability of urban congestion.
Amity Business ReviewVol. 21, No. 1, January - June, 2020
Table 2: Data to be submitted to RERA
Project Details
• Ongoing
• New
• Project Category
• Project Name
• Project Cost
• Registry document
• Sale Deed of Project Land
• Lease Deed of Project Land
• Extract of Land Record
• Allotment Letter issued by Competent Authority
Sanctioned Plan
• Type
• Permit Date
• Proposed Start Date
• Proposed End Date
• Sanction Letter
• Project Specifications
Other Approvals
• CA Certificate
• Waste Disposal Plan
• Electricity Supply Plan
• Electricity Clearance and Safety Certificate
• Environment Clearance Certificate
• NOC from Fire Fighting Department
• Municipal Clearance for Serverage and other infrastructure
• Commencement Certificate
• Sanction Certificate of Bank Construction Finance
• Height Clearance of Airport Authority of India
Development Works
• Water Supply
• Sewer System
• Design for Electric Supply
• Energy Management System
Geographical Location
• Sanctioned Plan
• Approved Map
• Approved Layout
Neighbourhood Profile
• Geographic information
• Physical and social amenities
• Neighbourhood infrastructure
• Landmarks
• Transport terminals
• Published secondary information
• Planning norms
Physical Data Spatial Data
Source: (http://www.up-rera.in/pdf/Guidelines_for_Registration_of_Project_and_Updating.pdf, n.d.)

59
Big Data Analytics in Residential Property Buying Decisions in India
Amity Business ReviewVol. 21, No. 1, January - June, 2020
Graph 1: A typical residential property purchase decision making process.
60
Big Data Analytics in Residential Property Buying Decisions in India
Spatial analysis of RERA data through Big Data
analytics would also help project developers in
taking a rational decision for new project planning.
Through analytics developers would also have
bird’s eye view of entire micro-market so that they
would be able take better business decision about
product mix, target buyer group, project phasing
and delivery period, project specifications,
amenities to be offered in project, marketing and
differentiation strategy etc. In post RERA scenario
project developer’s liability towards regulatory
bodies, as well as customers, have increased
significantly hence it is important that they
carefully analyze the micro market before
committing precious resources and launching a
project.
PHYSICAL DATA ANALYSISPhysical data (Kimberly Winson-Giedman & Andy
Krause, 2016) constitutes property specifics such as
land, structure, specification, amenities, type and
size of units, project layout design, unit layout
design and other quantitative and qualitative
aspects of project, on which a prospective buyer
spends most of his/her purchase evaluation time.
In Indian context practice of involving a qualified
architect or engineer, to advise on vital physical
data prior to property purchase is non-existent,
except for luxury property segment buyers.
Reasons for this attitude are purely financial. Since
usually property purchases are broker assisted
who charge a fee, prospective buyers do not wish
to further inflate their property purchase budget
by engaging other consultants. Often this attitude
backfires for buyers and they end up making a
substandard purchase at market value. Buyer’s
entire focus during the purchase process is on price
and mortgage conditions, more specifically interest
rate and repayment period, as validated by
Mahapatra, Mousumi Singha; De, Anupam (2017).
So far physical data was always transitional since
real estate property developers retained the right
for amendments in it and they kept it revising even
after purchase decision was made. Although basic
design and layout often do not change, project
specifications and other physical data that did not
impact individual properties were always in flux,
e.g. changing the design of community club,
position of entrance gates, internal circulation
patterns, quality & make of finishes etc. In present
c ircumstances as per RERA, al l project
specifications after project registrations would be
fixed and project developers have lost all liberties
for alteration is design or specifications. Therefore,
data available with RERA can be taken as
conclusive and can be effectively used for decision
making analysis using Big Data Analytics.
Through Big Data analytics now purchasers can
effectively compare properties, its specifications,
design and other tangible aspects to arrive at a
rational purchase decision.
IMPACT OF BIG DATA ON VARIOUS STAKEHOLDERSA Piece of information has a cost, sometimes
monetary or non-monetary. So, it is important to
understand the importance of a small piece of
information. In past, it has been found that how
poor-quality data can impact the outcome of the
organization wherein if the quality of data is good
results can be on a brighter side.Big Data in real
estate is now a big term which is turning out to be
a game changer for the industry as well as the
community. With the availability and proper
utilization of Big Data analytics all the stakeholders
including, developers, agents, financial institutions
as well as multiple regulatory bodies can use
analytics for effective governance and consumer
protection. This aspect has been detailed below for
few stakeholders.
For consumer:
Earlier home buyers used to be completely
dependent on traditional real estate broker to buy a
property at a limited location with limited
information. They did not have choice to explore
Amity Business ReviewVol. 21, No. 1, January - June, 2020
61
Big Data Analytics in Residential Property Buying Decisions in India
large number of locations and compare them, but
now accessibility of all the information on a
centralize platform would open up a much greater
possibility of analysis and informed decision
making. A Property buyer can understand demand
and supply in the neighbourhood, types of
property, it's pricing, target economic group and
proposed facilities in various projects which are
their prime concern. Consumers can also develop
some understanding of how their property would
fare as an investment over the medium and long
term in case of a construction development project.
Since information would be from RERA Web
Portal hence it would be reliable and project
developer would be legally bound to deliver
promised product. Although actual transaction
price information would not be available on RERA
Web Portal, but authentic pricing information is
available with few B2B property portals that can be
easily amalgamated through Big Data analytics
under commercial arrangements. Property buyer
would benefit most if Big Data analytics is
supported by RERA Data while making purchase
decisions.
For developer:
Big data analytics would be very useful for project
developers as well since it would help them in
product mix planning, pricing strategy,
specifications& design, understanding sales
velocity, availability of unsold inventory of
different types of product in a micro-market etc.
Analytics around these parameters would help
project developers in positioning their project and
product to ensure success by gap analysis.
Developers would understand the targeted
customer behaviour and accordingly may work on
an effective marketing strategy. This would also
allow developers to achieve a better return on
equity.
For financial institution:
Indian real estate sector is struggling today
primarily for want of finance which has dried up
due to disruption in the market cycle. Financial
institutions also suffered along with developers
and consumers, due to this disruption and
initiating bankruptcy process for several
developers. It would not be unfair to conclude that
Big Data Analytics would have prevented this
catastrophic situation. Had financial institution
knew about total supply in a neighbourhood
within a specified period, they might have taken an
objective view while financing projects or would
have effectively priced their risk. In absence of
reliable public data on supply of housing units,
project developers, as well as consultant, may
present selective information creating an
unrealistically positive picture of neighbourhood
real estate market. Moreover, information about
the solvency of developer in the public domain
would have forced funding agencies not to go
overboard while considering their funding
proposals, saving them from non-performing
assets.
For property agents:
Another significant improvement in service
delivery would take place among property service
providers particularly, property agents. This
important stakeholder of real estate business who
is the backbone of property sales that ensures
project success,was completely out of any
regulatory regime. Although property agents have
attempted to regulate themselves by forming
associations, however, it has rather resulted in
cartelisation, further compromising interests of
property buyers. Property agents have been one of
t h e k e y s t a k e h o l d e r s r e s p o n s i b l e f o r
misrepresentation to customers as well as property
developers. To an extent the entire marketing
ecosystem is responsible for this situation since
available information itself is questionable and cost
of misrepresentation was practically zero for
property agents. RERA has conclusively addressed
the issue of misrepresentation of information since
information is now universally available to all
stakeholders. RERA has put real estate agents
Amity Business ReviewVol. 21, No. 1, January - June, 2020

62
Big Data Analytics in Residential Property Buying Decisions in India
under its ambit with punitive action hence
property agents would also be more diligent with
clients and Big Data analytics would make their
jobs much more accurate, transparent and service
oriented. They would not only share information
with their customers but also be able to discuss
several possible scenarios about prospects of their
property, prior to purchase decision. Big Data
Analytics can transform property agents into
investment consultants.
For Regulatory Bodies:
With the implementation of Real Estate Regulation
and Development Act (RERA, 2016), Every state
authority is now custodian of a significant amount
of reliable data in public domain just like Securities
and Exchange Board of India (SEBI). At present
RERA is taking the role of the reactionary regulator
rather than a proactive regulator. RERA can easily
superimpose its physical and spatial data for
upcoming projects on Geographic Information
System to create multi-layered analysis helping
multiple stakeholders of built environment
business to creatively use it. RERA can collaborate
with private sector analytics firms having expertise
in Big Data layered analytics that can have
multiple application such as land record
verification, resource planning and optimisation,
traffic prediction and planning, infrastructure
mapping and augmentation, supply demand
analysis for reals estate sector, capital appreciation
prospects in a neighbourhood etc.
Below table shows the possible analytics using
RERA Big Data that has been mapped to various
stakeholders which would concern them in various
capacities either as buyer, builder, regulator,
investor or service providers. This table is not
exhaustive, and several combinations and
permutation are possible using Big Data analytics
that can handle millions of bytes of data.
CONCLUSIONTechnology is changing several frontiers in
business domains delivering efficiency and value.
There is no reason why it will not be true for real
estate sector as well. So far real estate sector has
successfully developed digital platforms for
property search that has become first point of
information search for any prospective property
buyer or seller followed by physical meeting or
property inspection. This digitisation in real estate
sector itself is generating large quantity of data that
has potential for trend analysis in term of location
and property preferences among customers.
Although due to questionable reliability of data on
these digital portals (refer Table 1), since it is never
sorted or filtered by any human interface, except
few subscriptions based portals, conclusive
purchase decisions cannot be taken by customer
using these digital classified platforms for real
estate.
RERA Authority has now successfully bridged this
gap of data reliability since project developer is
bound by the information s/he has provided to
regulator. Our analysis shows that the database of
RERA can be effectively used for analytics if
amalgamated with Big Data and that would be
very helpful for a residential property buyer in
taking informed decision. Such analytics shall not
only be useful for residential property buyer but
also for several stakeholders of real estate business.
Research conclusively indicates that RERA
Authority can explore possibilities of partnering
with private sector analytics organization to
harness its data not only to improve governance of
real estate sector but also work towards better
resource planning and urban management.
Layering of RERA data with GIS Spatial Data and
Big Data at large, could open several businesses,
governance and social application for a healthy
real estate market.
This research is one of the early efforts in
effectively using RERA data by amalgamating
analytics for enhancing consumer buying
experience as well as improving governance of real
estate sector. Researchers will further build on
Amity Business ReviewVol. 21, No. 1, January - June, 2020
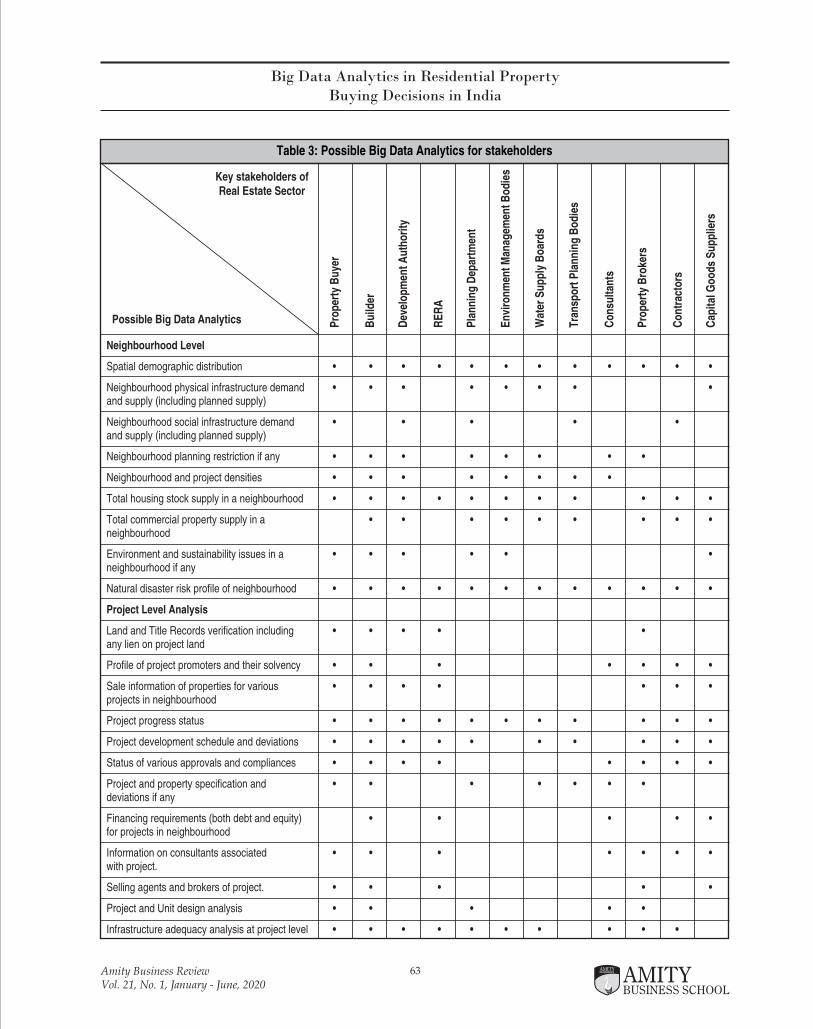
Table 3: Possible Big Data Analytics for stakeholders
Neighbourhood Level
Spatial demographic distribution • • • • • • • • • • • •
Neighbourhood physical infrastructure demand • • • • • • • •and supply (including planned supply)
Neighbourhood social infrastructure demand • • • • •and supply (including planned supply)
Neighbourhood planning restriction if any • • • • • • • •
Neighbourhood and project densities • • • • • • • •
Total housing stock supply in a neighbourhood • • • • • • • • • • •
Total commercial property supply in a • • • • • • • • •neighbourhood
Environment and sustainability issues in a • • • • • •neighbourhood if any
Natural disaster risk profile of neighbourhood • • • • • • • • • • • •
Project Level Analysis
Land and Title Records verification including • • • • •any lien on project land
Profile of project promoters and their solvency • • • • • • •
Sale information of properties for various • • • • • • •projects in neighbourhood
Project progress status • • • • • • • • • • •
Project development schedule and deviations • • • • • • • • • •
Status of various approvals and compliances • • • • • • • •
Project and property specification and • • • • • • •deviations if any
Financing requirements (both debt and equity) • • • • •for projects in neighbourhood
Information on consultants associated • • • • • • •with project.
Selling agents and brokers of project. • • • • •
Project and Unit design analysis • • • • •
Infrastructure adequacy analysis at project level • • • • • • • • • •
Key stakeholders of Real Estate Sector
Pro
per
ty B
uye
r
Bu
ilder
Dev
elo
pm
ent
Au
tho
rity
RE
RA
Pla
nn
ing
Dep
artm
ent
En
viro
nm
ent
Man
agem
ent
Bo
die
s
Wat
er S
up
ply
Bo
ard
s
Tra
nsp
ort
Pla
nn
ing
Bo
die
s
Co
nsu
ltan
ts
Pro
per
ty B
roke
rs
Co
ntr
acto
rs
Cap
ital
Go
od
s S
up
plie
rs
Possible Big Data Analytics
63
Big Data Analytics in Residential Property Buying Decisions in India
Amity Business ReviewVol. 21, No. 1, January - June, 2020
64
Big Data Analytics in Residential Property Buying Decisions in India
other aspects of technology in real estate sector for
a consumer friendly, transparent, and professional
approach towards buying decisions.
REFERENCES(2020). Global Real Estate Transparency. Jones Lang LaSalle
(JLL),
Batty, M. (2013 ). Big data, smart cities and city planning.
Dialogues in Human Geograph.
Basil, D. Z., & Weber, D. (2006). Values motivation and concern
for appearances: the effect of personality traits on responses to
corporate social responsibility. International Journal of
Nonprofit and Voluntary Sector Marketing, 11(1), 61–72.
https://doi.org/10.1002/nvsm.38.
Bose, A. (2020). worldwealthreport. Capgemini.
Boyd, D., & Crawford, K. (2012). Critical questions for big data:
provocations for a cultural, technological, and scholarly
phenomenon. Information, Communication, and Society, 662-
679.
Eiman Al Nuaimi, H. A.-J. (2015). Applications of big data to
smart cities. Journal of Internet Services and Applications.
Gobble, M. M. (2013). Big Data: The Next Big Thing in
Innovation. Research-Technology Management, 64-67.
Golob, U., Lah, M., & Jančič, Z. (2008). Value orientations and
consumer expectations of Corporate Social Responsibility.
Journal of Marketing Communications, 14(2), 83–96.
https://doi.org/10.1080/13527260701856525
H Chen, R. H. (2012). Business intelligence and analytics: from
Big Data to big. MIS Quarterly, 1165-1188.
Herman Donner, K. E. (2018). digitalcitiesjan292018.pdf.
R e t r i e v e d f r o m h t t p s : / / g p c . s t a n f o r d . e d u :
https://gpc.stanford.edu/sites/g/files/sbiybj8226/f/digitalciti
esjan292018.pdf
Ibrahim Abaker Targio Hashem, V. C. (2016). The role of big
data in smart city. International Journal of Information
Management, 748-758.
Karel, R. (2015). how-bad-data-impacts-critical-stakeholders.
R e t r i e v e d f r o m b l o g s . i n f o r m a t i c a . c o m :
https://blogs.informatica.com/2015/08/05/how-bad-data-
impacts-critical-stakeholders/#fbid=CFdocD4pa5f
Kimberly Winson-Geideman, A. K. (2016). Transformations in
Real Estate Research: The Big Data. RIM Real Estate Society
Conference, (pp. 17-20). Sunshine Coast, Queensland.
K, M. (1990). Pricing: marking protable decision, 2nd edn. New
York: Harper and Row.Linda L. Johnson, M. J. (1988). Service
Quality Determinants and Effectiveness in Real Estate
Brokerage Industry. The Journal of Real Estate Research, 21-36.
Lugmayr, A. S. (2017). Cognitive big data : survey and review
on big data research and its implications . What is really “ new ”
in big data ? JOURNAL OF KNOWLEDGE MANAGEMENT,
197-212.
M. Mazhar Rathore, A. A. (2016). Urban planning and building
smart cities based on the Internet of Things using Big Data
analytics. 63-80.
Madden, S. (2012). From Databases to Big Data. IEEE Internet
Computing, 4-6.
Monroe, K., & Krishnan, R. (1985). The effect of price on
subjective product evaluations. Lexington, MA: Lexington
Books.
Narendran, N. (2013). The Residential Real-Estate Industry in
India : Investigating Evidence for an Asset Bubble.
Neerav Merchant, M. (2016). Real Estate in India: An Overview.
Ovide, A. (2013). Big Data ( A Special Report ) --- Big Data , Big
Blunders : Five mistakes companies make -- and how they can
avoid them. Wall Street Journal, 1-3.
Piyush, R. B. (2016). Study of Factors Affecting Customer
Satisfaction for Residential Flats in Surat and Ahmedabad city
in Gujarat Region of India. International Research Journal of
Engineering and Technology, 1-8.
Private, F. (2018). India Corporate Fraud Perception Survey
2018 Edition III. Deloitte.
Provost, F., & Fawcett, T. (2013). Data science and its
relationship to big data and data-driven decision making. Big
Data, 51-59.
Putniņš, A. (2007). Organizācijas dzīves cikls un organizācijas
kultūra [Organizational Life Cycle and Organizational].
Management, 117, 218–226
Raghubir, P., Corfman, K., & J, M. (1999). When do price
promotions affect pretrial brand evaluations?S Gregory
Yovanof, H. N. (2009). An architectural framework and enabling
wireless technologies for digital cities & intelligent urban
environments. Wireless personal communications, 445-463.
Shashan, U. P. (2016). The Uttar Pradesh Real Estate (Regulation
and Development) Rules, 2016. Lucknow: Uttar Pradesh
Shashan.
Shetty, A. (2019). Indian millenials’ biggest aspiration is buying
a home, but is it the right time to buy one? Delhi: The Indian
Express.
The Economic Times. (2019). internet-users-in-india-to-rise-by-
40-smartphones-to-double-by-2023-mckinsey. Retrieved from
economictimes.indiatimes.com:
https://economictimes.indiatimes.com/tech/internet/internet-
users-in-india-to-rise-by-40-smartphones-to-double-by-2023-
mckinsey/articleshow/69040395.cms
Ward, J., & Barker, A. (2013). Undefined by data: a survey of big
data definitions. arXiv.
Amity Business ReviewVol. 21, No. 1, January - June, 2020
65
Dealing with difficult people
Ken Pierce
Bookboon.com
First Edition
2018
In this pandemic era, human
beings are already undergoing
many topsy-turvy situations.
This book titled “Dealing with
difficult people” is a very
appropriate self-help book.
Author had talked about the most
intriguing aspect of human
relationship, i.e. dealing with two
most challenging categories of
the people – one category is those
who pull your chain and the other
category is who push your
buttons. Both categories of
people cost one’s time & money.
In olden days (up to 1960s),
people use to focus on external
aspects but after 1960s, they
started focusing on internal
aspects of life too.
Conflicts arises when two
individuals are unable to find
common reality. In other words,
when one is unable to understand
the other’s version of reality. This
fatal misperception leads to
seven fatal costs, i.e. destroying
respect, undermining trust,
creating resentment, damaging
relationship, reducing team
s p i r i t , e n e r g y , d e p l e t i n g
productivity and destroying
organizations. Famous American
management consultant Edward
D e m i n g i d e n t i f i e d s e v e n
conditions for getting best from
others, they are – respecting
people for their values, treating
people fairly, caring about as a
person, listening regularly,
trusted to do good job, supported
when needed & challenges when
needed. By focussing on four
areas of one’s health (spiritual,
mental, vocational, financial,
social), better relation with the
family can also be developed.
Further, author also introduced
the Choice theory. It denotes
respecting one’s as well as other’s
opinion too. In this regard, Dr
John Demartini had quoted a
very relevant quote, “If the WHY
is big enough, then HOW take
care of itself.”
Choice theory depicts seven
principles which are pragmatic in
origin. First one indicates the
uniqueness of one’s genetic body
& mind. Second emphasizes on
one’s own specific value system
for self-motivation. Third depicts
one’s unique value system that
depends on one’s own perception
evolved through personal
experiences. Fourth principle is
about choosing one’s behaviour
out of 4600 choices. Fifth
principle is a unique concept that
d e n o t e s o n e ’ s b e h a v i o u r
comprise of four components-
first two control one’s action &
thinking simultaneously and
other two components are one’s
feelings and physiology that
one’s generate. Sixth principle
denotes two levels of one’s
thinking – level one assess
situation from the available
information & other level is
seeing situation from outside
perspectives (known as Self-talk).
Seventh principle arise from this
dual level of thinking only. It
indicates that self- talk creates
one’s feeling thus one is more
powerful and have more self-
control than one can think. These
seven principles highlight the
level of self-control. If one is able
to have high self-control, one will
not be suffering from pyscho-
somatic or Life style diseases.
Henceforth, author wrote about
seven assumptions which make
the difference in interacting
better with difficult people by
assuming that they are motivated
by survival, have a purpose,
can learn a better way, need
to make choices, need to see a
clear benefit, displaying their
Amity Business ReviewVol. 21, No. 1, January - June, 2020

66
best effort and require respect.
There are only three ways to
communicate with them, they
are:
Carelessly (self-righteously),
Carefully (self -wrongeously)
and Caringly (respectfully).
Carelessly (self-righteously)
communication refers when
one is communicating one’s
own values while ignoring
value system of di f f i cul t
person whereas Carefully (self -
w r o n g e o u s l y ) r e f e r s t o
communicating within the
difficult person’s value and
ignoring one’s value. Caring
communication (respectful)
refers communicating one’s
values coherent with difficult
person’s values. Thus, only
C a r i n g c o m m u n i c a t i o n
(respectful) works better with
difficult people as it (five
f a b u l o u s w a y s f o r
c o m m u n i c a t i n g ) a c c e p t s ,
encourages, listens, negotiates,
respect, supports and challenges
them. Whereas careless and
careful style of communication
destroys communication as it
leads to controlling, complaining,
criticizing, blaming, nagging,
punishing and threatening the
behaviour of difficult people and
interaction with them become
more volatile.
In last, author conclude the book
by a simple, practical, problem
solving tool as ‘A walk in the
Park’, is an analogy that kid is
walking in a park and had to go
for five benches. Each bench has a
question and answer that act as a
guardian for communicating
with difficult person. These
benches are Want (What do you
want), Doing (What have you
been doing to get it?), Options (Is
what you have been doing
working?), Planning (Are you
ready to make a plan?) &
Evaluating ((What else could you
do to get what you want?).
Dr. Supriti Agarwal
Amity Business ReviewVol. 21, No. 1, January - June, 2020

BOARD OF REVIEWERS
Dr Uma S. Singh
Faculty of Management Studies,
University of Delhi
Dr B.P. Singh
DSPSR, New Delhi
Prof. K.V. Bhanu Murthy
Dept. of Commerce,
Delhi School of Economics
Prof. H.K. Singh
Faculty of Commerce,
Banaras Hindu University
Dr Vinod Kumar Shukla
Amity University, Dubai
Dr Nrashant Singh
Amity University, Dubai
Dr Taranjeet Duggal
Amity University, Noida
Prof. Walter T Parrish
ICE Academy, United Kingdom
Prof. Ravinder Vinayek
MD University, Rohtak
Dr Balwinder Singh
Guru Nanak Dev University, Amritsar
Ms Sapna Goel
HCL Infosystems Ltd. Noida
Dr Anita Venaik
Amity University, Noida
Dr Nisha Gupta
Shaheed Bhagat Singh College, Delhi
University
Mr Harsh Saxena
Honeywell Automation and
Control Solutions, Perth, Australia
Dr Sumeet Singh Jasial
Amity University, Noida
Dr Vijit Chaturvedi
Amity University, Noida
Dr Jaya Yadav
Amity university, Noida
Dr H.K. Gujaral
Amity university, Noida
Ms Lakhwinder K. Dhillon
Amity University, Noida
Dr Rakesh Gupta
Griffith Business School,
Griffith University, Natahan Campus, Australia
Dr. Timira Shukla
Jaipuria Business School, Ghaziabad
Dr. Vijay Kumar Dwivedi
Madan Mohan Malviya Technical University,
Gorakhpur U.P
Dr. D.K. Tripathi
Alard Institute of Management Sciences, Pune
Dr. Ajay Kr. Singh
ABES, Ghaziabad
Dr. Vinay Kumar Yadav
Indira Gandhi Tribal University Amarkantak,
M.P.
Dr. Garima Malik
Amity Business School,
Amity University, Noida
Dr. Krishna Kumar Singh
Symbiosis Centre for Information Technology,
Pune
DR. Urvashi Varma
Amity Business School,
Amity University, Noida
Dr. Aseervatham Achary
Akshaya College of Art and Sciences Chennai,
Madras
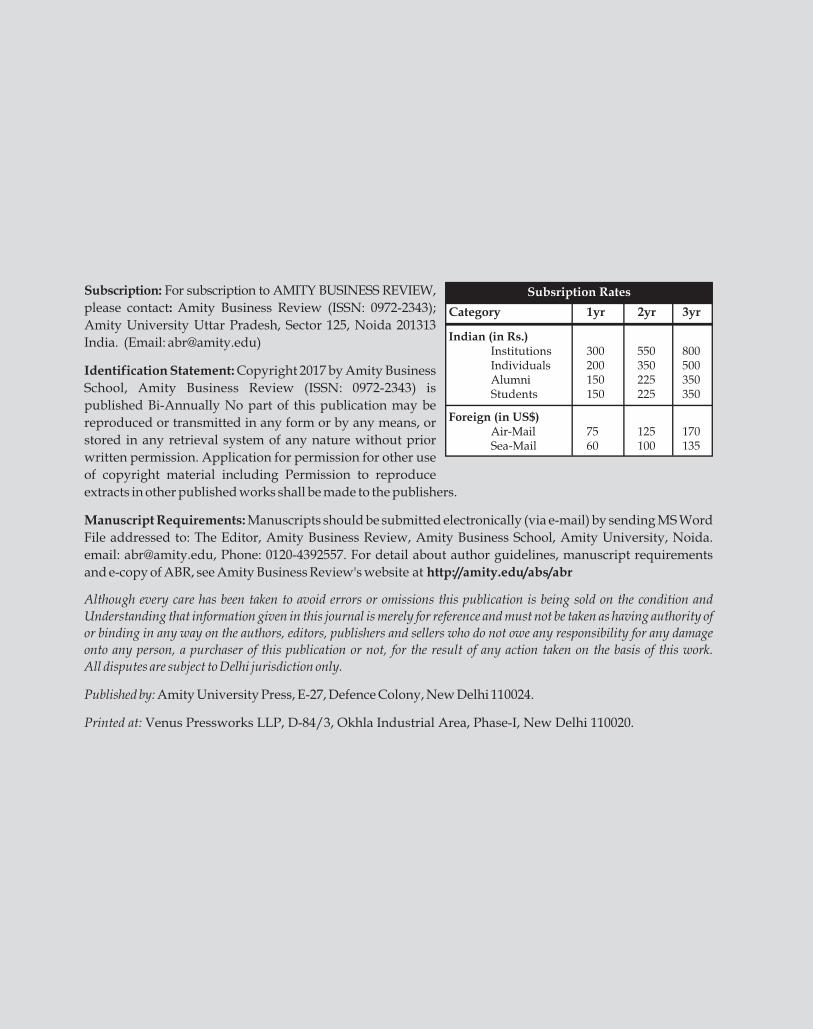
Venus Pressworks LLP, D-84/3, Okhla Industrial Area, Phase-I, New Delhi 110020.

I, hereby declare that the particulars given are true to the best of my knowledge and belief.Sanjeev Bansal
Sanjeev Bansal(Signature of the Editor-in-chief)
D-84/3, Okhla Industrial Area,
Venus Pressworks LLP
Amity Business SchoolYesAmity Business SchoolAmity University, Uttar Pradesh,Sector-125, NOIDA -201 313 (INDIA)
Editor-in-chief’s Name Dr Sanjeev BansalYesAmity Business SchoolAmity University, Uttar Pradesh,Sector-125, NOIDA -201 313 (INDIA)
Amity Business SchoolAmity University, Uttar Pradesh,Sector-125, NOIDA -201 313 (INDIA)

AMITY UNIVERSITY PRESS
![ユニソート - Sun Earth · 2343 2343 2343 2343 2343 2343 2343 2343 3565 3565 3565 3565 3565 3565 3565 3565 [kg] 2675 3445 4420 7070 2675 3445 4420 7070 2675 3445 4420 7070 2250](https://img.pdfslide.net/doc/110x75/5e7c5224a50d5b3ae925beba/ffff-sun-earth-2343-2343-2343-2343-2343-2343-2343-2343-3565-3565-3565.jpg)


![Print - Sun Earth · 2343 2343 2343 2343 2343 2343 2343 2343 3565 3565 3565 3565 3565 3565 3565 3565 [mm] 40-300 15-300 40-300 [mm] 2675 3445 4420 7070 2675 3445 4420 7070 2675 3445](https://img.pdfslide.net/doc/110x75/5e7c55371ac19940f3606150/print-sun-earth-2343-2343-2343-2343-2343-2343-2343-2343-3565-3565-3565-3565-3565.jpg)