Embed Size (px)
Citation preview
Journal of Sustainable Development of Energy, Water
and Environment Systems
http://www.sdewes.org/jsdewes
Year 2020, Volume 8, Issue 3, pp 476-492
476
ISSN 1848-9257
Journal of Sustainable Development
of Energy, Water and Environment
Systems
http://www.sdewes.org/jsdewes
Techno-economic Aspects of Electricity Generation from a Farm Based
Biogas Plant
Lina Jarrar1, Osama Ayadi*2, Jamil Al Asfar3
1Chemical Engineering Department, University of Jordan, Queen Rania str., Amman, 11942, Jordan e-mail: [email protected]
2Mechanical Engineering Department, University of Jordan, Queen Rania str., Amman, 11942, Jordan e-mail: [email protected]
3Mechanical Engineering Department, University of Jordan, Queen Rania str., Amman, 11942, Jordan e-mail: [email protected]
Cite as: Jarrar, L., Ayadi, O., Al Asfar, J., Techno-economic Aspects of Electricity Generation from a Farm Based
Biogas Plant, J. sustain. dev. energy water environ. syst., 8(3), pp 476-492, 2020, DOI: https://doi.org/10.13044/j.sdewes.d7.0302
ABSTRACT
This study produces a technical and economic analysis of a farm- fed biogas plant that utilizes cow manure to produce electricity and heat via combined heat and power unit. The electricity generated is directly injected into the grid while heat is used within the biogas plant. The biogas system design was done depending on number of cows in the farm, which denotes the amount of manure available as feedstock. The economic performance of the proposed biogas plant was evaluated using various economic indicators. The levelized cost of electricity and the avoided greenhouse gas emissions were calculated too. The preliminary design and economic feasibility results proved the profitability of the manure-based biogas systems on wide range of farm sizes. The net present values of a 100-cow, 500-cow, 1,000-cow, 1,500-cow and 2,000-cow farms were all positive. The internal rate of return values were 11%, 12%, 13%, 16% and 17%, respectively, and the levelized cost of electricity values were 0.071, 0.069, 0.064, 0.055 and 0.055 JOD/kWh, respectively. The study also produced a design for a centralized anaerobic digestion plant depending on Jordan resources. The government role in promoting biogas-based electricity was discussed too.
KEYWORDS
Biogas plant, Combined heat and power, Cow manure, Economic aspects, Levelized cost
of electricity, Greenhouse gas emissions.
INTRODUCTION
Biogas is a sustainable energy carrier that is composed mostly of methane (60%) and carbon dioxide (CO2) (35-40%) [1]. It is produced through the Anaerobic Digestion (AD) of biomass feedstocks, where microorganisms digest the biomass and break down organic matter into simpler chemical components in the absence of oxygen to produce biogas and digestate [2]. The use of biogas for energy production could substitute natural gas and decrease dependence on imported energy.
* Corresponding author
Jarrar, L., et al.
Techno-economic Aspects of Electricity ...
Year 2020
Volume 8, Issue 3, pp 476-492
477 Journal of Sustainable Development of Energy, Water and Environment Systems
Beside energy production, farm-fed AD systems provide plenty of environmental and socioeconomic benefits, these include, the production of a nutrient rich effluent (digestate) that can be used as fertilizer, odour and pathogens reduction, weed seed and manure volume reduction [3]. Biogas plants also provide job opportunities, energy access and energy security, especially in rural communities [4]. Processing manure and other organic wastes through AD systems is considered a feasible mean to help countries attain Greenhouse Gas (GHG) emission and waste treatment targets established in international agreements [5].
For many years, AD has been used successfully for handling domestic, industrial, farm, and municipal solid waste, as well as other types of waste. It is employed in different parts of the world and is widely used, especially in rural areas, where there is a ready supply of feedstocks with high organic content [5]. Biogas systems are already widely employed in Europe, and are gaining traction in North America [3]. The countries most engaged in producing biogas from AD plants are China, Germany, and the United States. There is also a rising trend in the use of biogas around the globe, especially in Japan and South Korea. This growth is driven, among other things, by governmental actions, global environmental concerns, and the realization from industry that AD can be used as an efficient method for treating waste and effluents [5].
The European Union (EU), political targets for climate and energy in 2030 are 40% reductions in GHG emissions, 27% renewable energy installed capacity and 27% improvement in energy efficiency. Biogas is expected to play an important role in reaching these targets [6]. The EU takes the lead in biogas electricity production, with more than 10 GW installed capacity and 17,400 biogas plants, in comparison to the global capacity of 15 GW in 2015 [7].
Because of the attractive feed-in tariff system, the German biogas production has expanded significantly. Since 2010, 50% of the total European production of biogas was produced in Germany [6]. In 2016, Germany had 4,237 MW installed electric capacity from biogas according to the German biogas association. In Italy, Salerno et al. [8] stated that the production of electricity from the bioenergy sector revealed an average increase of 19% a year (2001 to 2014) from 1,958 to 18,732 GWh. In 2014, it accounted for 15.5% of total production from renewable sources. The increase in the energy production from biogas rose from 1,665 GWh in 2009 up to 8,198 GWh in 2014.
In countries like China and India, government programs have promoted the construction of new household bio-digesters. That was responsible for the construction of about 27 million and 4 million new digesters in the respective countries [9].
In Nepal there are over 172,500 biogas plants in operation [10]. China is estimated to have installed 2.8 million biogas plants between 2010 and 2011, bringing the total number in the country to 43 million [10]. In Pakistan, the Biogas Support Program (BSP) was started in year 2000 by government for household biogas units, and so far 1,200 biogas units have been installed and operated under the program. Whereas there is a target to introduce another 10,000 units in the coming five years, that will harvest almost 27% of country’s biogas potential [11].
Özer [12] stated that Turkey has considerable bioenergy potential, and around 6% of the total potential located in eastern regions. The total electricity production potential from Ardahan city utilizing animal manure and agricultural residue was 323 GWh/year. Total CO2
emission reduction was around 2 million tons/year in case of biogas combustion instead of exiting coal-fired power plants. The utilization of poultry waste for energy generation was found feasible in a study done by Arshad et al. [13]. However, the Government financial and technical support under the renewable energy policies is of an essential importance for adoption this technology in Pakistan, they said.
New trends in biogas research field is going towards technology enhancement and biogas upgrading. Curto and Martín [14] analyzed a facility for the upgrading of biogas
Jarrar, L., et al.
Techno-economic Aspects of Electricity ...
Year 2020
Volume 8, Issue 3, pp 476-492
Journal of Sustainable Development of Energy, Water and Environment Systems 478
into biomethane using renewable hydrogen, solar and/or wind energy were the power sources for the facility. They evaluated two case studies, UK and Spain, and two modes of operation, continues and variable upgrading. Benizri et al. [15] presented an experimental and theoretical study of a new biogas upgrading technology and its application at farm scale. The system included physical absorption of CO2 into water at 7-10 bars and desorption at atmospheric pressure. Experimental and model results were very close. In their study, Prajapati and Singh [16] produced biogas in a bio-electrochemical digester, where anaerobic digestion was integrated with bio-electrolysis of agriculture waste mixed with wastewater. The digesters operated at different voltages and the total COD removal rate and organic conversion to methane were both enhanced at various applied voltages.
In Jordan, biogas projects are divided into three main categories: municipal solid waste (landfills), wastewater treatment and farm based projects. The largest installed biogas plant capacity is in Kherbet Alsamra wastewater treatment station, it utilizes sludge and produces biogas electricity in a capacity of 14 MW, Al-Ghabawi landfill project comes next with an electricity production capacity of 4.5 MW.
Regarding farm-scale biogas plants in Jordan, generally, these projects are built in small farms. Mostly funded by international agencies, and aims mainly to rural development and increase environmental awareness among farmers. Al-rousan and Zyadin [17] described Al-Khaldia farm project. The farm contains 15 cows and the digester size was 22 m3 built traditionally without heating or agitation, using local construction materials in order to minimize costs. The daily production of biogas was about 7 m3, which is equivalent to 4 kg of Liquefied Petroleum Gas (LPG). The produced gas was used directly in the farm for heating and cooking purposes.
Generally, the utilization of AD for biogas and power production in Jordan (especially on farms scale) is still modest and requires further exploration. The lack of knowledge on the resources potential and absence of government subsidies and incentives considered key barriers to biomass development in the country. Another global barrier to biomass development, stated by the International Renewable Energy Agency (IRENA), is the absence of accurate and reliable data on the cost and performance of renewable power generation technologies [18].
This study comes to fill the existing knowledge gap in biogas potential and economic evaluations in Jordan and paves the way for future researches in the field. This study will make benefit of the technological advancement, and the expert built in the AD field, and try to introduce the most suitable and profitable AD system to the interested stakeholders in Jordan. The preliminary financial evaluation of the proposed biogas project including expected costs and revenues, would be of a great value to the investors and decision makers in the decision of go/not go in the farm-based biogas investment.
This research analyses farm-fed biogas power plants of medium to large capacity, which was not investigated before in local research. It also provides a simple biogas calculator that estimates biogas, fertilizer and power generated from a certain feedstock. The calculator can be easily manipulated to suit case-by-case situations. In addition, the study proposes a centralized AD system that would make a good contribution in waste management plans. The government role in biogas technology deployment was investigated too.
METHODS
The analysis includes five farm sizes depending on number of cows, 100-cow, 500-cow, 1,000-cow, 1,500-cow and 2,000-cow farm. Biogas production estimation based on biogas yield method eq. (1), which relies on empirical biogas yield values gathered from literature:
Jarrar, L., et al.
Techno-economic Aspects of Electricity ...
Year 2020
Volume 8, Issue 3, pp 476-492
479 Journal of Sustainable Development of Energy, Water and Environment Systems
BP = mf × DM × ODM × BY (1)
where BP [m3/day] is the daily biogas production, mf [kg/day] is the daily fresh feed mass flowrate, DM [%] is the percentage of dry matter from the feed, ODM [%] is the percentage of organic dry matter from the DM content and BY is the corresponding biogas yield per kg of ODM [m3/kg ODM].
A model was prepared using Excel to estimate, the system size, yearly production, environmental and economic analysis results. The calculation based on the entered number of cows and default system parameters defined by the study.
The model was also used to design a Centralized Digestion Plant (CAD) that utilizes manure from numerous farms, depending on dairy cow population and distribution throughout the country.
Finally, the government entities impact on promoting biogas technology was investigated through examining the effect of increasing biogas-based electricity official selling price on payback period of the project.
System description and components
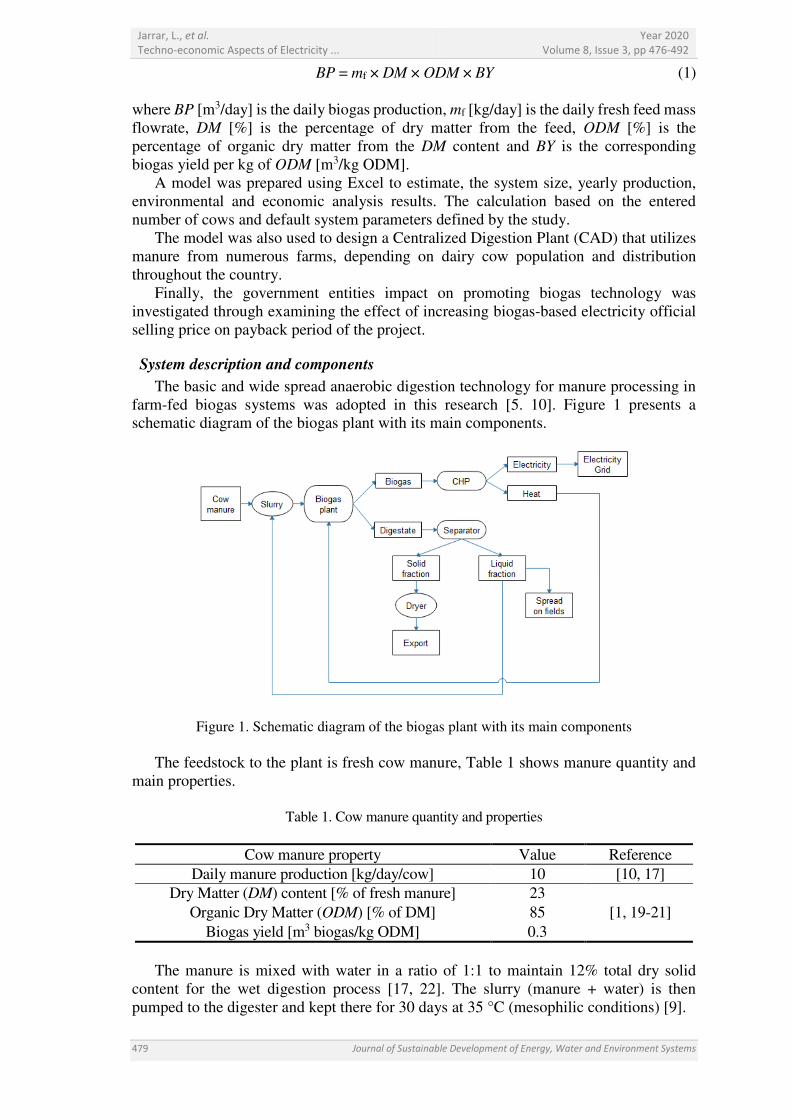
The basic and wide spread anaerobic digestion technology for manure processing in farm-fed biogas systems was adopted in this research [5. 10]. Figure 1 presents a schematic diagram of the biogas plant with its main components.
Figure 1. Schematic diagram of the biogas plant with its main components
The feedstock to the plant is fresh cow manure, Table 1 shows manure quantity and main properties.
Table 1. Cow manure quantity and properties
Cow manure property Value Reference
Daily manure production [kg/day/cow] 10 [10, 17] Dry Matter (DM) content [% of fresh manure] 23
[1, 19-21] Organic Dry Matter (ODM) [% of DM] 85 Biogas yield [m3 biogas/kg ODM] 0.3
The manure is mixed with water in a ratio of 1:1 to maintain 12% total dry solid
content for the wet digestion process [17, 22]. The slurry (manure + water) is then pumped to the digester and kept there for 30 days at 35 °C (mesophilic conditions) [9].
Jarrar, L., et al.
Techno-economic Aspects of Electricity ...
Year 2020
Volume 8, Issue 3, pp 476-492
Journal of Sustainable Development of Energy, Water and Environment Systems 480
The biogas produced from the system is used to generate electricity and heat via a Combined Heat and Power (CHP) generation unit, Table 2 shows the produced biogas properties.
Table 2. The main properties of biogas produced
Biogas property Value Reference Methane content [%] 60 [9, 17]
Calorific value of methane (LHV) [MJ/m3] 35.8 [2] Calorific value of biogas [MJ/m3] 21.48 Calculated
Density of biogas [kg/m3] 1.23 [20]
The electricity generated is fed directly into the grid. The heat is used mainly to keep
the digester temperature at 35 °C and the residual heat may be used for other heating or drying purposes.
The digestate is pumped out of the digester and transferred to a concrete lagoon installed with pumping system and works as a separator. The digestate is separated into liquid and solid organic fractions. The liquid fraction is mainly recycled to the digester, but part of it can be spread on fields (or sold) as liquid organic fertilizer. The solid fraction is dried by means of dryer or by the sun and sold as organic fertilizer.
The digester is an airtight, insulated, concrete Continuous Stirred Tank Reactor (CSTR). For integrated gas storage purposes, the cover is made of flexible double membrane roof. Before it enters the CHP unit, the biogas is cooled down to remove moisture content, and then enters an activated carbon filter to remove the hydrogen sulfide (H2S). Another simple and low-cost method to remove H2S from biogas commonly used in farm-scale digesters is adding some air (2-6 vol.%) into the headspace of the digestion tank, close to where the biogas exists the digester [23].
Digester sizing
The size of the digester depends on the amount of feed utilized and the process retention time, the volume needed can be calculated from eq. (2), a safety factor of 20% is added to the volume:
VD = (mf + mw) × HRT / 365 × 120% (2)
where VD [m3] is the digestion tank volume, mf [m3/year] is the fresh feed flowrate, mw [m3/year] is the added water flowrate and HRT [days] is the hydraulic retention time. Since the feed slurry is mostly water, the density of water is used in the calculations.
Practically, a bigger digester is chosen in order to increase the biogas storage capacity, since the amount of biogas stored under the double membrane cover can be small. Usually, a storage capacity of 20-50% of the daily biogas production is sufficient for use in a CHP unit. This might be even less if the CHP unit is operating constantly [23]. For this study, a storage capacity of 20% was taken and calculated as follows:
Vg = BP × 20% (3)
where Vg [m3] is biogas storage volume and BP [m3/day] is the daily biogas production. The total digester volume (V) [m3] is the summation of digestion tank volume (VD) [m3] and the biogas storage volume (Vg) [m3]:
V = VD + Vg (4)
Jarrar, L., et al.
Techno-economic Aspects of Electricity ...
Year 2020
Volume 8, Issue 3, pp 476-492
481 Journal of Sustainable Development of Energy, Water and Environment Systems
Energy production
In order to estimate the amount of electricity and heat that can be generated from the biogas produced, the efficiency of the CHP unit for electricity and heat generation must be known. The electrical efficiency typically varies from 30% to 40%. While the corresponding thermal efficiency is normally 35-55% [24]. Table 3 displays the efficiencies for the selected capacities of CHP units used in this study. These are average values assumed based on various studies [20, 23-25].
Table 3. Electricity and heat efficiencies values for the selected capacities of CHP units
CHP unit capacity [kW] Electricity efficiency [%] Heat efficiency [%]
< 40 30 45 40-80 32 45 80-120 35 45 120 < 37 45
The following steps shows the calculation procedure for energy production and CHP
system sizing. First, the total energy input to the CHP from biogas is calculated from:
Eg = BP × 365 × Calg / 3.6 (5)
where Eg [kWh/year] is biogas energy, Calg [MJ/m3] is the calorific value of biogas and 3.6 is a conversion factor (1 kWh = 3.6 MJ).
The CHP unit capacity [kW] is now determined following eq. (6) below:
CHP capacity = Eg × ƞelec / t (6)
where ƞelec is the electrical efficiency and t [hour/year] is the operational full load. For this study, the CHP unit is assumed to be working 8,000 hour per year.
Once the CHP system capacity is set, the expected amounts of electricity and heat that can be generated yearly from the proposed biogas plant are calculated from eq. (7) and eq. (8):
Eelec = CHP capacity × t (7)
Eth = CHP capacity × t × (ƞth / ƞelec) (8)
where Eelec [kWh/year] and Eth [kWh/year] are the expected electric and thermal energy productions, respectively, and ƞth is the thermal conversion efficiency.
Digesters heat demand
Heat is consumed by the AD unit mainly to heat up the substrates to the digester temperature. The amount of heat needed is calculated using eq. (9). As a rule of thumb, about 30% is added to the calculated heat consumption to compensate for energy losses through transmission [23]:
Qf = M × Cp × (Td – Tf) × 130% (9)
where Qf [kJ/day] is the heat needed to heat up the feed material, M [kg/day] is the total mass flow rate of the feed (manure + water), Cp [kJ/kg°C] is the specific heat capacity of the feed, Td [°C] is the digestion temperature and Tf [°C] is the feed temperature. The specific heat of feed is taken as that of water (4.18 kJ/kg°C) and the digester temperature (Td) is 35 °C.
Jarrar, L., et al.
Techno-economic Aspects of Electricity ...
Year 2020
Volume 8, Issue 3, pp 476-492
Journal of Sustainable Development of Energy, Water and Environment Systems 482
The residual heat is the heat that still left after the heat demand of the digester is subtracted from the total heat production of the CHP unit. It is calculated using eq. (10). This heat can be used effectively inside the AD plant for different heating or drying purposes:
Residual heat = Eth − Qf (10)
where the heat production of the CHP unit (Eth) and the heat needed to heat up the feed material (Qf) are in [kWh/day]. The conversion factor (1 kWh = 3,600 kJ) was used to make units consistent.
In this study, the minimum residual heat available was estimated based on the maximum heat consumption of the digester. The maximum heat consumption was calculated assuming that the minimum temperature that the feed material could have is 0 °C.
COST AND REVENUES ESTIMATION
The estimations of capital cost, operating and maintenance costs and plant revenues for the proposed biogas model are illustrated in the following subsections.
Capital cost
The capital cost of an AD plant depends on many factors like plant size, location, design, waste composition, biogas production and power generating technology. It is thus hard to provide accurate costs without the detailed specifications of the whole system. Generally, biomass (including biogas) power plants in emerging economies have significantly lower investment costs than the cost ranges for Organization for Economic Co-operation and Development (OECD)-based projects. This is due to lower local content costs, cheaper equipment allowed, and in some cases, by less strict environmental regulations [26].
The total installed costs for AD power systems can have values between 2,570 and 6,100 USD/kW [18], this is equivalent to 1,822-4,325 JOD/kW.
In order to simplify capital cost estimation in this study, the total biogas plant cost was divided into three major parts, the AD system cost, the power generation system (CHP) cost and other costs. The total capital investment is the sum of these three values. Land cost was not considered, since the project is assumed to be built on the farm property.
The AD system cost includes the total cost of building the digester with insulation, mixers, cover and accessories. For this study, the digester cost is represented in JOD/m3 of digester volume as shown in Table 4. These values were estimated based on average costs of similar systems in [8, 17, 19, 21, 27, 28] while taking into consideration local material of construction and civil work costs. The economy of scale was considered too, meaning that a proportionate saving in cost would be gained by an increased digester size.
The investment in the CHP unit varies depending on plant scale, biogas quality and technology. The lowest capital costs are for the mature technologies (reciprocating engines, gas and steam turbines) and the highest costs are for the two newer, small capacity technologies (micro-turbines and fuel cells) [29]. In addition, larger capacity CHP systems within a given technology have lower installed costs than smaller systems. Based on the review done on CHP systems [8, 21, 24, 27, 29-31], this study proposed an average prices scale per kW CHP unit capacity (Table 4). It is a compromise between price, suitability and best technology available. The price includes the purchase and installation costs of the CHP system. It is represented in JOD/kW CHP capacity.
The “Other costs” part of the capital cost includes all system parameters that was not accounted when estimating digestion and power generation units costs. Such as,
Jarrar, L., et al.
Techno-economic Aspects of Electricity ...
Year 2020
Volume 8, Issue 3, pp 476-492
483 Journal of Sustainable Development of Energy, Water and Environment Systems
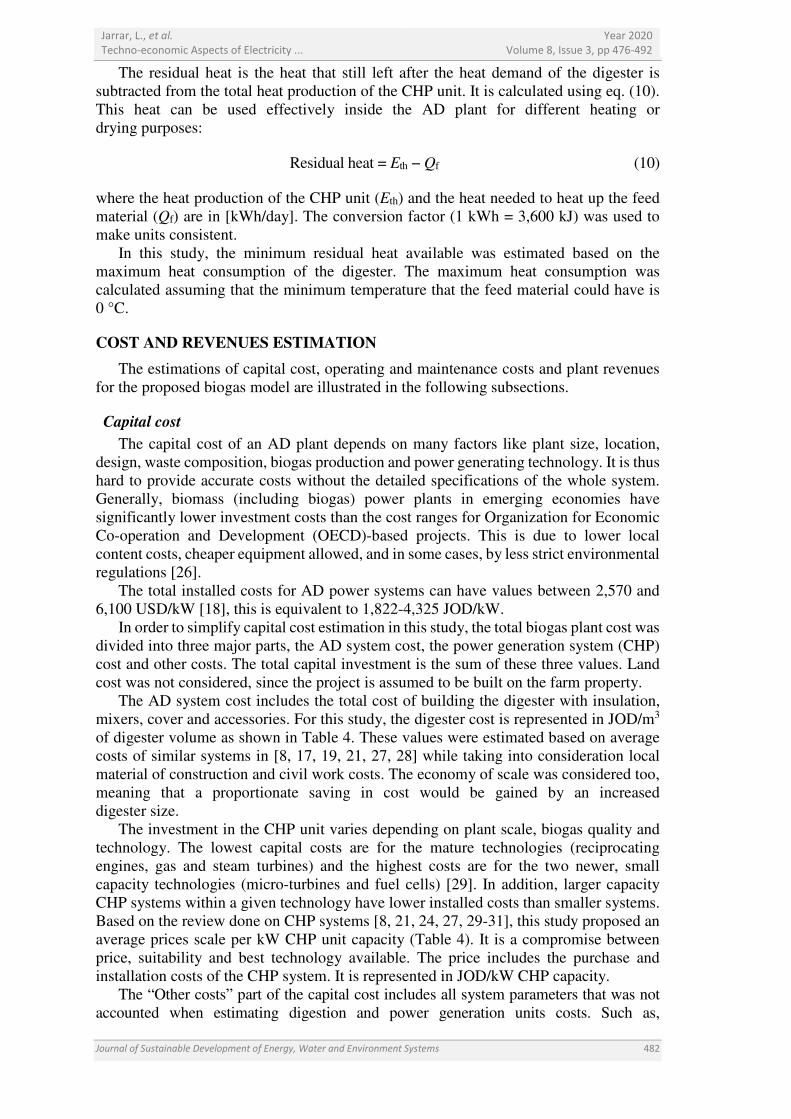
management and engineering costs, piping, safety system, connection to grid, tanks and backup storage and other related electrical, electronic and civil work. This study estimated other system costs as a percentage from the sum of digestion and power generation units costs (Table 4). This percent increases slightly with increasing farm size due to system complication, while taking into consideration that with smaller digester capacities, investment costs on a per kW basis (installed capacity) increase. This is because some expenditures, for example on grid connection, vary very little with scale [32].
Table 4. Capital cost estimation parameters, proposed by this study, including cost of digester,
CHP unit and other system parameters
Digestion system CHP unit Other system components Digester size [m3] Cost [JOD/m3] Capacity [kW] Cost [JOD/kW] No. of cows [%]
< 150 110 < 40 1,000 < 550 20 150-550 100 40-80 900 550-1,550 30
550-1,050 90 80-120 800 1,550 < 40 1,050-1,550 80 120 < 700
1,550 < 70
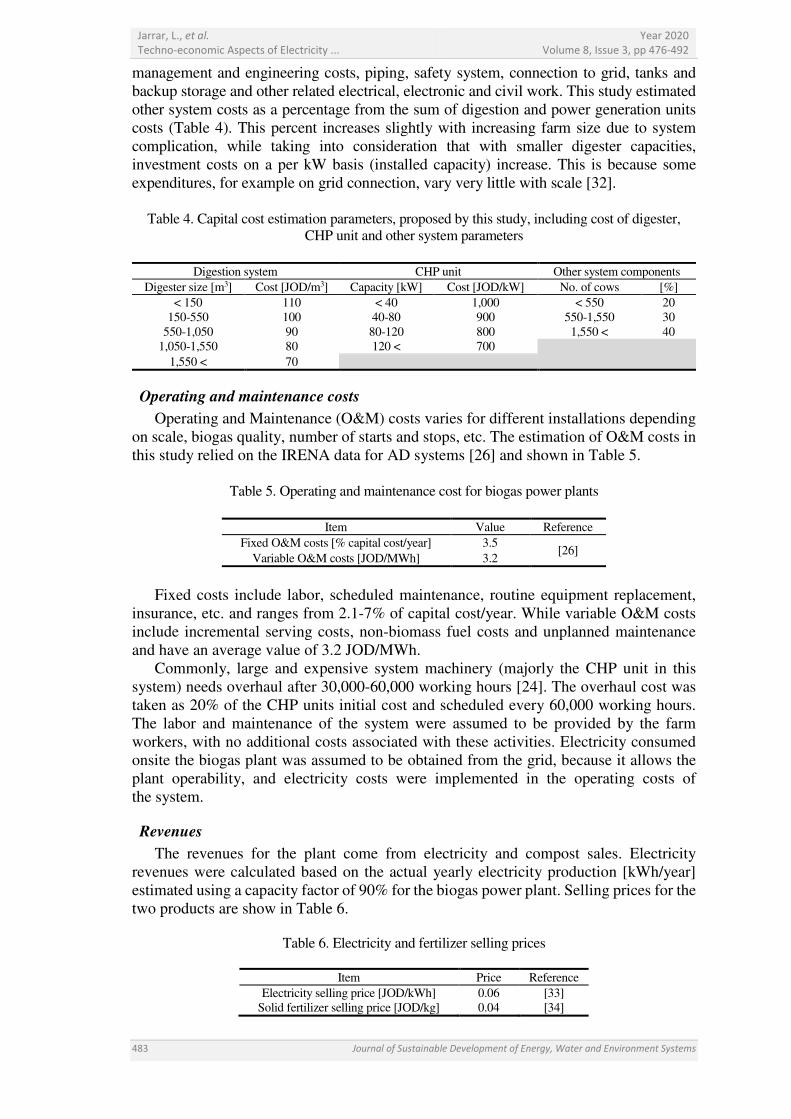
Operating and maintenance costs
Operating and Maintenance (O&M) costs varies for different installations depending on scale, biogas quality, number of starts and stops, etc. The estimation of O&M costs in this study relied on the IRENA data for AD systems [26] and shown in Table 5.
Table 5. Operating and maintenance cost for biogas power plants
Item Value Reference
Fixed O&M costs [% capital cost/year] 3.5 [26]
Variable O&M costs [JOD/MWh] 3.2
Fixed costs include labor, scheduled maintenance, routine equipment replacement,
insurance, etc. and ranges from 2.1-7% of capital cost/year. While variable O&M costs include incremental serving costs, non-biomass fuel costs and unplanned maintenance and have an average value of 3.2 JOD/MWh.
Commonly, large and expensive system machinery (majorly the CHP unit in this system) needs overhaul after 30,000-60,000 working hours [24]. The overhaul cost was taken as 20% of the CHP units initial cost and scheduled every 60,000 working hours. The labor and maintenance of the system were assumed to be provided by the farm workers, with no additional costs associated with these activities. Electricity consumed onsite the biogas plant was assumed to be obtained from the grid, because it allows the plant operability, and electricity costs were implemented in the operating costs of the system.
Revenues
The revenues for the plant come from electricity and compost sales. Electricity revenues were calculated based on the actual yearly electricity production [kWh/year] estimated using a capacity factor of 90% for the biogas power plant. Selling prices for the two products are show in Table 6.
Table 6. Electricity and fertilizer selling prices
Item Price Reference
Electricity selling price [JOD/kWh] 0.06 [33] Solid fertilizer selling price [JOD/kg] 0.04 [34]
Jarrar, L., et al.
Techno-economic Aspects of Electricity ...
Year 2020
Volume 8, Issue 3, pp 476-492
Journal of Sustainable Development of Energy, Water and Environment Systems 484
ECONOMIC EVALUATION
The economic feasibility of the biogas power generation system was evaluated using Net Present Value (NPV), Internal Rate of Return (IRR) and Payback Period (PBP) concepts [35].
The service life of the project (N) and the discount rate (i) were taken as 20 years and 10%, respectively.
The Levelized Cost of Electricity (LCOE) was calculated using the following eq. (11):
���� =
∑� + � + �
(1 + �)���
∑�
(1 + �)���
(11)
where In, Mn and Fn are the investment, operation and maintenance and fuel expenditures in the year n, respectively. En is electricity generated in the year n. In this study, all the plant expenditures was implemented in the operation and maintenance costs, and the electricity production was assumed to be the same during projects life.
AVOIDED GREENHOUSE GAS EMISSIONS
The use of biogas as an energy source has a double GHG emission benefits. First, methane is captured and converted to heat and CO2 instead of letting it escape to the atmosphere as it does in the traditional disposal procedures of manure. Methane’s global warming potential is 21 times that of CO2 and thus the conversion of methane to CO2 reduces the global warming potential [3]. Second, biogas is regarded as CO2 neutral because the released CO2 during combustion of biogas is the same CO2 that the plants in the biomass have consumed during photosynthesis to create organic matter. By this way, burning biogas is simply a recycling of CO2 in the biosphere [28]. If the AD biogas plant replaced fossil fuel-based electricity, there is a reduction in fossil fuel-related CO2 emissions [3].
According to the World Bank collection of development indicators [36], CO2 emissions in Jordan were reported at 26,450 kt in 2014. About 52.43% of this amount is from electricity and heat generation (as a percent of total fuel consumption).
In order to clarify the environmental benefits of implementing biogas projects in Jordan, this study calculated the avoided emissions for producing electricity by biogas instead of using natural gas [eq. (12)]. Natural gas was chosen since over 90% of power generation in 2018 in Jordan was from natural gas [37]:
Avoided GHG = Eelec × EmNG (12)
where Eelec [MWh/year] is the amount of electricity generated by biogas, and EmNG is the emissions of electricity produced by natural gas and equals 0.48 t CO2/MWh [30].
CENTRELIZED ANAEROBIC DIGESTION PLANT
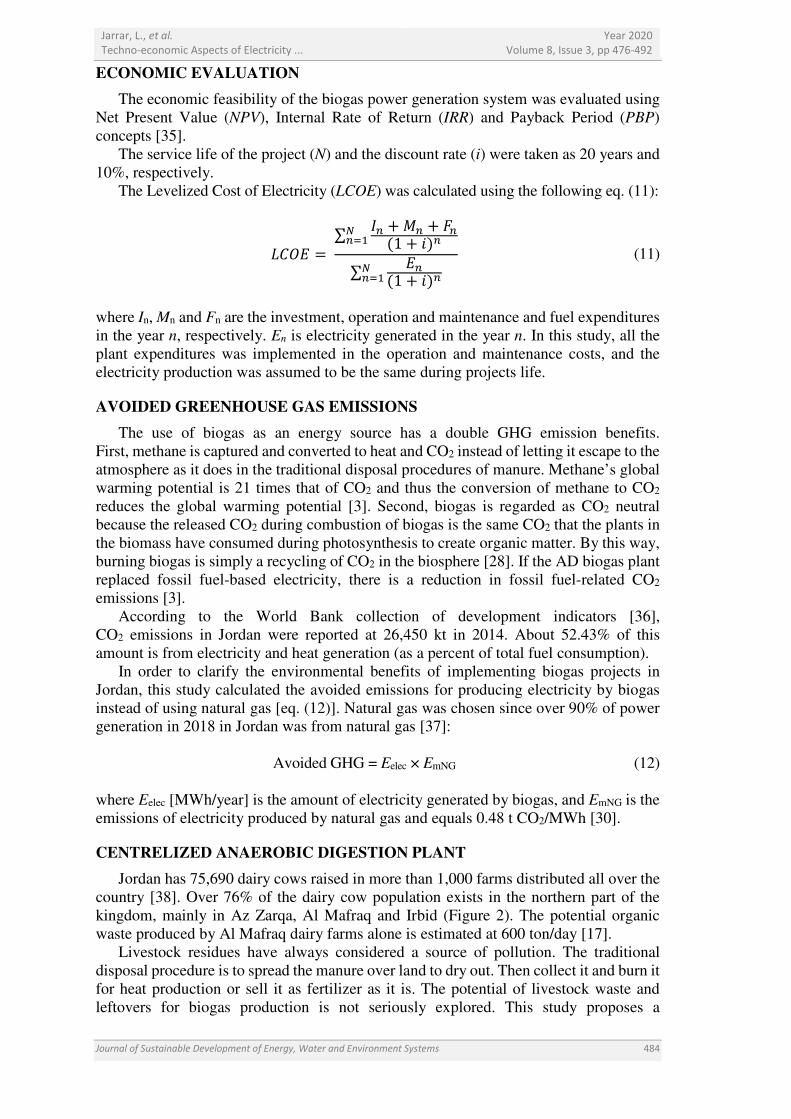
Jordan has 75,690 dairy cows raised in more than 1,000 farms distributed all over the country [38]. Over 76% of the dairy cow population exists in the northern part of the kingdom, mainly in Az Zarqa, Al Mafraq and Irbid (Figure 2). The potential organic waste produced by Al Mafraq dairy farms alone is estimated at 600 ton/day [17].
Livestock residues have always considered a source of pollution. The traditional disposal procedure is to spread the manure over land to dry out. Then collect it and burn it for heat production or sell it as fertilizer as it is. The potential of livestock waste and leftovers for biogas production is not seriously explored. This study proposes a
Jarrar, L., et al.
Techno-economic Aspects of Electricity ...
Year 2020
Volume 8, Issue 3, pp 476-492
485 Journal of Sustainable Development of Energy, Water and Environment Systems
Centralized Anaerobic Digestion (CAD) plant that utilizes cow manure from different farms in the area.
Figure 2. Major cow population areas in Jordan
In order to reduce transportation costs, the location of the plant is suggested to be somewhere between Az Zarqa and Al Mafraq governorates, where the majority of farms exist. The CAD plant is assumed to process 21,900 ton-manure/year. Since this is a private investment and not attached to a certain farm, the same previously proposed biogas model was used in the design of the CAD plant with the following adjustments:
• Land cost: The project assumed to be built on a 15,000 m2 land with an average cost of 1 JOD/m2 (depending on market review). The land cost was added to the capital investment;
• Manure transportation costs (with no additional costs for the manure itself) were calculated by assuming a 100 km travelling distance per day with an average cost of 500 JOD/month. This was added to the O&M costs;
• Fixed operation and maintenance cost is assumed to be (4.5% of capital investment) to account for extra labor and administrative costs.
Design and economic results of the CAD plant are shown in the results and discussion section.
RESULTS AND DISCUSSION
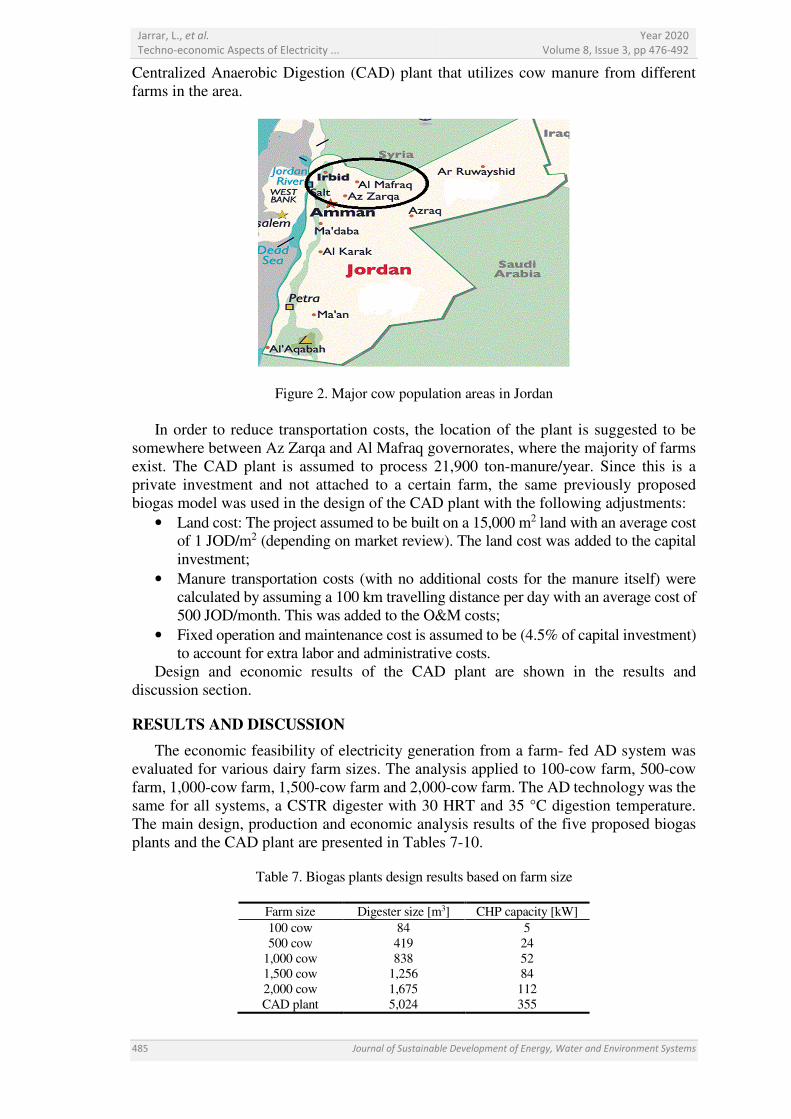
The economic feasibility of electricity generation from a farm- fed AD system was evaluated for various dairy farm sizes. The analysis applied to 100-cow farm, 500-cow farm, 1,000-cow farm, 1,500-cow farm and 2,000-cow farm. The AD technology was the same for all systems, a CSTR digester with 30 HRT and 35 °C digestion temperature. The main design, production and economic analysis results of the five proposed biogas plants and the CAD plant are presented in Tables 7-10.
Table 7. Biogas plants design results based on farm size
Farm size Digester size [m3] CHP capacity [kW] 100 cow 84 5 500 cow 419 24
1,000 cow 838 52 1,500 cow 1,256 84 2,000 cow 1,675 112 CAD plant 5,024 355
Jarrar, L., et al.
Techno-economic Aspects of Electricity ...
Year 2020
Volume 8, Issue 3, pp 476-492
Journal of Sustainable Development of Energy, Water and Environment Systems 486
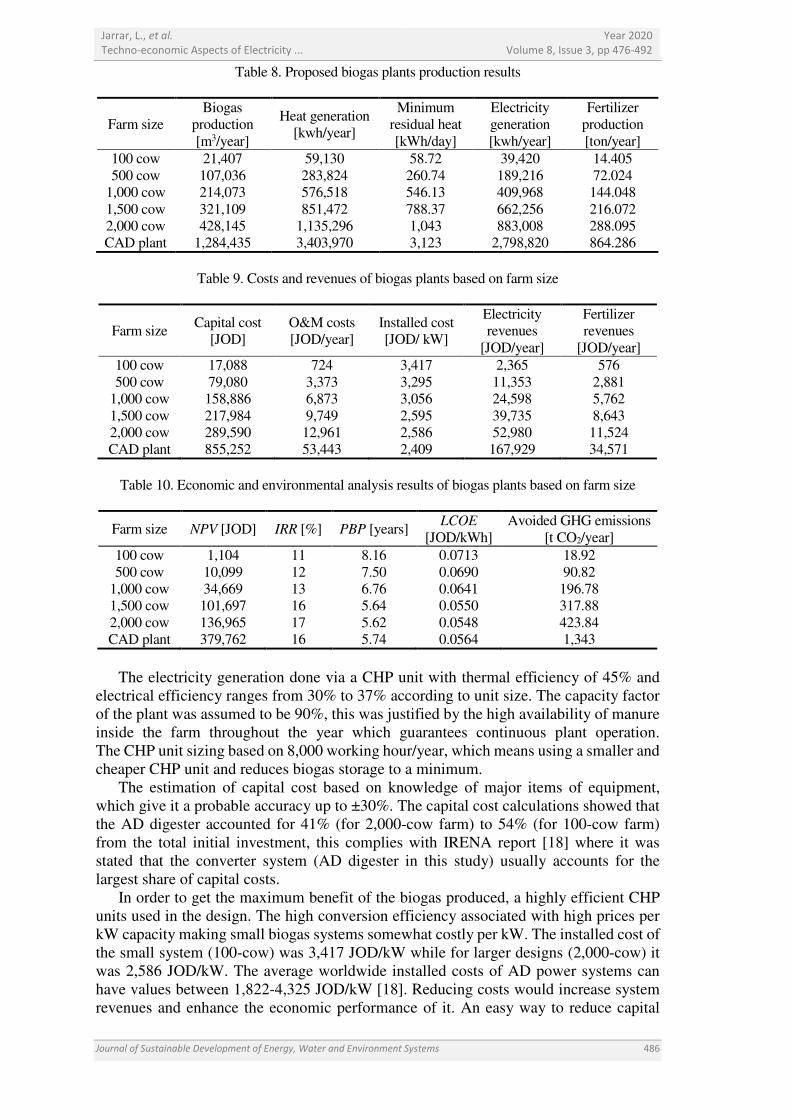
Table 8. Proposed biogas plants production results
Farm size Biogas
production [m3/year]
Heat generation [kwh/year]
Minimum residual heat [kWh/day]
Electricity generation [kwh/year]
Fertilizer production [ton/year]
100 cow 21,407 59,130 58.72 39,420 14.405 500 cow 107,036 283,824 260.74 189,216 72.024
1,000 cow 214,073 576,518 546.13 409,968 144.048 1,500 cow 321,109 851,472 788.37 662,256 216.072 2,000 cow 428,145 1,135,296 1,043 883,008 288.095 CAD plant 1,284,435 3,403,970 3,123 2,798,820 864.286
Table 9. Costs and revenues of biogas plants based on farm size
Farm size Capital cost
[JOD] O&M costs [JOD/year]
Installed cost [JOD/ kW]
Electricity revenues
[JOD/year]
Fertilizer revenues
[JOD/year] 100 cow 17,088 724 3,417 2,365 576 500 cow 79,080 3,373 3,295 11,353 2,881
1,000 cow 158,886 6,873 3,056 24,598 5,762 1,500 cow 217,984 9,749 2,595 39,735 8,643 2,000 cow 289,590 12,961 2,586 52,980 11,524 CAD plant 855,252 53,443 2,409 167,929 34,571
Table 10. Economic and environmental analysis results of biogas plants based on farm size
Farm size NPV [JOD] IRR [%] PBP [years] LCOE
[JOD/kWh] Avoided GHG emissions
[t CO2/year] 100 cow 1,104 11 8.16 0.0713 18.92 500 cow 10,099 12 7.50 0.0690 90.82
1,000 cow 34,669 13 6.76 0.0641 196.78 1,500 cow 101,697 16 5.64 0.0550 317.88 2,000 cow 136,965 17 5.62 0.0548 423.84 CAD plant 379,762 16 5.74 0.0564 1,343
The electricity generation done via a CHP unit with thermal efficiency of 45% and
electrical efficiency ranges from 30% to 37% according to unit size. The capacity factor of the plant was assumed to be 90%, this was justified by the high availability of manure inside the farm throughout the year which guarantees continuous plant operation. The CHP unit sizing based on 8,000 working hour/year, which means using a smaller and cheaper CHP unit and reduces biogas storage to a minimum.
The estimation of capital cost based on knowledge of major items of equipment, which give it a probable accuracy up to ±30%. The capital cost calculations showed that the AD digester accounted for 41% (for 2,000-cow farm) to 54% (for 100-cow farm) from the total initial investment, this complies with IRENA report [18] where it was stated that the converter system (AD digester in this study) usually accounts for the largest share of capital costs.
In order to get the maximum benefit of the biogas produced, a highly efficient CHP units used in the design. The high conversion efficiency associated with high prices per kW capacity making small biogas systems somewhat costly per kW. The installed cost of the small system (100-cow) was 3,417 JOD/kW while for larger designs (2,000-cow) it was 2,586 JOD/kW. The average worldwide installed costs of AD power systems can have values between 1,822-4,325 JOD/kW [18]. Reducing costs would increase system revenues and enhance the economic performance of it. An easy way to reduce capital
Jarrar, L., et al.
Techno-economic Aspects of Electricity ...
Year 2020
Volume 8, Issue 3, pp 476-492
487 Journal of Sustainable Development of Energy, Water and Environment Systems
investment costs is to reduce the digester volume, this could be done by decreasing the process HRT. However, care should be taken so biogas production will not be affected. Another way to reduce costs is to improve the biogas plant efficiency and overall system performance which is the scope of many studies nowadays [39, 40]. For small systems, a less expensive cogeneration technology (e.g. locally fabricated systems) can be adopted. To reduce O&M costs, the operation and routine maintenance of the system were assumed to be done by the farm workers themselves.
The revenues of the system came from electricity and organic fertilizer sales. The solid fertilizer revenues accounted for around 20% of the projects income. The exclusion of land cost, integrating the organic fertilizer sales in the revenues, and the cut-off of labor costs in the plant contributed effectively in the projects economic viability.
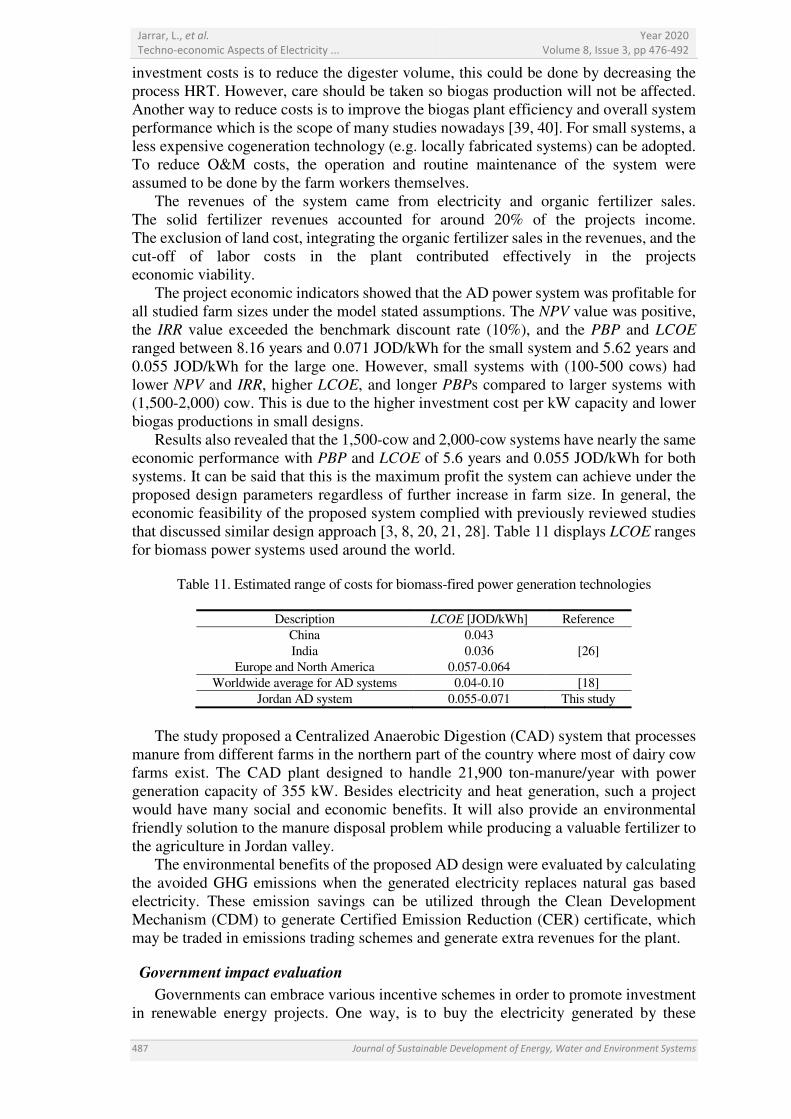
The project economic indicators showed that the AD power system was profitable for all studied farm sizes under the model stated assumptions. The NPV value was positive, the IRR value exceeded the benchmark discount rate (10%), and the PBP and LCOE ranged between 8.16 years and 0.071 JOD/kWh for the small system and 5.62 years and 0.055 JOD/kWh for the large one. However, small systems with (100-500 cows) had lower NPV and IRR, higher LCOE, and longer PBPs compared to larger systems with (1,500-2,000) cow. This is due to the higher investment cost per kW capacity and lower biogas productions in small designs.
Results also revealed that the 1,500-cow and 2,000-cow systems have nearly the same economic performance with PBP and LCOE of 5.6 years and 0.055 JOD/kWh for both systems. It can be said that this is the maximum profit the system can achieve under the proposed design parameters regardless of further increase in farm size. In general, the economic feasibility of the proposed system complied with previously reviewed studies that discussed similar design approach [3, 8, 20, 21, 28]. Table 11 displays LCOE ranges for biomass power systems used around the world.
Table 11. Estimated range of costs for biomass-fired power generation technologies
Description LCOE [JOD/kWh] Reference
China 0.043 [26] India 0.036
Europe and North America 0.057-0.064 Worldwide average for AD systems 0.04-0.10 [18]
Jordan AD system 0.055-0.071 This study
The study proposed a Centralized Anaerobic Digestion (CAD) system that processes
manure from different farms in the northern part of the country where most of dairy cow farms exist. The CAD plant designed to handle 21,900 ton-manure/year with power generation capacity of 355 kW. Besides electricity and heat generation, such a project would have many social and economic benefits. It will also provide an environmental friendly solution to the manure disposal problem while producing a valuable fertilizer to the agriculture in Jordan valley.
The environmental benefits of the proposed AD design were evaluated by calculating the avoided GHG emissions when the generated electricity replaces natural gas based electricity. These emission savings can be utilized through the Clean Development Mechanism (CDM) to generate Certified Emission Reduction (CER) certificate, which may be traded in emissions trading schemes and generate extra revenues for the plant.
Government impact evaluation
Governments can embrace various incentive schemes in order to promote investment in renewable energy projects. One way, is to buy the electricity generated by these
Jarrar, L., et al.
Techno-economic Aspects of Electricity ...
Year 2020
Volume 8, Issue 3, pp 476-492
Journal of Sustainable Development of Energy, Water and Environment Systems 488
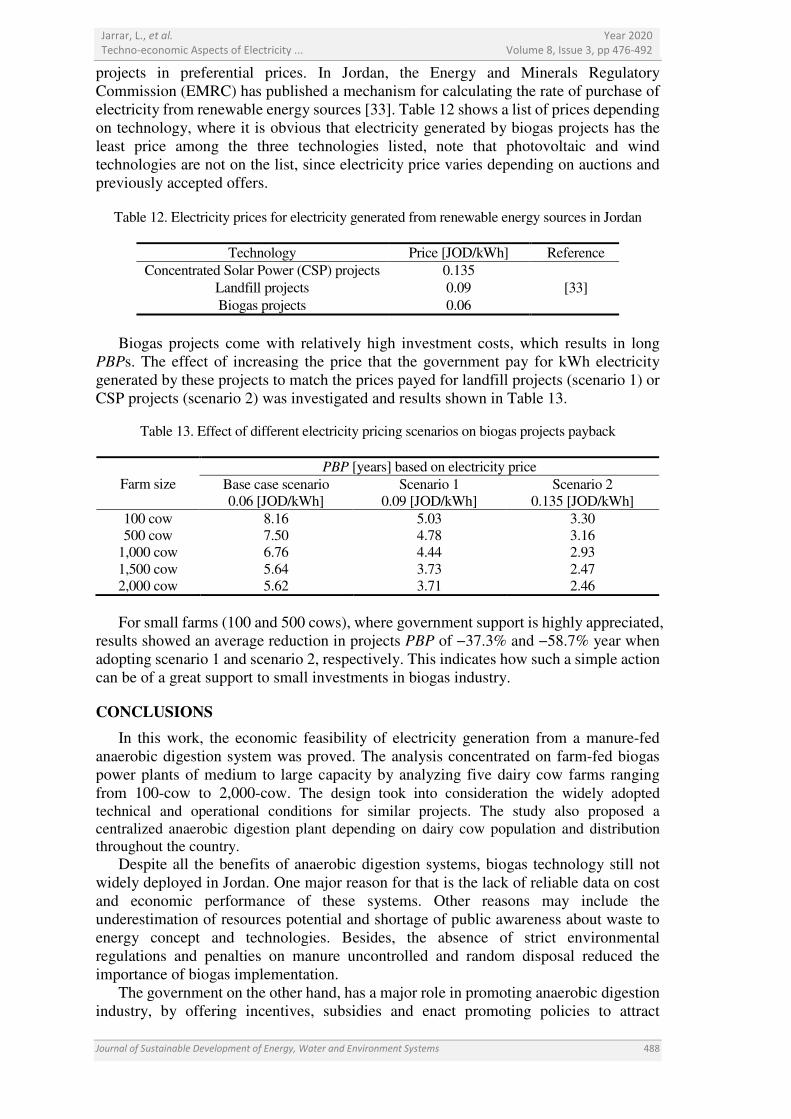
projects in preferential prices. In Jordan, the Energy and Minerals Regulatory Commission (EMRC) has published a mechanism for calculating the rate of purchase of electricity from renewable energy sources [33]. Table 12 shows a list of prices depending on technology, where it is obvious that electricity generated by biogas projects has the least price among the three technologies listed, note that photovoltaic and wind technologies are not on the list, since electricity price varies depending on auctions and previously accepted offers.
Table 12. Electricity prices for electricity generated from renewable energy sources in Jordan
Technology Price [JOD/kWh] Reference
Concentrated Solar Power (CSP) projects 0.135 [33] Landfill projects 0.09
Biogas projects 0.06
Biogas projects come with relatively high investment costs, which results in long
PBPs. The effect of increasing the price that the government pay for kWh electricity generated by these projects to match the prices payed for landfill projects (scenario 1) or CSP projects (scenario 2) was investigated and results shown in Table 13.
Table 13. Effect of different electricity pricing scenarios on biogas projects payback
Farm size PBP [years] based on electricity price
Base case scenario 0.06 [JOD/kWh]
Scenario 1 0.09 [JOD/kWh]
Scenario 2 0.135 [JOD/kWh]
100 cow 8.16 5.03 3.30 500 cow 7.50 4.78 3.16
1,000 cow 6.76 4.44 2.93 1,500 cow 5.64 3.73 2.47 2,000 cow 5.62 3.71 2.46
For small farms (100 and 500 cows), where government support is highly appreciated,
results showed an average reduction in projects PBP of −37.3% and −58.7% year when adopting scenario 1 and scenario 2, respectively. This indicates how such a simple action can be of a great support to small investments in biogas industry.
CONCLUSIONS
In this work, the economic feasibility of electricity generation from a manure-fed anaerobic digestion system was proved. The analysis concentrated on farm-fed biogas power plants of medium to large capacity by analyzing five dairy cow farms ranging from 100-cow to 2,000-cow. The design took into consideration the widely adopted technical and operational conditions for similar projects. The study also proposed a centralized anaerobic digestion plant depending on dairy cow population and distribution throughout the country.
Despite all the benefits of anaerobic digestion systems, biogas technology still not widely deployed in Jordan. One major reason for that is the lack of reliable data on cost and economic performance of these systems. Other reasons may include the underestimation of resources potential and shortage of public awareness about waste to energy concept and technologies. Besides, the absence of strict environmental regulations and penalties on manure uncontrolled and random disposal reduced the importance of biogas implementation.
The government on the other hand, has a major role in promoting anaerobic digestion industry, by offering incentives, subsidies and enact promoting policies to attract
Jarrar, L., et al.
Techno-economic Aspects of Electricity ...
Year 2020
Volume 8, Issue 3, pp 476-492
489 Journal of Sustainable Development of Energy, Water and Environment Systems
investors and stakeholders. An increase in the official price of kWh electricity generated by biogas projects from 0.06 to 0.09 JOD/kWh would result in an average decrease of −37.3% in PBP for small projects. After all, further optimization of these investigated biogas plants would add more value for the development and application of biogas technology in the country.
NOMENCLATURE
BD biogas density [kg/m3] BP daily biogas production [m3/day] BY biogas yield [m3/kg ODM] Calg calorific value of biogas [MJ/m3] Cp Specific heat capacity [kJ/kg°C] DM dry matter content [%] Eelec expected electricity production [kWh/year] Eg biogas energy [kWh/year] EmNG emissions of electricity produced by natural gas [t CO2/MWh] En electricity production in year n [kWh/year] Eth expected thermal production [kWh/year] Fn fuel expenditure in year n [JOD] HRT hydraulic retention time [days] i discount rate [%] I initial capital investment [JOD] In investment expenditure in year n [JOD] LCOE levelized cost of electricity [JOD/kWh] mf feed flowrate [m3/year] mw water flowrate [m3/year] Mn operation and maintenance expenditure in year n [JOD] N project life [years] ODM organic dry matter content [%] Qf feed heat requirement [kJ/day] Td digestion temperature [°C] Tf feed temperature [°C] V total digester volume [m3] VD digestion tank volume [m3] Vg biogas storage volume [m3]
Greek letters
ƞelec electrical conversion efficiency ƞth thermal conversion efficiency
Subscripts
D digester elec electricity f feed g biogas th thermal w water
REFERENCES
1. Abdeshahian, P., Lim, J. S., Ho, W. S., Hashim, H. and Lee, C. T., Potential of Biogas Production from Farm Animal Waste in Malaysia, Renewable and Sustainable
Jarrar, L., et al.
Techno-economic Aspects of Electricity ...
Year 2020
Volume 8, Issue 3, pp 476-492
Journal of Sustainable Development of Energy, Water and Environment Systems 490
Energy Reviews, Vol. 60, pp 714-723, 2016, https://doi.org/10.1016/j.rser.2016.01.117
2. Wu, A., Lovett, D., McEwan, M., Cecelja, F. and Chen, T., A Spreadsheet Calculator for Estimating Biogas Production and Economic Measures for UK-based Farm-fed Anaerobic Digesters, Bioresource Technology, Vol. 220, pp 479-489, 2016, https://doi.org/10.1016/j.biortech.2016.08.103
3. White, A. J., Kirk, D. W. and Graydon, J. W., Analysis of Small-scale Biogas Utilization Systems on Ontario Cattle Farms, Renewable Energy, Vol. 36, No. 3, pp 1019-1025, 2011, https://doi.org/10.1016/j.renene.2010.08.034
4. Al Seadi, T., Rutz, D., Prassl, H., Köttner, M., Finsterwalder, T., Volk, S. and Janssen, R., Biogas Handbook, University of Southern Denmark Esbjerg, Esbjerg, Denmark, 2008.
5. Grando, R. L., da Fonseca, F. V. and Antunes, A. M. de S., Mapping of the Use of Waste as Raw Materials for Biogas Production, Journal of Environmental Protection, Vol. 8, No. 2, pp 120-130, 2017, https://doi.org/10.4236/jep.2017.82010
6. Meyer, A. K. P., Ehimen, E. A. and Holm-Nielsen, J. B., Future European Biogas: Animal Manure, Straw and Grass Potentials for a Sustainable European Biogas Production, Biomass and Bioenergy, Vol. 111, pp 154-164, 2016, https://doi.org/10.1016/j.biombioe.2017.05.013
7. Scarlat, N., Dallemand, J.-F. and Fahl, F., Biogas: Developments and Perspectives in Europe, Renewable Energy, Vol. 129, Part A, pp 457-472, 2018, https://doi.org/10.1016/j.renene.2018.03.006
8. Salerno, M., Gallucci, F., Pari, L., Zambon, I., Sarri, D. and Colantoni, A., Costs-benefits Analysis of a Small-scale Biogas Plant and Electric Energy Production, Bulgarian Journal of Agricultural Science, Vol. 23, No. 3, pp 357-362, 2017.
9. Morgan, H. M., Xie, W., Liang, J., Mao, H., Lei, H., Ruan, R. and Bu, Q., A Techno-economic Evaluation of Anaerobic Biogas Producing Systems in Developing Countries, Bioresource Technology, Vol. 250, pp 910-921, 2017, https://doi.org/10.1016/j.biortech.2017.12.013
10. Tauseef, S. M., Premalatha, M., Abbasi, T. and Abbasi, S. A., Methane Capture from Livestock Manure, Journal of Environmental Management, Vol. 117, pp 187-207, 2013, https://doi.org/10.1016/j.jenvman.2012.12.022
11. Yasar, A., Nazir, S., Rasheed, R., Tabinda, A. B. and Nazar, M., Economic Review of Different Designs of Biogas Plants at Household Level in Pakistan, Renewable and
Sustainable Energy Reviews, Vol. 74, pp 221-229, 2017, https://doi.org/10.1016/j.rser.2017.01.128
12. Özer, B., Biogas Energy Opportunity of Ardahan City of Turkey, Energy, Vol. 139, pp 1144-1152, 2017, https://doi.org/10.1016/j.energy.2017.07.052
13. Arshad, M., Bano, I., Khan, N., Shahzad, M. I., Younus, M., Abbas, M. and Iqbal, M., Electricity Generation from Biogas of Poultry Waste: An Assessment of Potential and Feasibility in Pakistan, Renewable and Sustainable Energy Reviews, Vol. 81, Part 1, pp 1241-1246, 2018, https://doi.org/10.1016/j.rser.2017.09.007
14. Curto, D. and Martín, M., Renewable Based Biogas Upgrading, Journal of Cleaner
Production, Vol. 224, pp 50-59, 2019, https://doi.org/10.1016/j.jclepro.2019.03.176 15. Benizri, D., Dietrich, N., Labeyrie, P. and Hébrard, G., Separation and Purification
Technology a Compact, Economic Scrubber to Improve Farm Biogas Upgrading Systems, Separation and Purification Technology, Vol. 219, pp 169-179, 2019, https://doi.org/10.1016/j.seppur.2019.02.054
16. Prajapati, K. B. and Singh, R., Enhancement of Biogas Production in Bio-electrochemical Digester from Agricultural Waste Mixed with Wastewater, Renewable Energy, Vol. 146, pp 460-468, 2020, https://doi.org/10.1016/j.renene.2019.06.154
Jarrar, L., et al.
Techno-economic Aspects of Electricity ...
Year 2020
Volume 8, Issue 3, pp 476-492
491 Journal of Sustainable Development of Energy, Water and Environment Systems
17. Al-rousan, A. and Zyadin, A., A Technical Experiment on Biogas Production from Small-scale Dairy Farm, Journal of Sustainable Bioenergy Systems, Vol. 4, No. 1, pp 10-18, 2014, https://doi.org/10.4236/jsbs.2014.41002
18. International Renewable Energy Agency (IRENA), Renewable Energy Technologies: Cost Analysis Series, Biomass for Power Generation, 2012, www.irena.org/Publications, [Accessed: 05-June-2018]
19. Rupf, G. V., Bahri, P. A., de Boer, K. and McHenry, M. P., Development of an Optimal Biogas System Design Model for Sub-Saharan Africa with Case Studies from Kenya and Cameroon, Renewable Energy, Vol. 109, pp 586-601, 2017, https://doi.org/10.1016/j.renene.2017.03.048
20. Akbulut, A., Techno-economic Analysis of Electricity and Heat Generation from Farm-scale Biogas Plant: Çiçekdaĝi{dotless} Case Study, Energy, Vol. 44, No. 1, pp 381-390, 2012, https://doi.org/10.1016/j.energy.2012.06.017
21. Wresta, A., Andriani, D., Saepudin, A. and Sudibyo, H., Economic Analysis of Cow Manure Biogas as Energy Source for Electricity Power Generation in Small Scale Ranch, Energy Procedia, Vol. 68, pp 122-131, 2015, https://doi.org/10.1016/j.egypro.2015.03.240
22. International Renewable Energy Agency (IRENA), Measuring Small-scale Biogas Capacity and Production, Abu Dhabi, UAE, 2016, https://www.irena.org/-/media/Files/IRENA/Agency/Publication/2016/IRENA_Statistics_Measuring_small-scale_biogas_2016.pdf, [Accessed: 05-June-2018]
23. German Solar Energy Society and Ecofys, Planning and Installing Bioenergy Systems:
A Guide for Installers, Architects and Engineers (1st ed.), James & James, London, UK, 2005.
24. Lantz, M., The Economic Performance of Combined Heat and Power from Biogas Produced from Manure in Sweden – A Comparison of Different CHP Technologies, Applied Energy, Vol. 98, pp 502-511, 2012, https://doi.org/10.1016/j.apenergy.2012.04.015
25. Mohammed, M., Egyir, I. S., Donkor, A. K., Amoah, P., Nyarko, S., Boateng, K. K. and Ziwu, C., Feasibility Study for Biogas Integration into Waste Treatment Plants in Ghana, Egyptian Journal of Petroleum, Vol. 26, No. 3, pp 695-703, 2017, https://doi.org/10.1016/j.ejpe.2016.10.004
26. International Renewable Energy Agency (IRENA), Renewable Power Generation Costs in 2017, Abu Dhabi, UAE, 2018, https://www.irena.org/-/media/Files/IRENA/Agency/Publication/2018/Jan/IRENA_2017_Power_Costs_2018.pdf, [Accessed: 05-June-2018]
27. Wu, B., Zhang, X., Shang, D., Bao, D., Zhang, S. and Zheng, T., Energetic-environmental-economic Assessment of the Biogas System with Three Utilization Pathways: Combined Heat and Power, Biomethane and Fuel Cell, Bioresource Technology, Vol. 214, pp 722-728, 2016, https://doi.org/10.1016/j.biortech.2016.05.026
28. Teymoori Hamzehkolaei, F. and Amjady, N., A Techno-economic Assessment for Replacement of Conventional Fossil Fuel based Technologies in Animal Farms with Biogas Fueled CHP Units, Renewable Energy, Vol. 118, pp 602-614, 2018, https://doi.org/10.1016/j.renene.2017.11.054
29. US Environmental Protection Agency (EPA) ‒ CHP Partnership, Catalog of CHP Technologies ‒ Section 7, Packaged CHP Systems, 2017, https://www.epa.gov/sites/production/files/2017-09/documents/catalog-of-chp-technologies-section-7.pdf, [Accessed: 10-June-2018]
30. Murphy, J. D., McKeogh, E. and Kiely, G., Technical/Economic/Environmental Analysis of Biogas Utilisation, Applied Energy, Vol. 77, No. 4, pp 407-427, 2004, https://doi.org/10.1016/j.apenergy.2003.07.005
Jarrar, L., et al.
Techno-economic Aspects of Electricity ...
Year 2020
Volume 8, Issue 3, pp 476-492
Journal of Sustainable Development of Energy, Water and Environment Systems 492
31. US Environmental Protection Agency (EPA) ‒ CHP Partnership, Catalog of CHP Technologies, 2015, https://www.epa.gov/chp/catalog-chp-technologies, [Accessed: 10-June-2018]
32. Jones, P. and Salter, A., Modelling the Economics of Farm-based Anaerobic Digestion in a UK Whole-farm Context, Energy Policy, Vol. 62, pp 215-225, 2013, https://doi.org/10.1016/j.enpol.2013.06.109
33. Energy and Minerals Regulatory Commission (EMRC), Electricity Pricing, http://www. emrc.gov.jo/images/electric/electric_price_tech.pdf, [Accessed: 30-June-2019]
34. Jordan Investment Commission (JIC), Preliminary Feasibility Study of Organic Fertilizer Project, https://jic.gov.jo/portal, [Accessed: 10-May-2018]
35. Park, C. S., Contemporary Engineering Economics (4th ed.), Pearson Prentice Hall, New Jersey, USA, 2007.
36. World Bank, CO2 Emission from Electricity and Heat Production: Data, https://data.worldbank.org/indicator/EN.CO2.ETOT.ZS, [Accessed: 05-July-2018]
37. National Electric Power Co. (NEPCO), Statistics, http://www.nepco.com.jo/statistical_info_ar.aspx#, [Accessed: 05-July-2018]
38. Department of Statistics (DOS), Statistical Year Book of Jordan 2018, Amman, Jordan, http://dosweb.dos.gov.jo/ar/publications/, [Accessed: 30-June-2019]
39. Almomani, F., Shawaqfah, M., Bhosale, R. R., Kumar, A. and Khraisheh, M. A. M., Intermediate Ozonation to Enhance Biogas Production in Batch and Continuous Systems using Animal Dung and Agricultural Waste, International Biodeterioration
and Biodegradation, Vol. 119, pp 176-187, 2017, https://doi.org/10.1016/j.ibiod.2016.11.008
40. Wandera, S. M., Qiao, W., Algapani, D. E., Bi, S., Yin, D., Qi, X. and Dong, R., Searching for Possibilities to Improve the Performance of Full Scale Agricultural Biogas Plants, Renewable Energy, Vol. 116, Part A, pp 720-727, 2018, https://doi.org/10.1016/j.renene.2017.09.087
Paper submitted: 19.02.2019 Paper revised: 24.07.2019
Paper accepted: 14.08.2019