Embed Size (px)
Citation preview
Journal of Theoretical and Applied Information Technology 10
th December 2014. Vol.70 No.1
© 2005 - 2014 JATIT & LLS. All rights reserved.
ISSN: 1992-8645 www.jatit.org E-ISSN: 1817-3195
186
A STUDY ON THE PSO MODEL BASED QUICK TOTAL
PRODUCTIVE MAINTENANCE FOR SMALL AND TINY
ENTERPRISES
1G.ANANTH,
2B.K VINAYAGAM
1 Research Scholar, Faculty of Engg. and Tech. SME, SRM University India. 2 Professor of Mechatronics, SME, SRM University India.. E-mail: 1 [email protected], [email protected]
ABSTRACT
The Significance of Total Productive Maintenance (TPM), its applicability in small and tiny enterprises (STEs), the condition of the STEs, their survival problems, lack of any modern management/maintenance methodology that helps improve the productivity are what the driving forces of this work. A fast track version is designed, considering Critical Success Factors (CSF) and it can be called as Quick Total Productive Maintenance (Q-TPM), without diluting the essence of original TPM, in this study. The study is also an attempt to develop a mathematical model called Particle Swarm Optimization (PSO) specifically for the STEs. Thus, the model developed can be handled/extrapolated /interpolated in various manners, so that selective parameters may be altered to improve productivity and Synthetic Data Generation (SDG) may be done for further enhancement.
Keywords: TPM, Q-TPM, CSF, STEs, SDG, PSO, Mathematical Model, Productivity
1. INTRODUCTION TO ‘TPM’ AND
MODIFIED ‘Q-TPM’
Total Productive Maintenance (TPM) [1],[2],[3] is a management methodology adopted worldwide by major industries to maximize productivity. It is something that is measured by the overall equipment effectiveness (OEE) and is applicable throughout the life of the equipment/machinery/plant considered. It is of Japanese origin but has been proved successful in major industries everywhere. It is a comprehensive maintenance program and it involves everyone in the enterprise. It has been observed to be complicated to implement, but if implemented perfectly it is evident to be highly productive. Though there is a well defined procedure for implementation, available in the form of pillars of TPM, following it is tricky. It has been observed that, if it is partially or for namesake implemented, the result would be uninteresting. The industries usually show much enthusiasm initially and as the years go by, they start losing interest in it, as the result of it, would be experienced only after a
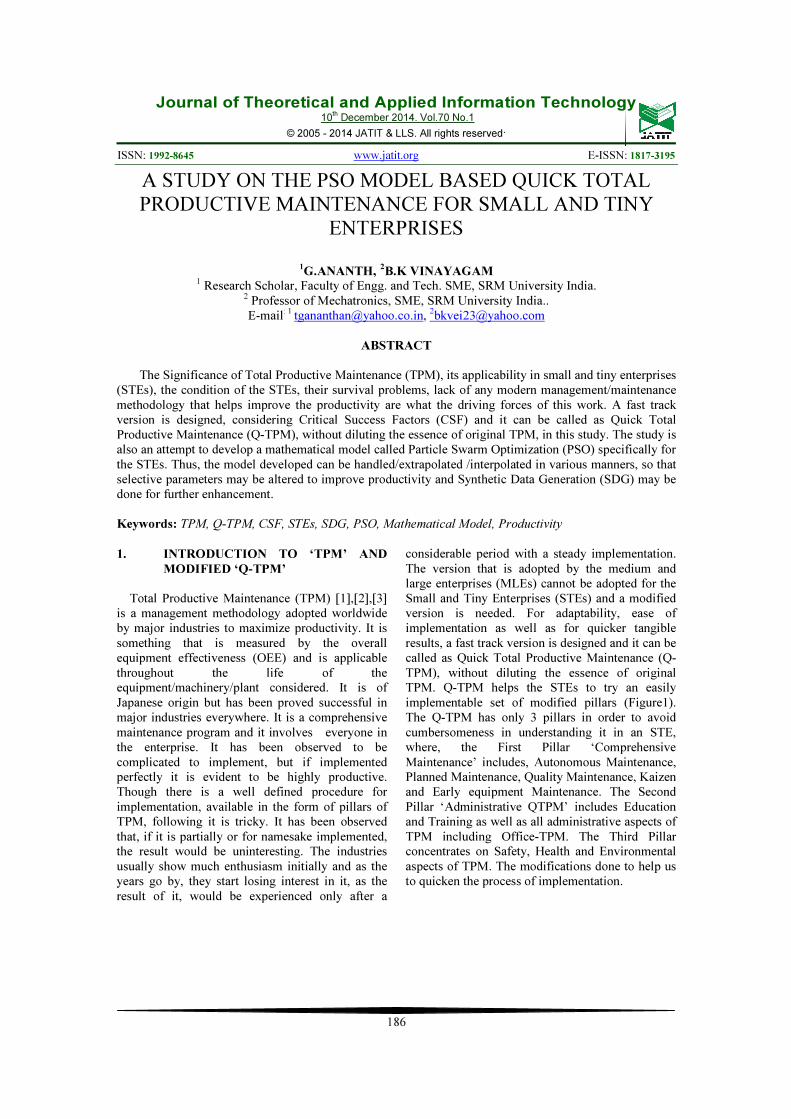
considerable period with a steady implementation. The version that is adopted by the medium and large enterprises (MLEs) cannot be adopted for the Small and Tiny Enterprises (STEs) and a modified version is needed. For adaptability, ease of implementation as well as for quicker tangible results, a fast track version is designed and it can be called as Quick Total Productive Maintenance (Q-TPM), without diluting the essence of original TPM. Q-TPM helps the STEs to try an easily implementable set of modified pillars (Figure1). The Q-TPM has only 3 pillars in order to avoid cumbersomeness in understanding it in an STE, where, the First Pillar ‘Comprehensive Maintenance’ includes, Autonomous Maintenance, Planned Maintenance, Quality Maintenance, Kaizen and Early equipment Maintenance. The Second Pillar ‘Administrative QTPM’ includes Education and Training as well as all administrative aspects of TPM including Office-TPM. The Third Pillar concentrates on Safety, Health and Environmental aspects of TPM. The modifications done to help us to quicken the process of implementation.
Journal of Theoretical and Applied Information Technology 10
th December 2014. Vol.70 No.1
© 2005 - 2014 JATIT & LLS. All rights reserved.
ISSN: 1992-8645 www.jatit.org E-ISSN: 1817-3195
187
Figure1: QTPM Pillar
2. MOTIVATION: STATUS OF THE SMALL
AND TINY ENTERPRISES (STEs)
Most of the small, medium, and large enterprises (SMLEs) rely on many tiny industries for most of their smaller and sub-components, which may be functioning as individual units or may be ancillary units of the main units. Whatever may be the case, tiny enterprises have a noticeable impact on the whole. Our consideration is the tiny units run individually, where the annual transaction is limited and varies with the country. There are many tiny units functioning in a conventional manner without the knowledge of or not considering the modern trends. On the other hand they struggle a lot for a survival and to withstand the competition. Of course, to be competitive they need to update themselves. But they are afraid of the increase in the expenses as well as lack of personnel to guide them. Moreover the complications in the understanding of the core concept of any modern tools, aids, techniques etc., impair such implementation of them, even in small, medium and large industries themselves, it is difficult, due to non involvement of the top management as well as the personnel up to the lowest rung. Cynicism is always there considering TPM also as one of the 3 or 4 letter acronym of the month. Since the outcome as well as the benefits of TPM could be perceived only after a long term proper implementation [5],[6],[7] without any lacuna. But there is a clear evidence of positive outcomes and noticeable benefits as found by Mishra RP [12], Gadjick [14],.
Considering the tiny enterprises, to taste the benefits they are not ready to spend time, money, personnel etc., and they still prefer short-term benefits. This makes the introduction of TPM in such industries become more and more difficult. Finding an apt industry and convincing the management remains a Himalayan task. Despite all the obstacles, TPM remains a relevant and important technique to be competitive in all respects. This aspect motivated and made this research possible and fruitful [8],[9] [10],[11].
3. THE ‘SWOT’ AND ‘CSF’ ANALYSES
As discussed by Mishra RP et.al [12] there exists a number of frame works designed by or adopted by a variety of industries/organizations, selecting a suitable frame work for a tiny/small manufacturing facility is a difficult job. So conducting a SWOT (strength, weakness, opportunities and threat) analysis is a right choice. Initially a model may be designed which concentrates on the economic efficiency, which plans and controls the maintenance expenses, to gain confidence of the top management, of course a tiny enterprise is mostly run by an individual. Convincing the management using economic efficiency of the model may be attractive; of course, zero accident, zero defect and zero failure are underlying agenda of the model. Coming to the workers participation, the tiny/small units normally have only temporary workers or workers’ turnover would be more, this should be changed. Though the
work force is of small strength it should be properly paid, educated, and trained so that understanding
and involvement would be there from their part, which in turn results in staff retention.
Then comes the critical success factors (CSF), for a successful implementation and productivity
enhancement there are certain criteria responsible and they may be termed as Critical Success Factors (CSF) like, Management Support,
Journal of Theoretical and Applied Information Technology 10
th December 2014. Vol.70 No.1
© 2005 - 2014 JATIT & LLS. All rights reserved.
ISSN: 1992-8645 www.jatit.org E-ISSN: 1817-3195
188
Employee Participation, Knowledge and Skill, Training and Education, Maintenance Strategy,
Supplier /customer Support Maintenance Data etc.; These were analyzed from the context of STEs [29].
4. DOWN TIME DETAILS OF A
LAMINATION MACHINE IN A
PRINTING INDUSTRY
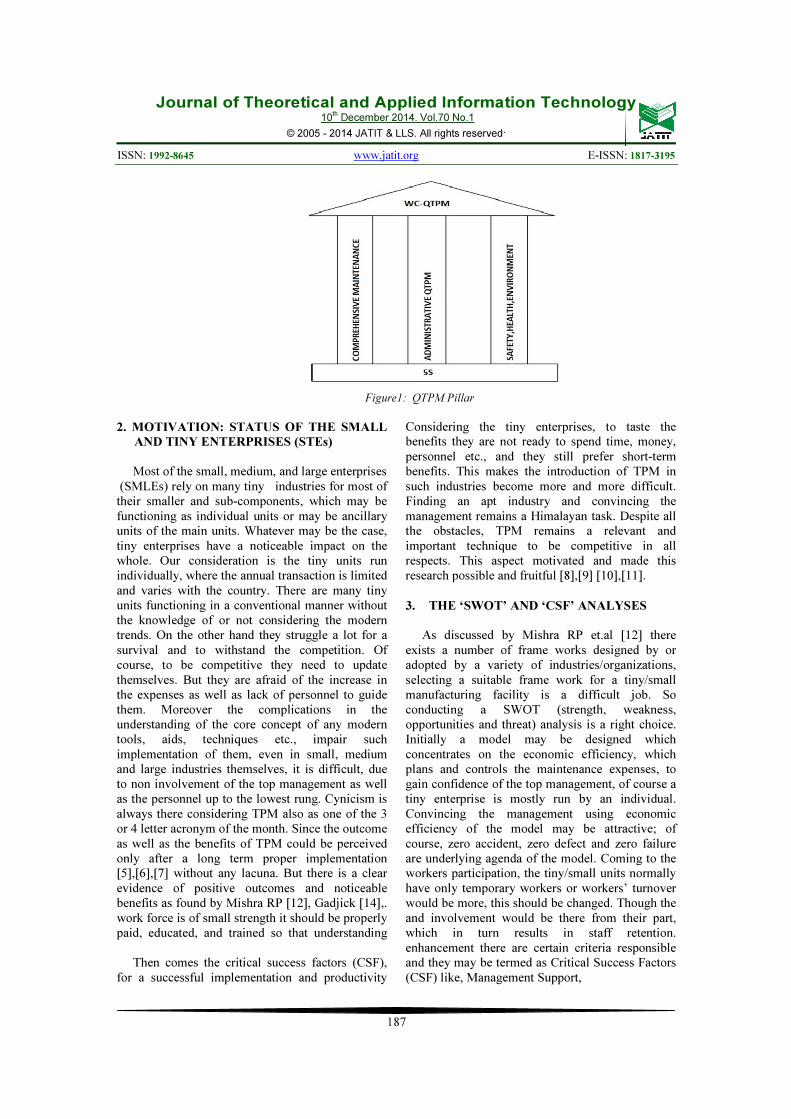
A data was collected on a Lamiantion Machine of a Printinting Industry falling under STE category and Fig.1 details the alteration of one of the procedures of down time procedure in Lamination machine. In fact, the downtime procedure is the synthesis of many methods. However, we are concerned only with the chronological career deficiency procedure in the entire downtime procedure. It is the mix of No. of job and job
variation procedures. With a view to decreasing these procedures, we carry out the QTPM doctrines in the company and the downtime process gets decreased without any complication. We also execute suitable design and decision making procedures in the company, and hence the chronological career deficiency procedure gets dwindled by about 56%.
F
i
Figure 2: Downtime Variation of Lamination Machine
5. MODEL BUILDING USING PARTICLE
SWARM OPTIMIZATION (PSO)
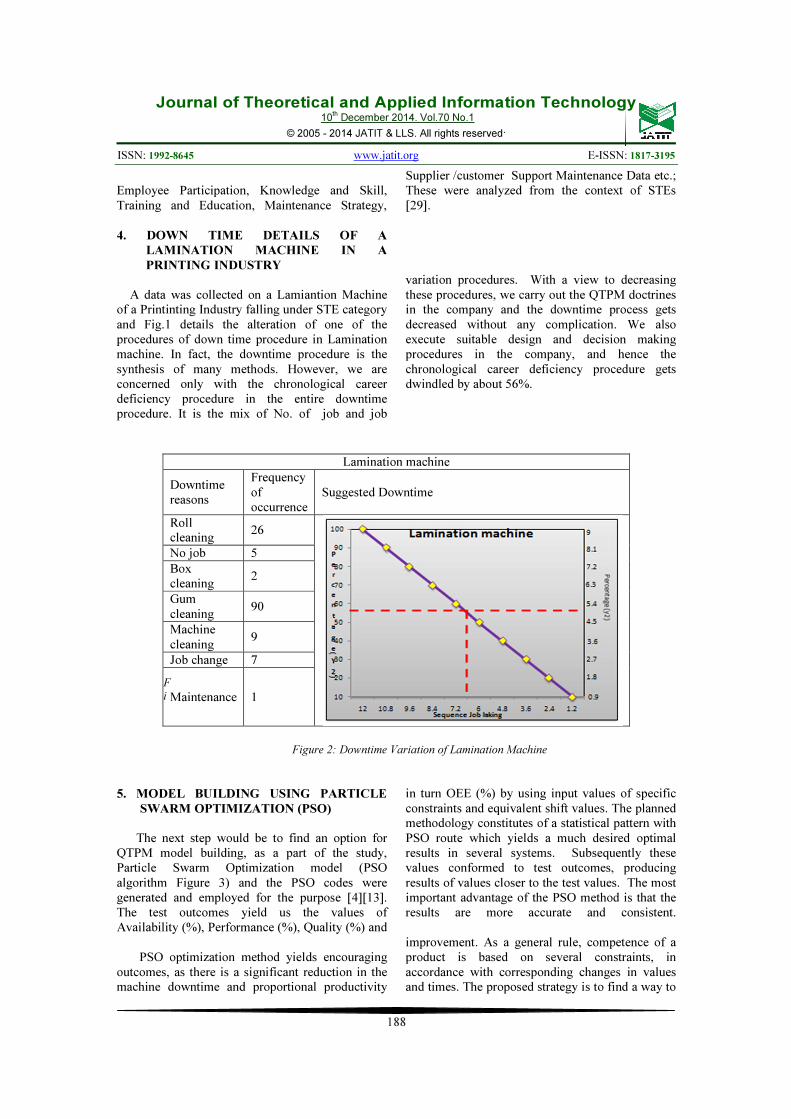
The next step would be to find an option for QTPM model building, as a part of the study, Particle Swarm Optimization model (PSO algorithm Figure 3) and the PSO codes were generated and employed for the purpose [4][13]. The test outcomes yield us the values of Availability (%), Performance (%), Quality (%) and
in turn OEE (%) by using input values of specific constraints and equivalent shift values. The planned methodology constitutes of a statistical pattern with PSO route which yields a much desired optimal results in several systems. Subsequently these values conformed to test outcomes, producing results of values closer to the test values. The most important advantage of the PSO method is that the results are more accurate and consistent.
PSO optimization method yields encouraging outcomes, as there is a significant reduction in the machine downtime and proportional productivity
improvement. As a general rule, competence of a product is based on several constraints, in accordance with corresponding changes in values and times. The proposed strategy is to find a way to
Lamination machine
Downtime reasons
Frequency of occurrence
Suggested Downtime
Roll cleaning
26
No job 5
Box cleaning
2
Gum cleaning
90
Machine cleaning
9
Job change 7
Maintenance 1
Journal of Theoretical and Applied Information Technology 10
th December 2014. Vol.70 No.1
© 2005 - 2014 JATIT & LLS. All rights reserved.
ISSN: 1992-8645 www.jatit.org E-ISSN: 1817-3195
189
upgrade the OEE value, by making use of certain methods which will ultimately usher in further decrease in downtime. This method enables the downtime values to go down sufficiently enough to augment the efficiency of the systems. When considering the Lamination machines with downtime values decrease in the process to 56%. After measuring the down time and total operation time, it is computed the new values of all constraints and shift values to find out the efficiency values, which is then supplied to the proposed model. At last it is arrived at the better values to the experimental values [4],[13]. Using PSO route, introduced the
mathematical model, which is applied on all the parameters and shift values for finding out the overall efficiency values, which are validated with the experimental results. It is then considered for all the output parameters such as availability, performance, quality and OEE for the up gradation later. The figures 3and 4 below were plotted for mathematical model with PSO technique output performances and experimental results. From these graphs, we can show that PSO technique has performances closest to the experimental results. [15]
Figure 3: Flow Chart Of PSO Algorithm
)))((exp(1
1
0
0
∑∑
=
=
++++++++−
=n
j
ijtt
N
i
iQ
TPGFNRDBT
Yopt
µ
ω
PQA YYYE ∗∗=
Eqns 1,2,3,4
)))((exp(1
1
0
0
A opt
∑∑
=
=
++++++++−
=n
j
ijtt
N
i
i
TPGFNRDBT
Y
µ
ω
)))((exp(1
1
0
0
∑∑
=
=
++++++++−
=n
j
ijtt
N
i
iP
TPGFNRDBT
Yopt
µ
ω
Journal of Theoretical and Applied Information Technology 10
th December 2014. Vol.70 No.1
© 2005 - 2014 JATIT & LLS. All rights reserved.
ISSN: 1992-8645 www.jatit.org E-ISSN: 1817-3195
190
Where,
���
�
Percentage value of availability; ��-
Percentage value of Quality; �� –Percentage value of
Performance; E - Percentage value of OEE; μ, ω -Random function value, T - Total Time; B- Production Breaks; D-Machine Downtime; R -Production Rate; N-Total products Produced; F -Total Products Rejected; G-Total Good Products Produced ;Pt -Total Planned
Production time; Tt -Total Operating time; G best- - position of swarm; P best -
position of particle
6. SUGGESTED MODELING
After the actual statistical modeling is
completed, we advance to assess the recommended output values using statistical modeling of PSO algorithm. The authentic experiments yield trial output values like Availability, Performance, Quality, and OEE. With a view to increasing the output values, we have suggested some proposals based on the down time alteration, considering the fact that downtime is the main trait which has a
sway over the entire process of the company. Our statistical model values have previously been compared with real experimental values. Clearly, the real experimentation has nine input parameters and four output values. We perform alteration in the downtime according to the deviation of each input parameter. The production breaks are programmed to default. Then we calculate some input parameters as per the following equation.
DTTt
−=
(5)
BTPt
−=
(6)
Tt-Total Operating time ; T-Total Time ; D-Machine Downtime;Pt-Total Planned Production time ; T -Total Time ; B-Production Breaks
The value of Total No. of cartons created is
the product of Total intended production time and production rate according to the real performance values. The process is done again and again to estimate the input parameters of all machines. After they are estimated, these values are furnished to the mathematical model of PSO algorithm. We derive the optimum output value vis-à-vis that of the existing technique.
7. SUGGESTED RESULT OF OEE
At first, we devised a statistical modeling of genuine test outcome employing PSO algorithm. This model was demonstrated with genuine test outcomes. And it was found that the model values were identical to the actual test values. Subsequently this statistical model is employed for estimating the recommended table output values according to the downtime alteration. Then we proceeded to make the input data of recommended table using equations 5 and 6 for the machine. Thereafter all input values are furnished to the PSO algorithm and at last we derived the optimum output values superior to the current output values.
Journal of Theoretical and Applied Information Technology 10
th December 2014. Vol.70 No.1
© 2005 - 2014 JATIT & LLS. All rights reserved.
ISSN: 1992-8645 www.jatit.org E-ISSN: 1817-3195
191
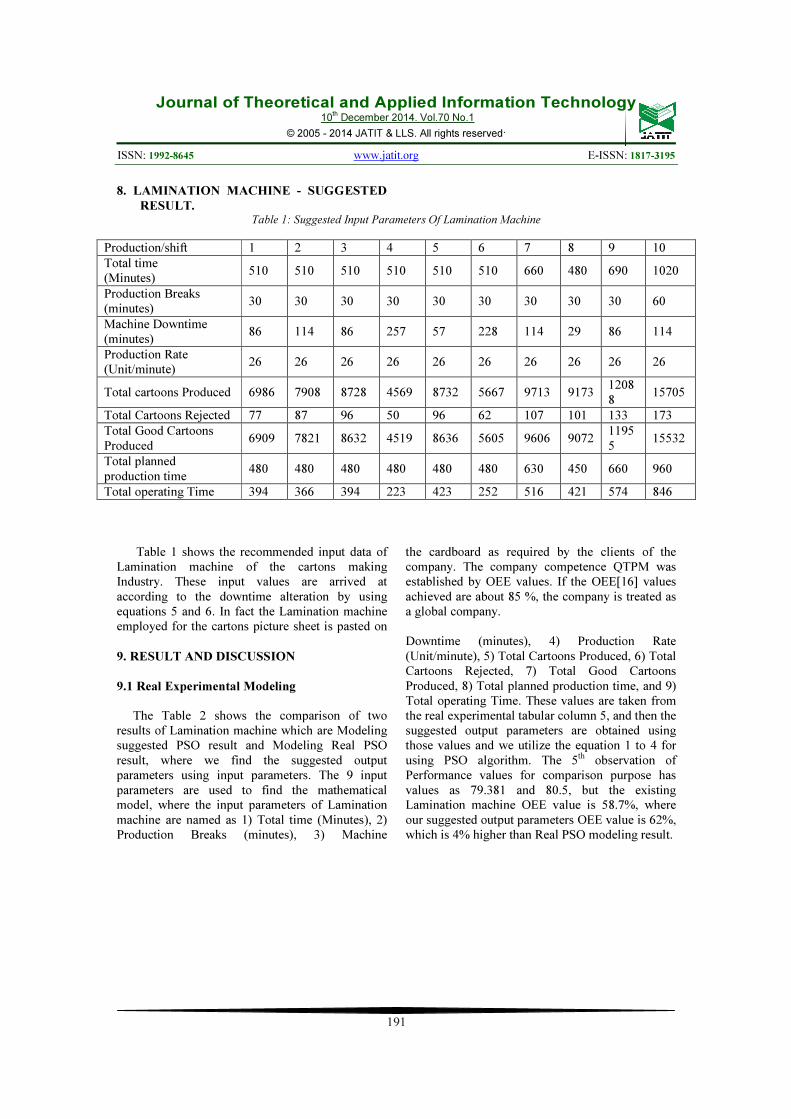
8. LAMINATION MACHINE - SUGGESTED
RESULT.
Table 1: Suggested Input Parameters Of Lamination Machine
Production/shift 1 2 3 4 5 6 7 8 9 10
Total time (Minutes)
510 510 510 510 510 510 660 480 690 1020
Production Breaks (minutes)
30 30 30 30 30 30 30 30 30 60
Machine Downtime (minutes)
86 114 86 257 57 228 114 29 86 114
Production Rate (Unit/minute)
26 26 26 26 26 26 26 26 26 26
Total cartoons Produced 6986 7908 8728 4569 8732 5667 9713 9173 12088
15705
Total Cartoons Rejected 77 87 96 50 96 62 107 101 133 173
Total Good Cartoons Produced
6909 7821 8632 4519 8636 5605 9606 9072 11955
15532
Total planned production time
480 480 480 480 480 480 630 450 660 960
Total operating Time 394 366 394 223 423 252 516 421 574 846
Table 1 shows the recommended input data of Lamination machine of the cartons making Industry. These input values are arrived at according to the downtime alteration by using equations 5 and 6. In fact the Lamination machine employed for the cartons picture sheet is pasted on
the cardboard as required by the clients of the company. The company competence QTPM was established by OEE values. If the OEE[16] values achieved are about 85 %, the company is treated as a global company.
9. RESULT AND DISCUSSION
9.1 Real Experimental Modeling
The Table 2 shows the comparison of two results of Lamination machine which are Modeling suggested PSO result and Modeling Real PSO result, where we find the suggested output parameters using input parameters. The 9 input parameters are used to find the mathematical model, where the input parameters of Lamination machine are named as 1) Total time (Minutes), 2) Production Breaks (minutes), 3) Machine
Downtime (minutes), 4) Production Rate (Unit/minute), 5) Total Cartoons Produced, 6) Total Cartoons Rejected, 7) Total Good Cartoons Produced, 8) Total planned production time, and 9) Total operating Time. These values are taken from the real experimental tabular column 5, and then the suggested output parameters are obtained using those values and we utilize the equation 1 to 4 for using PSO algorithm. The 5th observation of Performance values for comparison purpose has values as 79.381 and 80.5, but the existing Lamination machine OEE value is 58.7%, where our suggested output parameters OEE value is 62%, which is 4% higher than Real PSO modeling result.
Journal of Theoretical and Applied Information Technology 10
th December 2014. Vol.70 No.1
© 2005 - 2014 JATIT & LLS. All rights reserved.
ISSN: 1992-8645 www.jatit.org E-ISSN: 1817-3195
192
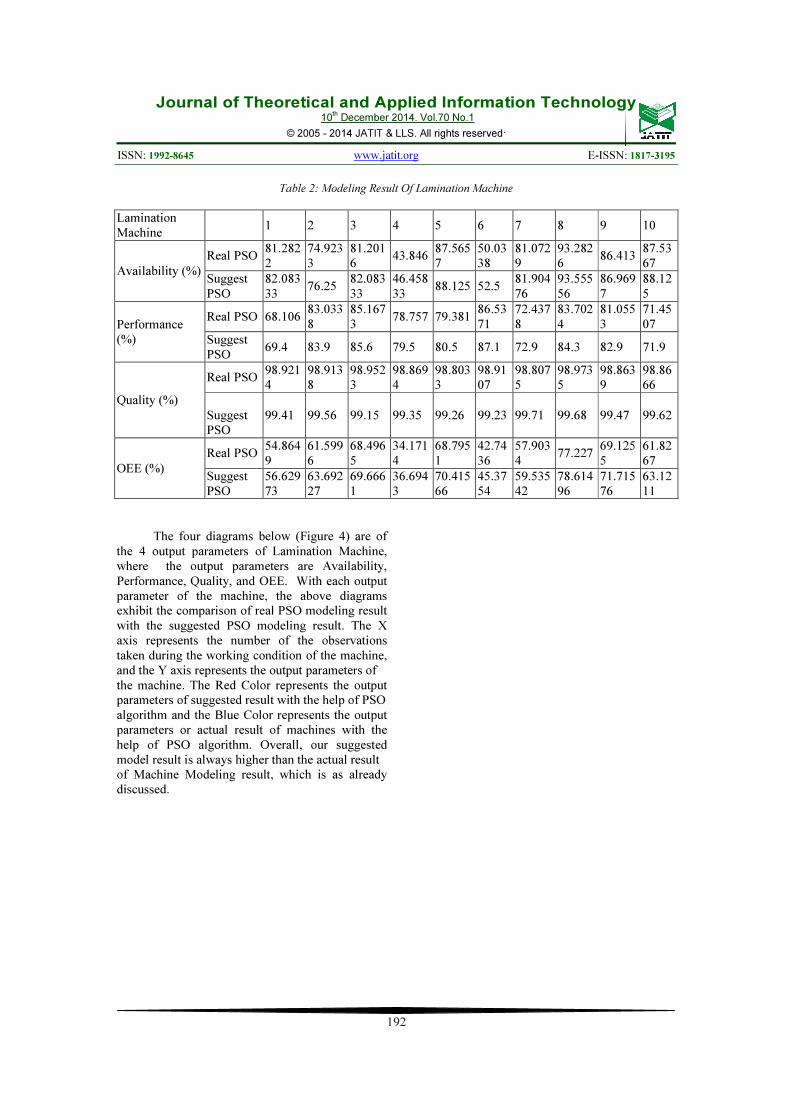
Table 2: Modeling Result Of Lamination Machine
Lamination Machine
1 2 3 4 5 6 7 8 9 10
Availability (%)
Real PSO 81.2822
74.9233
81.2016
43.846 87.5657
50.0338
81.0729
93.2826
86.413 87.5367
Suggest PSO
82.08333
76.25 82.08333
46.45833
88.125 52.5 81.90476
93.55556
86.9697
88.125
Performance (%)
Real PSO 68.106 83.0338
85.1673
78.757 79.381 86.5371
72.4378
83.7024
81.0553
71.4507
Suggest PSO
69.4 83.9 85.6 79.5 80.5 87.1 72.9 84.3 82.9 71.9
Quality (%)
Real PSO 98.9214
98.9138
98.9523
98.8694
98.8033
98.9107
98.8075
98.9735
98.8639
98.8666
Suggest PSO
99.41 99.56 99.15 99.35 99.26 99.23 99.71 99.68 99.47 99.62
OEE (%)
Real PSO 54.8649
61.5996
68.4965
34.1714
68.7951
42.7436
57.9034
77.227 69.1255
61.8267
Suggest PSO
56.62973
63.69227
69.6661
36.6943
70.41566
45.3754
59.53542
78.61496
71.71576
63.1211
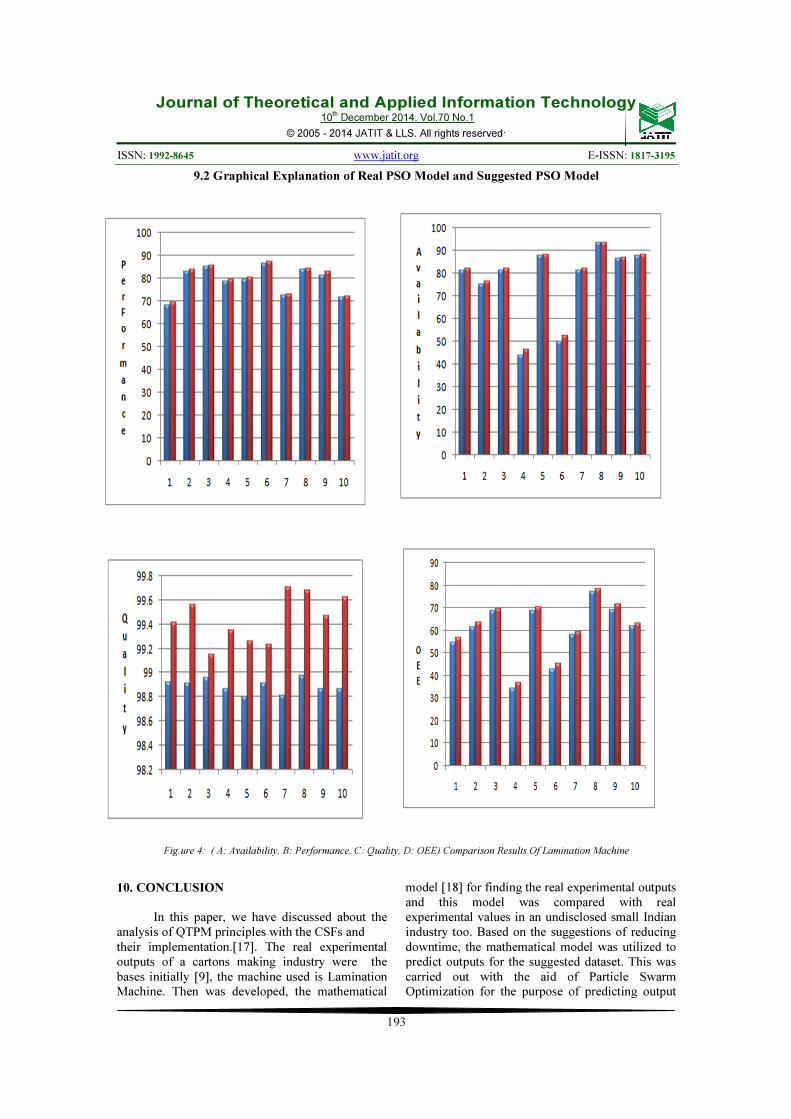
The four diagrams below (Figure 4) are of
the 4 output parameters of Lamination Machine, where the output parameters are Availability, Performance, Quality, and OEE. With each output parameter of the machine, the above diagrams exhibit the comparison of real PSO modeling result with the suggested PSO modeling result. The X axis represents the number of the observations taken during the working condition of the machine, and the Y axis represents the output parameters of the machine. The Red Color represents the output parameters of suggested result with the help of PSO algorithm and the Blue Color represents the output parameters or actual result of machines with the help of PSO algorithm. Overall, our suggested model result is always higher than the actual result of Machine Modeling result, which is as already discussed.
Journal of Theoretical and Applied Information Technology 10
th December 2014. Vol.70 No.1
© 2005 - 2014 JATIT & LLS. All rights reserved.
ISSN: 1992-8645 www.jatit.org E-ISSN: 1817-3195
193
9.2 Graphical Explanation of Real PSO Model and Suggested PSO Model
Fig.ure 4: ( A: Availability, B: Performance, C: Quality, D: OEE) Comparison Results Of Lamination Machine
10. CONCLUSION
In this paper, we have discussed about the analysis of QTPM principles with the CSFs and their implementation.[17]. The real experimental outputs of a cartons making industry were the bases initially [9], the machine used is Lamination Machine. Then was developed, the mathematical
model [18] for finding the real experimental outputs and this model was compared with real experimental values in an undisclosed small Indian industry too. Based on the suggestions of reducing downtime, the mathematical model was utilized to predict outputs for the suggested dataset. This was carried out with the aid of Particle Swarm Optimization for the purpose of predicting output
Journal of Theoretical and Applied Information Technology 10
th December 2014. Vol.70 No.1
© 2005 - 2014 JATIT & LLS. All rights reserved.
ISSN: 1992-8645 www.jatit.org E-ISSN: 1817-3195
194
for suggested data. Finally, optimum values of the output parameters when compared to the existing results were obtained. The existing results of the machine is 58.77% and the final OEE value obtained for the suggested machine outputs is 62%, which is superior when compared to the existing results. Thus Mathematical modeling can be used to find any real experimental values without any complexity and it could be implemented easily as well as used to predict the future outcomes also, like SDG .[19]-[25].
REFERENCES:
[1] Nakajima, S. (1986),”TPM a challenge to the improvement of productivity by small group activities'', Maintenance Management
International, Edition No. 6, pp. 73-83. [2] Nakajima, S. (1988), Introduction to Total
Productive Maintenance, Productivity Press, Cambridge, MA.
[3] Nakajima, S. (1989), TPM Development Programme: Implementing Total Productive Maintenance, Productivity Press, Cambridge, MA.
[4] James Kennedy and Russell Eberhart,’ Particle Swarm Optimization’, IEEE, ,1995, pp 1942-1948
[5] Ireland and B.G. Dale, "A study of total productive maintenance implementation”, Journal of Quality in Maintenance
Engineering, Vol. 7 No. 3, 2001, pp.183-19, [6] Kristy O. Cua, Kathleen E. McKone and Roger
G. Schroeder, "Relationships between implementation of TQM, JIT, and TPM and manufacturing performance", Journal of
Operations Management, Vol.19, 2001, pp.675-694
[7] Kathleen E. McKone, Roger G. Schroeder and Kristy O. Cua, "The impact of total productive maintenance practices on manufacturing performance”, Journal of Operations
Management, Vol.19, 2001,pp.39-58, [8] Abhijit Gosavi, "A risk-sensitive
approach to total productive maintenance", Automatica, Vol.42,, 2006, pp.1321-1330
[9] .Jörn-Henrick Thun, (2006) Maintaining preventive maintenance and maintenance prevention: analysing the dynamic implications of Total Productive Maintenance, John Wiley & Sons, Ltd. Syst. Dyn. Rev. 22, 163–179,
[10] Renuka Thota, Dr.N.Suren Dwivedi, Total Product Maintenance in Lean Manufacturing, Proceedings of the 2006 ASEE Gulf-Southwest
Annual Conference, Southern University and
A&M College, American Society for Engineering Education.
[11] Halim Mad Lazim, T. Ramayah and Norzieiriani Ahmad, Total Productive Maintenance And Performance: A Malaysian SME Experience, International Review of
Business Research Papers, Vol 4 No. 4 Aug – Sept 2008, Pp.237-250
[12] Rajesh Prasad Mishra, G. Anand, Rambabu Kodali, A SWOT analysis of total productive maintenance frameworks, Int. J. Management
Practice, Vol. 3, No. 1, 2008.
[13] Hugo Jair Escalante.etal Particle Swarm Model Selection, Journal of Machine Learning
Research 10, 2009,405-440.
[14] B. Gajdzik, “Introduction Of Total Productive Maintenance In Steelworks Plants”, Metalurgija, Vol. 48, No. 2, 2009, pp. 137-140
[15] Kamran Shahanaghi , Seyed Ahmad Yazdian, Analyzing the effects of implementation of Total Productive Maintenance (TPM) in the manufacturing companies: a system dynamics approach, World Journal of Modelling and
Simulation, Vol. 5 (2009) No. 2, pp. 120-129
[16] S.Fore, L.Zuze, Improvement of Overall Equipment Effectiveness through TPM, World
Academy of Science, Engineering and
Technology, 61, 2010
[17] Osama Taisir R.Almeanazel, Total Productive Maintenance Review and Overall Equipment Effectiveness Measurement, Jordan Journal of
Mechanical and Industrial Engineering, Volume 4, Number 4, September 2010 ISSN 1995-6665 Pages 517 – 522
[18] N.F. Wang and Tai, "Target matching problems and an adaptive constraint strategy for multi objective design optimization using genetic algorithms”, Computers and
Structures, Vol.88, 2010 , pp.1064-1076,
[19] I.P.S. Ahuja, Manufacturing Excellence Through Total Productive Maintenance Paradigm, Int. J. Technology, Policy and
Management, Vol. 11, No. 1, 2011.
[20] K. C. Ng, G. G. G. Goh and U. C. Eze, "Total Productive Maintenance in a Semiconductor Manufacturing Firm: An Empirical Analysis ",In proc of IEEE
International Conference on Industrial
Engineering and Engineering Management
(IEEM),2011, pp.829-833
[21] Ravikant V. Paropate, Shrikant R. Jachak and Prasad A. Hatwalne, “Implementing Approach
Journal of Theoretical and Applied Information Technology 10
th December 2014. Vol.70 No.1
© 2005 - 2014 JATIT & LLS. All rights reserved.
ISSN: 1992-8645 www.jatit.org E-ISSN: 1817-3195
195
of Total Productive Maintenance in Indian Industries & Theoretical Aspect: An overview”, International Journal Of Advanced
Engineering Sciences And Technologies, Vol. 6, No. 2,, 2011, pp. 270 - 276
[22] Abhijit Gosavi, Susan L. Murray, V. Mohamed Hassan, “Modeling an Oil Drilling Rig Total Productive Maintenance System Using Causal Loop Diagram Simulation”, CPMR-International Journal of Technology, Vol. 2, No. 2, December 2012, pp. 17-26,
[23] Khairul Hafiz Norddin Mohd Norddin and Muhamad Zameri Mat Saman, “Implementation of Total Productive Maintenance Concept In A Fertilizer Process Plant”, Jurnal Mekanikal, No 34, 2012, pp. 66-82,
[24] Badli Shah M.Y, “Total Productive Maintenance: A Study of Malaysian Automotive SMEs” Proceedings of the World
Congress on Engineering , WCE 2012, July 4 - 6, 2012, London, U.K. Vol. III, 2012.
[25] Ranteshwar Singh, Ashish M Gohil, Dhaval B Shah and Sanjay Desai, “Total Productive Maintenance (TPM) Implementation in a Machine Shop: A Case Study”, in proceedings of 3rd Nirma University International
Conference on Engineering, Procedia Engineering, Vol.51, 2013, pp. 592-599


![ISSN: 1992-8645 E-ISSN: A NEW STATIC ...some of these are: frequency planning, sectoring, and Fractional Frequency Reuse (FRF) [6]. Frequency planning means dividing the available](https://img.pdfslide.net/doc/110x75/5e91c4a33cd849146311230c/issn-1992-8645-e-issn-a-new-static-some-of-these-are-frequency-planning.jpg)