Embed Size (px)
Citation preview

Journal of Theoretical and Applied Information Technology 31st August 2018. Vol.96. No 16
© 2005 – ongoing JATIT & LLS
ISSN: 1992-8645 www.jatit.org E-ISSN: 1817-3195
5291
ENHANCEMENT OF GEOMETRICAL PREDICTIVE HANDOVER PROBABILITY BASED ON COVERAGE
SECTORS 1ALSUBAIE, SULAIMAN MOHAMMED S, 2NOR EFFENDY OTHMAN, 3ROSILAH HASSAN
Research Center for Software Technology and Management, Faculty of Information Science and Technology, Universiti Kebangsaan Malaysia, Selangor, Malaysia.
E-mail: [email protected], [email protected], [email protected]
ABSTRACT Mobile Internet Protocol (IP) handover refers to the seamless communication link change of one node from one access point to another. It is useful for preventing disruption in communication sessions in general, and it has a significant impact on the performance of the vehicular networks for the frequency of an occurrence in particular. This is important for different networks in general and vehicular networks in particular due to the high dependency of different vehicular and intelligent transportation of the internet. Thus, it is highly motivational applications to develop an efficient handover system for vehicular networks. The problematic aspect of vehicular handover is the non-accurate location information that might be provided to the handover because the non-accurate Global Positioning System (GPS) signal in an urban environment especially when the environment is occupied by the tall structures. Hence, it is essential to develop vehicular handover from the perspective of location prediction to assist in correct prediction to the next access point (AP). The two issues of mobile IP handover are in the latency and the possible loss of packets. Most previous studies have concentrated on the architecture aspect of the mobile IP to resolve this problem. Despite the effectiveness of such solutions they do not target directly the latency problem caused by the handover. In this research, a probability based geometrical model is developed for prediction of next AP based on logged information about the history of vehicles mobility in the road with respect to current AP. The methodology is based on dividing the coverage area around each AP to set of sectors and building dynamic probability table about the mobility of the vehicle from one AP at particular sector to the predicted AP. For further improvement in the performance, Kalman filter has been incorporated into each vehicle for accurate prediction of the vehicle location in the coverage zone. Simulation results have proven that our model outperformed the previous models in terms of all evaluation measures of the network performance: Packet Delivery Ratio (PDR), End to End delay (E2E delay), and overhead. The improvement showing on effects of number of sectors in the PDR is nearly 26.15% while the enhancement of the delay is up to 84.21% in the zone of the transition from one AP to another AP. Moreover, the achieved improvement of overhead is with a percentage of 34.67%. Keywords: Handover, Vehicular Network, Predictive Handover, Mobile IP, Coverage Sector. 1. INTRODUCTION
The modern era has witnessed an
extraordinary development of communication and networking with a broad range of applications in various fields [1] [2]. Vehicular networks are being incorporated into the architecture of the intelligent transportation system, and there is an active research for resolving its limitations and performance problems [3] [4]. Handover is one important aspect when developing reliable and excellent quality of service for vehicular networks. Handover or handoff is an event of handling the case when a mobile node moves from one wireless cell to another. Two main types of handover exist: horizontal and vertical. In horizontal, the handover occurs within single wireless technology while in the vertical the handover occurs within heterogeneous wireless technology. The primary
focus of this research article is to resolve two insufficient performance results of mobile Internet Protocol (IP) handover in the horizontal type: latency and loss of packets.
In the IP-based vehicular system, the mobile nodes or the vehicles are connected to an Access Point (AP). The mobility of the vehicle prevents the node from staying within the coverage zone of one AP all the time. As a result, the vehicle has to conduct two steps very frequently: discovering a new AP and registering through the new AP with its home agent (HA). These two steps combine the so-called: IP handover. Typically, the discovery and the registration of the vehicle at the new AP requires a specific time, which might disrupt the quality of service regarding E2E delay and PDR. A high demand for a solution that maintains a smooth mobile IP handover with the least performance cost is needed.

Journal of Theoretical and Applied Information Technology 31st August 2018. Vol.96. No 16
© 2005 – ongoing JATIT & LLS
ISSN: 1992-8645 www.jatit.org E-ISSN: 1817-3195
5292
Fast Mobile IP (FMIP) and Hierarchical Mobile IP (HMIP) are the most commonly studied to resolve the mobile IP handover performance issue. Both of these two methods change mobile IP architecture to solve performance costs. FMIP is using MAC layers triggers and HMIP is adding mobility access point. Regardless these two approaches are valid solutions, but there remains room for improvement. On the contrary, predictive handover is another method where it does not change architecture aspect of the mobile IP. A node in this approach aims to predict the next AP and performing an early registration while it is in its current.
Mobile IP handover has a significant impact on the performance of the vehicular networks for the frequent of an occurrence. It provides the nodes with internet access while moving from the range of one AP to another with minimum interruption. Thus, it is highly motivational applications to develop an efficient handover system for vehicular networks. The problematic aspect of vehicular handover is the non-accurate location information that might be provided the handover due to the non-accurate GPS signal in an urban environment especially when tall structures occupy the environment. Most of the previous approaches have tackled the handover from the perspective of architecture. However, less work has concentrated on the prediction of next AP which in case it has been performed with good accuracy; a less latency handover can be achieved. Alexander Magnano et al., have developed a baseline approach for performing vehicular handover with prediction capability [5]. However, more accurate prediction can be made in case the road environment is partitioned, and a historical profile for the navigation information of the vehicles has been built. This historical profile can assist in providing a prediction of the next AP based on the frequency of the vehicles that have been navigating within the same part of the road.
The primary goal of this study is to develop a vehicular handover system in general. The first objectives of this study is developing prediction process for vehicular handover based on geometrical prediction table. Secondly, Evaluation of the developed approach based on standard evaluation measures and comparing them with the benchmark.
This work develops vehicular handover based on geometrical prediction process. It considers a different number of vehicles starting from 40 vehicles until 90 vehicles. The vehicles are moving in different directions according to the road
infrastructure. Moreover, different velocities are considered for the vehicles. Different number of AP are also considered with no overlapping region in the coverage zone between them. More concentration is on the prediction part and its impact on the performance of the vehicular handover in general.
Vehicular ad hoc networks (VANETs) are mainly developing new network systems to provide the abilities of a new age of wireless technologies for vehicles. The ability to provide seamless connectivity for vehicles on the road is the primary purpose of VANETs. It is also focusing on providing V2I and V2V communications that target the efficient Intelligent Transportation System (ITS) [6]. Based on that there are many phases of the applications system requests to develop robust applications, that might involve prevention of collisions ،Real-time detour routes, computation, and control of traffic flows when across to other vehicular systems. Therefore, applications in VANET can be classified into three primary service and applications such as traffic management and monitoring systems, safety applications and comfort applications.
The organization of the article is as follows. In section 2 provide a summary of the related work. The baseline architecture Alexander Magnano et al., is introduced in section 3 [5]. Section 4 presents the developed methodology in this study while section 5 provides discussion on simulation and result. Section 6 and 7 provide research contribution and limitation. Finally, section 8 presents the conclusion and the future work.
2. RELATED WORKS
Handover has been reviewed in the work of
[7]. This survey presents a thorough categorization of the previous work on the problem of handover mobility. Three main categories are made: horizontal handovers, vertical handovers, and multi-homing. Also, the author has discussed both IPv4 and IPv6 based networks. The literature that has addressed the mobile handover problem can be categorized under two classes: the hierarchical and fast handovers. The hierarchical handover concentrates on the registration aspect. The earlier research that has addressed the hierarchical handover is introduced by [8]. This approach has aimed to resolve the mobile IP handover through introducing mobility anchor points (MAPs). The specific goal of using MAPs is to use them as temporary HA located closer to the mobile nodes. However, a common problem with this approach is

Journal of Theoretical and Applied Information Technology 31st August 2018. Vol.96. No 16
© 2005 – ongoing JATIT & LLS
ISSN: 1992-8645 www.jatit.org E-ISSN: 1817-3195
5293
the additional latency and overhead caused by transmitting data across multiple MAPs.
In the fast handover, the mobile node,
when there is another coverage zone of AP, it should quickly connect to the other AP, some techniques aimed at resolving this by scanning AP in advance or using the same IP address [9]. Predictive based approaches are more promising in resolving the problem of latency. Bergh & Ventura have implemented data mining algorithm based on the user’s mobility history between wireless subnets [10]. Alexander Magnano et al., have proposed new handover model for vehicular network that predicts next AP's destination for nodes and perform early registration based on probability analysis and vehicle movements [5]. However, there is lacking of customization to dense environment and complex road topologies. This can be handled by developing location aware prediction. Wanalertlak et al., study user's short-term behavior including location information, group, time-of-day, and duration characteristics of mobile users to provide accurate next-cell predictions [11]. However, the performance varies according to the density. Sandonis et al., present solution to provide Internet access from VANETs combining the Proxy Mobile IPv6 (PMIPv6) with The European Telecommunications Standards Institute Technical Committee Intelligent Transport System (ETSI TC ITS) and its GeoNetworking (GN) protocols [12]. However, the handover scheme ignores a prediction which plays an important role in reducing the latency. Asefi et al., proposes network mobility management scheme for seamless delivery of video packets in VANET [13]. It introduces adaptation of Proxy Mobile IPv6 (PMIPv6) for multi-hop VANET incorporating a handover prediction mechanism. The handover prediction mechanism is based on fixed velocity assumption which is not applied when the vehicle is accelerating or decelerating. Thus, it is not suitable for realistic conditions. Tin-Yu Wu et al., introduces Quality Scan scheme to enhance the handoff performance in VANETs [14]. It’s pre-scanning method that considers the signal strength and the load balance of the nodes.
Therefore this paper introduces AP
controller (APC) to collect information and the loading states of APs, and traffic and moving speed. Later, APs send a result to MN to select optimal AP. However, the prediction is provided for the mobile node to select their APs to improve
the handover processing. Prakash et al., present a vehicle assisted cross-layer handover scheme (VACH) by using VANEMO which is the combination of VANET and NEMO [15]. Other vehicles can assist vehicle which is undergoing handover process to get the router advertisement of the next access point and receiving packets destined for handover vehicle. However, relying on neighbor nodes in assisting of vehicles (V2V) causes a high variation in the performance according to the density of vehicles in the road. Also, there is no incorporation of any prediction approach. Pyo and Choi proposed a cross-layer handover scheme based on movement prediction for mobile WiMAX networks [16]. Exponential smoothing method has been used for prediction. Signal strength has been measured between nodes and access point continuously and used for exponential smoothing method. As a result, layer -3 handover tasks can be performed prior to layer 2 which as a result decrease the latency. This approach suffers from increasing computational complexity if accurate results of prediction are needed. 3. THE BASELINE ARCHITECTURE
The baseline from Alexander Magnano et al.
is adopted for this research [5]. The baseline introduced a new model that predicts next AP's destination and perform early registration. The baseline predicts next AP's destination based on probability analysis and vehicle movements. After predicting next destination, it performs early registration. Next, AP is determined by using a combination of different algorithms. Firstly, Kalman filter provides a tracking to the vehicle trajectory, secondly, hidden Markov model (HMM) is used to predict next state of the vehicle. The vehicle location is measured by GPS signal. Once AP is predicted an early registration is done. Figure 1 and Figure 2 illustrate the process of prediction, communication, and registration between three elements of the proposed predictive handover protocol: AP, vehicle, and HA. The wired communication can happen between two APs or between AP and HA, While the wireless communication happens between the vehicle and its AP. In both figures, the probability table is used in each vehicle to predict from its current AP the next AP.
Journal of Theoretical and Applied Information Technology 31st August 2018. Vol.96. No 16
© 2005 – ongoing JATIT & LLS
ISSN: 1992-8645 www.jatit.org E-ISSN: 1817-3195
5294
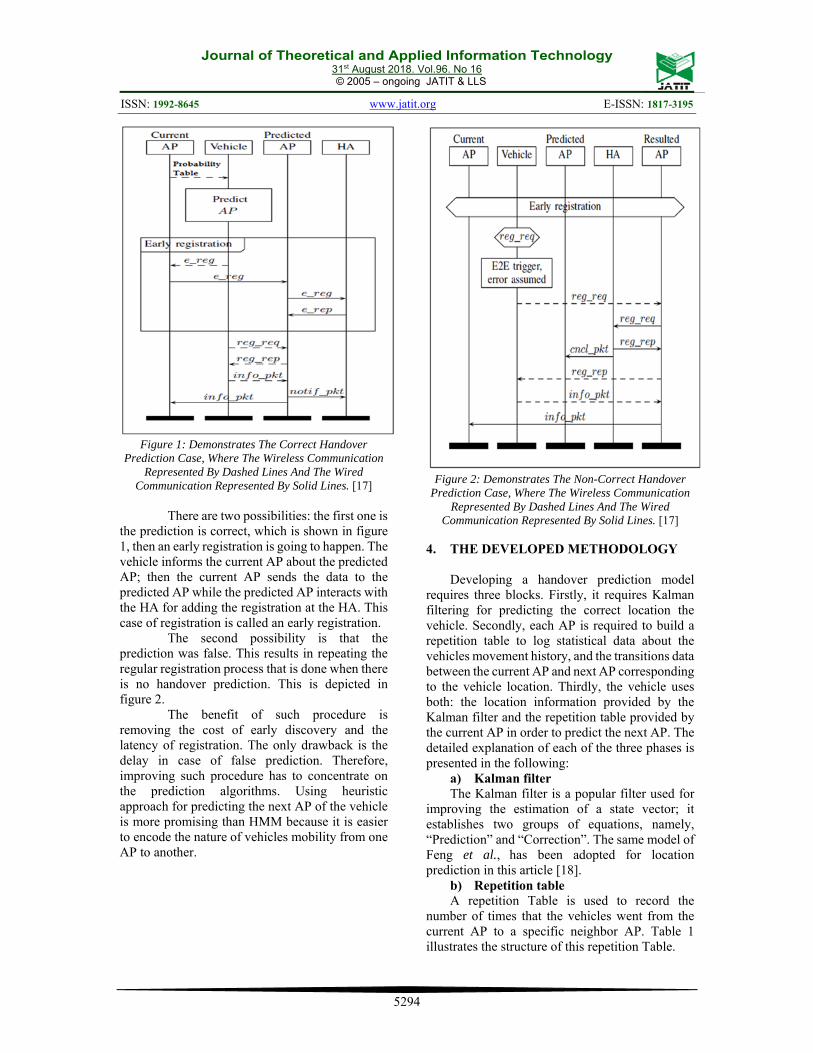
Figure 1: Demonstrates The Correct Handover
Prediction Case, Where The Wireless Communication Represented By Dashed Lines And The Wired
Communication Represented By Solid Lines. [17] There are two possibilities: the first one is
the prediction is correct, which is shown in figure 1, then an early registration is going to happen. The vehicle informs the current AP about the predicted AP; then the current AP sends the data to the predicted AP while the predicted AP interacts with the HA for adding the registration at the HA. This case of registration is called an early registration.
The second possibility is that the prediction was false. This results in repeating the regular registration process that is done when there is no handover prediction. This is depicted in figure 2.
The benefit of such procedure is removing the cost of early discovery and the latency of registration. The only drawback is the delay in case of false prediction. Therefore, improving such procedure has to concentrate on the prediction algorithms. Using heuristic approach for predicting the next AP of the vehicle is more promising than HMM because it is easier to encode the nature of vehicles mobility from one AP to another.
Figure 2: Demonstrates The Non-Correct Handover
Prediction Case, Where The Wireless Communication Represented By Dashed Lines And The Wired
Communication Represented By Solid Lines. [17]
4. THE DEVELOPED METHODOLOGY Developing a handover prediction model
requires three blocks. Firstly, it requires Kalman filtering for predicting the correct location the vehicle. Secondly, each AP is required to build a repetition table to log statistical data about the vehicles movement history, and the transitions data between the current AP and next AP corresponding to the vehicle location. Thirdly, the vehicle uses both: the location information provided by the Kalman filter and the repetition table provided by the current AP in order to predict the next AP. The detailed explanation of each of the three phases is presented in the following:
a) Kalman filter The Kalman filter is a popular filter used for
improving the estimation of a state vector; it establishes two groups of equations, namely, “Prediction” and “Correction”. The same model of Feng et al., has been adopted for location prediction in this article [18].
b) Repetition table A repetition Table is used to record the
number of times that the vehicles went from the current AP to a specific neighbor AP. Table 1 illustrates the structure of this repetition Table.
Journal of Theoretical and Applied Information Technology 31st August 2018. Vol.96. No 16
© 2005 – ongoing JATIT & LLS
ISSN: 1992-8645 www.jatit.org E-ISSN: 1817-3195
5295
Table 1: An Example Of The Layout Of The Repetition Table At A Current AP.
AP1 AP2 AP3 AP4 AP5
Current AP 5 6 10 1 3
The repetition table in Table 1 tells that five
vehicles went from current AP to AP1, and six vehicles went from current AP to AP2, and so on.
When the vehicle has to predict the new AP, the current AP gives the vehicle this repetition table to compute the probability for each neighbor AP and put them in a probability table. Table 2 illustrates the probability table that is calculated at the AP.
Table 2: An Example Of The Probability Table That Is Calculated At One AP Based On The Repetition Table
AP1 AP2 AP3 AP4 AP5
Current AP 0.2 0.24 0.4 0.04 0.12
Alexander Magnano et al., proposed
repetition table to predict correct next destination for a mobile node to improve network performance by reducing handover latency [5]. In this research article, we aim at providing a more accurate prediction for the mobile node and next destination. Our approach is splitting the coverage zone of an access point to K sectors, and the access point will be able to determine next destination based on vehicle's location. The approach considers the probability for a vehicle to move to the i_th neighbor AP among N neighbor APs given that it was in the sector j_th from the current AP. This approach also will help to deal with bidirectional roads and intersections, and it primarily contributes to minimizing the wrong prediction.
Figure 3 Two Sector Case With Two Directional Road
From Figure 3 the coming vehicles in the
direction from left to right and located in sector one will predict AP2 to be their next AP as soon as they begin to lose connection to the current AP, and the coming vehicles in the other direction and located in sector two will predict AP1 as their next AP. The
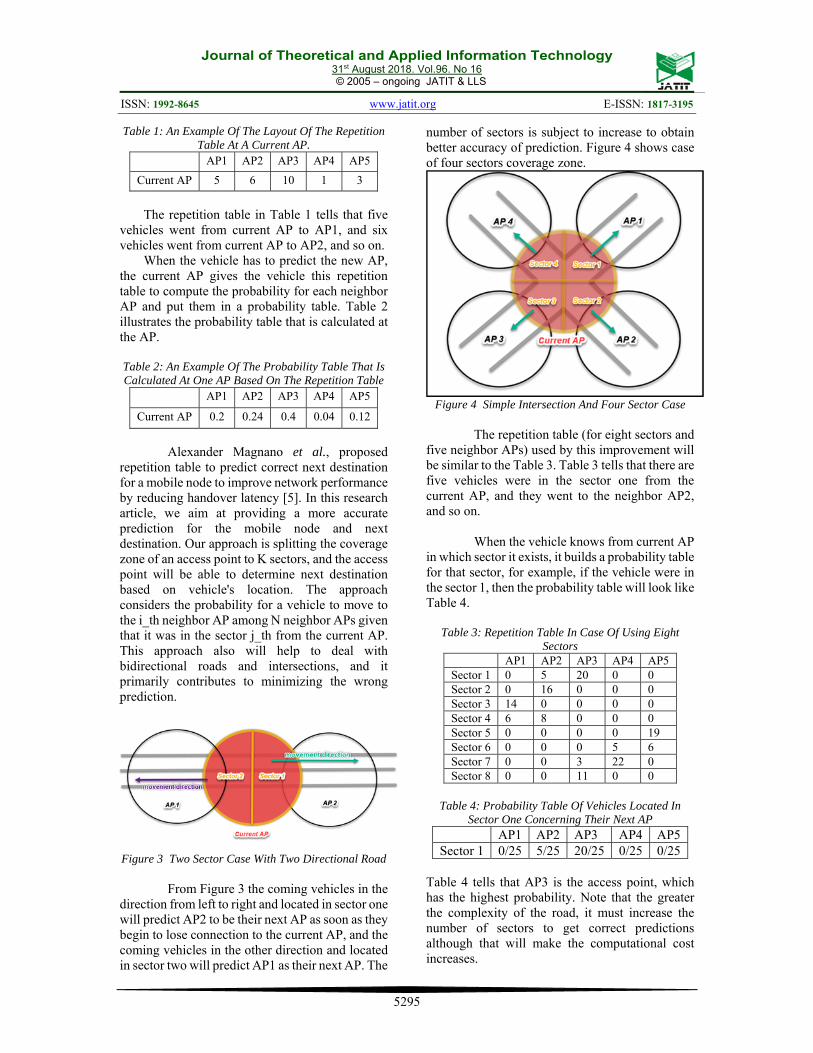
number of sectors is subject to increase to obtain better accuracy of prediction. Figure 4 shows case of four sectors coverage zone.
Figure 4 Simple Intersection And Four Sector Case
The repetition table (for eight sectors and
five neighbor APs) used by this improvement will be similar to the Table 3. Table 3 tells that there are five vehicles were in the sector one from the current AP, and they went to the neighbor AP2, and so on.
When the vehicle knows from current AP
in which sector it exists, it builds a probability table for that sector, for example, if the vehicle were in the sector 1, then the probability table will look like Table 4.
Table 3: Repetition Table In Case Of Using Eight Sectors
AP1 AP2 AP3 AP4 AP5 Sector 1 0 5 20 0 0 Sector 2 0 16 0 0 0 Sector 3 14 0 0 0 0 Sector 4 6 8 0 0 0 Sector 5 0 0 0 0 19 Sector 6 0 0 0 5 6 Sector 7 0 0 3 22 0 Sector 8 0 0 11 0 0
Table 4: Probability Table Of Vehicles Located In
Sector One Concerning Their Next AP AP1 AP2 AP3 AP4 AP5 Sector 1 0/25 5/25 20/25 0/25 0/25
Table 4 tells that AP3 is the access point, which has the highest probability. Note that the greater the complexity of the road, it must increase the number of sectors to get correct predictions although that will make the computational cost increases.
Journal of Theoretical and Applied Information Technology 31st August 2018. Vol.96. No 16
© 2005 – ongoing JATIT & LLS
ISSN: 1992-8645 www.jatit.org E-ISSN: 1817-3195
5296
c) Prediction process When the vehicle is about to leave the current
AP, it requests from the AP the probability table. The probability table is combined with one entry for each sector in the coverage zone. Each entry in the table is a vector of length equal to the number of APs. Each element of the vector is the probability that the vehicle will have the corresponding AP as its next AP. The sectors are placed starting from the eastern direction with an
angle of
. The vehicle uses its
location information provided by the prediction model to locate itself in the specific entry (according to the sector number). Next, the vehicle predicts the next AP according to be the one with the maximum probability.
5. SIMULATION AND RESULT
In the simulation, as it is shown in Table
5 the environment is 1200 meters by 1200 meters, the velocity of vehicles is 30 m/s, the experiment duration is 500 seconds, the number of access points is 9, and they are deployed in a regular form, the number of home agents is 8. The number of vehicles is 80 nodes. However, the number of nodes can be changed from 40 until 90 with ten increments. The coverage area for each access points is divided into four sectors. However, the number of sectors is variable, and it can be changed from 2 to 8 sectors. Table 5: Simulation Parameters For Testing Predictive
Handover Parameter name Parameter value
Area 1200 X1200 meters2
velocity 30 m/s
Experiment duration 500 seconds
The number of access points
9
The number of home agents
8
The number of vehicles
80 or Variable (40 until 90 with ten increments)
Data buffer size 500 packets
Number of sectors 4 or Variable (2 to 8 incremented by 2)
Packet size 1 byte
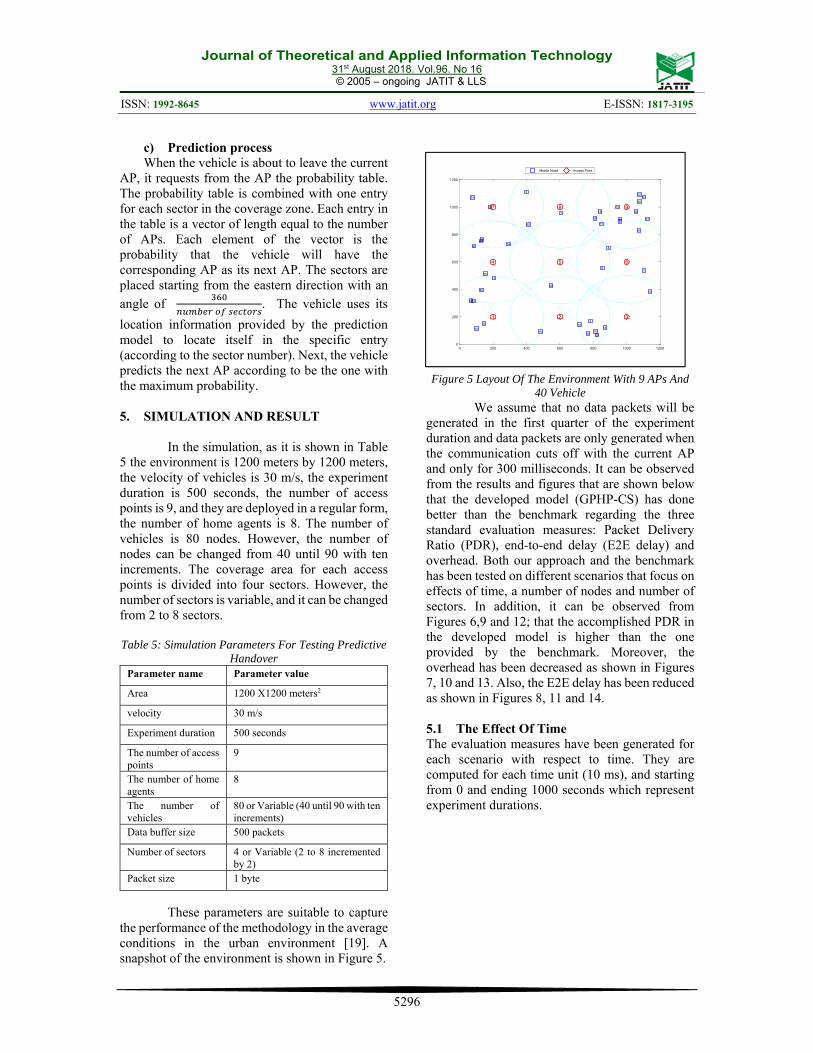
These parameters are suitable to capture
the performance of the methodology in the average conditions in the urban environment [19]. A snapshot of the environment is shown in Figure 5.
Figure 5 Layout Of The Environment With 9 APs And 40 Vehicle
We assume that no data packets will be generated in the first quarter of the experiment duration and data packets are only generated when the communication cuts off with the current AP and only for 300 milliseconds. It can be observed from the results and figures that are shown below that the developed model (GPHP-CS) has done better than the benchmark regarding the three standard evaluation measures: Packet Delivery Ratio (PDR), end-to-end delay (E2E delay) and overhead. Both our approach and the benchmark has been tested on different scenarios that focus on effects of time, a number of nodes and number of sectors. In addition, it can be observed from Figures 6,9 and 12; that the accomplished PDR in the developed model is higher than the one provided by the benchmark. Moreover, the overhead has been decreased as shown in Figures 7, 10 and 13. Also, the E2E delay has been reduced as shown in Figures 8, 11 and 14. 5.1 The Effect Of Time The evaluation measures have been generated for each scenario with respect to time. They are computed for each time unit (10 ms), and starting from 0 and ending 1000 seconds which represent experiment durations.
0 200 400 600 800 1000 12000
200
400
600
800
1000
1200
1
2
3
4
5
6
7
8
9
10
11
12
13
1415
16
17
18
19
20
2122
23
24
25
26
27
28
29
30
31
32
33
34
35
36
37
38
39
40
1 2 3
4 5 6
7 8 9
Mobile Node Access Point

Journal of Theoretical and Applied Information Technology 31st August 2018. Vol.96. No 16
© 2005 – ongoing JATIT & LLS
ISSN: 1992-8645 www.jatit.org E-ISSN: 1817-3195
5297
5.1.1 The effect of time on PDR
Figure 6: GPHP-CS Vs. Benchmark In Terms Of PDR
With Respect To Time Figure 6 shows PDR for both benchmark and GPHP-CS. Apparently, PDR has outperformed GPHP-CS where the average PDR for GPHP-CS is 83.38% and the average PDR for is 68.17%.
5.1.2 The effect of time on overhead
Figure 7 GPHP-CS vs. benchmark in terms of
overhead with respect to time Also, to that the overhead as it is shown in Figure 7. It can be observed GPHP-CS has achieved less overhead compared to the benchmark where the average overhead for GPHP-CS is 4.77, and the average overhead for the benchmarks is 6.99. 5.1.3 The effect of time on E2E delay
Figure 8 GPHP-CS vs. benchmark in terms of E2E
delay with respect to time E2E delay Figure 8 as shown above GPHP-CS has better and stable performance compared to the benchmark. In comparison, the average E2E delay for GPHP-CS is 0.03 seconds, and the average E2E delay for the benchmark is 0.17 seconds which is less delay for our approach. 5.1.4 Discussion on the effects of time In all experiments in term of the effects of time, GPHP-CS approach has shown better results than the benchmark. Table 6 lists the summaries of the experiment of the effects of the time. Table 6: The summary of the comparison and improvement of the effects of the time
Baseline GPHP-CS Improvement
PDR 68.17 83.38 22.31%
Overhead 6.99 4.77 31.76%
E2E delay 0.17 0.03 82.35%
It can be recognized that the average PDR for GPHP-CS has shown better results than the benchmark. Also, Overhead for GPHP-CS has decreased compared to the baseline. The noticeable improvement is an E2E delay for GPHP-CS has reached 82.35% less than the benchmark. Table 6 indicates the overview of the comparison result of GPHP-CS and the baseline of the effects of the time:
First, the improvement in the PDR is nearly 22.31%
Overhead archives around 31.76% E2E delay outperformance up to 82.35%
The improvement in the results of the measures is interpreted by the fact that GPHP-CS is better at predicting the new AP of a certain vehicle, which results in less time of data exchange or less delay because of avoidance of repeating the registration process. The reason GPHP-CS has better prediction is due to dividing the coverage
200 300 400 500 600 700 800 900 1000
Time [sec]
0
10
20
30
40
50
60
70
80
90
PD
R
Average PDR is: Benchmark = 68.1718 PGPH = 83.3886
BenchmarkPGPH
200 300 400 500 600 700 800 900 1000
Time [sec]
0
10
20
30
40
50
60
70
Ove
rhea
d
Average Overhead is: Benchmark = 6.9985 PGPH = 4.7729
BenchmarkPGPH
200 300 400 500 600 700 800 900 1000
Time [sec]
0.02
0.04
0.06
0.08
0.1
0.12
0.14
0.16
0.18
0.2
0.22
E2E
del
ay
[sec
]
Average E2E Delay is: Benchmark = 0.17224 PGPH = 0.037562
BenchmarkPGPH
Journal of Theoretical and Applied Information Technology 31st August 2018. Vol.96. No 16
© 2005 – ongoing JATIT & LLS
ISSN: 1992-8645 www.jatit.org E-ISSN: 1817-3195
5298
into sectors. Each sector has its own probability based on analyzing vehicles movement and location in the same sector. In comparison, AP in benchmark construct its probability table for the whole coverage of AP as location in benchmark is not included in making decision for predicting next AP. Moreover, benchmark doesn’t utilize localization fully for vehicles, as the developed approach, location is essential for making decision for predicting next AP. In addition, the success of prediction means less packet loss which implies a higher value of PDR. Moreover, avoidance of repeating registration process implies less control packet exchange which results in less overhead. 5.2 The Effect Of Number Of Nodes
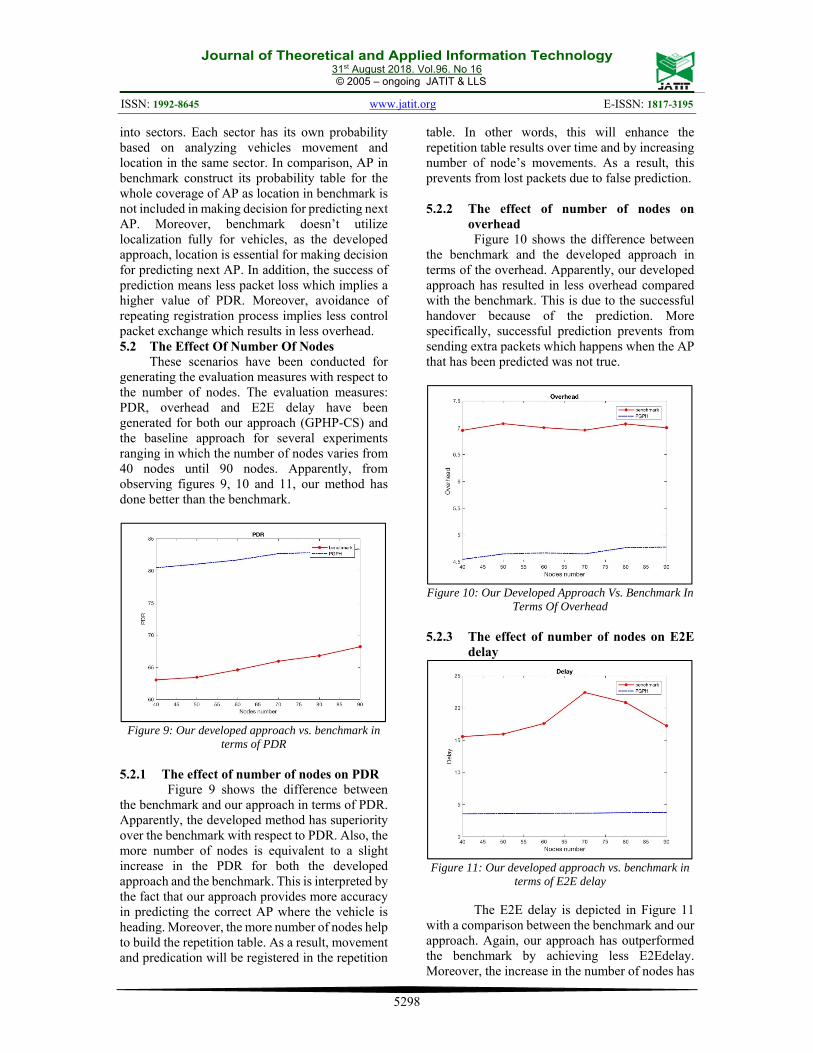
These scenarios have been conducted for generating the evaluation measures with respect to the number of nodes. The evaluation measures: PDR, overhead and E2E delay have been generated for both our approach (GPHP-CS) and the baseline approach for several experiments ranging in which the number of nodes varies from 40 nodes until 90 nodes. Apparently, from observing figures 9, 10 and 11, our method has done better than the benchmark.
Figure 9: Our developed approach vs. benchmark in
terms of PDR 5.2.1 The effect of number of nodes on PDR Figure 9 shows the difference between the benchmark and our approach in terms of PDR. Apparently, the developed method has superiority over the benchmark with respect to PDR. Also, the more number of nodes is equivalent to a slight increase in the PDR for both the developed approach and the benchmark. This is interpreted by the fact that our approach provides more accuracy in predicting the correct AP where the vehicle is heading. Moreover, the more number of nodes help to build the repetition table. As a result, movement and predication will be registered in the repetition
table. In other words, this will enhance the repetition table results over time and by increasing number of node’s movements. As a result, this prevents from lost packets due to false prediction. 5.2.2 The effect of number of nodes on
overhead Figure 10 shows the difference between the benchmark and the developed approach in terms of the overhead. Apparently, our developed approach has resulted in less overhead compared with the benchmark. This is due to the successful handover because of the prediction. More specifically, successful prediction prevents from sending extra packets which happens when the AP that has been predicted was not true.
Figure 10: Our Developed Approach Vs. Benchmark In
Terms Of Overhead 5.2.3 The effect of number of nodes on E2E
delay
Figure 11: Our developed approach vs. benchmark in
terms of E2E delay
The E2E delay is depicted in Figure 11 with a comparison between the benchmark and our approach. Again, our approach has outperformed the benchmark by achieving less E2Edelay. Moreover, the increase in the number of nodes has
Journal of Theoretical and Applied Information Technology 31st August 2018. Vol.96. No 16
© 2005 – ongoing JATIT & LLS
ISSN: 1992-8645 www.jatit.org E-ISSN: 1817-3195
5299
not resulted in significant increase in the delay. This is interpreted by the fact the probability table is calculated at each node on its own, not in a centric node. Another observation is that there is no noticeable trend in the data, this is because there is no routing involved and the AP is able to serve all the nodes in its coverage zone. 5.2.4 Discussion on the effects of number of
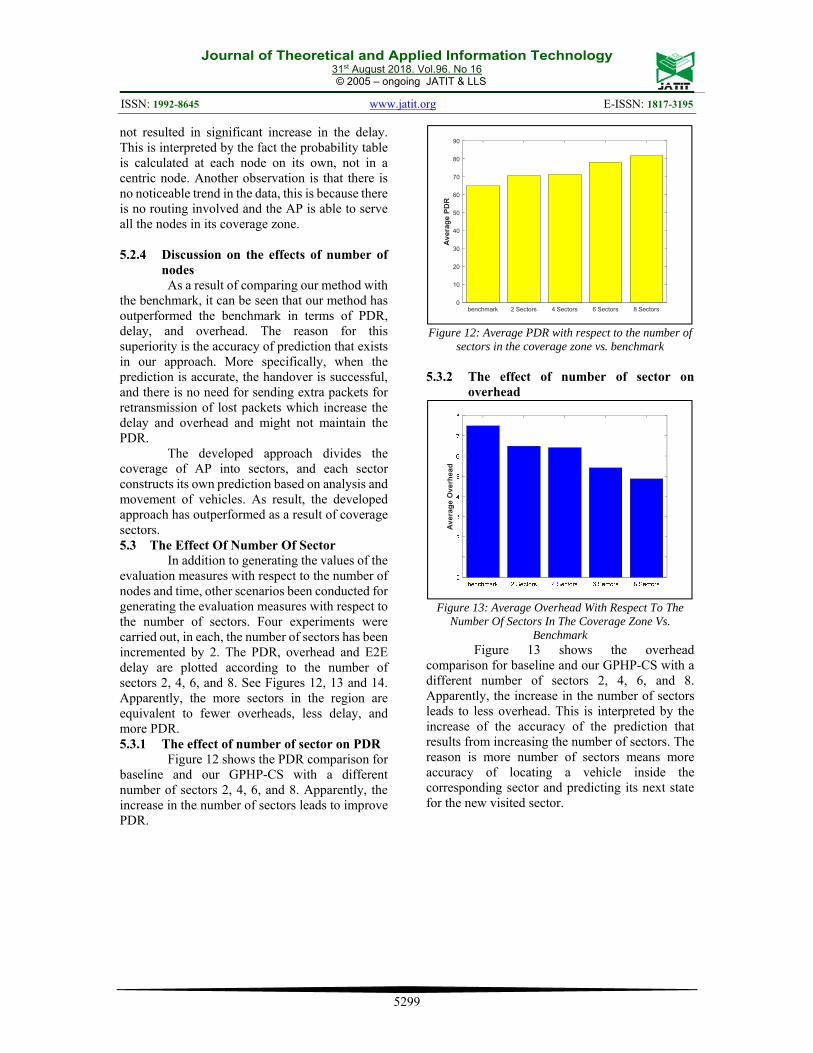
nodes As a result of comparing our method with the benchmark, it can be seen that our method has outperformed the benchmark in terms of PDR, delay, and overhead. The reason for this superiority is the accuracy of prediction that exists in our approach. More specifically, when the prediction is accurate, the handover is successful, and there is no need for sending extra packets for retransmission of lost packets which increase the delay and overhead and might not maintain the PDR. The developed approach divides the coverage of AP into sectors, and each sector constructs its own prediction based on analysis and movement of vehicles. As result, the developed approach has outperformed as a result of coverage sectors. 5.3 The Effect Of Number Of Sector In addition to generating the values of the evaluation measures with respect to the number of nodes and time, other scenarios been conducted for generating the evaluation measures with respect to the number of sectors. Four experiments were carried out, in each, the number of sectors has been incremented by 2. The PDR, overhead and E2E delay are plotted according to the number of sectors 2, 4, 6, and 8. See Figures 12, 13 and 14. Apparently, the more sectors in the region are equivalent to fewer overheads, less delay, and more PDR. 5.3.1 The effect of number of sector on PDR Figure 12 shows the PDR comparison for baseline and our GPHP-CS with a different number of sectors 2, 4, 6, and 8. Apparently, the increase in the number of sectors leads to improve PDR.
Figure 12: Average PDR with respect to the number of
sectors in the coverage zone vs. benchmark 5.3.2 The effect of number of sector on
overhead
Figure 13: Average Overhead With Respect To The
Number Of Sectors In The Coverage Zone Vs. Benchmark
Figure 13 shows the overhead comparison for baseline and our GPHP-CS with a different number of sectors 2, 4, 6, and 8. Apparently, the increase in the number of sectors leads to less overhead. This is interpreted by the increase of the accuracy of the prediction that results from increasing the number of sectors. The reason is more number of sectors means more accuracy of locating a vehicle inside the corresponding sector and predicting its next state for the new visited sector.
benchmark 2 Sectors 4 Sectors 6 Sectors 8 Sectors0
10
20
30
40
50
60
70
80
90
Av
erag
e P
DR
Av
erag
e O
ver
hea
d
Journal of Theoretical and Applied Information Technology 31st August 2018. Vol.96. No 16
© 2005 – ongoing JATIT & LLS
ISSN: 1992-8645 www.jatit.org E-ISSN: 1817-3195
5300
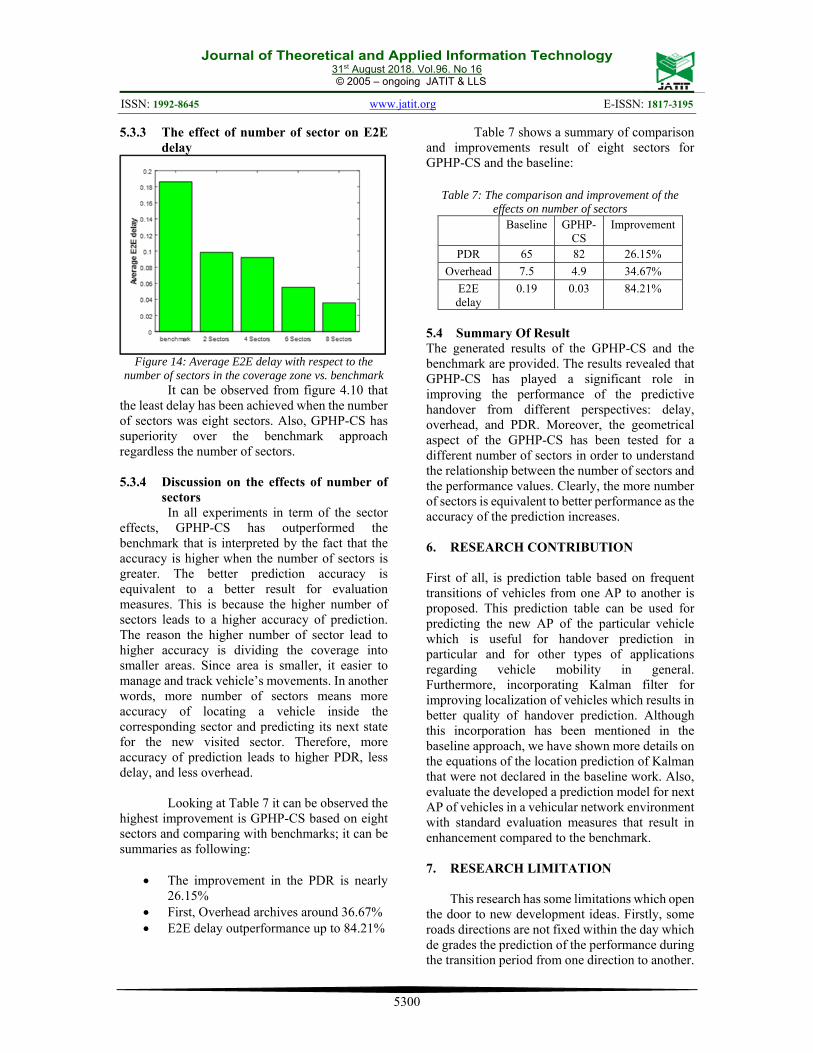
5.3.3 The effect of number of sector on E2E delay
Figure 14: Average E2E delay with respect to the
number of sectors in the coverage zone vs. benchmark It can be observed from figure 4.10 that the least delay has been achieved when the number of sectors was eight sectors. Also, GPHP-CS has superiority over the benchmark approach regardless the number of sectors. 5.3.4 Discussion on the effects of number of
sectors In all experiments in term of the sector effects, GPHP-CS has outperformed the benchmark that is interpreted by the fact that the accuracy is higher when the number of sectors is greater. The better prediction accuracy is equivalent to a better result for evaluation measures. This is because the higher number of sectors leads to a higher accuracy of prediction. The reason the higher number of sector lead to higher accuracy is dividing the coverage into smaller areas. Since area is smaller, it easier to manage and track vehicle’s movements. In another words, more number of sectors means more accuracy of locating a vehicle inside the corresponding sector and predicting its next state for the new visited sector. Therefore, more accuracy of prediction leads to higher PDR, less delay, and less overhead.
Looking at Table 7 it can be observed the highest improvement is GPHP-CS based on eight sectors and comparing with benchmarks; it can be summaries as following:
The improvement in the PDR is nearly 26.15%
First, Overhead archives around 36.67% E2E delay outperformance up to 84.21%
Table 7 shows a summary of comparison and improvements result of eight sectors for GPHP-CS and the baseline:
Table 7: The comparison and improvement of the effects on number of sectors
Baseline GPHP-CS
Improvement
PDR 65 82 26.15%
Overhead 7.5 4.9 34.67%
E2E delay
0.19 0.03 84.21%
5.4 Summary Of Result The generated results of the GPHP-CS and the benchmark are provided. The results revealed that GPHP-CS has played a significant role in improving the performance of the predictive handover from different perspectives: delay, overhead, and PDR. Moreover, the geometrical aspect of the GPHP-CS has been tested for a different number of sectors in order to understand the relationship between the number of sectors and the performance values. Clearly, the more number of sectors is equivalent to better performance as the accuracy of the prediction increases. 6. RESEARCH CONTRIBUTION First of all, is prediction table based on frequent transitions of vehicles from one AP to another is proposed. This prediction table can be used for predicting the new AP of the particular vehicle which is useful for handover prediction in particular and for other types of applications regarding vehicle mobility in general. Furthermore, incorporating Kalman filter for improving localization of vehicles which results in better quality of handover prediction. Although this incorporation has been mentioned in the baseline approach, we have shown more details on the equations of the location prediction of Kalman that were not declared in the baseline work. Also, evaluate the developed a prediction model for next AP of vehicles in a vehicular network environment with standard evaluation measures that result in enhancement compared to the benchmark. 7. RESEARCH LIMITATION
This research has some limitations which open the door to new development ideas. Firstly, some roads directions are not fixed within the day which de grades the prediction of the performance during the transition period from one direction to another.

Journal of Theoretical and Applied Information Technology 31st August 2018. Vol.96. No 16
© 2005 – ongoing JATIT & LLS
ISSN: 1992-8645 www.jatit.org E-ISSN: 1817-3195
5301
Secondly, the current handover approach does not rely on the surrounding vehicles in the prediction of the subject vehicle. Incorporating information from the surrounding vehicle lead to better performance. Thirdly, this work has not considered the different road infrastructure and its impact on the performance. Creating more scenarios will result in better handover system from the perspective of applications.
8. CONCLUSION AND FUTURE WORK
In this article, a new methodology for improving handover delay and PDR has been developed. The methodology is based on building two main blocks: location prediction model for assisting vehicles in locating themselves in the environment and probability table for assisting vehicles in predicting next AP based on the current sector in the current AP. The simulation has been implemented in MATLAB and shown that our approach has outperformed the previous work that is used as the benchmark in terms of delay, overhead, and PDR. Future work is to evaluate the system on real scenarios to assure the validity from the perspective of applications. Also, PDR. Future work is to evaluate the system on real scenarios to assure the validity from the perspective of applications. Also, considering both highway environment and urban (city) environment within the prediction approach. REFERENCES: [1] E. Ndashimye, S. K. Ray, N. I. Sarkar, and J.
A. Gutiérrez, “Vehicle-to-infrastructure communication over multi-tier heterogeneous networks: A survey,” Comput. Networks, vol. 112, pp. 144–166, Jan. 2017.
[2] M. Barua, M. S. Alam, X. Liang, and X. Shen, “Secure and quality of service assurance scheduling scheme for WBAN with application to eHealth,” 2011 IEEE Wirel. Commun. Netw. Conf. WCNC 2011, pp. 1102–1106, 2011.
[3] J. Toutouh, J. García-Nieto, and E. Alba, “Intelligent OLSR routing protocol optimization for VANETs,” IEEE Trans. Veh. Technol., vol. 61, no. 4, pp. 1884–1894, 2012.
[4] H. Feng, C. Liu, Y. Shu, and O. W. W. Yang, “Location Prediction of Vehicles in VANETs Using A Kalman Filter,” Wirel.
Pers. Commun., vol. 80, no. 2, pp. 543–559, Jan. 2015.
[5] A. Magnano, X. Fei, and A. Boukerche, “Predictive mobile IP handover for vehicular networks,” in 2015 IEEE 40th Conference on Local Computer Networks (LCN), 2015, pp. 338–346.
[6] J. Toutouh and E. Alba, “Performance analysis of optimized VANET protocols in real world tests,” in 2011 7th International Wireless Communications and Mobile Computing Conference, 2011, pp. 1244–1249.
[7] S. Ferretti, V. Ghini, and F. Panzieri, “A survey on handover management in mobility architectures,” Comput. Networks, vol. 94, pp. 390–413, Jan. 2016.
[8] H. Soliman, C. Castelluccia, K. ElMalki, and L. Bellier, “Hierarchical Mobile IPv6 (HMIPv6) Mobility Management,” Oct. 2008.
[9] A. Croitoru, D. Niculescu, C. Raiciu, I. Nsdi, A. Croitoru, and C. Raiciu, “Towards Wifi Mobility without Fast Handover This paper is included in the Proceedings of the Towards WiFi Mobility without Fast Handover,” pp. 218–234, 2015.
[10] A. E. Bergh and N. Ventura, “Prediction Assisted Fast Handovers for Mobile IPv6,” 2006.
[11] W. Wanalertlak, B. Lee, C. Yu, M. Kim, S. M. Park, and W. T. Kim, “Behavior-based mobility prediction for seamless handoffs in mobile wireless networks,” Wirel. Networks, vol. 17, no. 3, pp. 645–658, 2011.
[12] V. Sandonis, M. Calderon, I. Soto, and C. J. Bernardos, “Design and performance evaluation of a PMIPv6 solution for geonetworking-based VANETs,” Ad Hoc Networks, vol. 11, no. 7, pp. 2069–2082, 2013.
[13] M. Asefi, S. Cespedes, X. Shen, and J. W. Mark, “A Seamless Quality-Driven Multi-Hop Data Delivery Scheme for Video Streaming in Urban VANET Scenarios,” in 2011 IEEE International Conference on Communications (ICC), 2011, pp. 1–5.
[14] Tin-Yu Wu, Wei-Tsong Lee, Fong-Hao Liu, Hung- Lin Chan, and Tsung-Han Lin, “An efficient pre-scanning scheme for handoff in Cooperative Vehicular Networks,” in 2011 IEEE 22nd International Symposium on Personal, Indoor and Mobile Radio Communications, 2011, pp. 583–587.

Journal of Theoretical and Applied Information Technology 31st August 2018. Vol.96. No 16
© 2005 – ongoing JATIT & LLS
ISSN: 1992-8645 www.jatit.org E-ISSN: 1817-3195
5302
[15] A. Prakash, S. Tripathi, R. Verma, N. Tyagi, R. Tripathi, and K. Naik, “Vehicle assisted cross-layer handover scheme in NEMO-based VANETs (VANEMO),” Int. J. Internet Protoc. Technol., vol. 6, no. 1/2, p. 83, 2011.
[16] S. Pyo and Y. Choi, “A Fast Handover Scheme Using Exponential Smoothing Method,” J. Comput. Sci., vol. 9, no. 2, pp. 61–64, 2009.
[17] A. Magnano, X. Fei, A. Boukerche, and A. Loureiro, “Predictive Handover for Mobile IP in Vehicular Networks,” IEEE Trans. Veh. Technol., vol. PP, no. 99, p. 1, 2015.
[18] H. Feng, C. Liu, Y. Shu, and O. W. W. Yang, “Location Prediction of Vehicles in VANETs Using A Kalman Filter,” Wirel. Pers. Commun., vol. 80, no. 2, pp. 543–559, 2014.
[19] C. Haerri, J. and Filali, F. and Bonnet, “Performance comparison of AODV and OLSR in VANETs urban environments under realistic mobility patterns,” Proc. 5th IFIP Mediterr. Ad-Hoc Netw. Work., no. i, pp. 14–17, 2006.