Embed Size (px)
Citation preview

International Journal for Research in Engineering Application & Management (IJREAM)
ISSN : 2454-9150 Vol-06, Issue-08, NOV 2020
112 | IJREAMV06I0868028 DOI : 10.35291/2454-9150.2020.0686 © 2020, IJREAM All Rights Reserved.
Cross-Cultural Variations Affects on Employees
Competitiveness, Motivation, Attitude and Work
Environment Shipra* and Prof. (Dr.) Gurcharan Singh Ghotra**
*Ph.D Research Scholar, **Professor Department of Economics and Management, RIMT
University, Mandi Gobindgarh, Punjab, India.
Abstract - Motivation and work culture plays a very important role in determining the productivity and production of
any organization domestic or multinational corporation. Work culture therefore have the potential/capabilities to
increase or elevate the performance of the managers of organization. The purpose of the present research paper was to
examine the role of motivation, work culture and work environment prevailing in an industry/organization with
employees coming from diverse cultural background – both internal and external cross-cultural variations. The
purpose was also to investigate how far motivation or demotivation of employees working in a cross-cultural
environment (both internal and external) had positively or adversely affected the productivity, efficiency and
competitiveness and work environment, attitude, work culture of an organization/industry under the study. The
equally important objective of the study was to establish or determine whether the external cross-cultural variations
had a positive or a negative affective on the motivation, work environment, attitude, coordination, communication and
leadership of the technical employees working within the organization. The study also attempted to investigate whether
internal and external cross-cultural variations led to work conflicts, work tension, stress, among employees and how the
work production and productivity was affected as a result of prevailing of such situations in organization/industry. The
three main objectives which were studied under the present paper included: (i) To study the positive and negative
affects (if any) caused by the Cross-Cultural Variations, on the employees Motivation. (ii) To determine/ evaluate, how
the work environment, work culture, Motivation, (Values and Attitude) has changed in the organization, due to the
Cross-Cultural Variations. (iii) To Measure, the Competitiveness which has been noticed in the organization /industry
due to Cross-Cultural Variations. Beside of the above two hypotheses were also set and tested i.e (Null and Alternative
hypotheses). Various statistical tools used to test the hypotheses were mean, standard deviation, t-test, correlation, One
Way ANOVA, Regression Analysis and Factor Analysis. The findings of the study pointed out that when employees
were satisfied, and retreated with full dignity and their work performance and felt that their superiors or people
coming from foreign countries provided them with support and motivation or inspiration their contextual performance
increased to a great level there were no work conflicts prevailing in the organization with the internal technical and
non-technical and external technical employees coming from foreign countries an working in the organization.
Keywords: Motivation, work environment, attitude, work conflicts, production and productivity, leadership.
I. INTRODUCTION
The present paper attempts to examine affects of cross-
cultural variations on employees competitiveness,
motivation, attitude and work environment in the
organization under the study. Several studies had been
conducted on the motivation of employees, competitiveness
and work environment before the undertaking this study.
Studies on motivation carried out included Panying and
Binglu Zhao (2017), Farideh Salili (1996), Yamauchi
Hirotsugu, Dov, Elizur et al, (1996), Fey F. Carl (2005),
Ayan Zeynep et al, (2014) concluded that employees
motivation in cross-cultural variations situations prevailing
in organization increased rather than decreasing. Employees
felt highly motivated and competitive in working in a cross-
cultural environment. In the similar way studies carried out
on competitiveness, employees attitude, work environment
and work conflicts also provided diverse observations about
prevailing conflict as a result of existing/prevailing cross-

International Journal for Research in Engineering Application & Management (IJREAM)
ISSN : 2454-9150 Vol-06, Issue-08, NOV 2020
113 | IJREAMV06I0868028 DOI : 10.35291/2454-9150.2020.0686 © 2020, IJREAM All Rights Reserved.
cultural variations in an organization. The studies included
Al Jenaibi (2011) Greblikaite & Devgeline (2010), Visagie,
J.C. and Linde, H.M. (2011), Ya Fang Trar (2011), Amah
Edwinah (2012), Kawar T.I. (2012), Elasaid Abdel (2012)
all such studies were carried out by using primary and
secondary data. The studies used various statistical methods
to measure to competitiveness, motivation, work culture,
work environment, attitude and conflicts among the
employees. The present study by taking into consideration
therefore made and attempt to study employees
competitiveness, motivation, attitude and work environment
in an organization by taking into consideration the
prevalence of cross-cultural variations.
1.1 Culture and work culture:
Culture had and impact positive or adverse on the
performance of employees, work conflicts, motivation,
work culture and work environment an pointed out by
various studies carried out by various scholars on the
subject. Culture and work culture played dominant role in
measuring the employees competitiveness, motivation,
work culture and work environment for example scholar
such as (Hofstede, 1980), Ouchi 1981 Hofstede and Bond
1988, Kotter and Heskette, 1992, Magee, 2002) claimed
that the organizational culture helped to provide
opportunity and broad structure for the development of
human resources, Technical and behavioral skills in an
organization which covered work and work conflicts
attitude, motivation, work environment.
1.2 Objectives The present research paper as mentioned
above attempts to cover the following three main
objectives (i) to Measure, the competitiveness which has
been noticed in the organization/industry due to cross-
cultural variations (ii) to study the positive and negative
affects (if any) caused by the cross-cultural variations, on
the employees motivation (iii) to determine/evaluate, how
the work environment, work culture, motivation, (values
and attitude) has changed in the organization, due to the
cross-cultural variations.
1.3 Hypotheses
The present research paper studied the above objectives and
by setting the two hypotheses to test the various variables
(competitiveness, motivation, attitude work conflicts and
work culture) whether they had any significant affect on
employees competitiveness, motivation, work culture,
attitude, work environment and conflicts etc.
II. LITERATURE REVIEW
Faradeh Salili (1996) The research study explored the
relationship between age, sex and cultural differences in
achieving motivation. The total sample covered under the
study was 764 male and female British high school and
Chinese students age 13-55. The study applied or used the
thematic apperception test (TAT) to measure the need for
achievement of (nach). Results of the study revealed that
Chinese high school students had significantly higher
(nach) scores that their British counterparts. It was also
observed by the study that they also had a significantly
higher scores them their two older groups of Chinese
students. The further revealization of the study pointed out
that the female subjects of both culture had higher score
than males, although this difference was significant for
British female subjects only. The results of the study were
discussed in terms of socio cultural and situational factors.
Yamanchi Hirotsugu, Dov, Elizun et al (1996) In its
research study pointed out that an international research
projects on achievement of motivation was originated based
on a multifaceted approach. The main objective of the study
was to examine the structure of the achievement motive
domain for samples from five countries such as the United
States, the Netherlands, Israel, Hungry and Japan. They
study hypothesized that data collected from the various
samples reflected the basic features suggested by the
definitional frame work of achieving motivation. Results
from 1868 respondents supported the hypothesis tested by
the study that the individualistic and collectivistic cultural
orientations will have an effect on motive strength as well
as motivation. The three basic features of the definition of
achievement motive such as (i) behavior modality (ii) type
of confrontation and (iii) time perspective relative to task
performance were reflected as major determinants of the
data. Achievement tendencies in case of motivation were
found to be higher for USA respondents and lowest for the
Japanese and the Hungarian respondents. The study
suggested the theoretical implications for conducting
further research on the subject mentioned by using
quantitative analysis.
Fay F. Carl (2005) the study made an attempt to examine
the factors (or the similar factors) which motivated the
middle class managers in Sweden and Russia. The study
was based on the sample of 82 Swedish managers and 86
Russian managers. The hypotheses were set using the
main/key understanding of natural cultural differences and
several popular theories of motivation the need theory,
equality theory, goal setting theory, and the feedback
theory. The empirical analysis of the study and the results
obtained showed that natural culture plays an important role
in determining what motivates people. Russian and
Swedish manages were arguably motivated by different
factors such as perks, need hierarchy and the work
environment. The results provided strong support for needs
hierarchy theory. Swedish managers were highly motivated
by perceived equality with their peers.
Inder Science (2010) carried out on indepth analysis of the
nature of organization ethos prevalent in different sectors of
India economy by taking the profile of octapace. Data was
collected from the employees of 16 different organisatioins,
belonging to the consulting, manufacturing services and
International Journal for Research in Engineering Application & Management (IJREAM)
ISSN : 2454-9150 Vol-06, Issue-08, NOV 2020
114 | IJREAMV06I0868028 DOI : 10.35291/2454-9150.2020.0686 © 2020, IJREAM All Rights Reserved.
IT/IJES Sectors. Analysis of the data pointed out that there
existed significant differences in the culture of the
organizations under the study. Analysis further pointed out
that all then to city and autonomy were more priced/ valued
in consulting as compared to the manufacturing and
services Industry. Openness and confrontation were higher
in the IT/ITES sectors, while collaborations were higher in
the manufacturing sectors. Furthermore, Private sectors had
an open and trusting culture, as compared to, the Public
Sector. Results of the study further pointed out that
employees, who were professionally qualified rated
confrontations, authenticity and autonomy higher than
those, who were not professionally qualified. However, no
significant differences existed between males and females
in evaluation of organizational culture. The study used t-test
to find out the significant differences between population
means (2-sample), t-values measured, the size of the
difference relative to the variations in the sample data.
Al Jenaibi (2011) Argued that managing workplace
diversity became the main concern among organizations in
today. The United Arab Emirate (UAE), one of the World’s
largest net migration rates, and the number of workers from
India, the Philippines, Indonesia, Australia, the USA among
other countries increased significantly in the recent decades.
The UAE cross border mobility resulted in the interaction
of people, with diverse languages, cultures and ethanic
backgrounds, due to, the nature of the UAE work force,
which was dominated by foreign workforce. The study
therefore, critically analyzed the benefit and challenges,
which the organizations faced in the diverse work place of
the UAE. The study used a multi method approach
combining survey data from 750 surveys of foreign workers
with quantitative data from interviews, with native officials
of the organization. The research found generally a
favorable view towards workplace diversity, from the
perspective of surveyed employees. However, when asked
about more detailed questions about the company’s policy,
a significant segment of respondents expressed
reservations, about their employees ability, to implement
successful intercultural communications and diversity
practices.
Visagie, J.C and Linde, H.M. (2011) Expressed the
relationship between the employees perceptions of
organizational culture in a multinational construction
company and concluded that, if an organization/Industry
developed and maintained a supportive and applied work
culture, it would lead to higher performance, by including
high competitiveness, diversified work conditions, and
short period of work written a specified team of people.
Working conditions were mainly formed in high safety risk
environment and sometimes less than living conditions,
where people were working. The employees, who worked
in a flexible atmosphere were likely to be more discrete.
This type of organization was observed to be more
supportive to employees and in development of work
culture.
Amah Edwinah (2012) examined empirically the affects of
corporate culture on employees job performance, as well as,
organizational productivity, and effectiveness by making
the case study of the Nigerian Banking Industry. A total of
388 managers were randomly drawn from a population of
13339 managers of all the 24 Banks in Nigeria the
instruments used were the questionnaire and the oral
interviews Spearman’s Rank correlation statistical tool was
used to test the hypothesis the findings pointed out that
adaptability positively influenced the organizational
profitability and market share. It was further observed that
there was no significant relationship between adaptability
and organization productivity. The finding of the study,
pointed out that a good large number of respondents (57.7
percent) strongly agreed that Corporate culture had or did
effect positively on the employees job performance.
Employees performance did show improvement, and
another 48.7 percent of the employees, also agreed that the
corporate culture determined the productivity level of the
organization, as well as, of the employees. There findings
made up to accept the alternative hypothesis because in
both the cases the calculated value of chi-square were found
to be greater than the tabulated values.
Beyond doubt, todays organizations had become
predominantly dynamic in nature and such organizations,
enveloped large opportunities and challenges, to the
corporate practitioners and policy makers. In the past, there
had been researches in literature to explore the effect of
organizational culture on various human development
programmes of an organization. For example scholars such
as (Hofstade, 1980), Ouchi 1981 Hofstede and Bond 1988,
kotter and Heskette, 1992, Magee, 2002) claimed that the
organizational culture helped to provide opportunity and
broad structure for the development of human resources,
Technical and behavioral skills in an organization.
The purpose of the research paper was to; explore the
impact of organizational culture on Productivity and quality
in Software organization in case of India. This empirical
study was done basically in two phases. The first phase
adopted Qualitative Methodology and explored the
significant aspects of organizational culture such as
productivity and quality and nature of relationship
organizational culture had with productivity and quality.
The second phase made a qualitative analysis of this
relationship. The study developed a large a range of insights
into the way the cultural processes, tended to, influence
productivity and quality in people centric and knowledge
intensive work contexts such as software’s. The study also
employed perceptual measures of productivity and quality
in carrying out the quantitative analysis.
Kawar T.I. (2012), in its research article studied the cross-
cultural differences in management. The study pointed that

International Journal for Research in Engineering Application & Management (IJREAM)
ISSN : 2454-9150 Vol-06, Issue-08, NOV 2020
115 | IJREAMV06I0868028 DOI : 10.35291/2454-9150.2020.0686 © 2020, IJREAM All Rights Reserved.
there are areas in management, whereby differences
towards attitudes behaviours, functioning, communication
issues and cultural implications can be seen. Cross-cultural
differences mainly stemmed from the different background
of each culture. Cultural varieties could be witnessed in the
work place and other factors introduced other than the
factors mentioned above included sales target, meeting
deadlines, working on tight budgets which could lead to
cause work conflicts. Because the differences in culture
may occur that could lead to misunderstanding among
people working in the same organization due to their
different values, beliefs, background etc. The study
concluded that the successful management of any person
would lie in his capability to work with people from
different cultural backgrounds, no matter what their cultural
was orientation. It further pointed out that an evidence on
this was the successful management of many Western
companies operating in different parts of the world such as
Middle East and they come with good managerial results,
the study concluded.
Ya Fang Trar (2011) emphasized on the fact that
organizational culture referred to the beliefs and values that
had existed in, an organization for a long period of time and
to the belief of the staff and the foreseen value of their work
that influenced their attitude and behavior. Administrators
and Managers usually were found to be adjusting their
leadership behavior, to accomplish the mission, of the
organization and this could influence, the employees job
satisfaction. It was, therefore, essential to, understand the
relationship between organizational culture, leadership
behavior and job satisfaction of the employees. In this
context, a cross-sectional study was undertaken that focused
on the hospitals and nurses in Taiwan. Data were collected,
using a well-structured questionnaire. 300 questionnaires
were distributed and 200 valid questionnaires were received
or returned by the respondents. To test the reliability of the
data, they were analysed by cross-bach’s and the
confirmatory factors. Correlation analysis was used, on the
relationship between organizational cultures leadership
behavior and job satisfaction. Organizational cultures were
significantly (positively) correlated, with the leadership
behavior and job satisfaction and leadership behavior was
significantly (positively) correlated with job satisfaction.
Aycan Zeynep et al (2014) basically reviewed the research
on cross-cultural organizational behavior (OB). The study
broadly construed, cross-cultural organizational behaviour
as the study of the cross-cultural organizational behavior as
the study of the cross-cultural similarities and differences in
process and behavior at work and the dynamics of cross-
cultural interfaces in multi-cultural domestic and
international contexts. The study is based on the review of
more than 1000 publications on cross-cultural variations
and organizational behavior. The review showed that
developmentally, cross-cultural research in OB was coming
of aged as the study clearly pointed out how individuals
manage, their interdependence in organizations and
reviewed research on culture and negotiations and disputing
teams and leadership, followed by research on managing
across borders and expatriation. The study highlighted
critical challenges for future research which
included/enveloped moving beyond values to explain
cultural differences, attending focusing or concentrating to
levels of analysis issues, incorporating social and
organization context/text factors into cross-cultural research
and work culture, work environment.
Panying and Binglu Zhoo (2017) stated that modern day
work culture of various organization changed to a great deal
as more and more employees emanated from not only from
different countries but regions were observed to be marking
in the domestic and international companies and how to
motivate employees working together in such organisations.
It was a very important issue to study or explore. The
present study made together a lot of existing research
results with the actual business operation situations, the
present research paper is based on pure theoretical analysis
of various theories on motivation. Based on the research
results of scholars at home and abroad the study discussed
the incentives for cross-cultural employees in international
enterprises from four aspects which were significant of
work hierarchy of needs and dichotomy of internal and
external factors as well as the reward and punishment
mechanism. It was observed that the characteristics and
mechanism of effective incentives of different cultures were
different.
Jassy Mathew (2019) evaluated vertically the theorized
relationship between organizational culture and
effectiveness. The study was based on the empirical data
collected through a five-month ethnographic study in an
Indian knowledge intensive firm. It used/followed the three-
perspectives framework of culture that, enveloped
integration, differentiated and fragmented perspectives and
a comprehensive examination of effectiveness. The study
concluded that integrated, differentiated and frequentative
perspectives of culture, capture multiple organizational
values and they affect, effectiveness in varied ways.
Appropriate culture, although not sufficient conditions were
crucial for effectiveness, especially in knowledge intensive
firms. High level of differentiation and frequentative
prevent the formation of strong culture, which challenged
organization integration. There was heightened need for the
application of sophisticated Human Resource Management
(HRM) systems in the Indian Software Sector. (Bryan,
1999) In concrete terms cultural diversity in the work place
is which he considered was exercised through the co-
existence of workers, who came from different
backgrounds. The management of cultural diversity
required, therefore, a type of organizational culture, in
which, every employees career was not affected by age,
gender, race, religion or other factors not related to
performance.

International Journal for Research in Engineering Application & Management (IJREAM)
ISSN : 2454-9150 Vol-06, Issue-08, NOV 2020
116 | IJREAMV06I0868028 DOI : 10.35291/2454-9150.2020.0686 © 2020, IJREAM All Rights Reserved.
III. RESEARCH METHODOLOGY
The present study was conducted by following stratified
random sampling technique.
Shreyans Industries Limited, Ahmedgarh District Sangrur,
Punjab got selected where both the internal and external
cross-cultural variations existed. The present research paper
studied the three objectives mentioned above
(competitiveness, motivation, work culture and work
environment etc.) with the help of secondary data collected
from Shreyans Industries Limited, Ahmedgar, Sangrur,
Punjab.
1.5 Data Collection
Data were collected from primary as well as secondary
sources. Secondary data was collected from the Head office
of Shreyans Industries Limited, Ahmedgarh, District
Sangrur, Punjab. Objective-I of the study was examined
with the help of secondary data analysis. The objective-II
and III were studied with the help of sampled primary data
collected from the technical and non-technical employees
of Shreyans Industries Limited as discussed below:
1.6 Secondary Data Analysis Techniques
The data analysis techniques used for studying the
motivation, competitiveness, work culture and work
environment, work conflicts, attitude etc. included (i) trend
analysis (ii) Chi-square test and other statistical tests as can
be seen from the analysis of secondary data given below:
1.6.1 Secondary data analysis and results
In order to study the sense of the competitiveness secondary
as well as primary data collected from Shreyans Industries
Limited were analyzed and the results were presented as
below:
OBJECTIVE-I: TO MEASURE THE
COMPETITIVENESS WHICH HAS BEEN NOTICED
IN THE ORGANIZATION/INDUSTRY DUE TO
CROSS-CULTURAL VARIATIONS
A) Production: Table 1 given below provides year-wise
data for the years 1982-83 to 2017-18 on the total
production in millions, cost of production in Rs.(millions)
and profits in millions Rs. In case of Shreyans Industries
Limited, Ahmedgarh, Punjab.
Since the time series data was available for a large number
of years since 1982-83 to 2017-18 trend analysis was
carried out to find out the trend in production, cost and
profits. In case of production it showed that R2 value was
0.98 which was quite/highly significant, whereas, the F-
value was found to be (F=1433.7) which was also found to
be significant at (0.01) level of significance. This showed
that the production of paper in the Industry, since 1982-83
had been on the rise, till the year 2017-18. From the b co-
efficient value (b-1203.70), p<0.01) which showed that
production increased by amount of Rs.1203.7 and found to
be statically significant at 0.01 level. The results of the
same were presented by way of graph given in figure 1.
B) Costs: Year wise trend analysis was carried out on
production was also applied on the cost of production. It
was observed that, the year-wise trends in case of year-wise
cost that also observed to rising and the Ads R2 value was
0.98, which was again highly significant, whereas the F
value (1566.3), which was again observed to be significant
at 0.01 significant level. This showed that year-wise cost
was changing and varying from the year 1982-83 to 2017-
18, but overall was rising. From the co-efficient value (b
=1210.1, p<0.01), which showed that cost increased by
amount of Rs.12101 and found to be significant at 0.01
level.
C) Profits: In the similar way, the year-wise trend in profits
were obtained. It can be seen from the table 1, and figure 3
which provided year-wise trend of profits. In case of
profits, again check adj. R2 value was found to be 0.98,
which was highly significant, and the F value was found to
be F=1635.4 which again was significance at 0.01 level of
significant. This showed that the profits are varying or
changing since 1982-83 to 2017-18. It was further noted
from the results that beta co-efficient value (b=1006.5,
p<0.01) which showed that he profits increased by amount
of 1210 and found to be significant. The presented study
therefore evaluated the affects of cross-cultural variations
on production employees productivity, efficiency and sense
of competitiveness in Shreyans Industries Limited
Ahmedgarh, Punjab, India. The study also pointed out and
firmly laid emphasis, on the internal cross-cultural
variations, which existed in the organization and which to a
great extent also affected the production, cost, profits,
employees productivity, efficiency etc. The present study,
therefore, analysed or examined two types of cross-cultural
variations by taking into consideration the definition of
culture stated in (Chapter-I). External cross-cultural
variations (mainly foreign employees/experts working, with
local employees) and ii) Internal cross-cultural variations-
where employees, belonging to different domestic
Nationalities (different states) worked together and how
such internal cross-cultural variations and external cross-
cultural variations affected employees productivity,
efficiency, competitiveness work environment, motivation
(positively or adversely) etc. were analysed and presented.
This chapter, on data analysis on cross-cultural variations
(both internal and external) mainly dealt with the data
collected and analysed mainly from the secondary sources
i.e. the Head office and technical department and
production departments etc. as well as from the different
departments such as data on production, exports and
imports, costs and profits, raw material used (chemicals and
fuel) number of employees (both technical and non-
technical) and data on infrastructure such as power, water,

International Journal for Research in Engineering Application & Management (IJREAM)
ISSN : 2454-9150 Vol-06, Issue-08, NOV 2020
117 | IJREAMV06I0868028 DOI : 10.35291/2454-9150.2020.0686 © 2020, IJREAM All Rights Reserved.
transport etc. The secondary data thus collected was
analysed and the results were presented.
Table 1: Year wise production, cost and profits of
Industry
Year Production
(million
(Rs)
Cost
(in million Rs)
Profits
(in million Rs)
1982-83 3523 5989 2466
1983-84 6597 11215 4618
1984-85 8157 13867 5710
1985-86 9471 16101 6630
1986-87 10276 17469 7193
1987-88 11619 19752 8133
1988-89 12434 51138 8704
1989-90 11009 18715 7706
1990-91 14188 24120 9932
1991-92 14581 24788 10207
1992-93 19164 32579 13415
1993-94 21185 36015 14830
1994-95 22442 38151 15709
1995-96 22647 39632 16985
1996-97 22332 40198 17866
1997-98 24964 44935 1997
1998-99 25899 46618 20719
1999-20 28623 51521 22898
2000-01 29356 52841 23485
2001-02 29341 52814 23473
2002-03 29952 53914 23962
2003-04 29214 52585 23371
2004-05 29527 53149 23622
2005-06 33565 60417 26852
2006-07 33287 59917 26630
2007-08 33796 60833 27037
2008-09 34022 61240 27218
2009-10 34729 62512 27783
2010-11 35702 64264 28562
2010-12 36578 65840 29262
2012-13 44875 80775 25900
2013-14 45350 81630 36280
2014-15 43307 77953 34646
2015-16 45873 82571 36698
2016-17 48601 87482 38881
2017-18 49169 88504 39335
R2 0.98 0.98 0.99
Adj R2 0.98 0.98 0.98
F value 1433.7
(<0.01)
1566.3(<0.01) 1635.4(<0.01)
Beta coefficient
(b)
1203.7 2210.1 1006.5
Std.Error 31.8 55.84 24.9
t value 37.9 39.58 40.4
p value <0.01 <0.01 <0.01
Source: Secondary data collected from Head Office
Shreyans Industries Limited-2017-18.
Fig. 1(a): Year wise production of Industry
R2 value is 0.98 and significant value F=1566.3, which is significant at 0.01 level of significance. This shows production is
significant vary from year 1982-83 and 2017-18. From beta coefficient value (=1203, p<0.01), which shows, production is
increase with amount 1203.7 and found significant at 0.01 level.
0
10000
20000
30000
40000
50000
60000
19
82-8
3
19
83-8
4
19
84-8
5
19
85-8
6
19
86-8
7
19
87-8
8
19
88-8
9
19
89-9
0
19
90-9
1
19
91-9
2
19
92-9
3
19
93-9
4
19
94-9
5
19
95-9
6
19
96-9
7
19
97-9
8
19
98-9
9
19
99-2
0
20
00-0
1
20
01-0
2
20
02-0
3
20
03-0
4
20
04-0
5
20
05-0
6
20
06-0
7
20
07-0
8
20
08-0
9
20
09-1
0
20
10-1
1
20
10-1
2
20
12-1
3
20
13-1
4
20
14-1
5
20
15-1
6
20
16-1
7
20
17-1
8
Production (million (Rs)

International Journal for Research in Engineering Application & Management (IJREAM)
ISSN : 2454-9150 Vol-06, Issue-08, NOV 2020
118 | IJREAMV06I0868028 DOI : 10.35291/2454-9150.2020.0686 © 2020, IJREAM All Rights Reserved.
Fig. 1(b): Year wise cost of Industry
R2 value is 0.98 and significant value F=1566.3, which is significant at 0.01 level of significance. This shows production is
significant vary from year 1982-83 and 2017-18. From beta coefficient value (=1210.1, p<0.01), which shows, production is
increase with amount 1210.1 and found significant at 0.01 level.
Fig. 1(c): Year wise profit of Industry
R2 value is 0.98 and significant value F=1635.4, which is significant at 0.01 level of significance. This shows production is
significant vary from year 1982-83 and 2017-18. From beta coefficient value (=1006.5, p<0.01), which shows, production is
increase with amount 1210.1 and found significant at 0.01 level.
Table 2: Effects of Production and Cost of Production from 1982-83 to 2017-18.
Beta coefficient Newey-West Std.
Err.
t-value p-value 95% Confidence Interval
Minimum Maximum
Constant -1602.9 258.4 -6.20 0.00 -2158 -1077
Production 1.82 0.01 196.2 0.00 1.80 1.84
a. Dependent variable: Costs
b. Based on secondary data.
Table 2 above represented the regression result obtained/worked out by using Newey-West std. Error, where the dependent
variable used was the cost, and the independent variable used was the production. Significant linear relationship (F=7814,
p<0.01) was observed between dependent and independent variable at (0.01) level of significance. It was further observed that
the costs increased with increase of production (=1.82) and this increase was found to be statistically significant (t=196,
p<0.01) at 0.01 level of significance.
0
10000
20000
30000
40000
50000
60000
70000
80000
90000
1000001
982
-83
19
83-8
4
19
84-8
5
19
85-8
6
19
86-8
7
19
87-8
8
19
88-8
9
19
89-9
0
19
90-9
1
19
91-9
2
19
92-9
3
19
93-9
4
19
94-9
5
19
95-9
6
19
96-9
7
19
97-9
8
19
98-9
9
19
99-2
0
20
00-0
1
20
01-0
2
20
02-0
3
20
03-0
4
20
04-0
5
20
05-0
6
20
06-0
7
20
07-0
8
20
08-0
9
20
09-1
0
20
10-1
1
20
10-1
2
20
12-1
3
20
13-1
4
20
14-1
5
20
15-1
6
20
16-1
7
20
17-1
8
Cost (in million Rs)
0
5000
10000
15000
20000
25000
30000
35000
40000
45000
19
82-8
3
19
83-8
4
19
84-8
5
19
85-8
6
19
86-8
7
19
87-8
8
19
88-8
9
19
89-9
0
19
90-9
1
19
91-9
2
19
92-9
3
19
93-9
4
19
94-9
5
19
95-9
6
19
96-9
7
19
97-9
8
19
98-9
9
19
99-2
0
20
00-0
1
20
01-0
2
20
02-0
3
20
03-0
4
20
04-0
5
20
05-0
6
20
06-0
7
20
07-0
8
20
08-0
9
20
09-1
0
20
10-1
1
20
10-1
2
20
12-1
3
20
13-1
4
20
14-1
5
20
15-1
6
20
16-1
7
20
17-1
8
Profits (in million Rs)

International Journal for Research in Engineering Application & Management (IJREAM)
ISSN : 2454-9150 Vol-06, Issue-08, NOV 2020
119 | IJREAMV06I0868028 DOI : 10.35291/2454-9150.2020.0686 © 2020, IJREAM All Rights Reserved.
Table 3: Effects of Production vs. Profits of Industry from 1982-83 to 2017-18.
Beta coefficient Newey-West Std.
Err.
t-value p-value 95% Confidence Interval
Minimum Maximum
Constant -1602.9 258.4 -6.20 0.00 -2158 -1077
Production 0.82 0.01 88.4 0.00 0.80 0.84
a. Dependent variable: Costs
b. Based on secondary data.
Table 3 gave provided the regression results, with Newey-West Std. Error. In this case, the dependent variable used was Profits
and independent variable used was production. Significant linear relationship (F=7814, p<0.01) was observed between
dependent and independent variable at (0.01) level of significance. It was further observed from the table that profits increased
with the increase in production (=0.82) and the increase was found to be statistically significant as (t=88.4, p<0.01) at 0.01
level of significance.
Table 4: Total Exports Vs. Imports Behaviour (2008-2018)
Year Imports
(in million tons)
Exports
(in million tons)
2008-2009 107864 14559805
2009-2010 98739 5700581
2010-2011 117762 59951701
2011-2012 121534 85170622
2012-2013 125167 68817981
2013-2014 141629 60051090
2014-2015 143248 31343967
2015-2016 146395 23284784
2016-2017 35780 33534748
2017-2018 158250 140691644
R2 85.3 19.9
AdjR2 83.3 9.9
F value 46.5 1.99
Beta coefficient 5682 5916753
Std. Error 833.2 4196745
t value 6.82 1.41
p value <0.01 0.20 (ns)
Source: Secondary data collected from Head Office Shreyans Industries Limited-2017-18.
From the table above, it can be observed that R2 value is 85.3% and F=46.5, and 1.99 whereas the Ads R2 value was 83.5
which were significant at (0.01) level of significance. This showed that Imports played a very important role and were
increasing from 2008-2009 to 2017-2018. From beta coefficient value (=5682, p<0.01), it can be further observed that
imports increased by amount of Rs.5682 every year and were found to be significant at (0.01) level as shown in Fig 2 from
table it can also be observed from that in case of imports R2 value was 85.3 and F-value and the Adj R2 value was 83.5 and
which were significant at (0.01) level of significance. This also showed that imports played a very important role and were
increasing since 2008-2018. Hence imports showed a very significant role. From beta co-efficient value (=5682, p<0.01), it
was further observed that imports increased by amount 5682 every year and were found to be significant at 0.01) as shown in
Fig. 2.
In the same way. In case of Exports, R2 value was 19.9% and Adj R2 value was 9.9 and the F value was 1.99, which showed
that it was non-significant. However, year-wise trends of Exports, at 0.05 level were found to be significance as shown in fig.
2. This significance level in exports showed, that. This could be due to be some data errors. However, the presented study
recommended that this phenomenon needed further study and investigation.

International Journal for Research in Engineering Application & Management (IJREAM)
ISSN : 2454-9150 Vol-06, Issue-08, NOV 2020
120 | IJREAMV06I0868028 DOI : 10.35291/2454-9150.2020.0686 © 2020, IJREAM All Rights Reserved.
Fig. 2: Total Exports Vs. Imports Behaviour (2008-2018)
Linear Regression: It was observed from the previous analysis that Employees Productivity and Employees Efficiency was
influenced by the Market Competitiveness (i.e. Imports and Exports) from the Shreyans Industries Limited. Linear Regression
Analysis was carried out to asses, the impact of market competitiveness in enhancing Employees Productivity and Efficiency
and the results obtained in this regard were presented in table 5 below:
Table 5: Employees productivity and efficiency
Fact R2 Constant Regression Co-efficient t-value f-value
Employees productivity
Import-MT 0.483 45.511 0.006 2.731 0.026
Import Rs 0.512 48.3737 0.000000203 2.900 0.020
Export-MT 0.068 58.87 0.002 0.764 0.467
Export(Rs) 0.164 57.8 0.00000068 1.250 0.246
Employees Efficiency
Import-TM 0.481 18.142 0.002 2.722 0.026
Import Rs 0.509 19.303 0.000004841 2.880 0.021
Exports-MT 0.071 23.499 0.001 0.783 0.456
Exports(Rs) 0.168 23.072 0.000000281 1.270 0.240
Source: Secondary data collected from Head Office Shreyans Industries Limited-2017-18.
The above analysis clearly indicated that the levels of imports and exports had a significant impact on Employees Productivity
and Efficiency in Shreyans Industries Limited. Cross-Cultural Variations (both Internal and External) brought over the period
1978-2018 sense of Competitiveness among the employees, Quality of paper Production has increased (which has not only led
to higher production, but also in the increase of Exports) higher wages, incentives and increments. In the analysis presented in
the above table, it was further observed that with regard to employees productivity, the value of R2 (Co-efficient of Multiple
Determination) came to 0.483 and 0.512 in case of imports in physical terms and value terms in which further revealed that
48.3 and 51.2 percent variations in the Employees productivity were found due to the variations in the levels of Imports in
physical as well as value terms respectively. The value of Regression co-efficients indicated that there was a little
improvements i.e. only (0.006) and (0.000000203) times with one unit increase in the level of Imports, both in physical as well
as, in value terms. In the same way in case of Exports, the employees productivity the value of R2 was observed to be 0.68 and
0.164 in physical terms and in value terms, which further revealed that 68% and 16.4% variations in employees productivity
were due to the variations in the levels of exports in physical as well as in value terms. The values of regression co-efficient
showed that there was a little improvement i.e. (0.002) and (0.00000068) times with one unit increase in the level of exports
both in case of physical as well as value terms. The Contribution of Exports towards in the recent years showed a slight
0
20000000
40000000
60000000
80000000
100000000
120000000
140000000
160000000
2008-2009 2009-2010 2010-2011 2011-2012 2012-2013 2013-2014 2014-2015 2015-2016 2016-2017 2017-2018
107864 98739 117762 121534 125167 141629 143248 146395 35780 158250
145598055700581
59951701
85170622
6881798160051090
3134396723284784
33534748
140691644
Imports (in million tons) Exports (in million tons)

International Journal for Research in Engineering Application & Management (IJREAM)
ISSN : 2454-9150 Vol-06, Issue-08, NOV 2020
121 | IJREAMV06I0868028 DOI : 10.35291/2454-9150.2020.0686 © 2020, IJREAM All Rights Reserved.
Decline due to technical and data errors reporting. This observation was further investigated with the help of primary data
collected which showed that Secondary data compiled on Exports and imports was erratic and not correctly recorded/revealed.
The analysis of Primary data had shown a clear increasing trend in the Exports and Imports behaviour in case of Shreyans
Industries Limited. The results of the Primary data were presented in chapter on primary data analysis.
Similarly, in the case of the Employees efficiency, the value of R2 (Co-efficient of multiple determination) came out be 0.481
and 0.509 in case of Imports in Physical terms and value terms which clearly revealed that 48.1 and 59.1 per cent in the
employees productivity were, due to the variations, in the levels of Imports in Physical as well as in value terms respectively.
Once again, it was observed from the table that the value of the Regression Co-efficients indicated that there was a very little
Improvements i.e. only (0.002) and (0.000000481) times, with one unit increase in the levels of Imports, both in Physical, as
well as, in value terms. In the similar way in case of employees efficiency, the value of R2 was observed to be 0.071 and
0.168, in case of exports, in physical and value terms, which further revealed that 71% and 16.8% variations in employees
efficiency were, due to the variations in the levels of experts in physical as well as, in value terms. The values of regression co-
efficients did showing a very small/little improvements i.e. (0.0011 and 0.000000281) times, with one unit increase in the level
of Exports both in case of physical, as well as, value terms. In the similar way, again like-wise in case of Employees
Productivity, the contribution of Exports towards Employees Competitiveness came out to be Statistically Non-Significant, due
to occurrence of data errors (erratic data) gathered from the Secondary sources. However, the analysis of Primary data. Cleary
pointed out that the sense of competitions prevailed in the Industry or organization.
The Regression Analysis carried out above thus brought out, that the level of the Imports significantly improved the
Employees sense of Competitiveness, while the contribution of Exports towards the Employees productivity and efficiency and
Competitiveness remained Non-significant as far as the results of secondary data revealed.
Graphically figure 1 below provides the status of Employment. Employees productivity, employees efficiency and imports and
Exports.
Table 6: Year wise total prices and quantity of materials, chemicals and fuel prices
Year
Chemical Material Fuel
Price Quantity Price Quantity Price Quantity
2008-09 19438 68094 63501 36464 72445 3306
2009-10 18277 61839 58843 33703 67284 3197
2010-11 20699 67148 60646 46876 72659 3738
2011-12 23900 72816 67287 44614 71621 4104
2012-13 27381 80805 80354 39908 73771 4454
2013-14 30312 84599 83377 52570 91686 4460
2014-15 27637 86338 72318 52160 71689 4750
2015-16 31059 88185 77245 54070 81292 4140
2016-17 32090 87675 85506 45025 85038 3080
2017-18 35927 100300 86641 54080 91087 3870
R2 96 94.3 88.6 76.6 72.2 26.6
ADJ R2 92 88.9 78.4 58.6 52.2 7.1
F value 81.7 55.88 25.4 9.92 7.64 0.53
Beta coefficient 2197.5 4365.5 3512.9 2106.1 2419.4 55.2
Std. Error 243.0 583.9 696.4 668.6 875.1 76.7
t value 9.04 7.47 5.40 3.15 2.76 0.73
p value <0.01 <0.01 <0.01 <0.05 <0.03 0.49(ns)
Source: Secondary data collected from Head Office Shreyans Industries Limited-2017-18.
Year wise total prices and quantity of materials, chemicals and fuel prices for the years 2008-09 to 2017-18 was collected from
the secondary sources i.e the head office of the Industry. The same data has been analyzed and the results of the data analysis
showed adjusted R2 value, F-value, Beta coefficient, Std. error, t-value and p-value. The same data was presented in terms of
the trends analysis of Fig. 3(a) price of chemicals, Fig. 3(b), quantity of Chemicals, Fig. 3(c), price materials, Fig. 3(d),
quantity of Materials, Fig. 3(e), price fuels, Fig. 3(f), quantity of fuels given below:

International Journal for Research in Engineering Application & Management (IJREAM)
ISSN : 2454-9150 Vol-06, Issue-08, NOV 2020
122 | IJREAMV06I0868028 DOI : 10.35291/2454-9150.2020.0686 © 2020, IJREAM All Rights Reserved.
Fig. 3(a): Trends of price of chemicals
Fig. 3(b)Trends of quantity of Chemicals
Fig. 3(c): Trends of price materials
y = 2197.x + 15606
R² = 0.921
0
5000
10000
15000
20000
25000
30000
35000
40000
2008-09 2009-10 2010-11 2011-12 2012-13 2013-14 2014-15 2015-16 2016-17 2017-18
Price of Chemical
y = 4365.x + 57839
R² = 0.888
0
20000
40000
60000
80000
100000
120000
2008-09 2009-10 2010-11 2011-12 2012-13 2013-14 2014-15 2015-16 2016-17 2017-18
Quantity of Chemical
y = 3513.x + 55253
R² = 0.784
0
10000
20000
30000
40000
50000
60000
70000
80000
90000
100000
2008-09 2009-10 2010-11 2011-12 2012-13 2013-14 2014-15 2015-16 2016-17 2017-18
Price of Material

International Journal for Research in Engineering Application & Management (IJREAM)
ISSN : 2454-9150 Vol-06, Issue-08, NOV 2020
123 | IJREAMV06I0868028 DOI : 10.35291/2454-9150.2020.0686 © 2020, IJREAM All Rights Reserved.
Fig. 3(d): Trends of quantity of Material
Fig. 3(e): Trends of price fuels
Fig. 3(f): Trends of quantity of fuels
y = 2106.x + 36088
R² = 0.586
0
10000
20000
30000
40000
50000
60000
2008-09 2009-10 2010-11 2011-12 2012-13 2013-14 2014-15 2015-16 2016-17 2017-18
Quantity of Material
y = 2419.x + 66214
R² = 0.522
0
10000
20000
30000
40000
50000
60000
70000
80000
90000
100000
2008-09 2009-10 2010-11 2011-12 2012-13 2013-14 2014-15 2015-16 2016-17 2017-18
Price of Fuel
y = 55.91x + 3569
R² = 0.070
0
500
1000
1500
2000
2500
3000
3500
4000
4500
5000
2008-09 2009-10 2010-11 2011-12 2012-13 2013-14 2014-15 2015-16 2016-17 2017-18
Quantity of Fuel

International Journal for Research in Engineering Application & Management (IJREAM)
ISSN : 2454-9150 Vol-06, Issue-08, NOV 2020
124 | IJREAMV06I0868028 DOI : 10.35291/2454-9150.2020.0686 © 2020, IJREAM All Rights Reserved.
Table 7: Total imports and exports
Years Imports Exports
2008-09 107864 14579805
2009-10 98739 5700581
2010-11 117762 59951701
2011-12 121534 85170622
2012-13 125167 68817981
2013-14 141629 60051090
2014-15 143248 31343967
2015-16 146395 23284784
2016-17 135780 33534748
2017-18 158250 140691644
R2 85.3 19.9
ADJ R2 83.5 9.9
F value 46.5 1.99
Beta coefficient 5682 5916753
Std. Error 833.2 4196745
t value 6.82 1.41
p value <0.01 0.20(ns)
Source: Secondary data collected from Head Office Shreyans Industries Limited-2017-18.
Exports-imports behaviour Table 7 provided details about the behaviour of exports and imports from the Industry or
organization under the study for the year 2008-09 to 2017-18 and data analysis showed adjusted R2 value, p-value, beta
coefficient, Std. error, t-value and p-value as shown in table the figures 4(a) Trends of imports and 4(b) trends of exports below
showed the trends in the behaviour of exports and imports over the year.
Fig. 7(a): Trends of imports
Fig. 7(b): Trends of exports
y = 5682x + 98386R² = 0.8532
0
20000
40000
60000
80000
100000
120000
140000
160000
180000
2008-09 2009-10 2010-11 2011-12 2012-13 2013-14 2014-15 2015-16 2016-17 2017-18
Imports (Rs.)
y = 6E+06x + 2E+07R² = 0.199
0
20000000
40000000
60000000
80000000
100000000
120000000
140000000
160000000
2008-09 2009-10 2010-11 2011-12 2012-13 2013-14 2014-15 2015-16 2016-17 2017-18
Exports (Rs.)
International Journal for Research in Engineering Application & Management (IJREAM)
ISSN : 2454-9150 Vol-06, Issue-08, NOV 2020
125 | IJREAMV06I0868028 DOI : 10.35291/2454-9150.2020.0686 © 2020, IJREAM All Rights Reserved.
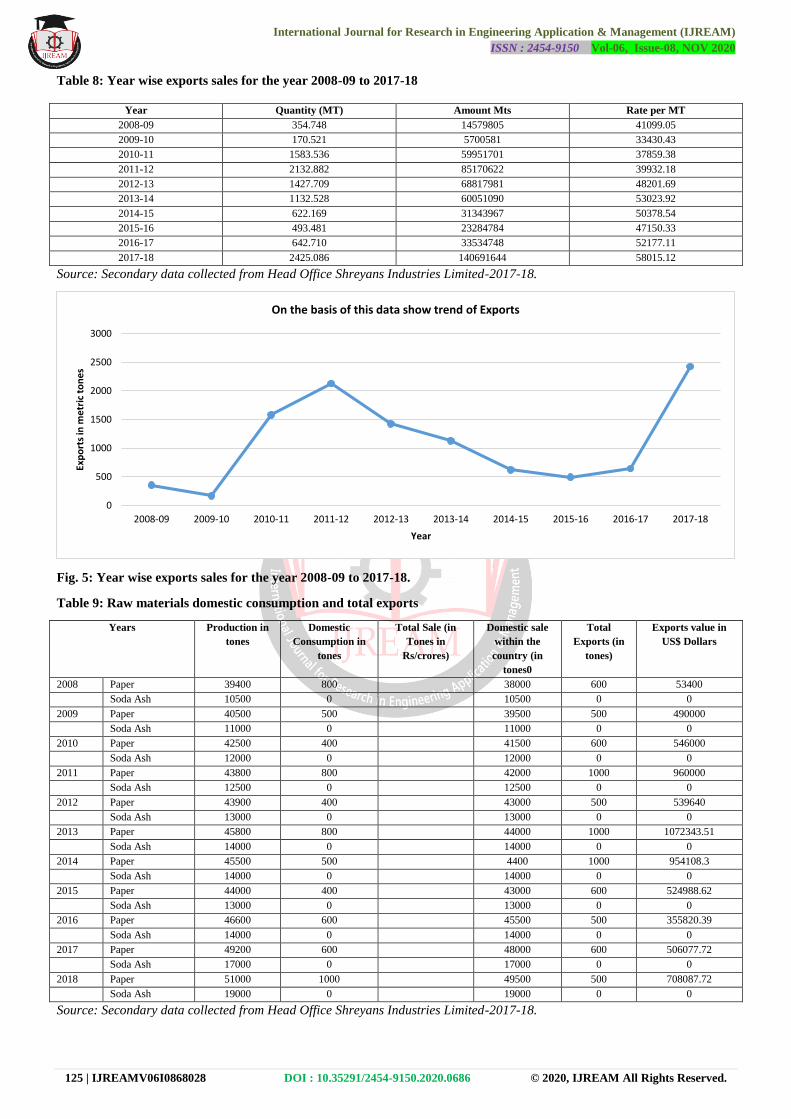
Table 8: Year wise exports sales for the year 2008-09 to 2017-18
Year Quantity (MT) Amount Mts Rate per MT
2008-09 354.748 14579805 41099.05
2009-10 170.521 5700581 33430.43
2010-11 1583.536 59951701 37859.38
2011-12 2132.882 85170622 39932.18
2012-13 1427.709 68817981 48201.69
2013-14 1132.528 60051090 53023.92
2014-15 622.169 31343967 50378.54
2015-16 493.481 23284784 47150.33
2016-17 642.710 33534748 52177.11
2017-18 2425.086 140691644 58015.12
Source: Secondary data collected from Head Office Shreyans Industries Limited-2017-18.
Fig. 5: Year wise exports sales for the year 2008-09 to 2017-18.
Table 9: Raw materials domestic consumption and total exports
Years Production in
tones
Domestic
Consumption in
tones
Total Sale (in
Tones in
Rs/crores)
Domestic sale
within the
country (in
tones0
Total
Exports (in
tones)
Exports value in
US$ Dollars
2008 Paper 39400 800 38000 600 53400
Soda Ash 10500 0 10500 0 0
2009 Paper 40500 500 39500 500 490000
Soda Ash 11000 0 11000 0 0
2010 Paper 42500 400 41500 600 546000
Soda Ash 12000 0 12000 0 0
2011 Paper 43800 800 42000 1000 960000
Soda Ash 12500 0 12500 0 0
2012 Paper 43900 400 43000 500 539640
Soda Ash 13000 0 13000 0 0
2013 Paper 45800 800 44000 1000 1072343.51
Soda Ash 14000 0 14000 0 0
2014 Paper 45500 500 4400 1000 954108.3
Soda Ash 14000 0 14000 0 0
2015 Paper 44000 400 43000 600 524988.62
Soda Ash 13000 0 13000 0 0
2016 Paper 46600 600 45500 500 355820.39
Soda Ash 14000 0 14000 0 0
2017 Paper 49200 600 48000 600 506077.72
Soda Ash 17000 0 17000 0 0
2018 Paper 51000 1000 49500 500 708087.72
Soda Ash 19000 0 19000 0 0
Source: Secondary data collected from Head Office Shreyans Industries Limited-2017-18.
0
500
1000
1500
2000
2500
3000
2008-09 2009-10 2010-11 2011-12 2012-13 2013-14 2014-15 2015-16 2016-17 2017-18
Exp
ort
s in
me
tric
to
ne
s
Year
On the basis of this data show trend of Exports

International Journal for Research in Engineering Application & Management (IJREAM)
ISSN : 2454-9150 Vol-06, Issue-08, NOV 2020
126 | IJREAMV06I0868028 DOI : 10.35291/2454-9150.2020.0686 © 2020, IJREAM All Rights Reserved.
Fig. 6: Raw materials domestic consumption and total exports.
OBJECTIVE-I: TO MEASURE THE COMPETITIVENESS WHICH HAS BEEN NOTICED IN THE
ORGANIZATION/INDUSTRY DUE TO CROSS-CULTURAL VARIATIONS
Objective-II: To study the positive and negative effects (if any) caused by the cross-cultural variations, on the
employees motivation.
Objective-III: To determine/evaluate, how the work environment, work culture, motivation, (values and attitude) has
changed in the organization, due to the cross-cultural variations
1.6.3 Technical employees: Competitiveness: Technical employee’s level of competitiveness was measured by a two periods
of time i.e 1978-79 to 1992-93 and (1993-94 to 2017-18). The technical employees competitiveness was measured by using the
primary data collected from the technical employees of the organization. The following two hypothesis were formulated and
tested.
i) Null Hypothesis (H0): Level of employees competitiveness in case of technical employees do not vary
significantly across two periods.
ii) Alternative Hypothesis (H1): Level of employees competitiveness in case of technical employees vary
significantly across two periods.
The status of employees competiveness in relation to cross cultural variations across two period of time is given in
Table 10. It was evident that, the proportion of technical employees, those reporting 'High competition of performance'
increased from 85.22 per cent in Period-I to 98.65 per cent in Period-II. The value of z-score corresponding to 'High
competition or/good competition and 'Average competition' came out to be greater than that of the critical level (2.576 at 1%:
1.96 at 5%), which further indicated that there were significant variations in employees competition in case of technical
employees across two point of time. Rather, the level of employees competitiveness in relation to cross cultural variations
across two period of time had improved significantly. The Null Hypothesis therefore stood rejected.
Table 10: Level of employees competitiveness in case of Technical Employees
Variables Period-I (1978-79 to 1991-92) Period-II (1993-94 to
2017-18)
Z-test Significance level
High competition 98 85.22 146 98.65 5.18 **
Good competition 8 6.96 1 0.68 2.78 **
Average competition 6 5.22 1 0.68 2.27 *
Some competition has begun 2 1.74 0 0.00 1.61 NS
No competition 1 0.87 0 0.00 1.14 NS
Source: Based on sampled primary data collected from the Shreyans Industries Limited-2017-18.
** and * significant at one and five per cent level of significance
39400
10500
40500
11000
42500
12000
43800
12500
43900
13000
45800
14000
45500
14000
44000
13000
46600
14000
49200
17000
51000
19000
0
10000
20000
30000
40000
50000
60000
Paper SodaAsh
Paper SodaAsh
Paper SodaAsh
Paper SodaAsh
Paper SodaAsh
Paper SodaAsh
Paper SodaAsh
Paper SodaAsh
Paper SodaAsh
Paper SodaAsh
Paper SodaAsh
2008 2009 2010 2011 2012 2013 2014 2015 2016 2017 2018
Year
Production in tones

International Journal for Research in Engineering Application & Management (IJREAM)
ISSN : 2454-9150 Vol-06, Issue-08, NOV 2020
127 | IJREAMV06I0868028 DOI : 10.35291/2454-9150.2020.0686 © 2020, IJREAM All Rights Reserved.
Fig. 7: Level of employees’ competitiveness in case of Technical Employees (primary data analysis)
1.6.4 Association between competitiveness and level of employee’s productivity (chi square analysis)
Association between competitiveness and level of employees productivity was measured by applying the chi-square test. The
follow my two hypothesis were formulated and tested.
a) Null hypothesis (H0): There is no significant association between competitiveness and employees productivity.
b) Alternative hypothesis (H1) There is significant association between competitiveness and employees productivity.
The observed and expected frequency with respect to low and high level of employees productivity in relation to
competitiveness of technical employees was presented in Table 11. The results showed that the calculated value of chi-square
(17.595) was very high and the p-value was less than (0.01), which further showed that there was a significant association
between competitiveness and employees productivity. Therefore, the Null hypothesis stood rejected which revealed that the
level of employee[s productivity of technical employees vary significantly in relation to competitiveness of technical
employees as shown in the table 11 below:
Table 11: Association between technical employees competitiveness and level of productivity
Competitiveness Low (up to Rs 5603/hrs) High (>Rs 5603/hrs) Total
High competition performance Count 1 0 1
Expected count 0.4 0.6 1
Good competition Count 2 0 2
Expected count 0.9 1.1 2
Average competition Count 6 1 7
Expected count 3.1 3.9 7
Some competition has begun Count 8 1 9
Expected count 3.9 5.1 9
Competition Count 98 146 244
Expected count 106.7 137.3 244
Total Count 115 148 263
Expected count 115 148 263
Source: Based on sampled primary data collected from the Shreyans Industries Limited-2017-18.
Chi-square Test
Chi-Square Tests
Value df Asymp. Sign. (2-sided)
Pearson Chi-Square 17.595a 4 0.001
Likelihood Ratio 19.672 4 0.001
Linear-by-Linear Association 14.68 1 0
N of Valid Cases 263
Source: Based on sampled primary data collected from the Shreyans Industries Limited-2017-18.
a. 7 cells (70.0%) had expected count less than 5.
b. The minimum expected count is 0.4.
0
10
20
30
40
50
60
70
80
90
100
High competition Good competition Average competition Some competition hasbegun
No competition
85.22
6.96 5.221.74 0.87
98.65
0.68 0.68 0 0
Period-I Period-II

International Journal for Research in Engineering Application & Management (IJREAM)
ISSN : 2454-9150 Vol-06, Issue-08, NOV 2020
128 | IJREAMV06I0868028 DOI : 10.35291/2454-9150.2020.0686 © 2020, IJREAM All Rights Reserved.
1.6.5 Association between competitiveness and employees efficiency-chi-square analysis.
Again under to find out the association between competitiveness and employees efficiency chi-square test was carried
out/applied. The following two hypothesis were formed and tested.
Null hypothesis (H0): There is no significant association between competitiveness and employees efficiency.
Alternative hypothesis (H1): There is significant association between competitiveness and employees efficiency.
The observed and expected frequency with respect to low and high level of employees efficiency in relation to competitiveness
of technical employees presented in Table 12. The results showed that the calculated value of chi-square (17.595) was very
high and the p-value was less than 0.01, therefore the null hypothesis stood rejected, which revealed that the level of
employees efficiency of technical employees vary significantly in relation to competitiveness of technical employees.
Table 12: Association between technical employees’ competitiveness and level of productivity
Employees productivity
Competitiveness Low (up to 89%) High (>89%) Total
High competition of performance Count 1 0 1
Expected count 0.4 0.6 1
Good competition Count 2 0 2
Expected count 0.9 1.1 2
Average competition Count 6 1 7
Expected count 3.1 3.9 7
Some competition has begun Count 8 1 9
Expected count 3.9 5.1 9
No Competition Count 98 146 244
Expected count 106.7 137.3 244
Total Count 115 148 263
Expected count 115 148 263
Source: Based on sampled primary data collected from the Shreyans Industries Limited-2017-18.
Chi-Square Tests
Value df Asymp. Sign. (2-sided)
Pearson Chi-Square 17.595a 4 0.001
Likelihood Ratio 19.672 4 0.001
Linear-by-Linear Association 14.68 1 0
No of Valid Cases 263
a. 7 cells (70.0%) have expected count has than 5.
b. The minimum expected count is 0.4.
1.6.6 Competitiveness among non-technical employees (based on primary data)
The status of employees competitiveness in relation to cross cultural variations across two period of time was tested by
developing following hypotheses:
Null Hypothesis (H0): Level of employees competitiveness in case of non-technical employees do not vary significantly
across two periods.
Alternative hypothesis (H1): Level of employees competitiveness in case of non-technical employees vary significantly
across two periods.
The status of employees’ competitiveness in relation to cross cultural variations across two period of time is given in Table 13.
It was evident from the table above that the proportion of non-technical employees, those reporting ''Excellent Competition'
increased from 24.32 per cent in Period-I to 55.68 per cent in Period-II. The value of z-score corresponding to 'excellent
competition' and 'some competition' came out to be greater than that of the critical level (2.576% at 1%: 1.96 at 5%), which
further indicated that, there were significant variations in the employees competition in the case of non-technical employees
across two point of time. Rather, the level of employees competitiveness in relation to cross cultural variations across two
period of time had improved significant. Therefore, the Null Hypothesis stood rejected.
Table 13: Sense of competition and competitiveness among non-technical employees
Particulars Period-I (1978-79 to 1991-92) Period-II (1991-92 to 2017-18) Z-test Significance level
Number Per cent Number Per cent
No Competition 2 5.41 9 5.11 0.07 NS
Some competition 6 16.22 9 5.11 2.40 *
Avg. competition 9 24.32 23 13.07 1.74 NS
Good competition 11 29.73 37 21.02 1.15 NS
Excellent competition 9 24.32 98 55.68 3.47 **

International Journal for Research in Engineering Application & Management (IJREAM)
ISSN : 2454-9150 Vol-06, Issue-08, NOV 2020
129 | IJREAMV06I0868028 DOI : 10.35291/2454-9150.2020.0686 © 2020, IJREAM All Rights Reserved.
Source: Based on sampled primary data collected from the Shreyans Industries Limited-2017-18.
1.6.7 Association of efficiency level of employees with level of employees competition in the case of non-technical
employees of the organization (based on primary data)
Association between efficiency level of employees with level of employees competition in case of non-technical employees of
the organization –Chi Square analysis.
Chi square test was applied to test the following two hypothesis:
a) Null Hypothesis (H0): There is no significant association between efficiency level of employees with level of
employees competition in case of non-technical employees.
b) Alternative Hypothesis (H1): There is significant association between efficiency level of employees, with level of
employees competition, in case of non-technical employees.
The observed and expected frequency, with respect to low and high level of employees efficiency, in relation to
competitiveness of technical employees is presented in Table 14. The results showed that the calculated value of chi-square
(145.8) was very high and the p-value was less than 0.01, therefore the null hypothesis stood rejected, which revealed that, the
level of employees varied efficiency of non-technical employees varied significantly in relation to competitiveness of technical
employees. Therefore, the Null hypothesis was rejected.
Table 14: Different types of training programmes conducted
Competition
EFEF Level No competition Some competition Avg. competition Good Competition Excellent competition Total
Class Room Training 26 70.27 75 42.61 3.06 **
On job training 9 24.32 89 50.57 2.91 **
Off job Training 2 5.41 11 6.25 0.20 NS
Out of country on job
training
0 0.00 1 0.57 0.46 NS
Source: Based on sampled primary data collected from the Shreyans Industries Limited-2017-18.
OBJECTIVE-III: THE DETERMINE HOW THE WORK ENVIRONMENT HAS CHANGED IN THE
ORGANIZATION DUE TO CROSS CULTURAL VARIATIONS.
Table 15: Perception of technical employees regarding the various issue of working with other communities
S. No. Variables Number Percent
1. Working with other Indian nationalities 263 100.00
2. Work with all type of communities 263 100.00
3. Smooth working we are mixed with other communities (Teamwork) 263 100.00
4. Employees productivity is not negatively affected, while working with other communities 252 95.82
5. While working with other communities no conflicts occurred 263 100.00
6. There was no tension/no stress while working with other communities 263 100.0
7. The experience of working with other communities was motivating and not demotivating 263 100.00
8. While working with other communities the work environment was healthy 252 95.82
9. It instilled professionalism and high work values 253 96.20
Source: Based on sampled primary data collected from the Shreyans Industries Limited-2017-18.
1.6.8 Level of susceptibility index of technical employees working with other communities
Susceptibility index is the compatibility level of technical employees working with different communities was carried out. As
discussed in the methodology, susceptibility index was calculated by taking into account the perception of the technical
employees with respect to various attributes of working with different communities. The distribution of technical employees,
according to the level of susceptibility index is given in Table 16 Susceptibility index was classified into low and high level on
the basis of the average value of susceptibility index. Employees lie above the average value of susceptibility index
representing high level of susceptibility while the remaining representing the low level of susceptibility. Out of total 263
employees, majority i.e. 88.21 per cent belonged to high level of susceptibility, while remaining 11.79 per cent belonged to
low susceptibility level as presented in Table given below:-
Table 16: Level of susceptibility index of technical employees working with other communities
Level of Susceptibility Score Number Percent
Low <=8 31 11.79
High > 8 232 88.21
Total 263 100.00
Source: Based on sampled primary data collected from the Shreyans Industries Limited-2017-18.

International Journal for Research in Engineering Application & Management (IJREAM)
ISSN : 2454-9150 Vol-06, Issue-08, NOV 2020
130 | IJREAMV06I0868028 DOI : 10.35291/2454-9150.2020.0686 © 2020, IJREAM All Rights Reserved.
1.6.9 Association between employees productivity and susceptibility level of technical employees-Chi square test
Chi square test was applied to test the following hypotheses:
Null hypothesis (H0): There is no significant association between employees productivity and susceptibility level technical
employees of the organization.
Alternative hypothesis (H1): There is significant association between employees and susceptibility level of technical
employees of the organization.
The observed and expected frequency with respect to low and high susceptibility level of technical employees in relation to
productivity is given in Table 17. The results showed that the calculated value of chi-square (45.227) which was very high and
the p-value was less than (0.01). Therefore, the Null hypothesis stood rejected, which revealed that the level of employees
productivity of technical employees vary significantly in relation to the susceptibility level of technical employees of the
organization.
Table 17: Association between employees productivity and susceptibility level of technical employees
Susceptibility Index
Level of Productivity Low (<=8) High (>8) Total
Low (up to Rs 5603/hrs) Count 31 84 115
Expected Count 13.6 101.4 115
High (> Rs 5603/hrs) Count 0 148 148
Expected Count 17.4 130.6 148
Total Count 31 232 263
Expected Count 31 232 263
Source: Based on sampled primary data collected from the Shreyans Industries Limited-2017-18.
a. 0 cells (.0%) have expected count less than 5. The minimum expected count is 13.56.
b. Computed only for a 2x2 table
1.6.10 Association between employees efficiency and susceptibility level of technical employees-Chi square test
Chi square test was applied to test the following hypotheses:
Null hypothesis (H0): There is no significant association between employees efficiency and susceptibility level technical
employees of the organization.
Alternative hypothesis (H1): There is significant association between employees and susceptibility level of technical
employees of the organization.
The observed and expected frequency with respect to low and high susceptibility level of technical employees in relation to
productivity is given in Table 18. The results showed that the calculated value of chi-square (45.227) which was very high and
the p-value was less than (0.01), therefore the null hypothesis stood rejected, which revealed that the level of employees
efficiency of technical employees vary significantly in relation to susceptibility level of technical employees of the
organization.
Table 18: Level of Productivity and Pearson Chi-square
n n on on n
Low Count 10 13 28 11 15 77
Expected count 4 5.4 11.6 17.4 38.7 77
Medium Count 1 2 4 37 36 80
Expected count 4.1 5.6 12 18 40.2 80
High Count 0 0 0 0 56 56
Expected count 2.9 3.9 8.4 12.6 28.1 56
Total Count 11 15 32 48 107 213
Expected count 11 15 32 48 107 213
Chi-Square Tests
Value df Asymp. Sig. (2-sided)
Pearson Chi-square 1.458 E2a 8 0
Likelihood Ratio 158.84 8 0
Linear-by-Linear Association 86.71 1 0
N of Valid Cases 213
Source: Based on sampled primary data collected from the Shreyans Industries Limited-2017-18.
a. 4 cells (26.7%) have expected count less than 5. The minimum expected count is 2.89.

International Journal for Research in Engineering Application & Management (IJREAM)
ISSN : 2454-9150 Vol-06, Issue-08, NOV 2020
131 | IJREAMV06I0868028 DOI : 10.35291/2454-9150.2020.0686 © 2020, IJREAM All Rights Reserved.
1.6.11 Motivation level of non-technical employees in relation to cross cultural variation
The status of motivation level of non-technical employees of the organization in relation to cross cultural variations across two
period of time was tested by developing following hypotheses:-
Null hypothesis (H0): Motivation level of non-technical employees in relation to cross-cultural variation in the organization
did not vary significantly across two periods.
Alternative hypothesis (H1): Motivation level of non-technical employees in relation to cross-cultural variation in the
organization varied significantly across two periods.
The motivation level of non-technical employees of the organization in relation to cross cultural variations across two period of
time is given in Table 19. It was evident that proportion of non-technical employees reporting 'Excellent motivation' increased
from 21.62 per cent in period-I to 46.02 per cent in Period-II. The value of z-score corresponding to 'excellent motivation' and
'Average motivation' came out to be greater than that of the critical level (2.576 at 1%: 1.96 at 5%) which further indicated that
there was significant variations in the employees motivation in the case of non-technical employees across two point of time.
Rather, the level of employees motivation in relation to cross cultural variations across two period of time was improved
significantly, as the results of the data analysis were observed to significant as shown in Table 4.39.
Table 19: Distribution of non-technical employees according to motivation
Particulars Period-I (1978-79 to 1991-92) Period-II (1991-92) to 2017-18) Z-test Significance level
No motivation 2 5.41 9 5.11 0.073 Ns
Some motivations 4 10.81 9 5.11 1.316 NS
Avg. motivation 16 43.24 38 21.59 2.752 **
Good motivation 7 18.92 39 22.16 0.435 NS
Excellent motivation 8 21.62 81 46.02 2.736 **
Source: Based on sampled primary data collected from the Shreyans Industries Limited-2017-18.
**Significant at 5% level.
1.6.12 Level of Attitude of non-technical employees in relation to cross cultural variation
The status of attitude level of non-technical employees of the organization in relation to cross cultural variations across two
period of time was tested by developing following hypotheses:-
Null hypothesis (H0): Attitude level of non-technical employees in relation to cross-cultural variation in the organization do
not varied significantly across two periods.
Alternative hypothesis (H1): Attitude level of non-technical employees in relation to cross-cultural variation in the
organization vary significantly across two periods.
Table 20: Status of different efficiency, productivity and competitiveness measures of non-technical employees between
two point of time
Employees efficiency indicators Period-I (1978-79 to
1991-92)
Period-I (1991-92 to
2017-18)
t Sign. (2-tailed) Significance level
Sense of competition and
competitiveness
3.51 4.17 3.13 0.002 **
Employees performance 3.46 4.09 2.937 0.004 **
Time given to achieve the targets 3.62 4.04 1.897 0.059 *
Employees Handling 3.46 4.00 2.589 0.01 **
Employees Coordination 3.54 4.10 3.074 0.002 **
Communication skills 3.38 4.09 3.265 0.001 **
Motivation 3.41 3.99 2.795 0.006 **
Attitude 3.43 3.99 2.723 0.007 **
Threats 3.95 4.76 5.268 0.00 **
Employees conflicts 2.03 1.24 5.334 0.00 **
Works Environment 3.41 4.08 3.181 0.002 **
Very poor time sense 3.30 3.99 3.329 0.001 **
Training 1.35 1.65 2.652 0.009 **
Source: Based on sampled primary data collected from the Shreyans Industries Limited-2017-18.
Note: ** and *significant at one and five per cent level of significance

International Journal for Research in Engineering Application & Management (IJREAM)
ISSN : 2454-9150 Vol-06, Issue-08, NOV 2020
132 | IJREAMV06I0868028 DOI : 10.35291/2454-9150.2020.0686 © 2020, IJREAM All Rights Reserved.
CONCLUSIONS
It can be concluded from the above analysis that all the three objectives with which the present research paper started were
fulfilled. As mentioned above various statistical techniques such as trend analysis, two proportion Z-test, chi-square test,
regression analysis, susceptibility analysis etc. techniques were used. The results clearly indicated that there was significant
improvement in the competitiveness, motivation, attitude, work culture and work environment of the employees. There were
no feeling of demotivation attitudinal problem or work conflicts and lack of sense of competitiveness among the employees of
the organization under the study.
REFERENCES
[1] Ying Pan and Binglu Zhao (2017) cross-cultural employees motivation in International Companies, in Journal of Human
Resource and Sustainability studies (05) (04) 215-222.
[2] Faradeh Salili (1996) Achievement motivation: A cross-cultural comparison of British and Chinese students, Education
psychology, 16(3), 271-279.
[3] Carl F. Fey (2005), “opening the Black Box of motivation: A cross-cultural comparison of Sweden and Russia.
[4] Michele J. Gel fand, Mariam Erez and Zeynep Aycan(2006), cross-cultural organization bahaviour in Annual Review of
Psychology, Vol. 58: 479-514, 2007, first published online as a review in advance in Oct. 17, 2006.
[5] Sagie, Abrahim, Elizur, Dev, Yamaruchi Hurotsugu (1996), The structure of strength of achievement motivation. A cross-
cultural comparison in journal of organizational behaviour, volume 17, Issue 5.
[6] Inder Science (2010), linking Academica.Business and industry through Research in
[7] European Journal of cross-cultural competence and Management, vol 1,No 2//3.
[8] Al-Jenaibi (2010) the effects of Cultural Diversity in the workplace in Journal of Diversity management, Dec2014
volume9,(Al Jenaibi2010)
[9] Mathew Jassy (2019),, influences of cultural Differences and Diversity in Journal IACCM, Inder science publishers
[10] Tagreed issa kawar, princess Sumaya 2012, Cross- cultural differences in management, in political science,Corpus
ID:56388727
[11] Aycan et al. (2000), Impact of culture on Human Resource management practices:A 10-country comparison in applied
Psychology :An International review,49(1) (2000),pp192-221.