Embed Size (px)
Citation preview
318
ISSN No. 2349-7165
UNNAYAN : International Bulletin of Management and EconomicsVolume - X | January 2019
Profitability analysis of Insurance companies:A case of Private Non-life Insurers
ABSTRACT
Pragati TomarResearch Scholar, Institute of Management studies, Devi Ahiliya Vishwavidyalaya, Indore
Email : [email protected]
Dr Monica SainyAssistant Professor, Shri Vaishnav Vidyapeeth Vishwavidyalaya, Indore
Dr Rajiv GuptaProfessor, Institute of Management studies, Devi Ahiliya Vishwavidyalaya, Indore
A business organization is always established with the aim of earning profit from its operations. It is the profit,
which act as a backbone for survival of every organization. Without earning profit, growth and stability of a
business firm is not possible. The private general insurance companies registered a growth rate of 13.12
percent in the year 2015-2016, against 9.62 percent growth rate in the year 2014-2015. Profit provides
incentives and inspirations for prospective investors, attracts external funds and also serves a key source of
internal funds. As per IMF- Background paper (2003) indicators for measuring financial soundness of
insurance Industry is CARAMEL framework. These indicators involve those quantitative factors which
significantly affect the financial position of Non-life insurance company. Earning and profitability parameter
of CARAMEL has been used on the basis of their analytical significance, data availability, calculation and its
relevance for the study. The study is basically based on secondary data and that has been gathered from annual
report of IRDA, annual report of selected Non-life Insurance companies, Journals, websites etc. to analyze
the 'earning and profitability' five leading Private Non-life Insurance Companies were taken up for the study .
The period of the study was 2011-2012 to 2015-2016.
Introduction
In this fundamental development of service in India, insurance service sector is additionally contributing
altogether with an extremely normal development rate. With biggest number of insurance policies authorized
around the world, life and non-life insurance happens to be an immense opportunity in India. Insurance is
financial intermediation function through which one can exposed to specified contingencies.
In India individuals trust that getting an insurance policy is a waste and they never approach to purchase an
insurance policy instantly. After globalization numerous private insurance agencies have learnt that India is a
potential zone to advertise their insurance products, (Khansili D.C. 2006). Hence large number of private
companies attached with famous organization in India and start selling their products in Indian market. These
companies are focusing mainly on general insurance sector because this sector is still untapped. The Private
Sector General Insurance Companies has increased their branch network, but quantitative expansion has only
beneficial when it is matched with consisting improvement in the quality of service and performance. The
rapid expansion of insurance companies after privatization has given rise to a numerous of problems
associated with brand image, operational efficiency, profitability and the quality of system as a whole. Their
survival in the industry depends upon their performance in profitability, efficiency and service quality. So,
there is a need to evaluate the service quality as well as profitability of the general insurance companies. The
present study “A Study of Private Insurance Business in India" is an attempt in this direction.
Review of Literature
Norgaard and Schick, (1970) determined the profitability of the companies which provide property and
liability insurance during the period 1953-67. Risk return trend analysis has been used for the further analysis.
UNNAYAN : International Bulletin of Management and EconomicsVolume - X | January 2019
319
ISSN No. 2349-7165Profitability analysis of Insurance companies: A case of Private Non-life Insurers
The result revaluate that inside the insurance industry economy of scale is found in degree of specialization
and size.
Baltelsmit and Bouzouita, (1998) inspected the connection amongst profitability and market structure in
automobile insurance. The information for study was related to the period 1984-1992. The outcomes
demonstrated that in private passenger automobile insurance there was a positive significant impact of
concentration on productivity of combined liability and physical damage lines.
Rao, (1998) observed that there has been a huge change in the physical execution of the LIC. But profitability
in terms of financial performance had not been up to the expected level.
Verma, (2000) observes the performance of GIC and its auxiliary organization throughout the year was no
such improvement recorded in profit position because of increased expenses, not increased claim and
commission. Rudolf, (2001) analyzed the profitability, investments and underwriting result of non-life
insurance companies of seven countries (G7) for the period 1996 – 2000. The outcomes showed that
exclusive Germany and japan have a positive underwriting result on the other hand France and Germany had
a low ROE, moderate in Canada and high in United Kingdom.
Brien, (2001) specifically focused 28 companies who are providing insurance services in United Kingdom
from 1990-99. Research demonstrated that they must focus on paid us commission and allowed higher
surrender esteems in the early years.
Sangmi, (2002) recognize the factors that are responsible for profitability of selected public sector banks in
India. Period chosen for the study was 1991-92 to 1997-98. the results reveal that earning of class one bank is
much satisfactory than earning of class two bank.
Verma, (2003) identified that motor insurance is the biggest and the quickest developing general insurance
market. The insurance company point out that expenses and loses are too high as compared to premium
earned in a year they cause immense underwriting loses the study likewise found that the new privately
owned businesses have demonstrated a cautious approach.
Lai and Limpaphayom, (2003) studied the Japanese life insurance industry and inspected the relationship
between organizational structure and firm performance. Period of 1983-1994 were chosen for the study. The
outcomes shows that stock companies that have a place with one of the six horizontal Keiretsce groups have
bring down cost and lower levels of free income than autonomous stock and mutual insurance companies.
Dhanda, (2004) observed the performance of LIC Business by utilizing both primary and secondary date. It
was discovered that development of individual business had not been exceptionally consistent during the
period from 1957-1990. 60 percent of aggregate income was gotten by premium income and the rest of the
pay was earned by investing funds.
Chen and Wong, (2004) analyzed the solvency of Asian general and life insurance organization utilizing firm
information and large scale data independently. Financial health of general insurance is influence by various
factors like liquidity ratio, firm size, operating margin, combined ratio, Surplus growth, and investment
performance.
Deloittie and Touche, (2004) focused on profitability and viability of the federal multiple crop insurance
(MPCI) programme. Data of 1992-2002 have been used for analyzing the performance of both MPCI
property and casualty insurance business. MPCI business does not have risk return benefits in respect to the
P&C business.
Uppal, (2004) identified the factors which are influencing the profitability of five noteworthy bank groups.
Period of study was 1997-2001. Ratio of public sector bank was lower than foreign and new private banks.

320
ISSN No. 2349-7165
UNNAYAN : International Bulletin of Management and EconomicsVolume - X | January 2019
Profitability analysis of Insurance companies: A case of Private Non-life Insurers
Hoyt and Powell, (2006) utilized economic combined ratio and ROE measures to analyses the profitability
performance of medical liability insurer. Study period was 1996 to 2004. Medical liability insurer sustained
losses in six sequential years from 1998 to 2003.
Holzheu, (2006) concentrated on the insurer of six major Non-life market the Japan, France, United States,
United Kingdom, Canada, Germany from 1994-2004. The outcomes for the years 1994-1997 and 2002-2004
that underwriting profit before tax for ten years were positive in all countries inferring a positive commitment
to profit from the insurance activities.
Kasturi (2006) focused on the insurance sector in terms of performance management. Financial performance
of any insurance company is generally expressed in terms of return on investment, profit earned, Return on
equity etc.
Kaur and Kapoor (2007) assessed the benefit and the relative effectiveness of Public sector Bank in India
during Post Liberalization period. All the twenty eight banks have been incorporated in the study and the
period chosen for the study in 2001-2005. Pal and Malik, (2007) researched the distinction in the financial
relative qualities of public sector banks, foreign banks and private banks in India. The outcomes shows that
foreign banks would be better to perform as contrasted with other two classes of banks, all in all and in terms
of use of resources specifically during the period decided for the study. Charumathi, (2012) researched that
Indian Life insurance Industry is the slightest productive market for its investors among all Asian nations
because of fall in new business premium in 2010-11 in in spite of the way that it has detailed net profit of Rs.
26.57 billion in 2010-11 as against net loss of Rs. 9.89 billion of every 2009-10.
Objective
1. To assess the profitability performance of selected private Non-Life Insurance service providers.
Research Methodology
The study is basically based on secondary data and that has been gathered from annual report of IRDA, annual
report of selected Non-life Insurance companies, Journals, websites etc. CARAMEL framework has been
utilized for the analysis. According to IMF-Background paper (2003), Financial Soundness Indicators (FSI's)
for the Insurance Industry can be given in CARAMEL [Capital sufficiency, Asset quality, Reinsurance and
Actuarial issues, Management soundness, Earnings/Profitability and Liquidity) Framework. These
Indicators incorporate the utilization of those quantitative variables which influence the financial position of
an Insurance organization. Just Earnings/Profitability and Liquidity are chosen for the study. The choice of
Indicator depends on their analytical criticalness, accessibility of information for gathering, calculation and
its relevance for the investigation.
To analyze the 'earning and profitability', five leading Private Non-life Insurance Companies were taken up
for the study. They are ICICI Lombard General Insurance Company Limited, Bajaj Allianz General Insurance
Company Limited, HDFC Ergo, Iffco Tokio General Insurance Company Limited and TATA AIG General
Insurance Company Limited. The period of the study was 2011-2012 to 2015-2016.
Analysis and Interpretation
1. Claim Incurred Ratio
Claim Incurred ratio is calculated by dividing net incurred claim to net written premium. B

321
ISSN No. 2349-7165
UNNAYAN : International Bulletin of Management and EconomicsVolume - X | January 2019
Profitability analysis of Insurance companies: A case of Private Non-life Insurers
Name of the Company
2015-2016 2014-2015 2013-2014 2012-2013 2011-2012 Mean
ICICI Lombard 81 81 83 84 101 86
Bajaj Allianz
73
71
72 72.4
77
73
Iffco Tokio
79
74
75
76 92
79.2
HDFC Ergo
72
78
80
76
83
77.8
Tata AIG
74
69
70
78
84
75
Mean 75.8 74.6 76 77.2 87.4
Table 1 : Claim Incurred ratio of selected General Insurance Companies
It was found that, ICICI Lombard showed a maximum average claim ratio of 86 percent followed by Iffco
Tokio and HDFC Ergo with the respective percentage of 79.2 percent and 77.8 percent. Tata AIG general
insurance company showed the least average claim ratio of 75 percent followed by Bajaj Allianz with the ratio
of 73 percent. Year-wise analysis indicates that the average claim ratio of private sector companies is highest
i.e. 87.4 percent in the year 2011-2012 followed by 77.2 percent in the year 2012-2013. Claim incurred is sub
parameter of earning and profitability. High value of this ratio reflects the high drainage of funds from the
organization. Furthermore taken into consideration the risk insured, an insurer definitely put him in a position
to pay claims. Good risk management and risk evaluation matters here.
Testing of Hypothesis: One Way ANOVA
Table 2 : Ho1.1: There is no significant difference in claim incurred ratio of selected private Non-
life Insurance Companies in India during the study period.
Total net incurred claims to net written premium (NWP) ratio
Source of Variation
SS
DF
MS
FCal.
Sig
Between Groups
492.266 4
123.066
3.286
.032
Within Groups
748.928
20
37.446
Total 1241.194 24
Table distinguished that distinction in the ratio of total net incurred claim to net written premium are
significant as the p value is 0.032, subsequently there are significant differences in claim incurred ratio of
selected general insurance companies under the investigation at 5 % level of significance. The difference is
because of good execution of ICICI Lombard when compared it with rest of the companies.
2. Expense Ratio
The ratio of expenses of management to gross direct premium reveals how much level of income is being
utilized for expenses on management.

322
ISSN No. 2349-7165
UNNAYAN : International Bulletin of Management and EconomicsVolume - X | January 2019
Profitability analysis of Insurance companies: A case of Private Non-life Insurers
Name of the Company
2015-2016 2014-2015 2013-2014 2012-2013 2011-2012 Mean
ICICI Lombard
21.15
20.77
17.71 16.59
16.94
18.63
Bajaj Allianz
21.87
20.17
18.51 19.21
20.45
20.04
Iffco Tokio
19.57
18.56
17.12 17.35
17.84
18.08
HDFC Ergo
22.65
19.58
15.37
15.24
15.75
17.71
Tata AIG
23.33
21.06
21.36
21.58
22.78
22.02
Mean 21.71 20.02 18.01 17.99 18.75
Table 3 : Expense Ratio of selected General Insurance Companies
In this way, it is set apart from the table that as competition expands private segment needed to spend more on
competition, commission and different cost. Sec 40 C of the Insurance Act 1938 likewise sets out the rules in
regard of the management expenses and indicated by this Sec that, expense ought to never surpass 20 percent
of the net premium. The private non-life Insurer appears to break it.
Testing of Hypothesis: One Way ANOVA
Table 4 : Ho1.2: There is no significant difference in expense ratio of selected private Non-life
Insurance Companies in India during the study period.
The ratio of expenses of management as percentage of gross direct premium
Source of Variation SS DF MS FCal. Sig
Between Groups 61.889
4
15.472
4.046
.015
Within Groups
76.483
20
3.824
Total 138.371 24
Table 1.4 identified that p value is 0.015 which is less than 0.05 which suggest that difference in the ratio of
expenses of management to gross direct premium are significant. There are significant differences found in
the expense ratio of selected general insurance companies under the study at 5 % level of significance. The
difference is because of companies like Bajaj Allianz and Tata AIG are spending additional on operating
expenses in comparison to other selected companies. This also shows that private companies are not able to
control their expenses and hence for them profitability decreases.
3. Combined Ratio
Combined ratio, is a proportion of profitability utilized by an insurance agency to demonstrate how well it is
performing in its day by day activities.

323
ISSN No. 2349-7165
UNNAYAN : International Bulletin of Management and EconomicsVolume - X | January 2019
Profitability analysis of Insurance companies: A case of Private Non-life Insurers
Name of the Company
2015-2016 2014-2015 2013-2014 2012-2013 2011-2012 Mean
ICICI Lombard 102.1 101.7 100.7 100.5 117.9 104.5
Bajaj Allianz
94.87
91.17
90.51 91.6
97.45 93.12
Iffco Tokio
98.5
89.5
92.12 93.8
109.8 96.74
HDFC Ergo
94.6
97.5
95.37
91.2
98.7 95.47
Tata AIG
97.3
90.0
88.01
95.3
106.7 95.46
Mean 97.47 93.97 93.34 94.48 106.11
Table 5 : Combined Ratio of selected General Insurance Companies
The ratio of Combined effect of expenses of management and claim incurred
Source of Variation SS DF MS FCal. Sig
Between Groups 386.208
4
96.552
2.531
.073
Within Groups
762.988
20
38.149
Total 1149.195 24
The table 1.6 indicates that differences in the ratio of underwriting result to net written premium are
insignificant as the p value is 0.175. Since the value is more than 0.05 hence there are insignificant differences
in the underwriting result ratio of selected general insurance companies at 5 % level of significance. The
result indicates the similar performance of selected insurance companies from core insurance business.
Except Bajaj Allianz, remaining companies' shows increasing combined ratio thus results in decreasing
underwriting profit. 2011-12 proved to be most significant year, also in this year all selected companies get
upward trend in their combined ratio.
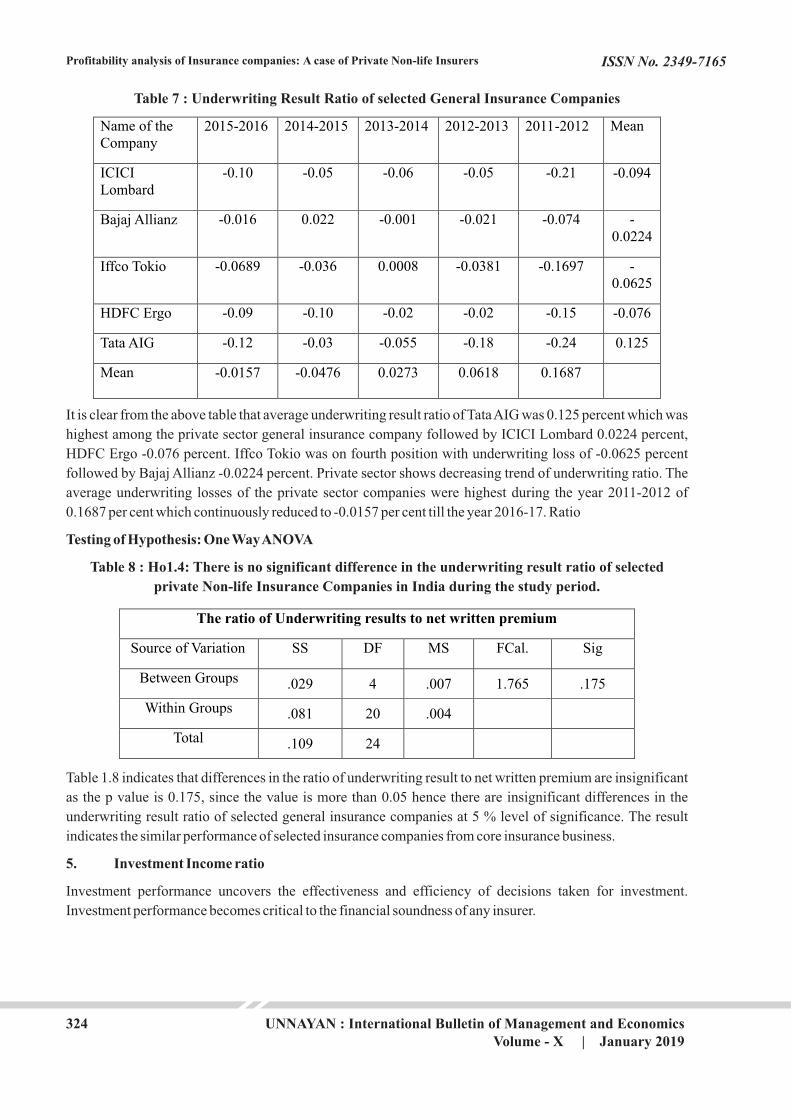
4. Underwriting Result Ratio
The underwriting results specify the execution of an insurance company from central insurance business. The
underwriting results ratio is ascertained by separating underwriting results to net written premium.
ICICI Lombard registered the highest average combined ratio of 104.5 percent followed by Iffco Tokio 96.74
percent. HDFC Ergo is registered fourth position among five private insurance companies with average
combined ratio of 95.47 percent followed by Tata AIG with 95.46 percent. Year-wise, the average combined
ratio of the private sector in the year 2011-12 was 106.11 per cent which reduced to 93.34 per cent in the year
2013-2014. Again, it showed an increasing trend and reached at 97.47 per cent in the year 2015-2016. Above
table indicates that the variation in the combined ratio of the private sector general insurance companies is
higher.
Testing of Hypothesis: One Way ANOVA
Table 6 : Ho1.3: There is no significant difference in the combined ratio of selected private Non-life
Insurance Companies in India during the study period.
324
ISSN No. 2349-7165
UNNAYAN : International Bulletin of Management and EconomicsVolume - X | January 2019
Profitability analysis of Insurance companies: A case of Private Non-life Insurers
Name of the Company
2015-2016 2014-2015 2013-2014 2012-2013 2011-2012 Mean
ICICI Lombard
-0.10
-0.05
-0.06 -0.05
-0.21
-0.094
Bajaj Allianz
-0.016
0.022
-0.001 -0.021
-0.074
-
0.0224
Iffco Tokio
-0.0689
-0.036
0.0008
-0.0381
-0.1697
-0.0625
HDFC Ergo
-0.09
-0.10
-0.02
-0.02
-0.15
-0.076
Tata AIG
-0.12
-0.03
-0.055
-0.18
-0.24
0.125
Mean -0.0157 -0.0476 0.0273 0.0618 0.1687
Table 7 : Underwriting Result Ratio of selected General Insurance Companies
It is clear from the above table that average underwriting result ratio of Tata AIG was 0.125 percent which was
highest among the private sector general insurance company followed by ICICI Lombard 0.0224 percent,
HDFC Ergo -0.076 percent. Iffco Tokio was on fourth position with underwriting loss of -0.0625 percent
followed by Bajaj Allianz -0.0224 percent. Private sector shows decreasing trend of underwriting ratio. The
average underwriting losses of the private sector companies were highest during the year 2011-2012 of
0.1687 per cent which continuously reduced to -0.0157 per cent till the year 2016-17. Ratio
Testing of Hypothesis: One Way ANOVA
Table 8 : Ho1.4: There is no significant difference in the underwriting result ratio of selected
private Non-life Insurance Companies in India during the study period.
The ratio of Underwriting results to net written premium
Source of Variation SS DF MS FCal. Sig
Between Groups .029
4
.007
1.765
.175
Within Groups
.081
20
.004
Total .109 24
Table 1.8 indicates that differences in the ratio of underwriting result to net written premium are insignificant
as the p value is 0.175, since the value is more than 0.05 hence there are insignificant differences in the
underwriting result ratio of selected general insurance companies at 5 % level of significance. The result
indicates the similar performance of selected insurance companies from core insurance business.
5. Investment Income ratio
Investment performance uncovers the effectiveness and efficiency of decisions taken for investment.
Investment performance becomes critical to the financial soundness of any insurer.

325
ISSN No. 2349-7165
UNNAYAN : International Bulletin of Management and EconomicsVolume - X | January 2019
Profitability analysis of Insurance companies: A case of Private Non-life Insurers
Table 9 : Investment Income Ratio of selected General Insurance Companies
Name of the Company
2015-2016 2014-2015 2013-2014 2012-2013 2011-2012 Mean
ICICI Lombard 17.11 17.25 14.65 11.17 7.50 13.53
Bajaj Allianz
10.51
13.22
12.32 11.95
10.78
11.75
Iffco Tokio
12.26
12.01
12.98
12.01
11.35
12.12
HDFC Ergo
13.62
12.63
10.68
9.64
8.33
10.98
Tata AIG
4.14
4.26
4.18
3.68
2.42
3.73
Mean 11.52 11.87 10.96 9.69 8.07
Table 1.9 highlights the investment income to net written premium ratio of the public insurers for the period
2011-12 to 2015-16. The results indicate that the among the private insurers, ICICI Lombard exhibits the
highest average investment income ratio of 13.53 per cent followed by Iffco Tokio 12.12 per cent, Bajaj
Allianz 11.75 per cent, HDFC Ergo 10.98 per cent and Tata AIG 3.73 per cent. Tata AIG has shown the least
average investment income ratio.
Testing of Hypothesis: One Way ANOVA
Table 10 : Ho1.5: There is no significant difference in the Investment Income ratio of selected
private Non-life Insurance Companies in India during the study period.
The ratio of Investment income to net written premium
Source of Variation SS DF MS FCal. Sig
Between Groups 296.902
4
74.226
15.274
.000
Within Groups
97.190
20
4.860
Total 394.092 24
Table 1.10 discloses that differences in the ratio of investment income to net written premium are significant
as the p value is 0.000, since the value is less than 0.05 hence there are significant differences in the
Investment Income ratio of selected general insurance companies at 5 % level of significance. The difference
is due to staggering performance of ICICI Lombard and Iffco Tokio.
6. Net Retention Ratio
Net Retention proportion characterized as net written premium divided by gross-direct premium.

326
ISSN No. 2349-7165
UNNAYAN : International Bulletin of Management and EconomicsVolume - X | January 2019
Profitability analysis of Insurance companies: A case of Private Non-life Insurers
Name of the Company
2015-2016 2014-2015 2013-2014 2012-2013 2011-2012 Mean
ICICI Lombard
67.17
66.30
65.60 67.58
53.91
64.11
Bajaj Allianz
78.39
76.66
83.28 80.05
82.02
80.08
Iffco Tokio
80.16
77.82
69.04
72.48
72.05
74.31
HDFC Ergo
56.16
55.88
60.74
59.98
63.27
59.20
Tata AIG
73.62
72.42
73.30
70.40
79.79
73.90
Mean 71.1 69.81 70.39 70.09 70.20
Table 11 : Net Retention Ratio of selected General Insurance Companies
Table 1.11 presents the Net Retention Ratio of private sector general insurance companies form the years
2011-12 to 2015-16. Among the private insurers, Bajaj Allianz has registered the highest average net
retention ratio of 80.08 percent followed by Iffco Tokio with a percentage of 74.31percent, Tata AIG with a
percentage of 73.90 percent, ICICI Lombard with a percentage of 64.11 percent and HDFC Ergo with a
percentage of 59.20 percent. The year wise trends indicate that, the private insurance company reported an
upward trend .Their average net retention ratio in the year 2011-2012 was 70.20 percent which was decreases
in the year 2014-2015 , 69.81 percent but again increased in the year 2015-2016 with a percentage of 71.1
percent.
Testing of Hypothesis: One Way ANOVA
Table 12 : Ho1.6: There is no significant difference in the Net Retention ratio of selected private
Non-life Insurance Companies in India during the study period.
The ratio of Net written premium to Gross Direct premium
Source of Variation SS DF MS FCal. Sig
Between Groups 296.902
4
74.226
15.274
.000
Within Groups
97.190
20
4.860
Total 394.092 24
Table 1.12 discloses that differences in net written premium to gross direct premium are significant as the p
value is 0.000, p value is less than 0.05 hence it implies significant differences in the Net Retention ratio of
selected general insurance companies at 5 % level of significance. The reason behind the difference is due to
the performance of Bajaj Allianz.
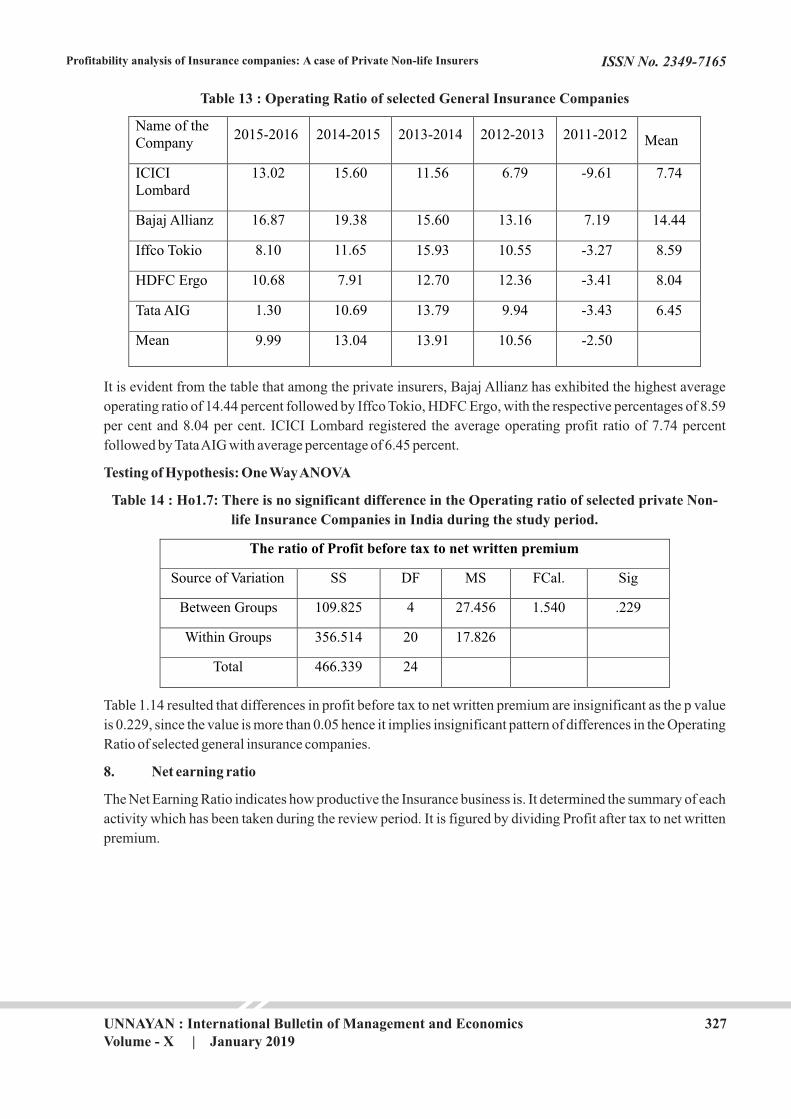
7. Operating Ratio
Operating Ratio characterized as profit before tax divided by net written premium.
327
ISSN No. 2349-7165
UNNAYAN : International Bulletin of Management and EconomicsVolume - X | January 2019
Profitability analysis of Insurance companies: A case of Private Non-life Insurers
Table 13 : Operating Ratio of selected General Insurance Companies
Name of the Company
2015-2016 2014-2015 2013-2014 2012-2013 2011-2012 Mean
ICICI Lombard
13.02 15.60 11.56 6.79 -9.61 7.74
Bajaj Allianz
16.87
19.38
15.60 13.16
7.19
14.44
Iffco Tokio
8.10
11.65
15.93
10.55
-3.27
8.59
HDFC Ergo
10.68
7.91
12.70
12.36
-3.41
8.04
Tata AIG
1.30
10.69
13.79
9.94
-3.43
6.45
Mean 9.99 13.04 13.91 10.56 -2.50
It is evident from the table that among the private insurers, Bajaj Allianz has exhibited the highest average
operating ratio of 14.44 percent followed by Iffco Tokio, HDFC Ergo, with the respective percentages of 8.59
per cent and 8.04 per cent. ICICI Lombard registered the average operating profit ratio of 7.74 percent
followed by Tata AIG with average percentage of 6.45 percent.
Testing of Hypothesis: One Way ANOVA
Table 14 : Ho1.7: There is no significant difference in the Operating ratio of selected private Non-
life Insurance Companies in India during the study period.
The ratio of Profit before tax to net written premium
Source of Variation SS DF MS FCal. Sig
Between Groups
109.825 4
27.456
1.540
.229
Within Groups
356.514
20
17.826
Total 466.339 24
Table 1.14 resulted that differences in profit before tax to net written premium are insignificant as the p value
is 0.229, since the value is more than 0.05 hence it implies insignificant pattern of differences in the Operating
Ratio of selected general insurance companies.
8. Net earning ratio
The Net Earning Ratio indicates how productive the Insurance business is. It determined the summary of each
activity which has been taken during the review period. It is figured by dividing Profit after tax to net written
premium.

328
ISSN No. 2349-7165
UNNAYAN : International Bulletin of Management and EconomicsVolume - X | January 2019
Profitability analysis of Insurance companies: A case of Private Non-life Insurers
Name of the Company
2015-2016 2014-2015 2013-2014 2012-2013 2011-2012 Mean
ICICI Lombard
9.33
12.09
11.36
7.37
-10.13
6.00
Bajaj Allianz
12.33
14.02
10.87
9.21 4.58
10.20
Iffco Tokio
5.64
7.94
10.67
7.24 -2.23
5.85
HDFC Ergo
7.97
5.84
11.06
10.49
-3.41
6.39
Tata AIG
0.91
7.83
9.36
7.00
-2.18
4.58
Mean 7.23 9.54 10.66 8.26 -2.67
Table 15 : Net Earning Ratio of selected General Insurance Companies
Table 1.15 highlights the trends of net earnings ratio (profit after tax to NWP) of the private sector general
insurance companies for the period 2011-12 to 2015-16. Among the public sector insurers, Bajaj Allianz has
showed the highest average net earnings ratio of 10.20 percent followed by HDFC Ergo, and ICICI Lombard
with respective percentage of 6.39percent and 6.00 percent. Iffco Tokio exhibited average net earnings ratio
of 5.85 percent followed by Tata AIG 4.58 percent. All the private insurers have shown operating profit during
all the years under study.
Testing of Hypothesis: One Way ANOVA
Table 16 : Ho1.8: There is no significant difference in the Net earning ratio of selected private Non-
life Insurance Companies in India during the study period.
The ratio of Profit after tax to net written premium.
Source of Variation SS DF MS FCal. Sig
Between Groups
109.825 4
27.456
1.540
.229
Within
Groups
356.514
20
17.826
Total 466.339 24
Table 1.16 demonstrate that differences in profit after tax to net written premium are insignificant because the
p value is 0.113, since the value is more than 0.05 hence it implies insignificant pattern in Net Earnings Ratio
of selected general insurance companies.
10. Return on equity ratio
Return on Equity ratio demonstrates how proficiently the assets of the proprietors have been utilized
(Anthony and Reece, 1995). It determined the return accumulating to owner's capital.
329
ISSN No. 2349-7165
UNNAYAN : International Bulletin of Management and EconomicsVolume - X | January 2019
Profitability analysis of Insurance companies: A case of Private Non-life Insurers
Name of the Company
2015-2016 2014-2015 2013-2014 2012-2013 2011-2012 Mean
ICICI Lombard
15.97
18.97
21.47 17.31
-28.55
9.03
Bajaj Allianz
20.22
25.26
24.57 23.50
12.89
21.28
Iffco Tokio
13.27
18.87
24.39
20.12
-5.94
14.14
HDFC Ergo
14.14
10.40
22.14
21.54
-7.46
12.15
Tata AIG
0.19
18.18
21.91
16.99
-6.36
10.18
Mean 12.57 18.33 22.89 19.89 -7.08
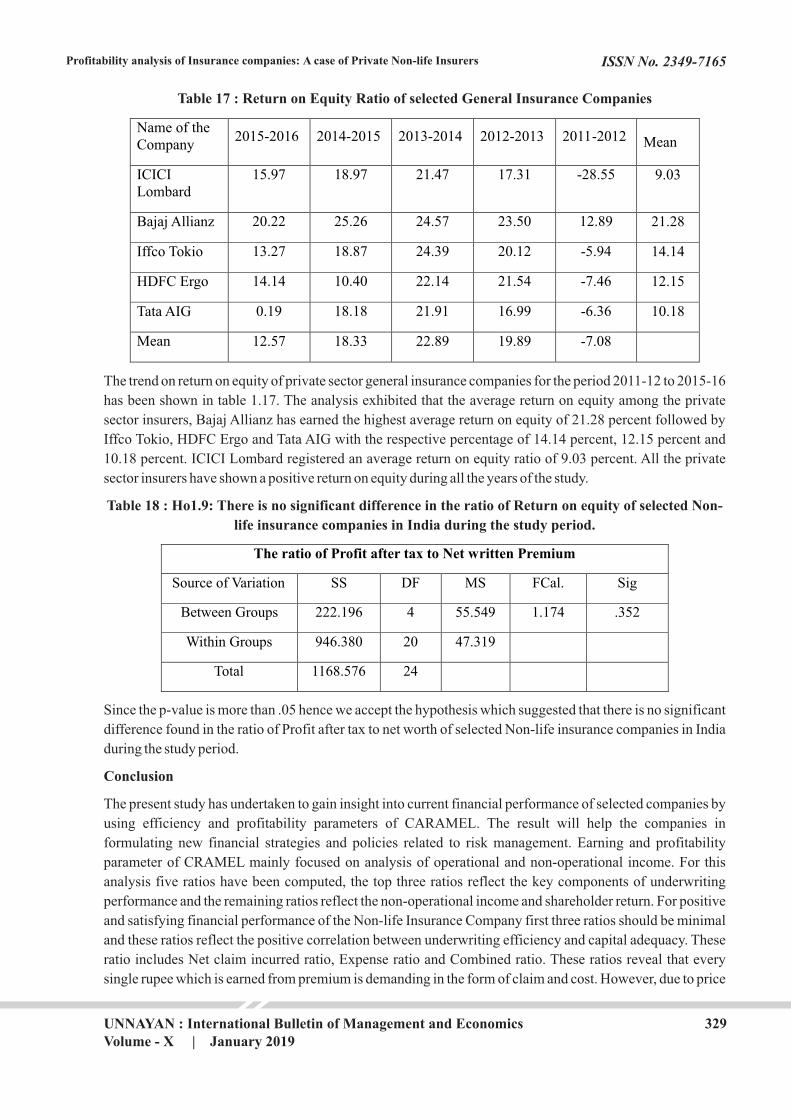
Table 17 : Return on Equity Ratio of selected General Insurance Companies
The trend on return on equity of private sector general insurance companies for the period 2011-12 to 2015-16
has been shown in table 1.17. The analysis exhibited that the average return on equity among the private
sector insurers, Bajaj Allianz has earned the highest average return on equity of 21.28 percent followed by
Iffco Tokio, HDFC Ergo and Tata AIG with the respective percentage of 14.14 percent, 12.15 percent and
10.18 percent. ICICI Lombard registered an average return on equity ratio of 9.03 percent. All the private
sector insurers have shown a positive return on equity during all the years of the study.
Table 18 : Ho1.9: There is no significant difference in the ratio of Return on equity of selected Non-
life insurance companies in India during the study period.
The ratio of Profit after tax to Net written Premium
Source of Variation SS DF MS FCal. Sig
Between Groups
222.196 4
55.549
1.174
.352
Within Groups
946.380
20
47.319
Total 1168.576 24
Since the p-value is more than .05 hence we accept the hypothesis which suggested that there is no significant
difference found in the ratio of Profit after tax to net worth of selected Non-life insurance companies in India
during the study period.
Conclusion
The present study has undertaken to gain insight into current financial performance of selected companies by
using efficiency and profitability parameters of CARAMEL. The result will help the companies in
formulating new financial strategies and policies related to risk management. Earning and profitability
parameter of CRAMEL mainly focused on analysis of operational and non-operational income. For this
analysis five ratios have been computed, the top three ratios reflect the key components of underwriting
performance and the remaining ratios reflect the non-operational income and shareholder return. For positive
and satisfying financial performance of the Non-life Insurance Company first three ratios should be minimal
and these ratios reflect the positive correlation between underwriting efficiency and capital adequacy. These
ratio includes Net claim incurred ratio, Expense ratio and Combined ratio. These ratios reveal that every
single rupee which is earned from premium is demanding in the form of claim and cost. However, due to price
330
ISSN No. 2349-7165
UNNAYAN : International Bulletin of Management and EconomicsVolume - X | January 2019
Profitability analysis of Insurance companies: A case of Private Non-life Insurers
war the profit margin from profitable segments of insurers seems to be decreasing and prevailing bearish
capital market. Therefore, insurers have to take cautions while choosing profitable business otherwise their
funds may get lost.
References
Ÿ Baltelsmit, V.L.; and Bouzouita, R. (1998), "Market Structure and Performance in Private
Passenger Automobile Insurance", The Journal of Risk and Insurance, Vol.65, No.3, Sept., pp. 503-
514.
Ÿ Bodla et al. (2017) Profitability Performance of Life Insurance Companies – A Study in Indian
Context, International Journal of Computing and Business Research, Volume 7 Issue 3
Ÿ Bodla, B.S.; and Verma, S.R. (2007), "Life Insurance Policies in Rural Areas: Understanding Buyer
Behaviour", The ICFAI Journal of Services Marketing, Vol.V, No.4, pp.18-27.
Ÿ Brien, C.O. (2001), "The Performance of Recent Entrants to the UK Life Assurance Market: A
Threat to Established Players?" Insurance Research and Practice, Vol.16, July, pp. 26-39.
Ÿ Chen, R.; and Wong, K.A. (2004), "The Determinants of Financial Health of Asian Insurance
Companies" The Journal of Risk and Insurance, Vol.71, No.3, Sept., pp. 469-499.
Ÿ Dhanda, R.L. (2004), "Divisional Performance Evaluation of LIC Business in North Zone", Finance
India, Vol. XVIII, No. 1, pp. 229-233.
Ÿ Holzheu, T. (2006), "Measuring Underwriting Profitability of the Non-Life Insurance Industry",
Swiss RE Sigma, No.3, pp. 1-31.
Ÿ Hoyt, R.E.; and Powell, L.S. (2006), "Assessing Financial Performance in Medical Professional
Liability Insurance", Journal of Insurance Regulation, pp. 3-13.
Ÿ Kasturi, R. (2006), "Performance Management in Insurance Corporation" Journal of Business
A d m i n i s t r a t i o n O n l i n e , S p r i n g , Vo l . 5 , N o . 1 , p p . 1 3 0 , Av a i l a b l e a t :
http://JBAO.ATU.Edu,Accessed on 10-6-2007.
Ÿ Kaur, N.; and Kapoor, R. (2007), "Profitability Analysis of Public Sector Banks in India", Indian
Management Studies Journal, Vol. 11, pp. 167 181.
Ÿ Lai, G.C.; and Limpaphayom, P. (2003), "Organisational Structure and Performance: Evidence from
the Non-life Insurance Industry in Japan", The Journal of Risk and Insurance, 2003, Vol.70, No.4,
pp.735-757.
Ÿ Norgaard, R.; and Schick, G. (1970), "Profitability in the Property and Liability Insurance Industry",
The Journal of Risk and Insurance, Vol. 37, No. 4, Dec., pp. 579-587.
Ÿ Pal, V.; and Malik, N.S. (2007), "A Multivariate Analysis of the Financial Characteristics of
commercial banks in India" The ICFAI Journal of Bank Management, Vol. V1, No.3, Aug., pp. 29-
42.
Ÿ Rao, D. T. (1998), "Operational Efficiency of Life Insurance Corporation of India", Journal of
Indian School of Political Economy, Vol.10, No. 3, pp. 473-485.
Ÿ Uppal, R.K. (2004), "Profitability Behaviour of Major Banking Groups in the Post-liberalization
and Globalization Era", Indian Management Studies Journal, Vol.8, No.2, pp.107-129.
Ÿ Verma, S. (2000), "Performance Appraisal of the General Insurance Corporation of India", M.Phil.
Thesis, Submitted to Department of Commerce, Delhi School of Economics, University of Delhi,
Delhi.