Embed Size (px)
Citation preview
8/7/2019 Issue #2 F Block
http://slidepdf.com/reader/full/issue-2-f-block 1/5
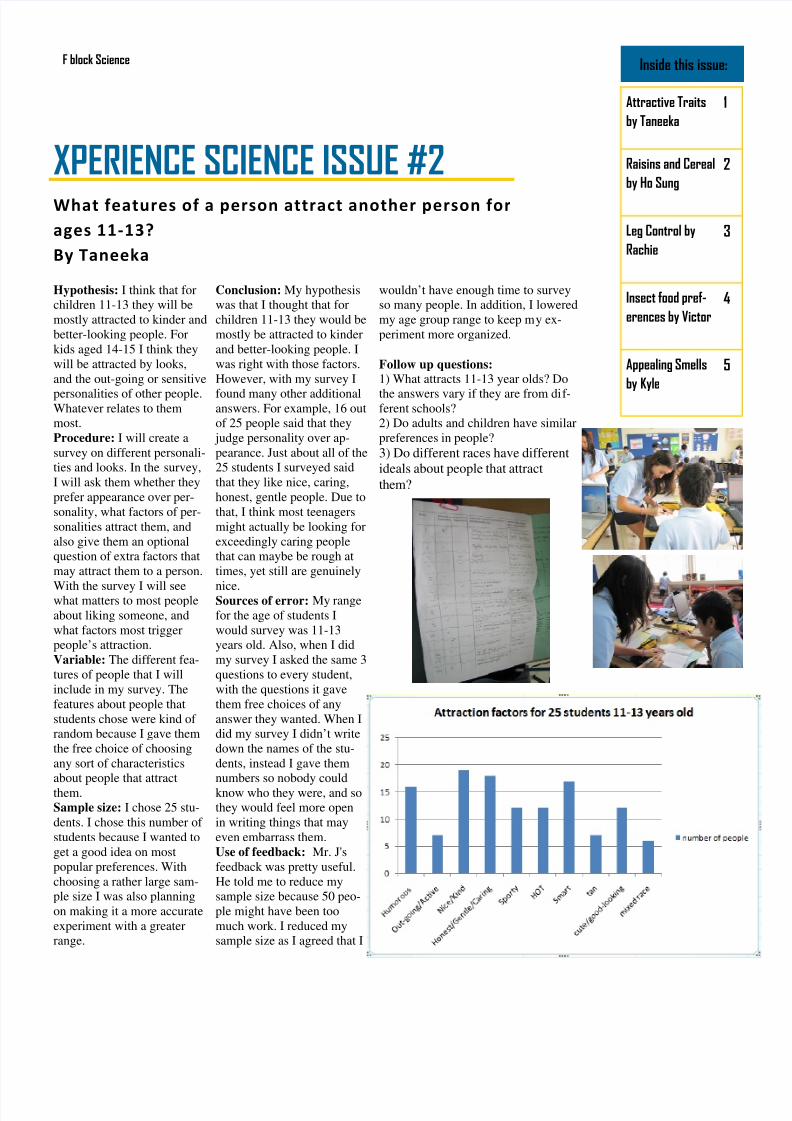
Conclusion: My hypothesis
was that I thought that for
children 11-13 they would be
mostly be attracted to kinder
and better-looking people. I
was right with those factors.
However, with my survey I
found many other additionalanswers. For example, 16 out
of 25 people said that they
judge personality over ap-
pearance. Just about all of the
25 students I surveyed said
that they like nice, caring,
honest, gentle people. Due to
that, I think most teenagers
might actually be looking for
exceedingly caring people
that can maybe be rough at
times, yet still are genuinely
nice.Sources of error: My range
for the age of students I
would survey was 11-13
years old. Also, when I did
my survey I asked the same 3
questions to every student,
with the questions it gave
them free choices of any
answer they wanted. When I
did my survey I didn’t write
down the names of the stu-
dents, instead I gave them
numbers so nobody could
know who they were, and so
they would feel more open
in writing things that may
even embarrass them.
Use of feedback: Mr. J's
feedback was pretty useful.
He told me to reduce my
sample size because 50 peo-
ple might have been too
much work. I reduced my
sample size as I agreed that I
Hypothesis: I think that for
children 11-13 they will be
mostly attracted to kinder and
better-looking people. For
kids aged 14-15 I think they
will be attracted by looks,
and the out-going or sensitive
personalities of other people.Whatever relates to them
most.
Procedure: I will create a
survey on different personali-
ties and looks. In the survey,
I will ask them whether they
prefer appearance over per-
sonality, what factors of per-
sonalities attract them, and
also give them an optional
question of extra factors that
may attract them to a person.
With the survey I will seewhat matters to most people
about liking someone, and
what factors most trigger
people’s attraction.
Variable: The different fea-
tures of people that I will
include in my survey. The
features about people that
students chose were kind of
random because I gave them
the free choice of choosing
any sort of characteristics
about people that attract
them.
Sample size: I chose 25 stu-
dents. I chose this number of
students because I wanted to
get a good idea on most
popular preferences. With
choosing a rather large sam-
ple size I was also planning
on making it a more accurate
experiment with a greater
range.
wouldn’t have enough time to survey
so many people. In addition, I lowered
my age group range to keep my ex-
periment more organized.
Follow up questions: 1) What attracts 11-13 year olds? Do
the answers vary if they are from dif-ferent schools?
2) Do adults and children have similar
preferences in people?
3) Do different races have different
ideals about people that attract
them?
What features of a person attract another person for
ages 11-13?
By Taneeka
XPERIENCE SCIENCE ISSUE #2
Inside this issue:
Attractive Traits
by Taneeka
1
Raisins and Cereal
by Ho Sung
2
Leg Control by
Rachie
3
Insect food pref-
erences by Victor
4
Appealing Smells
by Kyle
5
F block Science
8/7/2019 Issue #2 F Block
http://slidepdf.com/reader/full/issue-2-f-block 2/5
Hypothesis: I think
the Kellogg’s ce-
real has the mostraisons
Procedure: So I
would buy a lot of
cereal from differ-
ent brands in Viet-
nam.
Variable: 5 differ-
ent kinds of cereal.
Sample size: 5 dif-
ferent kinds of
brand
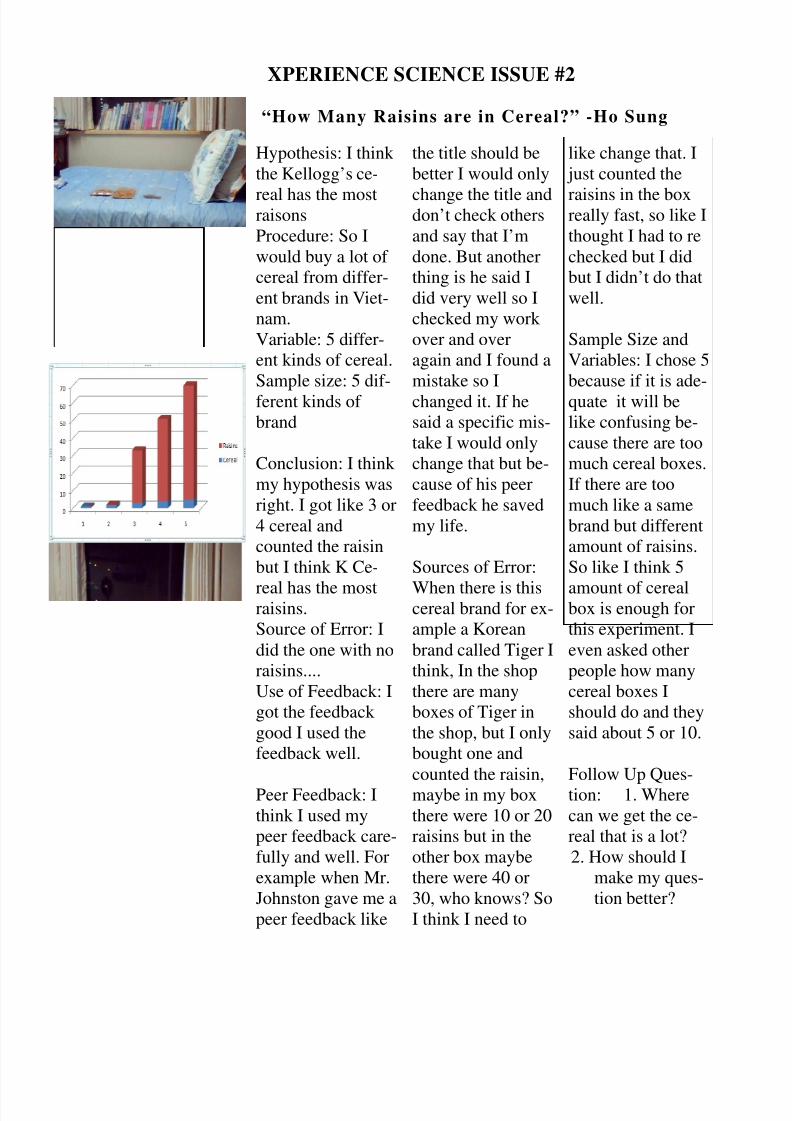
Conclusion: I think
my hypothesis was
right. I got like 3 or
4 cereal and
counted the raisin
but I think K Ce-
real has the mostraisins.
Source of Error: I
did the one with no
raisins....
Use of Feedback: I
got the feedback
good I used the
feedback well.
Peer Feedback: I
think I used my
peer feedback care-
fully and well. For
example when Mr.
Johnston gave me a
peer feedback like
the title should be
better I would only
change the title anddon’t check others
and say that I’m
done. But another
thing is he said I
did very well so I
checked my work
over and over
again and I found a
mistake so I
changed it. If he
said a specific mis-
take I would only
change that but be-
cause of his peer
feedback he saved
my life.
Sources of Error:
When there is thiscereal brand for ex-
ample a Korean
brand called Tiger I
think, In the shop
there are many
boxes of Tiger in
the shop, but I only
bought one and
counted the raisin,
maybe in my box
there were 10 or 20
raisins but in the
other box maybe
there were 40 or
30, who knows? So
I think I need to
like change that. I
just counted the
raisins in the boxreally fast, so like I
thought I had to re
checked but I did
but I didn’t do that
well.
Sample Size and
Variables: I chose 5
because if it is ade-
quate it will be
like confusing be-
cause there are too
much cereal boxes.
If there are too
much like a same
brand but different
amount of raisins.
So like I think 5
amount of cerealbox is enough for
this experiment. I
even asked other
people how many
cereal boxes I
should do and they
said about 5 or 10.
Follow Up Ques-
tion: 1. Where
can we get the ce-
real that is a lot?
2. How should I
make my ques-
tion better?
XPERIENCE SCIENCE ISSUE #2
“How Many Raisins are in Cereal?” -Ho Sung

8/7/2019 Issue #2 F Block
http://slidepdf.com/reader/full/issue-2-f-block 3/5
Hypothesis: I think
people who are lefthanded kick with their
left leg with more con-
trol and accurate andright handed kick with
their right leg better
because people whoare right handed usu-
ally kick with their
right leg better andvice versa.
Procedure: I will use a
soccer ball (the samefor each person) and
take 2 left handed
boys, 2 left handedgirls, 2 right handed
boys and 2 right
handed girls. In a tinyand tight place, the
person would kick the
ball 5 meters apart
where the cone will be
placed with each legand I would measure
the distance as preciseas possible and see
which leg kicks the
farther one.
Variable: boys and
girls in 7th grade that
have equal strength.Sample Size: 2 left
handed boys, 2 lefthanded girls, 2 righthanded girls, 2 right
handed boys. There
are not many lefthanded boys and girls
in ours school. So, I
limited my sample
size.
Feedback: I think Lu-
cas’ feedback did help
because he said thatmy hypothesis needs
to be more detailed
and why I think Ichose that hypothesis.
Conclusion: My hy-pothesis is supported
by my data because
right handed people
kicked the ball fartherwith their right leg,
left handed people
kicked the ball fartherwith their left leg.
Source of Error: Bytrying to make my ex-
periment fair, I tried to
mark the distance as
accurate as possible
because if I make anerror in marking the
distances, there mightbe a mistake in where
the distances the per-
son kicks the ball. I
used the same ball. If Iused a different ball,
there might be more
air in the other ball orless air in it and peo-
ple might be very un-comfortable with an-other ball and I use
people with the same
ball strength and con-trol, mostly people
from the soccer team
or people who can
kick with the same
strength.
Follow Up Questions:
1. If the distance was
longer, would it affect
how the person con-
trols the ball?
2. If I blindfold them,
would it be more ac-
curate or worst?
Page 3
Which leg has the best control? - Rachie
8/7/2019 Issue #2 F Block
http://slidepdf.com/reader/full/issue-2-f-block 4/5
Feedback:THIS IS THE REAL FEEDBACK
Dear Victor Khuong,
This is a very interesting experiment. Although the time that your checking,what I think, needs to be approximately the same. Maybe check the food eachday at the same time you left them. That way you might get a more accurate
result at the end. Also, what type of insects? Usually ants are the ones who goto the food that are left. Overall I think it's good.
THIS IS THE EVALUATION
When I have read the suggestions Michael Hall gave me, I thought thiswas very helpful. When he said about checking the food each day at theSAME time I left it and that it would be more accurate, I thought about it
and found out that maybe this suggestion was really helpful. But I didn’twant to be too specific about the type of insect, because maybe there
would be no ants, but lots of flies. Plus, I might not know what ate or
obtain the food.
Sources of Error:I try making this a fair experiment by keeping all the food in one place,
because if I had some of the food in one place, and the other food inanother place, some food might have less or more results than others and
they wouldn’t be so accurate. I also had checked the food at the sametime I have left the food so it would be more accurate. It was also a useful suggestionfrom Michael Hall. I also wanted to put it in/on somewhere so ALL insects are able toobtain it (on a picnic table outside). I know ants can climb, and flies can fly.
Sample Size and Variables:
Variables
I wanted to keep all the food items at the same place, (see sources of error) that will also
make all the food items at the same climate, because (for example), If I had 2 pieces of meat (exactly the same) one really hot and one not really hot, like frozen, there could bemore ants that like the hot meat more than the cold meat.
Sample SizeI chose to get 2 food items from each food group (including junk food) so I can getmore accurate results. Because (for example) some insects might like steak more thantofu in the meat group. Plus, if they like eating something in the dairy group, doesn’t
mean it likes ALL of the dairy products.
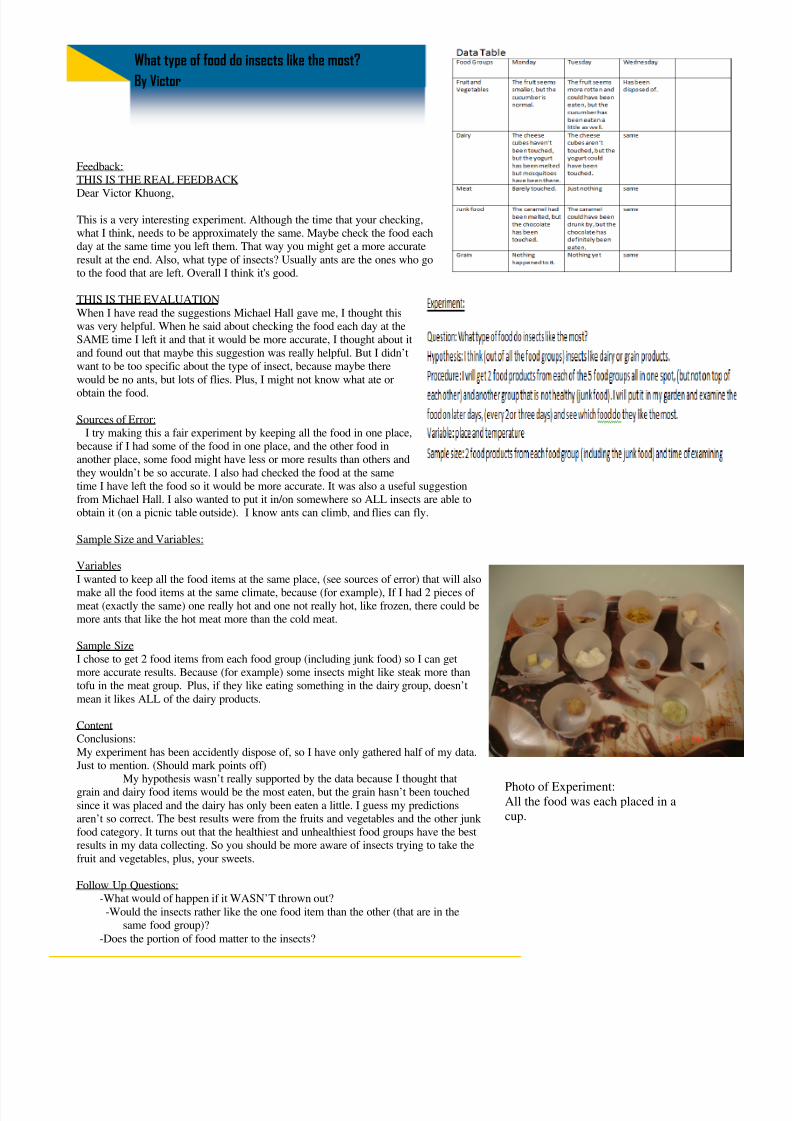
ContentConclusions:
My experiment has been accidently dispose of, so I have only gathered half of my data.Just to mention. (Should mark points off)
My hypothesis wasn’t really supported by the data because I thought thatgrain and dairy food items would be the most eaten, but the grain hasn’t been touched
since it was placed and the dairy has only been eaten a little. I guess my predictionsaren’t so correct. The best results were from the fruits and vegetables and the other junk food category. It turns out that the healthiest and unhealthiest food groups have the bestresults in my data collecting. So you should be more aware of insects trying to take the
fruit and vegetables, plus, your sweets.
Follow Up Questions:-What would of happen if it WASN’T thrown out?
-Would the insects rather like the one food item than the other (that are in thesame food group)?
-Does the portion of food matter to the insects?
What type of food do insects like the most?
By Victor
Photo of Experiment:All the food was each placed in a
cup.
8/7/2019 Issue #2 F Block
http://slidepdf.com/reader/full/issue-2-f-block 5/5
Hypothesis: I
think that the
roses, honey, and
flowers will do
good and the dog
food, garlic, on-
ion, and trash will
do badly.
Procedure: take
one of the samples
and have the peo-
ple smell them.
Variable:
Sample size: One
piece for one per-
son because the
sample might get
infected by other
smells and that is
the reason why I
did that.
Source of Error:
Other smells
could have got on
the samples, and
so that if I squeeze
the sample it will
not change it any
more than the air
changes it. Maybe
the like of smell is
the same because I
did my family and
not people out of
my family so they
might messed up.
I think I should
have done kids
my age because
we like the same
things and havetested older peo-
ple so that the
verities would be
wider
Use of Feedback:
Did not get any
feedback.
Conclusions:
Follow up Ques-
tion:
1.Do there like of
smells or dislike of
smells change
over time?2.What causes the
trigger in the brain
to like smells or to
not like them?
3. Why do some
people like some
smells?
What type of smells do people like? By Kyle
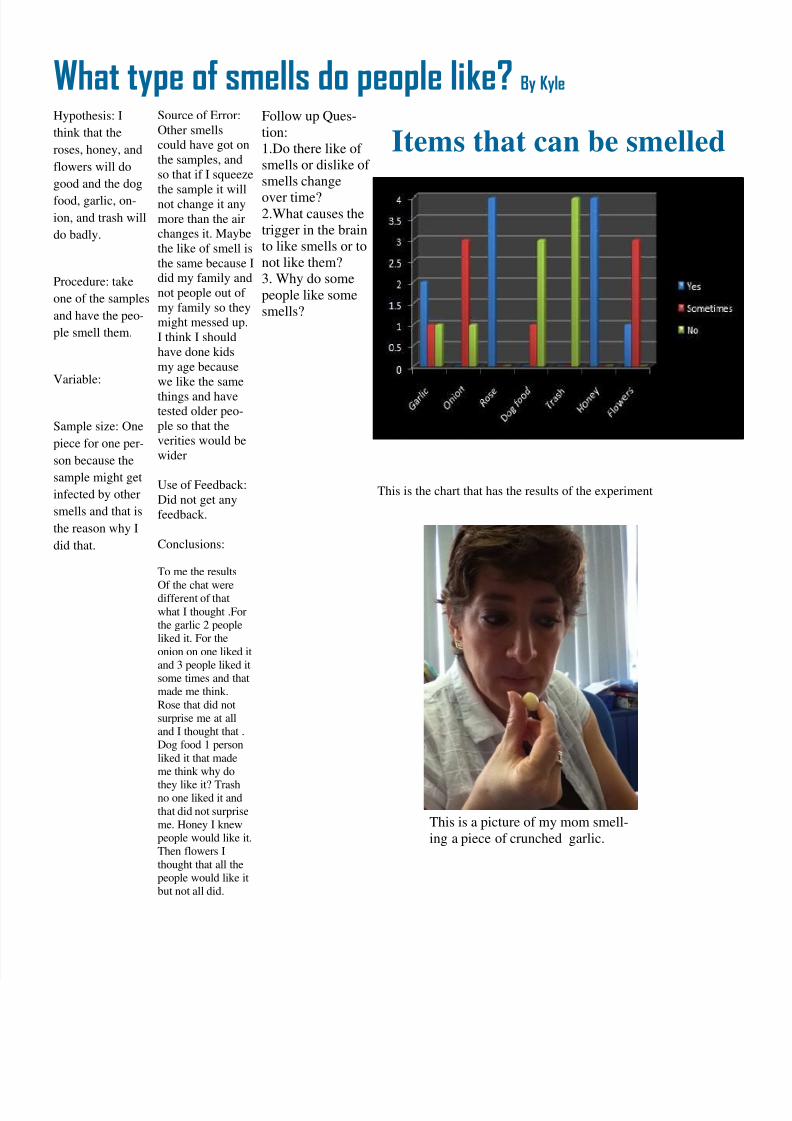
Items that can be smelled
This is the chart that has the results of the experiment
This is a picture of my mom smell-
ing a piece of crunched garlic.
To me the results
Of the chat weredifferent of that
what I thought .Forthe garlic 2 peopleliked it. For the
onion on one liked itand 3 people liked itsome times and thatmade me think.
Rose that did notsurprise me at alland I thought that .Dog food 1 person
liked it that mademe think why do
they like it? Trashno one liked it and
that did not surpriseme. Honey I knewpeople would like it.Then flowers I
thought that all thepeople would like itbut not all did.