Embed Size (px)
Citation preview
ECHO HANDBOOKA GENERAL PRACTITIONER’S GUIDE
ISSUE 8
www.inhealthgroup.com
Dr Raj Sharma, Clinical Lead Cardiologist
ECHOTECHMAKING HEALTHCARE BETTER
2
Echo HandbookA General Practitioner’s GuideISSUE 8
The images and text provided within this handbook are the property ofInHealth Echotech. Any reproduction of the contents without writtenpermission from InHealth Echotech is strictly prohibited.
Produced 2018
3
ForewordThe NHS landscape continues to change with one major direction being the transfer of services from acute trusts to community settings. Community based diagnostic services have formed the vanguard of this ‘shift’. The drivers steering this new direction in service delivery are clinical, political, financial and technological.
Furthermore, transforming the provision of community services is considered to be a top priority for the NHS in terms of improving quality and efficiency. Transforming the care and lives of those with long term conditions and delivering truly integrated, efficient and people-centred community services has the potential to improve the quality of millions of people’s lives. It will also release annual savings of up to £2.7 billion by enabling people to better manage their own conditions, treating them closer to their own homes avoiding unnecessary hospital visits.
With the transfer of commissioning responsibility to CCGs completed there exists enormous scope and flexibility in delivering services which improve local primary care provision. These services should offer greater choice to patients, be integrated, of a high quality and operate efficiently/cost effectively.
Standard adult transthoracic echocardiography (echo) is now well established as being ideally suited to an out-of-hospital setting, where the benefits of prompt, convenient patient-centred access have been clearly demonstrated. Echotech is the UK’s largest and longest established provider of these services.
Alongside the benefits of community echo services, continues the challenge of supporting general practitioners in meaningfully interpreting echocardiography reports, so they are confident in deciding the best path for their patients.
This handbook has been written with the intention of aiding GPs in this area, and thus facilitates the smooth transfer of standard, adult transthoracic echo services into primary care.
2
ContentsIntroduction 3
Referral Criteria 4
Principle 5
M-mode 5
Two-dimensional echocardiography 7
Doppler echocardiography 8
Tissue Doppler Imaging 9
Assessment of Left Ventricular Function 10
Assessment of LV systolic function 10
Assessment of LV diastolic function 13
Assessment of Valvular Disease 15
Aortic Stenosis 15
Aortic Regurgitation 17
Mitral Stenosis 19
Mitral Regurgitation 20
Tricuspid Regurgitation and Estimation of Pulmonary Artery Pressure 22
Left Ventricular Hypertrophy 23
Pericardial Effusion 24
Frequently Asked GP Questions 25
Limitations 28
References 28
Appendix 1 Community Echocardiography Referral Form 29
Appendix 2 Community Echocardiography Report Form 30
Appendix 3 Echotech Reporting Guidelines 31
Appendix 4 Common Echo Abbreviations 42
Notes 44
3
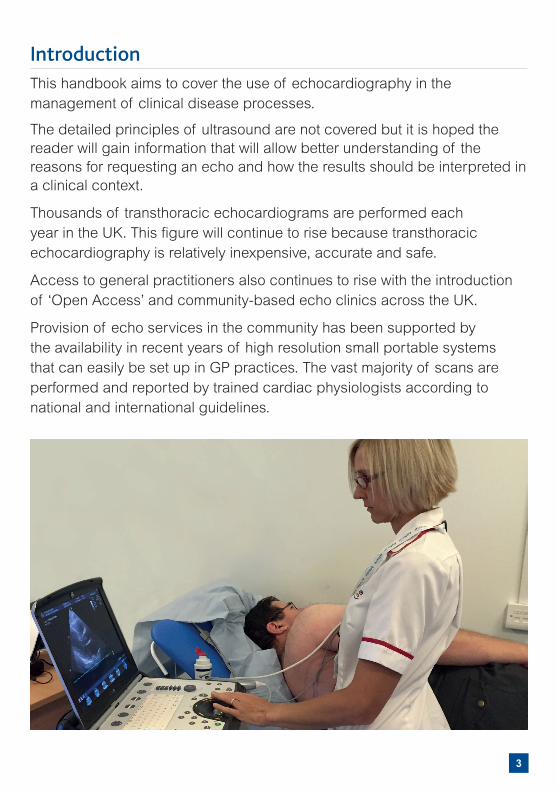
IntroductionThis handbook aims to cover the use of echocardiography in the management of clinical disease processes.
The detailed principles of ultrasound are not covered but it is hoped the reader will gain information that will allow better understanding of the reasons for requesting an echo and how the results should be interpreted in a clinical context.
Thousands of transthoracic echocardiograms are performed each year in the UK. This figure will continue to rise because transthoracic echocardiography is relatively inexpensive, accurate and safe.
Access to general practitioners also continues to rise with the introduction of ‘Open Access’ and community-based echo clinics across the UK.
Provision of echo services in the community has been supported by the availability in recent years of high resolution small portable systems that can easily be set up in GP practices. The vast majority of scans are performed and reported by trained cardiac physiologists according to national and international guidelines.
4
Referral CriteriaPatients may be referred to a community echo service based on any one of the following eight referral criteria2:
Patients with suspected heart failure
1. Suspected CCF based on clinical findings - dyspnoea or peripheral oedema
2. Suspected CCF based on abnormal ECG or abnormal chest X-ray
3. Suspected CCF based on raised BNP or NT pro-BNP
Patients with heart murmur
4. Heart murmur with cardiac symptoms
5. Asymptomatic heart murmur with abnormal ECG or abnormal chest X-ray
6. Known valve disease
Other
7. Suspected cardiomyopathy or left ventricular hypertrophy (LVH) based on clinical findings or abnormal ECG or abnormal chest X-ray
8. Atrial Fibrillation
See Appendix 1 on page 29 of this handbook for an example of a community echo referral form template.
This handbook discusses the role of echocardiography in common referral conditions.
5
PrincipleThe transducer generates ultrasonic waves in pulses that travel through tissue. Most of the sound waves are absorbed or scattered within the body but some are reflected back towards the transducer every time an ultrasound wave crosses interfaces of tissues with different density - typically the junctions between blood, myocardium and heart valves. Frequencies of 2 – 5 MHz are required for routine adult cardiac work.
The transducer is placed on the chest wall at standard positions or acoustic ‘windows’. Standard transthoracic views of the heart include parasternal long axis, parasternal short axis, apical 4, 5 and 2 chamber, apical long axis, subcostal and suprasternal.
Several modes of imaging are recognised. These include:
M-mode
Two-dimensional echo
Doppler echo
Tissue Doppler Imaging (TDI)
M-mode
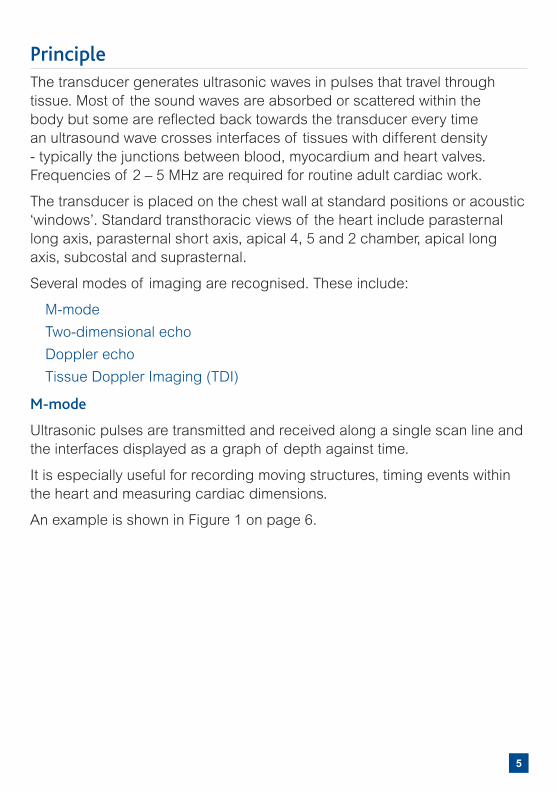
Ultrasonic pulses are transmitted and received along a single scan line and the interfaces displayed as a graph of depth against time.
It is especially useful for recording moving structures, timing events within the heart and measuring cardiac dimensions.
An example is shown in Figure 1 on page 6.
6
1 At the end of systole the mitral valve begins to open
E Maximum excursion of anterior mitral leaflet
2 Initial diastolic closing wave
A Reopening of mitral valve caused by atrial systole
3 Mitral valve closes at onset of ventricular systole
RV Right ventricle
LV Left ventricle
IVS Interventricular septum
LVPW Left ventricular posterior wall
Figure 1 Parasternal long axis M-mode at the level of the mitral valve leaflets.
RV
IVS
LV
LVPW
EA
1 2 3
7
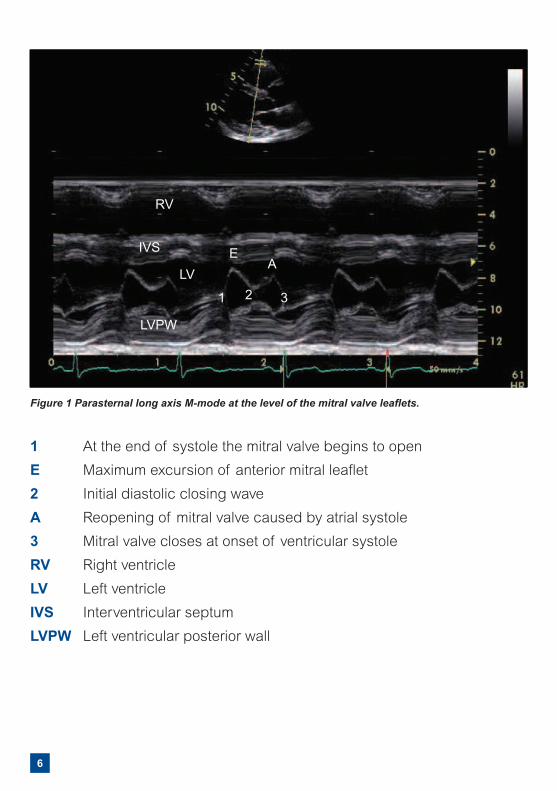
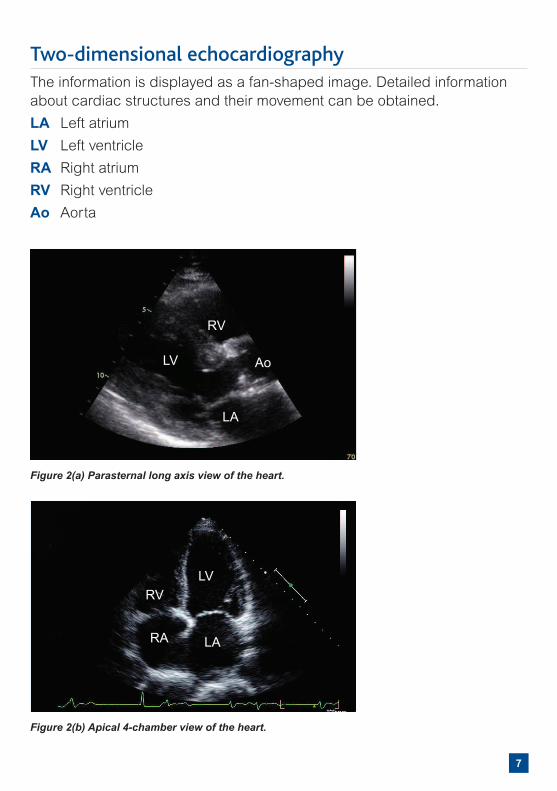
Two-dimensional echocardiographyThe information is displayed as a fan-shaped image. Detailed information about cardiac structures and their movement can be obtained.
LA Left atrium
LV Left ventricle
RA Right atrium
RV Right ventricle
Ao Aorta
Figure 2(a) Parasternal long axis view of the heart.
Figure 2(b) Apical 4-chamber view of the heart.
RV
RV
RA
LV
LV
Ao
LA
LA
8
Doppler echocardiographyVelocity measurements can be derived using the Doppler principle i.e. the frequency shift that occurs between transmitted and reflected ultrasound waves from moving red blood cells. Continuous Wave (CW) and Pulsed Wave (PW) Doppler recordings allow direct velocity measurements within the heart and across valves.
Intracardiac and valvular pressure differences are derived from the measured velocities (v) according to the modified Bernoulli equation: 4v2. An example is shown in Figure 5b (page 16). However, in patients with depressed cardiac function and therefore reduced myocardial blood velocity, valve gradients and stenosis severity may be underestimated with this technique. In this situation, valve area should be calculated.
Colour encoded Doppler velocity (colour flow mapping) displayed on a twodimensional image allows semi-quantitative assessment of valve regurgitation severity. Velocities directed towards the transducer are generally displayed in red and those away in blue. Increasing velocities are displayed as progressively lighter shades.
9
Tissue Doppler ImagingDoppler assessment of myocardial motion was first proposed in 1989.
The principles are the same as for colour flow mapping except high amplitude low velocity filters are used to detect myocardial motion in preference to blood flow. Images are processed in spectral pulsed wave, colour M-mode and colour two-dimensional mode.
Accurate quantification of regional myocardial motion in both systole and diastole, from multiple sites, can be acquired in seconds.
Lack of widespread clinical application is largely because of lack of training and old machines with inadequate frame rates.
10
Assessment of Left Ventricular FunctionThis is the most common reason for requesting an echo. An accurate assessment is therefore essential as it provides the requesting physician not only with a potential cause for symptoms but also important prognostic information.
Assessment of LV systolic function
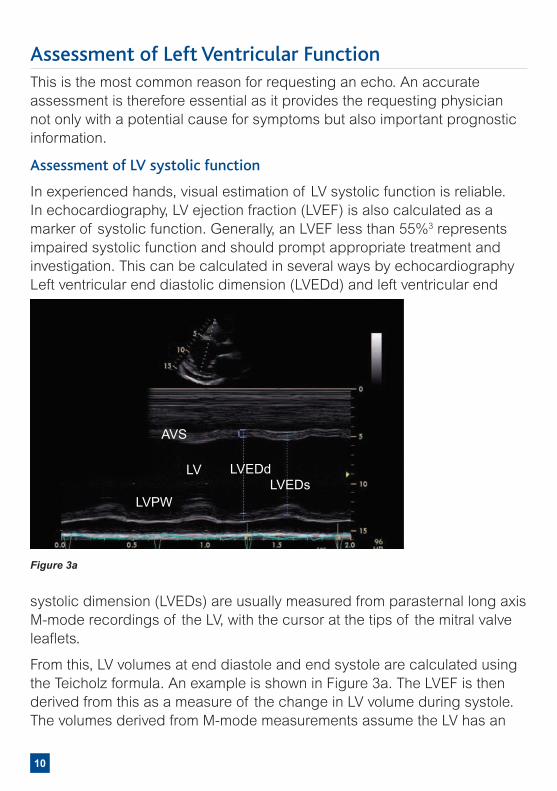
In experienced hands, visual estimation of LV systolic function is reliable. In echocardiography, LV ejection fraction (LVEF) is also calculated as a marker of systolic function. Generally, an LVEF less than 55%3 represents impaired systolic function and should prompt appropriate treatment and investigation. This can be calculated in several ways by echocardiography Left ventricular end diastolic dimension (LVEDd) and left ventricular end
systolic dimension (LVEDs) are usually measured from parasternal long axis M-mode recordings of the LV, with the cursor at the tips of the mitral valve leaflets.
From this, LV volumes at end diastole and end systole are calculated using the Teicholz formula. An example is shown in Figure 3a. The LVEF is then derived from this as a measure of the change in LV volume during systole. The volumes derived from M-mode measurements assume the LV has an
Figure 3a
AVS
LV
LVPW
LVEDdLVEDs
11
ellipsoid shape.
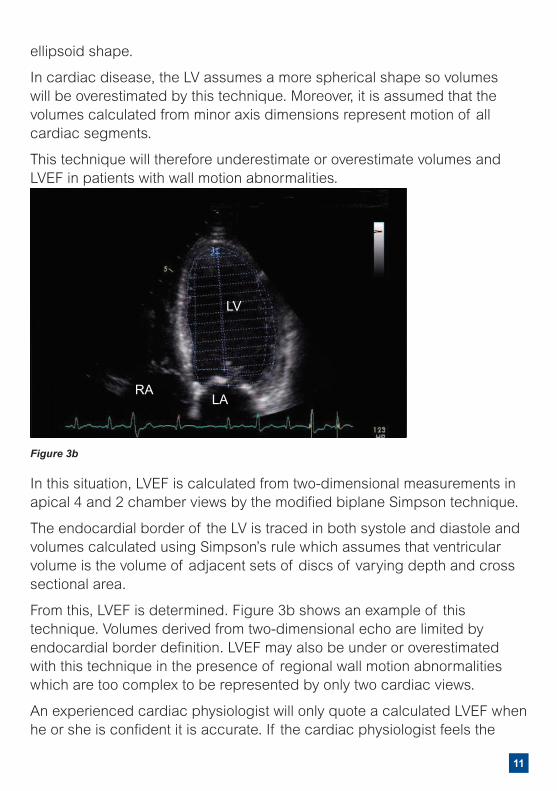
In cardiac disease, the LV assumes a more spherical shape so volumes will be overestimated by this technique. Moreover, it is assumed that the volumes calculated from minor axis dimensions represent motion of all cardiac segments.
This technique will therefore underestimate or overestimate volumes and LVEF in patients with wall motion abnormalities.
In this situation, LVEF is calculated from two-dimensional measurements in apical 4 and 2 chamber views by the modified biplane Simpson technique.
The endocardial border of the LV is traced in both systole and diastole and volumes calculated using Simpson’s rule which assumes that ventricular volume is the volume of adjacent sets of discs of varying depth and cross sectional area.
From this, LVEF is determined. Figure 3b shows an example of this technique. Volumes derived from two-dimensional echo are limited by endocardial border definition. LVEF may also be under or overestimated with this technique in the presence of regional wall motion abnormalities which are too complex to be represented by only two cardiac views.
An experienced cardiac physiologist will only quote a calculated LVEF when he or she is confident it is accurate. If the cardiac physiologist feels the
Figure 3b
LV
RALA
12
calculated LVEF does not truly reflect the LV systolic function, then a visual estimate is detailed in the report.
Despite these limitations, the methods described for LV dimensions and systolic function have widespread clinical and research use and have been validated by many studies.
Wall motion may be described as normal, hypokinetic (<50% normal function), akinetic (absent movement), dyskinetic (movement out of phase with the rest of the ventricle) or aneurysmal.
Global LV systolic dysfunction (LVSD) may be graded as mild, moderate or severe.3
Normal LVSF LVEF ≥ 55%
Mild LVSD LVEF 45 to 54%
Moderate LVSD LVEF 36 to 44%
Severe LVSD LVEF ≤ 35%
13
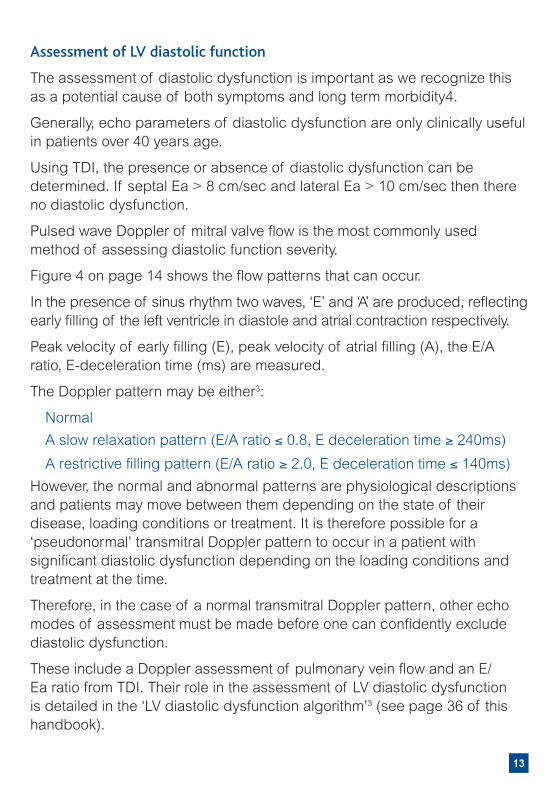
Assessment of LV diastolic function
The assessment of diastolic dysfunction is important as we recognize this as a potential cause of both symptoms and long term morbidity4.
Generally, echo parameters of diastolic dysfunction are only clinically useful in patients over 40 years age.
Using TDI, the presence or absence of diastolic dysfunction can be determined. If septal Ea > 8 cm/sec and lateral Ea > 10 cm/sec then there no diastolic dysfunction.
Pulsed wave Doppler of mitral valve flow is the most commonly used method of assessing diastolic function severity.
Figure 4 on page 14 shows the flow patterns that can occur.
In the presence of sinus rhythm two waves, ‘E’ and ‘A’ are produced, reflecting early filling of the left ventricle in diastole and atrial contraction respectively.
Peak velocity of early filling (E), peak velocity of atrial filling (A), the E/A ratio, E-deceleration time (ms) are measured.
The Doppler pattern may be either3:
Normal
A slow relaxation pattern (E/A ratio ≤ 0.8, E deceleration time ≥ 240ms)
A restrictive filling pattern (E/A ratio ≥ 2.0, E deceleration time ≤ 140ms)
However, the normal and abnormal patterns are physiological descriptions and patients may move between them depending on the state of their disease, loading conditions or treatment. It is therefore possible for a ‘pseudonormal’ transmitral Doppler pattern to occur in a patient with significant diastolic dysfunction depending on the loading conditions and treatment at the time.
Therefore, in the case of a normal transmitral Doppler pattern, other echo modes of assessment must be made before one can confidently exclude diastolic dysfunction.
These include a Doppler assessment of pulmonary vein flow and an E/Ea ratio from TDI. Their role in the assessment of LV diastolic dysfunction is detailed in the ‘LV diastolic dysfunction algorithm’3 (see page 36 of this handbook).
14
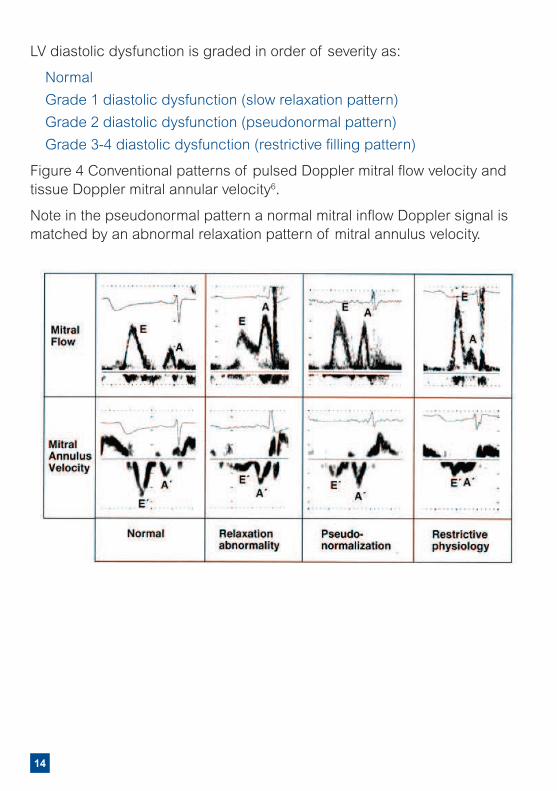
LV diastolic dysfunction is graded in order of severity as:
Normal
Grade 1 diastolic dysfunction (slow relaxation pattern)
Grade 2 diastolic dysfunction (pseudonormal pattern)
Grade 3-4 diastolic dysfunction (restrictive filling pattern)
Figure 4 Conventional patterns of pulsed Doppler mitral flow velocity and tissue Doppler mitral annular velocity6.
Note in the pseudonormal pattern a normal mitral inflow Doppler signal is matched by an abnormal relaxation pattern of mitral annulus velocity.
15
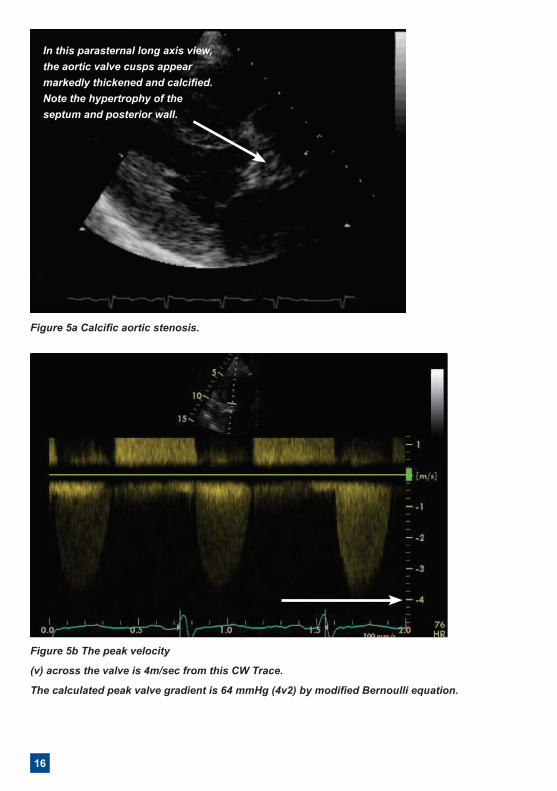
Assessment of Valvular DiseaseAortic Stenosis (AS)
The most common cause of AS in the western world is a calcified, degenerative tricuspid aortic valve. The second commonest cause is a bicuspid aortic valve, the commonest congenital abnormality. The peak pressure difference across the aortic valve can be calculated from the velocity according to the modified Bernoulli equation, 4v2. An example is shown in Figure 5b (page 16). In low flow states, when the velocity is reduced, the gradient will be underestimated so the valve area should be determined.
Echo criteria for severe aortic stenosis include3:
Peak aortic jet velocity > 4 m/s
Peak aortic valve gradient > 64 mmHg
Valve area < 1 cm2
In general, the Bernoulli equation tends to overestimate pressure differences for velocities < 2 m/sec and underestimate for velocities > 5m/sec.
On average, the aortic valve gradient will rise by 5 – 8 mmHg per year. More rapid progression is seen in those with moderate-severe aortic valve calcification, a baseline aortic jet velocity > 3m/sec and coronary artery disease. Drugs do not alter the rate of disease progression. Once patients with severe aortic stenosis develop symptoms, mortality is high without surgery so all patients should be seen by a cardiologist.
For patients with mild or moderate aortic stenosis, annual echocardiography and clinical evaluation are advised.
16
Figure 5a Calcific aortic stenosis.
Figure 5b The peak velocity
(v) across the valve is 4m/sec from this CW Trace.
The calculated peak valve gradient is 64 mmHg (4v2) by modified Bernoulli equation.
In this parasternal long axis view, the aortic valve cusps appear markedly thickened and calcified. Note the hypertrophy of the septum and posterior wall.
17
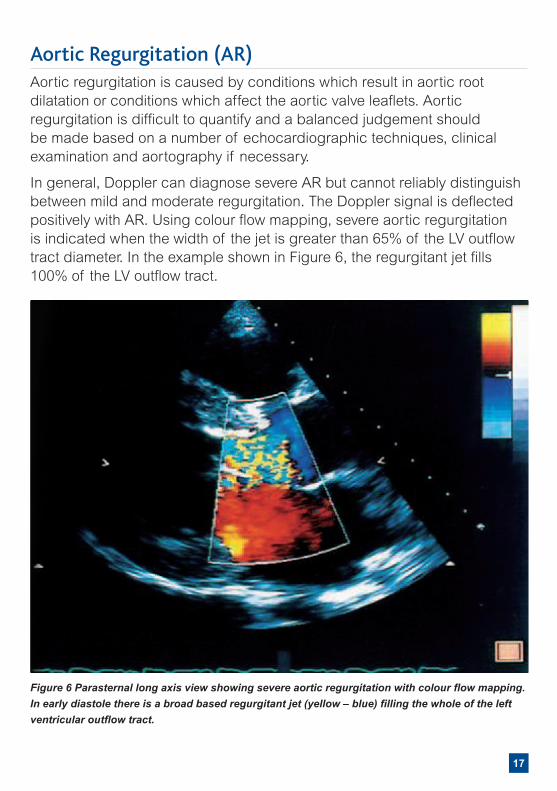
Aortic Regurgitation (AR)Aortic regurgitation is caused by conditions which result in aortic root dilatation or conditions which affect the aortic valve leaflets. Aortic regurgitation is difficult to quantify and a balanced judgement should be made based on a number of echocardiographic techniques, clinical examination and aortography if necessary.
In general, Doppler can diagnose severe AR but cannot reliably distinguish between mild and moderate regurgitation. The Doppler signal is deflected positively with AR. Using colour flow mapping, severe aortic regurgitation is indicated when the width of the jet is greater than 65% of the LV outflow tract diameter. In the example shown in Figure 6, the regurgitant jet fills 100% of the LV outflow tract.
Figure 6 Parasternal long axis view showing severe aortic regurgitation with colour flow mapping. In early diastole there is a broad based regurgitant jet (yellow – blue) filling the whole of the left ventricular outflow tract.
18
When continuous wave Doppler is used, severe AR is associated with a steep deceleration slope (> 3m/sec) and short pressure half time (< 250ms). This represents a rapid fall in the pressure difference across the valve in early diastole with severe regurgitation. Other measures of severe AR include flow reversal of high velocity and long duration in the aortic arch, vena contracta (the narrowest portion of the regurgitant jet) > 0.6cm and effective regurgitant orifice area (EROA) > 0.3cm2.
Surgery for severe AR is recommended even with mild symptoms because delay further worsens prognosis. In asymptomatic patients, surgery is advised before the LVEF falls below 55% and the LVEDs exceeds 4.5cm.
For patients with mild or moderate AR, annual echocardiography and clinical evaluation are advised and referral should be made when the AR becomes severe.
19
Mitral Stenosis (MS)In mitral stenosis there is resistance to diastolic flow. Consequently the left ventricle is small with an enlarged left atrium. The cause is rheumatic heart disease. Stenosis severity is calculated from the continuous wave (CW) Doppler of the mitral valve.
By convention, the time taken for the peak gradient to fall to half its original value (the pressure half time, PHT) is measured.
A pressure half time > 220ms indicates severe MS3
The mitral orifice area is calculated from the formula 220/PHT.
An area < 1.0 cm2 indicates severe MS3
Alternatively, the valve area may be measured directly by planimetry of the mitral orifice in the short axis view. However, reverberation arterfact from calcifications may make accurate tracing of the orifice impossible. Tracing the CW Doppler recording of the mitral valve gives the mean gradient.
A mean gradient > 10 mmHg indicates severe MS3
Mitral valve surgery is indicated for severe MS when symptoms occur as prognosis worsens with symptom severity. Pulmonary hypertension increases surgical mortality by up to four fold. Thus surgery is advised once pulmonary hypertension is detected, irrespective of the presence of symptoms.
Patients with minimal leaflet or subvalvar calcification, no more than mild mitral regurgitation and no evidence of left atrial thrombus, should be considered for percutaneous mitral balloon valvotomy.
For patients with mild or moderate MS, annual echocardiography and clinical evaluation are advised.
20
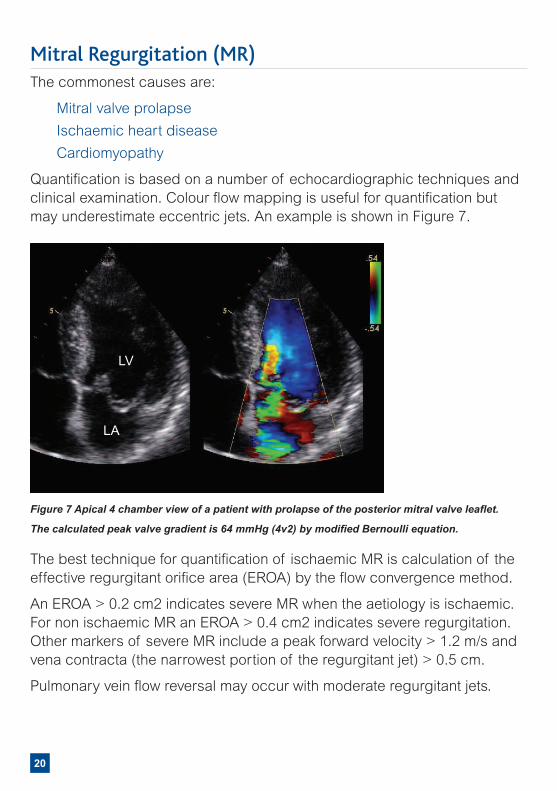
Mitral Regurgitation (MR)The commonest causes are:
Mitral valve prolapse
Ischaemic heart disease
Cardiomyopathy
Quantification is based on a number of echocardiographic techniques and clinical examination. Colour flow mapping is useful for quantification but may underestimate eccentric jets. An example is shown in Figure 7.
The best technique for quantification of ischaemic MR is calculation of the effective regurgitant orifice area (EROA) by the flow convergence method.
An EROA > 0.2 cm2 indicates severe MR when the aetiology is ischaemic. For non ischaemic MR an EROA > 0.4 cm2 indicates severe regurgitation. Other markers of severe MR include a peak forward velocity > 1.2 m/s and vena contracta (the narrowest portion of the regurgitant jet) > 0.5 cm.
Pulmonary vein flow reversal may occur with moderate regurgitant jets.
Figure 7 Apical 4 chamber view of a patient with prolapse of the posterior mitral valve leaflet.
The calculated peak valve gradient is 64 mmHg (4v2) by modified Bernoulli equation.
LA
LV

21
Surgery for severe MR is recommended even with mild symptoms because delay further worsens prognosis.
In asymptomatic patients, surgery is advised before the LVEF falls below 55% and the LVEDs exceeds 4.0cm.
For patients with mild or moderate MR, annual echocardiography and clinical evaluation are advised.
22
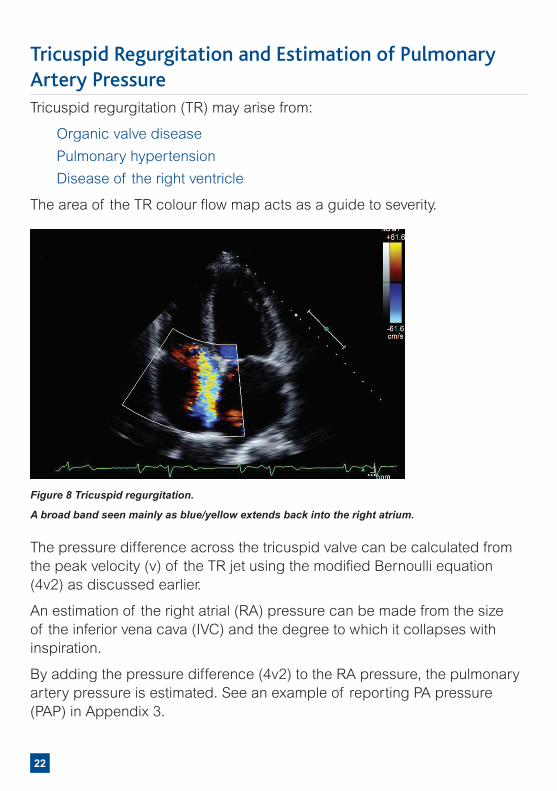
Tricuspid Regurgitation and Estimation of Pulmonary Artery PressureTricuspid regurgitation (TR) may arise from:
Organic valve disease
Pulmonary hypertension
Disease of the right ventricle
The area of the TR colour flow map acts as a guide to severity.
The pressure difference across the tricuspid valve can be calculated from the peak velocity (v) of the TR jet using the modified Bernoulli equation (4v2) as discussed earlier.
An estimation of the right atrial (RA) pressure can be made from the size of the inferior vena cava (IVC) and the degree to which it collapses with inspiration.
By adding the pressure difference (4v2) to the RA pressure, the pulmonary artery pressure is estimated. See an example of reporting PA pressure (PAP) in Appendix 3.
Figure 8 Tricuspid regurgitation.
A broad band seen mainly as blue/yellow extends back into the right atrium.
23
Left Ventricular Hypertrophy
An echocardiogram is often requested if a patient is suspected of having left ventricular hypertrophy (LVH) from an ECG. The hypertrophy may be concentric (involving all left ventricular walls), asymmetric (involving usually the septum, apex or anterior wall only) or apical.
Common causes of LVH include:
Hypertension
Aortic stenosis
Hypertrophic Cardiomyopathy (HCM)
Amyloid and other infiltrative disorders
Athletic heart
From echocardiography, it is very difficult to distinguish between LVH due to hypertension and HCM. A full clinical review is required to make this distinction.
HCM should always be suspected in (often younger) patients with LVH that cannot be explained by a potential primary cause such as hypertension, underlying valve disease, amyloidosis, renal or endocrine disease.
Distinguishing HCM from an athletic heart can be very difficult and may require complex imaging such as contrast echo, stress echo, deformation imaging, three-dimensional echo or cardiac MRI. Such patients should be investigated in a specialist cardiac unit.
24
Pericardial EffusionA pericardial effusion produces an echo free space around the heart. Effusions less than 1 cm are described as small and those greater than 2 cm large.
However, the haemodynamic consequences of an effusion are more important than the size. A rapid accumulation of only 100mls of fluid in the pericardial space may cause more haemodynamic compromise than a gradual accumulation of up to 1L of fluid.
Generally, all patients with a pericardial effusion should be referred for further evaluation. As well as considering the need for drainage of the effusion, these patients should be investigated for an underlying cause, especially malignancy.
25
Frequently Asked Questions
How should I manage a young patient with regional wall motion abnormalities with no previous history of MI?
Whilst patients under 40 often have left ventricular ejection fractions at the lower limit of normal, regional wall motion abnormalities should not occur and should therefore be investigated in the absence of significant valve disease. The commonest conditions causing this feature in the young are cardiomyopathy, myocarditis and coronary artery disease.
At what point should I administer heart failure treatment for a patient with LV systolic dysfunction?
The diagnosis of heart failure is clinical so treatment with diuretics should be administered based on clinical features alone. Echo and BNP support the diagnosis and provide prognostic information. Patients with systolic heart failure benefit from ACE inhibitors, beta blockers and aldosterone antagonists, especially when the LVEF < 35%.
When should diastolic dysfunction be considered significant?
In the community, diastolic dysfunction with preserved LV systolic function is responsible for 40% of all cases of heart failure. Echo is critical for the diagnosis. Generally, patients with echo evidence of preserved left ventricular systolic function and grade 2 or above (moderate or severe) diastolic dysfunction in combination with an elevated BNP or significant left atrial dilatation (> 4.3cm) should be considered as having diastolic heart failure if they have supporting clinical features.
How should I manage grades 2 to 4 LV diastolic dysfunction?
Unfortunately, beta blockers, ACE inhibitors and aldosterone antagonists do not have the same benefits in patients with diastolic heart failure. The main purpose of echo is to establish a diagnosis for the patient. Underlying coronary artery disease should be excluded in these patients.
Should I refer a patient with a PFO?
PFO (patent foramen ovale) occurs in 20% of the population so generally such patients do not need referral. The only exception is young patients with cryptogenic.
26
Frequently Asked QuestionsDo I need to arrange routine repeat echo’s for mild valve disease?
Patients with mild valve disease should have a repeat echo in 2 years to look for disease progression.
Is diastolic dysfunction important in the elderly?
Grade 1 (mild) diastolic dysfunction is extremely common in the elderly and is of little significance. However, the presence of Grade 2 to 4 diastolic dysfunction in conjunction with a dilated left atrium or left ventricular hypertrophy would suggest significant diastolic dysfunction in these patients.
How should I manage a patient with a mildly dilated aortic root and what should the follow up be?
In a young patient with no evidence of hypertension, these patients should be referred to look for an underlying cause. In patients with hypertension, good blood pressure control should be achieved and annual echocardiograms organised to look for disease progression. Once the aortic root is > 4.5cm, the patient should be referred.
If a study is technically difficult and an alternative imaging modality is suggested, which imaging modality should I choose for a patient with suspected heart failure?
There are several possibilities depending on local expertise. These include a contrast echocardiogram, a cardiac MRI, cardiac CT or a MUGA scan.
What should the follow up be for a patient with LVH?
Generally, if the left ventricular hypertrophy (LVH) is unexplained by valve disease or hypertension, a referral should be considered to look for an underlying cause. If the patient has hypertension, a referral should still be considered for symptoms such as chest pain, breathlessness, dizziness or syncope or a family history of sudden death. Hypertrophic cardiomyopathy needs to be excluded.
27
How should I manage a patient with a bicuspid aortic valve?
Patients with moderate or severe disease with symptoms should be referred. Patients with mild disease should have a repeat echo at 2 years. Patients with moderate disease who are asymptomatic should have a repeat echo after 1 year. Always look for the presence of dilatation of the proximal aorta or co arctation of the aorta in these patients.
How should I manage a patient with RV systolic dysfunction?
Patients with RV systolic dysfunction do not benefit from ACE inhibitors, beta blockers or aldosterone antagonists. If there are signs of right heart failure, diuretics should be administered. Referral should be considered to look for an underlying cause. These include arrythmogenic right ventricular complex, intracardiac shunt, underlying respiratory disease, pulmonary embolus and pulmonary hypertension.
I have a patient with 0.5cm global pericardial effusion. Is this significant?
A small pericardial effusion < 0.5 cm seen only in the anterior space is a normal finding. However, any size pericardial effusion that is global should be considered pathological and investigated.
28
LimitationsDue to the way images are acquired by echo, certain patients are technically difficult.
Obese patients: ultrasound is refracted through the fat, image quality is reduced and accurate measurement is made very difficult.
Patients with lung disease: the lungs are less mobile and therefore interfere with the ultrasound.
Immobile patients: if patients are unable to turn onto their left side, imaging is made difficult, as again the lung obstructs the ultrasound.
Only standard adult transthoracic echocardiography services should be provided in the community, therefore the following exclusion criteria applies:
Age less than 18 Known complex congenital heart disease
A congenital disorder in which cardiac disease may be suspected
E.g. Down’s syndrome, Noonan’s syndrome, William’s syndrome
Finally, the quality of echo report provided is highly dependent on the experience and skill level of the Cardiac Physiologist performing the scan.
References1. Our Health, Our Care, Our Say: A New Direction for Community
Services. DH White Paper. January 2006.
2. Echotech referral criteria for community echocardiography.
3. Echotech community echocardiography reporting guidelines (Appendix 3).
4. Mottram P, Marwick T. Assessment of diastolic function: What the general cardiologist needs to know. Heart 2005; 91: 681-695.
5. A minimum dataset for a standard adult transthoracic echocardiogram. BSE Education Committee. October 2005.
6. Sohn DW, et al JACC 1997:30:474-80
7. NHS Next Stage Review Final Report. High Quality Care for All. June 2008. Department of Health.
8. NHS 2010 - 2015: from Good to Great. Preventative, people-centred, productive. December 2009. Department of Health.
9. The Operating Framework for the NHS in England 2011/12. December 2010. Department of Heath.Referral form
29
InHealth Echotech Community Echocardiography Referral Form
Date of referral
Patient Details
NHS number
Title
Name
Telephone
Gender
Date of birth Male Female
Address
Post code
Reason for Referral (Please ensure to select at least ONE)
Patients with suspected heart failure Suspectedheartfailurebasedonclinicalfindings(dyspnoeaorperipheraloedema)
SuspectedheartfailurebasedonabnormalECGorabnormalchestXray
SuspectedheartfailurebasedonraisedBNPorNTproBNP(seelevelsbelow)
Patients with heart murmur Heartmurmurwithcardiacsymptoms
AsymptomaticheartmurmurwithabnormalECGorabnormalchestXray
Knownvalvediseasew
Other SuspectedcardiomyopathyorleftventricularhypertrophybasedonclinicalfindingsorabnormalECGorabnormalchestXray
Atrial Fibrillation
Ifthisechoservicewasn’tavailable,wouldyouhavereferredthispatienttotheAcuteTrust?YesNo
Relevant Past Medical History
MyocardialInfarction AtrialFibrillation Thyroiddisease
Angina Cardiomyopathy Alcohol/Drugabuse
Valvedisease Hypertension ChronicObstructivePulmonaryDisease
Cardiacsurgery Diabetes Other
Other Relevant Information
Relevant Medication (Drug and Dose)
INVESTIGATIONS (where relevant) Date Pleaseentervalues:
12 lead ECG NormalAbnormal(Pleaseattach)
CXR NormalAbnormal(Pleaseattach)
BMI
BP
BNP or NTproBNPNormallevels(BNP<100pg/mlorNTproBNP<400pg/ml)
Raisedlevels-Echowithin6weeks1(BNP100-400pg/mlorNTproBNP400-2000pg/ml)
Highlevels-Echowithin2weeks1(BNP>400pg/mlorNTproBNP>2000pg/ml)
Exclusion critera Agelessthan18years CongenitalHeartDisease
GP Details
GP name
Telephone
Fax
Address
Practice code
Special Requirements
30
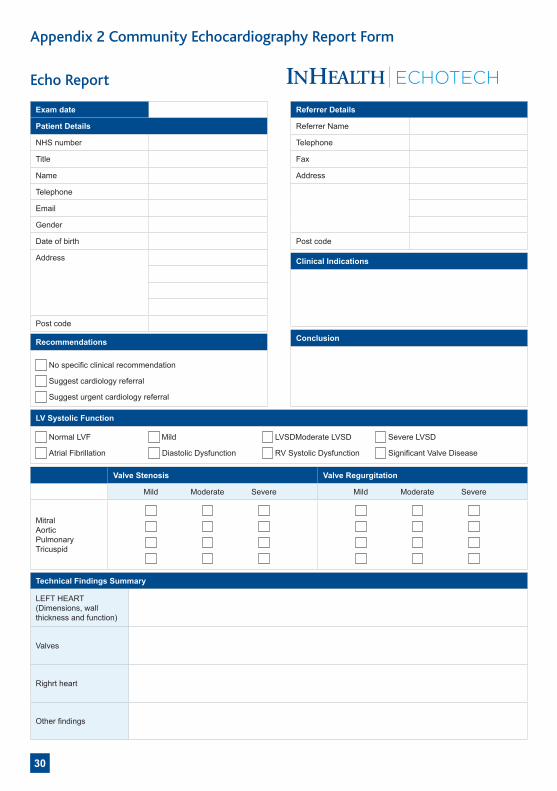
Appendix 2 Community Echocardiography Report Form
Echo Report
Valve Stenosis Valve Regurgitation
Mild Moderate Severe Mild Moderate Severe
Mitral AorticPulmonaryTricuspid
Exam date
Patient Details
NHS number
Title
Name
Telephone
Gender
Date of birth
Address
Post code
Technical Findings Summary
LEFT HEART (Dimensions,wallthicknessandfunction)
Valves
Righrtheart
Otherfindings
Recommendations
Nospecificclinicalrecommendation
Suggestcardiologyreferral
Suggesturgentcardiologyreferral
LV Systolic Function
Normal LVF Mild LVSDModerate LVSD SevereLVSD
Atrial Fibrillation DiastolicDysfunction RVSystolicDysfunction SignificantValveDisease
Referrer Details
Referrer Name
Telephone
Fax
Address
Post code
Clinical Indications
Conclusion
ECHOTECH
31
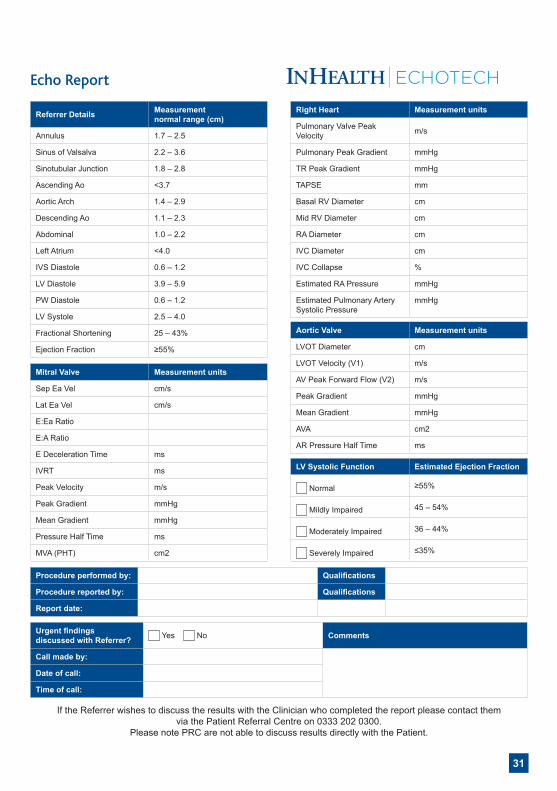
Echo Report
Referrer Details Measurement normal range (cm)
Annulus 1.7 – 2.5
SinusofValsalva 2.2–3.6
Sinotubular Junction 1.8–2.8
AscendingAo <3.7
Aortic Arch 1.4–2.9
DescendingAo 1.1 – 2.3
Abdominal 1.0–2.2
Left Atrium <4.0
IVS Diastole 0.6–1.2
LV Diastole 3.9–5.9
PW Diastole 0.6–1.2
LVSystole 2.5–4.0
FractionalShortening 25–43%
Ejection Fraction ≥55%
Right Heart Measurement units
PulmonaryValvePeakVelocity m/s
PulmonaryPeakGradient mmHg
TRPeakGradient mmHg
TAPSE mm
Basal RV Diameter cm
Mid RV Diameter cm
RA Diameter cm
IVC Diameter cm
IVC Collapse %
Estimated RA Pressure mmHg
EstimatedPulmonaryArterySystolicPressure
mmHg
Aortic Valve Measurement units
LVOTDiameter cm
LVOTVelocity(V1) m/s
AVPeakForwardFlow(V2) m/s
PeakGradient mmHg
Mean Gradient mmHg
AVA cm2
AR Pressure Half Time ms
LV Systolic Function Estimated Ejection Fraction
Normal ≥55%
MildlyImpaired 45–54%
ModeratelyImpaired 36–44%
SeverelyImpaired ≤35%
Mitral Valve Measurement units
Sep Ea Vel cm/s
Lat Ea Vel cm/s
E:EaRatio
E:ARatio
E Deceleration Time ms
IVRT ms
PeakVelocity m/s
PeakGradient mmHg
Mean Gradient mmHg
Pressure Half Time ms
MVA(PHT) cm2
Procedure performed by: Qualifications
Procedure reported by: Qualifications
Report date:
Urgent findings discussed with Referrer? Yes No Comments
Call made by:
Date of call:
Time of call:
ECHOTECH
IftheReferrerwishestodiscusstheresultswiththeClinicianwhocompletedthereportpleasecontactthem viathePatientReferralCentreon03332020300.
PleasenotePRCarenotabletodiscussresultsdirectlywiththePatient.
32
InHealth Echotech Reporting Guidelines Date of issue: Mar 2018 Version: V018 Date for review: Nov 2018 SOP Owner: Cheryl Barton Page 4 of 29
REPORTING GUIDELINES
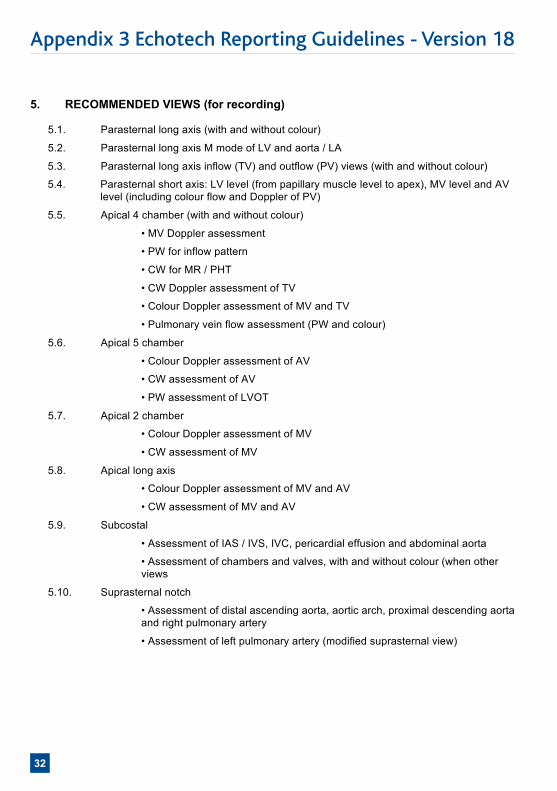
5. RECOMMENDED VIEWS (for recording) 5.1. Parasternal long axis (with and without colour)
5.2. Parasternal long axis M mode of LV and aorta / LA
5.3. Parasternal long axis inflow (TV) and outflow (PV) views (with and without colour)
5.4. Parasternal short axis: LV level (from papillary muscle level to apex), MV level and AV level (including colour flow and Doppler of PV)
5.5. Apical 4 chamber (with and without colour)
• MV Doppler assessment
• PW for inflow pattern
• CW for MR / PHT
• CW Doppler assessment of TV
• Colour Doppler assessment of MV and TV
• Pulmonary vein flow assessment (PW and colour)
5.6. Apical 5 chamber
• Colour Doppler assessment of AV
• CW assessment of AV
• PW assessment of LVOT
5.7. Apical 2 chamber
• Colour Doppler assessment of MV
• CW assessment of MV
5.8. Apical long axis
• Colour Doppler assessment of MV and AV
• CW assessment of MV and AV
5.9. Subcostal
• Assessment of IAS / IVS, IVC, pericardial effusion and abdominal aorta
• Assessment of chambers and valves, with and without colour (when other views
5.10. Suprasternal notch
• Assessment of distal ascending aorta, aortic arch, proximal descending aorta and right pulmonary artery
• Assessment of left pulmonary artery (modified suprasternal view)
Appendix 3 Echotech Reporting Guidelines - Version 18
33
InHealth Echotech Reporting Guidelines Date of issue: Mar 2018 Version: V018 Date for review: Nov 2018 SOP Owner: Cheryl Barton Page 5 of 29
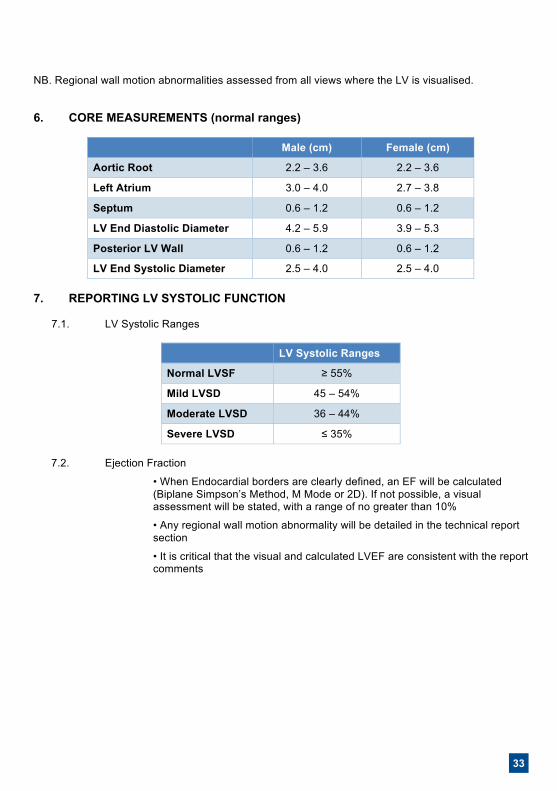
NB. Regional wall motion abnormalities assessed from all views where the LV is visualised.
6. CORE MEASUREMENTS (normal ranges)
Male (cm) Female (cm)
Aortic Root 2.2 – 3.6 2.2 – 3.6
Left Atrium 3.0 – 4.0 2.7 – 3.8
Septum 0.6 – 1.2 0.6 – 1.2
LV End Diastolic Diameter 4.2 – 5.9 3.9 – 5.3
Posterior LV Wall 0.6 – 1.2 0.6 – 1.2
LV End Systolic Diameter 2.5 – 4.0 2.5 – 4.0 7. REPORTING LV SYSTOLIC FUNCTION
7.1. LV Systolic Ranges
LV Systolic Ranges
Normal LVSF ≥ 55%
Mild LVSD 45 – 54%
Moderate LVSD 36 – 44%
Severe LVSD ≤ 35%
7.2. Ejection Fraction
• When Endocardial borders are clearly defined, an EF will be calculated (Biplane Simpson’s Method, M Mode or 2D). If not possible, a visual assessment will be stated, with a range of no greater than 10%
• Any regional wall motion abnormality will be detailed in the technical report section
• It is critical that the visual and calculated LVEF are consistent with the report comments
34
InHealth Echotech Reporting Guidelines Date of issue: Mar 2018 Version: V018 Date for review: Nov 2018 SOP Owner: Cheryl Barton Page 6 of 29
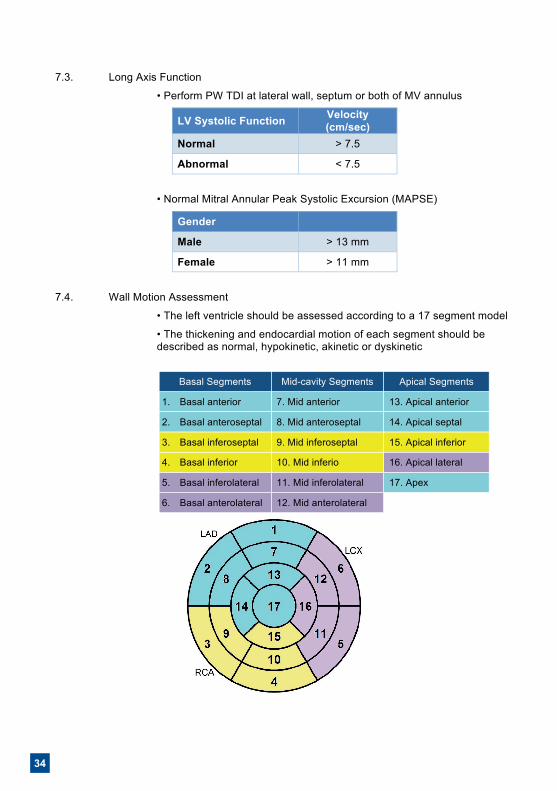
7.3. Long Axis Function
• Perform PW TDI at lateral wall, septum or both of MV annulus
LV Systolic Function Velocity (cm/sec)
Normal > 7.5
Abnormal < 7.5
• Normal Mitral Annular Peak Systolic Excursion (MAPSE)
Gender
Male > 13 mm
Female > 11 mm
7.4. Wall Motion Assessment
• The left ventricle should be assessed according to a 17 segment model
• The thickening and endocardial motion of each segment should be described as normal, hypokinetic, akinetic or dyskinetic
Basal Segments Mid-cavity Segments Apical Segments
1. Basal anterior 7. Mid anterior 13. Apical anterior
2. Basal anteroseptal 8. Mid anteroseptal 14. Apical septal
3. Basal inferoseptal 9. Mid inferoseptal 15. Apical inferior
4. Basal inferior 10. Mid inferio 16. Apical lateral
5. Basal inferolateral 11. Mid inferolateral 17. Apex
6. Basal anterolateral 12. Mid anterolateral
35
InHealth Echotech Reporting Guidelines Date of issue: Mar 2018 Version: V018 Date for review: Nov 2018 SOP Owner: Cheryl Barton Page 7 of 29
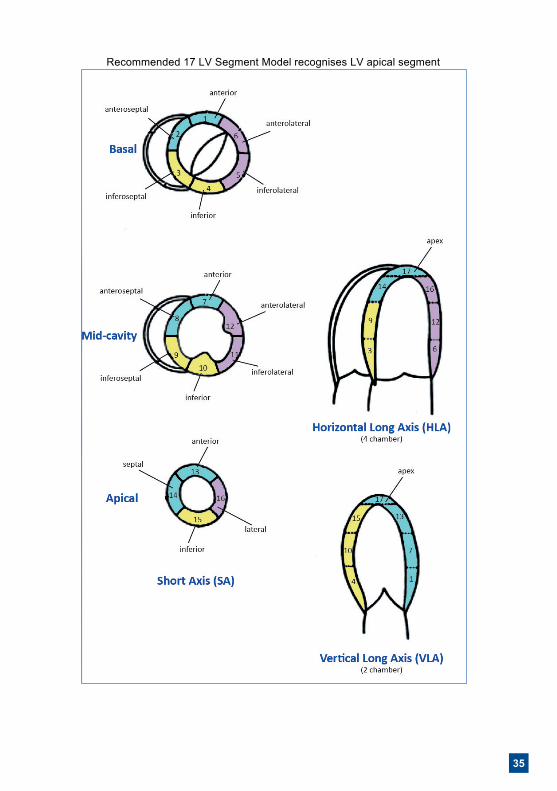
Recommended 17 LV Segment Model recognises LV apical segment
InHealth Echotech Reporting Guidelines Date of issue: Mar 2018 Version: V018 Date for review: Nov 2018 SOP Owner: Cheryl Barton Page 6 of 29
7.3. Long Axis Function
• Perform PW TDI at lateral wall, septum or both of MV annulus
LV Systolic Function Velocity (cm/sec)
Normal > 7.5
Abnormal < 7.5
• Normal Mitral Annular Peak Systolic Excursion (MAPSE)
Gender
Male > 13 mm
Female > 11 mm
7.4. Wall Motion Assessment
• The left ventricle should be assessed according to a 17 segment model
• The thickening and endocardial motion of each segment should be described as normal, hypokinetic, akinetic or dyskinetic
Basal Segments Mid-cavity Segments Apical Segments
1. Basal anterior 7. Mid anterior 13. Apical anterior
2. Basal anteroseptal 8. Mid anteroseptal 14. Apical septal
3. Basal inferoseptal 9. Mid inferoseptal 15. Apical inferior
4. Basal inferior 10. Mid inferio 16. Apical lateral
5. Basal inferolateral 11. Mid inferolateral 17. Apex
6. Basal anterolateral 12. Mid anterolateral
36
InHealth Echotech Reporting Guidelines Date of issue: Mar 2018 Version: V018 Date for review: Nov 2018 SOP Owner: Cheryl Barton Page 8 of 29
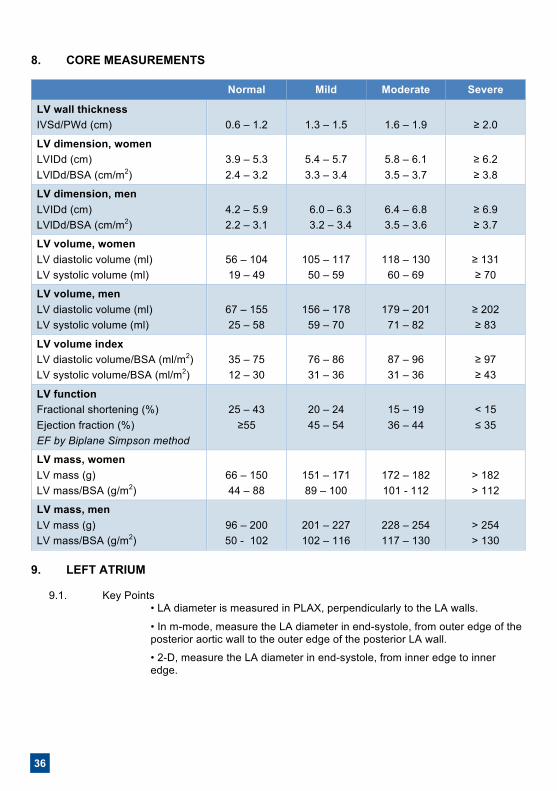
8. CORE MEASUREMENTS
Normal Mild Moderate Severe
LV wall thickness IVSd/PWd (cm)
0.6 – 1.2
1.3 – 1.5
1.6 – 1.9
≥ 2.0
LV dimension, women LVIDd (cm) LVlDd/BSA (cm/m2)
3.9 – 5.3 2.4 – 3.2
5.4 – 5.7 3.3 – 3.4
5.8 – 6.1 3.5 – 3.7
≥ 6.2 ≥ 3.8
LV dimension, men LVIDd (cm) LVlDd/BSA (cm/m2)
4.2 – 5.9 2.2 – 3.1
6.0 – 6.3 3.2 – 3.4
6.4 – 6.8 3.5 – 3.6
≥ 6.9 ≥ 3.7
LV volume, women LV diastolic volume (ml) LV systolic volume (ml)
56 – 104 19 – 49
105 – 117
50 – 59
118 – 130
60 – 69
≥ 131 ≥ 70
LV volume, men LV diastolic volume (ml) LV systolic volume (ml)
67 – 155 25 – 58
156 – 178
59 – 70
179 – 201
71 – 82
≥ 202 ≥ 83
LV volume index LV diastolic volume/BSA (ml/m2) LV systolic volume/BSA (ml/m2)
35 – 75 12 – 30
76 – 86 31 – 36
87 – 96 31 – 36
≥ 97 ≥ 43
LV function Fractional shortening (%) Ejection fraction (%) EF by Biplane Simpson method
25 – 43
≥55
20 – 24 45 – 54
15 – 19 36 – 44
< 15 ≤ 35
LV mass, women LV mass (g) LV mass/BSA (g/m2)
66 – 150 44 – 88
151 – 171 89 – 100
172 – 182 101 - 112
> 182 > 112
LV mass, men LV mass (g) LV mass/BSA (g/m2)
96 – 200 50 - 102
201 – 227 102 – 116
228 – 254 117 – 130
> 254 > 130
9. LEFT ATRIUM
9.1. Key Points
• LA diameter is measured in PLAX, perpendicularly to the LA walls.
• In m-mode, measure the LA diameter in end-systole, from outer edge of the posterior aortic wall to the outer edge of the posterior LA wall.
• 2-D, measure the LA diameter in end-systole, from inner edge to inner edge.
37
InHealth Echotech Reporting Guidelines Date of issue: Mar 2018 Version: V018 Date for review: Nov 2018 SOP Owner: Cheryl Barton Page 8 of 29
8. CORE MEASUREMENTS
Normal Mild Moderate Severe
LV wall thickness IVSd/PWd (cm)
0.6 – 1.2
1.3 – 1.5
1.6 – 1.9
≥ 2.0
LV dimension, women LVIDd (cm) LVlDd/BSA (cm/m2)
3.9 – 5.3 2.4 – 3.2
5.4 – 5.7 3.3 – 3.4
5.8 – 6.1 3.5 – 3.7
≥ 6.2 ≥ 3.8
LV dimension, men LVIDd (cm) LVlDd/BSA (cm/m2)
4.2 – 5.9 2.2 – 3.1
6.0 – 6.3 3.2 – 3.4
6.4 – 6.8 3.5 – 3.6
≥ 6.9 ≥ 3.7
LV volume, women LV diastolic volume (ml) LV systolic volume (ml)
56 – 104 19 – 49
105 – 117
50 – 59
118 – 130
60 – 69
≥ 131 ≥ 70
LV volume, men LV diastolic volume (ml) LV systolic volume (ml)
67 – 155 25 – 58
156 – 178
59 – 70
179 – 201
71 – 82
≥ 202 ≥ 83
LV volume index LV diastolic volume/BSA (ml/m2) LV systolic volume/BSA (ml/m2)
35 – 75 12 – 30
76 – 86 31 – 36
87 – 96 31 – 36
≥ 97 ≥ 43
LV function Fractional shortening (%) Ejection fraction (%) EF by Biplane Simpson method
25 – 43
≥55
20 – 24 45 – 54
15 – 19 36 – 44
< 15 ≤ 35
LV mass, women LV mass (g) LV mass/BSA (g/m2)
66 – 150 44 – 88
151 – 171 89 – 100
172 – 182 101 - 112
> 182 > 112
LV mass, men LV mass (g) LV mass/BSA (g/m2)
96 – 200 50 - 102
201 – 227 102 – 116
228 – 254 117 – 130
> 254 > 130
9. LEFT ATRIUM
9.1. Key Points
• LA diameter is measured in PLAX, perpendicularly to the LA walls.
• In m-mode, measure the LA diameter in end-systole, from outer edge of the posterior aortic wall to the outer edge of the posterior LA wall.
• 2-D, measure the LA diameter in end-systole, from inner edge to inner edge.
InHealth Echotech Reporting Guidelines Date of issue: Mar 2018 Version: V018 Date for review: Nov 2018 SOP Owner: Cheryl Barton Page 9 of 29
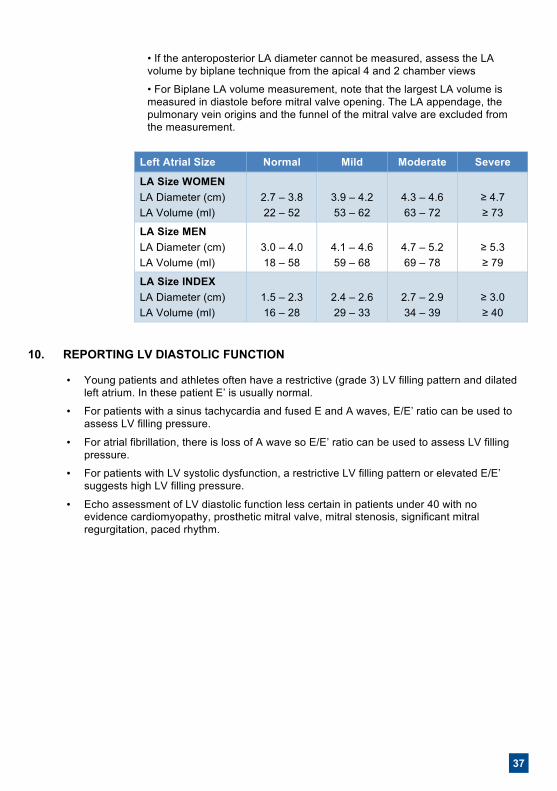
• If the anteroposterior LA diameter cannot be measured, assess the LA volume by biplane technique from the apical 4 and 2 chamber views
• For Biplane LA volume measurement, note that the largest LA volume is measured in diastole before mitral valve opening. The LA appendage, the pulmonary vein origins and the funnel of the mitral valve are excluded from the measurement.
Left Atrial Size Normal Mild Moderate Severe
LA Size WOMEN LA Diameter (cm) LA Volume (ml)
2.7 – 3.8 22 – 52
3.9 – 4.2 53 – 62
4.3 – 4.6 63 – 72
≥ 4.7 ≥ 73
LA Size MEN LA Diameter (cm) LA Volume (ml)
3.0 – 4.0 18 – 58
4.1 – 4.6 59 – 68
4.7 – 5.2 69 – 78
≥ 5.3 ≥ 79
LA Size INDEX LA Diameter (cm) LA Volume (ml)
1.5 – 2.3 16 – 28
2.4 – 2.6 29 – 33
2.7 – 2.9 34 – 39
≥ 3.0 ≥ 40
10. REPORTING LV DIASTOLIC FUNCTION
• Young patients and athletes often have a restrictive (grade 3) LV filling pattern and dilated left atrium. In these patient E’ is usually normal.
• For patients with a sinus tachycardia and fused E and A waves, E/E’ ratio can be used to assess LV filling pressure.
• For atrial fibrillation, there is loss of A wave so E/E’ ratio can be used to assess LV filling pressure.
• For patients with LV systolic dysfunction, a restrictive LV filling pattern or elevated E/E’ suggests high LV filling pressure.
• Echo assessment of LV diastolic function less certain in patients under 40 with no evidence cardiomyopathy, prosthetic mitral valve, mitral stenosis, significant mitral regurgitation, paced rhythm.
38
InHealth Echotech Reporting Guidelines Date of issue: Mar 2018 Version: V018 Date for review: Nov 2018 SOP Owner: Cheryl Barton Page 10 of 29
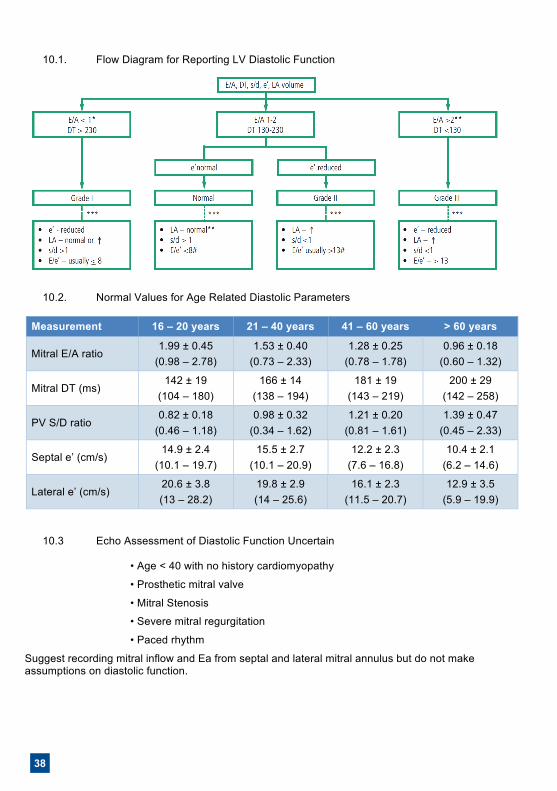
10.1. Flow Diagram for Reporting LV Diastolic Function
10.2. Normal Values for Age Related Diastolic Parameters
Measurement 16 – 20 years 21 – 40 years 41 – 60 years > 60 years
Mitral E/A ratio 1.99 ± 0.45
(0.98 – 2.78) 1.53 ± 0.40
(0.73 – 2.33) 1.28 ± 0.25
(0.78 – 1.78) 0.96 ± 0.18
(0.60 – 1.32)
Mitral DT (ms) 142 ± 19
(104 – 180) 166 ± 14
(138 – 194) 181 ± 19
(143 – 219) 200 ± 29
(142 – 258)
PV S/D ratio 0.82 ± 0.18
(0.46 – 1.18) 0.98 ± 0.32
(0.34 – 1.62) 1.21 ± 0.20
(0.81 – 1.61) 1.39 ± 0.47
(0.45 – 2.33)
Septal e’ (cm/s) 14.9 ± 2.4
(10.1 – 19.7) 15.5 ± 2.7
(10.1 – 20.9) 12.2 ± 2.3
(7.6 – 16.8) 10.4 ± 2.1
(6.2 – 14.6)
Lateral e’ (cm/s) 20.6 ± 3.8 (13 – 28.2)
19.8 ± 2.9 (14 – 25.6)
16.1 ± 2.3 (11.5 – 20.7)
12.9 ± 3.5 (5.9 – 19.9)
10.3 Echo Assessment of Diastolic Function Uncertain
• Age < 40 with no history cardiomyopathy
• Prosthetic mitral valve
• Mitral Stenosis
• Severe mitral regurgitation
• Paced rhythm
Suggest recording mitral inflow and Ea from septal and lateral mitral annulus but do not make assumptions on diastolic function.
39
InHealth Echotech Reporting Guidelines Date of issue: Mar 2018 Version: V018 Date for review: Nov 2018 SOP Owner: Cheryl Barton Page 10 of 29
10.1. Flow Diagram for Reporting LV Diastolic Function
10.2. Normal Values for Age Related Diastolic Parameters
Measurement 16 – 20 years 21 – 40 years 41 – 60 years > 60 years
Mitral E/A ratio 1.99 ± 0.45
(0.98 – 2.78) 1.53 ± 0.40
(0.73 – 2.33) 1.28 ± 0.25
(0.78 – 1.78) 0.96 ± 0.18
(0.60 – 1.32)
Mitral DT (ms) 142 ± 19
(104 – 180) 166 ± 14
(138 – 194) 181 ± 19
(143 – 219) 200 ± 29
(142 – 258)
PV S/D ratio 0.82 ± 0.18
(0.46 – 1.18) 0.98 ± 0.32
(0.34 – 1.62) 1.21 ± 0.20
(0.81 – 1.61) 1.39 ± 0.47
(0.45 – 2.33)
Septal e’ (cm/s) 14.9 ± 2.4
(10.1 – 19.7) 15.5 ± 2.7
(10.1 – 20.9) 12.2 ± 2.3
(7.6 – 16.8) 10.4 ± 2.1
(6.2 – 14.6)
Lateral e’ (cm/s) 20.6 ± 3.8 (13 – 28.2)
19.8 ± 2.9 (14 – 25.6)
16.1 ± 2.3 (11.5 – 20.7)
12.9 ± 3.5 (5.9 – 19.9)
10.3 Echo Assessment of Diastolic Function Uncertain
• Age < 40 with no history cardiomyopathy
• Prosthetic mitral valve
• Mitral Stenosis
• Severe mitral regurgitation
• Paced rhythm
Suggest recording mitral inflow and Ea from septal and lateral mitral annulus but do not make assumptions on diastolic function.
InHealth Echotech Reporting Guidelines Date of issue: Mar 2018 Version: V018 Date for review: Nov 2018 SOP Owner: Cheryl Barton Page 11 of 29
11. VALVE ASSESSMENT 11.1. Mitral Stenosis
• The aetiology will be rheumatic valve disease in 99% of cases.
• Comment on leaflet thickening, calcification and mobility, commissural fusion and subvalvar thickening.
• Stenosis severity is based on several parameters.
• Planimetry of the mitral valve is limited by ‘blooming’ due to calcifications and inability to trace the valve area at the level of the leaflet tips.
• Mean mitral valve gradient depends on flow rate so will be artificially high in high cardiac output states (e.g. pregnancy) and low in low output states (e.g. poor LV systolic function).
• Pressure half time assumes stable left ventricular and left atrial compliance and requires linear diastolic flow.
Measurement Mild Moderate Severe
PHT (ms) 60 – 120 121 – 220 > 220
MV area (cm2) > 1.5 1.0 – 1.5 < 1.0
Mean MV gradient (mmHg) < 5 6 – 9 > 10
11.2. Mitral Regurgitation
• The aetiology is either due to intrinsic mitral valve disease (mitral valve prolapse or rheumatic valve disease) or functional (ischaemic heart disease or heart failure)
• For mitral valve prolapse always comment on mitral leaflet size, thickening and motion as well as annular size. Document if any ruptured chordae seen and if leaflet flail. Try to localise the prolapsing mitral valve scallop.
• For functional mitral regurgitation always comment on mitral annular size and measure the maximal tethering distance in the apical 4 chamber view at end systole.
• If there is mitral regurgitation with apparent normal mitral valve morphology and no evidence of annular dilatation or leaflet tenting please state ‘mechanism of mitral regurgitation not clear’.
• Mitral regurgitation severity assessment can be difficult and is based on several measurements. Visual analysis of the colour flow jet may underestimate regurgitation severity with eccentric jets and overestimate severity with central jets. Where possible, the effective regurgitant orifice area should be calculated using the proximal isovelocity surface area (PISA) method.
40
InHealth Echotech Reporting Guidelines Date of issue: Mar 2018 Version: V018 Date for review: Nov 2018 SOP Owner: Cheryl Barton Page 12 of 29
Direct markers of severe mitral regurgitation:
• Vena Contracta diameter > 7 mm
• Proximal Isovelocity Surface Area (PISA) radius > 1 cm (when Nyquist limit is 40 cm/sec)
• Regurgitant volume > 60 ml
• Effective Regurgitant Orifice Area > 0.4 cm2 (or 0.2 cm2 with ischaemic mitral regurgitation)
Indirect markers of severe mitral regurgitation:
• Mitral jet area/atrial jet area ratio > 40%
• Peak mitral E velocity > 1.5 m/sec
• Mitral VTI/Aortic VTI ratio > 1.3
• Pulmonary venous flow reversal
• Density of the continuous wave jet
Mitral annulus diameter should be measured in end diastole in PLAX view ideally.
Dilatation is defined as end diastole diameter greater than 3.6 cm or the ratio annulus/anterior leaflet is greater than 1.3.
11.3. Aortic Stenosis
Measurement Mild Moderate Severe
Peak velocity (m/s) < 2.9 3.0 – 3.9 > 4.0
Mean pressure drop (mmHg) < 25 25 – 40 > 40
Valve area (cm2) 1.5 – 2.0 1.0 – 1.4 < 1.0
Velocity or VTI ratio ≥ 0.5 0.25 – 0.5 ≤ 0.25
• Ensure CW Doppler tracings recorded from 5 and 3 chamber views and right parasternal view with stand alone probe
• Aortic valve area is mandatory in patients with aortic stenosis
• Aortic valve area should always be calculated when aortic flow rate is affected by conditions such as LV dysfunction, AR, MR, pregnancy
• Comment on whether aortic valve is bi or tricuspid, site and extent of calcification and if calcification extends into mitral valve apparatus. With rheumatic aortic stenosis, comment on the degree of commissural fusion
• The pattern and extent of left ventricular hypertrophy, LVEF, coexistent valve disease and any dilatation of aorta should always be mentioned in the conclusion
41
InHealth Echotech Reporting Guidelines Date of issue: Mar 2018 Version: V018 Date for review: Nov 2018 SOP Owner: Cheryl Barton Page 12 of 29
Direct markers of severe mitral regurgitation:
• Vena Contracta diameter > 7 mm
• Proximal Isovelocity Surface Area (PISA) radius > 1 cm (when Nyquist limit is 40 cm/sec)
• Regurgitant volume > 60 ml
• Effective Regurgitant Orifice Area > 0.4 cm2 (or 0.2 cm2 with ischaemic mitral regurgitation)
Indirect markers of severe mitral regurgitation:
• Mitral jet area/atrial jet area ratio > 40%
• Peak mitral E velocity > 1.5 m/sec
• Mitral VTI/Aortic VTI ratio > 1.3
• Pulmonary venous flow reversal
• Density of the continuous wave jet
Mitral annulus diameter should be measured in end diastole in PLAX view ideally.
Dilatation is defined as end diastole diameter greater than 3.6 cm or the ratio annulus/anterior leaflet is greater than 1.3.
11.3. Aortic Stenosis
Measurement Mild Moderate Severe
Peak velocity (m/s) < 2.9 3.0 – 3.9 > 4.0
Mean pressure drop (mmHg) < 25 25 – 40 > 40
Valve area (cm2) 1.5 – 2.0 1.0 – 1.4 < 1.0
Velocity or VTI ratio ≥ 0.5 0.25 – 0.5 ≤ 0.25
• Ensure CW Doppler tracings recorded from 5 and 3 chamber views and right parasternal view with stand alone probe
• Aortic valve area is mandatory in patients with aortic stenosis
• Aortic valve area should always be calculated when aortic flow rate is affected by conditions such as LV dysfunction, AR, MR, pregnancy
• Comment on whether aortic valve is bi or tricuspid, site and extent of calcification and if calcification extends into mitral valve apparatus. With rheumatic aortic stenosis, comment on the degree of commissural fusion
• The pattern and extent of left ventricular hypertrophy, LVEF, coexistent valve disease and any dilatation of aorta should always be mentioned in the conclusion
InHealth Echotech Reporting Guidelines Date of issue: Mar 2018 Version: V018 Date for review: Nov 2018 SOP Owner: Cheryl Barton Page 13 of 29
• Aortic dimensions should be given at level of aortic annulus, sinus of valsalva, sinotubular junction
• Aortic sclerosis is calcified and thickened aortic valve with peak CW velocity < 2.0 m/s
• If aortic valve peak CW velocity is < 2.0 m/s and valve looks entirely normal with normal excursion, then report as normal Aortic Valve
• In atrial fibrillation, obtain CW tracings of 5 consecutive beats and quote the maximal value obtained
• Peak and mean gradients (using VTI) and valve area should be stated in the report for all degrees of Aortic Stenosis
11.4. Aortic Regurgitation
• Visually assess by use of colour flow and CW Doppler
• Detailed evaluation of aortic valve, aortic root, LV size and LVEF essential
• Comment on whether aortic valve bicuspid or tricuspid, rheumatic or degenerative
• Measure aortic root at aortic annulus, sinus of valsalva and sinotubular junction
• All quantification techniques have limitations and severity grade should be based on a combination of parameters
• Reliance on colour flow mapping and PHT alone will underestimate eccentric jets, underestimated due to poor Doppler alignment
Quantification of Aortic Regurgitation Mild Moderate Severe
Jet density Incomplete Dense Dense
Jet decal rate (PHT) ms > 500 - < 250
Diastolic flow in descending aorta Brief, early diastolic Intermediate Prominent,
holodiastolic reversal
Vena contracta (cm) < 0.3 - >0.6
Jet width / LVOT Diameter (%) < 25 - > 65
Regurgitant volume (ml/beat) < 30 31 – 59 > 60
Regurgitant fraction <30 30 – 50 >50
EROA (CM2) < 0.1 0.11 – 0.29 >0.3
42
InHealth Echotech Reporting Guidelines Date of issue: Mar 2018 Version: V018 Date for review: Nov 2018 SOP Owner: Cheryl Barton Page 14 of 29
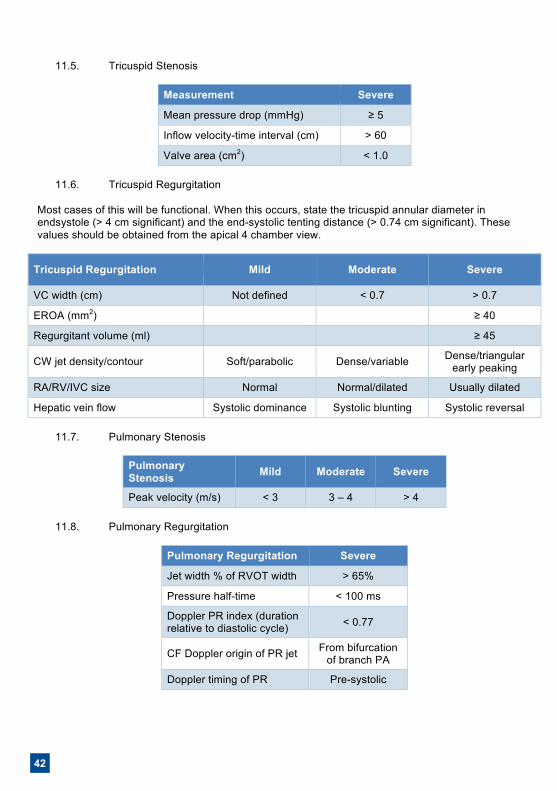
11.5. Tricuspid Stenosis
Measurement Severe
Mean pressure drop (mmHg) ≥ 5
Inflow velocity-time interval (cm) > 60
Valve area (cm2) < 1.0
11.6. Tricuspid Regurgitation Most cases of this will be functional. When this occurs, state the tricuspid annular diameter in endsystole (> 4 cm significant) and the end-systolic tenting distance (> 0.74 cm significant). These values should be obtained from the apical 4 chamber view.
Tricuspid Regurgitation Mild Moderate Severe
VC width (cm) Not defined < 0.7 > 0.7
EROA (mm2) ≥ 40
Regurgitant volume (ml) ≥ 45
CW jet density/contour Soft/parabolic Dense/variable Dense/triangular early peaking
RA/RV/IVC size Normal Normal/dilated Usually dilated
Hepatic vein flow Systolic dominance Systolic blunting Systolic reversal
11.7. Pulmonary Stenosis
Pulmonary Stenosis Mild Moderate Severe
Peak velocity (m/s) < 3 3 – 4 > 4
11.8. Pulmonary Regurgitation
Pulmonary Regurgitation Severe
Jet width % of RVOT width > 65%
Pressure half-time < 100 ms
Doppler PR index (duration relative to diastolic cycle) < 0.77
CF Doppler origin of PR jet From bifurcation of branch PA
Doppler timing of PR Pre-systolic
43
InHealth Echotech Reporting Guidelines Date of issue: Mar 2018 Version: V018 Date for review: Nov 2018 SOP Owner: Cheryl Barton Page 14 of 29
11.5. Tricuspid Stenosis
Measurement Severe
Mean pressure drop (mmHg) ≥ 5
Inflow velocity-time interval (cm) > 60
Valve area (cm2) < 1.0
11.6. Tricuspid Regurgitation Most cases of this will be functional. When this occurs, state the tricuspid annular diameter in endsystole (> 4 cm significant) and the end-systolic tenting distance (> 0.74 cm significant). These values should be obtained from the apical 4 chamber view.
Tricuspid Regurgitation Mild Moderate Severe
VC width (cm) Not defined < 0.7 > 0.7
EROA (mm2) ≥ 40
Regurgitant volume (ml) ≥ 45
CW jet density/contour Soft/parabolic Dense/variable Dense/triangular early peaking
RA/RV/IVC size Normal Normal/dilated Usually dilated
Hepatic vein flow Systolic dominance Systolic blunting Systolic reversal
11.7. Pulmonary Stenosis
Pulmonary Stenosis Mild Moderate Severe
Peak velocity (m/s) < 3 3 – 4 > 4
11.8. Pulmonary Regurgitation
Pulmonary Regurgitation Severe
Jet width % of RVOT width > 65%
Pressure half-time < 100 ms
Doppler PR index (duration relative to diastolic cycle) < 0.77
CF Doppler origin of PR jet From bifurcation of branch PA
Doppler timing of PR Pre-systolic
InHealth Echotech Reporting Guidelines Date of issue: Mar 2018 Version: V018 Date for review: Nov 2018 SOP Owner: Cheryl Barton Page 15 of 29
11.9. Assessment of Prosthetic Valves
• Key measurements are (i) peak velocity and (ii) calculated mean gradient (CW) [See reference book for valve size and type]
• Visual assessment of regurgitation by use of colour flow and CW Doppler
• Assess whether regurgitant jet is within (closure jet) or outside (paravalvular) the sewing ring
• Visually assess stability of valve
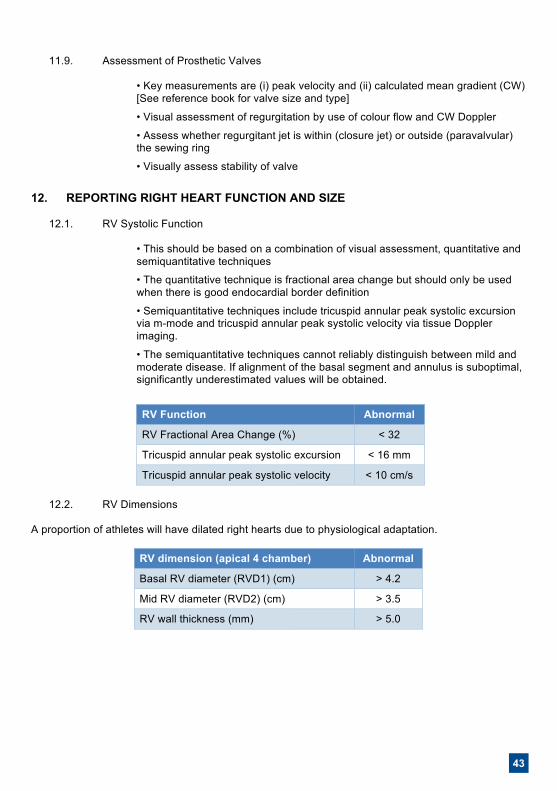
12. REPORTING RIGHT HEART FUNCTION AND SIZE
12.1. RV Systolic Function
• This should be based on a combination of visual assessment, quantitative and semiquantitative techniques
• The quantitative technique is fractional area change but should only be used when there is good endocardial border definition
• Semiquantitative techniques include tricuspid annular peak systolic excursion via m-mode and tricuspid annular peak systolic velocity via tissue Doppler imaging.
• The semiquantitative techniques cannot reliably distinguish between mild and moderate disease. If alignment of the basal segment and annulus is suboptimal, significantly underestimated values will be obtained.
RV Function Abnormal
RV Fractional Area Change (%) < 32
Tricuspid annular peak systolic excursion < 16 mm
Tricuspid annular peak systolic velocity < 10 cm/s
12.2. RV Dimensions A proportion of athletes will have dilated right hearts due to physiological adaptation.
RV dimension (apical 4 chamber) Abnormal
Basal RV diameter (RVD1) (cm) > 4.2
Mid RV diameter (RVD2) (cm) > 3.5
RV wall thickness (mm) > 5.0
44
InHealth Echotech Reporting Guidelines Date of issue: Mar 2018 Version: V018 Date for review: Nov 2018 SOP Owner: Cheryl Barton Page 16 of 29
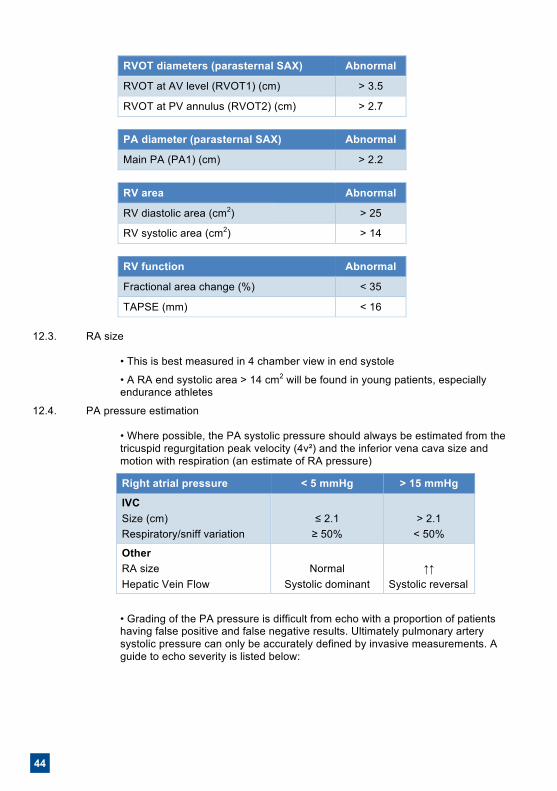
RVOT diameters (parasternal SAX) Abnormal
RVOT at AV level (RVOT1) (cm) > 3.5
RVOT at PV annulus (RVOT2) (cm) > 2.7
PA diameter (parasternal SAX) Abnormal
Main PA (PA1) (cm) > 2.2
RV area Abnormal
RV diastolic area (cm2) > 25
RV systolic area (cm2) > 14
RV function Abnormal
Fractional area change (%) < 35
TAPSE (mm) < 16
12.3. RA size
• This is best measured in 4 chamber view in end systole
• A RA end systolic area > 14 cm2 will be found in young patients, especially endurance athletes
12.4. PA pressure estimation
• Where possible, the PA systolic pressure should always be estimated from the tricuspid regurgitation peak velocity (4v²) and the inferior vena cava size and motion with respiration (an estimate of RA pressure)
Right atrial pressure < 5 mmHg > 15 mmHg
IVC Size (cm) Respiratory/sniff variation
≤ 2.1
≥ 50%
> 2.1
< 50%
Other RA size Hepatic Vein Flow
Normal
Systolic dominant
↑↑
Systolic reversal
• Grading of the PA pressure is difficult from echo with a proportion of patients having false positive and false negative results. Ultimately pulmonary artery systolic pressure can only be accurately defined by invasive measurements. A guide to echo severity is listed below:
45
InHealth Echotech Reporting Guidelines Date of issue: Mar 2018 Version: V018 Date for review: Nov 2018 SOP Owner: Cheryl Barton Page 16 of 29
RVOT diameters (parasternal SAX) Abnormal
RVOT at AV level (RVOT1) (cm) > 3.5
RVOT at PV annulus (RVOT2) (cm) > 2.7
PA diameter (parasternal SAX) Abnormal
Main PA (PA1) (cm) > 2.2
RV area Abnormal
RV diastolic area (cm2) > 25
RV systolic area (cm2) > 14
RV function Abnormal
Fractional area change (%) < 35
TAPSE (mm) < 16
12.3. RA size
• This is best measured in 4 chamber view in end systole
• A RA end systolic area > 14 cm2 will be found in young patients, especially endurance athletes
12.4. PA pressure estimation
• Where possible, the PA systolic pressure should always be estimated from the tricuspid regurgitation peak velocity (4v²) and the inferior vena cava size and motion with respiration (an estimate of RA pressure)
Right atrial pressure < 5 mmHg > 15 mmHg
IVC Size (cm) Respiratory/sniff variation
≤ 2.1
≥ 50%
> 2.1
< 50%
Other RA size Hepatic Vein Flow
Normal
Systolic dominant
↑↑
Systolic reversal
• Grading of the PA pressure is difficult from echo with a proportion of patients having false positive and false negative results. Ultimately pulmonary artery systolic pressure can only be accurately defined by invasive measurements. A guide to echo severity is listed below:
InHealth Echotech Reporting Guidelines Date of issue: Mar 2018 Version: V018 Date for review: Nov 2018 SOP Owner: Cheryl Barton Page 17 of 29
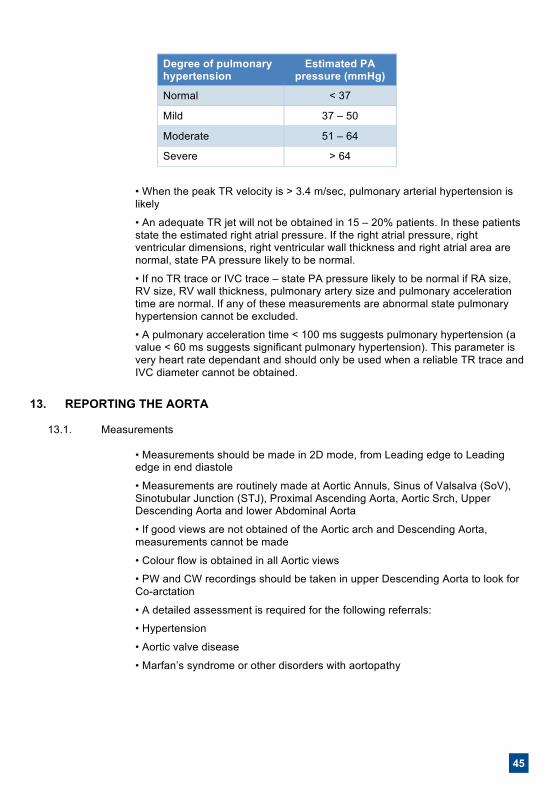
Degree of pulmonary hypertension
Estimated PA pressure (mmHg)
Normal < 37
Mild 37 – 50
Moderate 51 – 64
Severe > 64
• When the peak TR velocity is > 3.4 m/sec, pulmonary arterial hypertension is likely
• An adequate TR jet will not be obtained in 15 – 20% patients. In these patients state the estimated right atrial pressure. If the right atrial pressure, right ventricular dimensions, right ventricular wall thickness and right atrial area are normal, state PA pressure likely to be normal.
• If no TR trace or IVC trace – state PA pressure likely to be normal if RA size, RV size, RV wall thickness, pulmonary artery size and pulmonary acceleration time are normal. If any of these measurements are abnormal state pulmonary hypertension cannot be excluded.
• A pulmonary acceleration time < 100 ms suggests pulmonary hypertension (a value < 60 ms suggests significant pulmonary hypertension). This parameter is very heart rate dependant and should only be used when a reliable TR trace and IVC diameter cannot be obtained.
13. REPORTING THE AORTA
13.1. Measurements
• Measurements should be made in 2D mode, from Leading edge to Leading edge in end diastole
• Measurements are routinely made at Aortic Annuls, Sinus of Valsalva (SoV), Sinotubular Junction (STJ), Proximal Ascending Aorta, Aortic Srch, Upper Descending Aorta and lower Abdominal Aorta
• If good views are not obtained of the Aortic arch and Descending Aorta, measurements cannot be made
• Colour flow is obtained in all Aortic views
• PW and CW recordings should be taken in upper Descending Aorta to look for Co-arctation
• A detailed assessment is required for the following referrals:
• Hypertension
• Aortic valve disease
• Marfan’s syndrome or other disorders with aortopathy
46
InHealth Echotech Reporting Guidelines Date of issue: Mar 2018 Version: V018 Date for review: Nov 2018 SOP Owner: Cheryl Barton Page 18 of 29
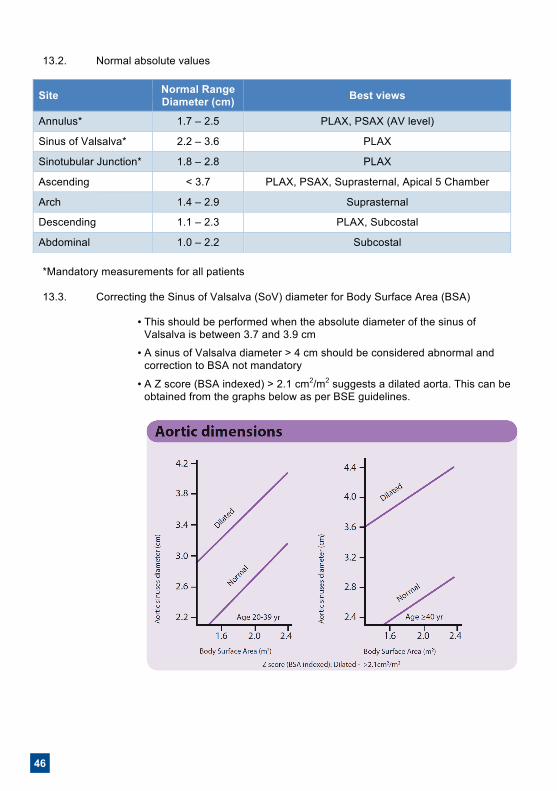
13.2. Normal absolute values
Site Normal Range Diameter (cm) Best views
Annulus* 1.7 – 2.5 PLAX, PSAX (AV level)
Sinus of Valsalva* 2.2 – 3.6 PLAX
Sinotubular Junction* 1.8 – 2.8 PLAX
Ascending < 3.7 PLAX, PSAX, Suprasternal, Apical 5 Chamber
Arch 1.4 – 2.9 Suprasternal
Descending 1.1 – 2.3 PLAX, Subcostal
Abdominal 1.0 – 2.2 Subcostal
*Mandatory measurements for all patients
13.3. Correcting the Sinus of Valsalva (SoV) diameter for Body Surface Area (BSA)
• This should be performed when the absolute diameter of the sinus of Valsalva is between 3.7 and 3.9 cm
• A sinus of Valsalva diameter > 4 cm should be considered abnormal and correction to BSA not mandatory
• A Z score (BSA indexed) > 2.1 cm2/m2 suggests a dilated aorta. This can be obtained from the graphs below as per BSE guidelines.
47
InHealth Echotech Reporting Guidelines Date of issue: Mar 2018 Version: V018 Date for review: Nov 2018 SOP Owner: Cheryl Barton Page 18 of 29
13.2. Normal absolute values
Site Normal Range Diameter (cm) Best views
Annulus* 1.7 – 2.5 PLAX, PSAX (AV level)
Sinus of Valsalva* 2.2 – 3.6 PLAX
Sinotubular Junction* 1.8 – 2.8 PLAX
Ascending < 3.7 PLAX, PSAX, Suprasternal, Apical 5 Chamber
Arch 1.4 – 2.9 Suprasternal
Descending 1.1 – 2.3 PLAX, Subcostal
Abdominal 1.0 – 2.2 Subcostal
*Mandatory measurements for all patients
13.3. Correcting the Sinus of Valsalva (SoV) diameter for Body Surface Area (BSA)
• This should be performed when the absolute diameter of the sinus of Valsalva is between 3.7 and 3.9 cm
• A sinus of Valsalva diameter > 4 cm should be considered abnormal and correction to BSA not mandatory
• A Z score (BSA indexed) > 2.1 cm2/m2 suggests a dilated aorta. This can be obtained from the graphs below as per BSE guidelines.
InHealth Echotech Reporting Guidelines Date of issue: Mar 2018 Version: V018 Date for review: Nov 2018 SOP Owner: Cheryl Barton Page 19 of 29
• Alternatively, a Z2 score (normalised for BSA according to Devereauz RB et al. Am J Cardiol 2012) can be obtained from the BSE App.
• For all other regions of the aorta only use absolute measurements with no correction for BSA.
14. PERICARDIAL DISEASE
• Visually assess for pericardial effusion on all patients
14.1. Pericardial Effusion
Pericardial Effusion Size Measurement (cm)
Normal amount of fluid < 0.8 (anterior space)
Small effusion 0.8 – 1.0
Moderate effusion 1.0 – 2.0
Large effusion > 2.0
• Should be measured in end diastole
• State whether global or loculated - if loculated, state area
• State measurement of fluid
• State if any wall compromise
• Look at the IVC and measure size and amount of respiratory collapse
• Any sized global pericardial effusion should be considered pathological
14.2. Signs of Pericardial Tamponade
• The rate of accumulation of fluid is as important as the size of the pericardial effusion
• RV diastolic collapse > 35%
• > 25% drop in mitral inflow E wave with inspiration
• > 25% rise in tricuspid inflow E wave with inspiration
• If patient is in AF, inflow can still be assessed using slow speed PW Doppler as should not vary by >25%
14.3. Pericardial Constriction
• Abrupt flattening of posterior wall in mid diastole
• Double septal motion in diastole
48
InHealth Echotech Reporting Guidelines Date of issue: Mar 2018 Version: V018 Date for review: Nov 2018 SOP Owner: Cheryl Barton Page 20 of 29
• > 25% drop in mitral inflow E wave with inspiration
• > 25% rise in tricuspid inflow E wave with inspiration
• > 25% drop in subaortic outflow with inspiration
• Preserved mitral annular peak systolic velocity
No single sign can exclude or diagnose pericardial constriction and the diagnosis should be made based on a combination of parameters.
15. TECHNICAL REPORT COMMENTS The technical report section is divided into 5 areas: LV assessment, Right Heart Assessment, Valves, Other and Conclusion. For each cardiac structure both morphology and function is described.
• The InHealth Echotech report is primary care and is therefore written in clear, descriptive terms, stating all key findings, whether normal or abnormal
• Abbreviations are not used in the conclusion
• All measurements that are not detailed elsewhere on the report but are relevant to the findings (e.g. aortic valve gradient) are stated within the technical report section (LV
• Assessment, Right Heart Assessment, Valves and Other)
• Measurements are not detailed in the Conclusion
• When a finding requires clarification / peer review then the term ‘suspicion of /query of…’ is used within the technical report and the ‘peer review required’ box is ticked
• The report states a conclusion / summary which:
1) Details the LV systolic function and the LV diastolic function (where appropriate)
2) Emphasises the abnormal findings and
3) Answers the question(s) posed by the referring clinician
49
InHealth Echotech Reporting Guidelines Date of issue: Mar 2018 Version: V018 Date for review: Nov 2018 SOP Owner: Cheryl Barton Page 20 of 29
• > 25% drop in mitral inflow E wave with inspiration
• > 25% rise in tricuspid inflow E wave with inspiration
• > 25% drop in subaortic outflow with inspiration
• Preserved mitral annular peak systolic velocity
No single sign can exclude or diagnose pericardial constriction and the diagnosis should be made based on a combination of parameters.
15. TECHNICAL REPORT COMMENTS The technical report section is divided into 5 areas: LV assessment, Right Heart Assessment, Valves, Other and Conclusion. For each cardiac structure both morphology and function is described.
• The InHealth Echotech report is primary care and is therefore written in clear, descriptive terms, stating all key findings, whether normal or abnormal
• Abbreviations are not used in the conclusion
• All measurements that are not detailed elsewhere on the report but are relevant to the findings (e.g. aortic valve gradient) are stated within the technical report section (LV
• Assessment, Right Heart Assessment, Valves and Other)
• Measurements are not detailed in the Conclusion
• When a finding requires clarification / peer review then the term ‘suspicion of /query of…’ is used within the technical report and the ‘peer review required’ box is ticked
• The report states a conclusion / summary which:
1) Details the LV systolic function and the LV diastolic function (where appropriate)
2) Emphasises the abnormal findings and
3) Answers the question(s) posed by the referring clinician
InHealth Echotech Reporting Guidelines Date of issue: Mar 2018 Version: V018 Date for review: Nov 2018 SOP Owner: Cheryl Barton Page 21 of 29
16. REPORT TICK BOXES The use of tick boxes is used extensively to further enhance the clarity of the report
Report Area Comment
LV Systolic Function Tick relevant box
Mitral Valve/Aortic Valve Tick severity of stenosis and/or regurgitation as either mild, moderate or severe
Atrial Fibrillation Tick if patient is in AF
Diastolic Dysfunction Tick if patient [ages 35 and above] has any degree of LVDD [grades 1-4]
RV Systolic Dysfunction Tick if patient has any degree of RVSD [mild to severe]
Significant Valve Disease Tick if patient has valve disease of moderate severity of above
Technical Quality Tick the technical quality of the study is either good, fair or poor
Peer Review Tick if a second opinion is required [study images will be reviewed]
Urgent Findings Tick if urgent action is required and dealt with
50
InHealth Echotech Reporting Guidelines Date of issue: Mar 2018 Version: V018 Date for review: Nov 2018 SOP Owner: Cheryl Barton Page 22 of 29
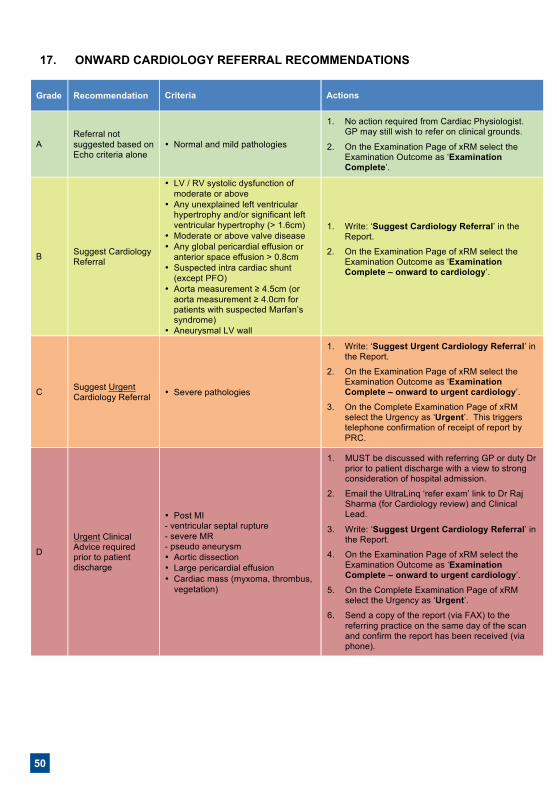
17. ONWARD CARDIOLOGY REFERRAL RECOMMENDATIONS
Grade Recommendation Criteria Actions
A Referral not suggested based on Echo criteria alone
• Normal and mild pathologies
1. No action required from Cardiac Physiologist. GP may still wish to refer on clinical grounds.
2. On the Examination Page of xRM select the Examination Outcome as ‘Examination Complete’.
B Suggest Cardiology Referral
• LV / RV systolic dysfunction of moderate or above
• Any unexplained left ventricular hypertrophy and/or significant left ventricular hypertrophy (> 1.6cm)
• Moderate or above valve disease • Any global pericardial effusion or
anterior space effusion > 0.8cm • Suspected intra cardiac shunt
(except PFO) • Aorta measurement ≥ 4.5cm (or
aorta measurement ≥ 4.0cm for patients with suspected Marfan’s syndrome)
• Aneurysmal LV wall
1. Write: ‘Suggest Cardiology Referral’ in the Report.
2. On the Examination Page of xRM select the Examination Outcome as ‘Examination Complete – onward to cardiology’.
C Suggest Urgent Cardiology Referral • Severe pathologies
1. Write: ‘Suggest Urgent Cardiology Referral’ in the Report.
2. On the Examination Page of xRM select the Examination Outcome as ‘Examination Complete – onward to urgent cardiology’.
3. On the Complete Examination Page of xRM select the Urgency as ‘Urgent’. This triggers telephone confirmation of receipt of report by PRC.
D
Urgent Clinical Advice required prior to patient discharge
• Post MI - ventricular septal rupture - severe MR - pseudo aneurysm • Aortic dissection • Large pericardial effusion • Cardiac mass (myxoma, thrombus,
vegetation)
1. MUST be discussed with referring GP or duty Dr prior to patient discharge with a view to strong consideration of hospital admission.
2. Email the UltraLinq ‘refer exam’ link to Dr Raj Sharma (for Cardiology review) and Clinical Lead.
3. Write: ‘Suggest Urgent Cardiology Referral’ in the Report.
4. On the Examination Page of xRM select the Examination Outcome as ‘Examination Complete – onward to urgent cardiology’.
5. On the Complete Examination Page of xRM select the Urgency as ‘Urgent’.
6. Send a copy of the report (via FAX) to the referring practice on the same day of the scan and confirm the report has been received (via phone).
51
InHealth Echotech Reporting Guidelines Date of issue: Mar 2018 Version: V018 Date for review: Nov 2018 SOP Owner: Cheryl Barton Page 22 of 29
17. ONWARD CARDIOLOGY REFERRAL RECOMMENDATIONS
Grade Recommendation Criteria Actions
A Referral not suggested based on Echo criteria alone
• Normal and mild pathologies
1. No action required from Cardiac Physiologist. GP may still wish to refer on clinical grounds.
2. On the Examination Page of xRM select the Examination Outcome as ‘Examination Complete’.
B Suggest Cardiology Referral
• LV / RV systolic dysfunction of moderate or above
• Any unexplained left ventricular hypertrophy and/or significant left ventricular hypertrophy (> 1.6cm)
• Moderate or above valve disease • Any global pericardial effusion or
anterior space effusion > 0.8cm • Suspected intra cardiac shunt
(except PFO) • Aorta measurement ≥ 4.5cm (or
aorta measurement ≥ 4.0cm for patients with suspected Marfan’s syndrome)
• Aneurysmal LV wall
1. Write: ‘Suggest Cardiology Referral’ in the Report.
2. On the Examination Page of xRM select the Examination Outcome as ‘Examination Complete – onward to cardiology’.
C Suggest Urgent Cardiology Referral • Severe pathologies
1. Write: ‘Suggest Urgent Cardiology Referral’ in the Report.
2. On the Examination Page of xRM select the Examination Outcome as ‘Examination Complete – onward to urgent cardiology’.
3. On the Complete Examination Page of xRM select the Urgency as ‘Urgent’. This triggers telephone confirmation of receipt of report by PRC.
D
Urgent Clinical Advice required prior to patient discharge
• Post MI - ventricular septal rupture - severe MR - pseudo aneurysm • Aortic dissection • Large pericardial effusion • Cardiac mass (myxoma, thrombus,
vegetation)
1. MUST be discussed with referring GP or duty Dr prior to patient discharge with a view to strong consideration of hospital admission.
2. Email the UltraLinq ‘refer exam’ link to Dr Raj Sharma (for Cardiology review) and Clinical Lead.
3. Write: ‘Suggest Urgent Cardiology Referral’ in the Report.
4. On the Examination Page of xRM select the Examination Outcome as ‘Examination Complete – onward to urgent cardiology’.
5. On the Complete Examination Page of xRM select the Urgency as ‘Urgent’.
6. Send a copy of the report (via FAX) to the referring practice on the same day of the scan and confirm the report has been received (via phone).
InHealth Echotech Reporting Guidelines Date of issue: Mar 2018 Version: V018 Date for review: Nov 2018 SOP Owner: Cheryl Barton Page 23 of 29
18. PATIENTS IN ATRIAL FIBRILLATION
• If AF is noted, state this in the conclusion, as well as ticking ‘Atrial Fibrillation’ box • In the conclusion, state a mean heart rate • An average of three Doppler and Ejection Fraction measurements should be taken • At least three beat loops should be recorded
19. REFERENCES
1 Recommendations for a standard adult transthoracic echocardiogram, incorporating requirements for a minimum dataset. BSE Education Committee, 2012. 2 Guidelines for chamber and valve quantification. BSE Education Committee, 2008. 3 The evaluation of left ventricular function for patients being considered or receiving Herceptin therapy. The Council of the BSE, June 2006.
20. ASSOCIATED DOCUMENTS
• Clinical Audit SOP • Competency Framework and Assessment Tool
21. APPENDICES
Appendix 1: Equality Impact Assessment Appendix 2: Herceptin Appendix 3: Left ventricular hypertrophy due to hypertensive heart disease Appendix 4: Echo exclusion criteria Appendix 5: Congenital assessment Appendix 6: Reporting Errors
52
InHealth Echotech Reporting Guidelines Date of issue: Mar 2018 Version: V018 Date for review: Nov 2018 SOP Owner: Cheryl Barton Page 25 of 29
APPENDIX 2: HERCEPTIN BSE Guidelines3 state that patients should not be commenced on Herceptin (Trastuzumab) if their baseline EF is ≤ 55%. If the EF falls by more than 10% or to < 50%, referral to a Cardiologist should be suggested on the echo report. Accurate measurement of EF is required as a 10% change in EF should reflect a ‘true’ change. To assist the accurate measurement of EF, the use of (biplane) Simpson’s Rule Method is required. If this is not possible, then referral to the Secondary Care Cardiology Department is appropriate. To track the EF for serial echocardiograms, a folder for the Herceptin patients will be kept within the echo file. APPENDIX 3: LEFT VENTRICULAR HYPERTROPHY Left ventricular hypertrophy due to hypertensive heart disease:
• Wall thickness rarely exceeds 2 cm • Pattern LVH usually concentric but may be ASH • SAM and LVOTO less common but may occur • LVEF rarely > 65% • Often distinguishing HCM from Hypertensive heart disease very difficult and requires clinical features, ECG, ETT, 24 hour ECG, CMR
Features of physiological left ventricular hypertrophy (athlete’s heart):
• LV wall thickness rarely exceeds 1.6 cm • LVH pattern concentric with < 2 mm difference between LV segments • LVEDD often 5.5 – 6.5 cm (HCM LVEDD rarely > 4.5 cm) • LVOTO and SAM rare • Ea usually > 9 cm/sec
APPENDIX 4: ECHO EXCLUSION CRITERIA Standard echo exclusion criteria (will vary by contract):
• Age less than 16 • Known congenital heart disease • A congenital disorder in which cardiac disease may be suspected e.g. Down’s syndrome, Noonan’s syndrome, William’s disease
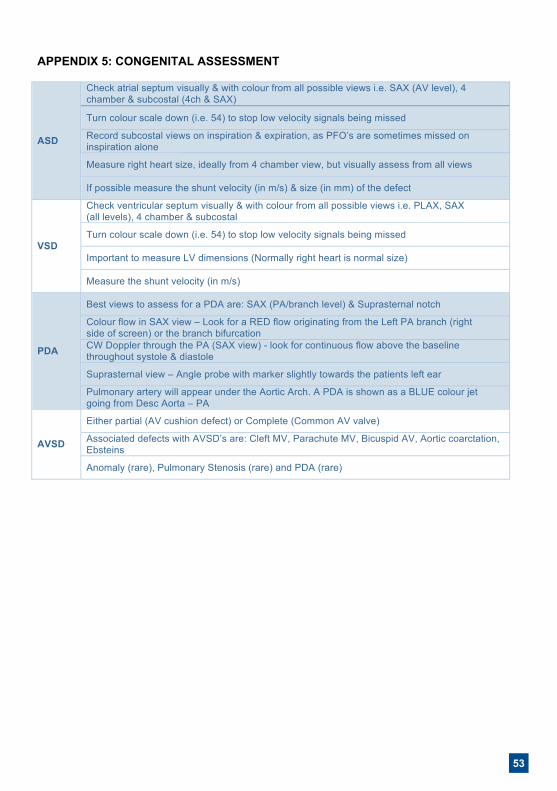
53
InHealth Echotech Reporting Guidelines Date of issue: Mar 2018 Version: V018 Date for review: Nov 2018 SOP Owner: Cheryl Barton Page 25 of 29
APPENDIX 2: HERCEPTIN BSE Guidelines3 state that patients should not be commenced on Herceptin (Trastuzumab) if their baseline EF is ≤ 55%. If the EF falls by more than 10% or to < 50%, referral to a Cardiologist should be suggested on the echo report. Accurate measurement of EF is required as a 10% change in EF should reflect a ‘true’ change. To assist the accurate measurement of EF, the use of (biplane) Simpson’s Rule Method is required. If this is not possible, then referral to the Secondary Care Cardiology Department is appropriate. To track the EF for serial echocardiograms, a folder for the Herceptin patients will be kept within the echo file. APPENDIX 3: LEFT VENTRICULAR HYPERTROPHY Left ventricular hypertrophy due to hypertensive heart disease:
• Wall thickness rarely exceeds 2 cm • Pattern LVH usually concentric but may be ASH • SAM and LVOTO less common but may occur • LVEF rarely > 65% • Often distinguishing HCM from Hypertensive heart disease very difficult and requires clinical features, ECG, ETT, 24 hour ECG, CMR
Features of physiological left ventricular hypertrophy (athlete’s heart):
• LV wall thickness rarely exceeds 1.6 cm • LVH pattern concentric with < 2 mm difference between LV segments • LVEDD often 5.5 – 6.5 cm (HCM LVEDD rarely > 4.5 cm) • LVOTO and SAM rare • Ea usually > 9 cm/sec
APPENDIX 4: ECHO EXCLUSION CRITERIA Standard echo exclusion criteria (will vary by contract):
• Age less than 16 • Known congenital heart disease • A congenital disorder in which cardiac disease may be suspected e.g. Down’s syndrome, Noonan’s syndrome, William’s disease
InHealth Echotech Reporting Guidelines Date of issue: Mar 2018 Version: V018 Date for review: Nov 2018 SOP Owner: Cheryl Barton Page 26 of 29
APPENDIX 5: CONGENITAL ASSESSMENT
ASD
Check atrial septum visually & with colour from all possible views i.e. SAX (AV level), 4 chamber & subcostal (4ch & SAX)
Turn colour scale down (i.e. 54) to stop low velocity signals being missed
Record subcostal views on inspiration & expiration, as PFO’s are sometimes missed on inspiration alone
Measure right heart size, ideally from 4 chamber view, but visually assess from all views
If possible measure the shunt velocity (in m/s) & size (in mm) of the defect
VSD
Check ventricular septum visually & with colour from all possible views i.e. PLAX, SAX (all levels), 4 chamber & subcostal
Turn colour scale down (i.e. 54) to stop low velocity signals being missed
Important to measure LV dimensions (Normally right heart is normal size)
Measure the shunt velocity (in m/s)
PDA
Best views to assess for a PDA are: SAX (PA/branch level) & Suprasternal notch
Colour flow in SAX view – Look for a RED flow originating from the Left PA branch (right side of screen) or the branch bifurcation CW Doppler through the PA (SAX view) - look for continuous flow above the baseline throughout systole & diastole
Suprasternal view – Angle probe with marker slightly towards the patients left ear
Pulmonary artery will appear under the Aortic Arch. A PDA is shown as a BLUE colour jet going from Desc Aorta – PA
AVSD
Either partial (AV cushion defect) or Complete (Common AV valve)
Associated defects with AVSD’s are: Cleft MV, Parachute MV, Bicuspid AV, Aortic coarctation, Ebsteins
Anomaly (rare), Pulmonary Stenosis (rare) and PDA (rare)
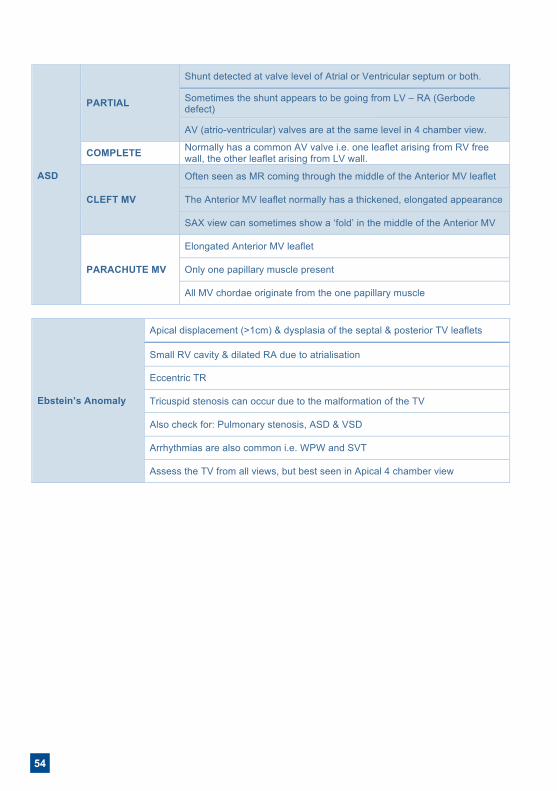
54
InHealth Echotech Reporting Guidelines Date of issue: Mar 2018 Version: V018 Date for review: Nov 2018 SOP Owner: Cheryl Barton Page 27 of 29
ASD
PARTIAL
Shunt detected at valve level of Atrial or Ventricular septum or both.
Sometimes the shunt appears to be going from LV – RA (Gerbode defect)
AV (atrio-ventricular) valves are at the same level in 4 chamber view.
COMPLETE Normally has a common AV valve i.e. one leaflet arising from RV free wall, the other leaflet arising from LV wall.
CLEFT MV
Often seen as MR coming through the middle of the Anterior MV leaflet
The Anterior MV leaflet normally has a thickened, elongated appearance
SAX view can sometimes show a ‘fold’ in the middle of the Anterior MV
PARACHUTE MV
Elongated Anterior MV leaflet
Only one papillary muscle present
All MV chordae originate from the one papillary muscle
Ebstein’s Anomaly
Apical displacement (>1cm) & dysplasia of the septal & posterior TV leaflets
Small RV cavity & dilated RA due to atrialisation
Eccentric TR
Tricuspid stenosis can occur due to the malformation of the TV
Also check for: Pulmonary stenosis, ASD & VSD
Arrhythmias are also common i.e. WPW and SVT
Assess the TV from all views, but best seen in Apical 4 chamber view
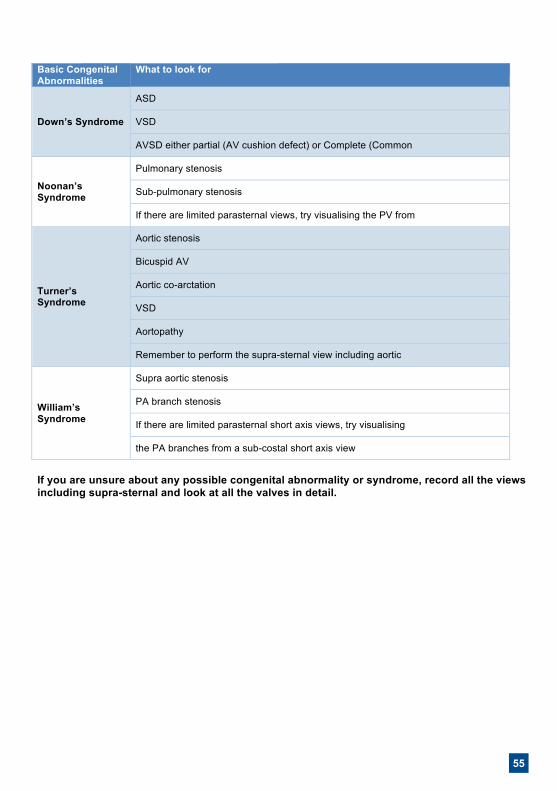
55
InHealth Echotech Reporting Guidelines Date of issue: Mar 2018 Version: V018 Date for review: Nov 2018 SOP Owner: Cheryl Barton Page 27 of 29
ASD
PARTIAL
Shunt detected at valve level of Atrial or Ventricular septum or both.
Sometimes the shunt appears to be going from LV – RA (Gerbode defect)
AV (atrio-ventricular) valves are at the same level in 4 chamber view.
COMPLETE Normally has a common AV valve i.e. one leaflet arising from RV free wall, the other leaflet arising from LV wall.
CLEFT MV
Often seen as MR coming through the middle of the Anterior MV leaflet
The Anterior MV leaflet normally has a thickened, elongated appearance
SAX view can sometimes show a ‘fold’ in the middle of the Anterior MV
PARACHUTE MV
Elongated Anterior MV leaflet
Only one papillary muscle present
All MV chordae originate from the one papillary muscle
Ebstein’s Anomaly
Apical displacement (>1cm) & dysplasia of the septal & posterior TV leaflets
Small RV cavity & dilated RA due to atrialisation
Eccentric TR
Tricuspid stenosis can occur due to the malformation of the TV
Also check for: Pulmonary stenosis, ASD & VSD
Arrhythmias are also common i.e. WPW and SVT
Assess the TV from all views, but best seen in Apical 4 chamber view
InHealth Echotech Reporting Guidelines Date of issue: Mar 2018 Version: V018 Date for review: Nov 2018 SOP Owner: Cheryl Barton Page 28 of 29
Basic Congenital Abnormalities
What to look for
Down’s Syndrome
ASD
VSD
AVSD either partial (AV cushion defect) or Complete (Common
Noonan’s Syndrome
Pulmonary stenosis
Sub-pulmonary stenosis
If there are limited parasternal views, try visualising the PV from
Turner’s Syndrome
Aortic stenosis
Bicuspid AV
Aortic co-arctation
VSD
Aortopathy
Remember to perform the supra-sternal view including aortic
William’s Syndrome
Supra aortic stenosis
PA branch stenosis
If there are limited parasternal short axis views, try visualising
the PA branches from a sub-costal short axis view
If you are unsure about any possible congenital abnormality or syndrome, record all the views including supra-sternal and look at all the valves in detail.
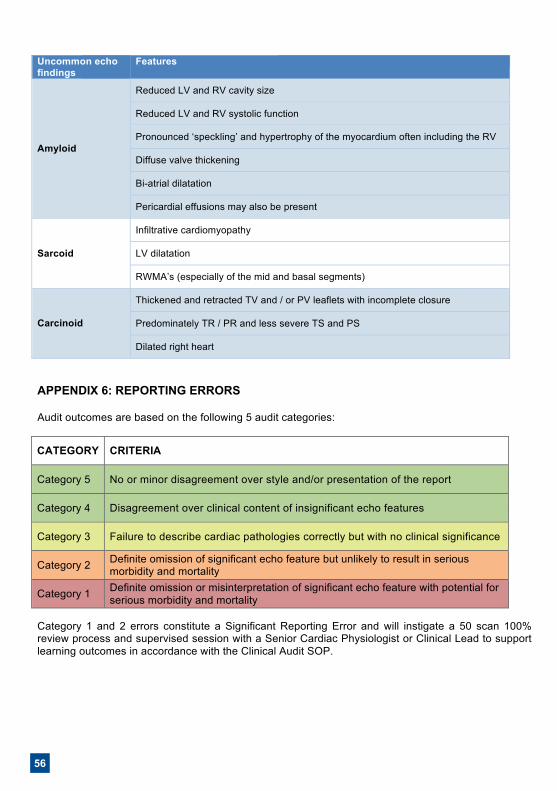
56
InHealth Echotech Reporting Guidelines Date of issue: Mar 2018 Version: V018 Date for review: Nov 2018 SOP Owner: Cheryl Barton Page 29 of 29
Uncommon echo findings
Features
Amyloid
Reduced LV and RV cavity size
Reduced LV and RV systolic function
Pronounced ‘speckling’ and hypertrophy of the myocardium often including the RV
Diffuse valve thickening
Bi-atrial dilatation
Pericardial effusions may also be present
Sarcoid
Infiltrative cardiomyopathy
LV dilatation
RWMA’s (especially of the mid and basal segments)
Carcinoid
Thickened and retracted TV and / or PV leaflets with incomplete closure
Predominately TR / PR and less severe TS and PS
Dilated right heart
APPENDIX 6: REPORTING ERRORS Audit outcomes are based on the following 5 audit categories:
CATEGORY CRITERIA
Category 5 No or minor disagreement over style and/or presentation of the report
Category 4 Disagreement over clinical content of insignificant echo features
Category 3 Failure to describe cardiac pathologies correctly but with no clinical significance
Category 2 Definite omission of significant echo feature but unlikely to result in serious morbidity and mortality
Category 1 Definite omission or misinterpretation of significant echo feature with potential for serious morbidity and mortality
Category 1 and 2 errors constitute a Significant Reporting Error and will instigate a 50 scan 100% review process and supervised session with a Senior Cardiac Physiologist or Clinical Lead to support learning outcomes in accordance with the Clinical Audit SOP.
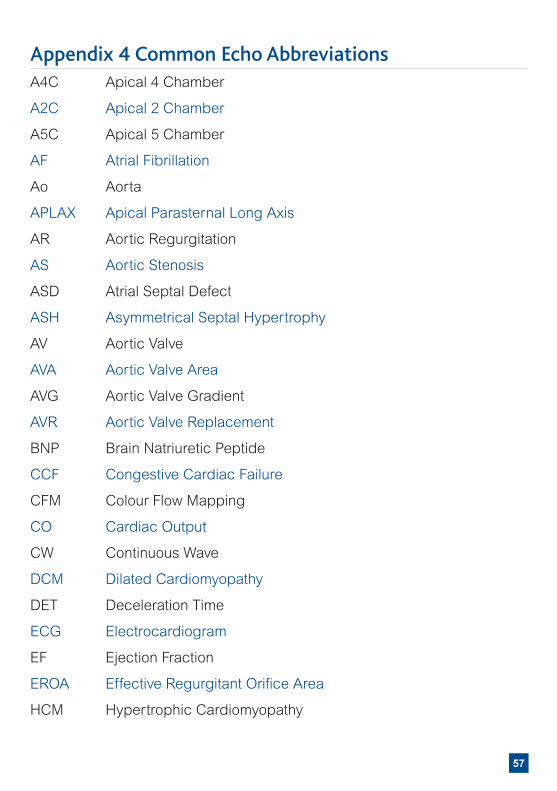
57
Appendix 4 Common Echo AbbreviationsA4C Apical 4 Chamber
A2C Apical 2 Chamber
A5C Apical 5 Chamber
AF Atrial Fibrillation
Ao Aorta
APLAX Apical Parasternal Long Axis
AR Aortic Regurgitation
AS Aortic Stenosis
ASD Atrial Septal Defect
ASH Asymmetrical Septal Hypertrophy
AV Aortic Valve
AVA Aortic Valve Area
AVG Aortic Valve Gradient
AVR Aortic Valve Replacement
BNP Brain Natriuretic Peptide
CCF Congestive Cardiac Failure
CFM Colour Flow Mapping
CO Cardiac Output
CW Continuous Wave
DCM Dilated Cardiomyopathy
DET Deceleration Time
ECG Electrocardiogram
EF Ejection Fraction
EROA Effective Regurgitant Orifice Area
HCM Hypertrophic Cardiomyopathy
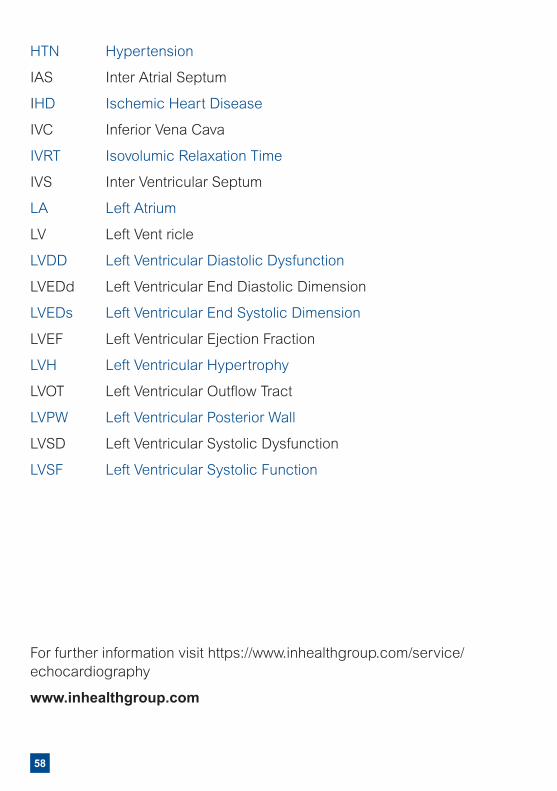
58
HTN Hypertension
IAS Inter Atrial Septum
IHD Ischemic Heart Disease
IVC Inferior Vena Cava
IVRT Isovolumic Relaxation Time
IVS Inter Ventricular Septum
LA Left Atrium
LV Left Vent ricle
LVDD Left Ventricular Diastolic Dysfunction
LVEDd Left Ventricular End Diastolic Dimension
LVEDs Left Ventricular End Systolic Dimension
LVEF Left Ventricular Ejection Fraction
LVH Left Ventricular Hypertrophy
LVOT Left Ventricular Outflow Tract
LVPW Left Ventricular Posterior Wall
LVSD Left Ventricular Systolic Dysfunction
LVSF Left Ventricular Systolic Function
For further information visit https://www.inhealthgroup.com/service/echocardiography
www.inhealthgroup.com

59
BUCKINGHAMSHIRE
Mid & South Bucks Diagnostic Centre
CAMBRIDGESHIRE
Peterborough City Hospital
Trinity Surgery
ESSEX
Douglas Grove Sugery
Hainault HC
Halstead Hospital
IDC Hornchurch
Moulsham Lodge Clinic
HAMPSHIRE
Adelaide Centre
Care UK Outpatients Dept Royal South Hants
Care UK St Marys NHS treatment Centre
Gosport War Memorial Hospital
Havant NHS Diagnostic Centre
Royal South Hants
The Chase Community Hospital
ISLE OF WHITE
Sandown Health Centre
Wootton Bridge Surgery
LEICESTERSHIRE
Ashleigh Clinic
Braunstone Health & Social Care Centre
Coalville Community Hospital
Fielding Palmer - Lutterworth
Hinckley & District Hospital
Hinckley Health Centres
Loughborough Community Hospital
Market Harborough & District Hospital
Melton Mowbray Community Hospital
Rosebery Medical Centre
Rutland Memorial Hospital
St Lukes Treatment Centre
St Peter’s Health Centre
Syston Health Centre
The Croft Medical Centre
The Surgery @ Aylestone
The Willows Medical Centre
LINCOLNSHIRE
County Hospital Louth
The Beacon Medical Practice
The Boston Health Clinic
The Johnson Community Hospital
The Marisco Medical Practice
LONDON
InHealth North London Diagnostic Centre
Appleby Health Centre
Fulham Health Clinic
Grovelands
IDC Golders Green
IDC Stratford
IDC Waterloo (Vista)
InHealth Ealing
Kentish Town
Langthorne Health Centre
Lordship Lane HC
The Centre
MIDDLESEX
Sudbury PCC
MIDLOTHIAN (SCOTLAND)
Army Assessment Centre Glencorse
NORFOLK
BMI Sandringham Hospital
OXFORDSHIRE
Abingdon Hospital
Chipping Norton Health Centre
Victoria House Surgery
Wallingford Community Hospital
Witney
Witney Community Hospital
SOUTH YORKSHIRE
Rotherham Community Health Centre
STAFFORDSHIRE
Army Assessment Centre Lichfield
Bentilee Neighbourhood Centre
Bradwell Hospital
STOKE-ON-TRENT
Tunstall Primary Care Centre
SURREY
Army Assessment Centre Pirbright
Birchwood Medical Practice
Emberbrook Community Health Centre
Oxted Health Centre
WEST SUSSEX
Angmering Medical Centre
Bersted Green Surgery
Northbourne Medical Centre
Old Shoreham Road Surgery Lancing
Park Surgery
St Lawrence Surgery
WILTSHIRE
Army Officer Selection Board Westbury

60
INHEALTH GROUP
InHealth is the UK’s largest specialist provider of diagnostic and healthcare solutions. Our mission is to make healthcare better and we do this by working with hospitals and commissioners across the NHS and independent sector. With over 25 years’ experience, our flexible and dynamic approach is helping to meet some of health’s most pressing challenges – reducing waiting times, speeding up diagnoses, saving money and improving the overall patient experience. Our ventures team is committed to investing in emerging technologies and services from across the world to improve patient outcomes. InHealth’s services span numerous disease areas and we provide tests, scans and examinations for more than 2 million patients a year across the UK.
We work across prevention, diagnostics and pathways & interventionAAA Screening, Breast Screening, Bowel Screening, Diabetic Eye Screening, MRI, CT, PET CT, X Ray, Ultrasound, DEXA, Reporting, Cardiac, Endoscopy, Audiology, Histopathology, MSK, ENT, GI, Cardiology, Pain Management, Referral Management, CHIS.
Putting quality at the heart of our businessbeing CQC registered, an Investor in Peopleand carrying ISO27001 accreditation forinformation Security Management.
>98%
98% of our patients are likely or more than likely to recommend us to friends and family.
Building information to improve medicaloutcomes, aligning ourselves with NHSsystems, being connected to ther N3network, IGSOC accredited, an e-RS provider and fully intergrated with the NHSImage Exchange Portal (IEP).
Trust Fresh Thinking
CarePassion

61
NOTES

62
NOTES

63
NOTES
With the expansion of imaging diagnostic services in primary care, this handbook aims to cover the use of echocardiography in the management of clinical disease processes.
The detailed principles of ultrasound are not covered but it is hoped the reader will gain information that will allow better understanding of the reasons for requesting an echo and how the results should be interpreted in a clinical context.
ECHOTECH
0256_January 2019 Copyright © 2019 InHealth Limited
InHealth | Beechwood Hall | Kingsmead RoadHigh Wycombe | HP11 1JL
T: 01494 560000www.inhealthgroup.com