Embed Size (px)
Citation preview

Issues in Political Economy, Vol 26(1), 2017, 162-180
162
Effects of Fiscal Policy on Consumer Confidence Sara Omohundro, Butler University
In the current era of near-zero interest rates and potential decline in monetary policy
effectiveness, fiscal policy will likely become more heavily relied on to combat recessions. A
deeper understanding of this economic tool is therefore necessary for the government to
implement it more effectively in the future. One area of research that requires more attention is
the effect fiscal policy can have on consumer confidence. Consumer confidence is an important
metric because it is sensitive to changes in government policy, especially during a recession.
Furthermore, consumer confidence indexes are often used to analyze and even possibly predict
consumer spending and economic growth. Many studies have provided evidence for these
conclusions. Nevertheless, the fiscal policy – consumer confidence relationship has often been
neglected in economic research. The majority of fiscal policy studies seek to quantify the
relationship between fiscal policy and output, which fails to account for changing consumer
expectations. There have been a few studies focused explicitly on the relationship between fiscal
policy and consumer confidence, but these also face shortcomings associated with using
historical data. This study seeks to address these issues by conducting a survey of consumers.
The consumers are faced with a hypothetical recession scenario followed by a randomly chosen
combination of tax cuts and government spending increases and then asked to respond to an
altered version of the Consumer Confidence Index survey. Demographic data is also accounted
for in a regression to determine whether it is actually the government’s fiscal policy actions, or
some other factor, that contributes to a person’s consumer confidence. The study found that a
combination of tax cuts and government spending resulted in the highest level of consumer
confidence, and there were no demographic factors measured that contributed significantly to
consumer confidence.
I. Literature Revivew
There are many studies that provide evidence that fiscal policy does, in fact, have an effect on
the economy. Prior research has primarily measured this effect through output. For instance, in
regard to taxes, Romer and Romer (2007) determined that a 1% increase in taxes in the post-
World War II United States resulted in a 3% decrease in GDP. Likewise, for government
spending, Auerbach and Gorodnichenko (2012) found that the average government spending
multiplier during a recession was between 1 and 1.5. Thus for every dollar spent by the
government, up to $1.50 of output was created.
Unfortunately, there are shortcomings to the output approach. The models behind spending
multiplier studies use different techniques and assumptions, and therefore they may not be
comparable. For studies on taxes, the most common method is to analyze historical output data
and draw empirical conclusions. This methodology based on data from the past does not
necessarily have external validity that extends to today. Furthermore, Parker (2011) argues that
the business cycle is not always taken into consideration, which could skew the results of the
data. He also argues that there is an insufficient amount of historical data to draw from because
there have been very few deep recessions in United States history.

Issues in Political Economy, 2017(1)
163
Besides technical shortcomings, there are theoretical reasons for finding alternative measures for
analyzing fiscal policy effectiveness. The output approach simply confirms that a relationship
between fiscal policy and economic output exists and attempts to quantify it. It does not account
for changing consumer expectations, which could be a critical connection between the
implementation in fiscal policy and the ultimate increase in output. In order to better understand
how fiscal policy affects the economy, one must understand how fiscal policy affects the
consumer. Studies have shown that high consumer confidence leads to increased consumer
spending, which increases economic output. This is important because consumer spending
accounts for 60-70% of GDP (Cotsomitis & Kwan, 2006). Since it is the economic indicator
most closely related to consumer behavior, it is a useful gauge as to why consumers are affected
by some fiscal policies more than others.
Consumer confidence is a convenient measurement tool because it can be measured accurately
and frequently. Consumer confidence is measured in the United States by two main indexes: the
Consumer Confidence Index (CCI) by the Conference Board and the University of Michigan
Index of Consumer Sentiment (ICS). Each index is derived from data collected via survey. The
surveys of both indexes are five questions long. Two questions pertain to current economic
conditions, while the other three involve future economic predictions (Bram and Ludvigson,
1998). Each question is directed at the respondent’s personal financial and consumption
information and is broad enough so that any person can answer the survey, regardless of his or
her knowledge in economics. The questions for each index can be seen in Appendix A. The
primary difference in the indexes is sample size. The CCI conducts its survey via mail and has a
sample size of about 3,500. In comparison, the ICS conducts its survey via phone and has a
sample size of about 500. The final indexes are then calculated using slightly different methods
and are released at the end of each month. Although these calculations generally result in
different numbers (a change of 1 point in the ICS is equivalent to a 2 point change in the CCI),
the two indexes have an extremely high level of correlation (Bram and Ludvigson, 1998). The
CCI and ICS provide the vehicles through which consumer confidence is measured.
Consumer confidence is a powerful metric because not only does it offer insight to consumers’
perspective of the current state of the economy, but many researchers believe that it can predict
future consumer spending patterns as well. This is because higher consumer confidence results in
less saving, which implies a higher marginal propensity to consume (Souleles, 2001). As a result,
consumers increase their consumption spending and therefore also increase economic output. As
evidence of this claim, a study by Bram and Ludvigson (1998) concluded that consumer
confidence not only helps predict consumption, but may also act as a catalyst for fluctuations in
the economy. Fuhrer, Carrol, and Wilcox (1994) determined that lagged ICS values alone
explained 14% of the variation in personal consumption expenditure growth. Graber (1982) also
offers a logical explanation as to why consumer confidence affects spending and output. In some
matters such as politics, people may be uninformed or have little desire to form an opinion if it
does not directly affect their lives. Economics is different because people have no choice. They
must form opinions on the economy because they have to make important financial decisions. As
a result, most people’s behavior follows their opinions on economic conditions. To some extent,
people’s perceptions of the economy may even become a self-fulfilling prophecy.

Fiscal Policy and Consumer Confidence
164
It is evident that both fiscal policy and consumer confidence can impact economic output, but the
relationship between fiscal policy and consumer confidence remains to be analyzed.
Unfortunately, existing research in this area is relatively limited. One of the few existing studies
is by Konstantinou and Tagkalakis (2011), who investigated whether or not fiscal policy can
directly increase consumer confidence. For taxes, Konstantinou and Tagkalakis (2011) analyzed
direct versus indirect taxes and their impacts on consumer confidence. A tax is considered direct
when it is both imposed upon and collected from the consumer, such as an income tax. A tax is
considered indirect when it is imposed upon the consumer but collected by another entity, such
as sales tax collected by a store. The study found that an increase in a direct tax cut had a
negative and statistically significant effect on consumer confidence, as would be expected.
However, the results for an indirect tax increase were insignificant.
The study divided government spending into three categories: government wage, non-wage, and
investment spending. Wage spending refers to the government payroll and the number of people
employed by the government. Non-wage spending refers to other forms of government spending,
including defense and consumption spending. Investment spending was considered to be when
the government purchases capital goods that will go towards increasing output in the long run.
Konstantinou and Tagkalakis (2011) found that non-wage government spending had a large,
positive statistically significant effect on consumer confidence, but wage and investment
spending had a small, negative statistically significant effect on consumer confidence.
While the study by Konstantinou and Tagkalakis (2011) was important for establishing the fiscal
policy – consumer confidence relationship, more work clearly needs to be done within this area.
The study successfully described relationships between government spending, taxes, and
consumer confidence, but it was not necessarily trying to compare the two forms of fiscal policy.
In order to make a direct comparison of expansive fiscal policy effectiveness, the study would
need to analyze a tax decrease along with a government spending increase. In addition, the study
used historical data. As previously noted in regard to studies using the output approach,
quantitative studies using historical data face many shortcomings, including simplifying
assumptions, limited time periods of data, and the inability to extrapolate historical results into
the future. In addition, these quantitative, historical studies on the fiscal policy – consumer
confidence relationship also neglect to account for important qualitative characteristics of the
consumer. Perhaps there are demographic factors that have more explanatory power on
consumer confidence levels than the fiscal policy approaches themselves.
Other studies pertaining to optimism have found evidence that this could be true. For instance,
Jacobsen, Lee, Marquering, and Zhang (2010) discovered that men are more optimistic than
women in all major economic indicators, even after income, employment, wealth, education, and
marital status are controlled for. Dominitz and Manski (2004) also found that younger people are
more optimistic than older people and that optimism increases with education level. Race also
plays a role: Asians were determined to be the most optimistic, followed by non-Hispanic white,
Hispanic, non-Hispanic black, and lastly American Indians. Marital status also had an effect on
optimism that was reflected by age; those who were never married tended to be young and the
most optimistic, followed by those who were married, those who were divorced, and finally
those who were widowed were the least optimistic and also tended to be older. Analysis of the
impact of demographic factors on consumer confidence could provide valuable evidence as to

Issues in Political Economy, 2017(1)
165
whether the government is even able to influence consumer expectations through fiscal policy. It
is possible that these demographic factors better explain consumer confidence than government
policy.
In order to address the shortcomings of using historical data and neglecting demographic
information, a different type of methodology warrants consideration. A survey of current
consumers that can capture both their demographic characteristics and their reaction to a
potential change in fiscal policy may begin to address these issues. Such is the methodology of
this study. It is also intuitive to use a survey methodology to measure the impact of fiscal policy
on consumer confidence because that is how consumer confidence itself is primarily measured.
This study collects consumer confidence data via questions mimicking the CCI, a survey for
which there is already strong evidence of its validity and economic impacts.
II. Methodology
The survey was administered to undergraduate students at Butler University. More specifically,
the survey was administered to an email listserv of 400 students in the Butler University Honors
Program. These students varied from First Year Students to Seniors and had a variety of majors
from all of the University’s colleges. The students are from every geographic region in the
United States, as well as a few international students; however, the vast majority hail from the
Midwest. Both male and female students were surveyed. Based on the demographics of Butler
University’s undergraduate population, it can be assumed that almost all of the students are aged
18-22 and unmarried.
Ideally, the survey would have liked to use a sample of the general United States adult
population as subjects. This would allow for a more accurate representation of consumers in the
United States and more meaningful results. A group of university students is obviously not
representative of all United States consumers. In addition, certain relevant demographic factors
had to be omitted from the survey, such as income level, education level, age, and marital status.
There was not enough diversity in the sample of Butler University students to collect meaningful
data on these questions. Unfortunately, the limited resources of this study did not allow for the
collection of data from a nation-wide sample. Using a service that charges a fee in exchange for
finding survey respondents in the desired population sample was considered, but it was deemed
to be too risky since there is no way to guarantee that the data is valid. It is possible that the
individuals taking the survey through such a service are doing so hurriedly and not in good faith
to collect commission for completing the survey, or that the service is not administering the
survey to the people it said it would. There is also the possibility that the service does not
adequately prevent robots from randomly completing surveys to collect commission. It was
ultimately decided that administering the survey to Butler University students in a relatively
controlled setting would be the safest alternative.
The survey first asked respondents to answer general demographic questions, including gender,
year in college, college of primary major, geographic region of the United States (hometown),
and political affiliation. The respondent was given options to choose from for each question.
Again, these demographic factors were chosen because they could be reliably measured based on
the diversity of the sample. Although limited, this sample still provided the opportunity to

Fiscal Policy and Consumer Confidence
166
measure factors that have not previously been studied in consumer confidence, such as college
major, hometown, and political affiliation.
The final question in the demographics section of the survey was whether or not the respondent
had taken an economics course in either high school or college. The purpose of this question was
not to provide any explanatory value, but rather to better control the data in case respondents
without a basic understanding of economics were unable to rationally answer the following
survey questions. If the data collected from respondents that said they had never taken an
economics course was significantly different or outlying from those that had, then it would be
removed from the data set during the analysis.
Next the survey asked the respondent to read a hypothetical recession scenario. The scenario was
as follows:
The unemployment rate in your hometown has recently increased from 5% to 8%.
Economic growth in your hometown has recently decreased from 6% to 1%. Your
family’s total annual personal income has recently decreased by 6%. The federal
government has decided to implement a fiscal policy during the next six months.
The percentages used were calculated by finding the average percentage change of unemployment,
economic growth, and personal income during each recession period in the United States from
1970 onwards. The data sets used to make the calculations were accessed from the Federal Reserve
Economic Data (FRED) provided by the St. Louis Federal Reserve Bank. Percentages were used
instead of dollar amounts so that each respondent could better perceive the economic change
relative to their hometown. Hometown was used instead of current town in order to gain more
diverse data. If current town was used, then it is likely that most of the respondents would have
assumed the town was Indianapolis, Indiana, where Butler University is located. The wording
“family’s total personal income” instead of simply “personal income” was used because many
college students do not have jobs or significant incomes; the incomes of their parents or other
family members may be more relevant to consider in a recession. Six months was chosen as the
time period during which the government would implement a fiscal policy because the government
realistically needs some time to pass and execute a change in fiscal policy. However, the time
period could not extend too far into the future in order to be able to measure consumer confidence
as a direct result of the fiscal policy change.
Next the respondents were presented with one of six hypothetical fiscal policy scenarios distributed
at random. The six potential scenarios a respondent could have received are:
1. The federal government will do nothing.
2. The federal government will increase spending on defense, roads and bridges, and
unemployment insurance by 10% each for a year based on the current budget.
3. The federal government will decrease personal income taxes across the board by
10% for a year.
4. The federal government will increase spending on defense, roads and bridges, and
unemployment insurance by 5% each for a year based on the current budget and
will decrease personal income taxes across the board by 5% for a year.
Issues in Political Economy, 2017(1)
167
5. The federal government will increase spending on defense, roads and bridges, and
unemployment insurance by 7.5% each for a year based on the current budget and
will decrease personal income taxes across the board by 2.5% for a year.
6. The federal government will increase spending on defense, roads and bridges, and
unemployment insurance by 2.5% each for a year and will decrease personal
income taxes across the board by 7.5% for a year.
The first scenario in which the federal government does nothing serves as the control group. The
other five scenarios consisted of a tax cut, government spending increase, or combination of the
two. 10% was chosen as the amount of the fiscal policy change because that was the calculated
average increase in government spending during recession periods in the United States from 1970
onwards, based on the FRED database. A year was chosen as the duration for the fiscal policy
because that was a realistic time frame for the government to begin implementing the policy and
for consumers to begin seeing its effects. For taxes, the wording “personal income taxes across the
board” was also used because that was the most direct tax that could apply to the most people. For
government spending, the wording “defense, roads and bridges, and unemployment insurance”
were used in order to incorporate a variety of non-wage government spending. Saying “roads and
bridges, and unemployment insurance” instead of “investment and consumption” also made the
types of government spending easier for someone with limited knowledge of economics to
understand.
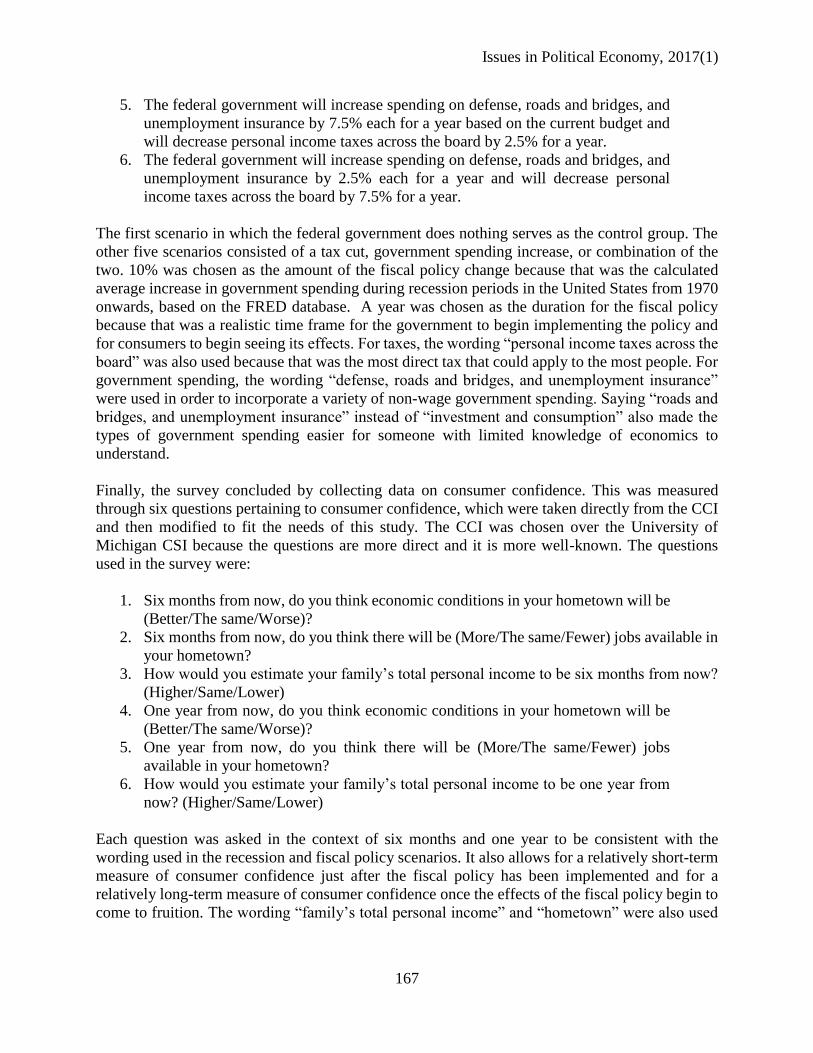
Finally, the survey concluded by collecting data on consumer confidence. This was measured
through six questions pertaining to consumer confidence, which were taken directly from the CCI
and then modified to fit the needs of this study. The CCI was chosen over the University of
Michigan CSI because the questions are more direct and it is more well-known. The questions
used in the survey were:
1. Six months from now, do you think economic conditions in your hometown will be
(Better/The same/Worse)?
2. Six months from now, do you think there will be (More/The same/Fewer) jobs available in
your hometown?
3. How would you estimate your family’s total personal income to be six months from now?
(Higher/Same/Lower)
4. One year from now, do you think economic conditions in your hometown will be
(Better/The same/Worse)?
5. One year from now, do you think there will be (More/The same/Fewer) jobs
available in your hometown?
6. How would you estimate your family’s total personal income to be one year from
now? (Higher/Same/Lower)
Each question was asked in the context of six months and one year to be consistent with the
wording used in the recession and fiscal policy scenarios. It also allows for a relatively short-term
measure of consumer confidence just after the fiscal policy has been implemented and for a
relatively long-term measure of consumer confidence once the effects of the fiscal policy begin to
come to fruition. The wording “family’s total personal income” and “hometown” were also used

Fiscal Policy and Consumer Confidence
168
for consistency with the recession scenario. A full version of the survey can be found in Appendix
B.
Out of 400 students who received the survey, 286 responded. The number of responses for each
of the six randomly distributed versions of the survey varied from 44 to 48. Unfortunately, there
were some respondents who answered the demographic questions at the beginning of the survey
and then chose not to respond to the consumer confidence questions. There were 34 such incidents,
which were removed from the data set. The number of respondents who did not complete the
consumer confidence questions at the end of the survey varied across each scenario from three to
nine. 252 surveys were completed in entirety.
Once the data was collected, an overall consumer confidence score for each respondent was
calculated. Each response option of the six consumer confidence questions at the end of the
survey was given a numeric value. The options “Better”, “More”, and “Higher” were allotted a
value of three, the options “The same” or “Same” were allotted a value of two, and the options
“Worse”, “Fewer”, and “Lower” were allotted a value of one. The values of one, two, and three
were held constant across all six consumer confidence questions; there was no clear reason to
weight certain questions over others. The response values for the six questions were then simply
added together to determine the consumer confidence score for each respondent. A score could
not be calculated for those who did not answer the consumer confidence questions; therefore a
total of 252 scores were calculated.
III. Data Analysis
First the data had to be evaluated for biases between those respondents who did and did not
complete the consumer confidence questions. This was to ensure that there was not an inherent
demographical difference between the two groups that could affect the outcome of the data. In
order to analyze the consumer confidence scores, the group of incomplete responses would
necessarily have to be removed from the data set. If there was a difference in demographics
between the two groups, then the following data analysis on the consumer confidence scores
would be skewed in terms of this difference.
The data was evaluated for such biases by performing t-tests on the means of each of the
demographic factors between those who did and did not complete the consumer confidence
questions. It was ultimately determined that there were no statistically significant differences in
the means amongst any of the demographic factors between those who did and did not complete
the consumer confidence questions. There was, however, a statistically significant difference in
the means for the question of whether or not the respondent had taken an economics course in
either high school or college. Those who completed the consumer confidence questions were
more likely to have taken an economics course than those who did not complete the consumer
confidence questions. This makes intuitive sense; people who have less understanding of
economics may feel less inclined to complete a survey focused on the subject. As a result, the
data was biased only in the sense that those who received a consumer confidence score were
more likely to have taken an economics course. Since none of the demographic factors
themselves were biased between those who had and had not completed the survey, no
adjustments were made.

Issues in Political Economy, 2017(1)
169
The data was also evaluated for a potential bias between the completed responses of those who
had versus those who had not taken an economics course. A t-test of the consumer confidence
score means between the two groups was not statistically significant. There was no evidence that
respondents who had not taken an economics course were unable to rationally answer the
consumer confidence questions, and therefore no adjustments were made to the data set.
Besides having taken an economics course, the average respondent who received a consumer
confidence score was most likely to be a female Junior Liberal Arts major from the Midwest who
identifies politically as a Republican. These were the modes for each demographic factor. The
average respondent who did not complete the consumer confidence questions differed by
identifying as a Democrat; however, this difference was not statistically significant. The average
respondent for the two groups combined matched that of the average respondent who received a
consumer confidence score.
The data analysis that yielded the primary results of this study was twofold. First, a single factor
ANOVA followed by additional t-tests were done between the six fiscal policy scenarios to
determine if there were statistically significant differences between each scenario’s average
consumer confidence score. This offered insight as to what extent the scores of the six scenarios
differed by and validated which scenarios had the highest and lowest consumer confidence
scores. Second, an ordinary least squares (OLS) regression using all of the demographic factors
and fiscal policy scenarios as cross-sectional variables was used to evaluate the causality of the
consumer confidence scores. The regression showed to what extent each demographic factor and
fiscal policy scenario contributed to the consumer confidence scores.
IV. Results
At the most basic level, these results show that some form of federal government fiscal policy
action during a recession will lead to greater levels of consumer confidence than if the
government does nothing. As seen in Tables 1 through 3, the first scenario of government
inaction had the lowest average consumer confidence score, and the differences between this
average and those of all the other scenarios were statistically significant. Another conclusion
from these results is that incorporating a decrease in personal income taxes into a fiscal policy
plan leads to higher consumer confidence than a fiscal policy plan without it. All of the fiscal
policy scenarios involving a tax decrease (scenarios three through six) had higher average
consumer confidence scores than the scenarios without a tax decrease (scenarios one and two).
The differences between the scenarios without a tax decrease and the scenarios with a tax
decrease were all statistically significant. However, the magnitude of the tax decrease does not
seem to make much of a difference. The scenario with the highest average consumer confidence
score was evenly split between a decrease in taxes and an increase in spending, but none of the
mean consumer confidence scores for the scenarios involving tax decreases were statistically
significantly different from each other. Additionally, all of the scenarios including a tax decrease
that also included a government spending increase (scenarios four through six) had a higher
average consumer confidence score than the scenario with a tax decrease only. However, this is a
relatively weak inference to make since the differences between the means of the tax decrease
only scenario and the tax decrease – spending increase combination scenarios were not
statistically significant.

Fiscal Policy and Consumer Confidence
170
Table 1. Mean Consumer Confidence Score by Scenario
Table 2. Existence of a Statistically Significant Difference between Scenario Means
Table 3. Scenario Key
Although these results are encouraging for proponents of fiscal policy, the t-test analysis does
not imply causation between fiscal policy and consumer confidence. It could be that other
variables, such as the demographic factors, are heavily contributing to the consumer confidence
scores. A regression comparing the demographic factors with the different fiscal policy scenarios
was therefore used to determine whether consumer confidence is actually affected by the
government’s fiscal policy actions or something else.

Issues in Political Economy, 2017(1)
171
The regression was a basic ordinary least squares model, and the variables were arranged as
cross sectional data using zero and one to indicate the presence of a scenario or demographic
factor. For the six scenarios and each set of cross-sectional demographic factors with more than
two options, one element had to be removed as a basis for comparison. The first scenario was
removed from the six because that is the scenario in which the government takes no action; thus
it functions as a control group. The College of Business was removed from College of Primary
Major because business students at Butler University are required to take three economics
courses and therefore may not have as much variance in their responses. In the first regression
that was created, International was removed from Geographic Region of the United States and
Other was removed from Political Affiliation. However, the results of the original regression
implied that there could be multicollinearity between these two factors. The statistical
significance of the Geographic Region of the United States variables were strong while the
statistical significance of the Political Affiliation variables were weak. It would make sense that
there would be multicollinearity between these two factors because people in the South and
Midwest tend to identify as Republicans, and people in the Northeast and West may more
frequently identify as Democrats. Furthermore, since only a few respondents identified as
International and Other, it was decided that it would be best to simply remove those two
categories from the data set altogether. Midwest was then removed for comparison from
Geographic Region of the United States in place of International because most students at Butler
University are from the Midwest. Independent was removed for comparison in place of Other for
Political Affiliation to better compare the two main political parties, Democrat and Republican.
Correlation coefficients between the six scenarios, the Geographic Region of the United States
variables, and the Political Affiliation variables were then calculated to ensure that
multicollinearity was no longer a problem. None of the correlation metrics indicated high levels
of correlation between any of those variables. The regression results are displayed in Table 4 and
Table 5.
Table 4. Regression Descriptive Statistics
Fiscal Policy and Consumer Confidence
172
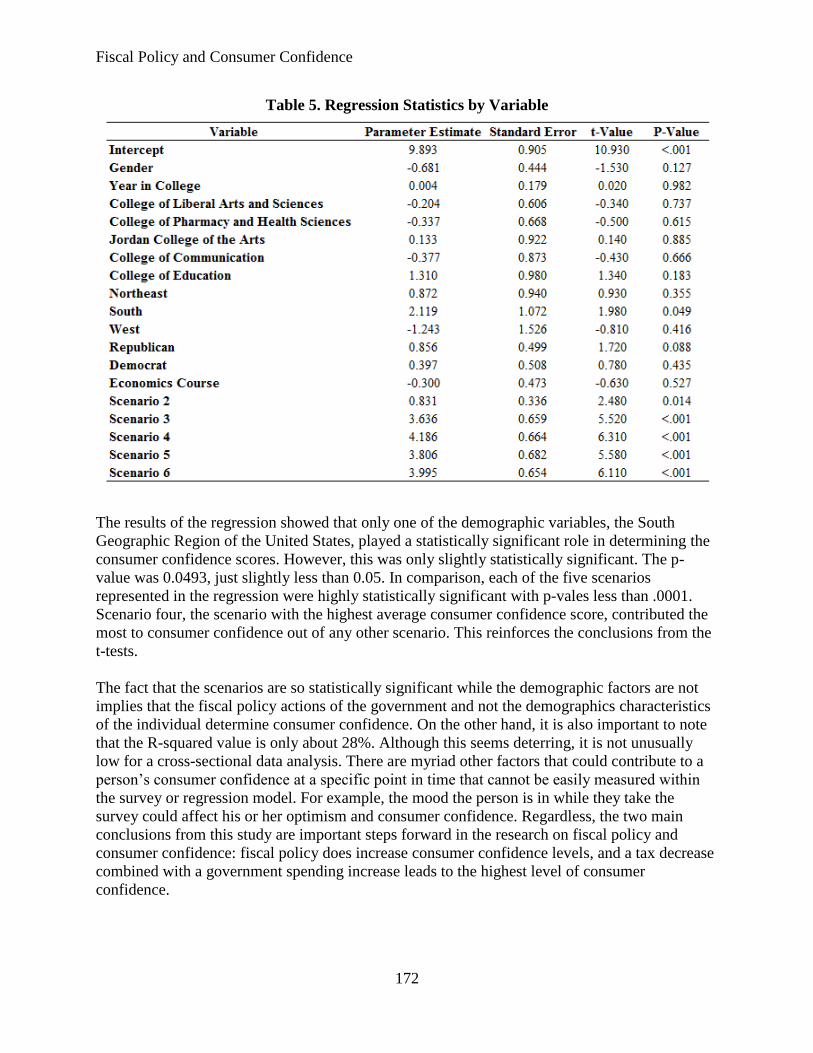
Table 5. Regression Statistics by Variable
The results of the regression showed that only one of the demographic variables, the South
Geographic Region of the United States, played a statistically significant role in determining the
consumer confidence scores. However, this was only slightly statistically significant. The p-
value was 0.0493, just slightly less than 0.05. In comparison, each of the five scenarios
represented in the regression were highly statistically significant with p-vales less than .0001.
Scenario four, the scenario with the highest average consumer confidence score, contributed the
most to consumer confidence out of any other scenario. This reinforces the conclusions from the
t-tests.
The fact that the scenarios are so statistically significant while the demographic factors are not
implies that the fiscal policy actions of the government and not the demographics characteristics
of the individual determine consumer confidence. On the other hand, it is also important to note
that the R-squared value is only about 28%. Although this seems deterring, it is not unusually
low for a cross-sectional data analysis. There are myriad other factors that could contribute to a
person’s consumer confidence at a specific point in time that cannot be easily measured within
the survey or regression model. For example, the mood the person is in while they take the
survey could affect his or her optimism and consumer confidence. Regardless, the two main
conclusions from this study are important steps forward in the research on fiscal policy and
consumer confidence: fiscal policy does increase consumer confidence levels, and a tax decrease
combined with a government spending increase leads to the highest level of consumer
confidence.

Issues in Political Economy, 2017(1)
173
V. Limitations
The most prominent limitation of this study is the narrow scope of survey respondents. A sample
of undergraduate Honors students from one small Midwestern university is not an accurate
sample of United States consumers as a whole. The data is uncontrollably biased towards the
demographics of these students. In addition, data on many demographic factors that could
contribute to consumer confidence could not be collected because they would not have enough
variance among undergraduate college students. For example, age, education level, personal
income level, and marital status would most likely be similar for most of the students surveyed.
Therefore there were many relevant variables that could have partially explained the consumer
confidence scores in addition to the scenarios and being from the South that were not accounted
for in the OLS regression. As previously explained, the resources available to this study
unfortunately limited the scope of the survey.
Nevertheless, this limitation does not render the results invalid. Although the scope of the sample
is small, it is still relevant on a local scale. These Butler University students will soon graduate,
enter the labor force, and become consumers with a high marginal propensity to consume.
Carrol, Slackalek, Tokuoka, and White (2016) found that younger people experience the most
rapid income growth, which encourages them to spend in an “impatient” manner and target a
lower level of savings. Considering many Butler University students stay in the greater
Indianapolis area after graduation, their spending habits could have significant implications for
the local economy. As previously described, people with a high marginal propensity to consume
are especially sensitive to changes in fiscal policy. Therefore, the results of this survey can still
be of particular use to the local government when designing fiscal policy.
In addition, the survey methodology of this study adds theoretical value that goes beyond the
practical limitations. The need for further research on the relationship between fiscal policy and
consumer confidence and the shortcomings of implementing this research through historical data
studies have been clearly delineated. This study offers a new approach to solving these problems.
The statistical significance of the results suggests that this methodology may work, although it
would need to be confirmed by further research that could extend the scope of the sample. At the
least, this study sets a foundation upon which other researchers can potentially build off of in the
future.
Another factor that could have affected the results is the current state of the economy. To keep
the survey simple, clear, and easy to apply to the respondent’s own life, no economic data was
given beyond what was provided in the recession scenario. While the respondent was asked to
envision the recession scenario described, it is possible that the respondent was still biased by the
present economic and political conditions. If the survey were re-administered during a different
phase of the economic cycle or election cycle, the results might have been different.
As in any survey, there is always the risk that the wording of the survey could be unclear to the
respondents. Although great amounts of detail and scrutiny went into the design of the survey,
there is still the possibility that the people actually taking the survey found something confusing
or interpreted the language in a way that was not intended.

Fiscal Policy and Consumer Confidence
174
A final limitation of this study is the multicollinearity issue that was discussed in the data
analysis. The problem was alleviated in the most reasonable way given the situation, but the
results could have been different if the Political Affiliation or Geographic Region of the United
States categories were removed altogether. For example, South, which was only slightly
statistically significant, might not have been statistically significant at all if Political Affiliation
had been removed. In addition, it is likely that the six scenarios themselves captured at least
some of the Political Affiliation data. Republicans, for instance, may respond with higher
consumer confidence towards a tax decrease and with lower consumer confidence towards a
government spending increase. The opposite would be true for Democrats. On the other hand, as
previously noted, correlation coefficients were calculated for each variable in the regression and
none indicated any further multicollinearity problems.
VI. Opportunities for Further Research
The first steps to expand upon this research would be to extend the sample from university
students to the general United States adult population and to include more demographic
variables. This would provide more meaningful results for United States consumers as a whole.
The sample size could also be dramatically increased, which would yield more solid results.
Although the resources of this study were too limited for this extension, it is a good opportunity
for other researchers with additional resources to build upon this work and add value to this area
of economic research.
Another interesting area for further research would be to replicate the method used in this study
to analyze the effects of monetary policy on consumer confidence. Monetary policy is often less
well-known and understood by the average consumer in comparison to fiscal policy, so it would
be interesting to see how monetary policy influences consumer confidence in comparison to
fiscal policy. A comparison of the effects of fiscal policy and monetary policy on consumer
confidence would also be helpful for designing future economic policy, especially today. Given
the current near-zero interest rate environment, there are many who believe that monetary policy
may no longer be as effective in influencing the economy because there is limited room to lower
interest rates (Bernanke, Reinhart, and Sack, 2004). Research comparing the effectiveness of
fiscal policy versus monetary policy as it pertains to consumer confidence may be valuable in
persuading the government to either take a stronger fiscal policy approach or reform the current
monetary policy situation.
Finally, this study could be altered to include government debt levels and financing methods,
such as borrowing from other governments or future tax increases, for the fiscal policy change.
Many consumers are concerned about government debt and take it into consideration when a
change in fiscal policy is announced. Tanner (1979) found that a decrease in taxes had little
effect on aggregate demand if consumers perceived that high levels of government debt would
result in higher taxes in the future. Including debt and financing methods was considered for this
study, but the number of independent variables would have increased exponentially if various
government debt levels or financing methods were included for each fiscal policy scenario. This
was determined to be beyond the scope of this study and therefore was not included, but it is a
topic for future consideration.

Issues in Political Economy, 2017(1)
175
VII. Conclusion
As one of the federal government’s main economic tools during a recession, fiscal policy is a
crucial area for further research. This is especially true today in the wake of the 2008 Financial
Crisis and the near-zero interest rate environment. Fiscal policy may need to play a larger role in
the future, so an increased focus on fiscal policy research is necessary. There has already been
extensive research done on the relationship between fiscal policy and output, but these studies
typically neglect changing consumer expectations and confidence. An effective fiscal policy plan
will also increase consumer confidence, which will then increase consumer spending and finally
increase output. Much research has already been done on the elements of this relationship chain,
but the key link between fiscal policy and consumer confidence is still missing. Little research
has been done in this area even though it can help explain why certain fiscal policy strategies are
more effective than others. The few studies that have been done on this relationship also face
shortcomings. Their reliance on historical data limits their validity and ability to account for
consumer demographics. This study offers a new way of approaching this research through a
survey methodology. The survey results not only validated the relationship between fiscal policy
and consumer confidence, but also determined that a tax decrease combined with a government
spending increase is the fiscal policy plan that increases consumer confidence the most. In
addition, this study found that many demographic factors do not significantly contribute to
consumer confidence, which further solidifies the causal relationship between fiscal policy and
consumer confidence. Albeit limited by the narrow scope of respondents, these results still have
local implications and are valuable steps forward towards the greater goal of understanding fiscal
policy and consumer confidence.
VIII. References
Alesina, A., Ardagna, S., Perotti, R., & Schiantarelli, F. (2002). Fiscal Policy, Profits, And
Investment. American Economic Review, 92(3), 571-589.
Auerbach, A., & Gorodnichenko, Y. (2012). Measuring the Output Responses to Fiscal Policy.
American Economic Journal, 4(2), 1-27.
Baxter, M. & King, R. (1993). Fiscal Policy in General Equilibrium. American Economic
Review, 83(3), 315-334.
Bernanke, B., Reinhart, V., & Sack, B. (2004). Monetary Policy Alternatives to the Zero Bound:
An Empirical Assesment. Federal Reserve Board Working Paper.
Blinder, A. S. (2008). Keynesian Economics. The Concise Encyclopedia of Economics.
Retrieved January 2, 2016, from The Library of Economics and Liberty:
http://www.econlib.org/library/Enc/KeynesianEconomics.html
Bram, J., & Ludvigson, S. (1998). Does Consumer Confidence Forecast Household Expenditure?
Economic Policy Review, June, 59-78.

Fiscal Policy and Consumer Confidence
176
Carroll, C.D., Fuhrer, J. C., & Wilcox, D. W. (1994). Does Consumer Sentiment Forecast
Household Spending? The American Economic Review, 84(5), 1397-1408.
Carroll, C., Slacalek, J., Tokuoka, K., & White., M. (2016). The Distribution of Wealth and the
Marginal Propensity to Consume.
Civilian Unemployment Rate [UNRATE]. US. Bureau of Labor Statistics. FRED, Federal
Reserve Bank of St. Louis.
Cotsomitis, J. A., & Kwan A. C. C. (2006). Can Consumer Confidence Forecast Household
Spending? Southern Economic Journal 72(3), 597-610.
Dominitz, J., & Manski, C. F. (2004). How Should We Measure Consumer Confidence? Journal
of Economic Perspectives, 18(2), 51-66.
Feldstein, M. (2009). Rethinking the Role of Fiscal Policy. American Economic Review, 99(2),
556-559.
Fuhrer, J. (1993). What Role Does Consumer Sentiment Play in the US Macroeconomy? New
England Economic Review, Jan/Feb, 32-44.
Government total expenditures [W068RCQ027SBEA]. US. Bureau of Economic Analysis.
FRED, Federal Reserve Bank of St. Louis.
Graber, D. A. (1982). Reading Between the Lines of Consumer Confidence Measures. The
Public Opinion Quarterly. 46(3), 336-339.
Gravelle, J. (2008). Tax Cuts and Economic Stimulus: How Effective are the Alternatives?
Congressional Research Service.
Hymans, S. H. (1970). Consumer Durable Spending: Explanation and Prediction. Brookings
Papers on Economic Activity, 1(2), 173-206.
Jacobsen, B., Lee, J.B., & Marquering, W. (2008) Are Men More Optimistic? Retrieved
November 20, 2013, from: http://ssrn.com/abstract=1030478
Jahan, S., Mahmud, A., & Papageorgiou, C. (2014, September). What is Keynesian Economics?
Finance and Development. Retrieved January 2, 2016, from The International Monetary Fund:
http://www.imf.org/external/pubs/ft/fandd/2014/09/basics.htm
Juster, T. & Wachtel, P. (1972). Anticipatory and Objective Models of Durable Goods Demand.
American Economic Review, 62(4), 564-579.
Konstantinou, P., & Tagkalakis, A. (2011). Boosting Confidence: Is There a Role for Fiscal
Policy? Elsevier, 28, 1629-1641.

Issues in Political Economy, 2017(1)
177
Ludvigson, S. C. (2004). Consumer Confidence and Consumer Spending. Journal of Economic
Perspectives, 18(2), 29-50.
McWhinney, J. (2013). Understanding the Consumer Confidence Index. Investopedia. Retrieved
October 24, 2013, from www.investopedia.com
Parker, J. A. (2011). On Measuring the Effects of Fiscal Policy in Recessions. Journal of
Economic Literature, 49(3), 703-718.
Perotti, R. (1999). Fiscal Policy in Good Times and Bad. Quarterly Journal of Economics,
114(4), 1399-1436.
Real Gross Domestic Product [A191RL1A225NBEA]. US. Bureau of Economic Analysis.
FRED, Federal Reserve Bank of St. Louis.
Real Median Household Income in the United States [MEHOINUSA672N]. US. Bureau of the
Census. FRED, Federal Reserve Bank of St. Louis.
Romer, C. D., & Romer, D. H. (2007). The Macroeconomic Effects of Tax Changes. American
Economic Review, 100(3), 763-801.
Souleles, N. (2001). Consumer Sentiment: Its Rationality and Usefulness in Forecasting
Expenditure. National Bureau of Economic Research, Working Paper No. 8410.
Tagkalakis, A. (2008). The Effects of Fiscal Policy on Consumption in Recessions and
Expansions. Journal of Public Economics, 92(5-6), 1468-1508.
Tanner, J. E. (1979). Fiscal Policy and Consumer Behavior. Review of Economics and Statistics,
61(2), 317-321.
Technical Note. (2011). The Conference Board. Retrieved November 10, 2013, from
www.conference-board.org
IX. Appendix A
Conference Board Consumer Confidence Index Questions:
1. How would you rate present general business conditions in your area? (good/normal/bad)
2. What would you say about available jobs in your area right now? (plentiful/not so
many/hard to get)
3. Six months from now, do you think business conditions in your area will be (better/the
same/worse)?
4. Six months from now, do you think there will be (more/same/fewer/) jobs available in
your area?

Fiscal Policy and Consumer Confidence
178
5. How would you guess your total family income to be six months from now?
(higher/same/lower)
University of Michigan Consumer Sentiment Index Questions:
1. Do you think now is a good or bad time for people to buy major household items? (good
time to buy/uncertain, depends/bad time to buy)
2. Would you say that you (and your family living there) are better off or worse off
financially than you were a year ago? (better/same/worse)
3. Now turning to business conditions in the country as a whole – do you think that during
the next twelve months we’ll have good times financially or bad times or what? (good
times/uncertain/bad times)
4. Looking ahead, which would you say is more likely – that in the country as a whole we’ll
have continuous good times during the next five years or so or that we’ll have periods of
widespread unemployment or depression, or what? (good times/uncertain/bad times)
5. Now looking ahead – do you think that a year from now, you (and your family living
there) will be better off financially, or worse off, or just about the same as now?
(better/same/worse)
Source: Bram, J., & Ludvigson, S. (1998). Does Consumer Confidence Forecast Household
Expenditure? FRBNY Economic Policy Review, June, 61, Box A.
X. Appendix B
Example of Survey:
Fiscal Policy Survey
The purpose of this survey is to collect data for an undergraduate research thesis. Your individual
response will be anonymous. Your participation is optional and voluntary.
Demographic Information:
Please circle the response that best describes you.
Gender: Male, Female
Year in College: First Year Student, Sophomore, Junior, Senior

Issues in Political Economy, 2017(1)
179
College of Primary Major: Liberal Arts and Sciences, Business, Pharmacy and Health
Sciences, Fine Arts, Communication, Education
Geographic Region of the United States (Hometown): Northeast, South, Midwest, West,
International
Political Affiliation: Republican, Democrat, Independent, Other
Have you taken an economics course in high school or college? Yes, No
Recession Scenario:
Please read the following scenario.
The unemployment rate in your hometown has recently increased from 5% to 8%. Economic
growth in your hometown has recently decreased from 6% to 1%. Your family’s total annual
personal income has recently decreased by 6%. The federal government has decided to
implement a fiscal policy during the next six months.
Fiscal Policy Scenario:
The federal government has decided to implement the following fiscal policy during the next six
months.
Each respondent will be presented with only one of the following scenarios. The scenarios will
be randomly distributed.
1. The federal government will do nothing.
2. The federal government will increase spending on defense, roads and bridges, and
unemployment insurance by 10% each for a year based on the current budget.
3. The federal government will decrease personal income taxes across the board by 10% for
a year.
4. The federal government will increase spending on defense, roads and bridges, and
unemployment insurance by 5% each for a year based on the current budget and will decrease
personal income taxes across the board by 5% for a year.
5. The federal government will increase spending on defense, roads and bridges, and
unemployment insurance by 7.5% each for a year based on the current budget and will decrease
personal income taxes across the board by 2.5% for a year.

Fiscal Policy and Consumer Confidence
180
6. The federal government will increase spending on defense, roads and bridges, and
unemployment insurance by 2.5% each for a year and will decrease personal income taxes across
the board by 7.5% for a year.
Consumer Confidence
Please circle your response to the following questions.
1. Six months from now, do you think economic conditions in your hometown will be
(Better/The same/Worse)?
2. Six months from now, do you think there will be (More/The same/Fewer) jobs available
in your hometown?
3. How would you estimate your family’s total personal income to be six months from now?
(Higher/Same/Lower)
4. One year from now, do you think economic conditions in your hometown will be
(Better/The same/Worse)?
5. One year from now, do you think there will be (More/The same/Fewer) jobs available in
your hometown?
6. How would you estimate your family’s total personal income to be one year from now?
(Higher/Same/Lower)
Thank you for participating in this survey.