Embed Size (px)
DESCRIPTION
Issues in Projecting Increased Risk of Cardiovascular Events to the Exposed Population. Robert T. O’Neill, Ph.D. Director, Office of Biostatistics February 18, 2005. Issues for Discussion. The approach we used (one of several) and why? Rofecoxib as an example - data sets available - PowerPoint PPT Presentation
Citation preview

1
Department of Health and Human Services
Center for Drug Evaluation and Research
Issues in Projecting Increased Risk of Cardiovascular Events
to the Exposed Population
Robert T. O’Neill, Ph.D.
Director, Office of BiostatisticsFebruary 18, 2005February 18, 2005

2
Department of Health and Human Services
Center for Drug Evaluation and Research
Issues for Discussion• The approach we used (one of several) and why? Rofecoxib as an
example - data sets available
• What do we know from the rofecoxib randomized controlled trials
(RCTs)
• Data sources for projections of events to the exposed population
• Model assumptions
• A range of estimates for different scenarios
• Uncertainties in the projection strategies
• Concluding remarks
3
Department of Health and Human Services
Center for Drug Evaluation and Research
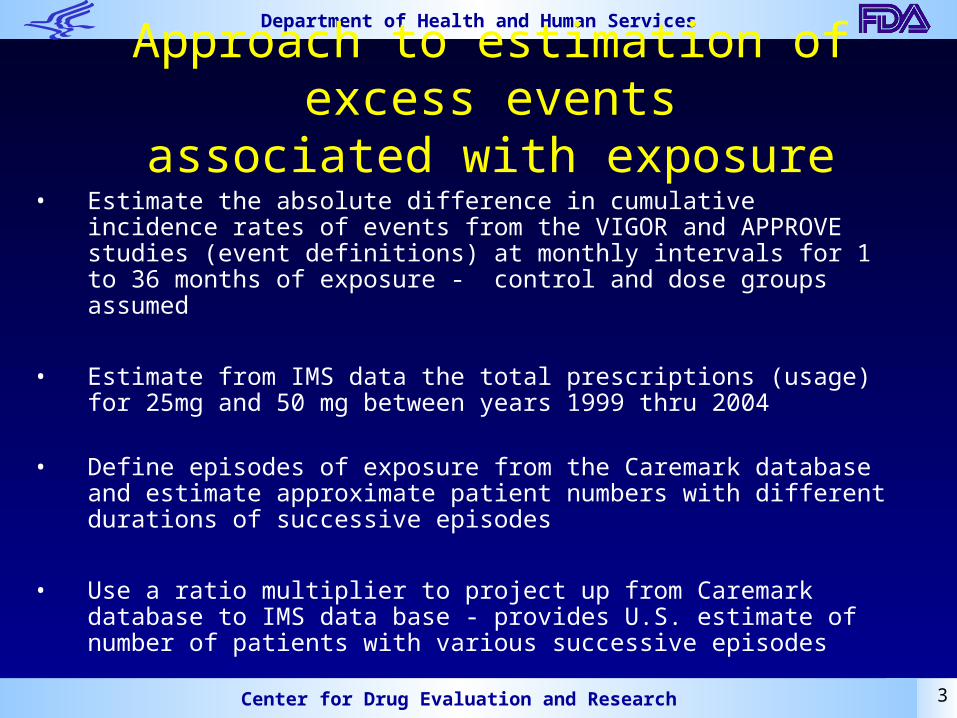
Approach to estimation of excess events
associated with exposure• Estimate the absolute difference in cumulative incidence
rates of events from the VIGOR and APPROVE studies (event definitions) at monthly intervals for 1 to 36 months of exposure - control and dose groups assumed
• Estimate from IMS data the total prescriptions (usage) for 25mg and 50 mg between years 1999 thru 2004
• Define episodes of exposure from the Caremark database and estimate approximate patient numbers with different durations of successive episodes
• Use a ratio multiplier to project up from Caremark database to IMS data base - provides U.S. estimate of number of patients with various successive episodes
4
Department of Health and Human Services
Center for Drug Evaluation and Research
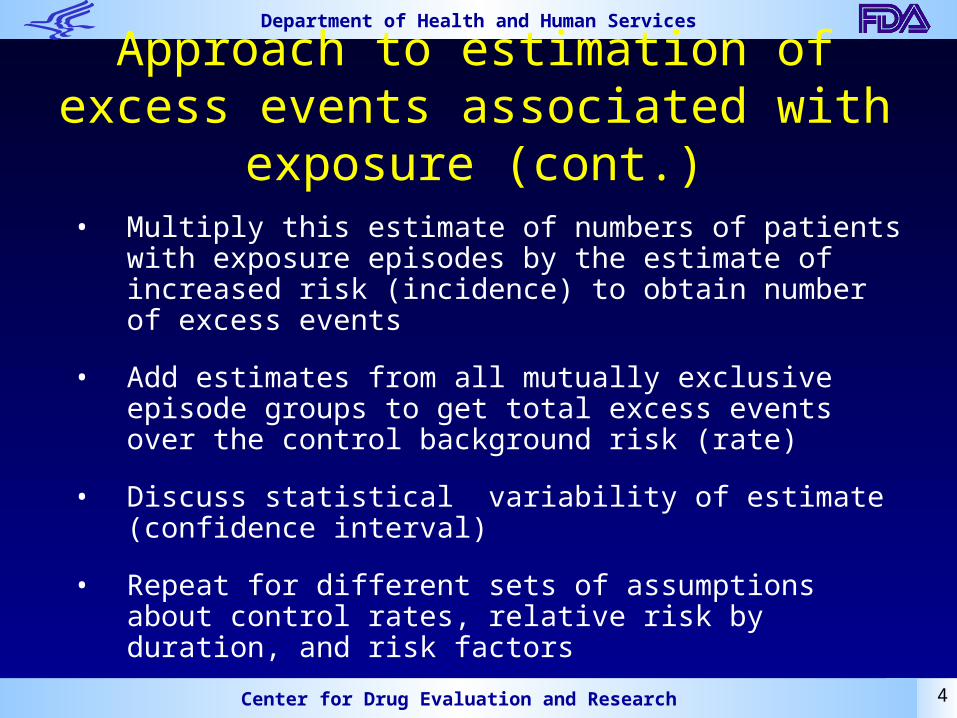
Approach to estimation of excess events associated with exposure
(cont.)• Multiply this estimate of numbers of patients with
exposure episodes by the estimate of increased risk (incidence) to obtain number of excess events
• Add estimates from all mutually exclusive episode groups to get total excess events over the control background risk (rate)
• Discuss statistical variability of estimate (confidence interval)
• Repeat for different sets of assumptions about control rates, relative risk by duration, and risk factors
5
Department of Health and Human Services
Center for Drug Evaluation and Research
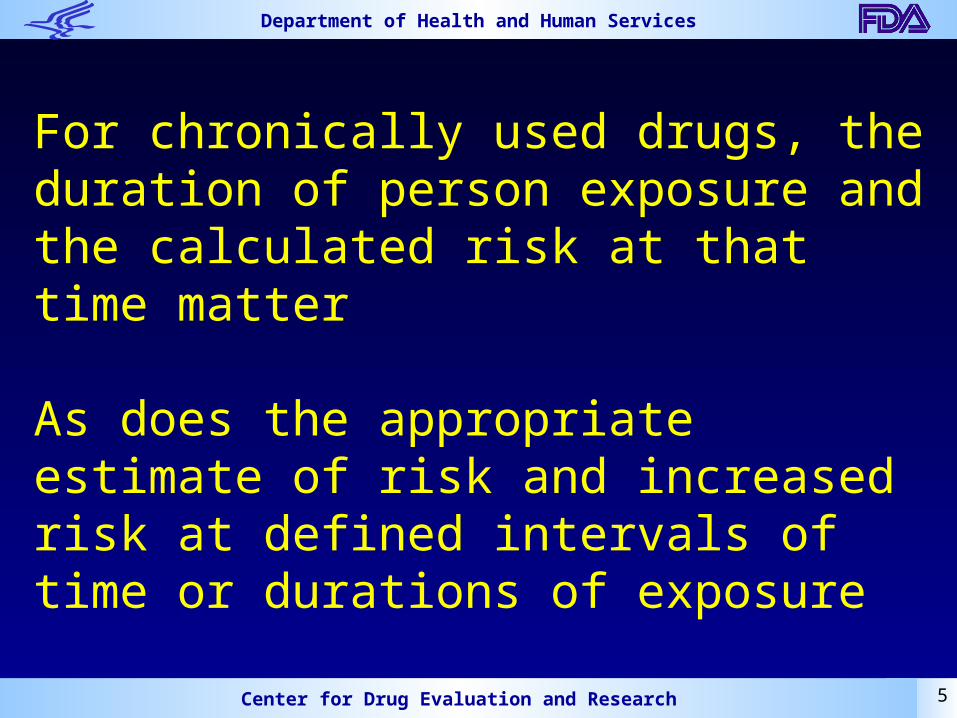
For chronically used drugs, the duration of person exposure and the calculated risk at that time matter
As does the appropriate estimate of risk and increased risk at defined intervals of time or durations of exposure

6
Department of Health and Human Services
Center for Drug Evaluation and Research
What did we learn from two Rofecoxib clinical trials?
(Studies were not prospectively designed for CV events)
Study VIGOR APPROVeEndpoint PUBs Recurrent CA
Indication Rheumatoid Arthritis Polyp prevention
Duration 1 year 3 year
Dose 50 mg 25 mg
Mean Age 58 years 59 years
Subjects 79% Female 48% Female
Comparator Naproxen Placebo

7
Department of Health and Human Services
Center for Drug Evaluation and Research
Replication
• Do we believe there is an effect to project?
• Is there consistency of effects in different studies on same endpoints?– Alzheimer’s Disease– Mild Cognitive Impairment
8
Department of Health and Human Services
Center for Drug Evaluation and Research
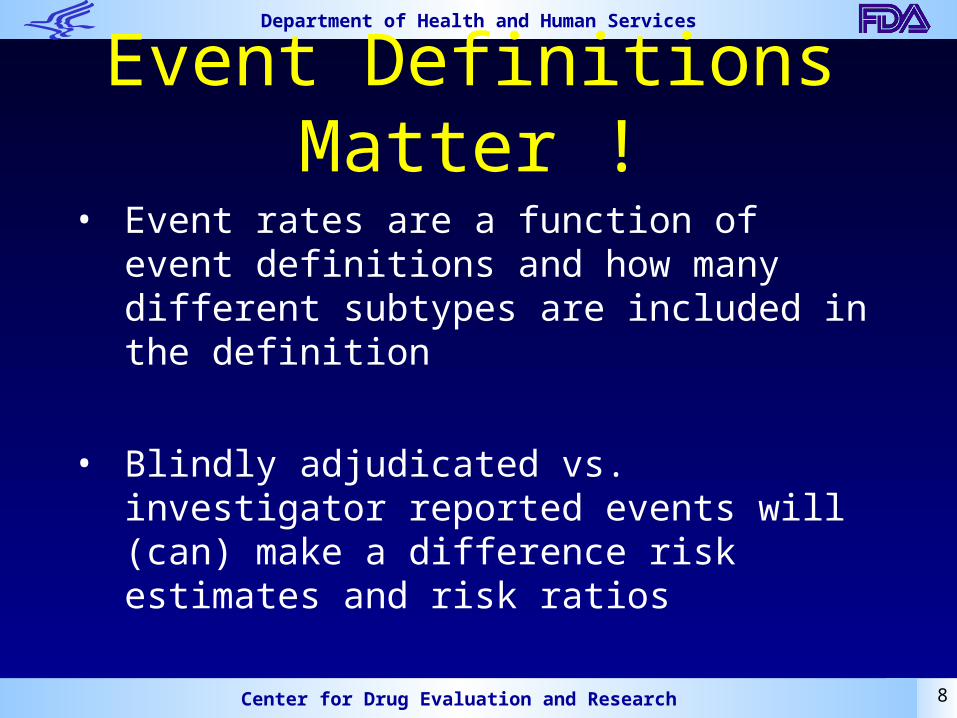
Event Definitions Matter !
• Event rates are a function of event definitions and how many different subtypes are included in the definition
• Blindly adjudicated vs. investigator reported events will (can) make a difference risk estimates and risk ratios

9
Department of Health and Human Services
Center for Drug Evaluation and Research
Event definitions in VIGOR & APPROVe
We will examine two of them:
• Confirmed thrombotic events within 14 days of last dose of study drug:
• Myocardial infarction (fatal and non-fatal), or sudden cardiac death
APTC events within 14 days of last dose of study drug

10
Department of Health and Human Services
Center for Drug Evaluation and Research
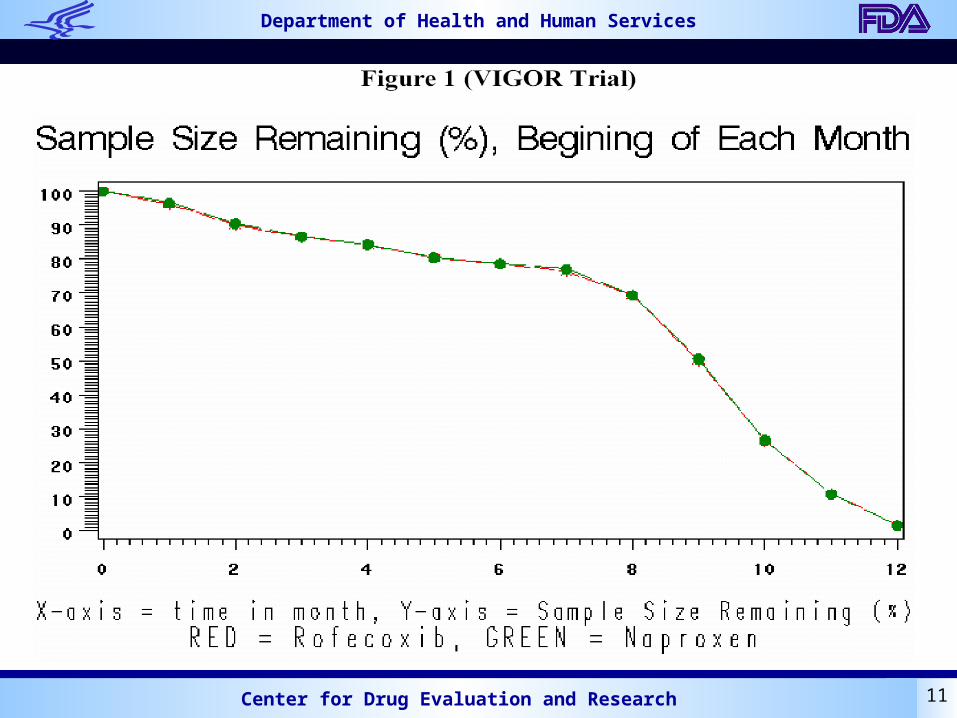
VIGORPatients withdraw from exposure (trial)
early !Impact on event rates and comparisonsCompleted:
rofecoxib: 2862 / 4047 ( 70.7% )naproxen: 2880 / 4029 ( 71.5% )
Discontinued (Reasons):Clinical AE’s:
rofecoxib: 563 (13. 9%); naproxen: 492 (12.2%)Lack of efficacy:
rofexocib: 256 (6.3%); naproxen: 263 (6.5%)
Other: laboratory AE’s, moved, lost, withdrew consent
11
Department of Health and Human Services
Center for Drug Evaluation and Research

12
Department of Health and Human Services
Center for Drug Evaluation and Research
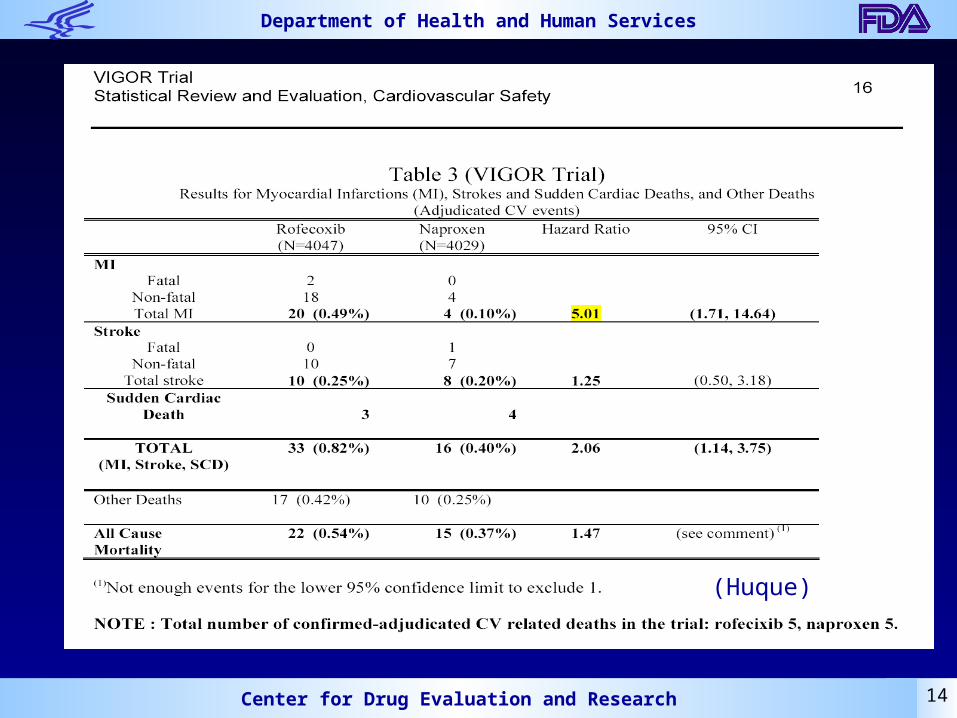
RR = 2.28, P =0.0035
(1.31,3.97 )
13
Department of Health and Human Services
Center for Drug Evaluation and Research
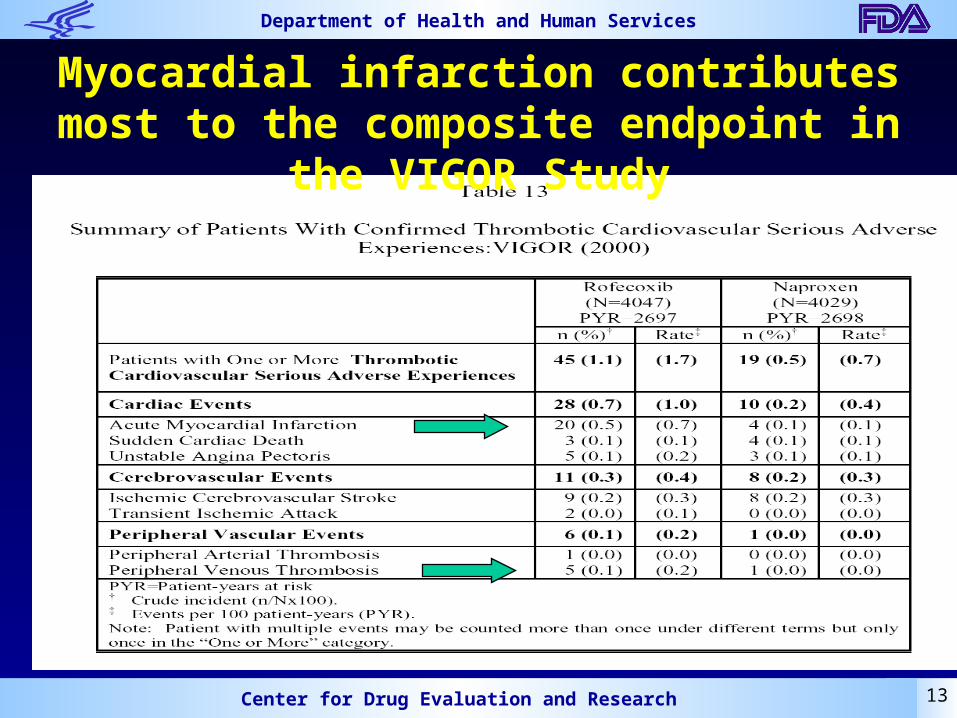
Myocardial infarction contributes most to the composite endpoint in the VIGOR Study
14
Department of Health and Human Services
Center for Drug Evaluation and Research
(Huque)

15
Department of Health and Human Services
Center for Drug Evaluation and Research
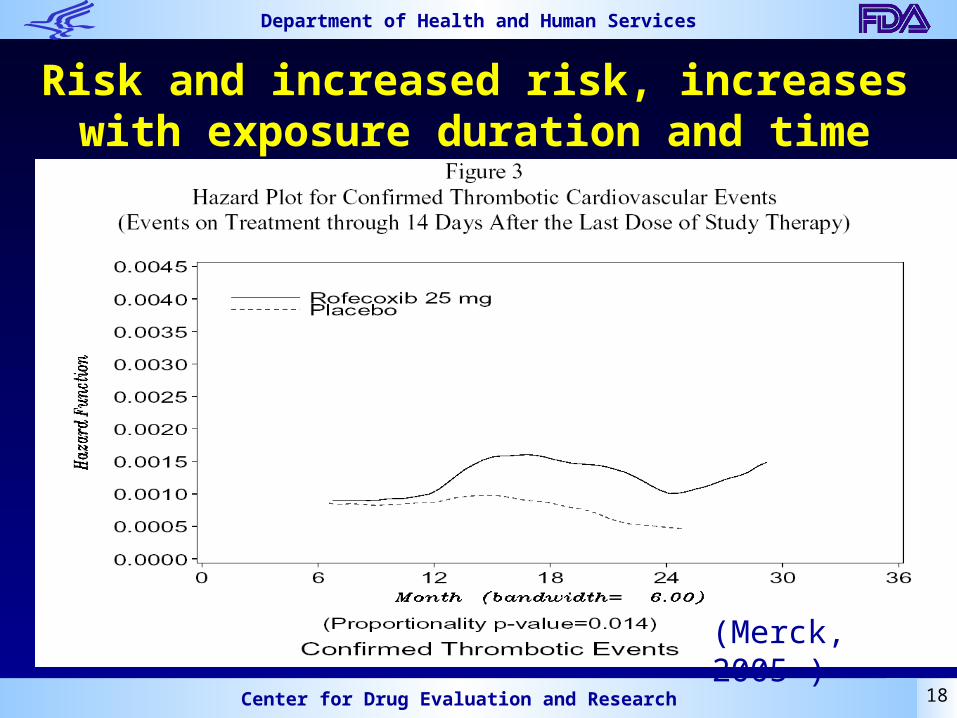
Data support risk and increased risk, increases with longer duration of exposure
16
Department of Health and Human Services
Center for Drug Evaluation and Research
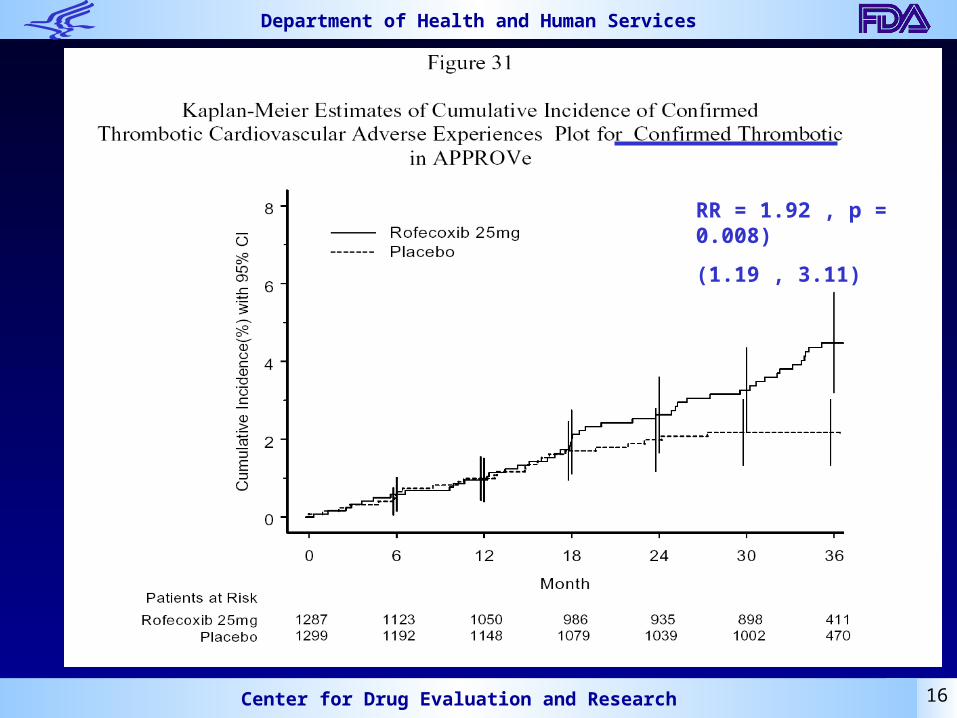
RR = 1.92 , p = 0.008)
(1.19 , 3.11)

17
Department of Health and Human Services
Center for Drug Evaluation and Research
18
Department of Health and Human Services
Center for Drug Evaluation and Research
(Merck, 2005 )
Risk and increased risk, increases with exposure duration and time

19
Department of Health and Human Services
Center for Drug Evaluation and Research
(Merck, 2005 )

20
Department of Health and Human Services
Center for Drug Evaluation and Research
Increased Incidence of MI & Sudden Cardiovascular Death for 25 mg Vioxx (APPROVe )
-0.5
0
0.5
1
1.5
2
2.5
0 2 4 6 8 10 12 14 16 18 20 22 24 26 28 30 32 34 36
in Months
Inc
reas
ed
In
cid
en
ce
in
%
Average
95% CI Upper Limit
95% CI Lower Limit
25 mg Tablet strength - Increased Risk (Difference in rates)

21
Department of Health and Human Services
Center for Drug Evaluation and Research
Increased Incidence of MI & Sudden Cardiovascular Death for 50 mg Vioxx (over Naproxen) (VIGOR)
-0.2
0
0.2
0.4
0.6
0.8
1
1.2
1.4
0 1 2 3 4 5 6 7 8 9 10 11 12 13
in Months
Inc
rea
se
d I
nc
ide
nc
e i
n % Average
95% CI Upper Limit
95% CI Lower Limit
50 mg Tablet strength - Increased Risk (Difference in rates)
22
Department of Health and Human Services
Center for Drug Evaluation and Research
Increased Incidence of All Thrombotic Events for 50 mg Vioxx (with Constant Projection to 36 Mon)
-0.5
0
0.5
1
1.5
2
0 2 4 6 8 10 12 14 16 18 20 22 24 26 28 30 32 34 36
in Months
Inc
rea
se
d I
nc
ide
nc
e i
n % Average
95% CI Upper Limit
95% CI Lower Limit
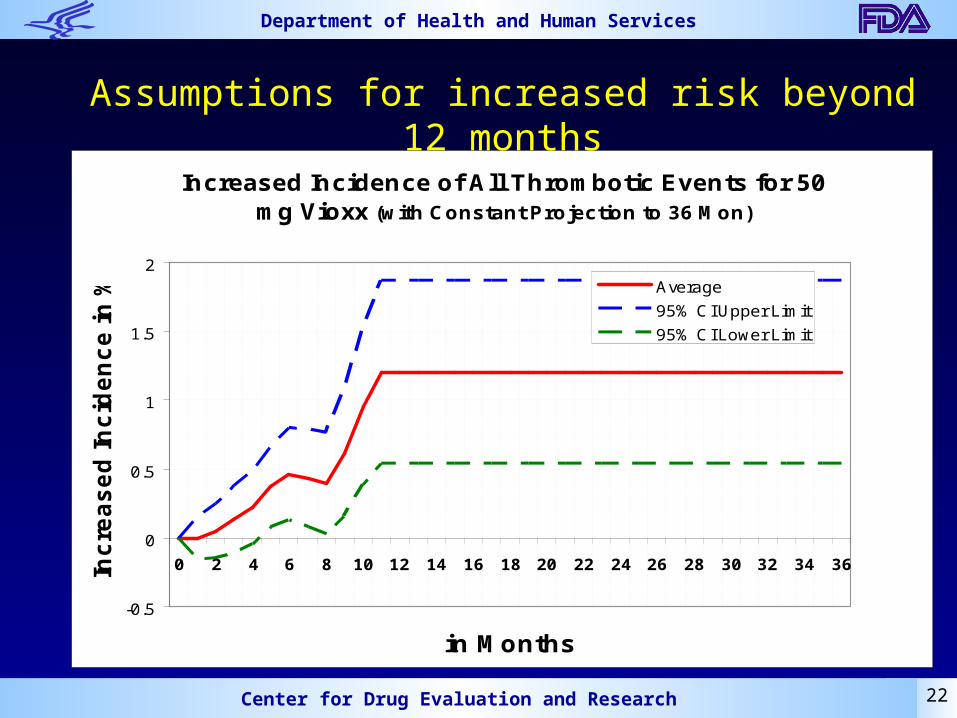
Assumptions for increased risk beyond 12 months

23
Department of Health and Human Services
Center for Drug Evaluation and Research
Increased Incidence of MI & Sudden Cardiovascular Death for 50 mg Vioxx (with APPROVe Projection to 36 Mon)
-0.5
0
0.5
1
1.5
2
2.5
3
3.5
4
0 2 4 6 8 10 12 14 16 18 20 22 24 26 28 30 32 34 36
in Months
Inc
rea
se
d I
nc
ide
nc
e i
n %
Average
95% CI Upper Limit
95% CI Lower Limit
Assumptions for increased risk beyond 12 months:
Using APPROVe estimates for 12 to 36 months
24
Department of Health and Human Services
Center for Drug Evaluation and Research
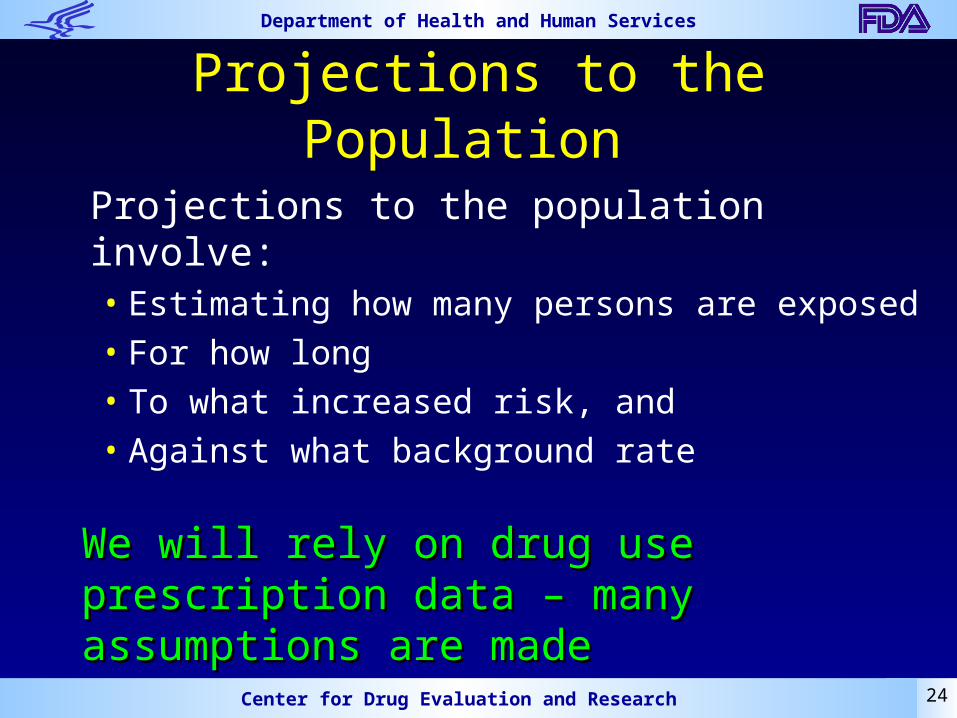
Projections to the Population
Projections to the population involve:• Estimating how many persons are exposed• For how long• To what increased risk, and• Against what background rate
We will rely on drug use prescription data – We will rely on drug use prescription data – many assumptions are mademany assumptions are made

25
Department of Health and Human Services
Center for Drug Evaluation and Research
National Prescription Data Sources
• IMS Health, National Prescription Audit Plus – Total number of prescriptions dispensed from U.S.
retail pharmacies– Does not provide patient demographic information
• IMS Health, National Disease and Therapeutic Index– Survey of 2000 - 3000 office-based physicians – Projections may be unstable given small sample
size

26
Department of Health and Human Services
Center for Drug Evaluation and Research
Total number of prescriptions dispensed for Vioxx from 1999 - 2004 in outpatient settings
14 M
20 M22 M
25 M
21 M
5 M
0
5
10
15
20
25
30
1999 2000 2001 2002 2003 2004
Year
Dis
pen
sed
Pre
scri
pti
on
s(m
illio
ns)
All Strengths
25 mg
50 mg
12.5 mg
IMS Health, National Prescription Audit Plus™, Years 1999 – 2004, Extracted January 2005, Original File: 0501viox.dvr

27
Department of Health and Human Services
Center for Drug Evaluation and Research
Indications for Use of Vioxx: 1999-2003
Average use of Vioxx for 1999 - 2003
OA: 18% RA : 3%
Highest use was in 1999
OA: 23% RA: 5%
Use in 2003
OA: 16% RA: 3%
28
Department of Health and Human Services
Center for Drug Evaluation and Research
Estimating Patient Level Duration of Rofecoxib Exposure
The Caremark Data
An attempt to estimate how many persons are exposed for how long
a duration to different tablet strengths

29
Department of Health and Human Services
Center for Drug Evaluation and Research
Source of Data for Defining Episodes of Vioxx Use
• Dataset obtained through Caremark™– Large pharmacy benefits manager– Covers 70+ million patient lives and ~25% of total U.S.
prescriptions
• Dataset included all Vioxx claims (n=1,969,285) from 1 January 2002 through 31 December 2004– Patients must have been in Caremark™ for entire study
time period (~25% of all claims)

30
Department of Health and Human Services
Center for Drug Evaluation and Research
Analytical Caremark™ Dataset
• We excluded prescriptions claims where:– Strength = 12.5 mg– Patients who were younger than 18 years – Suspension formulation
• We also removed nonsensical data– Days supply dispensed equal to zero– Patients aging more than 2 years between subsequent
prescriptions– Patients whose gender changed between prescriptions
• Final dataset included 1,736,639 claims and 403,293 patients
31
Department of Health and Human Services
Center for Drug Evaluation and Research
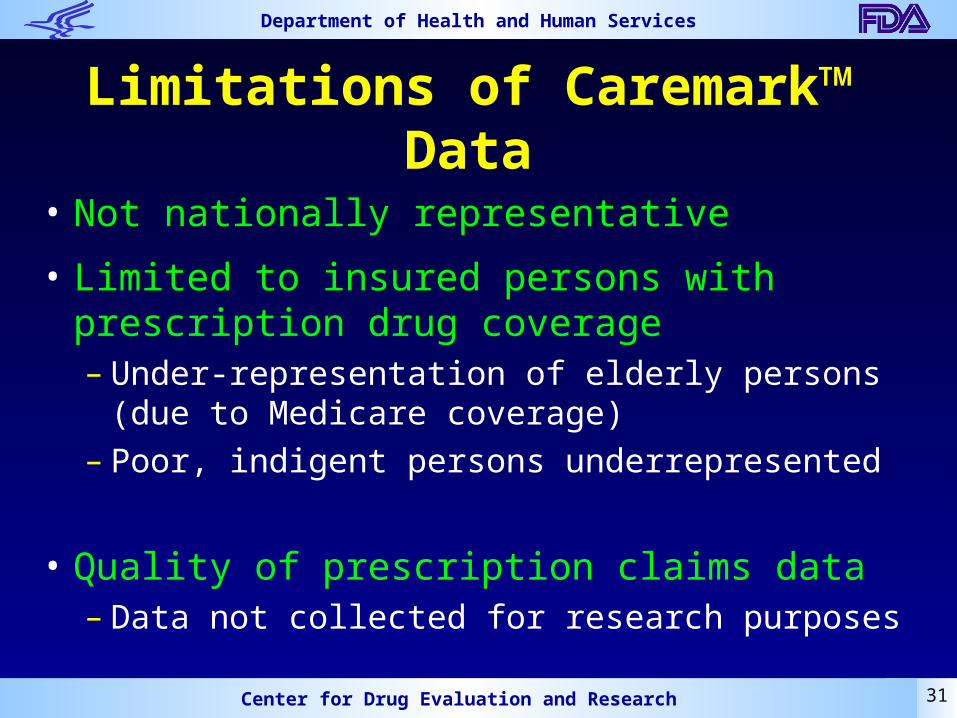
Limitations of Caremark™ Data
• Not nationally representative
• Limited to insured persons with prescription drug coverage– Under-representation of elderly persons (due to
Medicare coverage)– Poor, indigent persons underrepresented
• Quality of prescription claims data– Data not collected for research purposes
32
Department of Health and Human Services
Center for Drug Evaluation and Research
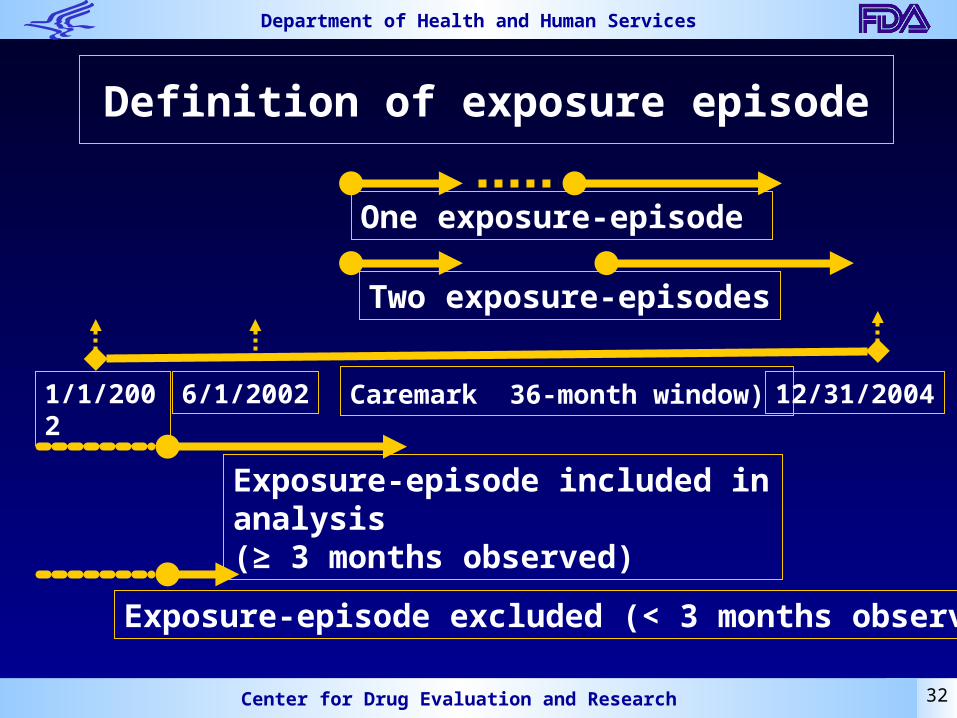
Definition of exposure episode
One exposure-episode
Two exposure-episodes
Caremark 36-month window) 6/1/2002
Exposure-episode included in analysis(≥ 3 months observed)
Exposure-episode excluded (< 3 months observed)
1/1/2002 12/31/2004
33
Department of Health and Human Services
Center for Drug Evaluation and Research
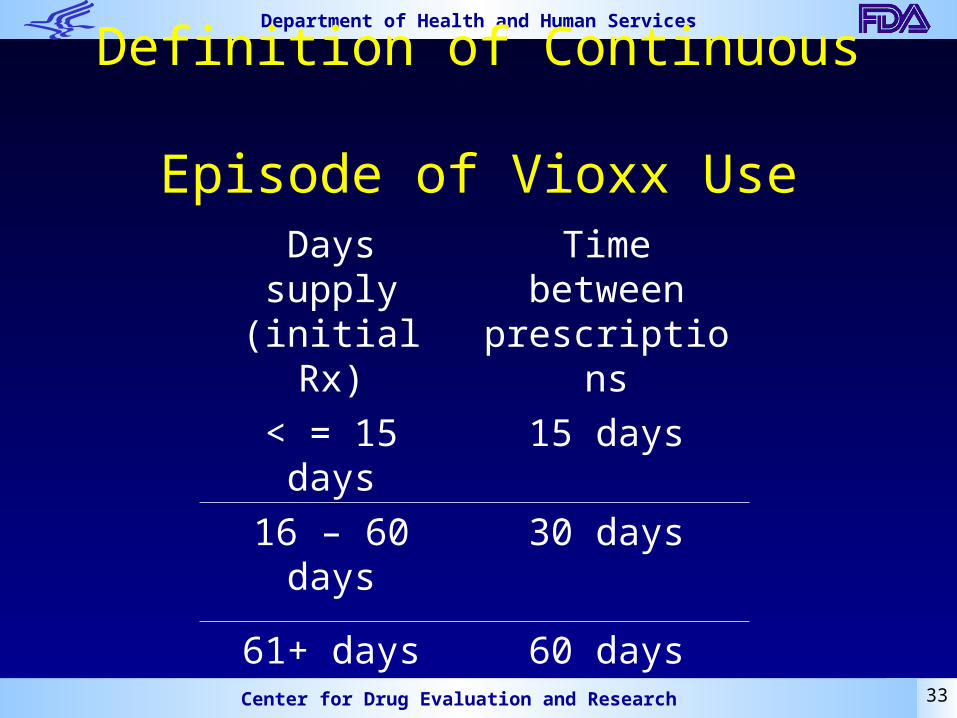
Definition of Continuous Episode of Vioxx Use
Days supply (initial Rx)
Time between prescriptions
< = 15 days 15 days
16 – 60 days 30 days
61+ days 60 days

34
Department of Health and Human Services
Center for Drug Evaluation and Research
Frequency of 25 mg Vioxx Exposure-Episodes (Caremark/AdvancePCS 36-mon Window)
0
50000
100000
150000
200000
250000
1 3 5 7 9 11 13 15 17 19 21 23 25 27 29 31 33 35
Length in Months
# o
f E
xp
osu
re-e
pis
od
es
Vioxx exposure-episode (exclusive)
Vioxx exposure-episode (cummulative)
Total Number of Exposure-episode=489900
35
Department of Health and Human Services
Center for Drug Evaluation and Research
Frequency of 50 mg Vioxx Exposure-Episodes (Caremark/AdvancePCS 36-month Window)
0
10000
20000
30000
40000
50000
60000
1 3 5 7 9 11 13 15 17 19 21 23 25 27 29 31 33 35
Length in Months
# o
f E
xp
osu
re-e
pis
od
es
Vioxx exposure-episode (exclusive)
Vioxx exposure-episode (cummulative)
Total Number of Exposure-episode = 78748

36
Department of Health and Human Services
Center for Drug Evaluation and Research
Projection Ratio R IMS Rx relative increase over Caremark™ Rx:
Assume constant multiplier
R = (Total IMS Rx’s in 1999-2004) /(Total Rx’s in Caremark)
Caremark (2002-2004)
IMS Rx's(in 1,000) R
# Exposure/episodes # Rx's
25 mg 489900 1437231 84205 58.59
50 mg 78748 190914 9601 50.29
Total 568648 1628145 93806

37
Department of Health and Human Services
Center for Drug Evaluation and Research
What is the increased risk in exposure sub-populations?
• By dose• By duration of exposure
• No other factors possible to examine:– Age– Gender– Indication, or– Other risk factors

38
Department of Health and Human Services
Center for Drug Evaluation and Research
CalculationAverage Increased Number (Events)
Attributable to Vioxx
• For each dose strength and length of exposure-episode L
NL = (# of exposures) x (Increased Incidence) x R
• To obtain the increased events for each dose strength
Sum over all exposure lengthsSum over both dose strengths to obtain total

39
Department of Health and Human Services
Center for Drug Evaluation and Research
Estimates of Population Increased Events: MI & Sudden Cardiovascular Deaths
(Events)
25 mg = 28,686 (95% CI upper limit = 100,159)
50 mg = 3,732 (9,256) – constant projection = 4,407 (w / APPROVe Projection )
Both 25mg and 50mg strengths combined
32,418 (109,415) events (w/constant projection) 33,093 (w/APPROVe Projection)
40
Department of Health and Human Services
Center for Drug Evaluation and Research
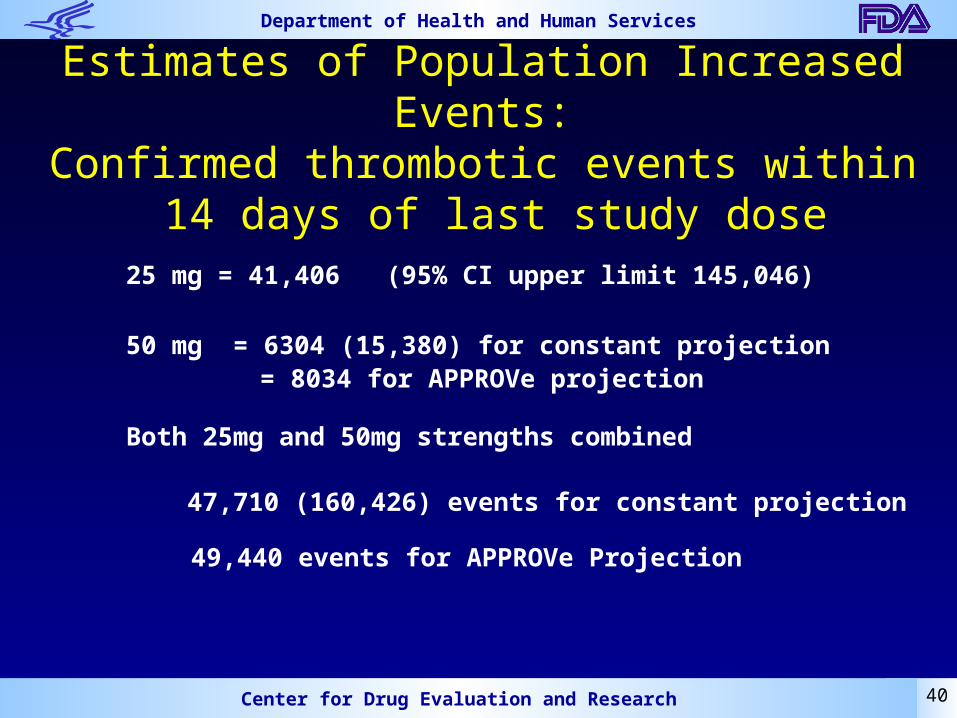
Estimates of Population Increased Events:Confirmed thrombotic events within
14 days of last study dose
25 mg = 41,406 (95% CI upper limit 145,046)
50 mg = 6304 (15,380) for constant projection = 8034 for APPROVe projection
Both 25mg and 50mg strengths combined
47,710 (160,426) events for constant projection 49,440 events for APPROVe Projection
41
Department of Health and Human Services
Center for Drug Evaluation and Research
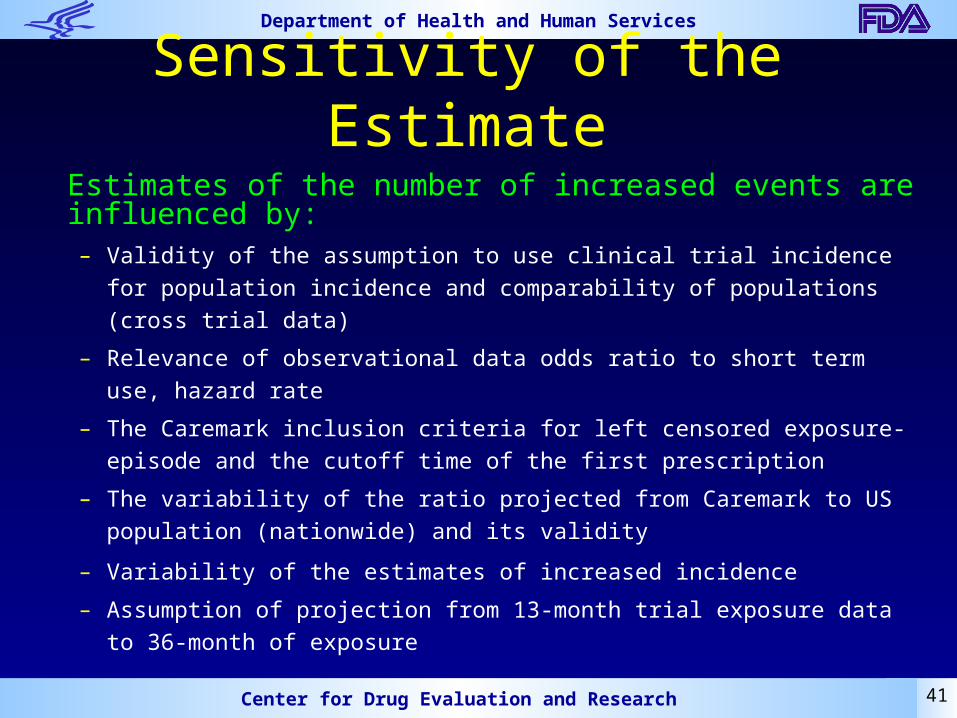
Sensitivity of the Estimate
Estimates of the number of increased events are influenced by: – Validity of the assumption to use clinical trial incidence for population
incidence and comparability of populations (cross trial data)
– Relevance of observational data odds ratio to short term use, hazard rate
– The Caremark inclusion criteria for left censored exposure-episode and the
cutoff time of the first prescription
– The variability of the ratio projected from Caremark to US population
(nationwide) and its validity
– Variability of the estimates of increased incidence
– Assumption of projection from 13-month trial exposure data to 36-month of
exposure

42
Department of Health and Human Services
Center for Drug Evaluation and Research
Where do some of the differences in estimates come
from?• Assumption of constant hazard rate calculated as
events per 100 person years - can overestimate early 1 - 2 month hazard, underestimates later ( > 8 months, 1.5 year ) hazard
• Assumption of constant (proportional hazard ratio over exposure time)
• Estimate of very large number of people exposed for short (1-2 months) episodes - RCT vs. Caremark vs. Actual US pop
43
Department of Health and Human Services
Center for Drug Evaluation and Research
Exposure Length Distribution Difference
Vioxx 25 mg Exposure in APPROVe and Caremark
0.0000
10.0000
20.0000
30.0000
40.0000
50.0000
60.0000
1 4 7 10 13 16 19 22 25 28 31 34 37 40 43
Exposure in Months
Pe
rce
nta
ge
of
Ex
po
su
re
Vioxx 25 mg Exposure in APPROVe
Vioxx 25 mg Exposure in Caremark
44
Department of Health and Human Services
Center for Drug Evaluation and Research
Increased Incidence of MI and Sudden Cardiovascular Death for Vioxx 25 mg over Placebo (APPROVe) - Kaplan-Meier vs. Patient-
Mon Rate
0
0.2
0.4
0.6
0.8
1
1.2
1.4
1.6
1 3 5 7 9 11 13 15 17 19 21 23 25 27 29 31 33 35Month in Trial
Incr
ease
d In
cid
ence
Person-month Diff (0.0315%/patient-Month
Kaplan-Meier Rate Diff in APPROVe
45
Department of Health and Human Services
Center for Drug Evaluation and Research
Increased Incidence of MI & Sudden Cardiovascular Death for 50 mg Vioxx (over Naproxen) (VIGOR) - Kaplan-Meier vs.
Average Patient-month rate
0
0.1
0.2
0.3
0.4
0.5
0.6
0.7
0.8
0.9
0 1 2 3 4 5 6 7 8 9 10 11 12 13
in Months
Incr
ease
d In
cid
ence
in
%
Kapla-Meier-diff
Average Patient-Month rate Diff

46
Department of Health and Human Services
Center for Drug Evaluation and Research
Increased Incidence of MI & Sudden Cardiovascular Death by Kaplan-Meier Diff and Average Patient-Month Diff
• 25 mg– By Kaplan-Meier diff 28,686– By Patient-Month diff 39,187
• 50 mg– By Kaplan-Meier diff 7,542 (w/APPROVe
Projection) – By Patient-Month diff 5,843
• 25 mg & 50 mg Combined– By Kaplan-Meier diff 36,228– By Patient-Month diff 45,030

47
Department of Health and Human Services
Center for Drug Evaluation and Research
Summary• Goal of the projection effort:
– Provide a framework for considering estimates
– Provide a range of estimates to show how assumption
dependent each is - not to emphasize any one estimate
– To describe the logic, process, assumptions and
uncertainties in the estimates
– To focus attention on duration of exposure and time related
risk
– Given the data limitations and uncertainties, argue that
there is no best approach nor estimate and it is difficult to
choose an estimate without qualifying its relevance
48
Department of Health and Human Services
Center for Drug Evaluation and Research
Acknowledgements• ODS Team
– Laura Governale– Gerald Dal Pan– Aaron Mendelsohn– Judy Staffa
• OB Team– Joanne Zhang– Yi Tsong– Mohammad Huque