Embed Size (px)
Citation preview

Draft
Formulation of Aerial Platform Environmental Requirements
from Global Radiosonde Data
Journal: Journal of Unmanned Vehicle Systems
Manuscript ID juvs-2016-0010.R1
Manuscript Type: Note
Date Submitted by the Author: 28-Aug-2016
Complete List of Authors: Stelman, Jacob; Facebook Inc, Liu, Zhang; Facebook, Connectivity Labs
Keyword: UAV, HAP, Aerial platform, Climate, Cloud computing
Please Select from this Special Issues list if applicable:
https://mc06.manuscriptcentral.com/juvs-pubs
Journal of Unmanned Vehicle Systems

Draft
Formulation of Aerial Platform Environmental Requirements from
Global Radiosonde Data
Jacob Stelman and Zhang Liu
Facebook Connectivity Labs
Woodland Hills, CA
Abstract
Successful operation of an aerial platform
requires that it be designed with respect to the
environments in which it will function. This paper
demonstrates how raw observational climate data
can be processed to characterize global climate
histories and statistics for the formulation of aerial
platform environmental requirements.
Introduction
Within a decade, High-Altitude Platforms
(HAPs) will support novel civilian applications such
as remote sensing, search and rescue, and Internet
distribution. For instance, Facebook plans to design
and trial technology to supply Internet to the
underserved parts of the world by using its High
Altitude Long Endurance (HALE) HAP named
Aquila (Parikh, 2015). Aquila, which has a
wingspan 10m greater than that of a Boeing 737 and
only 3% of its mass, will fly for months at a time in
the mid-ranges of the stratosphere (18-27km) with
payloads that transmit Internet service to the ground
(Talmor et al., 2016).
To ensure the success of aerial platforms
such as Aquila, design requirements need to take
into consideration climatic conditions of desired
operating environments. For instance, if a given
aerial platform is required to be operational 99% of
the time in a certain region, it must be designed to
withstand the 99th percentile of that region’s
extremal environmental conditions. This paper
demonstrates how raw radiosonde data can be
processed to characterize global climate histories to
aid in the establishment of environmental
requirements.
Data/Methods
NOAA’s Integrated Global Radiosonde
Archive V2 Beta (hereafter referred to as IGRA), a
collection of 70 years of daily sounding
measurements taken from balloons launched at
2700 stations worldwide (Figure 1), was chosen as
the source of climate data for this analysis (Durre et
al. 2006; Durre 2014). The IGRA consists of
Figure 1: Data Acquisition locations of IGRA.
Page 1 of 6
https://mc06.manuscriptcentral.com/juvs-pubs
Journal of Unmanned Vehicle Systems

Draft
roughly 80GB of measurements recorded (at
various times and altitudes during a balloon’s
ascent) of the following quantities: wind speed,
wind direction, temperature, pressure, relative
humidity and dew point depression (hereafter
referred to as “climate quantities”) (Durre, 2014).
Parallel computing was used to grid
(aggregate) the IGRA data into a central data
structure for statistical climate analysis. The
process begins by partitioning IGRA attributes into
discrete bins representing ranges of values of
interest. For example, the world was divided into
two degree squares of latitude and longitude,
altitude was segmented into various layers, and the
values of climate quantities were separated into
ranges of interest. The gridding process consists of
iterating through all of the IGRA data records and
recording occurrences of climate quantity
measurements within established bins. The
corresponding latitude, longitude, altitude, and time
of the measurements, hereafter referred to as “look-
up quantities”, are used to “index” the occurrences
into a central data structure.
The central data structure chosen for this
application is a multidimensional array with
dimensions representing latitude, longitude,
altitude, time, the recorded climate quantities, and
their respective ranges of values. An additional
metadata structure is used to determine the values of
bins represented by positions along the dimensions
of the central data structure.
Elements in the array store occurrences of
climate quantity measurements, whereas an
element’s position along a given dimension of the
array represents the bin corresponding to a range of
values symbolized by the particular dimension.
The choice of an array for the central data
structure lends itself to fast statistical calculations in
an array-driven language such as MATLAB or
Python. For example, a Probability Density
Function (PDF) of a climate quantity over a specific
range of look-up quantities can be obtained by
taking a “slice” of the central data structure and
summing over the appropriate dimensions
(therefore compounding occurrences) until one is
left with a one-dimensional array. By normalizing
this array, one obtains a PDF.
For ease of analysis, Geographic
Information System (GIS) shapefiles were parsed to
allow one to index into the central data structure
based on country name. Shapefiles contain vector
GIS data including country names and
corresponding polygons that represent the borders
of a country. One can build a key-value pair data
structure to map a string containing the name of a
country to an array of corresponding latitude and
longitude indices representing the data recorded
within the border of the country in the central data
structure. This allows one to effectively specify a
list of country names, and view climate statistics as
is demonstrated in the following example.
Figure 2: Geography considered for analysis.
Page 2 of 6
https://mc06.manuscriptcentral.com/juvs-pubs
Journal of Unmanned Vehicle Systems

Draft
Example Analysis
The following example analysis is merely a
demonstration of what can be done with this tool.
The geography of interest was arbitrarily chosen,
and in no way represents the regions Facebook
hopes to serve with its Aquila HAP.
Suppose one wishes to determine
environmental requirements for an aerial platform
that would serve a latitude range of ±30 degrees
over the following list of countries: Algeria,
Angola, Argentina, Australia, Belize, Botswana,
Brazil, Cameroon, Chad, Congo, Egypt, Ethiopia,
Guyana, India, Madagascar, Nepal, Peru, Saudi
Arabia, Venezuela, and Zimbabwe. The list of
countries can be used to index into the central data
structure and extract climate information (Figure 2).
Different aerial platforms will be sensitive to
different environmental conditions and therefore
different climatic data will be pertinent. What
follows is a general overview of the data that can be
obtained, and its application to a general aerial
platform.
Computing the PDF of wind direction for
various altitude ranges yields the following plot:
Figure 3: PDF of Wind Direction at various altitude ranges.
One can see from Figure 3 that at lower altitudes
the wind blows predominantly from east-to-west,
and from west-to-east at higher altitudes. Balloon
platforms can exploit this wind behavior to station
keep by controlling their altitude to catch wind in
different directions.
Figure 4: Wind speed percentiles vs altitude.
Computing percentiles of wind speed at various
altitudes (Figure 4) shows that large wind
magnitudes exist in the upper-troposphere (10km)
through lower-stratosphere (15km) whereas in the
mid-stratosphere (20km) there is a lull in wind
speed. This is a suitable operating altitude for aerial
platforms since station keeping at a geographic
location requires flying against the wind.
Thermal requirements can be challenging at
high altitudes since low air density makes heat
rejection difficult. A plot of temperature percentiles
vs altitude can be used for thermal analyses.
Similar statistics on temperature can be obtained
from MIL-HDBK-310 (“Global climatic data for
developing military products”, 1997), but it is
important to note that the statistics in the mil
handbook are for the entire earth and do not tailor to
specific regions of interest.
Figure 5: Temperature percentiles vs altitude.
Page 3 of 6
https://mc06.manuscriptcentral.com/juvs-pubs
Journal of Unmanned Vehicle Systems
Draft
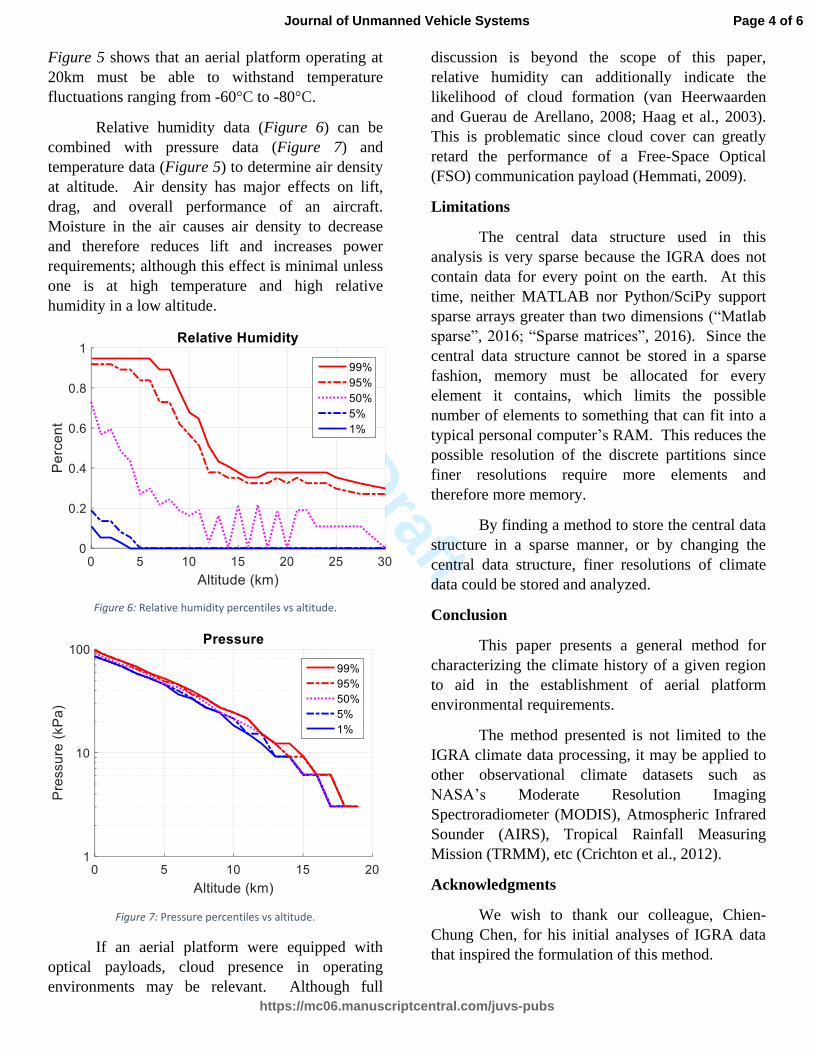
Figure 5 shows that an aerial platform operating at
20km must be able to withstand temperature
fluctuations ranging from -60°C to -80°C.
Relative humidity data (Figure 6) can be
combined with pressure data (Figure 7) and
temperature data (Figure 5) to determine air density
at altitude. Air density has major effects on lift,
drag, and overall performance of an aircraft.
Moisture in the air causes air density to decrease
and therefore reduces lift and increases power
requirements; although this effect is minimal unless
one is at high temperature and high relative
humidity in a low altitude.
Figure 6: Relative humidity percentiles vs altitude.
Figure 7: Pressure percentiles vs altitude.
If an aerial platform were equipped with
optical payloads, cloud presence in operating
environments may be relevant. Although full
discussion is beyond the scope of this paper,
relative humidity can additionally indicate the
likelihood of cloud formation (van Heerwaarden
and Guerau de Arellano, 2008; Haag et al., 2003).
This is problematic since cloud cover can greatly
retard the performance of a Free-Space Optical
(FSO) communication payload (Hemmati, 2009).
Limitations
The central data structure used in this
analysis is very sparse because the IGRA does not
contain data for every point on the earth. At this
time, neither MATLAB nor Python/SciPy support
sparse arrays greater than two dimensions (“Matlab
sparse”, 2016; “Sparse matrices”, 2016). Since the
central data structure cannot be stored in a sparse
fashion, memory must be allocated for every
element it contains, which limits the possible
number of elements to something that can fit into a
typical personal computer’s RAM. This reduces the
possible resolution of the discrete partitions since
finer resolutions require more elements and
therefore more memory.
By finding a method to store the central data
structure in a sparse manner, or by changing the
central data structure, finer resolutions of climate
data could be stored and analyzed.
Conclusion
This paper presents a general method for
characterizing the climate history of a given region
to aid in the establishment of aerial platform
environmental requirements.
The method presented is not limited to the
IGRA climate data processing, it may be applied to
other observational climate datasets such as
NASA’s Moderate Resolution Imaging
Spectroradiometer (MODIS), Atmospheric Infrared
Sounder (AIRS), Tropical Rainfall Measuring
Mission (TRMM), etc (Crichton et al., 2012).
Acknowledgments
We wish to thank our colleague, Chien-
Chung Chen, for his initial analyses of IGRA data
that inspired the formulation of this method.
Page 4 of 6
https://mc06.manuscriptcentral.com/juvs-pubs
Journal of Unmanned Vehicle Systems

Draft
We additionally thank Paul Ullrich of the
University of California, Davis for his technical
feedback on this paper, and Mathew Oliver of the
University of California, Davis for his stylistic
suggestions.
Page 5 of 6
https://mc06.manuscriptcentral.com/juvs-pubs
Journal of Unmanned Vehicle Systems

Draft
References
Crichton, D., Mattmann, C., Cinquini, L., Braverman,
A., Waliser, D., Gunson, M., Hart, A., Goodale, C.,
Lean, P., Kim, J. 2012. Sharing satellite observations
with the climate-modeling community: software and
architecture. IEEE Software. 29(5): 73-81.
doi:10.1109/ms.2012.21.
Durre, I. 2014. Integrated Global Radiosonde Archive
(IGRA) V2 beta readme file [online]. National Climatic
Data Center. Available from
http://www1.ncdc.noaa.gov/pub/data/igra/v2beta/igra2-
readme.txt [accessed 13 March 2016].
Durre, I., Vose, R., Wuertz, D. 2006. Overview of the
Integrated Global Radiosonde Archive. Journal of
Climate. 19(1): 53-68. doi:10.1175/jcli3594.1.
Global climatic data for developing military products.
1997. United States Department of Defense. MIL-
HDBK-310.
Haag, W., Kärcher, B., Ström, J., Minikin, A., Lohmann,
U., Ovarlez, J., Stohl, A. 2003. Freezing thresholds and
cirrus cloud formation mechanisms inferred from in situ
measurements of relative humidity. Atmos. Chem. and
Phys. 3(5): 1791-1806. doi:10.5194/acp-3-1791-2003.
Hemmati, H. 2009. Near-earth laser communications.
CRC Press. Boca Raton, U.S.
Parikh, J. 2015. New milestones in Connectivity Lab’s
aircraft and laser programs [online]. Facebook
Newsroom. Available from
http://newsroom.fb.com/news/2015/07/new-milestones-
in-connectivity-labs-aircraft-and-laser-programs/
[accessed 13 March 2016].
Talmor, A., Harding, H., and Chen, C. 2016. Two-axis
gimbal for air-to-air and air-to-ground laser
communications [online]. Research at Facebook.
Available from
https://research.facebook.com/publications/two-axis-
gimbal-for-air-to-air-and-air-to-ground-laser-
communications/ [accessed 13 March 2016].
van Heerwaarden, C., Guerau de Arellano, J. 2008.
Relative humidity as an indicator for cloud formation
over heterogeneous land surfaces. J. Atmos. Sci. 65(10):
3263-3277. doi: 10.1175/2008jas2591.1.
MATLAB sparse [online]. 2016. Mathworks. Available
from
http://www.mathworks.com/help/matlab/ref/sparse.html
[accessed 13 March 2016].
Sparse matrices [online]. 2016. SciPy Reference Guide.
Available from
http://docs.scipy.org/doc/scipy/reference/sparse.html
[accessed 13 March 2016].
Page 6 of 6
https://mc06.manuscriptcentral.com/juvs-pubs
Journal of Unmanned Vehicle Systems