Embed Size (px)
Citation preview

ISTA
R F
INA
NC
IAL
AN
NU
AL
RE
PO
RT
20
12
ANNUAL REPORT 2012
iStar
Financial

Headquarters1114 Avenue of the AmericasNew York, NY 10036Tel: 212.930.9400Fax: 212.930.9494
regional offices3480 Preston Ridge RoadSuite 575Alpharetta, GA 30005Tel: 678.297.0100Fax: 678.297.0101
525 West Monroe StreetSuite 1900Chicago, IL 60661Tel: 312.577.8549Fax: 312.612.4162
One Galleria Tower13355 Noel RoadSuite 900Dallas, TX 75240Tel: 972.506.3131Fax: 972.501.0078
1501 E. Orangethorpe AvenueSuite 200Fullerton, CA 92831Tel: 714.961.4700Fax: 714.961.4701
180 Glastonbury BoulevardSuite 201Glastonbury, CT 06033Tel: 860.815.5900Fax: 860.815.5901
1777 Ala Moana BoulevardSuite 226Honolulu, HI 96815Tel: 212.405.4537Fax: 808.944.6322
One Sansome Street30th FloorSan Francisco, CA 94104Tel: 415.391.4300 Fax: 415.391.6259
10960 Wilshire Boulevard Suite 1260Los Angeles, CA 90024Tel: 310.315.7019 Fax: 310.315.7017
employeesAs of March 14, 2013, the Company had 167 employees.
independent auditorsPricewaterhouseCoopers LLPNew York, NY
registrar and transfer agentComputershare Trust Company, NAPO Box 43078Providence, RI 02940-3078Tel: 800.756.8200
www.computershare.com
annual meeting of sHareHoldersMay 21, 2013, 9:00 a.m. ETSofitel Hotel of New York City45 West 44th StreetNew York, NY 10036
investor information servicesiStar Financial is a listed company on the New York Stock Exchange and is traded under the ticker “SFI.” The Company has filed all required Annual Chief Executive Officer Certifications with the NYSE. In addition, the Company has filed with the SEC the certifications of the Chief Executive Officer and Chief Financial Officer required under Section 302 and Section 906 of the Sarbanes-Oxley Act of 2002 as exhibits to our most recently filed Annual Report on Form 10-K. For help with questions about the Company, or to receive additional corporate information, please contact:
investor relationsJason FooksVice President Investor Relations & Marketing1114 Avenue of the AmericasNew York, NY 10036Tel: 212.930.9484
Email: [email protected]
iStar Financial Website:www.istarfinancial.com
corporate information
Des
ign
by
Ad
dis
on
ww
w.a
dd
iso
n.c
om
REAL ESTATE FINANCE $1.86 BILLION
NET LEASINg $1.34 BILLION
OPERATINg PROPERTIES $1.17 BILLION
LANd $971 mILLION

1
TO OUR VALUED INVESTORS,The year 2013 marks a turning point for our company. Having successfully stabilized the right side of our balance
sheet through multiple capital market transactions and a lengthened maturity profi le, iStar can now focus on deriving
maximum value from its existing $6 billion portfolio, its multiple business platforms and its 20 years of experience
across a large portion of the real estate marketplace.
During the past 12 months, we have worked to guide the market to the growing opportunities in our portfolio and to
identify the strengths we can build on and the challenges still ahead. In this report, we highlight in each of our main
business lines the strong foundation from which we can move forward, as well as the key opportunities yet to be
realized on. Much progress has been made and we expect to make further progress throughout this year.
Our goal now must be to execute the plans developed to capture hidden value and unlock trapped returns in the current
book — resolving NPLs, leasing up operating properties in transition and pushing our land portfolio to participate in the
rapidly recovering housing environment. Progress has come quickly and tangibly in some areas, more slowly and more
incrementally in others, but we are clearly heading in the right direction.
With greater capital fl exibility, we can now also direct our efforts to new investments and to building new income
streams. While we have been actively investing in the existing portfolio, the opportunity to begin creating value in new
transactions is one the team has been eagerly awaiting. I think you can count on them to uncover interesting and
attractively priced opportunities and to help get us in position to successfully reenter the market in a meaningful way.
My sincere thanks for your support and patience as we worked through this diffi cult period and for your continued
interest in iStar as we position the company for stability and future growth.
Jay Sugarman
Chairman and Chief Executive Offi cer

-
3
2
REAL ESTATE FINANCE
$1.86 BILLION Our real estate fi nance portfolio primarily consists of both senior and subordinated loans secured by commercial real estate assets. The credit quality of our performing loans improved throughout the year, as measured by our internal risk ratings. At year-end, these assets generated a weighted average yield of 7.5%. We intend to ramp up new investment originations during the coming year and will lean on our historical strengths in this area to fi nd
attractive opportunities.
We reduced the balance of our non-performing loans (NPLs) by $268 million during the year; however, the remaining NPLs continue to be a drag on earnings as they are not currently generating revenues. We expect progress throughout the year in continuing to resolve NPLs which will allow
us to unlock trapped revenue potential.
OPPORTUNITYSTRENGTH7.5%YIELD
RAMPING UP
NEW INVESTMENT
ORIGINATIONS
CONTINUE
TO RESOLVE NPLs IN
ORDER TO UNLOCK
TRAPPED REVENUE
REDUCED NPLs
BY $268 MILLION
IN 2012
PERFORMING LOANS
$1.36 Billion
NPLs
$503 Million

-
5
4
Our net leasing portfolio is primarily comprised of properties owned by iStar, which have in place long-term leases to single creditworthy tenants. Our leases typically provide for expenses at the facility to be paid by the tenant on a triple net lease basis. We generally intend to hold our net lease assets for long-term investment. We seek to target corporate customers with facilities that are mission-critical to their ongoing businesses. The portfolio is well-diversifi ed by geography and property type, and with a weighted average remaining lease term of 12 years, it is a source of stable, long-term cash fl ow. Given current market conditions and the 10.3% yield generated by the occupied assets, we believe signifi cant value exists in these
assets above net book value.
NET LEASING
$1.34 BILLION

SQUARE FEET
OCCUPIED
19,504,119
SQUARE FEET
VACANT
1,063,610
95%OCCUPIED
12YEAR AVERAGE
LEASE TERM
10.3%YIELD
CONTINUED
RENT AND
PORTFOLIO
GROWTH
OPPORTUNITYSTRENGTH

-
7
6
Our residential operating assets consist of luxury condominium projects across the U.S. Our strategy has been to complete unfinished developments, reposition and reintroduce the assets to the market, with a goal of selling out the projects at signifi cantly improved economics. Our efforts in this area are delivering results, with $376 million in proceeds and $89 million of gains in 2012
from condo sales.
A similar strategy is being employed within the commercial operating portfolio. These properties represent a diverse pool of asset types, including offi ce, retail, hotel and industrial. We are working to lease up these properties through a combination of creative asset management and capital infusions, and in the process realize their value potential by turning transitional real estate into stabilized real estate. By the end of 2012, we had stabilized 20% of our commercial operating properties to an average of 90% occupancy
and a yield of 7.3%.
OPERATING PROPERTIES
$1.17 BILLION

RESIDENTIAL
$385 Million
COMMERCIAL
$787 Million
$376 MillionCONDOS SOLD
$89 MillionOF GAINS
REALIZED IN 2012
80%TO BE STABILIZED
55%CURRENT OCCUPANCY
20%STABILIZED AT
90% OCCUPANCY
OPPORTUNITYSTRENGTH

-
9
8
The challenging market conditions over the past few years have laid the groundwork for future opportunity in land development. Housing starts are coming off 60-year lows and demand is increasing across many markets. In combination with tightening supply, low interest rates and a growing population suggest the residential market could be on the verge of an attractive
multiyear cycle.
Our land portfolio is comprised of master-planned community projects, infill/urban land and waterfront land parcels collectively entitled for 31,000 primarily residential units. With projects in key Sunbelt markets, including Southern California, Phoenix and Naples, we are focused on bringing more of these assets into production in 2013 and 2014 to begin generating positive earnings
out of a portion of this segment.
LAND
$971 MILLION

CONTINUED
INVESTMENT AND
IMPROVING
MARKET CONDITIONS
REPOSITIONED
ASSETS BEGINNING TO
RAMP UP SALES
IN DEVELOPMENT
OR PRE-DEVELOPMENT
$796 Million
IN PRODUCTION
$175 Million
OPPORTUNITYSTRENGTH

-
11
10
REAL ESTATE FINANCEESCALA
SEAT TLE, WA
Luxury 270 unit tower, located in the heart of downtown Seattle • In 2012, the project sold 81 units, and currently has 53 units remaining for sale • At the end of 2012, our remaining fi rst-mortgage loan balance was $59 million,
and has a current interest coupon of 8.0%

NET LEASINGUNIVERSAL TECHNICAL INSTITUTE
LISLE, IL
Tenant is the leading provider of post-secondary education for to-be professional automotive technicians • In 2012, UTI signed an 18-year lease for a new build-to-suit project to be developed by iStar • We are in the process of completing this $40 million campus and expect annual GAAP lease
income to average $3.7 million

-
13
12
OPERATING PROPERTIESVAN DYKE COMMONS
LUTZ, FL
Shopping center located in northern Tampa Bay submarket • Since the beginning of 2012, we have signed 10 leases with existing and new tenants, bringing occupancy to 100% • Recently sold for $30 million, representing a
$5 million gain on book and more than 17% roundtrip levered IRR

LANDMARINA PALMS
MIAMI, FL
Land parcel with 750 feet of pristine water frontage, desirable location and entitlements to build one million square feet of sellable residential space and over 100 wet marina slips • In 2012, we partnered with local developers to update design plans and begin sales efforts • Based on strong pre-sales to
date, we currently expect construction to begin in 2013

FINANCIALS
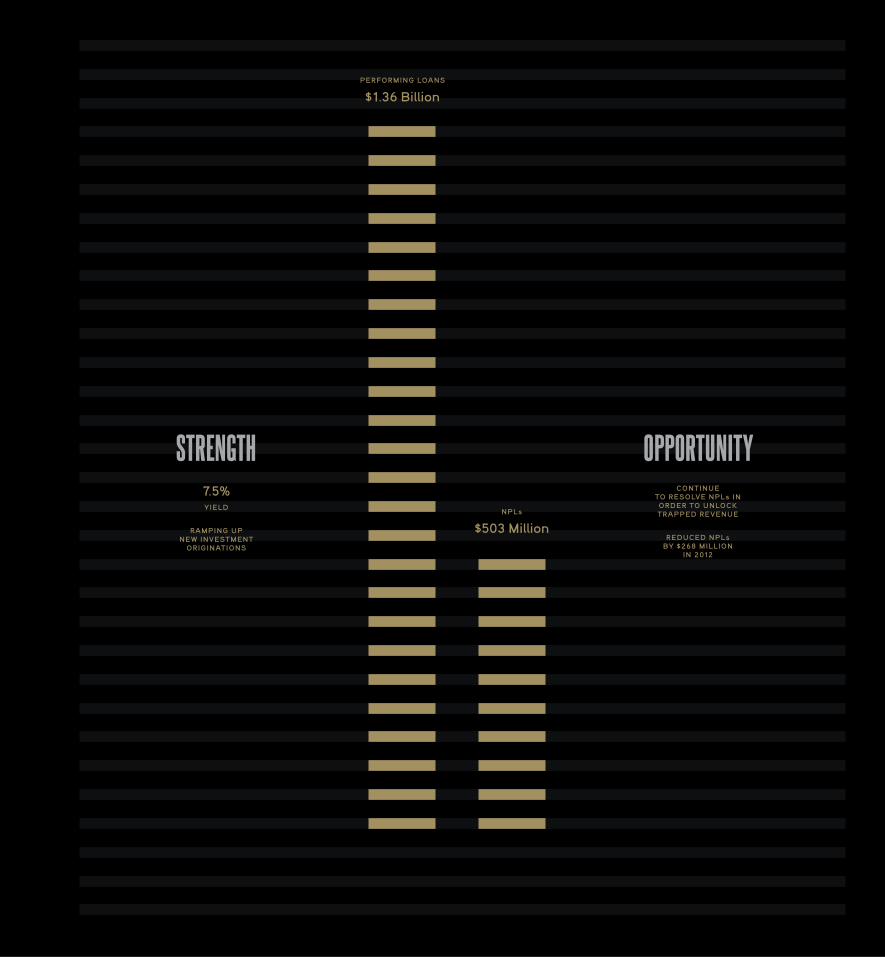
Selected Financial Data 16
Management’s Discussion and Analysis of Financial Condition and Results of Operations 18
Quantitative and Qualitative Disclosures about Market Risk 32
Management’s Report on Internal Control over Financial Reporting 33
Report of Independent Registered Public Accounting Firm 34
Consolidated Balance Sheets 35
Consolidated Statements of Operations 36
Consolidated Statements of Comprehensive Income (Loss) (Unaudited) 37
Consolidated Statements of Changes in Equity 38
Consolidated Statements of Cash Flows 39
Notes to Consolidated Financial Statements 40
Performance Graph 74
Common Stock Price and Dividends (unaudited) 75
Directors and Officers 76
Corporate Information 77

selected financial data
The following table sets forth selected financial data on a consolidated historical basis for the Company. This information should be read in conjunction with the discussions set forth in ”Management’s Discussion and Analysis of Financial Condition and Results of Operations.” Certain prior year amounts have been reclassified to conform to the 2012 presentation.
For the Years Ended December 31, 2012 2011 2010 2009 2008(In thousands, except per share data and ratios)
Operating Data:Operating lease income $ 219,019 $ 198,478 $ 186,630 $ 186,082 $ 186,946Interest income 133,410 226,871 364,094 557,809 947,661Other income 48,043 39,720 50,733 32,442 100,292 Total revenue $ 400,472 $ 465,069 $ 601,457 $ 776,333 $1,234,899Interest expense $ 355,097 $ 342,186 $ 313,766 $ 411,889 $ 615,533Real estate expense 151,827 138,943 121,399 81,794 50,010Depreciation and amortization 69,350 58,662 57,220 57,741 55,470General and administrative 80,856 105,039 109,526 124,152 138,164Provision for loan losses 81,740 46,412 331,487 1,255,357 1,029,322Impairment of assets 13,778 13,239 12,809 114,117 303,611Other expense 17,266 11,070 16,055 62,329 14,582 Total costs and expenses $ 769,914 $ 715,551 $ 962,262 $ 2,107,379 $2,206,692Income (loss) before earnings from equity method investments
and other items $(369,442) $(250,482) $(360,805) $(1,331,046) $ (971,793) Gain (loss) on early extinguishment of debt, net (37,816) 101,466 108,923 547,349 393,131 Earnings from equity method investments 103,009 95,091 51,908 5,298 286,754Income (loss) from continuing operations before income taxes $(304,249) $ (53,925) $(199,974) $ (778,399) $ (291,908) Income tax (expense) benefit (8,445) 4,719 (7,023) (4,141) (10,375)Income (loss) from continuing operations $(312,694) $ (49,206) $(206,997) $ (782,540) $ (302,283) Income (loss) from discontinued operations (19,465) (7,318) 16,821 267 29,058 Gain from discontinued operations 27,257 25,110 270,382 12,426 91,458 Income from sales of residential property 63,472 5,721 – – – Net income (loss) $(241,430) $ (25,693) $ 80,206 $ (769,847) $ (181,767) Net (income) loss attributable to noncontrolling interests 1,500 3,629 (523) 1,071 (21,258)Net income (loss) attributable to iStar Financial Inc. $(239,930) $ (22,064) $ 79,683 $ (768,776) $ (203,025) Preferred dividends (42,320) (42,320) (42,320) (42,320) (42,320) Net (income) loss allocable to HPU holders and
Participating Security holders (1) 9,253 1,997 (1,084) 22,526 2,855Net income (loss) allocable to common shareholders $(272,997) $ (62,387) $ 36,279 $ (788,570) $ (242,490)Per common share data (2): Income (loss) attributable to iStar Financial Inc. Basic $ (3.35) $ (0.89) $ (2.60) $ (8.00) $ (2.75) from continuing operations: Diluted $ (3.35) $ (0.89) $ (2.60) $ (8.00) $ (2.75) Net income (loss) attributable Basic $ (3.26) $ (0.70) $ 0.39 $ (7.88) $ (1.85) to iStar Financial Inc.: Diluted $ (3.26) $ (0.70) $ 0.39 $ (7.88) $ (1.85)Per HPU share data (2): Income (loss) attributable to iStar Financial Inc Basic $ (633.94) $ (169.93) $ (493.33) $ (1,525.07) $ (520.07) from continuing operations: Diluted $ (633.94) $ (169.93) $ (493.33) $ (1,525.07) $ (520.07) Net income (loss) attributable Basic $ (616.87) $ (133.13) $ 72.27 $ (1,501.73) $ (349.87) to iStar Financial Inc.: Diluted $ (616.87) $ (133.13) $ 72.27 $ (1,501.73) $ (349.87)Dividends declared per common share (3) $ – $ – $ – $ – $ 1.74
16
-
17
For the Years Ended December 31, 2012 2011 2010 2009 2008(In thousands, except per share data and ratios)
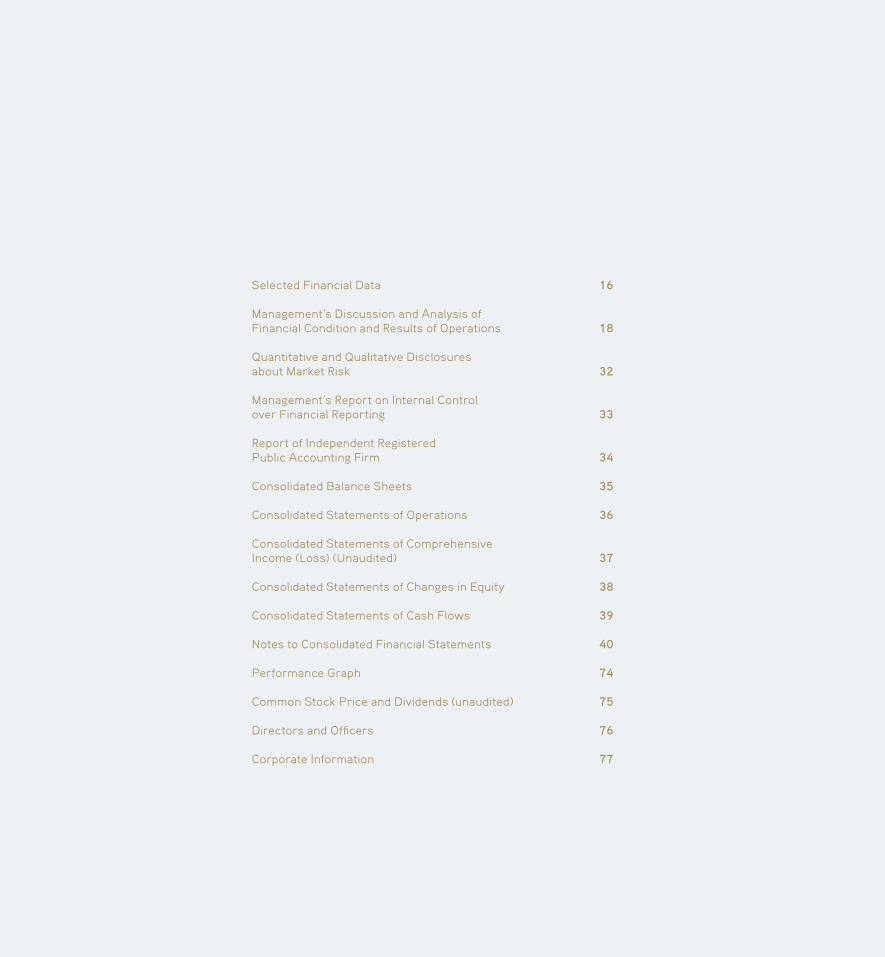
Supplemental Data:Adjusted Income (4) $ (53,847) $ (3,316) $ 360,525 $ 155,324 $ 842,049Adjusted EBITDA $ 349,754 $ 376,464 $ 767,663 $ 686,267 $1,592,422Ratio of Adjusted EBITDA to interest expense and preferred dividends (4) 0.9x 1.0x 2.0x 1.3x 2.2xRatio of earnings to fixed charges (5) (6) – – – – – Ratio of earnings to fixed charges and preferred dividends (5) (6) – – – – – Weighted average common shares outstanding – basic 83,742 88,688 93,244 100,071 131,153Weighted average common shares outstanding – diluted 83,742 88,688 93,244 100,071 131,153Weighted average HPU shares outstanding – basic and diluted 15 15 15 15 15Cash flows from: Operating activities $ (191,932) $ (28,577) $ (45,883) $ 77,795 $ 418,529 Investing activities $ 1,267,047 $ 1,461,257 $ 3,738,823 $ 724,702 $ (27,943) Financing activities $(1,175,597) $(1,580,719) $(3,412,707) $(1,074,402) $ 1,444
As of December 31, 2012 2011 2010 2009 2008(In thousands)
Balance Sheet Data:Real estate, net $2,799,023 $2,947,911 $2,642,038 $ 3,357,311 $ 3,103,310Real estate available and held for sale $ 635,865 $ 677,458 $ 746,081 $ 856,422 $ 242,505Loans receivable, net $1,829,985 $2,860,762 $4,587,352 $ 7,661,562 $10,586,644Total assets $6,150,789 $7,517,837 $9,174,154 $12,810,575 $15,296,748Debt obligations, net $4,691,494 $5,837,540 $7,345,433 $10,894,903 $12,486,404Total equity $1,313,154 $1,573,604 $1,694,659 $ 1,656,118 $ 2,446,662
Explanatory Notes:
(1) HPU holders are current and former Company employees who purchased high performance common stock units under the Company’s High Performance Unit Program. Participating Security holders are Company employees and directors who hold unvested restricted stock units, restricted stock awards and common stock equivalents granted under the Company’s Long Term Incentive Plans.
(2) See Note 13 of the Notes to Consolidated Financial Statements.(3) The Company has not declared or paid a common dividend since the quarter ended June 30, 2008.(4) Adjusted income and Adjusted EBITDA should be examined in conjunction with net income (loss) as shown in our Consolidated Statements of Operations. Adjusted income and
Adjusted EBITDA should not be considered as an alternative to net income (loss) (determined in accordance with GAAP), as an indicator of our performance, or to cash flows from operating activities (determined in accordance with GAAP) as a measure of our liquidity, nor are Adjusted income and Adjusted EBITDA indicative of funds available to fund our cash needs or available for distribution to shareholders. Rather, Adjusted income and Adjusted EBITDA are additional measures for us to use to analyze how our business is performing. It should be noted that our manner of calculating Adjusted income and Adjusted EBITDA may differ from the calculations of similarly-titled measures by other companies. See computa-tion of Adjusted income and Adjusted EBITDA on page 36.
(5) This ratio of earnings to fixed charges is calculated in accordance with SEC Regulation S-K Item 503. The Company’s unsecured debt securities have a fixed charge coverage covenant which is calculated differently in accordance with the terms of the agreements governing such securities.
(6) For the years ended December 31, 2012, 2011, 2010, 2009 and 2008, earnings were not sufficient to cover fixed charges by $303,466, $68,784, $218,353, $757,283 and $276,951, respectively, and earnings were not sufficient to cover fixed charges and preferred dividends by $345,786, $111,104, $260,673, $799,603 and $319,271, respectively.

management’s discussion and analysis of financial condition and results of operations
Certain statements in this report, other than purely histori-cal information, including estimates, projections, statements relating to our business plans, objectives and expected operating results, and the assumptions upon which those statements are based, are “for-ward-looking statements” within the meaning of the Private Securities Litigation Reform Act of 1995, Section 27A of the Securities Act and Section 21E of the Exchange Act. Forward-looking statements are included with respect to, among other things, the Company’s current business plan, business strategy, portfolio management, prospects and liquidity. These forward-looking statements generally are identified by the words “believe,” “project,” “expect,” “anticipate,” “estimate,” “intend,” “strategy,” “plan,” “may,” “should,” “will,” “would,” “will be,” “will continue,” “will likely result,” and similar expressions. Forward-looking statements are based on current expectations and assumptions that are subject to risks and uncertainties which may cause actual results or outcomes to differ materially from those contained in the forward-looking statements. Important factors that the Company believes might cause such differ-ences are discussed in the section entitled, “Risk Factors” in Part I, Item 1a of iStar Financial’s Form 10-K or otherwise accompany the forward-looking statements contained in this Annual Report. We undertake no obligation to update or revise publicly any forward-looking statements, whether as a result of new information, future events or otherwise. In assessing all forward-looking statements, readers are urged to read carefully all cautionary statements contained in this Annual Report. For purposes of this Management’s Discussion and Analysis of Financial Condition and Results of Operations, the terms “we,” “our” and “us” refer to iStar Financial Inc. and its consolidated subsidiaries, unless the con-text indicates otherwise.
This discussion summarizes the significant factors affecting our consolidated operating results, financial condition and liquidity dur-ing the three-year period ended December 31, 2012. This discussion should be read in conjunction with our consolidated financial statements and related notes for the three-year period ended December 31, 2012 included elsewhere in this Annual Report. These historical financial statements may not be indicative of our future performance. We have reclassified certain items in our consolidated financial statements from prior years in order to conform to our current year presentation (see Note 2 of the Notes to Consolidated Financial Statements).
Introduction
iStar Financial Inc. is a fully-integrated finance and investment company focused on the commercial real estate industry. We provide custom-tailored investment capital to high-end private and corporate owners of real estate and invest directly across a range of real estate sectors. We are taxed as a real estate investment trust, or “REIT,” and have invested more than $35 billion over the past two decades. Our pri-mary business segments are real estate finance, net leasing, operating properties and land.
Our real estate finance portfolio is primarily comprised of senior and mezzanine real estate loans that may be either fixed-rate or variable-rate and are structured to meet the specific financing needs of borrowers. Our portfolio also includes senior and subordinated loans to corporations, particularly those engaged in real estate or real estate related businesses and may be either secured or unsecured. Our loan portfolio includes whole loans and loan participations.
Our net lease portfolio is primarily comprised of properties owned by us and leased to single creditworthy tenants where the prop-erties are subject to long-term leases. Most of the leases provide for expenses at the facility to be paid by the tenant on a triple net lease basis. The properties in this portfolio are diversified by property type and geographic location.
Our operating properties portfolio is comprised of commer-cial and residential properties which represent a diverse pool of assets across a broad range of geographies and property types. We gener-ally seek to reposition or redevelop these assets with the objective of maximizing their value through the infusion of capital and/or intensive asset management efforts. The commercial properties within this port-folio include office, retail and hotel properties. The residential properties within this portfolio are generally luxury condominium projects located in major U.S. cities where our strategy is to sell individual condominium units through retail distribution channels.
Our land portfolio primarily consists of 11 master planned community projects, seven urban infill land parcels and six waterfront land parcels located throughout the United States. Master planned com-munities represent large-scale residential projects that we intend to plan and/or develop and may sell through retail channels to home builders or in bulk. We currently have entitlements at these projects for more than 25,000 lots. Waterfront parcels are generally entitled for residential projects and urban infill parcels are generally entitled for mixed-use proj-ects. We may develop these properties ourselves or sell to or partner with commercial real estate developers. These projects are currently entitled for approximately 6,000 residential units, and select projects include commercial, retail and office uses. As of December 31, 2012, we had four land projects in production, nine in development and 11 in the pre-development phase.
18
-
19
Executive Overview
2012 was a transitional year for the Company during which we made significant progress in strengthening our balance sheet and positioning the Company for the future. We executed several capi-tal markets transactions that extended our debt maturities, including three senior notes issuances which marked our return to the unsecured debt markets for the first time since 2008. The rates associated with the financings that we completed in the latter half of the year, following an upgrade of the Company’s corporate credit ratings, were materially lower than our earlier financings. Within our real estate and loan portfo-lios, our performing loans, net lease assets and residential condominium projects performed well, and we continued to make progress reducing the balance of our non-performing loans and enhancing the value of our commercial operating properties and land assets through the invest-ment of capital and intensive asset management. We intend to continue these efforts, with the objective of having these assets contribute posi-tively to earnings.
During 2012, we saw a meaningful contribution to earnings from our performing loans, net lease assets and sales of our residen-tial operating properties. However, the performance of our commercial operating properties and nonperforming loans resulted in losses and our land assets incurred sizable carrying costs, which factors continue to negatively impact our earnings.
For the year ended December 31, 2012, we recorded a net loss allocable to common shareholders of $(273.0) million, compared to a loss of $(62.4) million in the prior year. Results for the current year included $35.2 million of expenses associated with three capital mar-kets transactions. Results in the prior year included a $109.0 million gain associated with the redemption of the Company’s 10% senior secured notes and $30.3 million of additional earnings from equity method invest-ments associated with the sale of Oak Hill Advisors.
With respect to liquidity, during 2012, we generated $1.48 billion of proceeds from our portfolio and we raised approximately $3.51 bil-lion through secured and unsecured debt capital markets transactions. We used the proceeds of these transactions to repay and/or refinance a significant portion of our debt that was due to mature before 2017, which should enable us to increase our investment originations beginning in 2013. As of December 31, 2012, we had $545.3 million of debt maturities due before December 31, 2013, with a majority of that amount due in October 2013. As of December 31, 2012, we had $256.3 million of cash on hand and in January 2013, we entered into a definitive agreement to sell our interest in LNR for approximate net proceeds of $220.0 million. Additionally, as of December 31, 2012, we had unencumbered assets with a carrying value of $3.01 billion. Our capital resources to meet debt maturities in the coming year include debt refinancings, proceeds from asset sales, loan repayments from borrowers and may include equity capital raising transactions.

Results of Operations for the Year Ended December 31, 2012 compared to the Year Ended December 31, 2011
2012 2011 $ Change % Change(in thousands)
Operating lease income $ 219,019 $198,478 $ 20,541 10%Interest income 133,410 226,871 (93,461) (41)%Other income 48,043 39,720 8,323 21% Total revenue $ 400,472 $465,069 $ (64,597) (10)%Interest expense $ 355,097 $342,186 $ 12,911 4%Real estate expenses 151,827 138,943 12,884 9%Depreciation and amortization 69,350 58,662 10,688 18%General and administrative 80,856 105,039 (24,183) (23)%Provision for loan losses 81,740 46,412 35,328 76%Impairment of assets 13,778 13,239 539 4%Other expense 17,266 11,070 6,196 56% Total costs and expenses $ 769,914 $715,551 $ 54,363 8%Gain (loss) on early extinguishment of debt, net $ (37,816) $101,466 $(139,282) >100%Earnings from equity method investments 103,009 95,091 7,918 8%Income tax (expense) benefit (8,445) 4,719 (13,164) >100%Income (loss) from discontinued operations (19,465) (7,318) (12,147) >100%Gain from discontinued operations 27,257 25,110 2,147 9%Income from sales of residential property 63,472 5,721 57,751 >100%Net income (loss) $(241,430) $ (25,693) $(215,737) >100%
Revenue – Operating lease income increased to $219.0 million in 2012 and includes income from net lease assets and commercial operat-ing properties. Operating lease income from net lease assets increased 3.3% to $152.0 million in 2012 from $147.2 million in 2011 primarily due to new leasing activity. As of December 31, 2012, net lease assets were 94.8% leased compared to 94.4% leased as of December 31, 2011. For the year ended December 31, 2012, the net lease portfolio generated a weighted average effective yield of 8.6% compared to 8.4% during the same period in 2011.
Operating lease income from commercial operating properties increased to $65.5 million in 2012 from $51.2 million in 2011. We acquired title to additional commercial operating properties at the end of 2011 and during 2012, which contributed $20.6 million in operating lease income for the year ended December 31, 2012. The impact of certain lease terminations offset this increase by $6.3 million year over year. As of December 31, 2012, commercial operating properties, excluding hotels, were 58.1% leased compared to 41.0% leased as of December 31, 2011.
Interest income declined primarily due to a decline in the average balance of performing loans to $1.67 billion for the year ended December 31, 2012 from $2.58 billion for the same period in 2011. The decrease in performing loans was primarily due to loan repayments as well as performing loans moving to non-performing status (see Risk Management below). For the year ended December 31, 2012, performing loans generated a weighted average effective yield of 7.5% as compared to 7.2% in 2011.
Other income primarily includes revenue related to hotel properties included in the operating property portfolio, which was $32.8 million in 2012 compared to $32.5 million in 2011. For the year ended December 31, 2012, other income also includes $8.6 million of loan income related to the prepayment and sales of loans as compared to $2.9 million for the year ended December 31, 2011.
Costs and expenses – Interest expense increased in 2012 pri-marily due to a higher weighted average cost of debt offset by a lower average outstanding balance. Our weighted average effective cost of debt increased to 6.5% for the year ended December 31, 2012 as com-pared to 5.3% during 2011, primarily due to the refinancing of existing debt in 2011 and the first half of 2012 at higher rates. With continued improvement in the capital markets and upgrades in our credit ratings achieved later in 2012, we refinanced one of our secured credit facili-ties and issued unsecured debt at rates which will reduce our weighted average cost of debt in future periods. The average outstanding balance of our debt declined to $5.49 billion for the year ended December 31, 2012 from $6.47 billion for the year ended December 31, 2011.
The increase in real estate expense year over year was primar-ily driven by additional properties that we took title to in 2012 and late 2011 through resolution of non-performing loans. Expenses for operat-ing properties were $100.3 million in 2012 as compared to $92.0 million in 2011, which includes carrying costs on our residential operating prop-erties totaling $26.5 million in 2012 and $24.4 million in 2011. Operating expenses for net lease assets declined slightly to $24.3 million in 2012 from $25.3 million in 2011. Carrying costs and other expenses on our
20
-
21
land assets increased to $27.3 million in 2012 from $21.6 million in 2011, primarily related to acquiring title to assets in resolution of non-performing loans as well as increased legal and consulting expenses. Depreciation and amortization increased in 2012 primarily due to the acquisition of additional operating properties in late 2011 and 2012.
General and administrative expenses decreased primarily due to lower stock-based compensation expense, lower payroll and employee related costs and decreased legal expenses. Stock-based compensation expense declined to $15.3 million in 2012 from $29.7 mil-lion in 2011, primarily resulting from the incremental expense in 2011 associated with the July 2011 modification of our restricted stock units originally awarded on December 19, 2008. Payroll and employee related costs declined due to staffing reductions, while legal expenses declined due to the settlement of litigation in June 2012 (see Item 3. Legal Proceedings in iStar Financial’s Form 10-K).
Provisions for loan losses totaled $81.7 million during the year ended December 31, 2012 and included higher specific reserves on non-performing loans, offset by a reduction in the general reserve primarily due to a reduction in the balance of performing loans outstanding during the current year (see Risk Management below).
Impairment of assets for the year ended December 31, 2012 resulted primarily from changes in business strategy for certain assets and consisted of $27.7 million on operating properties and $7.7 million on net lease assets. Of these amounts, $22.6 million of impairments related to real estate assets held for sale or sold and were therefore included in discontinued operations for the year ended December 31, 2012. For the year ended December 31, 2011, we recorded impairments of $22.4 mil-lion related to operating properties which resulted from changing market conditions and changes in business strategy for certain assets. Of this amount, $9.1 million relates to real estate assets held for sale or sold and therefore, were included in discontinued operations for the year ended December 31, 2011.
Other expense for the year ended December 31, 2012 increased primarily due to $8.1 million of third party expenses incurred in connection with the refinancing of our 2011 Secured Credit Facilities with our October Credit Facility (see Liquidity and Capital Resources below).
Gain on early extinguishment of debt, net – During the year ended December 31, 2012, net losses on the early extinguishment of debt included a $14.9 million prepayment fee on the early redemption of our 8.625% Senior Unsecured Notes due in June 2013 as well as $12.1 mil-lion related to the accelerated amortization of discounts and fees in connection with the refinancing of our 2011 Secured Credit Facilities in October of 2012 (see Liquidity and Capital Resources below). We also recorded $13.8 million of losses in 2012 related to the accelerated amor-tization of discounts and fees in connection with amortization payments that we made on our 2011 and 2012 Secured Credit Facilities. These losses were partially offset by gains on the repurchases of unsecured notes during 2012.
During the same period in 2011, we fully redeemed the $312.3 million remaining principal balance of our 10% senior secured notes due June 2014 which resulted in a $109.0 million gain on early extinguishment of debt primarily related to the recognition of deferred gain that resulted from a previous debt exchange. This was offset by losses on extinguishment of debt related to the accelerated amortization of discounts and fees in connection with amortization payments that we made on our secured credit facilities, including the A-1 Tranche of the 2011 Secured Credit Facilities.
Earnings from equity method investments – Earnings from equity method investments increased during the year ended December 31, 2012, primarily due to $26.0 million of equity in earnings recognized from income from sales of residential property units recorded by one of our real estate equity investments. Earnings from certain of our other stra-tegic investments increased due to better overall market performance. These increases were partially offset by the impact of the sale of Oak Hill Advisors, L.P. and related entities in October 2011, which contributed $38.4 million to earnings, including a pre-tax gain of $30.3 million during the year ended December 31, 2011.
Income tax (expense) benefit – Income taxes are primarily gen-erated by assets held in our taxable REIT subsidiaries (“TRS’s”), and increased to an expense of $8.4 million in 2012 versus a benefit of $4.7 million in 2011. During the year ended December 31, 2012, TRS entities generated taxable income of $42.2 million, which was partially offset by the utilization of net operating loss carryforwards, resulting in current tax expense of $8.4 million. For the year ended December 31, 2011, TRS entities generated taxable income of $75.8 million, including the gain on the sale of our Oak Hill investments. This income was par-tially offset by the utilization of net operating loss carryforwards that reduced our current tax expense to $9.0 million for the year. The current tax expense was partially offset by a $13.7 million non-cash deferred tax benefit that resulted from the reversal of a deferred tax liability related to a difference in investment basis for our Oak Hill investments that were sold in October of 2011.
Discontinued operations – During the year ended December 31, 2012, we sold net lease assets with a carrying value of $115.5 million and recorded gains of $27.3 million. During the year ended December 31, 2011, we realized a $22.2 million gain from discontinued operations pre-viously deferred as part of the June 2010 sale of 32 net lease assets.
Income (loss) from discontinued operations includes operat-ing results from net lease assets and commercial operating properties held for sale or sold as of December 31, 2012. For the years ended December 31, 2012 and 2011, income (loss) from discontinued opera-tions includes impairment of assets of $22.6 million and $9.1 million, respectively.
Income from sales of residential property – During the year ended December 31, 2012 and 2011, we sold condominium units for total net proceeds of $319.3 million and $154.0 million, respectively, that resulted in income from sales of residential properties totaling $63.5 million and $5.7 million, respectively.
Results of Operations for the Year Ended December 31, 2011 Compared to the Year Ended December 31, 2010
2011 2010 $ Change % Change(in thousands)
Operating lease income $198,478 $186,630 $ 11,848 6%Interest income 226,871 364,094 (137,223) (38)%Other income 39,720 50,733 (11,013) (22)% Total revenue $465,069 $601,457 $(136,388) (23)%Interest expense $342,186 $313,766 $ 28,420 9%Real estate expense 138,943 121,399 17,544 14%Depreciation and amortization 58,662 57,220 1,442 3%General and administrative 105,039 109,526 (4,487) (4)%Provision for loan losses 46,412 331,487 (285,075) (86)%Impairment of assets 13,239 12,809 430 3%Other expense 11,070 16,055 (4,985) (31)% Total costs and expenses $715,551 $962,262 $(246,711) (26)%Gain on early extinguishment of debt, net $101,466 $108,923 $(7,457) (7)%Earnings from equity method investments 95,091 51,908 43,183 83%Income tax (expense) benefit 4,719 (7,023) 11,742 >100%Income (loss) from discontinued operations (7,318) 16,821 (24,139) >100%Gain from discontinued operations 25,110 270,382 (245,272) (91)%Income from sales of residential property 5,721 – 5,721 100%Net income (loss) $ (25,693) $ 80,206 $(105,899) >100%
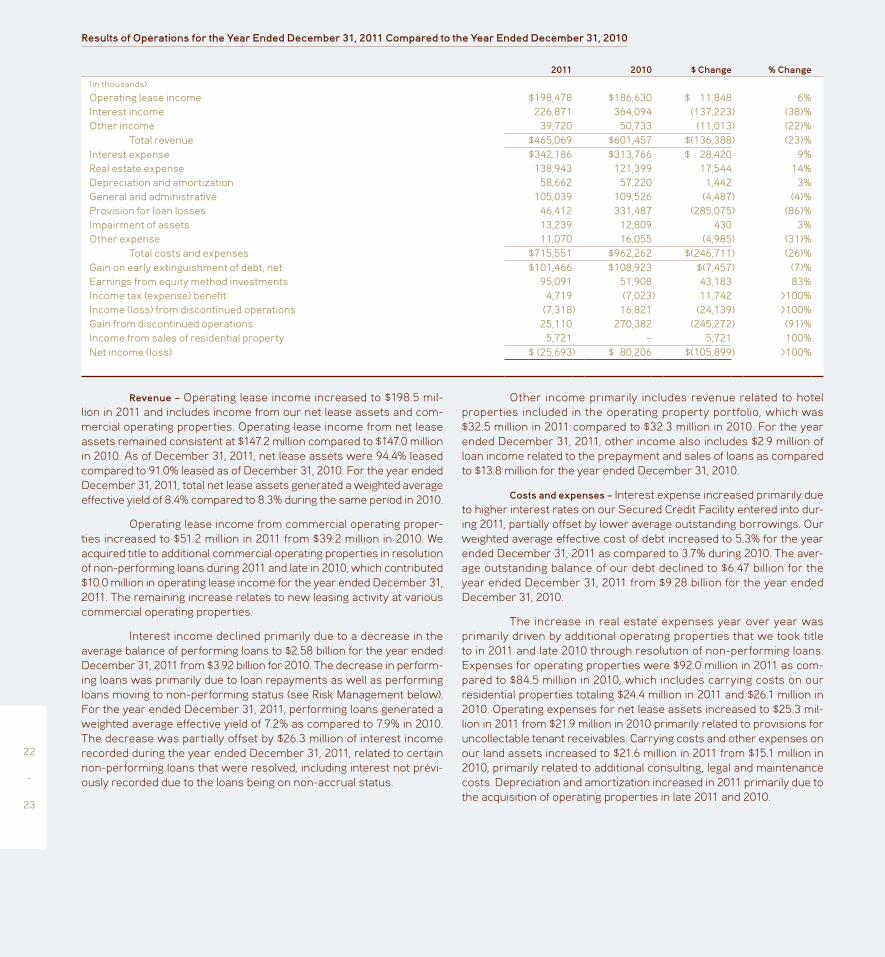
Revenue – Operating lease income increased to $198.5 mil-lion in 2011 and includes income from our net lease assets and com-mercial operating properties. Operating lease income from net lease assets remained consistent at $147.2 million compared to $147.0 million in 2010. As of December 31, 2011, net lease assets were 94.4% leased compared to 91.0% leased as of December 31, 2010. For the year ended December 31, 2011, total net lease assets generated a weighted average effective yield of 8.4% compared to 8.3% during the same period in 2010.
Operating lease income from commercial operating proper-ties increased to $51.2 million in 2011 from $39.2 million in 2010. We acquired title to additional commercial operating properties in resolution of non-performing loans during 2011 and late in 2010, which contributed $10.0 million in operating lease income for the year ended December 31, 2011. The remaining increase relates to new leasing activity at various commercial operating properties.
Interest income declined primarily due to a decrease in the average balance of performing loans to $2.58 billion for the year ended December 31, 2011 from $3.92 billion for 2010. The decrease in perform-ing loans was primarily due to loan repayments as well as performing loans moving to non-performing status (see Risk Management below). For the year ended December 31, 2011, performing loans generated a weighted average effective yield of 7.2% as compared to 7.9% in 2010. The decrease was partially offset by $26.3 million of interest income recorded during the year ended December 31, 2011, related to certain non-performing loans that were resolved, including interest not previ-ously recorded due to the loans being on non-accrual status.
Other income primarily includes revenue related to hotel properties included in the operating property portfolio, which was $32.5 million in 2011 compared to $32.3 million in 2010. For the year ended December 31, 2011, other income also includes $2.9 million of loan income related to the prepayment and sales of loans as compared to $13.8 million for the year ended December 31, 2010.
Costs and expenses – Interest expense increased primarily due to higher interest rates on our Secured Credit Facility entered into dur-ing 2011, partially offset by lower average outstanding borrowings. Our weighted average effective cost of debt increased to 5.3% for the year ended December 31, 2011 as compared to 3.7% during 2010. The aver-age outstanding balance of our debt declined to $6.47 billion for the year ended December 31, 2011 from $9.28 billion for the year ended December 31, 2010.
The increase in real estate expenses year over year was primarily driven by additional operating properties that we took title to in 2011 and late 2010 through resolution of non-performing loans. Expenses for operating properties were $92.0 million in 2011 as com-pared to $84.5 million in 2010, which includes carrying costs on our residential properties totaling $24.4 million in 2011 and $26.1 million in 2010. Operating expenses for net lease assets increased to $25.3 mil-lion in 2011 from $21.9 million in 2010 primarily related to provisions for uncollectable tenant receivables. Carrying costs and other expenses on our land assets increased to $21.6 million in 2011 from $15.1 million in 2010, primarily related to additional consulting, legal and maintenance costs. Depreciation and amortization increased in 2011 primarily due to the acquisition of operating properties in late 2011 and 2010.
22
-
23

General and administrative expenses decreased primar-ily due to lower payroll and employee related costs from both staffing reductions and reduced annual cash compensation offset by additional stock-based compensation expense resulting from the modification of our December 19, 2008 restricted stock units. Excluding stock-based compensation expense, general and administrative expense declined by $14.8 million or 16.5% from the prior year.
Our total costs and expenses were impacted most significantly by lower provisions for loan losses. The decline in our provisions for loan losses primarily resulted from fewer loans moving to non-performing status and a lower overall balance of non-performing loans during the year ended December 31, 2011 as compared to 2010. Additionally, repay-ments and sales of performing loans resulted in a lower portfolio bal-ance leading to a reduction in the required general loan loss reserve.
For the years ended December 31, 2011 and 2010, impairments on real estate assets resulted from changes in market conditions and changes in business strategy. In 2011, $22.4 million of impairments were recorded related to operating properties and of this amount, $9.1 million related to real estate assets held for sale or sold and were therefore included in discontinued operations. In 2010, we recorded $19.1 million of impairments on operating properties and $4.2 million on net lease assets. Of these amounts, $9.6 million related to real estate assets held for sale or sold and were therefore included in discontinued operations.
Other expense decreased primarily due to lower legal fees and other unreimbursed expenses incurred relating to non-performing loans.
Gain (loss) on early extinguishment of debt, net – During the year ended December 31, 2011, we fully redeemed the $312.3 million remain-ing principal balance of our 10% senior secured notes due June 2014, which resulted in a $109.0 million gain on early extinguishment of debt. This was offset by losses on extinguishment of debt related to the accel-erated amortization of deferred fees and debt discount resulting from amortization payments made on our secured credit facilities, including the Tranche A-1 facility.
During the same period in 2010, we retired $633.0 million par value of our senior secured and unsecured notes and we redeemed $282.3 million of senior secured notes. Together, these transac-tions resulted in an aggregate gain on early extinguishment of debt of $131.0 million. These gains were offset by $22.1 million of losses resulting from the acceleration of unamortized deferred fees and debt discount in connection with the prepayments of our $1.0 billion First Priority Credit Agreement, which was due to mature in 2012, and our $947.9 million non-recourse secured term loan and another secured term loan that were collateralized by net lease assets we sold during the period.
Earnings from equity method investments – The increase in earn-ings from equity method investments was primarily attributable to the sale of our interests in Oak Hill Advisors, L.P. and related entities as well as a full year of earnings from our investment in LNR. In October 2011,
we sold a substantial portion of our interests in Oak Hill Advisors, L.P. and related entities and recorded a pre-tax gain of $30.3 million. Prior to the sale in October of 2011, we recorded $8.5 million of earnings from our investments in the Oak Hill entities that were sold during the year ended December 31, 2011. We also recorded a full year of earnings from our investment in LNR, which was $52.1 million higher than our partial year earnings in the prior year when the investment was made. During the year ended December 31, 2011, our share of earnings from LNR included $19.2 million of nonrecurring income from the settlement of tax liabilities. These increases in earnings were partially offset by losses and lower returns recorded by certain of our strategic investments, primarily due to weaker market performance as compared to 2010.
Income tax (expense) benefit – The income tax benefit recorded during the year ended December 31, 2011 was comprised of $13.7 mil-lion of deferred tax benefit offset by $9.0 million of current tax expense related to taxable income generated by assets held in our TRS’s. TRS entities generated taxable income of $75.8 million for the year ended December 31, 2011, including the gain on the sale of our investment in Oak Hill Advisors L.P. This income was partially offset by the utiliza-tion of net operating loss carryforwards that reduced our current tax expense to $9.0 million for the year. The $13.7 million non-cash deferred tax benefit was due to the reversal of a deferred tax liability related to a difference in investment basis for our Oak Hill investments that were sold in October of 2011.
Discontinued operations – During the year ended December 31, 2011, we sold net lease assets with an aggregate carrying value of $34.4 million resulting in a net gain of $2.9 million. In 2011, we also resolved a contingent obligation related to the 2010 portfolio sale of 32 net lease assets, resulting in a gain of $22.2 million. During the same period in 2010, we sold net lease assets, including a portfolio of 32 net lease assets, and recognized an aggregate initial gain of $270.4 million.
Income (loss) from discontinued operations includes operat-ing results from net lease assets and commercial operating properties held for sale or sold as of December 31, 2012. For the years ended December 31, 2011 and 2010, income (loss) from discontinued opera-tions includes impairment of assets of $9.1 million and $9.6 million, respectively.
Income from sales of residential property – During the year ended December 31, 2011 we sold condominium units for total net proceeds of $154.0 million that resulted in income from sales of residential properties totaling $5.7 million.
Adjusted Income and Adjusted EBITDA
In addition to net income (loss), we use Adjusted income and Adjusted EBITDA to measure our operating performance. Adjusted income represents net income (loss) allocable to common sharehold-ers, prior to the effect of depreciation and amortization, provision for loan losses, impairment of assets, stock-based compensation expense,
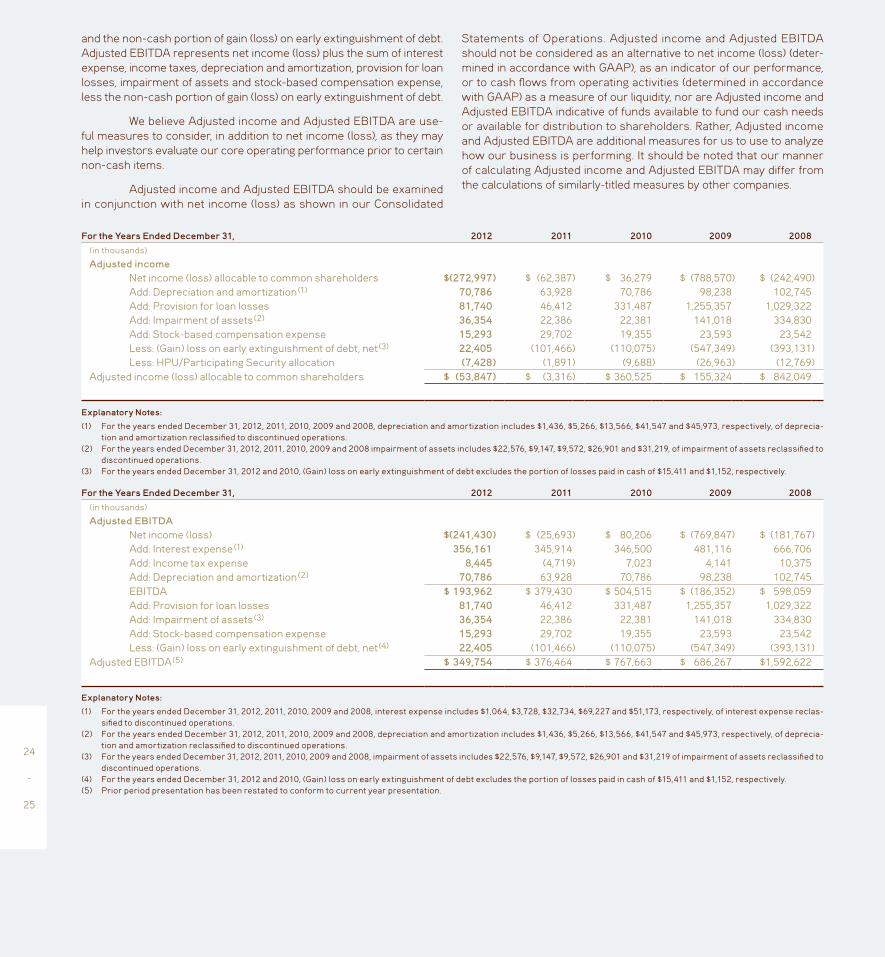
and the non-cash portion of gain (loss) on early extinguishment of debt. Adjusted EBITDA represents net income (loss) plus the sum of interest expense, income taxes, depreciation and amortization, provision for loan losses, impairment of assets and stock-based compensation expense, less the non-cash portion of gain (loss) on early extinguishment of debt.
We believe Adjusted income and Adjusted EBITDA are use-ful measures to consider, in addition to net income (loss), as they may help investors evaluate our core operating performance prior to certain non-cash items.
Adjusted income and Adjusted EBITDA should be examined in conjunction with net income (loss) as shown in our Consolidated
Statements of Operations. Adjusted income and Adjusted EBITDA should not be considered as an alternative to net income (loss) (deter-mined in accordance with GAAP), as an indicator of our performance, or to cash flows from operating activities (determined in accordance with GAAP) as a measure of our liquidity, nor are Adjusted income and Adjusted EBITDA indicative of funds available to fund our cash needs or available for distribution to shareholders. Rather, Adjusted income and Adjusted EBITDA are additional measures for us to use to analyze how our business is performing. It should be noted that our manner of calculating Adjusted income and Adjusted EBITDA may differ from the calculations of similarly-titled measures by other companies.
For the Years Ended December 31, 2012 2011 2010 2009 2008(in thousands)
Adjusted income Net income (loss) allocable to common shareholders $(272,997) $ (62,387) $ 36,279 $ (788,570) $ (242,490) Add: Depreciation and amortization (1) 70,786 63,928 70,786 98,238 102,745 Add: Provision for loan losses 81,740 46,412 331,487 1,255,357 1,029,322 Add: Impairment of assets (2) 36,354 22,386 22,381 141,018 334,830 Add: Stock-based compensation expense 15,293 29,702 19,355 23,593 23,542 Less: (Gain) loss on early extinguishment of debt, net (3) 22,405 (101,466) (110,075) (547,349) (393,131) Less: HPU/Participating Security allocation (7,428) (1,891) (9,688) (26,963) (12,769)Adjusted income (loss) allocable to common shareholders $ (53,847) $ (3,316) $ 360,525 $ 155,324 $ 842,049
Explanatory Notes:
(1) For the years ended December 31, 2012, 2011, 2010, 2009 and 2008, depreciation and amortization includes $1,436, $5,266, $13,566, $41,547 and $45,973, respectively, of deprecia-tion and amortization reclassified to discontinued operations.
(2) For the years ended December 31, 2012, 2011, 2010, 2009 and 2008 impairment of assets includes $22,576, $9,147, $9,572, $26,901 and $31,219, of impairment of assets reclassified to discontinued operations.
(3) For the years ended December 31, 2012 and 2010, (Gain) loss on early extinguishment of debt excludes the portion of losses paid in cash of $15,411 and $1,152, respectively.
For the Years Ended December 31, 2012 2011 2010 2009 2008(in thousands)
Adjusted EBITDA Net income (loss) $(241,430) $ (25,693) $ 80,206 $ (769,847) $ (181,767) Add: Interest expense (1) 356,161 345,914 346,500 481,116 666,706 Add: Income tax expense 8,445 (4,719) 7,023 4,141 10,375 Add: Depreciation and amortization (2) 70,786 63,928 70,786 98,238 102,745 EBITDA $ 193,962 $ 379,430 $ 504,515 $ (186,352) $ 598,059 Add: Provision for loan losses 81,740 46,412 331,487 1,255,357 1,029,322 Add: Impairment of assets (3) 36,354 22,386 22,381 141,018 334,830 Add: Stock-based compensation expense 15,293 29,702 19,355 23,593 23,542 Less: (Gain) loss on early extinguishment of debt, net (4) 22,405 (101,466) (110,075) (547,349) (393,131)Adjusted EBITDA (5) $ 349,754 $ 376,464 $ 767,663 $ 686,267 $1,592,622
Explanatory Notes:
(1) For the years ended December 31, 2012, 2011, 2010, 2009 and 2008, interest expense includes $1,064, $3,728, $32,734, $69,227 and $51,173, respectively, of interest expense reclas-sified to discontinued operations.
(2) For the years ended December 31, 2012, 2011, 2010, 2009 and 2008, depreciation and amortization includes $1,436, $5,266, $13,566, $41,547 and $45,973, respectively, of deprecia-tion and amortization reclassified to discontinued operations.
(3) For the years ended December 31, 2012, 2011, 2010, 2009 and 2008, impairment of assets includes $22,576, $9,147, $9,572, $26,901 and $31,219 of impairment of assets reclassified to discontinued operations.
(4) For the years ended December 31, 2012 and 2010, (Gain) loss on early extinguishment of debt excludes the portion of losses paid in cash of $15,411 and $1,152, respectively.(5) Prior period presentation has been restated to conform to current year presentation.
24
-
25

Risk Management
Loan credit statistics – The table below summarizes our non-performing loans, watch list loans and the reserves for loan losses asso-ciated with our loans ($ in thousands):
As of December 31, 2012 2011Non-performing loansCarrying value (1) $503,112 $771,196As a percentage of total carrying
value of loans 27.5% 27.1%Watch list loansCarrying value $ 44,350 $136,006As a percentage of total carrying
value of loans 2.4% 4.8%Reserve for loan lossesTotal reserve for loan losses $524,499 $646,624As a percentage of total loans
before loan loss reserves 22.3% 18.5%Non-performing loan asset-specific
reserves for loan losses $476,140 $557,129As a percentage of gross carrying
value of non-performing loans 48.6% 41.9%
Explanatory Note:
(1) As of December 31, 2012 and 2011, carrying values of non-performing loans are net of asset-specific reserves for loan losses of $476.1 million and $557.1 million, respectively.
Non-Performing Loans – We designate loans as non-performing at such time as: (1) the loan becomes 90 days delinquent; (2) the loan has a maturity default; or (3) management determines it is probable that it will be unable to collect all amounts due according to the contractual terms of the loan. All non-performing loans are placed on non-accrual status and income is only recognized in certain cases upon actual cash receipt. As of December 31, 2012, we had non-performing loans with an aggregate carrying value of $503.1 million. Our non-performing loans decreased during year ended December 31, 2012, primarily due to us taking title to properties serving as collateral in full or partial satisfaction of such loans.
Watch List Loans – During our quarterly loan portfolio assess-ments, loans are put on the watch list if deteriorating performance indicates they warrant a higher degree of monitoring and senior man-agement attention. As of December 31, 2012, we had loans on the watch list with a combined carrying value of $44.4 million.
Reserve for Loan Losses – The reserve for loan losses was $524.5 million as of December 31, 2012, or 22.3% of the gross carrying value of total loans, compared to $646.6 million or 18.5% at December 31, 2011. The change in the balance of the reserve was the result of $81.7 million of provisioning for loan losses, reduced by $203.9 million of charge-offs during the year ended December 31, 2012. Due to the continued volatility of the commercial real estate market, the process
of estimating collateral values and reserves require us to use significant judgment. In addition, the process of estimating values and reserves for our European loan assets (which had a carrying value of $228.7 million as of December 31, 2012), is subject to additional risks related to the continued economic uncertainty in the Eurozone. We currently believe there are adequate collateral and reserves to support the carrying val-ues of the loans.
The reserve for loan losses includes an asset-specific com-ponent and a formula-based component. An asset-specific reserve is established for an impaired loan when the estimated fair value of the loan’s collateral less costs to sell is lower than the carrying value of the loan. As of December 31, 2012, asset-specific reserves decreased to $491.4 million compared to $573.1 million at December 31, 2011, pri-marily due to charge-offs on loans where we took title to properties serving as collateral in full or partial satisfaction of such loans or loans that were sold. The decrease was partially offset by additional reserves established on new non-performing loans.
The formula-based general reserve is derived from estimated principal default probabilities and loss severities applied to groups of performing loans based upon risk ratings assigned to loans with simi-lar risk characteristics during our quarterly loan portfolio assessment. During this assessment, we perform a comprehensive analysis of our loan portfolio and assign risk ratings to loans that incorporate man-agement’s current judgments about their credit quality based on all known and relevant factors that may affect collectability. We consider, among other things, payment status, lien position, borrower financial resources and investment in collateral, collateral type, project econom-ics and geographical location as well as national and regional economic factors. This methodology results in loans being segmented by risk clas-sification into risk rating categories that are associated with estimated probabilities of default and principal loss. We estimate loss rates based on historical realized losses experienced within our portfolio and take into account current economic conditions affecting the commercial real estate market when establishing appropriate time frames to evaluate loss experience.
The general reserve decreased to $33.1 million or 2.4% of the gross carrying value of performing loans as of December 31, 2012, com-pared to $73.5 million or 3.4% of the gross carrying value of perform-ing loans at December 31, 2011. This reduction is primarily attributable to the reduction in the balance of performing loans combined with an improvement in the weighted average risk ratings of performing loans to 3.01 as of December 31, 2012 compared to 3.29 as of December 31, 2011.
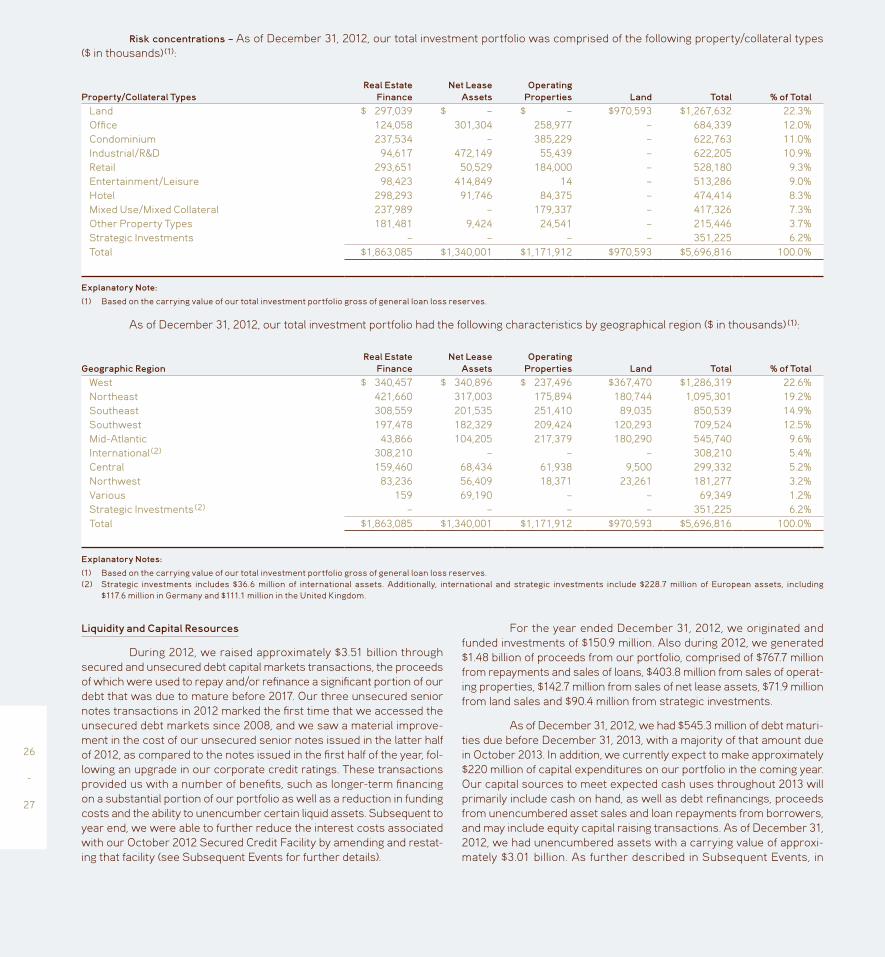
Risk concentrations – As of December 31, 2012, our total investment portfolio was comprised of the following property/collateral types ($ in thousands) (1):
Property/Collateral TypesReal Estate
FinanceNet Lease
AssetsOperating
Properties Land Total % of TotalLand $ 297,039 $ – $ – $970,593 $1,267,632 22.3%Office 124,058 301,304 258,977 – 684,339 12.0%Condominium 237,534 – 385,229 – 622,763 11.0%Industrial/R&D 94,617 472,149 55,439 – 622,205 10.9%Retail 293,651 50,529 184,000 – 528,180 9.3%Entertainment/Leisure 98,423 414,849 14 – 513,286 9.0%Hotel 298,293 91,746 84,375 – 474,414 8.3%Mixed Use/Mixed Collateral 237,989 – 179,337 – 417,326 7.3%Other Property Types 181,481 9,424 24,541 – 215,446 3.7%Strategic Investments – – – – 351,225 6.2%Total $1,863,085 $1,340,001 $1,171,912 $970,593 $5,696,816 100.0%
Explanatory Note:
(1) Based on the carrying value of our total investment portfolio gross of general loan loss reserves.
As of December 31, 2012, our total investment portfolio had the following characteristics by geographical region ($ in thousands) (1):
Geographic RegionReal Estate
FinanceNet Lease
AssetsOperating
Properties Land Total % of TotalWest $ 340,457 $ 340,896 $ 237,496 $367,470 $1,286,319 22.6%Northeast 421,660 317,003 175,894 180,744 1,095,301 19.2%Southeast 308,559 201,535 251,410 89,035 850,539 14.9%Southwest 197,478 182,329 209,424 120,293 709,524 12.5%Mid-Atlantic 43,866 104,205 217,379 180,290 545,740 9.6%International (2) 308,210 – – – 308,210 5.4%Central 159,460 68,434 61,938 9,500 299,332 5.2%Northwest 83,236 56,409 18,371 23,261 181,277 3.2%Various 159 69,190 – – 69,349 1.2%Strategic Investments (2) – – – – 351,225 6.2%Total $1,863,085 $1,340,001 $1,171,912 $970,593 $5,696,816 100.0%
Explanatory Notes:
(1) Based on the carrying value of our total investment portfolio gross of general loan loss reserves.(2) Strategic investments includes $36.6 million of international assets. Additionally, international and strategic investments include $228.7 million of European assets, including
$117.6 million in Germany and $111.1 million in the United Kingdom.
Liquidity and Capital Resources
During 2012, we raised approximately $3.51 billion through secured and unsecured debt capital markets transactions, the proceeds of which were used to repay and/or refinance a significant portion of our debt that was due to mature before 2017. Our three unsecured senior notes transactions in 2012 marked the first time that we accessed the unsecured debt markets since 2008, and we saw a material improve-ment in the cost of our unsecured senior notes issued in the latter half of 2012, as compared to the notes issued in the first half of the year, fol-lowing an upgrade in our corporate credit ratings. These transactions provided us with a number of benefits, such as longer-term financing on a substantial portion of our portfolio as well as a reduction in funding costs and the ability to unencumber certain liquid assets. Subsequent to year end, we were able to further reduce the interest costs associated with our October 2012 Secured Credit Facility by amending and restat-ing that facility (see Subsequent Events for further details).
For the year ended December 31, 2012, we originated and funded investments of $150.9 million. Also during 2012, we generated $1.48 billion of proceeds from our portfolio, comprised of $767.7 million from repayments and sales of loans, $403.8 million from sales of operat-ing properties, $142.7 million from sales of net lease assets, $71.9 million from land sales and $90.4 million from strategic investments.
As of December 31, 2012, we had $545.3 million of debt maturi-ties due before December 31, 2013, with a majority of that amount due in October 2013. In addition, we currently expect to make approximately $220 million of capital expenditures on our portfolio in the coming year. Our capital sources to meet expected cash uses throughout 2013 will primarily include cash on hand, as well as debt refinancings, proceeds from unencumbered asset sales and loan repayments from borrowers, and may include equity capital raising transactions. As of December 31, 2012, we had unencumbered assets with a carrying value of approxi-mately $3.01 billion. As further described in Subsequent Events, in
26
-
27
January 2013, we entered into a definitive agreement to sell our interest in LNR for approximate net proceeds of $220.0 million. This transaction is expected to close in the second quarter of 2013, subject to custom-ary closing conditions. The closing of this transaction will provide us with cash that we can use for new investment activities which should contribute positively to our earnings; however, those investments may not fully replace the earnings contributed by LNR (see Note 6 to the Consolidated Financial Statements).
We cannot predict with certainty the specific transactions we will undertake to generate sufficient liquidity to meet our obligations
as they come due. We will adjust our plans as appropriate in response to changes in our expectations and changes in market conditions. It is also not possible for us to predict whether improving economic trends will continue or to quantify the impact of these or other trends on our financial results. If we fail to repay our obligations as they become due, it would be an event of default under the relevant debt instruments, which could result in a cross-default and acceleration of our other outstanding debt obligations, all of which would have a material adverse effect on our business.
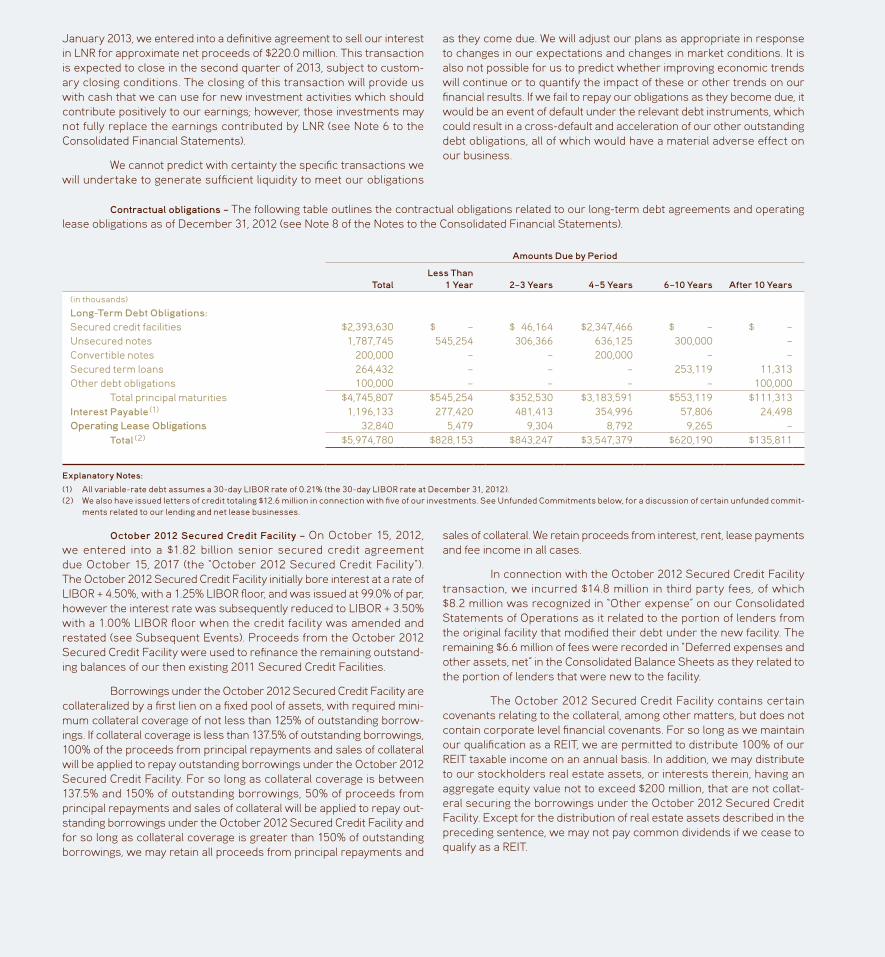
Contractual obligations – The following table outlines the contractual obligations related to our long-term debt agreements and operating lease obligations as of December 31, 2012 (see Note 8 of the Notes to the Consolidated Financial Statements).
Amounts Due by Period
TotalLess Than
1 Year 2–3 Years 4–5 Years 6–10 Years After 10 Years(in thousands)
Long-Term Debt Obligations:Secured credit facilities $2,393,630 $ – $ 46,164 $2,347,466 $ – $ – Unsecured notes 1,787,745 545,254 306,366 636,125 300,000 – Convertible notes 200,000 – – 200,000 – – Secured term loans 264,432 – – – 253,119 11,313Other debt obligations 100,000 – – – – 100,000 Total principal maturities $4,745,807 $545,254 $352,530 $3,183,591 $553,119 $111,313Interest Payable (1) 1,196,133 277,420 481,413 354,996 57,806 24,498Operating Lease Obligations 32,840 5,479 9,304 8,792 9,265 – Total (2) $5,974,780 $828,153 $843,247 $3,547,379 $620,190 $135,811
Explanatory Notes:
(1) All variable-rate debt assumes a 30-day LIBOR rate of 0.21% (the 30-day LIBOR rate at December 31, 2012).(2) We also have issued letters of credit totaling $12.6 million in connection with five of our investments. See Unfunded Commitments below, for a discussion of certain unfunded commit-
ments related to our lending and net lease businesses.
October 2012 Secured Credit Facility – On October 15, 2012, we entered into a $1.82 billion senior secured credit agreement due October 15, 2017 (the “October 2012 Secured Credit Facility”). The October 2012 Secured Credit Facility initially bore interest at a rate of LIBOR + 4.50%, with a 1.25% LIBOR floor, and was issued at 99.0% of par, however the interest rate was subsequently reduced to LIBOR + 3.50% with a 1.00% LIBOR floor when the credit facility was amended and restated (see Subsequent Events). Proceeds from the October 2012 Secured Credit Facility were used to refinance the remaining outstand-ing balances of our then existing 2011 Secured Credit Facilities.
Borrowings under the October 2012 Secured Credit Facility are collateralized by a first lien on a fixed pool of assets, with required mini-mum collateral coverage of not less than 125% of outstanding borrow-ings. If collateral coverage is less than 137.5% of outstanding borrowings, 100% of the proceeds from principal repayments and sales of collateral will be applied to repay outstanding borrowings under the October 2012 Secured Credit Facility. For so long as collateral coverage is between 137.5% and 150% of outstanding borrowings, 50% of proceeds from principal repayments and sales of collateral will be applied to repay out-standing borrowings under the October 2012 Secured Credit Facility and for so long as collateral coverage is greater than 150% of outstanding borrowings, we may retain all proceeds from principal repayments and
sales of collateral. We retain proceeds from interest, rent, lease payments and fee income in all cases.
In connection with the October 2012 Secured Credit Facility transaction, we incurred $14.8 million in third party fees, of which $8.2 million was recognized in “Other expense” on our Consolidated Statements of Operations as it related to the portion of lenders from the original facility that modified their debt under the new facility. The remaining $6.6 million of fees were recorded in “Deferred expenses and other assets, net” in the Consolidated Balance Sheets as they related to the portion of lenders that were new to the facility.
The October 2012 Secured Credit Facility contains certain covenants relating to the collateral, among other matters, but does not contain corporate level financial covenants. For so long as we maintain our qualification as a REIT, we are permitted to distribute 100% of our REIT taxable income on an annual basis. In addition, we may distribute to our stockholders real estate assets, or interests therein, having an aggregate equity value not to exceed $200 million, that are not collat-eral securing the borrowings under the October 2012 Secured Credit Facility. Except for the distribution of real estate assets described in the preceding sentence, we may not pay common dividends if we cease to qualify as a REIT.
Through December 31, 2012, we have made cumulative amor-tization repayments of $65.5 million on the October 2012 Secured Credit Facility, which exceeds all required amortization payments through March 2016. Repayments of the October 2012 Secured Credit Facility prior to scheduled amortization dates have resulted in losses on early extinguishment of debt of $1.2 million for the year ended December 31, 2012 related to the acceleration of discounts and unamortized deferred financing fees on the portion of the facility that was repaid. See Subsequent Events below for details on the refinancing of the October 2012 Secured Credit Facility in February 2013.
March 2012 Secured Credit Facilities – In March 2012, we entered into an $880.0 million senior secured credit agreement providing for two tranches of term loans: a $410.0 million 2012 A-1 tranche due March 2016, which bears interest at a rate of LIBOR + 4.00% (the “2012 Tranche A-1 Facility”), and a $470.0 million 2012 A-2 tranche due March 2017, which bears interest at a rate of LIBOR + 5.75% (the “2012 Tranche A-2 Facility,” together the “March 2012 Secured Credit Facilities”). The 2012 A-1 and A-2 tranches were issued at 98.0% of par and 98.5% of par, respectively, and both tranches include a LIBOR floor of 1.25%. Proceeds from the March 2012 Secured Credit Facilities were used to repurchase and repay at maturity $606.7 million aggregate principal amount of our convertible notes due October 2012, to fully repay our $244.0 million balance on our unsecured credit facility due June 2012, and to repay, upon maturity, $90.3 million outstanding principal balance of our 5.50% senior unsecured notes.
The March 2012 Secured Credit Facilities are collateralized by a first lien on a fixed pool of assets. Proceeds from principal repay-ments and sales of collateral are applied to amortize the March 2012 Secured Credit Facilities. Proceeds received for interest, rent, lease payments and fee income are retained by us. The 2012 Tranche A-1 Facility requires amortization payments of $41.0 million to be made every six months beginning December 31, 2012. After the 2012 Tranche A-1 Facility is repaid, proceeds from principal repayments and sales of collateral will be used to amortize the 2012 Tranche A-2 Facility. We may make optional prepayments on each tranche of term loans, subject to prepayment fees.
Through December 31, 2012, we have made cumulative amortization repayments of $240.8 million on the 2012 Tranche A-1 Facility, which exceeds all required amortization payments through December 31, 2014. Repayments of the 2012 Tranche A-1 Facility prior to scheduled amortization dates have resulted in losses on early extin-guishment of debt of $8.1 million for the year ended December 31, 2012 related to the acceleration of discounts and unamortized deferred financing fees on the portion of the facility that was repaid.
2011 Secured Credit Facilities – In March 2011, we entered into a $2.95 billion senior secured credit agreement providing for two tranches of term loans: a $1.50 billion 2011 A-1 tranche due June 2013, which bore interest at a rate of LIBOR + 3.75% (the “2011 Tranche A-1 Facility”), and a $1.45 billion 2011 A-2 tranche due June 2014, which bore interest at a rate of LIBOR + 5.75% (the “2011 Tranche A-2 Facility,” together the “2011 Secured Credit Facilities”). The 2011 A-1 and A-2 tranches were
issued at 99.0% of par and 98.5% of par, respectively, and both tranches include a LIBOR floor of 1.25%. The 2011 Secured Credit Facilities were collateralized by a first lien on a fixed pool of assets.
The 2011 Secured Credit Facilities were refinanced by the October 2012 Secured Credit Facility. Prior to refinancing, we have made cumulative amortization repayments of $1.07 billion on the 2011 Secured Credit Facilities which resulted in losses on early extinguishment of debt of $4.5 million and $12.0 million for the years ended December 31, 2012 and 2011, respectively, related to the acceleration of discounts and unamortized deferred financing fees on the portion of the facility that was repaid.
At the time of the refinancing, we had $21.2 million of unam-ortized discounts and financing fees related to the 2011 Secured Credit Facilities. In connection with the refinancing, we recorded a loss on early extinguishment of debt of $12.1 million, related primarily to the portion of lenders in the original facility that did not participate in the new facil-ity. The remaining $9.0 million of unamortized fees and discounts will continue to be amortized to interest expense over the remaining term of the October 2012 Secured Credit Facility.
Secured Term Loans – In October 2012, we entered into a $28.0 million secured term loan maturing in November 2019, bearing interest at a rate of LIBOR + 2.00%. Simultaneously with the financing, we entered into an interest rate swap to exchange our variable rate on the loan for a fixed interest rate (see Note 10 of the Notes to the Consolidated Financial Statements).
In September 2012, we refinanced two secured term loans with an aggregate outstanding principal balance of $53.3 million, bearing interest at rates of 5.3% and 8.2% and maturing in January 2013 with a new $54.5 million secured term loan. The new loan bears interest at 4.851%, matures in October 2022 and is collateralized by the same net lease asset as the original term loan. In connection with the refinanc-ing, we recorded a loss on early extinguishment of debt of $0.5 mil-lion in our Consolidated Statements of Operations for the year ended December 31, 2012.
In addition, during the year ended December 31, 2012, in con-junction with the sale of a portfolio of 12 net lease assets, we repaid the $50.8 million outstanding balances of our LIBOR + 4.50% secured term loans due in 2014 and terminated the related interest rate swaps associated with the loans (see Note 10 of the Notes to the Consolidated Financial Statements).
Unsecured Credit Facility – During the year ended December 31, 2012, we repaid the $243.7 million remaining principal balance of our LIBOR + 0.85% unsecured credit facility due June 2012. In connection with the repayments, we recorded a loss on early extinguishment of debt of $0.2 million.
Unsecured Notes – In November 2012, we issued $300.0 mil-lion aggregate principal of 7.125% senior unsecured notes due February 2018 and issued $200.0 million aggregate principal of 3.00% convert-ible senior unsecured notes due November 2016. Proceeds from these transactions were used to repay the entire $67.1 million of our 6.5% senior unsecured notes due December 2013 and to repay $404.9 million of our 8.625% senior unsecured notes due June 2013. In connection
28
-
29

with these repurchases, we paid a $14.9 million prepayment penalty which was reflected in “Gain (loss) on early extinguishment of debt, net” for the year ended December 31, 2012.
In May 2012, we issued $275.0 million aggregate principal of 9.0% senior unsecured notes due June 2017 that were sold at 98.012% of their principal amount. We used the net proceeds to repay unsecured senior notes due in 2012.
During the year ended December 31, 2012, we repaid, upon maturity, the $460.7 million outstanding principal balance of our LIBOR + 0.50% senior unsecured convertible notes, the $169.7 million outstanding principal balance of our 5.15% senior unsecured notes and the $90.3 million outstanding principal balance of our 5.50% senior unsecured notes. In addition, we repurchased $420.4 million par value of senior unsecured notes with various maturities ranging from March 2012 to October 2012. In connection with these repurchases, we recorded aggregate gains on early extinguishment of debt of $3.2 mil-lion, for the year ended December 31, 2012.
Unencumbered/Encumbered Assets – As of December 31, 2012, the carrying value of our unencumbered and encumbered assets by asset type are as follows ($ in thousands):
As of December 31,
2012 2011
Encumbered Assets
Unencumbered Assets
Encumbered Assets
Unencumbered Assets
Real estate, net $1,794,198 $1,004,825 $1,533,579 $1,414,332Real estate available and held for sale 141,673 494,192 177,092 500,366Loans receivable, net (1) 1,197,373 665,712 1,780,591 1,153,671Other investments 43,545 355,298 37,957 419,878Cash and other assets – 487,073 – 573,871 Total $3,176,789 $3,007,100 $3,529,219 $4,062,118
Explanatory Note:
(1) As of December 31, 2012 and 2011, the amounts presented exclude general reserves for loan losses of $33.1 million and $73.5 million, respectively.
Debt Covenants
Our outstanding unsecured debt securities contain corporate level covenants that include a covenant to maintain a ratio of unencum-bered assets to unsecured indebtedness of at least 1.2x and a restric-tion on debt incurrence based upon the effect of the debt incurrence on our fixed charge coverage ratio. If any of our covenants are breached and not cured within applicable cure periods, the breach could result in acceleration of our debt securities unless a waiver or modification is agreed upon with the requisite percentage of the bondholders. While we expect that our ability to incur new indebtedness under the fixed charge coverage ratio will be limited for the foreseeable future, we will continue to be permitted to incur indebtedness for the purpose of refi-nancing existing indebtedness and for other permitted purposes under the indentures.
Our March 2012 Secured Credit Facilities and October 2012 Secured Credit Facility (as amended and restated by the New Credit Facility) are collectively defined as the “Secured Credit Facilities.” Our Secured Credit Facilities contain certain covenants, including covenants relating to collateral coverage, dividend payments, restrictions on fun-damental changes, transactions with affiliates, matters relating to the liens granted to the lenders and the delivery of information to the lend-ers. In particular, we are required to maintain collateral coverage of 1.25x outstanding borrowings. In addition, for so long as we maintain our qualification as a REIT, the Secured Credit Facilities permit us to distribute 100% of our REIT taxable income on an annual basis and the
October 2012 Secured Credit Facility permits us to distribute to our shareholders real estate assets, or interests therein, having an aggre-gate equity value not to exceed $200 million, so long as such assets are not collateral for the October 2012 Secured Credit Facility. We may not pay common dividends if we cease to qualify as a REIT (except that the October 2012 Secured Credit Facility permits us to distribute certain real estate assets as described in the preceding sentence).
Our Secured Credit Facilities contain cross default provisions that would allow the lenders to declare an event of default and acceler-ate our indebtedness to them if we fail to pay amounts due in respect of our other recourse indebtedness in excess of specified thresholds or if the lenders under such other indebtedness are otherwise permitted to accelerate such indebtedness for any reason. The indentures governing our unsecured public debt securities permit the bondholders to declare an event of default and accelerate our indebtedness to them if our other recourse indebtedness in excess of specified thresholds is not paid at final maturity or if such indebtedness is accelerated.
Derivatives – Our use of derivative financial instruments is pri-marily limited to the utilization of interest rate hedges or other instru-ments to manage interest rate risk exposure and foreign exchange hedges to manage our risk to changes in foreign currencies. The prin-cipal objectives of such hedges are to minimize the risks and/or costs associated with our operating and financial structure and to manage our exposure to foreign exchange rate movements (see Note 10 of the Notes to the Consolidated Financial Statements).
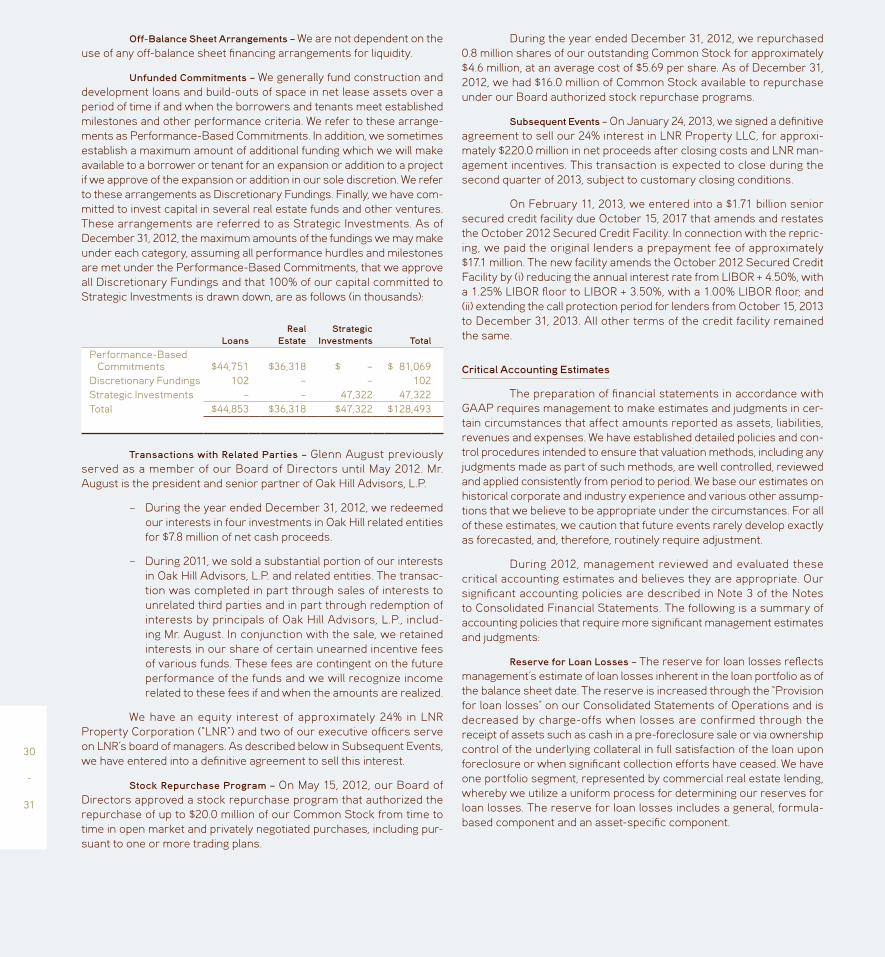
Off-Balance Sheet Arrangements – We are not dependent on the use of any off-balance sheet financing arrangements for liquidity.
Unfunded Commitments – We generally fund construction and development loans and build-outs of space in net lease assets over a period of time if and when the borrowers and tenants meet established milestones and other performance criteria. We refer to these arrange-ments as Performance-Based Commitments. In addition, we sometimes establish a maximum amount of additional funding which we will make available to a borrower or tenant for an expansion or addition to a project if we approve of the expansion or addition in our sole discretion. We refer to these arrangements as Discretionary Fundings. Finally, we have com-mitted to invest capital in several real estate funds and other ventures. These arrangements are referred to as Strategic Investments. As of December 31, 2012, the maximum amounts of the fundings we may make under each category, assuming all performance hurdles and milestones are met under the Performance-Based Commitments, that we approve all Discretionary Fundings and that 100% of our capital committed to Strategic Investments is drawn down, are as follows (in thousands):
LoansReal
EstateStrategic
Investments TotalPerformance-Based
Commitments $44,751 $36,318 $ – $ 81,069Discretionary Fundings 102 – – 102Strategic Investments – – 47,322 47,322Total $44,853 $36,318 $47,322 $128,493
Transactions with Related Parties – Glenn August previously served as a member of our Board of Directors until May 2012. Mr. August is the president and senior partner of Oak Hill Advisors, L.P.
– During the year ended December 31, 2012, we redeemed our interests in four investments in Oak Hill related entities for $7.8 million of net cash proceeds.
– During 2011, we sold a substantial portion of our interests in Oak Hill Advisors, L.P. and related entities. The transac-tion was completed in part through sales of interests to unrelated third parties and in part through redemption of interests by principals of Oak Hill Advisors, L.P., includ-ing Mr. August. In conjunction with the sale, we retained interests in our share of certain unearned incentive fees of various funds. These fees are contingent on the future performance of the funds and we will recognize income related to these fees if and when the amounts are realized.
We have an equity interest of approximately 24% in LNR Property Corporation (“LNR”) and two of our executive officers serve on LNR’s board of managers. As described below in Subsequent Events, we have entered into a definitive agreement to sell this interest.
Stock Repurchase Program – On May 15, 2012, our Board of Directors approved a stock repurchase program that authorized the repurchase of up to $20.0 million of our Common Stock from time to time in open market and privately negotiated purchases, including pur-suant to one or more trading plans.
During the year ended December 31, 2012, we repurchased 0.8 million shares of our outstanding Common Stock for approximately $4.6 million, at an average cost of $5.69 per share. As of December 31, 2012, we had $16.0 million of Common Stock available to repurchase under our Board authorized stock repurchase programs.
Subsequent Events – On January 24, 2013, we signed a definitive agreement to sell our 24% interest in LNR Property LLC, for approxi-mately $220.0 million in net proceeds after closing costs and LNR man-agement incentives. This transaction is expected to close during the second quarter of 2013, subject to customary closing conditions.
On February 11, 2013, we entered into a $1.71 billion senior secured credit facility due October 15, 2017 that amends and restates the October 2012 Secured Credit Facility. In connection with the repric-ing, we paid the original lenders a prepayment fee of approximately $17.1 million. The new facility amends the October 2012 Secured Credit Facility by (i) reducing the annual interest rate from LIBOR + 4.50%, with a 1.25% LIBOR floor to LIBOR + 3.50%, with a 1.00% LIBOR floor; and (ii) extending the call protection period for lenders from October 15, 2013 to December 31, 2013. All other terms of the credit facility remained the same.
Critical Accounting Estimates
The preparation of financial statements in accordance with GAAP requires management to make estimates and judgments in cer-tain circumstances that affect amounts reported as assets, liabilities, revenues and expenses. We have established detailed policies and con-trol procedures intended to ensure that valuation methods, including any judgments made as part of such methods, are well controlled, reviewed and applied consistently from period to period. We base our estimates on historical corporate and industry experience and various other assump-tions that we believe to be appropriate under the circumstances. For all of these estimates, we caution that future events rarely develop exactly as forecasted, and, therefore, routinely require adjustment.
During 2012, management reviewed and evaluated these critical accounting estimates and believes they are appropriate. Our significant accounting policies are described in Note 3 of the Notes to Consolidated Financial Statements. The following is a summary of accounting policies that require more significant management estimates and judgments:
Reserve for Loan Losses – The reserve for loan losses reflects management’s estimate of loan losses inherent in the loan portfolio as of the balance sheet date. The reserve is increased through the “Provision for loan losses” on our Consolidated Statements of Operations and is decreased by charge-offs when losses are confirmed through the receipt of assets such as cash in a pre-foreclosure sale or via ownership control of the underlying collateral in full satisfaction of the loan upon foreclosure or when significant collection efforts have ceased. We have one portfolio segment, represented by commercial real estate lending, whereby we utilize a uniform process for determining our reserves for loan losses. The reserve for loan losses includes a general, formula-based component and an asset-specific component.
30
-
31

The general reserve component covers performing loans and reserves for loan losses are recorded when (i) available information as of each balance sheet date indicates that it is probable a loss has occurred in the portfolio and (ii) the amount of the loss can be reasonably esti-mated. The formula-based general reserve is derived from estimated principal default probabilities and loss severities applied to groups of loans based upon risk ratings assigned to loans with similar risk char-acteristics during our quarterly loan portfolio assessment. During this assessment, we perform a comprehensive analysis of our loan portfolio and assign risk ratings to loans that incorporate management’s current judgments about their credit quality based on all known and relevant internal and external factors that may affect collectability. We consider, among other things, payment status, lien position, borrower financial resources and investment in collateral, collateral type, project econom-ics and geographical location as well as national and regional economic factors. This methodology results in loans being segmented by risk clas-sification into risk rating categories that are associated with estimated probabilities of default and principal loss. Ratings range from “1” to “5” with “1” representing the lowest risk of loss and “5” representing the highest risk of loss. We estimate loss rates based on historical realized losses experienced within our portfolio and take into account current economic conditions affecting the commercial real estate market when establishing appropriate time frames to evaluate loss experience.
The asset-specific reserve component relates to reserves for losses on impaired loans. We consider a loan to be impaired when, based upon current information and events, we believe that it is probable that we will be unable to collect all amounts due under the contractual terms of the loan agreement. This assessment is made on a loan-by-loan basis each quarter based on such factors as payment status, lien position, borrower financial resources and investment in collateral, collateral type, project economics and geographical location as well as national and regional economic factors. A reserve is established for an impaired loan when the present value of payments expected to be received, observ-able market prices, or the estimated fair value of the collateral (for loans that are dependent on the collateral for repayment) is lower than the carrying value of that loan.
Substantially all of our impaired loans are collateral dependent and impairment is measured using the estimated fair value of collat-eral, less costs to sell. We generally use the income approach through internally developed valuation models to estimate the fair value of the collateral for such loans. In more limited cases, we obtain external “as is” appraisals for loan collateral, generally when third party participa-tions exist. Valuations are performed or obtained at the time a loan is determined to be impaired and designated non-performing, and they are updated if circumstances indicate that a significant change in value has occurred. In limited cases, appraised values may be discounted when real estate markets rapidly deteriorate.
A loan is also considered impaired if its terms are modified in a troubled debt restructuring (“TDR”). A TDR occurs when we grant a con-cession and the debtor is experiencing financial difficulties. Impairments on TDR loans are generally measured based on the present value of expected future cash flows discounted at the effective interest rate of the original loan.
The provisions for loan losses for the years ended December 31, 2012, 2011 and 2010 were $81.7 million, $46.4 mil-lion and $331.5 million, respectively. The total reserve for loan losses at December 31, 2012 and 2011, included asset specific reserves of $491.4 million and $573.1 million, respectively, and general reserves of $33.1 million and $73.5 million, respectively.
Acquisition of real estate – We generally acquire real estate assets through cash purchases or through foreclosure or deed-in-lieu of foreclosure in full or partial satisfaction of non-performing loans. When we acquire assets through foreclosure or deed in lieu of foreclo-sure, based on our strategic plan to realize the maximum value from the collateral received, these properties are classified as “Real estate, net” or “Real estate available and held for sale” on our Consolidated Balance Sheets. When we intend to hold, operate or develop the property for a period of at least 12 months, assets are classified as “Real estate, net,” and when we intend to market these properties for sale in the near term, assets are classified as “Real estate available and held for sale.” Assets classified as real estate are initially recorded at their estimated fair value and assets classified as assets held for sale are recorded at their estimated fair value less costs to sell. The excess of the carrying value of the loan over these amounts is charged-off against the reserve for loan losses. In both cases, upon acquisition, tangible and intangible assets and liabilities acquired are recorded at their estimated fair values.
During the years ended December 31, 2012, 2011 and 2010, we received titles to properties in satisfaction of senior mortgage loans with cumulative gross carrying values of $352.8 million, $617.8 million and $1.41 billion, respectively, for which those properties had served as collateral, and recorded charge-offs totaling $85.3 million, $115.3 million and $631.9 million, respectively, related to these loans.
Long-lived assets impairment test – Real estate assets to be dis-posed of are reported at the lower of their carrying amount or estimated fair value less costs to sell and are included in “Real estate held for sale” on our Consolidated Balance Sheets. The difference between the estimated fair value less costs to sell and the carrying value will be recorded as an impairment charge and included in “Income (loss) from discontinued oper-ations” on the Consolidated Statements of Operations. Once the asset is classified as held for sale, depreciation expense is no longer recorded and historical operating results are reclassified to “Income (loss) from discontinued operations” on the Consolidated Statements of Operations.
We periodically review long-lived assets to be held and used for impairment in value whenever events or changes in circumstances indi-cate that the carrying amount of such assets may not be recoverable. A held for use long-lived asset’s value is impaired only if management’s estimate of the aggregate future cash flows (undiscounted and with-out interest charges) to be generated by the asset (taking into account the anticipated holding period of the asset) is less than the carrying value. Such estimate of cash flows considers factors such as expected future operating income, trends and prospects, as well as the effects of demand, competition and other economic factors. To the extent impairment has occurred, the loss will be measured as the excess of the carrying amount of the property over the fair value of the asset and reflected as an adjustment to the basis of the asset. Impairments of real estate assets are recorded in “Impairment of assets,” on our Consolidated Statements of Operations.
During the years ended December 31, 2012, 2011 and 2010, we recorded impairment charges on real estate assets of $35.4 million, $22.4 million and $25.2 million, respectively, due to changes in business strategy and market conditions, of which $22.6 million, $9.1 million and $9.6 million, respectively, were included in “Income (loss) from discon-tinued operations.”
Identified intangible assets – We record intangible assets acquired at their estimated fair values separate and apart from goodwill. We determine whether such intangible assets have finite or indefinite lives. As of December 31, 2012, all such acquired intangible assets have finite lives. We amortize finite lived intangible assets based on the period over which the assets are expected to contribute directly or indirectly to the future cash flows of the business acquired. We review finite lived intangible assets for impairment whenever events or changes in circum-stances indicate that their carrying amount may not be recoverable. If we determine the carrying value of an intangible asset is not recoverable we will record an impairment charge to the extent its carrying value exceeds its estimated fair value. Impairments of intangibles are recorded in “Impairment of assets” on our Consolidated Statements of Operations.
Valuation of deferred tax assets – Deferred income taxes reflect the net tax effects of temporary differences between the carrying amount of assets and liabilities for financial reporting purposes and the amounts used for income tax purposes, as well as operating loss and tax credit carryforwards. We evaluate the realizability of our deferred tax assets and recognize a valuation allowance if, based on the available evidence, both positive and negative, it is more likely than not that some portion or all of our deferred tax assets will not be realized. When evalu-ating the realizability of our deferred tax assets, we consider, among other matters, estimates of expected future taxable income, nature of current and cumulative losses, existing and projected book/tax differ-ences, tax planning strategies available, and the general and industry specific economic outlook. This realizability analysis is inherently sub-jective, as it requires us to forecast our business and general economic environment in future periods. Changes in estimate of deferred tax asset realizability, if any are included in “Income tax (expense) benefit” on the Consolidated Statements of Operations.
Based on our assessment of all factors, we determined that a valuation allowance of $40.8 million and $50.9 million was required on our deferred tax assets as of December 31, 2012 and 2011, respectively.
Consolidation – Variable interest entities – We evaluate our invest-ments and other contractual arrangements to determine if our inter-ests constitute variable interests in a variable interest entity (“VIE”) and if we are the primary beneficiary. There is a significant amount of judgment required to determine if an entity is considered a VIE and if we are the primary beneficiary. We first perform a qualitative analysis, which requires certain subjective decisions regarding our assessment, including, but not limited to, which interests create or absorb variability, contractual terms, the key decision making powers, either impact on the VIE’s economic performance and related party relationships. An iterative quantitative analysis is required if our qualitative analysis proves inconclusive as to whether the entity is a VIE or we are the primary beneficiary and consolidation is required.
Fair value of assets and liabilities – The degree of management judgment involved in determining the fair value of assets and liabilities is dependent upon the availability of quoted market prices or observ-able market parameters. For financial and nonfinancial assets and liabili-ties that trade actively and have quoted market prices or observable market parameters, there is minimal subjectivity involved in measuring fair value. When observable market prices and parameters are not fully available, management judgment is necessary to estimate fair value. In addition, changes in market conditions may reduce the availability of quoted prices or observable data. For example, reduced liquidity in the capital markets or changes in secondary market activities could result in observable market inputs becoming unavailable. Therefore, when market data is not available, we would use valuation techniques requiring more management judgment to estimate the appropriate fair value measurement.
See Note 14 of the Notes to Consolidated Financial Statements for a complete discussion on how we determine fair value of financial and non-financial assets and financial liabilities and the related measure-ment techniques and estimates involved.
New Accounting Pronouncements
For a discussion of the impact of new accounting pronounce-ments on our financial condition or results of operations, see Note 3 of the Notes to Consolidated Financial Statements.
quantitative and qualitative disclosures about market risk
Market Risks
Market risk is the exposure to loss resulting from changes in interest rates, foreign currency exchange rates, commodity prices and equity prices. In pursuing our business plan, the primary market risk to which we are exposed is interest rate risk. Our operating results will depend in part on the difference between the interest and related income earned on our assets and the interest expense incurred in con-nection with our interest-bearing liabilities. Changes in the general level of interest rates prevailing in the financial markets will affect the spread between our floating rate assets and liabilities subject to the net amount of floating rate assets/liabilities and the impact of interest rate floors and caps. Any significant compression of the spreads between interest- earning assets and interest-bearing liabilities could have a material adverse effect on us.
In the event of a significant rising interest rate environment or further economic downturn, defaults could increase and cause us to incur additional credit losses which would adversely affect our liquidity and operating results. Such delinquencies or defaults would likely have an adverse effect on the spreads between interest-earning assets and interest-bearing liabilities. In addition, an increase in interest rates could, among other things, reduce the value of our fixed-rate interest-bearing assets and our ability to realize gains from the sale of such assets.
32
-
33

Interest rates are highly sensitive to many factors, including governmental monetary and tax policies, domestic and international economic and political conditions, and other factors beyond our con-trol. We monitor the spreads between our interest-earning assets and interest-bearing liabilities and may implement hedging strategies to limit the effects of changes in interest rates on our operations, including engaging in interest rate swaps and other interest rate-related deriva-tive contracts. Such strategies are designed to reduce our exposure, on specific transactions or on a portfolio basis, to changes in cash flows as a result of interest rate movements in the market. We do not enter into derivative contracts for speculative purposes or as a hedge against changes in our credit risk or the credit risk of our borrowers.
While a REIT may utilize derivative instruments to hedge inter-est rate risk on its liabilities incurred to acquire or carry real estate assets without generating non-qualifying income, use of derivatives for other purposes will generate non-qualified income for REIT income test purposes. This includes hedging asset related risks such as credit, for-eign exchange and prepayment or interest rate exposure on our loan assets. As a result our ability to hedge these types of risks is limited. There can be no assurance that our profitability will not be adversely affected during any period as a result of changing interest rates.
The following table quantifies the potential changes in net income should interest rates increase by 50 or 100 basis points and decrease by 10 basis points, assuming no change in the shape of the yield curve (i.e., relative interest rates). The base interest rate scenario assumes the one-month LIBOR rate of 0.21% as of December 31, 2012. Actual results could differ significantly from those estimated in the table.
Estimated Percentage Change in Net Income
Change in Interest Rates Net Income (1)
-10 Basis Points (0.23)%Base Interest Rate –% + 50 Basis Points 1.16%+ 100 Basis Points 2.37%
Explanatory Note:
(1) We have an overall net variable-rate debt exposure. However, this is negated by interest rate floors that cause the debt to act as fixed rate until such time as mar-ket interest rates move above the floor minimums. As such, we are effectively in a net variable-rate asset exposure, which results in an increase in net income when rates increase and a decrease in net income when rates decrease. As of December 31, 2012, $286.3 million of our floating rate loans have a cumulative weighted average interest rate floor of 3.26% and $2.39 billion of our floating rate debt has a cumulative weighted average interest rate floor of 1.25%.
management’s report on internal control over financial reporting
Management is responsible for establishing and maintaining adequate internal control over financial reporting, as defined in Exchange Act Rule 13a-15(f). Under the supervision and with the participation of the disclosure committee and other members of management, includ-ing the Chief Executive Officer and Chief Financial Officer, management carried out its evaluation of the effectiveness of the Company’s inter-nal control over financial reporting based on the framework in Internal Control – Integrated Framework issued by the Committee of Sponsoring Organizations of the Treadway Commission.
Based on management’s assessment under the framework in Internal Control – Integrated Framework, management has concluded that its internal control over financial reporting was effective as of December 31, 2012.
The Company’s internal control over financial reporting as of December 31, 2012, has been audited by PricewaterhouseCoopers LLP, an independent registered public accounting firm, as stated in their report which appears on page 34.
report of independent registered public accounting firm
To the Board of Directors and Shareholders of iStar Financial Inc.:
In our opinion, the consolidated financial statements present fairly, in all material respects, the financial position of iStar Financial Inc. and its subsidiaries (collectively, the ‘‘Company’’) at December 31, 2012 and 2011, and the results of their operations and their cash flows for each of the three years in the period ended December 31, 2012 in conformity with accounting principles generally accepted in the United States of America. Also in our opinion, the Company maintained, in all material respects, effective internal control over financial report-ing as of December 31, 2012, based on criteria established in Internal Control—Integrated Framework issued by the Committee of Sponsoring Organizations of the Treadway Commission (COSO). The Company’s management is responsible for these financial statements, for maintain-ing effective internal control over financial reporting and for its assess-ment of the effectiveness of internal control over financial reporting, included in the accompanying Management’s Report on Internal Control over Financial Reporting. Our responsibility is to express opinions on these financial statements and on the Company’s internal control over financial reporting based on our integrated audits. We conducted our audits in accordance with the standards of the Public Company Accounting Oversight Board (United States). Those standards require that we plan and perform the audits to obtain reasonable assurance about whether the financial statements are free of material misstate-ment and whether effective internal control over financial reporting was maintained in all material respects. Our audits of the financial statements included examining, on a test basis, evidence supporting the amounts and disclosures in the financial statements, assessing the accounting principles used and significant estimates made by management, and evaluating the overall financial statement presentation. Our audit of internal control over financial reporting included obtaining an under-standing of internal control over financial reporting, assessing the risk that a material weakness exists, and testing and evaluating the design and operating effectiveness of internal control based on the assessed risk. Our audits also included performing such other procedures as we considered necessary in the circumstances. We believe that our audits provide a reasonable basis for our opinions.
A company’s internal control over financial reporting is a pro-cess designed to provide reasonable assurance regarding the reliability of financial reporting and the preparation of financial statements for external purposes in accordance with generally accepted accounting principles. A company’s internal control over financial reporting includes those policies and procedures that (i) pertain to the maintenance of records that, in reasonable detail, accurately and fairly reflect the transactions and dispositions of the assets of the company; (ii) provide reasonable assurance that transactions are recorded as necessary to permit preparation of financial statements in accordance with generally accepted accounting principles, and that receipts and expenditures of the company are being made only in accordance with authorizations of management and directors of the company; and (iii) provide reason-able assurance regarding prevention or timely detection of unauthorized acquisition, use, or disposition of the company’s assets that could have a material effect on the financial statements.
Because of its inherent limitations, internal control over finan-cial reporting may not prevent or detect misstatements. Also, projec-tions of any evaluation of effectiveness to future periods are subject to the risk that controls may become inadequate because of changes in conditions, or that the degree of compliance with the policies or proce-dures may deteriorate.
New York, New York March 1, 2013
34
-
35

consolidated balance sheets
As of December 31, 2012 2011(In thousands, except per share data)
Assets Real estate Real estate, at cost $ 3,226,648 $ 3,344,672 Less: accumulated depreciation (427,625) (396,761) Real estate, net $ 2,799,023 $ 2,947,911 Real estate available and held for sale 635,865 677,458
$ 3,434,888 $ 3,625,369Loans receivable, net 1,829,985 2,860,762Other investments 398,843 457,835Cash and cash equivalents 256,344 356,826Restricted cash 36,778 32,630Accrued interest and operating lease income receivable, net 15,226 20,208Deferred operating lease income receivable 84,735 73,368Deferred expenses and other assets, net 93,990 90,839 Total assets $ 6,150,789 $ 7,517,837Liabilities and EquityLiabilities:Accounts payable, accrued expenses and other liabilities $ 132,460 $ 105,357Debt obligations, net 4,691,494 5,837,540 Total liabilities $ 4,823,954 $ 5,942,897Commitments and contingencies – – Redeemable noncontrolling interests 13,681 1,336Equity:iStar Financial Inc. shareholders’ equity:Preferred Stock Series D, E, F, G and I, liquidation preference $25.00 per share (see Note 11) 22 22High Performance Units 9,800 9,800Common Stock, $0.001 par value, 200,000 shares authorized, 142,699 issued and 83,782 outstanding at
December 31, 2012 and 140,028 issued and 81,920 outstanding at December 31, 2011 143 140Additional paid-in capital 3,832,780 3,834,460Retained earnings (deficit) (2,360,647) (2,078,397)Accumulated other comprehensive income (loss) (see Note 11) (1,185) (328)Treasury stock, at cost, $0.001 par value, 58,917 shares at December 31, 2012 and
58,108 shares at December 31, 2011 (241,969) (237,341) Total iStar Financial Inc. shareholders’ equity $1,238,944 $ 1,528,356Noncontrolling interests 74,210 45,248 Total equity $1,313,154 $ 1,573,604 Total liabilities and equity $6,150,789 $ 7,517,837
The accompanying notes are an integral part of the consolidated financial statements.
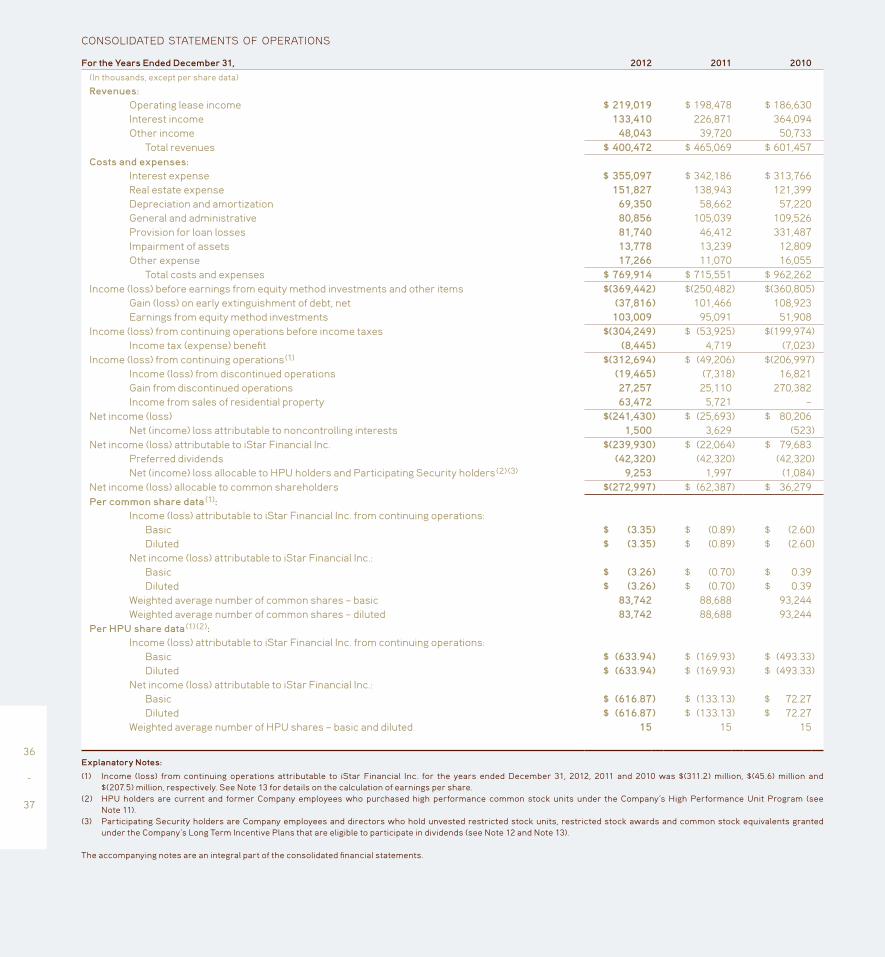
consolidated statements of operations
For the Years Ended December 31, 2012 2011 2010(In thousands, except per share data)
Revenues: Operating lease income $ 219,019 $ 198,478 $ 186,630 Interest income 133,410 226,871 364,094 Other income 48,043 39,720 50,733 Total revenues $ 400,472 $ 465,069 $ 601,457Costs and expenses: Interest expense $ 355,097 $ 342,186 $ 313,766 Real estate expense 151,827 138,943 121,399 Depreciation and amortization 69,350 58,662 57,220 General and administrative 80,856 105,039 109,526 Provision for loan losses 81,740 46,412 331,487 Impairment of assets 13,778 13,239 12,809 Other expense 17,266 11,070 16,055 Total costs and expenses $ 769,914 $ 715,551 $ 962,262Income (loss) before earnings from equity method investments and other items $(369,442) $(250,482) $(360,805) Gain (loss) on early extinguishment of debt, net (37,816) 101,466 108,923 Earnings from equity method investments 103,009 95,091 51,908Income (loss) from continuing operations before income taxes $(304,249) $ (53,925) $(199,974) Income tax (expense) benefit (8,445) 4,719 (7,023)Income (loss) from continuing operations (1) $(312,694) $ (49,206) $(206,997) Income (loss) from discontinued operations (19,465) (7,318) 16,821 Gain from discontinued operations 27,257 25,110 270,382 Income from sales of residential property 63,472 5,721 – Net income (loss) $(241,430) $ (25,693) $ 80,206 Net (income) loss attributable to noncontrolling interests 1,500 3,629 (523)Net income (loss) attributable to iStar Financial Inc. $(239,930) $ (22,064) $ 79,683 Preferred dividends (42,320) (42,320) (42,320) Net (income) loss allocable to HPU holders and Participating Security holders (2) (3) 9,253 1,997 (1,084)Net income (loss) allocable to common shareholders $(272,997) $ (62,387) $ 36,279Per common share data (1): Income (loss) attributable to iStar Financial Inc. from continuing operations: Basic $ (3.35) $ (0.89) $ (2.60) Diluted $ (3.35) $ (0.89) $ (2.60) Net income (loss) attributable to iStar Financial Inc.: Basic $ (3.26) $ (0.70) $ 0.39 Diluted $ (3.26) $ (0.70) $ 0.39 Weighted average number of common shares – basic 83,742 88,688 93,244 Weighted average number of common shares – diluted 83,742 88,688 93,244Per HPU share data (1) (2): Income (loss) attributable to iStar Financial Inc. from continuing operations: Basic $ (633.94) $ (169.93) $ (493.33) Diluted $ (633.94) $ (169.93) $ (493.33) Net income (loss) attributable to iStar Financial Inc.: Basic $ (616.87) $ (133.13) $ 72.27 Diluted $ (616.87) $ (133.13) $ 72.27 Weighted average number of HPU shares – basic and diluted 15 15 15
Explanatory Notes:
(1) Income (loss) from continuing operations attributable to iStar Financial Inc. for the years ended December 31, 2012, 2011 and 2010 was $(311.2) million, $(45.6) million and $(207.5) million, respectively. See Note 13 for details on the calculation of earnings per share.
(2) HPU holders are current and former Company employees who purchased high performance common stock units under the Company’s High Performance Unit Program (see Note 11).
(3) Participating Security holders are Company employees and directors who hold unvested restricted stock units, restricted stock awards and common stock equivalents granted under the Company’s Long Term Incentive Plans that are eligible to participate in dividends (see Note 12 and Note 13).
The accompanying notes are an integral part of the consolidated financial statements.
36
-
37
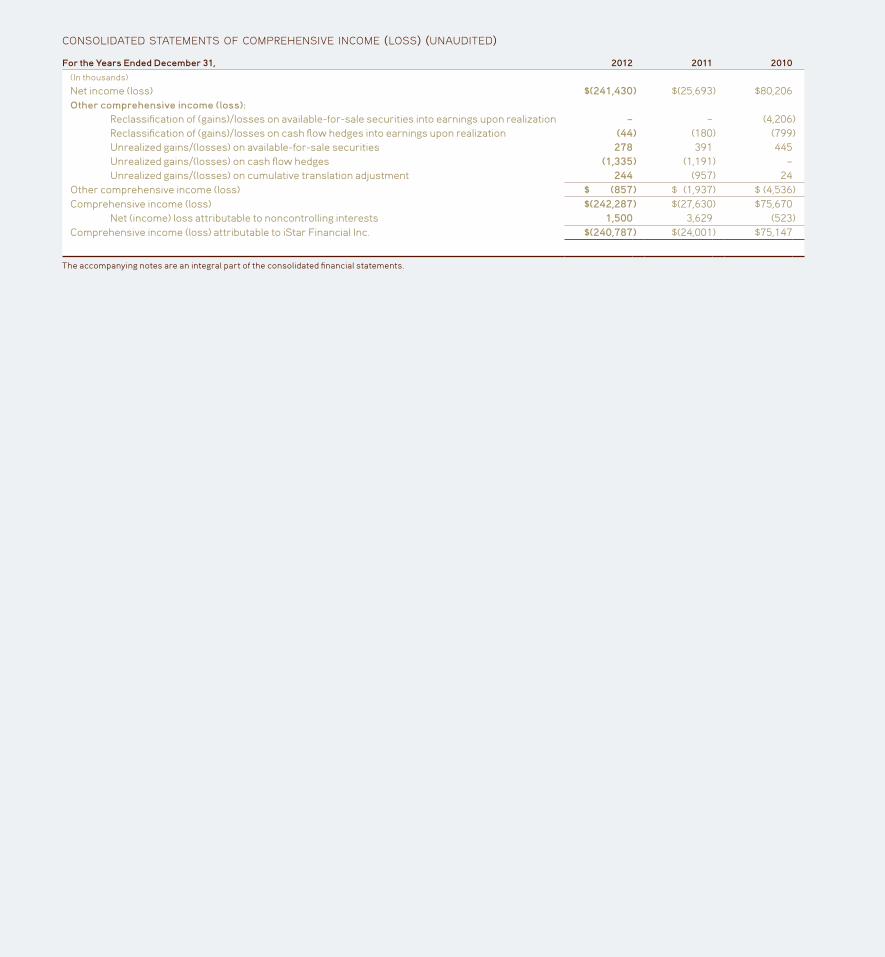
consolidated statements of comprehensive income (loss) (unaudited)For the Years Ended December 31, 2012 2011 2010
(In thousands)
Net income (loss) $(241,430) $(25,693) $80,206Other comprehensive income (loss): Reclassification of (gains)/losses on available-for-sale securities into earnings upon realization – – (4,206) Reclassification of (gains)/losses on cash flow hedges into earnings upon realization (44) (180) (799) Unrealized gains/(losses) on available-for-sale securities 278 391 445 Unrealized gains/(losses) on cash flow hedges (1,335) (1,191) – Unrealized gains/(losses) on cumulative translation adjustment 244 (957) 24Other comprehensive income (loss) $ (857) $ (1,937) $ (4,536)Comprehensive income (loss) $(242,287) $(27,630) $75,670 Net (income) loss attributable to noncontrolling interests 1,500 3,629 (523)Comprehensive income (loss) attributable to iStar Financial Inc. $(240,787) $(24,001) $75,147
The accompanying notes are an integral part of the consolidated financial statements.
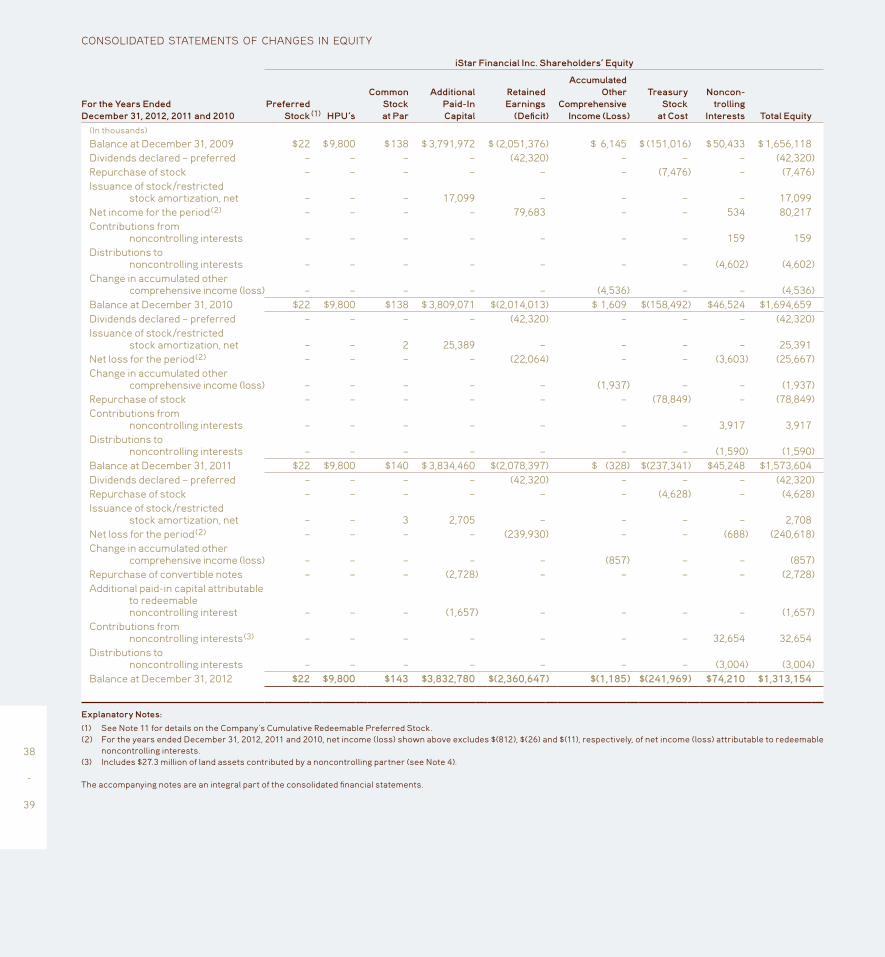
consolidated statements of changes in equity
iStar Financial Inc. Shareholders’ Equity
For the Years Ended December 31, 2012, 2011 and 2010
Preferred Stock (1) HPU’s
Common Stock at Par
Additional Paid-In Capital
Retained Earnings
(Deficit)
Accumulated Other
Comprehensive Income (Loss)
Treasury Stock
at Cost
Noncon - trolling
Interests Total Equity(In thousands)
Balance at December 31, 2009 $ 22 $ 9,800 $ 138 $ 3,791,972 $ (2,051,376) $ 6,145 $ (151,016) $ 50,433 $ 1,656,118Dividends declared – preferred – – – – (42,320) – – – (42,320)Repurchase of stock – – – – – – (7,476) – (7,476)Issuance of stock/restricted
stock amortization, net – – – 17,099 – – – – 17,099Net income for the period (2) – – – – 79,683 – – 534 80,217Contributions from
noncontrolling interests – – – – – – – 159 159Distributions to
noncontrolling interests – – – – – – – (4,602) (4,602)Change in accumulated other
comprehensive income (loss) – – – – – (4,536) – – (4,536)Balance at December 31, 2010 $22 $9,800 $138 $ 3,809,071 $(2,014,013) $ 1,609 $(158,492) $46,524 $1,694,659Dividends declared – preferred – – – – (42,320) – – – (42,320)Issuance of stock/restricted
stock amortization, net – – 2 25,389 – – – – 25,391Net loss for the period (2) – – – – (22,064) – – (3,603) (25,667)Change in accumulated other
comprehensive income (loss) – – – – – (1,937) – – (1,937)Repurchase of stock – – – – – – (78,849) – (78,849)Contributions from
noncontrolling interests – – – – – – – 3,917 3,917Distributions to
noncontrolling interests – – – – – – – (1,590) (1,590)Balance at December 31, 2011 $22 $9,800 $140 $ 3,834,460 $(2,078,397) $ (328) $(237,341) $45,248 $1,573,604Dividends declared – preferred – – – – (42,320) – – – (42,320)Repurchase of stock – – – – – – (4,628) – (4,628)Issuance of stock/restricted
stock amortization, net – – 3 2,705 – – – – 2,708Net loss for the period (2) – – – – (239,930) – – (688) (240,618)Change in accumulated other
comprehensive income (loss) – – – – – (857) – – (857)Repurchase of convertible notes – – – (2,728) – – – – (2,728)Additional paid-in capital attributable
to redeemable noncontrolling interest – – – (1,657) – – – – (1,657)
Contributions from noncontrolling interests (3) – – – – – – – 32,654 32,654
Distributions to noncontrolling interests – – – – – – – (3,004) (3,004)
Balance at December 31, 2012 $22 $9,800 $143 $3,832,780 $(2,360,647) $(1,185) $(241,969) $74,210 $1,313,154
Explanatory Notes:
(1) See Note 11 for details on the Company’s Cumulative Redeemable Preferred Stock.(2) For the years ended December 31, 2012, 2011 and 2010, net income (loss) shown above excludes $(812), $(26) and $(11), respectively, of net income (loss) attributable to redeemable
noncontrolling interests.(3) Includes $27.3 million of land assets contributed by a noncontrolling partner (see Note 4).
The accompanying notes are an integral part of the consolidated financial statements.
38
-
39

consolidated statements of cash flows
For the Years Ended December 31, 2012 2011 2010(In thousands)
Cash flows from operating activities:Net income (loss) $ (241,430) $ (25,693) $ 80,206Adjustments to reconcile net income (loss) to cash flows from operating activities: Provision for loan losses 81,740 46,412 331,487 Impairment of assets 38,077 22,386 22,403 Depreciation and amortization 70,786 63,928 70,770 Payments for withholding taxes upon vesting of stock-based compensation (12,589) (6,273) (639) Non-cash expense for stock-based compensation 15,293 29,702 19,355 Amortization of discounts/premiums and deferred financing costs on debt 31,981 32,345 (18,926) Amortization of discounts/premiums and deferred interest on loans (47,279) (62,194) (102,261) Earnings from equity method investments (103,009) (95,091) (51,908) Distributions from operations of equity method investments 105,586 85,766 32,651 Deferred operating lease income (11,812) (9,390) (9,976) Deferred income taxes – (13,729) 4,473 Income from sales of residential property (63,472) (5,721) – Gain from discontinued operations (27,257) (25,110) (270,382) (Gain) loss on early extinguishment of debt, net 22,405 (97,742) (110,075) Repayments and repurchases of debt – debt discount (1) (74,712) (5,748) (1,461) Other operating activities, net 9,427 6,492 9,749 Changes in assets and liabilities: Changes in accrued interest and operating lease income receivable, net 1,337 4,793 14,259 Changes in deferred expenses and other assets, net 1,271 20,580 (1,781) Changes in accounts payable, accrued expenses and other liabilities 11,725 5,710 (63,827) Cash flows from operating activities $ (191,932) $ (28,577) $ (45,883)Cash flows from investing activities: Investment originations and fundings $ (57,353) $ (120,333) $ (456,678) Capital expenditures on real estate assets (83,070) (64,169) (42,863) Contributions to unconsolidated entities (10,640) (41,820) (23,520) Repayments of and principal collections on loans 728,657 1,208,403 1,519,653 Net proceeds from sales of loans 56,998 95,859 700,098 Net proceeds from sales of real estate assets 562,705 215,930 1,823,181 Net proceeds from repayments and sales of securities – – 213,344 Distributions from unconsolidated entities 78,238 188,467 11,441 Changes in restricted cash held in connection with investing activities (5,127) (20,042) (2,068) Other investing activities, net (3,361) (1,038) (3,765) Cash flows from investing activities $ 1,267,047 $ 1,461,257 $ 3,738,823Cash flows from financing activities: Borrowings under secured credit facilities $ 2,652,265 $ 2,913,250 $ 36,294 Repayments under secured credit facilities (2,681,112) (1,489,970) (36,812) Repayments under unsecured credit facilities (244,046) (506,600) – Borrowings under secured term loans 82,500 124,575 – Repayments under secured term loans (111,260) (1,684,231) (2,132,899) Borrowings under unsecured notes 764,029 – – Repayments under unsecured notes (697,842) (374,775) (374,249) Repurchases and redemptions of secured and unsecured notes (873,873) (408,678) (857,346) Payments for deferred financing costs (21,662) (35,545) – Preferred dividends paid (42,320) (42,320) (42,320) Purchase of treasury stock (4,628) (78,849) (7,476) Changes in restricted cash held in connection with debt obligations – 199 12,064 Other financing activities, net 2,352 2,225 (9,963) Cash flows from financing activities $(1,175,597) $(1,580,719) $(3,412,707) Changes in cash and cash equivalents $ (100,482) $ (148,039) $ 280,233 Cash and cash equivalents at beginning of period 356,826 504,865 224,632 Cash and cash equivalents at end of period $ 256,344 $ 356,826 $ 504,865
Explanatory Note:
(1) Represents the portion of debt repayments and repurchases made during the period related to the original issue discount (“OID”). Although these amounts do not reflect contractual interest payments made during the period, the OID is considered an operating cash flow in accordance with GAAP.
The accompanying notes are an integral part of the consolidated financial statements.
notes to consolidated financial statements
Note 1 – Business and Organization
Business – iStar Financial Inc., or the “Company,” is a fully- integrated finance and investment company focused on the commer-cial real estate industry. The Company provides custom-tailored invest-ment capital to high-end private and corporate owners of real estate and invests directly across a range of real estate sectors. The Company, which is taxed as a real estate investment trust, or “REIT,” has invested more than $35 billion over the past two decades. The Company’s pri-mary business segments are real estate finance, net leasing, operating properties and land.
Organization – The Company began its business in 1993 through private investment funds and became publicly traded in 1998. Since that time, the Company has grown through the origination of new lending and leasing transactions, as well as through corporate acquisitions.
Note 2 – Basis of Presentation and Principles of Consolidation
Basis of Presentation – The accompanying audited Consolidated Financial Statements have been prepared in conformity with generally accepted accounting principles in the United States of America (“GAAP”) for complete financial statements. The preparation of financial state-ments in conformity with GAAP requires management to make esti-mates and assumptions that affect the reported amounts of assets, liabilities, disclosure of contingent assets and liabilities at the dates of the financial statements and the reported amounts of revenues and expenses during the reporting periods. Actual results could differ from those estimates.
The Company has revised the presentation of its Consolidated Financial Statements to provide financial information that management believes better reflects the changes in its underlying business, includ-ing the types of investments the Company now holds. The Company has not changed any of its historically applied accounting policies, nor has it revised the aggregate amount of previously reported total assets, liabilities, equity, net income or classifications of cash flows as part of the new presentation.
As of December 31, 2012, assets that were previously pre-sented in, “Net lease assets, net,” and “Real estate held for investment, net,” are now presented in “Real estate, net.” Assets that were presented in “Other real estate owned” and “Assets held for sale” are now pre-sented in “Real estate available and held for sale.”
On the Consolidated Statements of Operations, lease income related to what was previously classified as “Real estate held for invest-ment, net” and was previously presented in “Other income,” is now presented as “Operating lease income.” Additionally, tenant expense recoveries that were previously presented in “Operating costs-net lease assets” and “Other income” are now presented in “Operating lease income.” In addition, subject to certain changes mentioned above, costs previously presented as “Operating costs-net lease asset,” and “Operating costs-REHI and OREO,” are now presented in “Real estate expense.”
Prior year amounts have been reclassified in the Consolidated Financial Statements and the related notes to conform to the current period presentation.
Principles of Consolidation – The Consolidated Financial Statements include the financial statements of the Company, its wholly owned subsidiaries, controlled partnerships and variable interest enti-ties (“VIEs”) for which the Company is the primary beneficiary. All sig-nificant intercompany balances and transactions have been eliminated in consolidation.
Consolidated VIEs – As of December 31, 2012, the Company consolidated five VIEs for which the Company is considered the primary beneficiary. None of these entities had debt as of December 31, 2012 and 2011. The assets and liabilities of the Company’s consolidated VIEs are included in the Company’s Consolidated Balance Sheets. The Company’s total unfunded commitments related to consolidated VIEs is $67.0 million as of December 31, 2012.
Unconsolidated VIEs – As of December 31, 2012, 27 of the Company’s other investments were in VIEs where it is not the primary beneficiary and accordingly the VIEs have not been consolidated in the Company’s Consolidated Financial Statements. As of December 31, 2012, the Company’s maximum exposure to loss from these invest-ments does not exceed the sum of the $153.1 million carrying value of the investments and $8.5 million of related unfunded commitments.
Note 3 – Summary of Significant Accounting Policies
Real estate – Real estate assets are recorded at cost less accu-mulated depreciation and amortization, as follows:
Capitalization and depreciation – Certain improvements and replacements are capitalized when they extend the useful life of the asset. Qualified development and construction costs, including inter-est and certain other carrying costs incurred during the construction and/or renovation periods are also capitalized and charged to opera-tions through depreciation over the asset’s estimated useful life. The Company ceases capitalization on the portions substantially completed and capitalizes only those costs associated with the portions under development. Repairs and maintenance items are expensed as incurred. Depreciation is computed using the straight-line method of cost recov-ery over the shorter of estimated useful lives or 40 years for facilities, five years for furniture and equipment, the shorter of the remaining lease term or expected life for tenant improvements and the remaining useful life of the facility for facility improvements.
Purchase price allocation – The Company accounts for its acquisi-tion of properties by recording the purchase price of tangible and intan-gible assets and liabilities acquired based on their estimated fair values. The value of the tangible assets, consisting of land, buildings, building improvements and tenant improvements is determined as if these assets are vacant. Intangible assets may include the value of above-market or below-market, in-place leases and the value of customer rela-tionships, which are each recorded at their estimated fair values and included in “Real estate, net” on the Company’s Consolidated Balance Sheets. The capitalized above-market (or below-market) lease value is amortized as a reduction of (or, increase to) operating lease income over the remaining non-cancelable term of each lease plus any renewal
40
-
41

periods with fixed rental terms that are considered to be below-market. The Company also engages in sale/leaseback transactions and typically executes leases with the occupant simultaneously with the purchase of the net lease asset at market-rate rents. As such, no above-market or below-market lease value is ascribed to these transactions.
Impairments – The Company periodically reviews long-lived assets to be held and used for impairment in value whenever events or changes in circumstances indicate that the carrying amount of such assets may not be recoverable. The value of a long-lived asset held for use is impaired only if management’s estimate of the aggregate future cash flows (undiscounted and without interest charges) to be gener-ated by the asset (taking into account the anticipated holding period of the asset) is less than the carrying value. Such estimate of cash flows considers factors such as expected future operating income, trends and prospects, as well as the effects of demand, competition and other economic factors. To the extent impairment has occurred, the loss will be measured as the excess of the carrying amount of the property over the estimated fair value of the asset and reflected as an adjustment to the basis of the asset. Impairments of real estate assets that are not held for sale are recorded in “Impairment of assets” on the Company’s Consolidated Statements of Operations.
Real estate available and held for sale – The Company reports real estate assets to be disposed of at the lower of their carrying amount or estimated fair value less costs to sell and classifies them as “Real estate available and held for sale” on the Company’s Consolidated Balance Sheets. If a triggering event occurs and the estimated fair value less costs to sell is less than the carrying value, the difference will be recorded as an impairment charge and included in “Income (loss) from discontinued operations” on the Company’s Consolidated Statements of Operations. Once a real estate asset is classified as held for sale, depreciation expense is no longer recorded and historical operating results, including impairments, are reclassified to “Income (loss) from discontinued operations” on the Company’s Consolidated Statements of Operations.
If circumstances arise that were previously considered unlikely and, as a result the Company decides not to sell a property previously classified as held for sale, the property is reclassified as held and used and included in “Real estate, net” on the Company’s Consolidated Balance Sheets. The Company measures and records a property that is reclassified as held and used at the lower of (i) its carrying amount before the property was classified as held for sale, adjusted for any depreciation expense that would have been recognized had the property been continuously classified as held and used, or (ii) the estimated fair value at the date of the subsequent decision not to sell.
The Company reports residential property units to be disposed of at the lower of their carrying amount or estimated fair value less costs to sell and classifies them as “Real estate available and held for sale” on the Company’s Consolidated Balance Sheets. If the estimated fair value less costs to sell is less than the carrying value, the difference will be recorded as an impairment charge and included in “Impairment of assets” on the Company’s Consolidated Statements of Operations. The net carrying costs for residential property units are recorded in “Real estate expense” on the Company’s Consolidated Statements of Operations.
Dispositions – Sales and the associated gains or losses on real estate assets, including developed condominiums, are recognized in accordance with ASC 360-20, Real Estate Sales. Sales and the associ-ated gains for individual condominium units are recognized for full profit recognition upon closing of the sale transactions, when the profit is determinable, the earnings process is virtually complete, the parties are bound by the terms of the contract, all consideration has been exchanged, any permanent financing for which the seller is responsible has been arranged and all conditions for closing have been performed. The Company uses the relative sales value method to allocate costs. Gains on sales of net lease assets or commercial operating proper-ties are recorded in “Gains from discontinued operations” and profits on sales of residential property units are included in “Income from sales of residential property” on the Company’s Consolidated Statements of Operations.
Loans receivable, net – Loans receivable, net includes the fol-lowing investments: senior mortgages, subordinate mortgages, cor-porate/partnership loans and other lending investments-securities. Management considers nearly all of its loans to be held-for-investment, although certain investments may be classified as held-for-sale.
Loans classified as held-for-investment are reported at their outstanding unpaid principal balance, and include unamortized acqui-sition premiums or discounts and unamortized deferred loan costs or fees. These loans also include accrued and paid-in-kind interest and accrued exit fees that the Company determines are probable of being collected.
Loans receivable designated for sale are classified as held-for-sale and are carried at lower of amortized historical cost or estimated fair value. The amount by which carrying value exceeds fair value is recorded as a valuation allowance. Subsequent changes in the valuation allowance are included in the determination of net income (loss) in the period in which the change occurs.
The Company acquires properties through foreclosure or by deed-in-lieu of foreclosure in full or partial satisfaction of non-performing loans. Based on the Company’s strategic plan to realize the maximum value from the collateral received, property is classified as “Real estate, net” or “Real estate available and held for sale” at its estimated fair value when title to the property is obtained. Any excess of the carrying value of the loan over the estimated fair value of the property (less costs to sell for assets held for sale) is charged-off against the reserve for loan losses as of the date of foreclosure.
Equity and cost method investments – Equity interests are accounted for pursuant to the equity method of accounting if the Company can significantly influence the operating and financial policies of an investee. This is generally presumed to exist when ownership interest is between 20% and 50% of a corporation, or greater than 5% of a limited partnership or certain limited liability companies. The Company’s peri-odic share of earnings and losses in equity method investees is included in “Earnings from equity method investments” on the Consolidated Statements of Operations. When the Company’s ownership position is too small to provide such influence, the cost method is used to account for the equity interest. Equity and cost method investments are included in “Other investments” on the Company’s Consolidated Balance Sheets.

The Company periodically reviews equity method investments for impairment in value whenever events or changes in circumstances indicate that the carrying amount of such investments may not be recov-erable. The Company will record an impairment charge to the extent that the estimated fair value of an investment is less than its carrying value and the Company determines the impairment is other-than-temporary. Impairment charges are recorded in “Earnings from equity method investments” on the Company’s Consolidated Statements of Operations.
Cash and cash equivalents – Cash and cash equivalents include cash held in banks or invested in money market funds with original maturity terms of less than 90 days.
Restricted cash – Restricted cash represents amounts required to be maintained under certain of the Company’s debt obligations, loans, leasing, land development and derivative transactions.
Consolidation – Variable interest entities – The Company evalu-ated its investments and other contractual arrangements to determine if they constitute variable interests in a VIE. A VIE is an entity where a controlling financial interest is achieved through means other than vot-ing rights. A VIE is consolidated by the primary beneficiary, which is the party that has the power to direct matters that most significantly impact the activities of the VIE and has the obligation to absorb losses or the right to receive benefits of the VIE that could potentially be significant to the VIE. This overall consolidation assessment includes a review of, among other factors, which interests create or absorb variability, con-tractual terms, the key decision making powers, their impact on the VIE’s economic performance, and related party relationships. Where qualita-tive assessment is not conclusive, the Company performs a quantita-tive analysis. The Company reassesses its evaluation of the primary beneficiary of a VIE on an ongoing basis and assesses its evaluation of an entity as a VIE upon certain reconsideration events.
The Company has investments in certain funds that meet the deferral criteria in Accounting Standards Update (“ASU”) 2010–10 and will continue to assess consolidation of these entities under the overall guidance on the consolidation of VIEs in Accounting Standards Codification (“ASC”) 810-10. The consolidation evaluation is similar to the process noted above, except that the primary beneficiary is the party that will receive a majority of the VIE’s anticipated losses, a majority of the VIE’s expected residual returns, or both. In addition, for entities that meet the deferral criteria, the Company reassesses its initial evaluation of the primary beneficiary and whether an entity is a VIE upon the occur-rence of certain reconsideration events.
Deferred expenses – Deferred expenses include leasing costs and financing fees. Leasing costs include brokerage, legal and other costs which are amortized over the life of the respective leases. External fees and costs incurred to obtain long-term financing have been deferred and are amortized over the term of the respective borrowing using the effective interest method or the straight line method, as appropriate. Amortization of leasing costs is included in “Depreciation and amortiza-tion” and amortization of deferred financing fees is included in “Interest expense” on the Company’s Consolidated Statements of Operations.
Identified intangible assets – Upon the acquisition of a business, the Company records intangible assets acquired at their estimated fair values separate and apart from goodwill. The Company determines whether such intangible assets have finite or indefinite lives. As of December 31, 2012, all such intangible assets acquired by the Company have finite lives and are included in “Real estate, net” on the Company’s Consolidated Balance Sheets. The Company amortizes finite lived intan-gible assets based on the period over which the assets are expected to contribute directly or indirectly to the future cash flows of the busi-ness acquired. The Company reviews finite lived intangible assets for impairment whenever events or changes in circumstances indicate that their carry ing amount may not be recoverable. If the Company deter-mines the carry ing value of an intangible asset is not recoverable it will record an impairment charge to the extent its carrying value exceeds its estimated fair value. Impairments of intangible assets are recorded in “Impairment of assets” on the Company’s Consolidated Statements of Operations.
Revenue recognition – The Company’s revenue recognition poli-cies are as follows:
Operating lease income: The Company’s leases have all been determined to be operating leases based on an analysis performed in accordance with ASC 840. Operating lease income is recognized on the straight-line method of accounting, generally from the later of the date the lessee takes possession of the space and it is ready for its intended use or the date of acquisition of the facility subject to existing leases. Accordingly, contractual lease payment increases are recognized evenly over the term of the lease. The periodic difference between lease revenue recognized under this method and contractual lease payment terms is recorded as “Deferred operating lease income receivable,” on the Company’s Consolidated Balance Sheets.
The Company also recognizes revenue from certain tenant leases for reimbursements of all or a portion of operating expenses, including common area costs, insurance, utilities and real estate taxes of the respective property. This revenue is accrued in the same periods as the expense is incurred and is recorded as “Operating lease income” on the Company’s Consolidated Statements of Operations. Revenue is also recorded from certain tenant leases that is contingent upon tenant sales exceeding defined thresholds. These rents are recognized only after the defined threshold has been met for the period.
Management estimates losses inherent in the accrued oper-ating lease income receivable and deferred operating lease income receivable balances as of the balance sheet date and incorporates an asset-specific component, as well as a general, formula-based reserve based on management’s evaluation of the credit risks associated with these receivables. At December 31, 2012 and 2011, the total allowance for doubtful accounts was $5.6 million and $3.7 million, respectively.
Interest Income: Interest income on loans receivable is recog-nized on an accrual basis using the interest method.
On occasion, the Company may acquire loans at premiums or discounts. These discounts and premiums in addition to any deferred costs or fees, are typically amortized over the contractual term of the loan using the interest method. Exit fees are also recognized over the lives of the related loans as a yield adjustment, if management believes it
42
-
43

is probable that such amounts will be received. If loans with premiums, discounts, loan origination or exit fees are prepaid, the Company imme-diately recognizes the unamortized portion, which is included in “Other income” on the Company’s Consolidated Statements of Operations.
The Company considers a loan to be non-performing and places loans on non-accrual status at such time as: (1) the loan becomes 90 days delinquent; (2) the loan has a maturity default; or (3) manage-ment determines it is probable that it will be unable to collect all amounts due according to the contractual terms of the loan. While on non-accrual status, based on the Company’s judgment as to collectability of principal, loans are either accounted for on a cash basis, where interest income is recognized only upon actual receipt of cash, or on a cost-recovery basis, where all cash receipts reduce a loan’s carrying value. Non-accrual loans are returned to accrual status when a loan has become contrac-tually current and management believes all amounts contractually owed will be received.
Certain of the Company’s loans contractually provide for accrual of interest at specified rates that differ from current payment terms. Interest is recognized on such loans at the accrual rate subject to management’s determination that accrued interest and outstanding principal are ultimately collectible, based on the underlying collateral and operations of the borrower.
Prepayment penalties or yield maintenance payments from borrowers are recognized as additional income when received. Certain of the Company’s loan investments provide for additional interest based on the borrower’s operating cash flow or appreciation of the underlying collateral. Such amounts are considered contingent interest and are reflected as interest income only upon receipt of cash.
The Company holds certain loans initially acquired at a dis-count, for which it was probable, at acquisition, that all contractually required payments would not be received. The Company does not have a reasonable expectation about the timing and amount of cash flows expected to be collected on these loans and recognizes income when cash is received.
Reserve for loan losses – The reserve for loan losses reflects management’s estimate of loan losses inherent in the loan portfolio as of the balance sheet date. The reserve is increased through the “Provision for loan losses” on the Company’s Consolidated Statements of Operations and is decreased by charge-offs when losses are confirmed through the receipt of assets such as cash in a pre-foreclosure sale or via ownership control of the underlying collateral in full satisfaction of the loan upon foreclosure or when significant collection efforts have ceased. The Company has one portfolio segment, represented by commercial real estate lending, whereby it utilizes a uniform process for determin-ing its reserve for loan losses. The reserve for loan losses includes a general, formula-based component and an asset-specific component.
The general reserve component covers performing loans and reserves for loan losses are recorded when (i) available information as of each balance sheet date indicates that it is probable a loss has occurred in the portfolio and (ii) the amount of the loss can be reason-ably estimated. The formula-based general reserve is derived from esti-mated principal default probabilities and loss severities applied to groups of loans based upon risk ratings assigned to loans with similar risk
characteristics during the Company’s quarterly loan portfolio assess-ment. During this assessment, the Company performs a comprehen-sive analysis of its loan portfolio and assigns risk ratings to loans that incorporate management’s current judgments about their credit quality based on all known and relevant internal and external factors that may affect collectability. The Company considers, among other things, pay-ment status, lien position, borrower financial resources and investment in collateral, collateral type, project economics and geographical location as well as national and regional economic factors. This methodology results in loans being segmented by risk classification into risk rating categories that are associated with estimated probabilities of default and principal loss. Ratings range from “1” to “5” with “1” representing the lowest risk of loss and “5” representing the highest risk of loss. The Company estimates loss rates based on historical realized losses expe-rienced within its portfolio and takes into account current economic conditions affecting the commercial real estate market when establish-ing appropriate time frames to evaluate loss experience.
The asset-specific reserve component relates to reserves for losses on impaired loans. The Company considers a loan to be impaired when, based upon current information and events, it believes that it is probable that the Company will be unable to collect all amounts due under the contractual terms of the loan agreement. This assessment is made on a loan-by-loan basis each quarter based on such factors as payment status, lien position, borrower financial resources and invest-ment in collateral, collateral type, project economics and geographical location as well as national and regional economic factors. A reserve is established for an impaired loan when the present value of payments expected to be received, observable market prices, or the estimated fair value of the collateral (for loans that are dependent on the collateral for repayment) is lower than the carrying value of that loan.
Substantially all of the Company’s impaired loans are collateral dependent and impairment is measured using the estimated fair value of collateral, less costs to sell. The Company generally uses the income approach through internally developed valuation models to estimate the fair value of the collateral for such loans. In more limited cases, the Company obtains external “as is” appraisals for loan collateral, gener-ally when third party participations exist. Valuations are performed or obtained at the time a loan is determined to be impaired and designated non-performing, and they are updated if circumstances indicate that a significant change in value has occurred. In limited cases, appraised values may be discounted when real estate markets rapidly deteriorate.
A loan is also considered impaired if its terms are modified in a troubled debt restructuring (“TDR”). A TDR occurs when the Company has granted a concession and the debtor is experiencing financial diffi-culties. Impairments on TDR loans are generally measured based on the present value of expected future cash flows discounted at the effective interest rate of the original loan.
Gain or loss on debt extinguishments – The Company recognizes the difference between the reacquisition price of debt and the net car-rying amount of extinguished debt currently in earnings. Such amounts may include prepayment penalties or the write-off of unamortized debt issuance costs, and are recorded in “Gain (loss) on early extinguishment of debt, net” on the Company’s Consolidated Statements of Operations.

Derivative instruments and hedging activity – The Company recognizes derivatives as either assets or liabilities on the Company’s Consolidated Balance Sheets at fair value. If certain conditions are met, a derivative may be specifically designated as a hedge of the exposure to changes in the fair value of a recognized asset or liability, a hedge of a forecasted transaction or the variability of cash flows to be received or paid related to a recognized asset or liability.
Derivatives, such as foreign currency hedges and interest rate caps, that are not designated hedges are considered economic hedges, with changes in fair value reported in current earnings in “Other expense” on the Company’s Consolidated Statements of Operations. The Company does not enter into derivatives for trading purposes.
Stock-based compensation – Compensation cost for stock-based awards is measured on the grant date and adjusted over the period of the employees’ services to reflect (i) actual forfeitures and (ii) the out-come of awards with performance or service conditions through the requisite service period. The Company recognizes compensation cost for performance-based awards if and when the Company concludes that it is probable that the performance condition will be achieved. Compensation cost for market condition-based awards is determined using a Monte Carlo model to simulate a range of possible future stock prices for the Company’s Common Stock, which is reflected in the grant date fair value. All compensation cost for market-condition based awards in which the service conditions are met is recognized regard-less of whether the market condition is satisfied. Compensation costs are recognized ratably over the applicable vesting/service period and recorded in “General and administrative” on the Company’s Consolidated Statements of Operations.
Income taxes – The Company has elected to be qualified and taxed as a REIT under section 856 through 860 of the Internal Revenue Code of 1986, as amended (the “Code”). The Company is subject to fed-eral income taxation at corporate rates on its REIT taxable income, how-ever, the Company is allowed a deduction for the amount of dividends paid to its shareholders, thereby subjecting the distributed net income of the Company to taxation at the shareholder level only. In addition, the Company is allowed several other deductions in computing its REIT taxable income, including non-cash items such as depreciation expense and certain specific reserve amounts that the Company deems to be uncollectable. These deductions allow the Company to shelter a portion of its operating cash flow from its dividend payout requirement under federal tax laws. In addition, the Company has made foreclosure elec-tions for certain properties acquired through foreclosure which allows the Company to operate these properties within the REIT but subjects them to certain tax obligations. The carrying value of assets with fore-closure elections as of December 31, 2012 is $1.23 billion. The Company intends to operate in a manner consistent with and to elect to be treated as a REIT for tax purposes. As of December 31, 2011, the Company had $423.9 million of net operating loss carryforwards at the corporate REIT level, which can generally be used to offset both ordinary and capital taxable income in future years and will expire through 2031 if unused. The amount of net operating loss carryforwards as of December 31,
2012 will be subject to finalization of the 2012 tax returns. The Company recognizes interest expense and penalties related to uncertain tax positions, if any, as “Income tax (expense) benefit” on the Company’s Consolidated Statements of Operations.
The Company can participate in certain activities from which it was previously precluded in order to maintain its qualification as a REIT, as long as these activities are conducted in entities which elect to be treated as taxable subsidiaries under the Code, subject to certain limitations. As such, the Company, through its taxable REIT subsidiaries (“TRSs”), is engaged in various real estate related opportunities, primar-ily related to managing activities related to certain foreclosed assets, as well as managing various investments in equity affiliates, including LNR. As of December 31, 2012, $796.8 million of the Company’s assets were owned by TRS entities. The Company’s TRS entities are not consolidated for federal income tax purposes and are taxed as corporations. For financial reporting purposes, current and deferred taxes are provided for on the portion of earnings recognized by the Company with respect to its interest in TRS entities. The following represents the Company’s TRS income tax expense ($ in thousands):
For the Years Ended December 31, 2012 2011 2010Current tax expense $8,445 $ 9,010 $2,550Deferred tax expense (benefit) (1) – (13,729) 4,473Total income tax expense (benefit) $8,445 $ (4,719) $7,023
Explanatory Note:
(1) During the year ended December 31, 2011, the Company sold its investment in Oak Hill Advisors L.P. (see Note 6) and recognized a deferred tax benefit resulting from the reversal of a deferred tax liability associated with the investment. See the table below for the Company’s deferred tax assets and liabilities as of December 31, 2012 and 2011.
During the year ended December 31, 2012, the Company’s TRS entities generated taxable income of $42.2 million which was partially offset by the utilization of net operating loss carryforwards, resulting in current tax expense of $8.4 million. During the year ended December 31, 2011, the Company’s TRS entities generated taxable income of $75.8 mil-lion which was partially offset by the utilization of net operating loss carryforwards, resulting in current tax expense of $9.0 million. The Company’s TRS taxable income for the year ended December 31, 2011 included the gain on the Company’s sale of its investment in Oak Hill Advisors L.P. (see Note 6).
Total cash paid for taxes for the years ended December 31, 2012, 2011 and 2010, was $5.5 million, $8.5 million and $7.3 million, respectively.
Deferred income taxes reflect the net tax effects of tempo-rary differences between the carrying amount of assets and liabilities for financial reporting purposes and the amounts used for income tax purposes, as well as operating loss and tax credit carryforwards. The Company evaluates the realizability of its deferred tax assets and rec-ognizes a valuation allowance if, based on the available evidence, both positive and negative, it is more likely than not that some portion or
44
-
45
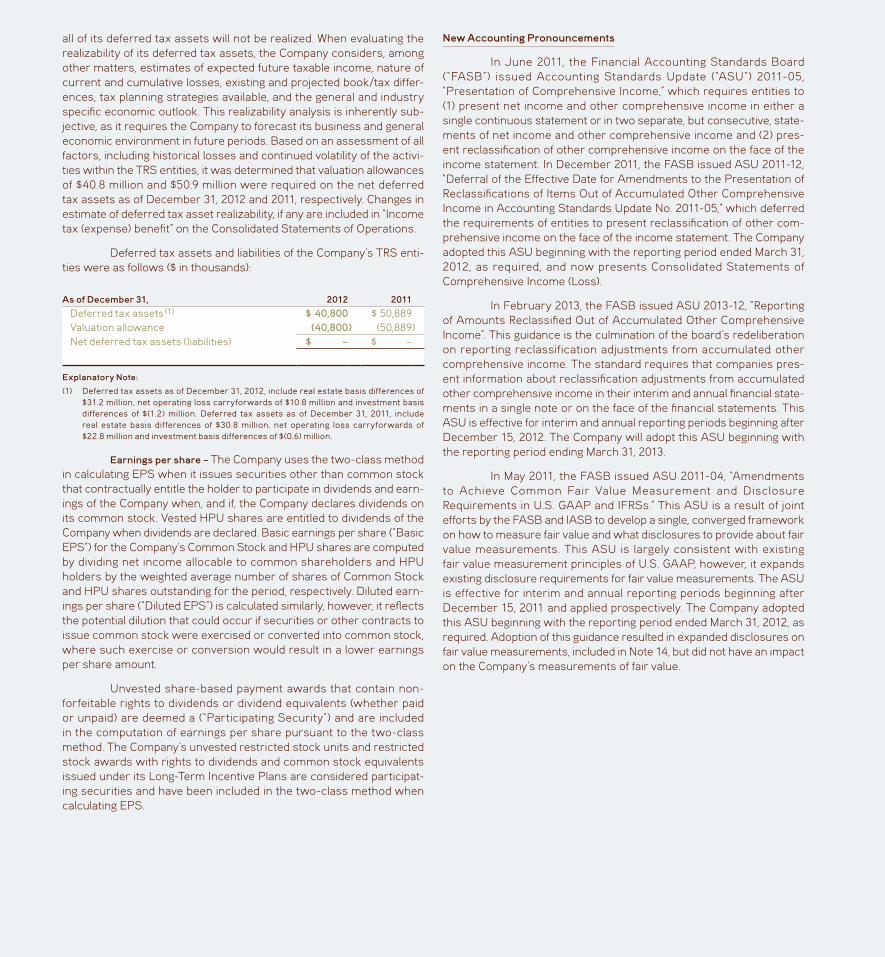
all of its deferred tax assets will not be realized. When evaluating the realizability of its deferred tax assets, the Company considers, among other matters, estimates of expected future taxable income, nature of current and cumulative losses, existing and projected book/tax differ-ences, tax planning strategies available, and the general and industry specific economic outlook. This realizability analysis is inherently sub-jective, as it requires the Company to forecast its business and general economic environment in future periods. Based on an assessment of all factors, including historical losses and continued volatility of the activi-ties within the TRS entities, it was determined that valuation allowances of $40.8 million and $50.9 million were required on the net deferred tax assets as of December 31, 2012 and 2011, respectively. Changes in estimate of deferred tax asset realizability, if any are included in “Income tax (expense) benefit” on the Consolidated Statements of Operations.
Deferred tax assets and liabilities of the Company’s TRS enti-ties were as follows ($ in thousands):
As of December 31, 2012 2011Deferred tax assets (1) $ 40,800 $ 50,889Valuation allowance (40,800) (50,889)Net deferred tax assets (liabilities) $ – $ –
Explanatory Note:
(1) Deferred tax assets as of December 31, 2012, include real estate basis differences of $31.2 million, net operating loss carryforwards of $10.8 million and investment basis differences of $(1.2) million. Deferred tax assets as of December 31, 2011, include real estate basis differences of $30.8 million, net operating loss carryforwards of $22.8 million and investment basis differences of $(0.6) million.
Earnings per share – The Company uses the two-class method in calculating EPS when it issues securities other than common stock that contractually entitle the holder to participate in dividends and earn-ings of the Company when, and if, the Company declares dividends on its common stock. Vested HPU shares are entitled to dividends of the Company when dividends are declared. Basic earnings per share (“Basic EPS”) for the Company’s Common Stock and HPU shares are computed by dividing net income allocable to common shareholders and HPU holders by the weighted average number of shares of Common Stock and HPU shares outstanding for the period, respectively. Diluted earn-ings per share (“Diluted EPS”) is calculated similarly, however, it reflects the potential dilution that could occur if securities or other contracts to issue common stock were exercised or converted into common stock, where such exercise or conversion would result in a lower earnings per share amount.
Unvested share-based payment awards that contain non-forfeitable rights to dividends or dividend equivalents (whether paid or unpaid) are deemed a (“Participating Security”) and are included in the computation of earnings per share pursuant to the two-class method. The Company’s unvested restricted stock units and restricted stock awards with rights to dividends and common stock equivalents issued under its Long-Term Incentive Plans are considered participat-ing securities and have been included in the two-class method when calculating EPS.
New Accounting Pronouncements
In June 2011, the Financial Accounting Standards Board (“FASB”) issued Accounting Standards Update (“ASU”) 2011-05, “Presentation of Comprehensive Income,” which requires entities to (1) present net income and other comprehensive income in either a single continuous statement or in two separate, but consecutive, state-ments of net income and other comprehensive income and (2) pres-ent reclassification of other comprehensive income on the face of the income statement. In December 2011, the FASB issued ASU 2011-12, “Deferral of the Effective Date for Amendments to the Presentation of Reclassifications of Items Out of Accumulated Other Comprehensive Income in Accounting Standards Update No. 2011-05,” which deferred the requirements of entities to present reclassification of other com-prehensive income on the face of the income statement. The Company adopted this ASU beginning with the reporting period ended March 31, 2012, as required, and now presents Consolidated Statements of Comprehensive Income (Loss).
In February 2013, the FASB issued ASU 2013-12, “Reporting of Amounts Reclassified Out of Accumulated Other Comprehensive Income”. This guidance is the culmination of the board’s redeliberation on reporting reclassification adjustments from accumulated other comprehensive income. The standard requires that companies pres-ent information about reclassification adjustments from accumulated other comprehensive income in their interim and annual financial state-ments in a single note or on the face of the financial statements. This ASU is effective for interim and annual reporting periods beginning after December 15, 2012. The Company will adopt this ASU beginning with the reporting period ending March 31, 2013.
In May 2011, the FASB issued ASU 2011-04, “Amendments to Achieve Common Fair Value Measurement and Disclosure Requirements in U.S. GAAP and IFRSs.” This ASU is a result of joint efforts by the FASB and IASB to develop a single, converged framework on how to measure fair value and what disclosures to provide about fair value measurements. This ASU is largely consistent with existing fair value measurement principles of U.S. GAAP, however, it expands existing disclosure requirements for fair value measurements. The ASU is effective for interim and annual reporting periods beginning after December 15, 2011 and applied prospectively. The Company adopted this ASU beginning with the reporting period ended March 31, 2012, as required. Adoption of this guidance resulted in expanded disclosures on fair value measurements, included in Note 14, but did not have an impact on the Company’s measurements of fair value.

Note 4 – Real Estate
The Company’s real estate assets were comprised of the following ($ in thousands):
Net Lease Assets
Operating Properties Land Total
As of December 31, 2012Land and land improvements $ 344,239 $ 132,028 $786,114 $1,262,381Buildings and improvements 1,295,081 669,186 – 1,964,267Less: accumulated depreciation and amortization (315,699) (109,634) (2,292) (427,625)Real estate, net $1,323,621 $ 691,580 $783,822 $2,799,023Real estate available and held for sale – 454,587 181,278 635,865Total real estate $1,323,621 $1,146,167 $965,100 $3,434,888As of December 31, 2011Land and land improvements $ 378,458 $ 84,010 $ 851,272 $ 1,313,740Buildings and improvements 1,394,691 636,241 – 2,030,932Less: accumulated depreciation and amortization (302,851) (90,383) (3,527) (396,761)Real estate, net $ 1,470,298 $ 629,868 $ 847,745 $ 2,947,911Real estate available and held for sale – 551,998 125,460 677,458Total real estate $ 1,470,298 $ 1,181,866 $ 973,205 $ 3,625,369
Real estate available and held for sale – As of December 31, 2012 and 2011, the Company had $374.1 million and $419.0 million, respectively, of residential properties available for sale in its operating properties portfolio. The Company is actively marketing and selling con-dominium units in these projects. During the years ended December 31, 2012 and 2011, the Company sold condominium units for total net pro-ceeds of $319.3 million and $154.0 million, respectively, and recorded income from sales of residential properties totaling $63.5 million and $5.7 million, respectively.
Real estate assets held for sale included $181.3 million of land assets and $80.5 million of commercial operating properties as of December 31, 2012 and $125.5 million of land assets and $133.0 mil-lion of commercial operating properties as of December 31, 2011. During the year ended December 31, 2012, the Company had a change in its business plans to sell two commercial operating properties previously considered held for sale. As of December 31, 2012, the carrying amount of these assets was $49.8 million and was recorded in Real Estate, net. The assets were reclassified at their carrying value prior to classification as held for sale and adjusted for depreciation expense during the held for sale period, which was lower than the assets fair value at the time of the change in plans to sell. In connection with the reclassification of these assets to held and used, the Company reclassified their results of operations for each of the periods presented, as follows:
For the Years Ended December 31, 2012 2011 2010Other income $ 21,148 $ 21,663 $ 22,751Real estate expenses $(22,603) $(24,297) $(25,612)
Acquisitions – During the year ended December 31, 2012, the Company acquired title to properties previously serving as collateral on its loan receivables with a total fair value of $269.1 million at the time of foreclosure (see Note 5). These properties included $172.4 mil-lion of residential operating properties, $63.4 million of commercial oper-ating properties and $33.3 million of land assets.
During the year ended December 31, 2012, the Company also acquired land and other assets with a fair value of $27.3 million from a third party to form a new venture related to one of the Company’s commercial operating properties. The third party contributed land into the venture in a non-cash exchange for a non-controlling interest and the Company continues to consolidate the subsidiary. In conjunc-tion with the formation of this new venture, the venture contributed land with a recorded value of $11.6 million in a non-cash exchange for a 40% noncontrolling equity interest in a separate new venture. The Company did not recognize any gains or losses associated with these transactions.
In addition, during 2012, the Company acquired land and other assets with a fair value of $11.5 million from a third party to form a new strategic venture related to one of the Company’s active land devel-opment projects. The third party contributed land into the venture in a non-cash exchange for a non-controlling interest and the Company continues to consolidate the subsidiary. The Company did not recognize any gains or losses associated with the transaction. Based upon certain rights held by the minority partner in this land venture that provide it with an option to redeem its interest at fair value after seven years, the Company has reflected the partner’s non-controlling interest in this venture as a redeemable non-controlling interest within its Consolidated Balance Sheet at December 31, 2012. As it is probable that the interest will become redeemable, subsequent changes in fair value are being accreted over the seven year period from the date of issuance to the earliest redemption date using the interest method. As of December 31, 2012, the estimated redemption value of the redeemable non-controlling interest is $17.9 million.
46
-
47

During the year ended December 31, 2011, the Company acquired title to properties previously serving as collateral on its loan receivables with a total fair value of $502.5 million at the time of foreclo-sure (see Note 5). These properties included $61.8 million of residential operating properties, $258.8 million of commercial operating properties and $181.9 million of land assets.
Dispositions – During the year ended December 31, 2012, the Company sold a portfolio of 12 net lease assets with an aggregate car-rying value of $105.7 million and recorded a gain of $24.9 million resulting from the transaction. Certain of the properties were subject to secured term loans with a remaining principal balance of $50.8 million that were repaid in full at closing (see Note 8). In addition to this portfolio sale, during 2012, the Company sold net lease assets with a carrying value of $9.8 million, resulting in a net gain of $2.4 million. During the year ended December 31, 2012, the Company sold commercial operating proper-ties with an aggregate carrying value of $29.3 million and land assets with a carrying value of $72.1 million for proceeds that approximated carrying value.
During the year ended December 31, 2011, the Company sold net lease assets with carrying values of $34.1 million, resulting in a net gain of $3.2 million. During 2011, the Company also sold commercial operating properties with an aggregate carrying value of $17.9 million and land assets with a carrying value of $9.5 million for proceeds that approximated carrying value.
During the year ended December 31, 2010, the Company com-pleted the sale of a portfolio of 32 net lease assets to a single purchaser for a gross purchase price of $1.35 billion that resulted in a net gain of $250.3 million. The aggregate carrying value of the portfolio of assets was $1.05 billion. At the time of sale, the Company had reduced its gain on sale and recorded a liability based upon certain contingent obliga-tions that have now been fully resolved. Upon resolution of this liabil-ity in 2011, the Company realized $22.2 million of the gain previously deferred and recorded the gain in “Gain from discontinued operations” on the Company’s Consolidated Statements of Operations for the year ended December 31, 2011. As part of the purchaser’s financing for the transaction, the Company provided the purchaser with $105.6 million of mezzanine loans, which have been fully repaid as of December 31, 2012.
In addition to the sale of the portfolio of assets noted above, during the year ended December 31, 2010, the Company sold net lease assets with carrying values of $119.7 million, which resulted in gains of $20.1 million. During 2010, the Company also sold commercial operat-ing properties with a carrying value of $180.6 million and land assets with a carrying value of $3.1 million for proceeds that approximated carrying value.
Discontinued Operations – The following table summarizes income from discontinued operations for the years ended December 31, 2012, 2011 and 2010, respectively ($ in thousands):
For the Years Ended December 31, 2012 2011 2010Revenues $ 5,561 $ 16,512 $ 88,536Total expenses (2,450) (14,683) (62,143)Impairment of assets (22,576) (9,147) (9,572)Income (loss) from discontinued
operations $(19,465) $ (7,318) $ 16,821
Impairments – During the years ended December 31, 2012, 2011 and 2010 the Company recorded impairments on real estate assets totaling $35.4 million, $22.4 million and $25.2 million. Of these amounts, $22.6 million, $9.1 million and $9.6 million for the years ended December 31, 2012, 2011 and 2010, respectively, have been reclassified to discontinued operations due to the assets being sold or classified as held for sale as of December 31, 2012 (see above).
Intangible assets – As of December 31, 2012, 2011 and 2010, the Company had $59.9 million and $53.6 million, respectively, of unam-ortized finite lived intangible assets primarily related to the acquisition of real estate assets. The total amortization expense for these intan-gible assets was $10.6 million, $11.0 million and $9.0 million for the years ended December 31, 2012, 2011 and 2010, respectively. The estimated aggregate amortization costs for each of the five succeeding fiscal years are as follows ($ in thousands):
Year2013 $11,5342014 $ 9,2212015 $ 7,5892016 $ 6,7702017 $ 5,721
Future Minimum Operating Lease Payments – Future minimum operating lease payments under non-cancelable leases, excluding cus-tomer reimbursements of expenses, in effect at December 31, 2012, are as follows ($ in thousands):
YearNet Lease
AssetsOperating
Properties2013 $126,777 $54,5902014 $129,622 $53,5162015 $130,871 $48,9252016 $128,347 $46,4262017 $121,533 $43,754

Tenant Reimbursements – The Company receives reimburse-ments from tenants for certain facility operating expenses including common area costs, insurance, utilities and real estate taxes. Tenant expense reimbursements for the years ended December 31, 2012, 2011 and 2010 were $30.9 million, $29.4 million and $33.2 million, respec-tively, and are included in “Operating lease income” on the Company’s Consolidated Statements of Operations.
Note 5 – Loans Receivable, net
The following is a summary of the Company’s loans receivable by class ($ in thousands):
As of December 31, 2012 2011Type of InvestmentSenior mortgages $1,751,256 $2,801,213Subordinate mortgages 152,737 211,491Corporate/Partnership loans 450,491 478,892 Total gross carrying value of loans (1) $2,354,484 $3,491,596Reserves for loan losses (524,499) (646,624) Total carrying value of loans $1,829,985 $2,844,972Other lending investments – securities – 15,790 Total loans receivable, net $1,829,985 $2,860,762
Explanatory Note:
(1) The Company’s recorded investment in loans as of December 31, 2012 and 2011, was $2.36 billion and $3.50 billion, respectively, which consists of total gross carrying value of loans plus accrued interest of $9.8 million and $13.3 million, for the same two periods, respectively.
During the year ended December 31, 2012, the Company origi-nated and funded $39.6 million of loans and received principal repay-ments of $710.7 million. During the same period, the Company sold loans with a total carrying value of $53.9 million, for which it recog-nized charge-offs of $3.3 million and also recorded income of $6.4 mil-lion in “Other income” on the Company’s Consolidated Statements of Operations.
During the year ended December 31, 2012, the Company received title to properties in full or partial satisfaction of non-performing mortgage loans with a gross carrying value of $352.8 million, for which the properties had served as collateral, and recorded charge-offs total-ing $85.3 million related to these loans. These properties were recorded as “Real estate, net” or “Real estate available and held for sale” on the Company’s Consolidated Balance Sheets (see Note 4).
Reserve for Loan Losses – Changes in the Company’s reserve for loan losses were as follows ($ in thousands):
For the Years Ended December 31, 2012 2011 2010Reserve for loan losses
at beginning of period $ 646,624 $ 814,625 $1,417,949Provision for loan losses 81,740 46,412 331,487Charge-offs (203,865) (214,413) (934,811)Reserve for loan losses
at end of period $ 524,499 $ 646,624 $ 814,625
The Company’s recorded investment in loans (comprised of a loan’s carrying value plus accrued interest) and the associated reserve for loan losses were as follows ($ in thousands):
Individually Evaluated for
Impairment (1)
Collectively Evaluated for
Impairment (2)
Loans Acquired with
Deteriorated Credit Quality (3) Total
As of December 31, 2012Loans $1,095,957 $1,210,077 $ 58,281 $2,364,315Less: Reserve for loan losses (472,058) (33,100) (19,341) (524,499) Total $ 623,899 $1,176,977 $ 38,940 $1,839,816As of December 31, 2011Loans $ 1,525,337 $ 1,919,876 $ 59,648 $ 3,504,861Less: Reserve for loan losses (554,131) (73,500) (18,993) (646,624) Total $ 971,206 $ 1,846,376 $ 40,655 $ 2,858,237
Explanatory Notes:
(1) The carrying value of these loans include unamortized discounts, premiums, deferred fees and costs aggregating to a net discount of $4.0 million and a net premium of $0.1 million as of December 31, 2012 and 2011, respectively. The Company’s loans individually evaluated for impairment primarily represent loans on non-accrual status and therefore, the unamor-tized amounts associated with these loans are not currently being amortized into income.
(2) The carrying value of these loans include unamortized discounts, premiums, deferred fees and costs aggregating to a net discount of $3.8 million and $0.2 million as of December 31, 2012 and 2011, respectively.
(3) The carrying value of these loans include unamortized discounts, premiums, deferred fees and costs aggregating to a net premium of $0.1 million and a net discount of $15.0 million as of December 31, 2012 and 2011, respectively. These loans had cumulative principal balances of $58.8 million and $74.5 million, as of December 31, 2012 and 2011, respectively.
48
-
49
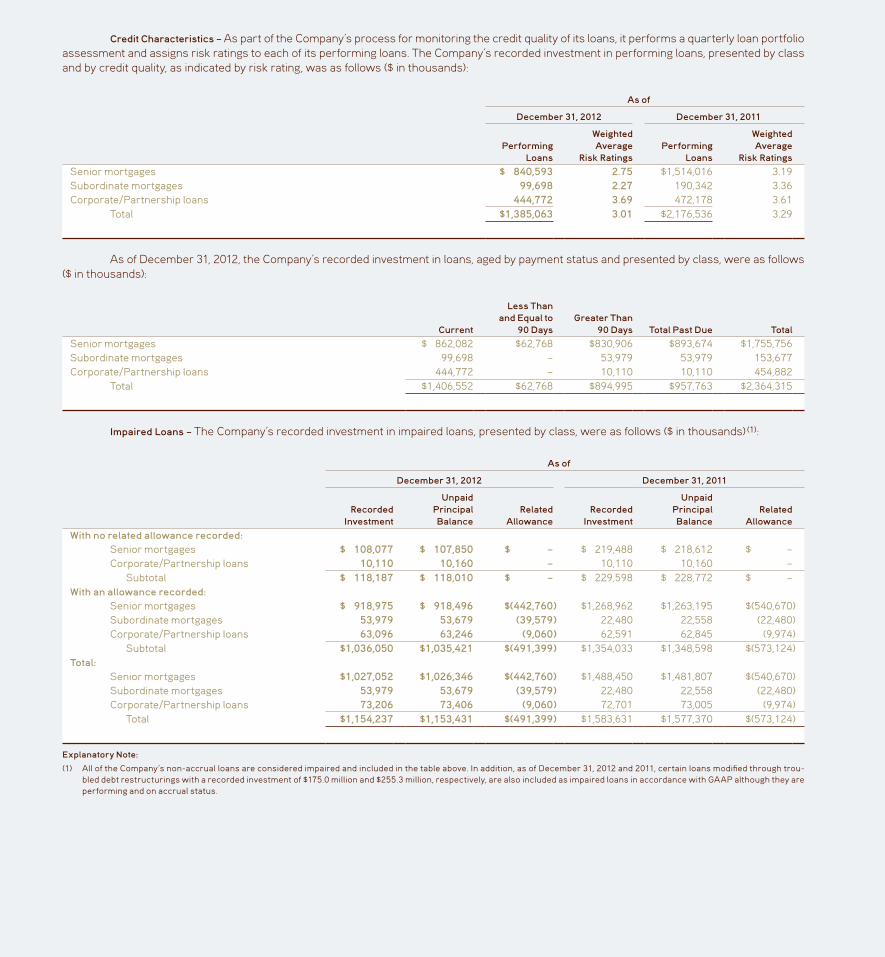
Credit Characteristics – As part of the Company’s process for monitoring the credit quality of its loans, it performs a quarterly loan portfolio assessment and assigns risk ratings to each of its performing loans. The Company’s recorded investment in performing loans, presented by class and by credit quality, as indicated by risk rating, was as follows ($ in thousands):
As of
December 31, 2012 December 31, 2011
Performing Loans
Weighted Average
Risk RatingsPerforming
Loans
Weighted Average
Risk RatingsSenior mortgages $ 840,593 2.75 $1,514,016 3.19Subordinate mortgages 99,698 2.27 190,342 3.36Corporate/Partnership loans 444,772 3.69 472,178 3.61 Total $1,385,063 3.01 $2,176,536 3.29
As of December 31, 2012, the Company’s recorded investment in loans, aged by payment status and presented by class, were as follows ($ in thousands):
Current
Less Than and Equal to
90 DaysGreater Than
90 Days Total Past Due TotalSenior mortgages $ 862,082 $62,768 $830,906 $893,674 $1,755,756Subordinate mortgages 99,698 – 53,979 53,979 153,677Corporate/Partnership loans 444,772 – 10,110 10,110 454,882 Total $1,406,552 $62,768 $894,995 $957,763 $2,364,315
Impaired Loans – The Company’s recorded investment in impaired loans, presented by class, were as follows ($ in thousands) (1):
As of
December 31, 2012 December 31, 2011
Recorded Investment
Unpaid Principal Balance
Related Allowance
Recorded Investment
Unpaid Principal Balance
Related Allowance
With no related allowance recorded: Senior mortgages $ 108,077 $ 107,850 $ – $ 219,488 $ 218,612 $ – Corporate/Partnership loans 10,110 10,160 – 10,110 10,160 – Subtotal $ 118,187 $ 118,010 $ – $ 229,598 $ 228,772 $ – With an allowance recorded: Senior mortgages $ 918,975 $ 918,496 $(442,760) $1,268,962 $1,263,195 $(540,670) Subordinate mortgages 53,979 53,679 (39,579) 22,480 22,558 (22,480) Corporate/Partnership loans 63,096 63,246 (9,060) 62,591 62,845 (9,974) Subtotal $1,036,050 $1,035,421 $(491,399) $1,354,033 $1,348,598 $(573,124)Total: Senior mortgages $1,027,052 $1,026,346 $(442,760) $1,488,450 $1,481,807 $(540,670) Subordinate mortgages 53,979 53,679 (39,579) 22,480 22,558 (22,480) Corporate/Partnership loans 73,206 73,406 (9,060) 72,701 73,005 (9,974) Total $1,154,237 $1,153,431 $(491,399) $1,583,631 $1,577,370 $(573,124)
Explanatory Note:
(1) All of the Company’s non-accrual loans are considered impaired and included in the table above. In addition, as of December 31, 2012 and 2011, certain loans modified through trou-bled debt restructurings with a recorded investment of $175.0 million and $255.3 million, respectively, are also included as impaired loans in accordance with GAAP although they are performing and on accrual status.

The Company’s average recorded investment in impaired loans and interest income recognized, presented by class, were as follows ($ in thousands):
For the Years Ended December 31,
2012 2011 2010
Average Recorded
Investment
Interest Income
Recognized
Average Recorded
Investment
Interest Income
Recognized
Average Recorded
Investment
Interest Income
RecognizedWith no related allowance recorded: Senior mortgages $ 162,093 $2,765 $ 309,079 $31,799 $ 659,150 $20,472 Subordinate mortgages – – – – 1,404 87 Corporate/Partnership loans 10,110 160 10,110 680 27,526 1,868 Subtotal $ 172,203 $2,925 $ 319,189 $32,479 $ 688,080 $22,427With an allowance recorded: Senior mortgages $1,064,045 $3,865 $1,608,486 $ 7,187 $2,411,735 $ 5,183 Subordinate mortgages 52,208 – 19,477 – 77,125 107 Corporate/Partnership loans 62,248 312 66,087 332 65,118 – Subtotal $1,178,501 $4,177 $1,694,050 $ 7,519 $2,553,978 $ 5,290Total: Senior mortgages $1,226,138 $6,630 $1,917,565 $38,986 $3,070,885 $25,655 Subordinate mortgages 52,208 – 19,477 – 78,529 194 Corporate/Partnership loans 72,358 472 76,197 1,012 92,644 1,868 Total $1,350,704 $7,102 $2,013,239 $39,998 $3,242,058 $27,717
During the year ended December 31, 2011, the Company recorded interest income of $26.3 million related to the resolution of certain non-performing loans. Interest income was not previously recorded while the loans were on non-accrual status.
Troubled Debt Restructurings – During the years ended December 31, 2012 and 2011, the Company modified loans that were determined to be troubled debt restructurings. The recorded investment in these loans was impacted by the modifications as follows, presented by class ($ in thousands):
For the Years Ended December 31,
2012 2011
Number of Loans
Pre-Modification Outstanding
Recorded Investment
Post-Modification Outstanding
Recorded Investment
Number of Loans
Pre-Modification Outstanding
Recorded Investment
Post-Modification Outstanding
Recorded Investment
Senior mortgages 8 $319,667 $272,753 7 $191,158 $190,893
Troubled debt restructurings that subsequently defaulted during the period were as follows ($ in thousands):
For the Years Ended December 31,
2012 2011
Number of Loans
Outstanding Recorded
InvestmentNumber of Loans
Outstanding Recorded
InvestmentSenior mortgages 1 $18,511 1 $28,005
50
-
51
Troubled debt restructurings that occurred during the year ended December 31, 2012 included the modifications of performing loans with a combined recorded investment of $64.1 million. The modi-fied terms of these loans granted maturity extensions ranging from one year to three years and included conditional extension options in certain cases dependent on borrower-specific performance hurdles. In each case, the Company believes the borrowers can perform under the modified terms of the loans and continues to classify these loans as performing.
Non-performing loans with a combined recorded investment of $255.6 million were also modified during the year ended December 31, 2012 and continued to be classified as non-performing subsequent to modification. Included in this balance was a loan with a recorded invest-ment of $181.5 million prior to modification, for which the Company agreed to reduce the outstanding principal balance and recorded charge-offs totaling $45.5 million, and also reduce the loan’s interest rate. The remaining non-performing loans were granted maturity exten-sions ranging from one month to seven months and the interest rate was reduced on one loan.
Troubled debt restructurings that occurred during the year ended December 31, 2011 included the modifications of performing loans with a combined recorded investment of $129.2 million. The mod-ified terms of these loans granted maturity extensions ranging from three months to five years and included conditional extension options in certain cases dependent on borrower-specific performance hurdles. The Company reduced the rate on loans with a combined recorded investment of $59.5 million from a combined weighted average rate
of 6.2% to 4.1%. In each case, the Company believed the borrowers could perform under the modified terms of the loans and classified these loans as performing after the modification. One of these loans subsequently defaulted.
Non-performing loans with a combined recorded investment of $62.0 million were also modified during the year ended December 31, 2011 and continued to be classified as non-performing subsequent to modification. Included in this balance was a loan with a recorded investment of $46.1 million, for which the Company granted a maturity extension of six months while also reducing the loan’s interest rate. The Company also extended a discounted payoff option on another loan that was classified as non-performing.
Generally when granting concessions, the Company will seek to protect its position by requiring incremental pay downs, additional collateral or guarantees and in some cases lookback features or equity kickers to offset concessions granted should conditions impacting the loan improve. The Company’s determination of credit losses is impacted by troubled debt restructurings whereby loans that have gone through troubled debt restructurings are considered impaired, assessed for specific reserves, and are not included in the Company’s assessment of general loan loss reserves. Loans previously restructured under troubled debt restructurings that subsequently default are reassessed to incorporate the Company’s current assumptions on expected cash flows and additional provision expense is recorded to the extent nec-essary. As of December 31, 2012, the Company had $21.6 million of unfunded commitments associated with modified loans considered troubled debt restructurings.
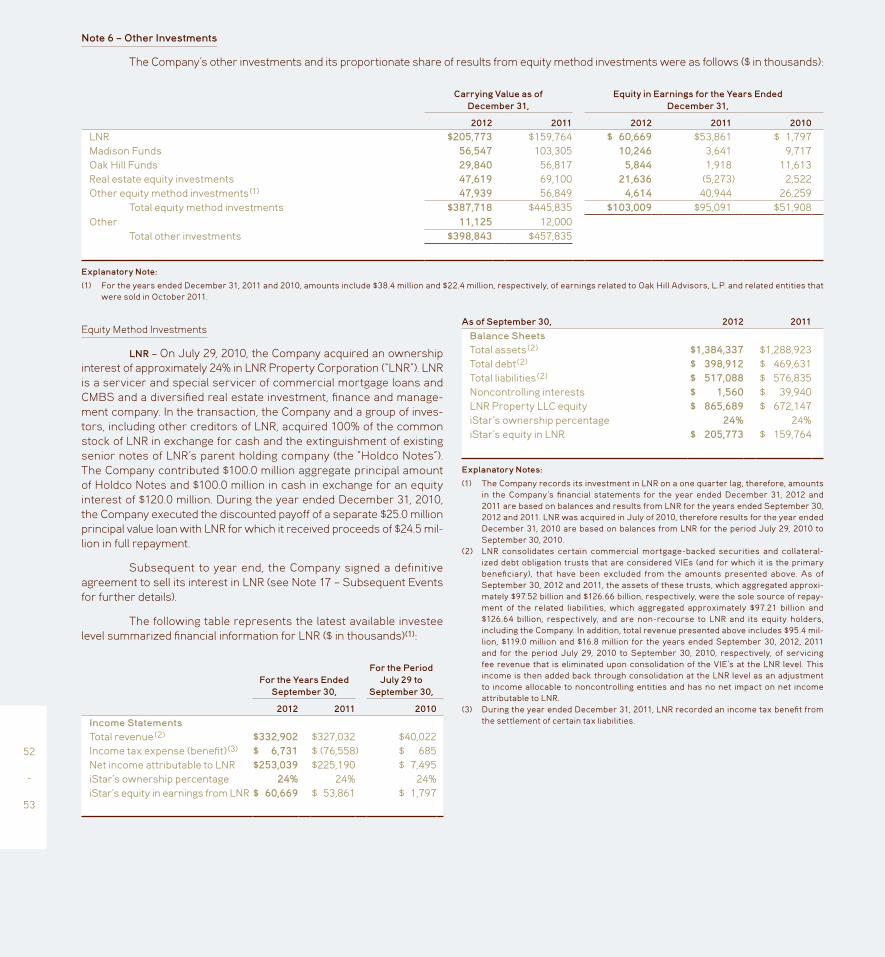
Note 6 – Other Investments
The Company’s other investments and its proportionate share of results from equity method investments were as follows ($ in thousands):
Carrying Value as of December 31,
Equity in Earnings for the Years Ended December 31,
2012 2011 2012 2011 2010LNR $205,773 $159,764 $ 60,669 $53,861 $ 1,797Madison Funds 56,547 103,305 10,246 3,641 9,717Oak Hill Funds 29,840 56,817 5,844 1,918 11,613Real estate equity investments 47,619 69,100 21,636 (5,273) 2,522Other equity method investments (1) 47,939 56,849 4,614 40,944 26,259 Total equity method investments $387,718 $445,835 $103,009 $95,091 $51,908Other 11,125 12,000 Total other investments $398,843 $457,835
Explanatory Note:
(1) For the years ended December 31, 2011 and 2010, amounts include $38.4 million and $22.4 million, respectively, of earnings related to Oak Hill Advisors, L.P. and related entities that were sold in October 2011.
Equity Method Investments
LNR – On July 29, 2010, the Company acquired an ownership interest of approximately 24% in LNR Property Corporation (“LNR”). LNR is a servicer and special servicer of commercial mortgage loans and CMBS and a diversified real estate investment, finance and manage-ment company. In the transaction, the Company and a group of inves-tors, including other creditors of LNR, acquired 100% of the common stock of LNR in exchange for cash and the extinguishment of existing senior notes of LNR’s parent holding company (the “Holdco Notes”). The Company contributed $100.0 million aggregate principal amount of Holdco Notes and $100.0 million in cash in exchange for an equity interest of $120.0 million. During the year ended December 31, 2010, the Company executed the discounted payoff of a separate $25.0 million principal value loan with LNR for which it received proceeds of $24.5 mil-lion in full repayment.
Subsequent to year end, the Company signed a definitive agreement to sell its interest in LNR (see Note 17 – Subsequent Events for further details).
The following table represents the latest available investee level summarized financial information for LNR ($ in thousands) (1):
For the Years Ended September 30,
For the Period July 29 to
September 30,
2012 2011 2010Income StatementsTotal revenue (2) $332,902 $327,032 $40,022Income tax expense (benefit) (3) $ 6,731 $ (76,558) $ 685Net income attributable to LNR $253,039 $225,190 $ 7,495iStar’s ownership percentage 24% 24% 24%iStar’s equity in earnings from LNR $ 60,669 $ 53,861 $ 1,797
As of September 30, 2012 2011
Balance SheetsTotal assets (2) $1,384,337 $1,288,923Total debt (2) $ 398,912 $ 469,631Total liabilities (2) $ 517,088 $ 576,835Noncontrolling interests $ 1,560 $ 39,940LNR Property LLC equity $ 865,689 $ 672,147iStar’s ownership percentage 24% 24%iStar’s equity in LNR $ 205,773 $ 159,764
Explanatory Notes:
(1) The Company records its investment in LNR on a one quarter lag, therefore, amounts in the Company’s financial statements for the year ended December 31, 2012 and 2011 are based on balances and results from LNR for the years ended September 30, 2012 and 2011. LNR was acquired in July of 2010, therefore results for the year ended December 31, 2010 are based on balances from LNR for the period July 29, 2010 to September 30, 2010.
(2) LNR consolidates certain commercial mortgage-backed securities and collateral-ized debt obligation trusts that are considered VIEs (and for which it is the primary beneficiary), that have been excluded from the amounts presented above. As of September 30, 2012 and 2011, the assets of these trusts, which aggregated approxi-mately $97.52 billion and $126.66 billion, respectively, were the sole source of repay-ment of the related liabilities, which aggregated approximately $97.21 billion and $126.64 billion, respectively, and are non-recourse to LNR and its equity holders, including the Company. In addition, total revenue presented above includes $95.4 mil-lion, $119.0 million and $16.8 million for the years ended September 30, 2012, 2011 and for the period July 29, 2010 to September 30, 2010, respectively, of servicing fee revenue that is eliminated upon consolidation of the VIE’s at the LNR level. This income is then added back through consolidation at the LNR level as an adjustment to income allocable to noncontrolling entities and has no net impact on net income attributable to LNR.
(3) During the year ended December 31, 2011, LNR recorded an income tax benefit from the settlement of certain tax liabilities.
52
-
53
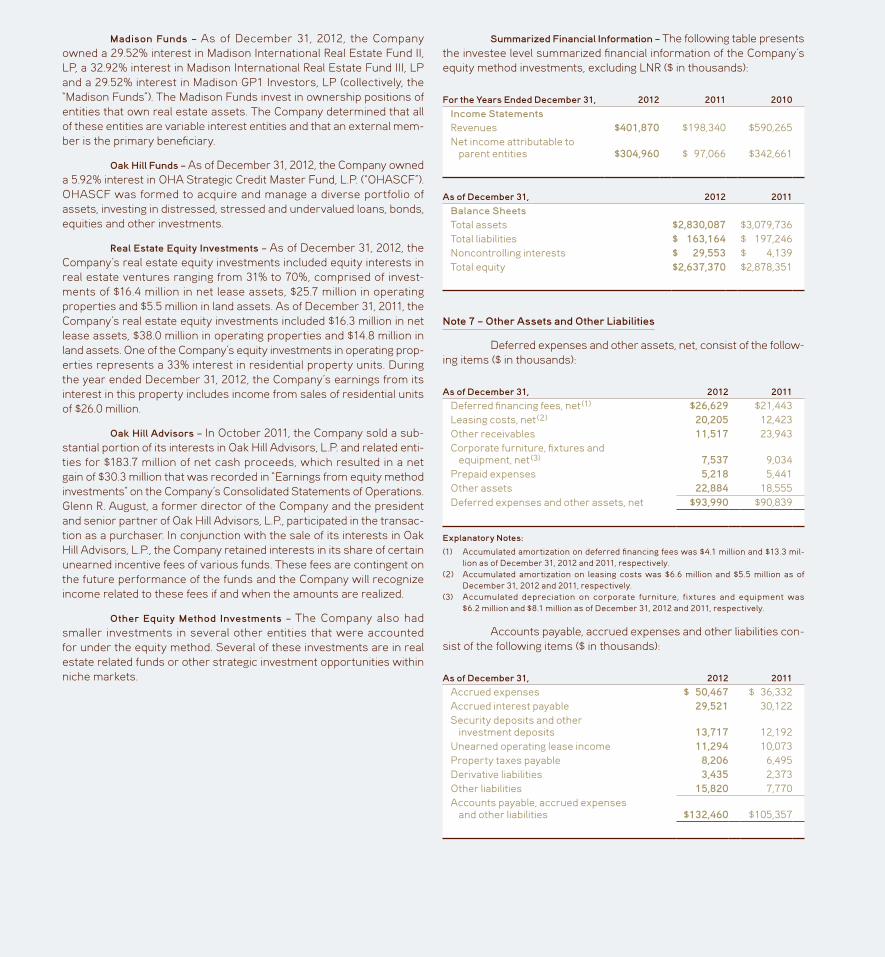
Madison Funds – As of December 31, 2012, the Company owned a 29.52% interest in Madison International Real Estate Fund II, LP, a 32.92% interest in Madison International Real Estate Fund III, LP and a 29.52% interest in Madison GP1 Investors, LP (collectively, the “Madison Funds”). The Madison Funds invest in ownership positions of entities that own real estate assets. The Company determined that all of these entities are variable interest entities and that an external mem-ber is the primary beneficiary.
Oak Hill Funds – As of December 31, 2012, the Company owned a 5.92% interest in OHA Strategic Credit Master Fund, L.P. (“OHASCF”). OHASCF was formed to acquire and manage a diverse portfolio of assets, investing in distressed, stressed and undervalued loans, bonds, equities and other investments.
Real Estate Equity Investments – As of December 31, 2012, the Company’s real estate equity investments included equity interests in real estate ventures ranging from 31% to 70%, comprised of invest-ments of $16.4 million in net lease assets, $25.7 million in operating properties and $5.5 million in land assets. As of December 31, 2011, the Company’s real estate equity investments included $16.3 million in net lease assets, $38.0 million in operating properties and $14.8 million in land assets. One of the Company’s equity investments in operating prop-erties represents a 33% interest in residential property units. During the year ended December 31, 2012, the Company’s earnings from its interest in this property includes income from sales of residential units of $26.0 million.
Oak Hill Advisors – In October 2011, the Company sold a sub-stantial portion of its interests in Oak Hill Advisors, L.P. and related enti-ties for $183.7 million of net cash proceeds, which resulted in a net gain of $30.3 million that was recorded in “Earnings from equity method investments” on the Company’s Consolidated Statements of Operations. Glenn R. August, a former director of the Company and the president and senior partner of Oak Hill Advisors, L.P., participated in the transac-tion as a purchaser. In conjunction with the sale of its interests in Oak Hill Advisors, L.P., the Company retained interests in its share of certain unearned incentive fees of various funds. These fees are contingent on the future performance of the funds and the Company will recognize income related to these fees if and when the amounts are realized.
Other Equity Method Investments – The Company also had smaller investments in several other entities that were accounted for under the equity method. Several of these investments are in real estate related funds or other strategic investment opportunities within niche markets.
Summarized Financial Information – The following table presents the investee level summarized financial information of the Company’s equity method investments, excluding LNR ($ in thousands):
For the Years Ended December 31, 2012 2011 2010Income StatementsRevenues $401,870 $198,340 $590,265Net income attributable to
parent entities $304,960 $ 97,066 $342,661
As of December 31, 2012 2011Balance SheetsTotal assets $2,830,087 $3,079,736Total liabilities $ 163,164 $ 197,246Noncontrolling interests $ 29,553 $ 4,139Total equity $2,637,370 $2,878,351
Note 7 – Other Assets and Other Liabilities
Deferred expenses and other assets, net, consist of the follow-ing items ($ in thousands):
As of December 31, 2012 2011Deferred financing fees, net (1) $26,629 $21,443Leasing costs, net (2) 20,205 12,423Other receivables 11,517 23,943Corporate furniture, fixtures and
equipment, net (3) 7,537 9,034Prepaid expenses 5,218 5,441Other assets 22,884 18,555Deferred expenses and other assets, net $93,990 $90,839
Explanatory Notes:
(1) Accumulated amortization on deferred financing fees was $4.1 million and $13.3 mil-lion as of December 31, 2012 and 2011, respectively.
(2) Accumulated amortization on leasing costs was $6.6 million and $5.5 million as of December 31, 2012 and 2011, respectively.
(3) Accumulated depreciation on corporate furniture, fixtures and equipment was $6.2 million and $8.1 million as of December 31, 2012 and 2011, respectively.
Accounts payable, accrued expenses and other liabilities con-sist of the following items ($ in thousands):
As of December 31, 2012 2011Accrued expenses $ 50,467 $ 36,332Accrued interest payable 29,521 30,122Security deposits and other
investment deposits 13,717 12,192Unearned operating lease income 11,294 10,073Property taxes payable 8,206 6,495Derivative liabilities 3,435 2,373Other liabilities 15,820 7,770Accounts payable, accrued expenses
and other liabilities $132,460 $105,357

Note 8 – Debt Obligations, net
As of December 31, 2012 and 2011, the Company’s debt obligations were as follows ($ in thousands):
Carrying Value as of December 31,
2012 2011Stated
Interest RatesScheduled
Maturity DateSecured credit facilities and term loans: 2011 Tranche A-1 Facility $ – $ 961,580 LIBOR + 3.75% (1) – 2011 Tranche A-2 Facility – 1,450,000 LIBOR + 5.75% (1) – 2012 Tranche A-1 Facility 169,164 – LIBOR + 4.00% (2) March 2016 2012 Tranche A-2 Facility 470,000 – LIBOR + 5.75% (2) March 2017 October 2012 Secured Credit Facility 1,754,466 – LIBOR + 4.50% (3) October 2017 Term loans collateralized by net lease assets 264,432 293,192 4.851% – 7.68% Various through 2026Total secured credit facilities and term loans $2,658,062 $2,704,772Unsecured credit facility: Line of credit $ – $ 243,650 LIBOR + 0.85% –Unsecured notes: 5.15% senior notes – 263,466 5.15% – 5.50% senior notes – 92,845 5.50% – LIBOR + 0.50% senior convertible notes – 784,750 LIBOR + 0.50% – 8.625% senior notes 96,801 501,701 8.625% June 2013 5.95% senior notes 448,453 448,453 5.95% October 2013 6.5% senior notes – 67,055 6.5% December 2013 5.70% senior notes 200,601 200,601 5.70% March 2014 6.05% senior notes 105,765 105,765 6.05% April 2015 5.875% senior notes 261,403 261,403 5.875% March 2016 3.0% senior convertible notes (4) 200,000 – 3.0% November 2016 5.85% senior notes 99,722 99,722 5.85% March 2017 9.0% senior notes 275,000 – 9.0% June 2017 7.125% senior notes 300,000 – 7.125% February 2018Total unsecured notes $1,987,745 $2,825,761Other debt obligations: Other debt obligations $ 100,000 $ 100,000 LIBOR + 1.5% October 2035Total debt obligations $4,745,807 $5,874,183 Debt discounts, net (54,313) (36,643)Total debt obligations, net $4,691,494 $5,837,540
Explanatory Notes:
(1) These loans had a LIBOR floor of 1.25%.(2) These loans each have a LIBOR floor of 1.25%. As of December 31, 2012, inclusive of the floors, the 2012 Tranche A-1 Facility and 2012 Tranche A-2 Facility loans incurred interest at a
rate of 5.25% and 7.00%, respectively.(3) This loan has a LIBOR floor of 1.25%. As of December 31, 2012, inclusive of the floor, the October 2012 Secured Credit Facility incurred interest at a rate of 5.75%. Subsequent to year
end, in connection with the repricing of the October 2012 Secured Credit Facility, the loan will bear interest at a rate of LIBOR + 3.50%, with a LIBOR floor of 1.00%. See Note 17 – Subsequent Events.
(4) The Company’s convertible senior fixed rate notes due November 2016 (“Convertible Notes”) are convertible at the option of the holders, into 85.0 shares per $1,000 principal amount of Convertible Notes, at any time prior to the close of business on November 14, 2016. As of December 31, 2012, the outstanding principal balance of the Company’s senior convertible notes was $200.0 million. For the year ended December 31, 2012, the Company recognized interest expense on the convertible notes of $0.8 million.
54
-
55

Future Scheduled Maturities – As of December 31, 2012, future scheduled maturities of outstanding long-term debt obligations are as follows ($ in thousands) (1):
Unsecured Debt
Secured Debt Total
2013 $ 545,254 $ – $ 545,2542014 200,601 – 200,6012015 105,765 46,164 151,9292016 461,403 134,816 596,2192017 374,722 2,212,650 2,587,372Thereafter 400,000 264,432 664,432Total principal maturities $2,087,745 $2,658,062 $4,745,807Unamortized debt discounts, net (19,147) (35,166) (54,313)Total long-term debt
obligations, net $2,068,598 $2,622,896 $4,691,494
Explanatory Note:
(1) Includes minimum required amortization payments on the March 2012 Secured Credit Facilities and the October 2012 Secured Credit Facility.
October 2012 Secured Credit Facility – On October 15, 2012, the Company entered into a $1.82 billion senior secured credit agree-ment due October 15, 2017 (the “October 2012 Secured Credit Facility”). The October 2012 Secured Credit Facility bears interest at a rate of LIBOR + 4.50%, with a 1.25% LIBOR floor, and was issued at 99.0% of par. Proceeds from the October 2012 Secured Credit Facility were used to refinance the remaining outstanding balances of the Company’s existing 2011 Secured Credit Facilities.
Borrowings under the October 2012 Secured Credit Facility are collateralized by a first lien on a fixed pool of assets, with required mini-mum collateral coverage of not less than 125% of outstanding borrow-ings. If collateral coverage is less than 137.5% of outstanding borrowings, 100% of the proceeds from principal repayments and sales of collateral will be applied to repay outstanding borrowings under the October 2012 Secured Credit Facility. For so long as collateral coverage is between 137.5% and 150% of outstanding borrowings, 50% of proceeds from principal repayments and sales of collateral will be applied to repay out-standing borrowings under the October 2012 Secured Credit Facility and for so long as collateral coverage is greater than 150% of outstand-ing borrowings, the Company may retain all proceeds from principal repayments and sales of collateral. The Company retains proceeds from interest, rent, lease payments and fee income in all cases.
In connection with the October 2012 Secured Credit Facility transaction, the Company incurred $14.8 million in third party fees, of which $8.2 million was recognized in “Other expense” on the Company’s Consolidated Statements of Operations as it related to the portion of lenders from the original facility that modified their debt under the new facility. The remaining $6.6 million of fees were recorded in “Deferred expenses and other assets, net” on the Company’s Consolidated Balance Sheets, as they related to the portion of lenders that were new to the facility.
The October 2012 Secured Credit Facility contains certain covenants relating to the collateral, among other matters, but does not contain corporate level financial covenants. For so long as the Company maintains its qualification as a REIT, it is permitted to distribute 100%
of its REIT taxable income on an annual basis. In addition, the Company may distribute to its stockholders real estate assets, or interests therein, having an aggregate equity value not to exceed $200 million, that are not collateral securing the borrowings under the October 2012 Secured Credit Facility. Except for the distribution of real estate assets described in the preceding sentence, the Company may not pay common dividends if it ceases to qualify as a REIT.
Through December 31, 2012, the Company has made cumu-lative amortization repayments of $65.5 million on the October 2012 Secured Credit Facility, which exceeds all required amortization pay-ments through March 2016. Repayments of the October 2012 Secured Credit Facility prior to scheduled amortization dates have resulted in losses on early extinguishment of debt of $1.2 million for the year ended December 31, 2012 related to the acceleration of discounts and unamor-tized deferred financing fees on the portion of the facility that was repaid. See Note 17 – Subsequent Events below for details on the refinancing of the October 2012 Secured Credit Facility in February 2013.
March 2012 Secured Credit Facilities – In March 2012, the Company entered into an $880.0 million senior secured credit agree-ment providing for two tranches of term loans: a $410.0 million 2012 A-1 tranche due March 2016, which bears interest at a rate of LIBOR + 4.00% (the “2012 Tranche A-1 Facility”), and a $470.0 million 2012 A-2 tranche due March 2017, which bears interest at a rate of LIBOR + 5.75% (the “2012 Tranche A-2 Facility,” together the “March 2012 Secured Credit Facilities”). The 2012 A-1 and A-2 tranches were issued at 98.0% of par and 98.5% of par, respectively, and both tranches include a LIBOR floor of 1.25%. Proceeds from the March 2012 Secured Credit Facilities were used to repurchase and repay at maturity $606.7 million aggregate prin-cipal amount of the Company’s convertible notes due October 2012, to fully repay the $244.0 million balance on the Company’s unsecured credit facility due June 2012, and to repay, upon maturity, $90.3 million outstanding principal balance of its 5.50% senior unsecured notes.
The March 2012 Secured Credit Facilities are collateralized by a first lien on a fixed pool of assets. Proceeds from principal repayments and sales of collateral are applied to amortize the March 2012 Secured Credit Facilities. Proceeds received for interest, rent, lease payments and fee income are retained by the Company. The 2012 Tranche A-1 Facility requires amortization payments of $41.0 million to be made every six months beginning December 31, 2012. After the 2012 Tranche A-1 Facility is repaid, proceeds from principal repayments and sales of collateral will be used to amortize the 2012 Tranche A-2 Facility. The Company may make optional prepayments on each tranche of term loans, subject to prepayment fees.
Through December 31, 2012, the Company made cumulative amortization repayments of $240.8 million on the 2012 Tranche A-1 Facility, which exceeds all required amortization payments through December 31, 2014. Repayments of the 2012 Tranche A-1 Facility prior to scheduled amortization dates have resulted in losses on early extin-guishment of debt of $8.1 million for the year ended December 31, 2012 related to the acceleration of discounts and unamortized deferred financing fees on the portion of the facility that was repaid.
2011 Secured Credit Facilities – In March 2011, the Company entered into a $2.95 billion senior secured credit agreement providing for two tranches of term loans: a $1.50 billion 2011 A-1 tranche due June
2013, bearing interest at a rate of LIBOR + 3.75% (the “2011 Tranche A-1 Facility”), and a $1.45 billion 2011 A-2 tranche due June 2014, bear-ing interest at a rate of LIBOR + 5.75% (the “2011 Tranche A-2 Facility,” together the “2011 Secured Credit Facilities”). The 2011 A-1 and A-2 tranches were issued at 99.0% of par and 98.5% of par, respectively, and both tranches include a LIBOR floor of 1.25%.
The 2011 Secured Credit Facilities were collateralized by a first lien on a fixed pool of assets. Proceeds from principal repayments and sales of collateral were applied to amortize the 2011 Secured Credit Facilities. Proceeds received for interest, rent, lease payments, fee income and, under certain circumstances, additional amounts funded on assets serving as collateral were retained by the Company. The 2011 Tranche A-1 Facility required that aggregate cumulative amortization payments of not less than $200.0 million would be made on or before December 30, 2011, not less than $450.0 million on or before June 30, 2012, not less than $750.0 million on or before December 31, 2012 and not less than $1.50 billion on or before June 28, 2013. The 2011 Tranche A-2 Facility had amortization requirements that would begin amortizing six months after the repayment in full of the 2011 Tranche A-1 Facility, such that not less than $150.0 million of cumulative amortization pay-ments would be made on or before the six month anniversary of repay-ment of the Tranche A-1 Facility, with additional amortization payments of $150.0 million due on or before each six month anniversary thereafter, with any unpaid principal amounts due at maturity in June 2014.
The 2011 Secured Credit Facilities were refinanced by the October 2012 Secured Credit Facility. Prior to refinancing, the Company made cumulative amortization repayments of $1.07 billion on the 2011 Secured Credit Facilities, which resulted in losses on early extin-guishment of debt of $4.5 million and $12.0 million for the years ended December 31, 2012 and 2011, respectively, related to the acceleration of discounts and unamortized deferred financing fees on the portion of the facility that was repaid.
At the time of the refinancing, the Company had $21.2 million of unamortized discounts and financing fees related to the 2011 Secured Credit Facilities. In connection with the refinancing, the Company recorded a loss on early extinguishment of debt of $12.1 million, related primarily to the portion of lenders in the original facility that did not par-ticipate in the new facility. The remaining $9.0 million of unamortized fees and discounts will continue to be amortized to interest expense over the remaining term of the October 2012 Secured Credit Facility.
Secured Term Loans – In October 2012, the Company entered into a $28.0 million secured term loan maturing in November 2019, bearing interest at a rate of LIBOR + 2.00%. Simultaneously with the financing, the Company entered into an interest rate swap to exchange its variable rate on the loan for a fixed interest rate (see Note 10).
In September 2012, the Company refinanced two secured term loans with an aggregate outstanding principal balance of $53.3 million, bearing interest at rates of 5.3% and 8.2% and maturing in January 2013 with a new $54.5 million secured term loan. The new loan bears interest at 4.851%, matures in October 2022 and is collateralized by the same net lease asset as the original term loan. In connection with the refinanc-ing, the Company recorded a loss on early extinguishment of debt of $0.5 million in its Consolidated Statements of Operations for the year ended December 31, 2012.
In addition, during the year ended December 31, 2012, in con-junction with the sale of a portfolio of 12 net lease assets, the Company repaid the $50.8 million outstanding balances of its LIBOR + 4.50% secured term loans due in 2014 and terminated the related interest rate swaps associated with the loans (see Note 10).
In 2011, the Company entered into a $120.0 million secured term loan financing maturing in July 2021. This financing is collateralized by net lease properties occupied by a single tenant and bears interest at 5.05%.
Also, in 2011, the Company refinanced the $47.7 million out-standing principal balance of a maturing secured term loan. In addition, during 2011, the Company entered into an additional $4.6 million secured term loan. The loans bear interest at LIBOR + 4.50%, mature in 2014 and are cross-collateralized by the same net lease assets. Simultaneously with the financings, the Company entered into interest rate swaps to exchange its variable rates on the notes for fixed interest rates.
In 2010, the Company repaid other secured term loans, including a $947.9 million non-recourse loan that was collateralized by the portfolio of net lease assets sold during the period, as well as $153.3 million of other term loans with various maturities. In connection with these repayments, the Company expensed unamortized deferred financing costs and incurred other expenses totaling $22.1 million, which reduced net gain on early extinguishment of debt during the year ended December 31, 2010.
Unsecured Credit Facility – During the year ended December 31, 2012, the Company repaid the $243.7 million remaining principal balance of its LIBOR + 0.85% unsecured credit facility due June 2012. In con-nection with the repayments, the Company recorded a loss on early extinguishment of debt of $0.2 million.
In 2011, the Company repaid the $329.9 million remaining prin-cipal balance of its LIBOR + 0.85% unsecured line of credit.
Secured Notes – In January 2011, the Company redeemed the $312.3 million remaining principal balance of its 10% 2014 secured exchange notes and recorded a gain on early extinguishment of debt of $109.0 million primarily related to the recognition of deferred gain premiums that resulted from a previous debt exchange.
During 2010, the Company redeemed or repurchased $322.5 million par value of its 2011 and 2014 Notes, generating $71.3 mil-lion of gains on early extinguishment of debt.
Unsecured Notes – In November 2012, the Company issued $300.0 million aggregate principal of 7.125% senior unsecured notes due February 2018 and issued $200.0 million aggregate principal of 3.00% convertible senior unsecured notes due November 2016. Proceeds from these transactions were used to fully repay $67.1 million of the 6.5% senior unsecured notes due December 2013 and partially repay $404.9 million of the 8.625% senior unsecured notes due June 2013. In connection with these repurchases, the Company paid a $14.9 million prepayment penalty which was reflected in “Gain (loss) on early extin-guishment of debt, net” on the Company’s Consolidated Statements of Operations for the year ended December 31, 2012.
56
-
57

In May 2012, the Company issued $275.0 million aggregate principal of 9.0% senior unsecured notes due June 2017 that were sold at 98.012% of their principal amount.
During the year ended December 31, 2012, the Company repaid, upon maturity, the $460.7 million outstanding principal balance of its LIBOR + 0.50% senior unsecured convertible notes, the $169.7 million outstanding principal balance of its 5.15% senior unsecured notes and the $90.3 million outstanding principal balance of its 5.50% senior unse-cured notes. In addition, the Company repurchased $420.4 million par value of senior unsecured notes with various maturities ranging from March 2012 to October 2012. In connection with these repurchases, the Company recorded aggregate gains on early extinguishment of debt of $3.2 million, for the year ended December 31, 2012.
During the year ended December 31, 2011, the Company repaid, upon maturity, the $170.4 million outstanding principal balance of its 5.65% senior unsecured notes, the $96.9 million outstanding principal balance of its 5.125% senior unsecured notes and the $107.8 million out-standing principal balance of its 5.80% senior unsecured senior notes. In addition, the Company repurchased $97.2 million par value of its senior unsecured notes with various maturities ranging from September 2011 to October 2012. In connection with these repurchases, the Company recorded an aggregate gain on early extinguishment of debt of $0.8 mil-lion for the year ended December 31, 2011.
During the year ended December 31, 2010, the Company repurchased $592.8 million par value of senior unsecured notes with various maturities ranging from March 2010 to March 2014 generating $59.7 million in net gains on early extinguishment of debt.
Unencumbered/Encumbered Assets – As of December 31, 2012, the carrying value of the Company’s unencumbered and encumbered assets by asset type are as follows ($ in thousands):
As of December 31,
2012 2011
Encumbered Assets
Unencumbered Assets
Encumbered Assets
Unencumbered Assets
Real estate, net $1,794,198 $1,004,825 $1,533,579 $1,414,332Real estate available and held for sale 141,673 494,192 177,092 500,366Loans receivable, net (1) 1,197,373 665,712 1,780,591 1,153,671Other Investments 43,545 355,298 37,957 419,878Cash and other assets – 487,073 – 573,871 Total $3,176,789 $3,007,100 $3,529,219 $4,062,118
Explanatory Note:
(1) As of December 31, 2012 and 2011, the amounts presented exclude general reserves for loan losses of $33.1 million and $73.5 million, respectively.
Debt Covenants
The Company’s outstanding unsecured debt securities contain corporate level covenants that include a covenant to maintain a ratio of unencumbered assets to unsecured indebtedness of at least 1.2x and a restriction on debt incurrence based upon the effect of the debt incurrence on the Company’s fixed charge coverage ratio. If any of the Company’s covenants are breached and not cured within applicable cure periods, the breach could result in acceleration of its debt securities unless a waiver or modification is agreed upon with the requisite per-centage of the bondholders. While the Company expects that its ability to incur new indebtedness under the fixed charge coverage ratio will be limited for the foreseeable future, it will continue to be permitted to incur indebtedness for the purpose of refinancing existing indebtedness and for other permitted purposes under the indentures.
The Company’s March 2012 Secured Credit Facilities and October 2012 Secured Credit Facility are collectively defined as the “Secured Credit Facilities.” The Company’s Secured Credit Facilities contain certain covenants, including covenants relating to collateral coverage, dividend payments, restrictions on fundamental changes, transactions with affiliates, matters relating to the liens granted to the lenders and the delivery of information to the lenders. In particu-lar, the Company is required to maintain collateral coverage of 1.25x
outstanding borrowings. In addition, for so long as the Company maintains its qualification as a REIT, the Secured Credit Facilities per-mit the Company to distribute 100% of its REIT taxable income on an annual basis and the October 2012 Secured Credit Facility permits the Company to distribute to its shareholders real estate assets, or interests therein, having an aggregate equity value not to exceed $200 million, so long as such assets are not collateral for the October 2012 Secured Credit Facility. The Company may not pay common dividends if it ceases to qualify as a REIT (except that the October 2012 Secured Credit Facility permits us to distribute certain real estate assets as described in the preceding sentence).
The Company’s Secured Credit Facilities contain cross default provisions that would allow the lenders to declare an event of default and accelerate the Company’s indebtedness to them if the Company fails to pay amounts due in respect of its other recourse indebtedness in excess of specified thresholds or if the lenders under such other indebt-edness are otherwise permitted to accelerate such indebtedness for any reason. The indentures governing the Company’s unsecured public debt securities permit the bondholders to declare an event of default and accelerate the Company’s indebtedness to them if the Company’s other recourse indebtedness in excess of specified thresholds is not paid at final maturity or if such indebtedness is accelerated.
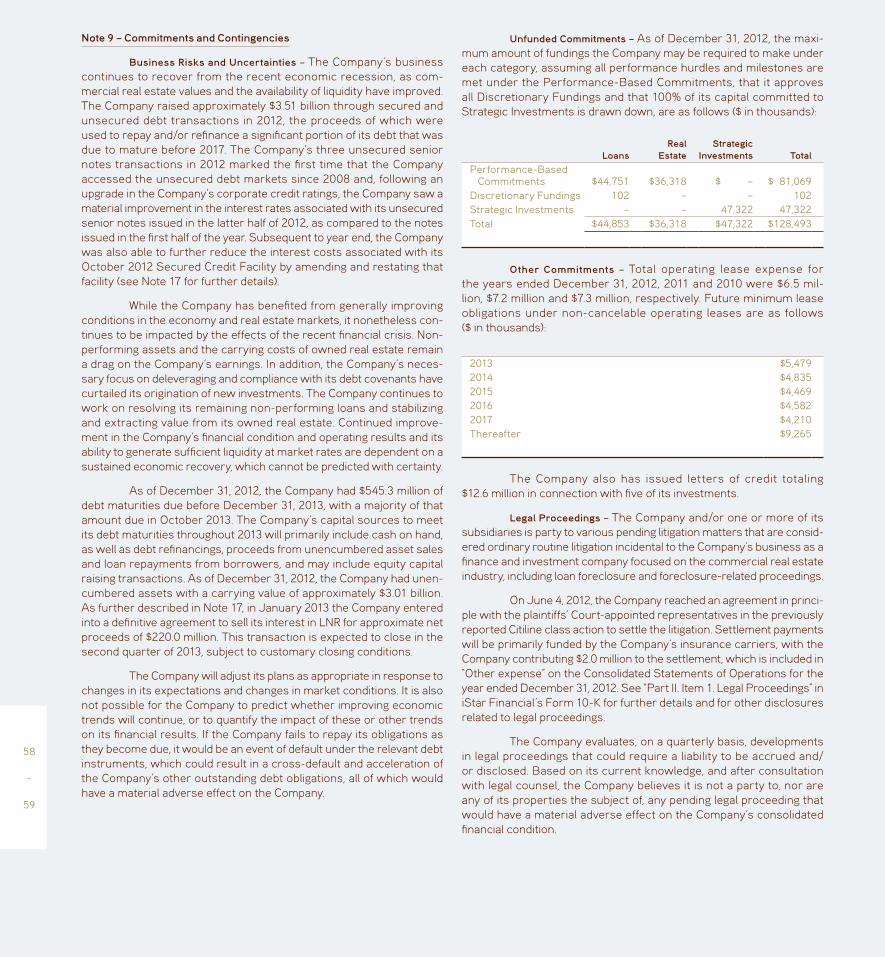
Note 9 – Commitments and Contingencies
Business Risks and Uncertainties – The Company’s business continues to recover from the recent economic recession, as com-mercial real estate values and the availability of liquidity have improved. The Company raised approximately $3.51 billion through secured and unsecured debt transactions in 2012, the proceeds of which were used to repay and/or refinance a significant portion of its debt that was due to mature before 2017. The Company’s three unsecured senior notes transactions in 2012 marked the first time that the Company accessed the unsecured debt markets since 2008 and, following an upgrade in the Company’s corporate credit ratings, the Company saw a material improvement in the interest rates associated with its unsecured senior notes issued in the latter half of 2012, as compared to the notes issued in the first half of the year. Subsequent to year end, the Company was also able to further reduce the interest costs associated with its October 2012 Secured Credit Facility by amending and restating that facility (see Note 17 for further details).
While the Company has benefited from generally improving conditions in the economy and real estate markets, it nonetheless con-tinues to be impacted by the effects of the recent financial crisis. Non-performing assets and the carrying costs of owned real estate remain a drag on the Company’s earnings. In addition, the Company’s neces-sary focus on deleveraging and compliance with its debt covenants have curtailed its origination of new investments. The Company continues to work on resolving its remaining non-performing loans and stabilizing and extracting value from its owned real estate. Continued improve-ment in the Company’s financial condition and operating results and its ability to generate sufficient liquidity at market rates are dependent on a sustained economic recovery, which cannot be predicted with certainty.
As of December 31, 2012, the Company had $545.3 million of debt maturities due before December 31, 2013, with a majority of that amount due in October 2013. The Company’s capital sources to meet its debt maturities throughout 2013 will primarily include cash on hand, as well as debt refinancings, proceeds from unencumbered asset sales and loan repayments from borrowers, and may include equity capital raising transactions. As of December 31, 2012, the Company had unen-cumbered assets with a carrying value of approximately $3.01 billion. As further described in Note 17, in January 2013 the Company entered into a definitive agreement to sell its interest in LNR for approximate net proceeds of $220.0 million. This transaction is expected to close in the second quarter of 2013, subject to customary closing conditions.
The Company will adjust its plans as appropriate in response to changes in its expectations and changes in market conditions. It is also not possible for the Company to predict whether improving economic trends will continue, or to quantify the impact of these or other trends on its financial results. If the Company fails to repay its obligations as they become due, it would be an event of default under the relevant debt instruments, which could result in a cross-default and acceleration of the Company’s other outstanding debt obligations, all of which would have a material adverse effect on the Company.
Unfunded Commitments – As of December 31, 2012, the maxi-mum amount of fundings the Company may be required to make under each category, assuming all performance hurdles and milestones are met under the Performance-Based Commitments, that it approves all Discretionary Fundings and that 100% of its capital committed to Strategic Investments is drawn down, are as follows ($ in thousands):
LoansReal
EstateStrategic
Investments TotalPerformance-Based
Commitments $44,751 $36,318 $ – $ 81,069Discretionary Fundings 102 – – 102Strategic Investments – – 47,322 47,322Total $44,853 $36,318 $47,322 $128,493
Other Commitments – Total operating lease expense for the years ended December 31, 2012, 2011 and 2010 were $6.5 mil-lion, $7.2 million and $7.3 million, respectively. Future minimum lease obligations under non-cancelable operating leases are as follows ($ in thousands):
2013 $5,4792014 $4,8352015 $4,4692016 $4,5822017 $4,210Thereafter $9,265
The Company also has issued letters of credit totaling $12.6 million in connection with five of its investments.
Legal Proceedings – The Company and/or one or more of its subsidiaries is party to various pending litigation matters that are consid-ered ordinary routine litigation incidental to the Company’s business as a finance and investment company focused on the commercial real estate industry, including loan foreclosure and foreclosure-related proceedings.
On June 4, 2012, the Company reached an agreement in princi-ple with the plaintiffs’ Court-appointed representatives in the previously reported Citiline class action to settle the litigation. Settlement payments will be primarily funded by the Company’s insurance carriers, with the Company contributing $2.0 million to the settlement, which is included in “Other expense” on the Consolidated Statements of Operations for the year ended December 31, 2012. See “Part II. Item 1. Legal Proceedings” in iStar Financial’s Form 10-K for further details and for other disclosures related to legal proceedings.
The Company evaluates, on a quarterly basis, developments in legal proceedings that could require a liability to be accrued and/or disclosed. Based on its current knowledge, and after consultation with legal counsel, the Company believes it is not a party to, nor are any of its properties the subject of, any pending legal proceeding that would have a material adverse effect on the Company’s consolidated financial condition.
58
-
59

Note 10 – Risk Management and Derivatives
Risk Management
In the normal course of its on-going business operations, the Company encounters economic risk. There are three main components of economic risk: interest rate risk, credit risk and market risk. The Company is subject to interest rate risk to the degree that its interest-bearing liabilities mature or reprice at different points in time and potentially at different bases, than its interest-earning assets. Credit risk is the risk of default on the Company’s lending investments or leases that result from a borrower’s or tenant’s inability or unwillingness to make contractually required payments. Market risk reflects changes in the value of loans and other lending investments due to changes in interest rates or other market factors, including the rate of prepayments of principal and the value of the collateral underlying loans, the valuation of real estate assets by the Company as well as changes in foreign currency exchange rates.
Risk concentrations – As of December 31, 2012, the Company’s total investment portfolio was comprised of the following property/collateral types ($ in thousands) (1):
Property/Collateral TypesReal Estate
FinanceNet Lease
AssetsOperating
Properties Land Total % of TotalLand $ 297,039 $ – $ – $970,593 $1,267,632 22.3%Office 124,058 301,304 258,977 – 684,339 12.0%Condominium 237,534 – 385,229 – 622,763 11.0%Industrial/R&D 94,617 472,149 55,439 – 622,205 10.9%Retail 293,651 50,529 184,000 – 528,180 9.3%Entertainment/Leisure 98,423 414,849 14 – 513,286 9.0%Hotel 298,293 91,746 84,375 – 474,414 8.3%Mixed Use/Mixed Collateral 237,989 – 179,337 – 417,326 7.3%Other Property Types 181,481 9,424 24,541 – 215,446 3.7%Strategic Investments – – – – 351,225 6.2%Total $1,863,085 $1,340,001 $1,171,912 $970,593 $5,696,816 100.0%
Explanatory Note:
(1) Based on the carrying value of the Company’s total investment portfolio gross of general loan loss reserves.
As of December 31, 2012, the Company’s total investment portfolio had the following characteristics by geographical region ($ in thousands) (1):
Geographic RegionReal Estate
FinanceNet Lease
AssetsOperating
Properties Land Total % of TotalWest $ 340,457 $ 340,896 $ 237,496 $367,470 $1,286,319 22.6%Northeast 421,660 317,003 175,894 180,744 1,095,301 19.2%Southeast 308,559 201,535 251,410 89,035 850,539 14.9%Southwest 197,478 182,329 209,424 120,293 709,524 12.5%Mid-Atlantic 43,866 104,205 217,379 180,290 545,740 9.6%International (2) 308,210 – – – 308,210 5.4%Central 159,460 68,434 61,938 9,500 299,332 5.2%Northwest 83,236 56,409 18,371 23,261 181,277 3.2%Various 159 69,190 – – 69,349 1.2%Strategic Investments (2) – – – – 351,225 6.2%Total $1,863,085 $1,340,001 $1,171,912 $970,593 $5,696,816 100.0%
Explanatory Notes:
(1) Based on the carrying value of the Company’s total investment portfolio gross of general loan loss reserves.(2) Strategic investments includes $36.6 million of international assets. Additionally, international and strategic investments include $228.7 million of European assets, including
$117.6 million in Germany and $111.1 million in the United Kingdom.

Concentrations of credit risks arise when a number of bor-rowers or tenants related to the Company’s investments are engaged in similar business activities, or activities in the same geographic region, or have similar economic features that would cause their ability to meet contractual obligations, including those to the Company, to be similarly affected by changes in economic conditions. The Company monitors various segments of its portfolio to assess potential concentrations of credit risks. Management believes the current portfolio is reasonably well diversified and does not contain any significant concentration of credit risks.
Substantially all of the Company’s real estate as well as assets collateralizing its loans receivable are located in the United States, with California 15.5% representing the only significant concentration greater than 10.0% as of December 31, 2012. The Company’s portfolio contains significant concentrations in the following asset types as of
December 31, 2012: land 22.3%, office 12.0%, condominium 11.0% and industrial/R&D 10.9%.
The Company underwrites the credit of prospective borrow-ers and tenants and often requires them to provide some form of credit support such as corporate guarantees, letters of credit and/or cash security deposits. Although the Company’s loans and real estate assets are geographically diverse and the borrowers and tenants operate in a variety of industries, to the extent the Company has a significant concen-tration of interest or operating lease revenues from any single borrower or tenant, the inability of that borrower or tenant to make its payment could have an adverse effect on the Company. As of December 31, 2012, the Company’s five largest borrowers or tenants collectively accounted for approximately $88.2 million of the Company’s aggregate annual-ized interest and operating lease revenue, of which no single customer accounts for more than 7.2%.
Derivatives
The Company’s use of derivative financial instruments is primarily limited to the utilization of interest rate hedges and foreign exchange hedges. The principal objective of such hedges is to minimize the risks and/or costs associated with the Company’s operating and financial struc-ture and to manage its exposure to foreign exchange rates. Derivatives not designated as hedges are not speculative and are used to manage the Company’s exposure to interest rate movements, foreign exchange rate movements, and other identified risks, but may not meet the strict hedge accounting requirements.
The table below presents the fair value of the Company’s derivative financial instruments as well as their classification on the Consolidated Balance Sheets as of December 31, 2012 and 2011 ($ in thousands):
Derivative Assets as of December 31, Derivative Liabilities as of December 31,
2012 2011 2012 2011
DerivativeBalance Sheet
Location Fair ValueBalance Sheet
Location Fair ValueBalance Sheet
Location Fair ValueBalance Sheet
Location Fair Value
Foreign exchange contracts N/A $ – N/A $ –
Other Liabilities $2,855
Other Liabilities $1,342
Cash flow interest rate swap N/A – N/A –
Other Liabilities 580
Other Liabilities 1,031
Total $ – $ – $3,435 $2,373
60
-
61

The tables below present the effect of the Company’s derivative financial instruments on the Consolidated Statements of Operations for the years ended December 31, 2012 and 2011 ($ in thousands):
Derivatives Designated in Hedging Relationships
Location of Gain (Loss) Recognized in Income on Derivative
Amount of Gain (Loss) Recognized in
Accumulated Other Comprehensive Income
(Effective Portion)
Amount of Gain (Loss Reclassified from
Accumulated Other Comprehensive Income
into Earnings (Effective Portion
) )
Amount of Gain (Loss Recognized in Earnings
(Ineffective Portion
) )
For Year Ended December 31, 2012Cash flow interest rate swap Interest Expense $ (968) $ (44) N/AFor the Year Ended December 31, 2011Cash flow interest rate swap Interest Expense $(1,553) $(180) N/A
Amount of Gain or (Loss) Recognized in Income on Derivative
For the Years Ended December 31,
Derivatives Not Designated in Hedging Relationships
Location of Gain or (Loss Recognized in
Income on Derivative
)
2012 2011 2010Foreign Exchange Contracts Other Expense $(8,920) $17,406 $(1,010)
The Company utilizes foreign exchange derivatives to limit its exposure to changes in exchange rates on certain assets denominated in foreign currencies. The Company marks its foreign investments to market each quarter based on current exchange rates and records the gain or loss through “Other expense” on its Consolidated Statements of Operations for loan investments or “Accumulated comprehensive income,” on its Consolidated Balance Sheets for net investments in foreign subsidiaries. Gains or losses on the related foreign exchange derivatives are recorded in “Other Expense,” as noted in the table above, and offset the marks taken on the assets. During the years ended December 31, 2012, 2011 and 2010, the Company recorded net losses related to foreign investments of $0.7 million, $2.3 million and $0.1 million, in its Consolidated Statements of Operations.
The following table presents the Company’s foreign currency derivatives outstanding as of December 31, 2012 ($ in thousands):
Derivative Type Notional AmountNotional
(USD Equivalent) MaturitySells EUR/Buys USD Forward €109,000 $143,925 January 2013Sells GBP/Buys USD Forward £52,850 $ 85,856 January 2013Sells CAD/Buys USD Forward C$50,700 $ 51,065 January 2013
Qualifying Cash Flow Hedges – In October 2012, the Company entered into an interest rate swap to convert its variable rate debt to fixed rate on a new $28.0 million secured term loan maturing in 2019. The following table presents the Company’s interest rate swap outstanding as of year ended December 31, 2012 ($ in thousands).
Derivative Type Notional Amount Variable Rate Fixed Rate MaturityInterest Rate Swap $28,000 LIBOR + 2.00% 3.75% November 2019
During the year ended December 31, 2012, the Company ter-minated its previously outstanding interest rate swaps in conjunction with the early repayment of its secured term loans (see also Note 8).
Over the next 12 months, the Company expects that $3.2 mil-lion of expense and $0.6 million of income related to terminated cash flow hedges, will be reclassified from “Accumulated other comprehen-sive income (loss)” into earnings.
Credit risk-related contingent features – The Company has agree-ments with each of its derivative counterparties that contain a provision where if the Company either defaults or is capable of being declared in default on any of its indebtedness, then the Company could also be declared in default on its derivative obligations.
In connection with its foreign currency derivatives, as of December 31, 2012 and December 31, 2011, the Company has posted collateral of $9.6 million, which is included in “Restricted cash” on the Company’s Consolidated Balance Sheets.

Note 11 – Equity
The Company’s charter provides for the issuance of up to 200.0 million shares of Common Stock, par value $0.001 per share and 30.0 million shares of preferred stock. As of December 31, 2012, 142.7 million common shares were issued and 83.8 million common shares were outstanding.
Preferred Stock – The Company had the following series of Cumulative Redeemable Preferred Stock outstanding as of December 31, 2012 and 2011:
Cumulative Preferential Cash Dividends (1) (2)
Series
Shares Issued and Outstanding
(in thousands) Par Value
Rate per Annum of the $25.00
Liquidation Preference
Equivalent to Fixed Annual Rate
(per share)D 4,000 $0.001 8.000% $2.00E 5,600 $0.001 7.875% $1.97F 4,000 $0.001 7.8% $1.95G 3,200 $0.001 7.65% $1.91I 5,000 $0.001 7.50% $1.88
21,800
Explanatory Notes:
(1) Holders of shares of the Series D, E, F, G and I preferred stock are entitled to receive dividends, when and as declared by the Board of Directors, out of funds legally available for the payment of dividends. Dividends are cumulative from the date of original issue and are payable quarterly in arrears on or before the 15th day of each March, June, September and December or, if not a business day, the next succeeding business day. Any dividend payable on the preferred stock for any partial dividend period will be computed on the basis of a 360-day year consisting of twelve 30-day months. Dividends will be payable to holders of record as of the close of business on the first day of the calendar month in which the appli-cable dividend payment date falls or on another date designated by the Board of Directors of the Company for the payment of dividends that is not more than 30 nor less than 10 days prior to the dividend payment date.
(2) The Company declared and paid dividends of $8.0 million, $11.0 million, $7.8 million, $6.1 million and $9.4 million on its Series D, E, F, G and I preferred stock, respectively, during each of the years ended December 31, 2012 and 2011, all of which qualified as return of capital for tax reporting purposes. There are no dividend arrearages on any of the preferred shares currently outstanding.
The Series D, E, F, G and I Cumulative Redeemable Preferred Stock are redeemable without premium at the option of the Company at their respective liquidation preferences.
High Performance Unit Program
In May 2002, the Company’s shareholders approved the iStar Financial High Performance Unit (“HPU”) Program. The program enti-tled employee participants (“HPU Holders”) to receive distributions if the total rate of return on the Company’s Common Stock (share price appreciation plus dividends) exceeded certain performance thresholds over a specified valuation period. The Company established seven HPU plans that had valuation periods ending between 2002 and 2008 and the Company has not established any new HPU plans since 2005. HPU Holders purchased interests in the High Performance Common Stock for an aggregate initial purchase price of $9.8 million. The remaining four plans that had valuation periods which ended in 2005, 2006, 2007 and 2008, did not meet their required performance thresholds, none of the plans were funded and the Company redeemed the participants’ units.
The 2002, 2003 and 2004 plans all exceeded their perfor-mance thresholds and are entitled to receive distributions equivalent to the amount of dividends payable on 819,254 shares, 987,149 shares and 1,031,875 shares, respectively, of the Company’s Common Stock as and when such dividends are paid on the Company’s Common Stock. Each of these three plans has 5,000 shares of High Performance Common Stock associated with it, which is recorded as a separate class of stock
within shareholders’ equity on the Company’s Consolidated Balance Sheets. High Performance Common Stock carries 0.25 votes per share. Net income allocable to common shareholders is reduced by the HPU holders’ share of earnings.
Dividends – In order to maintain its election to qualify as a REIT, the Company must currently distribute, at a minimum, an amount equal to 90% of its taxable income, excluding net capital gains, and must dis-tribute 100% of its taxable income (including net capital gains) to avoid paying corporate federal income taxes. The Company has recorded net operating losses and may record net operating losses in the future, which may reduce its taxable income in future periods and lower or elim-inate entirely the Company’s obligation to pay dividends for such peri-ods in order to maintain its REIT qualification. As of December 31, 2011, the Company had $423.9 million of net operating loss carryforwards at the corporate REIT level that can generally be used to offset both ordi-nary and capital taxable income in future years and will expire through 2031 if unused. The amount net of operating loss carryforwards as of December 31, 2012 will be subject to finalization of the 2012 tax returns. Because taxable income differs from cash flow from operations due to non-cash revenues and expenses (such as depreciation and cer-tain asset impairments), in certain circumstances, the Company may generate operating cash flow in excess of its dividends or, alternatively, may need to make dividend payments in excess of operating cash flows. The Company’s 2012 Secured Credit Facilities and 2011 Secured Credit Facilities permit the Company to distribute 100% of its REIT tax-able income on an annual basis, for so long as the Company maintains its qualification as a REIT. The 2012 and 2011 Secured Credit Facilities
62
-
63

restrict the Company from paying any common dividends if it ceases to qualify as a REIT. The Company did not declare or pay any Common Stock dividends for the years ended December 31, 2012 and 2011.
Stock Repurchase Programs – On May 15, 2012, the Company’s Board of Directors approved a stock repurchase program that autho-rized the repurchase of up to $20.0 million of its Common Stock from time to time in open market and privately negotiated purchases, includ-ing pursuant to one or more trading plans.
During the year ended December 31, 2012, the Company repurchased 0.8 million shares of its outstanding Common Stock for approximately $4.6 million, at an average cost of $5.69 per share. As of December 31, 2012, the Company had $16.0 million of Common Stock available to repurchase under its Board authorized stock repurchase programs.
Accumulated Other Comprehensive Income (Loss) – “Accumulated other comprehensive income (loss)” reflected in the Company’s share-holders’ equity is comprised of the following ($ in thousands):
As of December 31, 2012 2011Unrealized gains on
available-for-sale securities $ 867 $ 589Unrealized gains on cash flow hedges 607 1,986Unrealized losses on cumulative
translation adjustment (2,659) (2,903)Accumulated other comprehensive
income (loss) $(1,185) $ (328)
Note 12 – Stock-Based Compensation Plans and Employee Benefits
On May 27, 2009, the Company’s shareholders approved the Company’s 2009 Long-Term Incentive Plan (the “2009 LTIP”) which is designed to provide incentive compensation for officers, key employ-ees, directors and advisors of the Company. The 2009 LTIP provides for awards of stock options, shares of restricted stock, phantom shares, restricted stock units, dividend equivalent rights and other share-based performance awards. A maximum of 8,000,000 shares of Common Stock may be awarded under the 2009 LTIP, plus up to an additional 500,000 shares to the extent that a corresponding number of equity awards previously granted under the Company’s 1996 Long-Term Incentive Plan expire or are canceled or forfeited. All awards under the 2009 LTIP are made at the discretion of the Board of Directors or a committee of the Board of Directors.
The Company’s 2006 Long-Term Incentive Plan (the “2006 LTIP”) is designed to provide equity-based incentive compensation for officers, key employees, directors, consultants and advisors of the Company. The 2006 LTIP provides for awards of stock options, shares of restricted stock, phantom shares, dividend equivalent rights and other share-based performance awards. A maximum of 4,550,000 shares of Common Stock may be subject to awards under the 2006 LTIP provided that the number of shares of Common Stock reserved for grants of options designated as incentive stock options is 1.0 million, subject to certain anti-dilution provisions in the 2006 LTIP. All awards under this Plan are at the discretion of the Board of Directors or a committee of the Board of Directors.
The Company’s 2007 Incentive Compensation Plan (“Incentive Plan”) was approved and adopted by the Board of Directors in 2007 in order to establish performance goals for selected officers and other key employees and to determine bonuses that will be awarded to those officers and other key employees based on the extent to which they achieve those performance goals. Equity-based awards may be made under the Incentive Plan, subject to the terms of the Company’s equity incentive plans.
As of December 31, 2012, an aggregate of 4.1 million shares remain available for issuance pursuant to future awards under the Company’s 2006 and 2009 Long-Term Incentive Plans.
Stock-based compensation – The Company recorded stock-based compensation expense of $15.3 million, $29.7 million and $19.4 million for the years ended December 31, 2012, 2011 and 2010, respectively, in “General and administrative” on the Company’s Consolidated Statements of Operations. As of December 31, 2012, there was $10.1 million of total unrecognized compensation cost related to all unvested restricted stock units that is expected to be recognized over a weighted average remaining vesting/service period of 0.59 years.
Restricted Stock Units
Changes in non-vested restricted stock units during the year ended December 31, 2012 were as follows ($ in thousands, except per share amounts):
Number of Shares
Weighted Average Grant
Date Fair Value Per Share
Aggregate Intrinsic Value
Non-vested at December 31, 2011 9,985 $4.70
Granted – $ – Vested (4,595) $4.06 Forfeited (114) $5.99Non-vested at
December 31, 2012 5,276 $5.24 $43,000
The total fair value of restricted stock units vested during the years ended December 31, 2012, 2011 and 2010 was $29.1 million, $15.5 million and $1.7 million, respectively.
2012 Activity – During the year ended December 31, 2012, 4,594,572 restricted stock units vested and 2,610,816 were issued to employees, net of statutory minimum required tax withholdings. These vested restricted stock units were primarily comprised of 1,947,551 Amended Units which vested on January 1, 2012 (see below), 1,340,620 service-based restricted stock units granted to employees in February 2010 that cliff vested on February 17, 2012 and 806,518 performance-based restricted stock units granted to the Company’s Chairman and Chief Executive Officer in March 2010 that cliff vested on March 2, 2012. The performance-based units had certain performance and service conditions, relating to reductions in the Company’s general and admin-istrative expenses, retirement of debt and continued employment, which were satisfied during the year ended December 31, 2010.
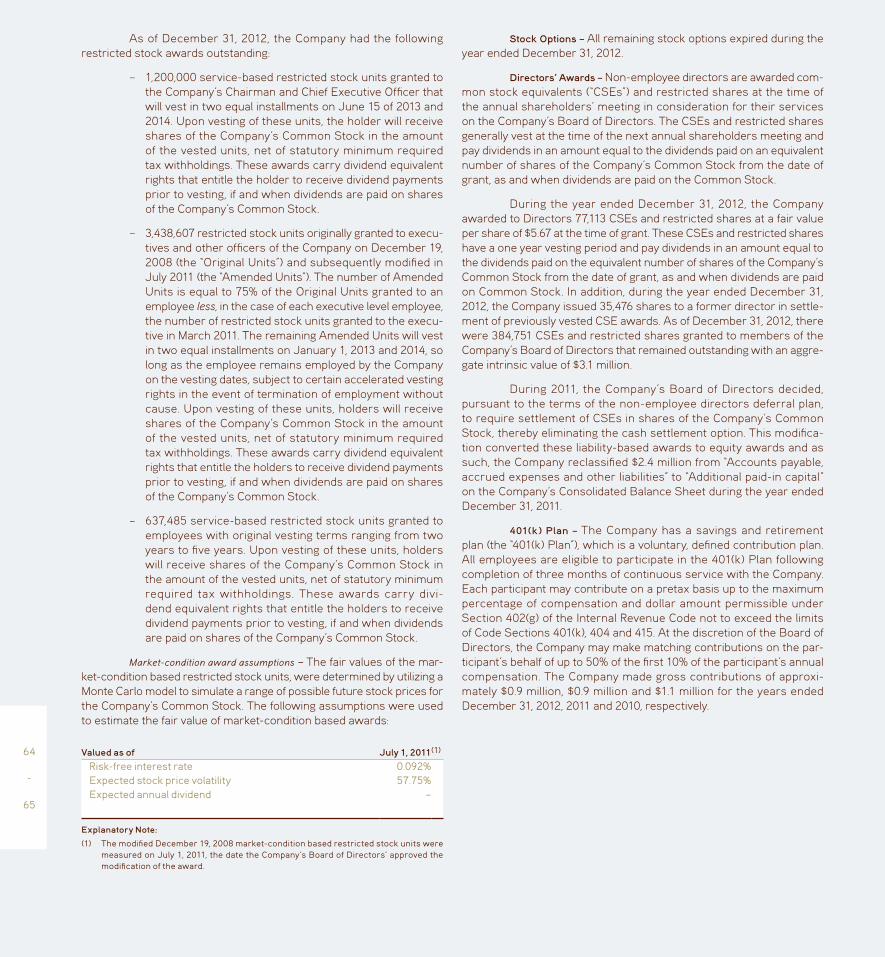
As of December 31, 2012, the Company had the following restricted stock awards outstanding:
– 1,200,000 service-based restricted stock units granted to the Company’s Chairman and Chief Executive Officer that will vest in two equal installments on June 15 of 2013 and 2014. Upon vesting of these units, the holder will receive shares of the Company’s Common Stock in the amount of the vested units, net of statutory minimum required tax withholdings. These awards carry dividend equivalent rights that entitle the holder to receive dividend payments prior to vesting, if and when dividends are paid on shares of the Company’s Common Stock.
– 3,438,607 restricted stock units originally granted to execu-tives and other officers of the Company on December 19, 2008 (the “Original Units”) and subsequently modified in July 2011 (the “Amended Units”). The number of Amended Units is equal to 75% of the Original Units granted to an employee less, in the case of each executive level employee, the number of restricted stock units granted to the execu-tive in March 2011. The remaining Amended Units will vest in two equal installments on January 1, 2013 and 2014, so long as the employee remains employed by the Company on the vesting dates, subject to certain accelerated vesting rights in the event of termination of employment without cause. Upon vesting of these units, holders will receive shares of the Company’s Common Stock in the amount of the vested units, net of statutory minimum required tax withholdings. These awards carry dividend equivalent rights that entitle the holders to receive dividend payments prior to vesting, if and when dividends are paid on shares of the Company’s Common Stock.
– 637,485 service-based restricted stock units granted to employees with original vesting terms ranging from two years to five years. Upon vesting of these units, holders will receive shares of the Company’s Common Stock in the amount of the vested units, net of statutory minimum required tax withholdings. These awards carry divi-dend equivalent rights that entitle the holders to receive dividend payments prior to vesting, if and when dividends are paid on shares of the Company’s Common Stock.
Market-condition award assumptions – The fair values of the mar-ket-condition based restricted stock units, were determined by utilizing a Monte Carlo model to simulate a range of possible future stock prices for the Company’s Common Stock. The following assumptions were used to estimate the fair value of market-condition based awards:
Valued as of July 1, 2011(1)
Risk-free interest rate 0.092%Expected stock price volatility 57.75%Expected annual dividend –
Explanatory Note:
(1) The modified December 19, 2008 market-condition based restricted stock units were measured on July 1, 2011, the date the Company’s Board of Directors’ approved the modification of the award.
Stock Options – All remaining stock options expired during the year ended December 31, 2012.
Directors’ Awards – Non-employee directors are awarded com-mon stock equivalents (“CSEs”) and restricted shares at the time of the annual shareholders’ meeting in consideration for their services on the Company’s Board of Directors. The CSEs and restricted shares generally vest at the time of the next annual shareholders meeting and pay dividends in an amount equal to the dividends paid on an equivalent number of shares of the Company’s Common Stock from the date of grant, as and when dividends are paid on the Common Stock.
During the year ended December 31, 2012, the Company awarded to Directors 77,113 CSEs and restricted shares at a fair value per share of $5.67 at the time of grant. These CSEs and restricted shares have a one year vesting period and pay dividends in an amount equal to the dividends paid on the equivalent number of shares of the Company’s Common Stock from the date of grant, as and when dividends are paid on Common Stock. In addition, during the year ended December 31, 2012, the Company issued 35,476 shares to a former director in settle-ment of previously vested CSE awards. As of December 31, 2012, there were 384,751 CSEs and restricted shares granted to members of the Company’s Board of Directors that remained outstanding with an aggre-gate intrinsic value of $3.1 million.
During 2011, the Company’s Board of Directors decided, pursuant to the terms of the non-employee directors deferral plan, to require settlement of CSEs in shares of the Company’s Common Stock, thereby eliminating the cash settlement option. This modifica-tion converted these liability-based awards to equity awards and as such, the Company reclassified $2.4 million from “Accounts payable, accrued expenses and other liabilities” to “Additional paid-in capital” on the Company’s Consolidated Balance Sheet during the year ended December 31, 2011.
401(k) Plan – The Company has a savings and retirement plan (the “401(k) Plan”), which is a voluntary, defined contribution plan. All employees are eligible to participate in the 401(k) Plan following completion of three months of continuous service with the Company. Each participant may contribute on a pretax basis up to the maximum percentage of compensation and dollar amount permissible under Section 402(g) of the Internal Revenue Code not to exceed the limits of Code Sections 401(k), 404 and 415. At the discretion of the Board of Directors, the Company may make matching contributions on the par-ticipant’s behalf of up to 50% of the first 10% of the participant’s annual compensation. The Company made gross contributions of approxi-mately $0.9 million, $0.9 million and $1.1 million for the years ended December 31, 2012, 2011 and 2010, respectively.
64
-
65

Note 13 – Earnings Per Share
EPS is calculated using the two-class method, which allocates earnings among common stock and participating securities to calcu-late EPS when an entity’s capital structure includes either two or more classes of common stock or common stock and participating securi-ties. HPU holders are current and former Company employees who
purchased high performance common stock units under the Company’s High Performance Unit (HPU) Program (see Note 11). These HPU units are treated as a separate class of common stock.
The following table presents a reconciliation of income (loss) from continuing operations used in the basic and diluted earnings per share calculations ($ in thousands, except for per share data):
For the Years Ended December 31, 2012 2011 2010Income (loss) from continuing operations $(312,694) $(49,206) $(206,997)Net (income) loss attributable to noncontrolling interests 1,500 3,629 (523)Income from sales of residential property 63,472 5,721 – Preferred dividends (42,320) (42,320) (42,320)Income (loss) from continuing operations attributable to iStar Financial Inc. and allocable to
common shareholders, HPU holders and Participating Security Holders $(290,042) $(82,176) $(249,840)

For the Years Ended December 31, 2012 2011 2010Earnings allocable to common shares:Numerator for basic earnings per share:Income (loss) from continuing operations attributable to iStar Financial Inc.
and allocable to common shareholders $(280,534) $(79,627) $(242,440)Income (loss) from discontinued operations (18,826) (7,091) 16,324Gain from discontinued operations 26,363 24,331 262,395Net income (loss) attributable to iStar Financial Inc. and allocable to common shareholders $(272,997) $(62,387) $ 36,279Numerator for diluted earnings per share:Income (loss) from continuing operations attributable to iStar Financial Inc.
and allocable to common shareholders $(280,534) $(79,627) $(242,440)Income (loss) from discontinued operations (18,826) (7,091) 16,324Gain from discontinued operations 26,363 24,331 262,395Net income (loss) attributable to iStar Financial Inc. and allocable to common shareholders $(272,997) $(62,387) $ 36,279Denominator for basic and diluted earnings per share:Weighted average common shares outstanding for basic earnings per common share 83,742 88,688 93,244Add: effect of assumed shares issued under treasury stock method for restricted shares – – – Add: effect of joint venture shares – – – Weighted average common shares outstanding for diluted earnings per common share 83,742 88,688 93,244Basic earnings per common share:Income (loss) from continuing operations attributable to iStar Financial Inc.
and allocable to common shareholders $ (3.35) $ (0.89) $ (2.60)Income (loss) from discontinued operations (0.22) (0.08) 0.18Gain from discontinued operations 0.31 0.27 2.81Net income (loss) attributable to iStar Financial Inc. and allocable to common shareholders $ (3.26) $ (0.70) $ 0.39Diluted earnings per common share:Income (loss) from continuing operations attributable to iStar Financial Inc.
and allocable to common shareholders $ (3.35) $ (0.89) $ (2.60)Income (loss) from discontinued operations (0.22) (0.08) 0.18Gain from discontinued operations 0.31 0.27 2.81Net income (loss) attributable to iStar Financial Inc. and allocable to common shareholders $ (3.26) $ (0.70) $ 0.39
For the Years Ended December 31, 2012 2011 2010Earnings allocable to High Performance Units:Numerator for basic earnings per HPU share:Income (loss) from continuing operations attributable to iStar Financial Inc.
and allocable to HPU holders $ (9,509) $ (2,549) $ (7,400)Income (loss) from discontinued operations (638) (227) 497Gain from discontinued operations 894 779 7,987Net income (loss) attributable to iStar Financial Inc. and allocable to HPU holders $ (9,253) $ (1,997) $ 1,084Numerator for diluted earnings per HPU share:Income (loss) from continuing operations attributable to iStar Financial Inc.
and allocable to HPU holders $ (9,509) $ (2,549) $ (7,400)Income (loss) from discontinued operations (638) (227) 497Gain from discontinued operations 894 779 7,987Net income (loss) attributable to iStar Financial Inc. and allocable to HPU holders $ (9,253) $ (1,997) $ 1,084Denominator for basic and diluted earnings per HPU share:Weighted average High Performance Units outstanding for basic and diluted earnings per share 15 15 15Basic earnings per HPU share:Income (loss) from continuing operations attributable to iStar Financial Inc.
and allocable to HPU holders $ (633.94) $(169.93) $ (493.33)Income (loss) from discontinued operations (42.53) (15.13) 33.13Gain from discontinued operations 59.60 51.93 532.47Net income (loss) attributable to iStar Financial Inc. and allocable to HPU holders $ (616.87) $(133.13) $ 72.27Diluted earnings per HPU share:Income (loss) from continuing operations attributable to iStar Financial Inc.
and allocable to HPU holders $ (633.94) $(169.93) $ (493.33)Income (loss) from discontinued operations (42.53) (15.13) 33.13Gain from discontinued operations 59.60 51.93 532.47Net income (loss) attributable to iStar Financial Inc. and allocable to HPU holders $ (616.87) $(133.13) $ 72.27
66
-
67

For the years ended December 31, 2012, 2011 and 2010 the following shares were anti-dilutive ($ in thousands):
For the Years Ended December 31, 2012 2011 2010Joint venture shares 298 298 298Stock options – 44 143
Note 14 – Fair Values
Fair value represents the price that would be received to sell an asset or paid to transfer a liability in an orderly transaction between market participants at the measurement date. The following fair value hierarchy prioritizes the inputs to be used in valuation techniques to measure fair value:
Level 1: Unadjusted quoted prices in active markets that are accessible at the measurement date for identical, unrestricted assets or liabilities;
Level 2: Quoted prices in markets that are not active, or inputs which are observable, either directly or indirectly, for substantially the full term of the asset or liability; and
Level 3: Prices or valuation techniques that require inputs that are both significant to the fair value measurement and unobservable (i.e., supported by little or no market activity).
Certain of the Company’s assets and liabilities are recorded at fair value either on a recurring or non-recurring basis. Assets required to be marked-to-market and reported at fair value every reporting period are classified as being valued on a recurring basis. Other assets not required to be recorded at fair value every period may be recorded at fair value if a specific provision or other impairment is recorded within the period to mark the carrying value of the asset to market as of the reporting date. Such assets are classified as being valued on a non-recurring basis.
The following fair value hierarchy table summarizes the Company’s assets and liabilities recorded at fair value on a recurring and non-recurring basis by the above categories ($ in thousands):
Fair Value Using
Total
Quoted Market Prices in
Active Markets (Level 1)
Significant Other
Observable Inputs
(Level 2)
Significant Unobservable
Inputs (Level 3)
As of December 31, 2012Recurring basis: Derivative liabilities $ 3,435 $ – $3,435 $ – Non-recurring basis: Impaired loans $ 57,201 $ – $ – $ 57,201 Impaired real estate $ 31,597 $ – $7,649 $ 23,948As of December 31, 2011Recurring basis: Derivative liabilities $ 2,373 $ – $ 2,373 $ – Non-recurring basis: Impaired loans $271,968 $ – $ – $271,968 Impaired real estate $ 43,660 $ – $ – $ 43,660
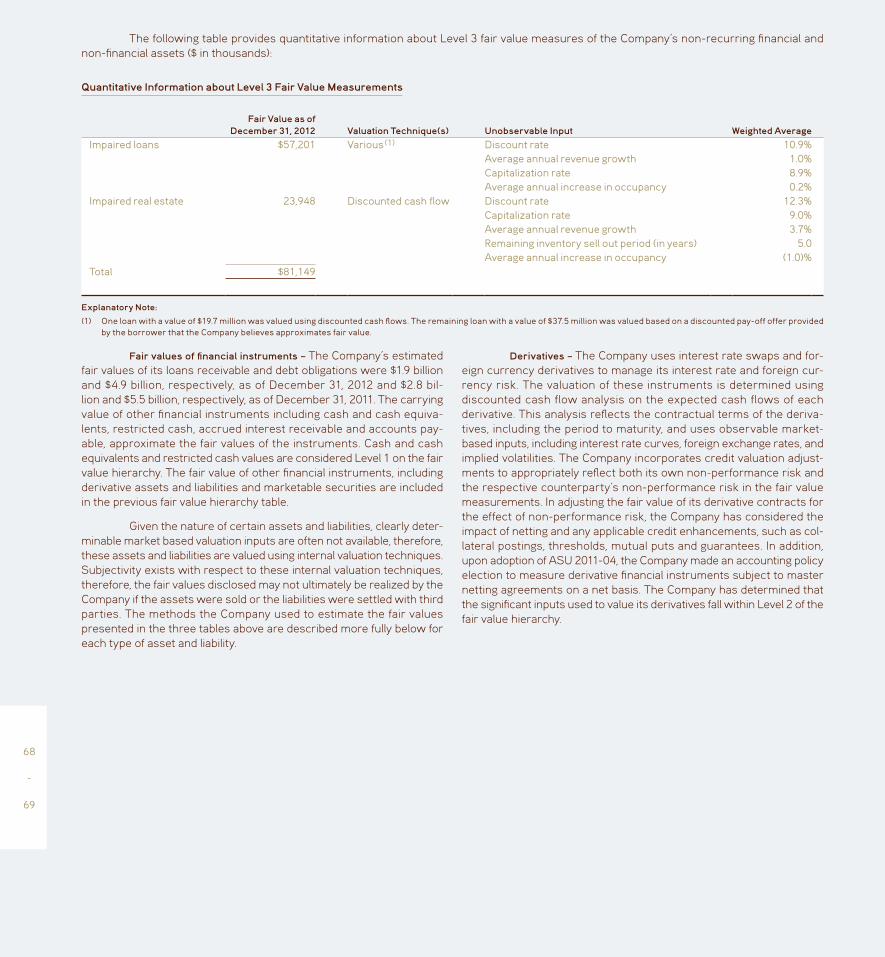
The following table provides quantitative information about Level 3 fair value measures of the Company’s non-recurring financial and non-financial assets ($ in thousands):
Quantitative Information about Level 3 Fair Value Measurements
Fair Value as of December 31, 2012 Valuation Technique(s) Unobservable Input Weighted Average
Impaired loans $57,201 Various (1) Discount rate 10.9%Average annual revenue growth 1.0%Capitalization rate 8.9%Average annual increase in occupancy 0.2%
Impaired real estate 23,948 Discounted cash flow Discount rate 12.3%Capitalization rate 9.0%Average annual revenue growth 3.7%Remaining inventory sell out period (in years) 5.0Average annual increase in occupancy (1.0)%
Total $81,149
Explanatory Note:
(1) One loan with a value of $19.7 million was valued using discounted cash flows. The remaining loan with a value of $37.5 million was valued based on a discounted pay-off offer provided by the borrower that the Company believes approximates fair value.
Fair values of financial instruments – The Company’s estimated fair values of its loans receivable and debt obligations were $1.9 billion and $4.9 billion, respectively, as of December 31, 2012 and $2.8 bil-lion and $5.5 billion, respectively, as of December 31, 2011. The carrying value of other financial instruments including cash and cash equiva-lents, restricted cash, accrued interest receivable and accounts pay-able, approximate the fair values of the instruments. Cash and cash equivalents and restricted cash values are considered Level 1 on the fair value hierarchy. The fair value of other financial instruments, including derivative assets and liabilities and marketable securities are included in the previous fair value hierarchy table.
Given the nature of certain assets and liabilities, clearly deter-minable market based valuation inputs are often not available, therefore, these assets and liabilities are valued using internal valuation techniques. Subjectivity exists with respect to these internal valuation techniques, therefore, the fair values disclosed may not ultimately be realized by the Company if the assets were sold or the liabilities were settled with third parties. The methods the Company used to estimate the fair values presented in the three tables above are described more fully below for each type of asset and liability.
Derivatives – The Company uses interest rate swaps and for-eign currency derivatives to manage its interest rate and foreign cur-rency risk. The valuation of these instruments is determined using discounted cash flow analysis on the expected cash flows of each derivative. This analysis reflects the contractual terms of the deriva-tives, including the period to maturity, and uses observable market-based inputs, including interest rate curves, foreign exchange rates, and implied volatilities. The Company incorporates credit valuation adjust-ments to appropriately reflect both its own non-performance risk and the respective counterparty’s non-performance risk in the fair value measurements. In adjusting the fair value of its derivative contracts for the effect of non-performance risk, the Company has considered the impact of netting and any applicable credit enhancements, such as col-lateral postings, thresholds, mutual puts and guarantees. In addition, upon adoption of ASU 2011-04, the Company made an accounting policy election to measure derivative financial instruments subject to master netting agreements on a net basis. The Company has determined that the significant inputs used to value its derivatives fall within Level 2 of the fair value hierarchy.
68
-
69

Impaired loans – The Company’s loans identified as being impaired are nearly all collateral dependent loans and are evaluated for impairment by comparing the estimated fair value of the underly-ing collateral, less costs to sell, to the carrying value of each loan. Due to the nature of the individual properties collateralizing the Company’s loans, the Company generally uses a discounted cash flow methodol-ogy through internally developed valuation models to estimate the fair value of the collateral. This approach requires the Company to make judgments in respect to significant unobservable inputs, which may include discount rates, capitalization rates and the timing and amounts of estimated future cash flows. For income producing properties, cash flows generally include property revenues, operating costs and capital expenditures that are based on current observable market rates and estimates for market rate growth and occupancy levels. For other real estate, cash flows may include lot and unit sales that are based on cur-rent observable market rates and estimates for annual revenue growth, operating costs and costs of completion and the remaining inventory sell out periods. The Company will also consider market comparables if available. In more limited cases, the Company obtains external “as is” appraisals for loan collateral, generally when third party participations exist, and appraised values may be discounted when real estate markets rapidly deteriorate. The Company has determined that significant inputs used in its internal valuation models and appraisals fall within Level 3 of the fair value hierarchy.
Impaired real estate – If the Company determines a real estate asset available and held for sale is impaired, it records an impairment charge to adjust the asset to its estimated fair market value less costs to sell. Due to the nature of individual real estate properties, the Company generally uses a discounted cash flow methodology through internally developed valuation models to estimate the fair value of the assets. This approach requires the Company to make judgments with respect to significant unobservable inputs, which may include discount rates, capi-talization rates and the timing and amounts of estimated future cash flows. For income producing properties, cash flows generally include property revenues, operating costs and capital expenditures that are based on current observable market rates and estimates for market rate growth and occupancy levels. For other real estate, cash flows may include lot and unit sales that are based on current observable market rates and estimates for annual market rate growth, operating costs and costs of completion and the remaining inventory sell out periods. The Company will also consider market comparables if available. In more limited cases, the Company obtains external “as is” appraisals for real estate assets and appraised values may be discounted when real estate markets rapidly deteriorate. The Company has determined that signifi-cant inputs used in its internal valuation models and appraisals fall within Level 3 of the fair value hierarchy. Additionally, in certain cases, if the Company is under contract to sell an asset, it will mark the asset to the contracted sales price less costs to sell. The Company considers this to be a Level 2 input under the fair value hierarchy.
Loans receivable – The Company estimates the fair value of its performing loans using a discounted cash flow methodology. This method discounts estimated future cash flows using rates manage-ment determines best reflect current market interest rates that would be offered for loans with similar characteristics and credit quality. The Company determined that the significant inputs used to value its loans and other lending investments fall within Level 3 of the fair value hierarchy.
Debt obligations, net – For debt obligations traded in secondary markets, the Company uses market quotes, to the extent they are avail-able, to determine fair value. For debt obligations not traded in secondary markets, the Company determines fair value using a discounted cash flow methodology, whereby contractual cash flows are discounted at rates that management determines best reflect current market inter-est rates that would be charged for debt with similar characteristics and credit quality. The Company has determined that the inputs used to value its debt obligations under the discounted cash flow methodology fall within Level 3 of the fair value hierarchy.
Note 15 – Segment Reporting
The Company has determined that it has four reportable seg-ments based on how management reviews and manages its business. These reportable segments include: Real Estate Finance, Net Leasing, Operating Properties and Land. The Real Estate Finance segment includes all of the Company’s activities related to senior and mezzanine real estate loans. The Net Leasing segment includes all of the Company’s activities related to the ownership and leasing of corporate facilities to single creditworthy tenants. The Operating Properties segment includes all of the Company’s activities and operations related to its commercial and residential properties. The Land segment includes the Company’s activities related to its developable land portfolio.
The Company evaluates performance based on the follow-ing financial measures for each segment, and has conformed the prior periods presentation for the change in composition of its business seg-ments, ($ in thousands):

For the Year Ended December 31, 2012Real Estate
Finance Net LeasingOperating Property Land
Corporate/Other (1)
Company Total
Operating lease income $ – $ 151,992 $ 65,500 $ 1,527 $ – $ 219,019Interest income 133,410 – – – – 133,410Other income 8,613 – 32,820 2,635 3,975 48,043 Total revenue $ 142,023 $ 151,992 $ 98,320 $ 4,162 $ 3,975 $ 400,472Earnings (loss) from equity method investments – 2,632 25,142 (6,138) 81,373 103,009Income from sales of residential property – – 63,472 – – 63,472Net operating income from discontinued
operations (2) – 4,725 886 – – 5,611Gain from discontinued operations – 27,257 – – – 27,257 Revenue and other earnings $ 142,023 $ 186,606 $ 187,820 $ (1,976) $ 85,348 $ 599,821Real estate expense – (24,255) (100,258) (27,314) – (151,827)Other expense (4,775) – – – (12,491) (17,266) Direct expenses $ (4,775) $ (24,255) $ (100,258) $ (27,314) $ (12,491) $ (169,093) Direct segment profit (loss) $ 137,248 $ 162,351 $ 87,562 $ (29,290) $ 72,857 $ 430,728Allocated interest expense (3) (124,208) (83,658) (66,001) (43,993) (38,301) (356,161)Allocated general and administrative (4) (14,998) (9,484) (7,760) (7,405) (25,916) (65,563) Segment profit (loss) (5) $ (1,958) $ 69,209 $ 13,801 $ (80,688) $ 8,640 $ 9,004Other significant non-cash items: Provision for loan losses $ 81,740 $ – $ – $ – $ – $ 81,740 Impairment of assets (3) $ – $ 6,670 $ 28,501 $ 205 $ 978 $ 36,354 Depreciation and amortization (3) $ – $ 39,250 $ 28,450 $ 1,276 $ 1,810 $ 70,786Capitalized expenditures $ – $ 10,994 $ 51,579 $ 20,497 $ – $ 83,070As of December 31, 2012 Real estate Real estate, at cost $ – $1,639,320 $ 801,214 $786,114 $ – $3,226,648 Less: accumulated depreciation – (315,699) (109,634) (2,292) – (427,625) Real estate, net $ – $1,323,621 $ 691,580 $783,822 $ – $2,799,023 Real estate available and held for sale – – 454,587 181,278 – 635,865 Total real estate $ – $1,323,621 $1,146,167 $965,100 $ – $3,434,888 Loans receivable, net 1,829,985 – – – – 1,829,985 Other investments – 16,380 25,745 5,493 351,225 398,843Total portfolio assets $1,829,985 $1,340,001 $1,171,912 $970,593 $351,225 $5,663,716 Cash and other assets 9,832 105,595 60,500 9,638 301,508 487,073 Total assets $1,839,817 $1,445,596 $1,232,412 $980,231 $652,733 $6,150,789
70
-
71
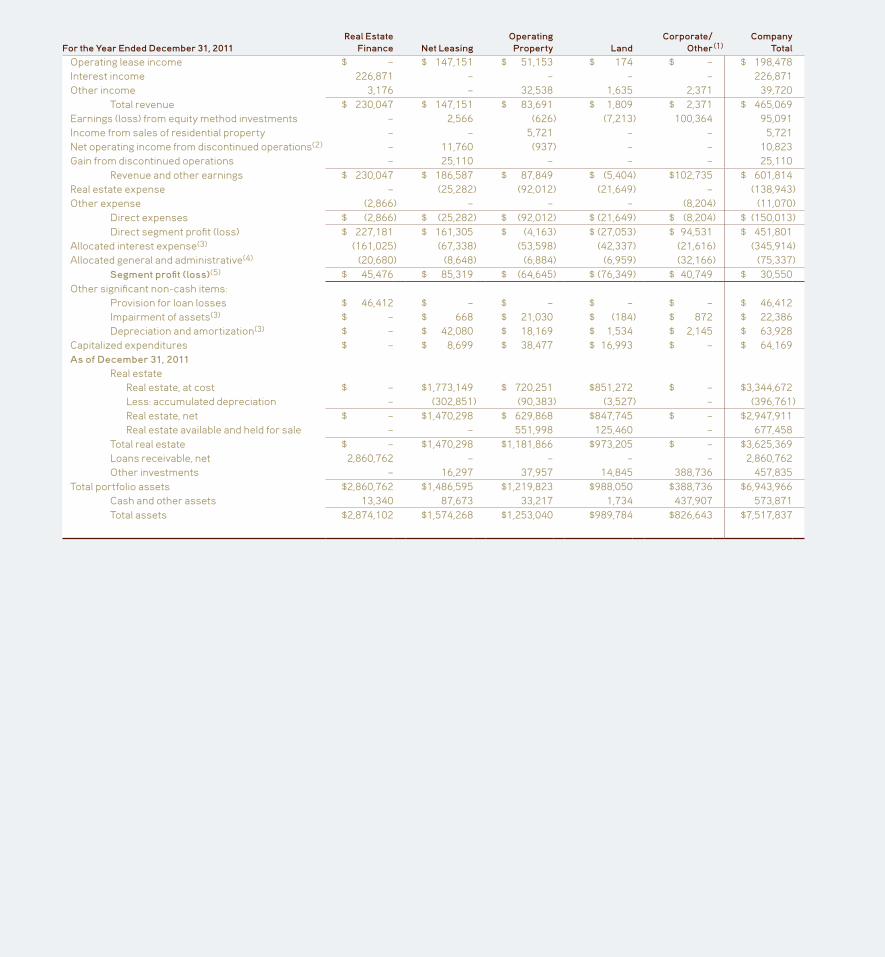
For the Year Ended December 31, 2011Real Estate
Finance Net LeasingOperating Property Land
Corporate/Other (1)
Company Total
Operating lease income $ – $ 147,151 $ 51,153 $ 174 $ – $ 198,478Interest income 226,871 – – – – 226,871Other income 3,176 – 32,538 1,635 2,371 39,720 Total revenue $ 230,047 $ 147,151 $ 83,691 $ 1,809 $ 2,371 $ 465,069Earnings (loss) from equity method investments – 2,566 (626) (7,213) 100,364 95,091Income from sales of residential property – – 5,721 – – 5,721Net operating income from discontinued operations (2) – 11,760 (937) – – 10,823Gain from discontinued operations – 25,110 – – – 25,110 Revenue and other earnings $ 230,047 $ 186,587 $ 87,849 $ (5,404) $102,735 $ 601,814Real estate expense – (25,282) (92,012) (21,649) – (138,943)Other expense (2,866) – – – (8,204) (11,070) Direct expenses $ (2,866) $ (25,282) $ (92,012) $ (21,649) $ (8,204) $ (150,013) Direct segment profit (loss) $ 227,181 $ 161,305 $ (4,163) $ (27,053) $ 94,531 $ 451,801Allocated interest expense (3) (161,025) (67,338) (53,598) (42,337) (21,616) (345,914)Allocated general and administrative (4) (20,680) (8,648) (6,884) (6,959) (32,166) (75,337) Segment profit (loss) (5) $ 45,476 $ 85,319 $ (64,645) $ (76,349) $ 40,749 $ 30,550Other significant non-cash items: Provision for loan losses $ 46,412 $ – $ – $ – $ – $ 46,412 Impairment of assets (3) $ – $ 668 $ 21,030 $ (184) $ 872 $ 22,386 Depreciation and amortization (3) $ – $ 42,080 $ 18,169 $ 1,534 $ 2,145 $ 63,928Capitalized expenditures $ – $ 8,699 $ 38,477 $ 16,993 $ – $ 64,169As of December 31, 2011 Real estate Real estate, at cost $ – $1,773,149 $ 720,251 $851,272 $ – $3,344,672 Less: accumulated depreciation – (302,851) (90,383) (3,527) – (396,761) Real estate, net $ – $1,470,298 $ 629,868 $847,745 $ – $2,947,911 Real estate available and held for sale – – 551,998 125,460 – 677,458 Total real estate $ – $1,470,298 $1,181,866 $973,205 $ – $3,625,369 Loans receivable, net 2,860,762 – – – – 2,860,762 Other investments – 16,297 37,957 14,845 388,736 457,835Total portfolio assets $2,860,762 $1,486,595 $1,219,823 $988,050 $388,736 $6,943,966 Cash and other assets 13,340 87,673 33,217 1,734 437,907 573,871 Total assets $2,874,102 $1,574,268 $1,253,040 $989,784 $826,643 $7,517,837

For the Year Ended December 31, 2010Real Estate
Finance Net LeasingOperating Property Land
Corporate/Other (1)
Company Total
Operating lease income $ – $ 146,599 $ 39,623 $ 408 $ – $ 186,630Interest income 364,094 – – – – 364,094Other income 13,750 – 33,403 643 2,937 50,733 Total revenue $ 377,844 $ 146,599 $ 73,026 $ 1,051 $ 2,937 $ 601,457Earnings (loss) from equity method investments – 2,522 – – 49,386 51,908Income from sales of residential property – – – – – – Net operating income from discontinued operations (2) – 73,233 (541) – – 72,692Gain from discontinued operations – 270,382 – – – 270,382Revenue and other earnings $ 377,844 $ 492,736 $ 72,485 $ 1,051 $ 52,323 $ 996,439Real estate expense – (21,223) (85,097) (15,079) – (121,399)Other expense (10,107) – – – (5,948) (16,055) Direct expenses $ (10,107) $ (21,223) $ (85,097) $ (15,079) $ (5,948) $ (137,454) Direct segment profit (loss) $ 367,737 $ 471,513 $ (12,612) $ (14,028) $ 46,375 $ 858,985Allocated interest expense (3) (174,074) (62,094) (39,957) (30,445) (39,930) (346,500)Allocated general and administrative (4) (28,833) (10,285) (6,618) (5,261) (39,173) (90,170)Segment profit (loss) (5) $ 164,830 $ 399,134 $ (59,187) $ (49,734) $ (32,728) $ 422,315Other significant non-cash items: Provision for loan losses $ 331,487 $ – $ – $ – $ – $ 331,487 Impairment of assets (3) $ – $ 6,063 $ 18,988 $ 100 $ (2,770) $ 22,381 Depreciation and amortization (3) $ – $ 48,973 $ 17,050 $ 1,037 $ 3,726 $ 70,786Capitalized expenditures $ – $ 13,475 $ 18,894 $ 10,494 $ – $ 42,863As of December 31, 2010 Real estate Real estate, at cost $ – $1,834,172 $ 470,989 $693,477 $ – $2,998,638 Less: accumulated depreciation – (284,489) (70,074) (2,037) – (356,600) Real estate, net $ – $1,549,683 $ 400,915 $691,440 $ – $2,642,038 Real estate available and held for sale – – 631,920 114,161 – 746,081 Total real estate $ – $1,549,683 $1,032,835 $805,601 $ – $3,388,119 Loans receivable, net 4,587,352 – – – – 4,587,352 Other investments – 16,128 – – 516,230 532,358Total portfolio assets $4,587,352 $1,565,811 $1,032,835 $805,601 $ 516,230 $8,507,829 Cash and other assets 21,710 78,337 25,122 500 541,016 666,685 Total assets $4,609,062 $1,644,148 $1,057,957 $806,101 $1,057,246 $9,174,514
Explanatory Notes:
(1) Corporate/Other represents all corporate level and unallocated items including any intercompany eliminations necessary to reconcile to consolidated Company totals. This caption also includes the Company’s joint venture investments and strategic investments that are not related to the other reportable segments above, including the Company’s equity invest-ment in LNR of $205.8 million and $159.8 million, as of December 31, 2012 and 2011, respectively, and the Company’s share of equity in earnings from LNR of $60.7 million, $53.9 million and $1.8 million for the years ended December 31, 2012, 2011 and 2010, respectively. See Note 6 for further details on the Company’s investment in LNR and summarized financial information of LNR.
(2) Includes revenue and real estate expense reclassified to discontinued operations on the Company’s Consolidated Statements of Operations.(3) Includes related amounts reclassified to discontinued operations on the Company’s Consolidated Statements of Operations.(4) General and administrative excludes stock-based compensation expense of $15.3 million, $29.7 million and $19.4 million for the years ended December 31, 2012, 2011 and 2010, respectively.(5) The following is a reconciliation of segment profit (loss) to net income (loss) ($ in thousands):
For the Years Ended December 31, 2012 2011 2010Segment profit (loss) $ 9,004 $ 30,550 $ 422,315 Less: Provision for loan losses (81,740) (46,412) (331,487) Less: Impairment of assets (36,354) (22,386) (22,381) Less: Stock-based compensation expense (15,293) (29,702) (19,355) Less: Depreciation and amortization (70,786) (63,928) (70,786) Less: Income tax (expense) benefit (8,445) 4,719 (7,023) Add: Gain (loss) on early extinguishment of debt, net (37,816) 101,466 108,923Net income (loss) $(241,430) $ (25,693) $ 80,206
72
-
73

Note 16 – Quarterly Financial Information (Unaudited)
The following table sets forth the selected quarterly financial data for the Company ($ in thousands, except per share amounts).
For the Quarters Ended December 31, September 30, June 30, March 31, 2012 (1):Revenue $ 93,713 $ 95,159 $108,647 $102,953Net income (loss) $ (79,948) $ (64,306) $ (51,129) $ (46,048)Earnings per common share data: Net income (loss) attributable to iStar Financial Inc. $ (87,424) $ (71,784) $ (58,996) $ (54,792) Basic earnings per share $ (1.04) $ (0.86) $ (0.70) $ (0.66) Diluted earnings per share $ (1.04) $ (0.86) $ (0.70) $ (0.66) Weighted average number of common shares – basic 83,674 83,629 84,113 83,556 Weighted average number of common shares – diluted 83,674 83,629 84,113 83,556Earnings per HPU share data: Net income (loss) attributable to iStar Financial Inc. $ (2,966) $ (2,436) $ (1,991) $ (1,861) Basic earnings per share $ (197.73) $ (162.40) $ (132.73) $ (124.07) Diluted earnings per share $ (197.73) $ (162.40) $ (132.73) $ (124.07) Weighted average number of HPU shares – basic and diluted 15 15 15 152011 (2):Revenue $104,731 $105,841 $ 136,610 $ 117,887Net income (loss) $ (28,915) $ (54,661) $ (26,020) $ 83,902Earnings per common share data: Net income (loss) attributable to iStar Financial Inc. $ (35,202) $ (62,231) $ (35,525) $ 67,420 Basic earnings per share $ (0.43) $ (0.71) $ (0.38) $ 0.73 Diluted earnings per share $ (0.43) $ (0.71) $ (0.38) $ 0.71 Weighted average number of common shares – basic 81,769 87,951 92,621 92,458 Weighted average number of common shares – diluted 81,769 87,951 92,621 94,609Earnings per HPU share data: Net income (loss) attributable to iStar Financial Inc. $ (1,222) $ (2,008) $ (1,089) $ 2,070 Basic earnings per share $ (81.47) $ (133.87) $ (72.60) $ 138.00 Diluted earnings per share $ (81.47) $ (133.87) $ (72.60) $ 135.07 Weighted average number of HPU shares – basic and diluted 15 15 15 15
Explanatory Notes:
(1) During the quarter ended December 31, 2012, the Company recorded a loss on early extinguishment of debt of $31.0 million primarily related to a prepayment penalty on the early repayment of 8.625% Senior Notes, as well as a loss due to the acceleration of unamortized fees and discounts related to the refinancing of the 2011 Secured Credit Facilities (see Note 8). The Company also recorded $27.9 million related to Income from sales of residential property. During the quarter ended March 31, 2012, the Madison Funds recorded a signifi-cant gain related to the sale of an investment for which the Company recorded its $13.7 million proportionate share.
(2) During the quarter ended December 31, 2011, the Company sold a substantial portion of its interests in Oak Hill Advisors, L.P. and related entities which resulted in a net gain of $30.3 million (see Note 6). During the quarter ended June 30, 2011, the Company recorded interest income of $26.3 million related to certain non-performing loans that were resolved, including interest not previously recorded due to the loans being on non-accrual status. During the quarter ended March 31, 2011, the Company recorded a gain on early extinguish-ment of debt of $109.0 million for the redemption of its $312.3 million remaining principal amount of 10% senior secured notes due June 2014.

Note 17 – Subsequent Events
On January 24, 2013, the Company signed a definitive agree-ment to sell LNR Property LLC, for approximately $220.0 million in net proceeds after closing costs and LNR management incentives. This transaction is expected to close during the second quarter of 2013, subject to customary closing conditions.
On February 11, 2013, the Company entered into a $1.71 bil-lion senior secured credit facility due October 15, 2017 that amends and restates its October 2012 Secured Credit Facility. In connection with the repricing, the Company paid the original lenders a prepayment fee of approximately $17.1 million. The new facility amends the October 2012 Secured Credit Facility by (i) reducing the annual interest rate from LIBOR + 4.50%, with a 1.25% LIBOR floor to LIBOR + 3.50%, with a 1.00% LIBOR floor; and (ii) extending the call protection period for lend-ers from October 15, 2013 to December 31, 2013. All other terms of the credit facility remained the same.
Performance Graph
The following graph compares the total cumulative share-holder returns on our Common Stock from December 31, 2007 to December 31, 2012 to that of: (1) the Standard & Poor’s 500 Index (the “S&P 500”); and (2) the Standard & Poor’s 500 Financials Index (the “S&P 500 Financials”). Our prior comparative index, the Russell 1000 Financial Services Index, was discontinued on October 1, 2010.
$100.0
$44.7
$9.8
$52.4
$79.7
$58.8
$48.8
$62.9
$91.7$93.6
$108.6
$63.0
$11.2
$34.2 $35.7
$23.2
12/31/07 12/31/08 12/31/09 12/31/10 12/31/11 12/31/12
iStar Financial S&P 500 S&P 500 Financials
PERFORMANCE GRAPH
74
-
75
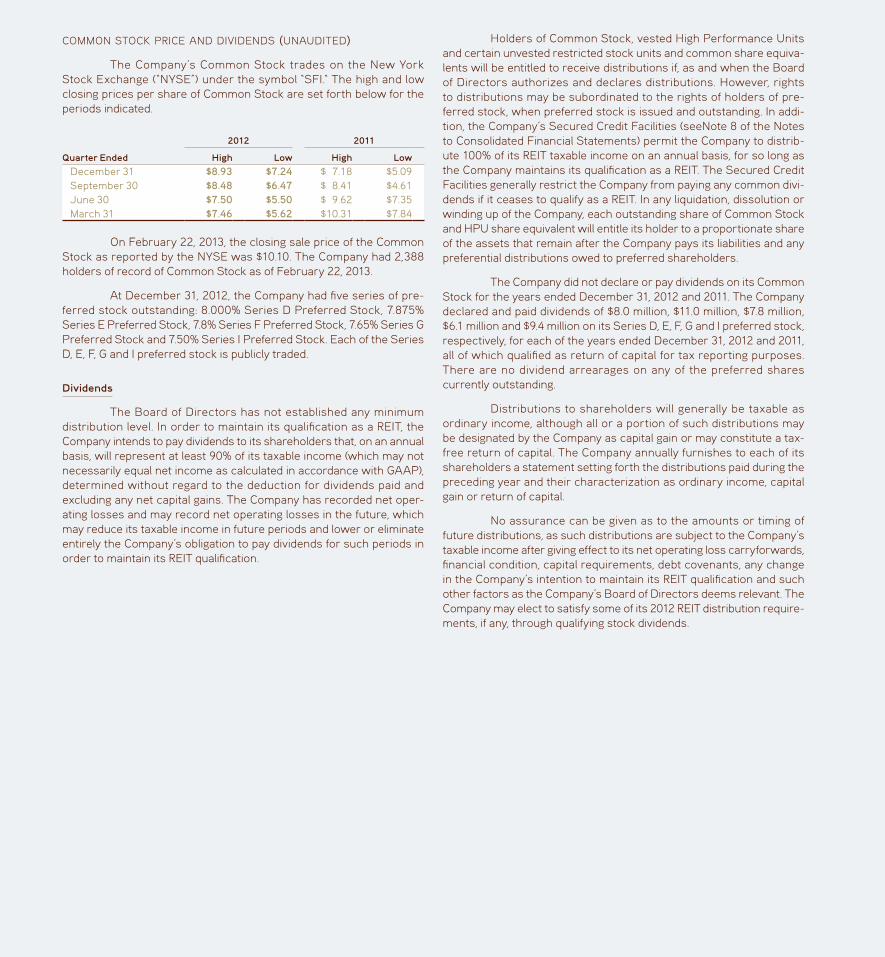
common stock price and dividends (unaudited)
The Company’s Common Stock trades on the New York Stock Exchange (“NYSE”) under the symbol “SFI.“ The high and low closing prices per share of Common Stock are set forth below for the periods indicated.
2012 2011
Quarter Ended High Low High LowDecember 31 $8.93 $7.24 $ 7.18 $5.09September 30 $8.48 $6.47 $ 8.41 $4.61June 30 $7.50 $5.50 $ 9.62 $7.35March 31 $7.46 $5.62 $10.31 $7.84
On February 22, 2013, the closing sale price of the Common Stock as reported by the NYSE was $10.10. The Company had 2,388 holders of record of Common Stock as of February 22, 2013.
At December 31, 2012, the Company had five series of pre-ferred stock outstanding: 8.000% Series D Preferred Stock, 7.875% Series E Preferred Stock, 7.8% Series F Preferred Stock, 7.65% Series G Preferred Stock and 7.50% Series I Preferred Stock. Each of the Series D, E, F, G and I preferred stock is publicly traded.
Dividends
The Board of Directors has not established any minimum distribution level. In order to maintain its qualification as a REIT, the Company intends to pay dividends to its shareholders that, on an annual basis, will represent at least 90% of its taxable income (which may not necessarily equal net income as calculated in accordance with GAAP), determined without regard to the deduction for dividends paid and excluding any net capital gains. The Company has recorded net oper-ating losses and may record net operating losses in the future, which may reduce its taxable income in future periods and lower or eliminate entirely the Company’s obligation to pay dividends for such periods in order to maintain its REIT qualification.
Holders of Common Stock, vested High Performance Units and certain unvested restricted stock units and common share equiva-lents will be entitled to receive distributions if, as and when the Board of Directors authorizes and declares distributions. However, rights to distributions may be subordinated to the rights of holders of pre-ferred stock, when preferred stock is issued and outstanding. In addi-tion, the Company’s Secured Credit Facilities (seeNote 8 of the Notes to Consolidated Financial Statements) permit the Company to distrib-ute 100% of its REIT taxable income on an annual basis, for so long as the Company maintains its qualification as a REIT. The Secured Credit Facilities generally restrict the Company from paying any common divi-dends if it ceases to qualify as a REIT. In any liquidation, dissolution or winding up of the Company, each outstanding share of Common Stock and HPU share equivalent will entitle its holder to a proportionate share of the assets that remain after the Company pays its liabilities and any preferential distributions owed to preferred shareholders.
The Company did not declare or pay dividends on its Common Stock for the years ended December 31, 2012 and 2011. The Company declared and paid dividends of $8.0 million, $11.0 million, $7.8 million, $6.1 million and $9.4 million on its Series D, E, F, G and I preferred stock, respectively, for each of the years ended December 31, 2012 and 2011, all of which qualified as return of capital for tax reporting purposes. There are no dividend arrearages on any of the preferred shares currently outstanding.
Distributions to shareholders will generally be taxable as ordinary income, although all or a portion of such distributions may be designated by the Company as capital gain or may constitute a tax-free return of capital. The Company annually furnishes to each of its shareholders a statement setting forth the distributions paid during the preceding year and their characterization as ordinary income, capital gain or return of capital.
No assurance can be given as to the amounts or timing of future distributions, as such distributions are subject to the Company’s taxable income after giving effect to its net operating loss carryforwards, financial condition, capital requirements, debt covenants, any change in the Company’s intention to maintain its REIT qualification and such other factors as the Company’s Board of Directors deems relevant. The Company may elect to satisfy some of its 2012 REIT distribution require-ments, if any, through qualifying stock dividends.

DIRECTORSJay SugarmanChairman & Chief Executive Officer, iStar Financial Inc.
Robert W. Holman, Jr. (2) (3) (4)Chairman & Chief Executive Officer, National Warehouse Investment Company
Robin Josephs (1) (2) (4)Lead Independent Director, iStar Financial Inc.
John G. McDonald (2) (4)Stanford Investors Professor, Stanford University Graduate School of Business
George R. Puskar (1) (3)Former Chairman & Chief Executive Officer, Equitable Real Estate Investment Management
Dale Anne Reiss (1) (3)Senior Consultant, Global Real Estate CenterGlobal & Americas Director of Real Estate, Ernst & Young, LLP (Retired)
Barry W. Ridings (1) (2)Vice Chairman of US Investment Banking Lazard Freres & Co. LLC
(1) Audit Committee(2) Compensation Committee(3) Asset Management & Investment
Committee(4) Nominating & Governance
Committee
EXECUTIVE OFFICERSJay SugarmanChairman & Chief Executive Officer
Nina B. MatisExecutive Vice President, Chief Legal Officer & Chief Investment Officer
David M. DiStasoChief Financial Officer
EXECUTIVE VICE PRESIDENTSChase S. Curtis Jr.Credit
Karl FreyiStar Land Co.
Barclay Jones IIIInvestments
Michelle MacKayInvestments/Head of Capital Markets
Steve MageeiStar Land Co.
Barbara RubiniStar Asset Services, Inc.
Vernon B. SchwartzInvestments
DIRECTORS AND OFFICERS
76
-
77

Headquarters1114 Avenue of the AmericasNew York, NY 10036Tel: 212.930.9400Fax: 212.930.9494
regional offices3480 Preston Ridge RoadSuite 575Alpharetta, GA 30005Tel: 678.297.0100Fax: 678.297.0101
525 West Monroe StreetSuite 1900Chicago, IL 60661Tel: 312.577.8549Fax: 312.612.4162
One Galleria Tower13355 Noel RoadSuite 900Dallas, TX 75240Tel: 972.506.3131Fax: 972.501.0078
1501 E. Orangethorpe AvenueSuite 200Fullerton, CA 92831Tel: 714.961.4700Fax: 714.961.4701
180 Glastonbury BoulevardSuite 201Glastonbury, CT 06033Tel: 860.815.5900Fax: 860.815.5901
1777 Ala Moana BoulevardSuite 226Honolulu, HI 96815Tel: 212.405.4537Fax: 808.944.6322
One Sansome Street30th FloorSan Francisco, CA 94104Tel: 415.391.4300 Fax: 415.391.6259
10960 Wilshire Boulevard Suite 1260Los Angeles, CA 90024Tel: 310.315.7019 Fax: 310.315.7017
employeesAs of March 14, 2013, the Company had 167 employees.
independent auditorsPricewaterhouseCoopers LLPNew York, NY
registrar and transfer agentComputershare Trust Company, NAPO Box 43078Providence, RI 02940-3078Tel: 800.756.8200
www.computershare.com
annual meeting of sHareHoldersMay 21, 2013, 9:00 a.m. ETSofitel Hotel of New York City45 West 44th StreetNew York, NY 10036
investor information servicesiStar Financial is a listed company on the New York Stock Exchange and is traded under the ticker “SFI.” The Company has filed all required Annual Chief Executive Officer Certifications with the NYSE. In addition, the Company has filed with the SEC the certifications of the Chief Executive Officer and Chief Financial Officer required under Section 302 and Section 906 of the Sarbanes-Oxley Act of 2002 as exhibits to our most recently filed Annual Report on Form 10-K. For help with questions about the Company, or to receive additional corporate information, please contact:
investor relationsJason FooksVice President Investor Relations & Marketing1114 Avenue of the AmericasNew York, NY 10036Tel: 212.930.9484
Email: [email protected]
iStar Financial Website:www.istarfinancial.com
corporate information
Des
ign
by
Ad
dis
on
ww
w.a
dd
iso
n.c
om
REAL ESTATE FINANCE $1.86 BILLION
NET LEASINg $1.34 BILLION
OPERATINg PROPERTIES $1.17 BILLION
LANd $971 mILLION

ISTA
R F
INA
NC
IAL
AN
NU
AL
RE
PO
RT
20
12
ANNUAL REPORT 2012
iStar
Financial