Embed Size (px)
DESCRIPTION
Public Opinion Research
Citation preview
1
Istrian Citizens and Europe
Authors: Dr. sc. Andrea Debeljuh and Dr. sc. Adrijana Hrelja
Public Opinion Research

2
3
www.iceproject.eu
PROJEKT I.C.E. – ISTRIA COMMUNICATING EUROPE
This project is co-financed by the European Union through the programme “Europe for Citizens”.
4
ABOUT THE PROJECT
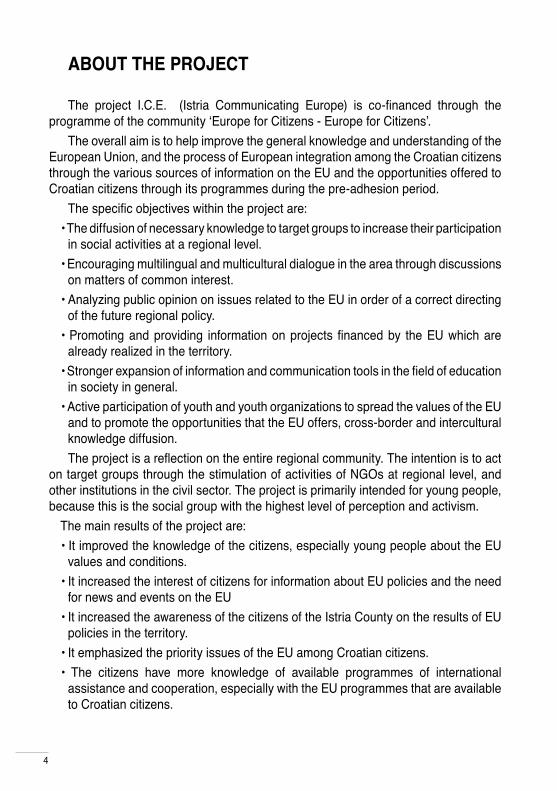
The project I.C.E. (Istria Communicating Europe) is co-financed through the programme of the community ‘Europe for Citizens - Europe for Citizens’.
The overall aim is to help improve the general knowledge and understanding of the European Union, and the process of European integration among the Croatian citizens through the various sources of information on the EU and the opportunities offered to Croatian citizens through its programmes during the pre-adhesion period.
The specific objectives within the project are: • The diffusion of necessary knowledge to target groups to increase their participation
in social activities at a regional level. • Encouraging multilingual and multicultural dialogue in the area through discussions
on matters of common interest. • Analyzing public opinion on issues related to the EU in order of a correct directing
of the future regional policy. • Promoting and providing information on projects financed by the EU which are
already realized in the territory. • Stronger expansion of information and communication tools in the field of education
in society in general. • Active participation of youth and youth organizations to spread the values of the EU
and to promote the opportunities that the EU offers, cross-border and intercultural knowledge diffusion. The project is a reflection on the entire regional community. The intention is to act
on target groups through the stimulation of activities of NGOs at regional level, and other institutions in the civil sector. The project is primarily intended for young people, because this is the social group with the highest level of perception and activism.
The main results of the project are: • It improved the knowledge of the citizens, especially young people about the EU
values and conditions. • It increased the interest of citizens for information about EU policies and the need
for news and events on the EU • It increased the awareness of the citizens of the Istria County on the results of EU
policies in the territory. • It emphasized the priority issues of the EU among Croatian citizens.• The citizens have more knowledge of available programmes of international
assistance and cooperation, especially with the EU programmes that are available to Croatian citizens.
5
INFORMATION:PROJECT I.C.E. – ISTRIA COMMUNICATING EUROPEMletačka 12/IV, Pula, CroatiaTel. +385 52/212-938Fax. +385 52/381-905e-mail: [email protected]: www.iceproject.eu
The partnership of the project includes the most important stakeholders of civil society of the Istrian County and cross-border partners. It has encouraged the open access to all the target groups and the use of common efforts in building pro-European attitudes.
The partners in this project are the Foundation for Partnerships and Civil Society Development (Leading partner), Istria County, Association Suncokret, Association ZUM, Association Informo and ALDA (The Association of Local Democracy Agencies).
The project enables partners to achieve progress in the implementation of communication strategy that aims to inform citizens in Istria on the accession of Croatia to the European Union, as well as the benefits and costs of this integration.
6
The Foundation for Partnership and Civil Society Development has been founded by the Istrian Region. The main goal of the Foundation is to offer informational, professional and financial support for
various programs that promote sustainability of the non-profit sector, cooperation, citizen initiative, volunteering and society development.
The Foundation has three main functions: Financial - it entails publishing Tenders and support for various organization, Informative - offers basic information about civil society and its function, Educational - organization of various workshops, lectures and seminars.
The areas of Development of the Foundation are:1. Environmental Protection and Sustainable Development 2. Democracy and Human Rights3. Youth4. Capacity building5. Promotion of social entreprenuershipsMission: Development of Partnership and Civil Society. Vision: support for partnership
between the private, public and civil sector, through which we raise the consciousness among our citizens about the importance of citizen participation in the decision making process.
Goals: • Support of partnership and cooperation• Development of networking among civil society organizations• Active citizen participation in the decision making process• Development of awareness and public influence of civil society organizations• Development of the local community• Increasing levels of employment in civil society organizations• Civil Society capacity building• Support for active participation of citizens in the development of the local community• Life- long learning
CONTACTS:Foundation for partnership and civil society developmentMletačka 12/IV, Pula, Hrvatska Tel. +385 52 /212-938 Fax. +385 52 /381-905 e-mail: zaklada@civilno drustvo-istra.hrweb:www.zaklada.civilnodrustvo-istra.hr
FOUNDATION FOR PARTNERSHIP AND CIVIL SOCIETY DEVELOPMENT
7
THE REGION OF ISTRIA
The Region of Istria is one of 21 regions in Croatia, established in 1993. It is located in Istria, the largest Adriatic peninsula. It is administratively divided into 41 territorial units of local self-government : 10 cities and 31 municipalities. The land area is of 2822 km ² which is 5% of the total area of Croatia. In the Istrian territory there are various kinds of climate, Mediterranean, Sub-Mediterranean, Continental and Sub - mountain. The languages used are Croatian and Italian. According to the census carried out in 2001, Istria has a population of 206,344 which is 4.65% of the total population of Croatia. The average population of the Region of Istria is 73 inhabitants per km ², while the average age is 40,2 years.
The nationality structure is as follows: Croats (71.9%), Italians (6.9%), Serbs (3.2%), Bosnians (1.5%), others (16.5%).
GDP according to data from 2006 is 9.768 €. Unemployment in 2008 was 5.70%. Economic sectors according to the % of income in the Region of Istria: Manufacturing (33%), Commerce
(29%), Hotels/Restaurants (10%), Building Industry (8%), Labour Services (5%), Agriculture (2%). The Istrian County is visited by 244,000 visitors each year.
INTERNATIONAL COOPERATION AND EU INTEGRATIONS From the activities that the Region of Istria implements in the field of international cooperation we
distinguish bilateral, multilateral cooperation, European programme and projects, European integration - information.
• BILATERAL COOPERATION The Region of Istria has developed a bilateral cooperation with the following regions: Region of Tuscany
(Italy), Region of Liguria (Italy), Veneto Region (Italy), Autonomous Region of Friuli Venezia Giulia (Italy), Region Somogy (Hungary), Region of Carinthia (Austria), Region Hargita (Romania), the AP of Vojvodina (Serbia), Zenica-Doboj Canton (Bosnia and Herzegovina), Kerry Region (Ireland), Yunnan Province (China), Trenčin (Slovakia), Zhejiang (China), Sarajevo Canton (Bosnia and Herzegovina) , Region of Puglia (Italy), Champagne Ardenne (France).
• MULTILATERAL COOPERATION Membership of international organizations: SER - Assembly of European Regions, CRPM Conference
of peripheral coastal regions of Europe, IRE - Institute of the Regions of Europe, AE – Adriatic Euroregion, AEBR - The Association of European Border Regions, Wateregio, Alda - The Association of Local Democracy Agencies, MMFN - Mediterranean Model Forest Network, AREV - Assembly of European Wine Regions.
• EU PROGRAMME The Region of Istria participates in the following EU programme: INTERREG III A, B, C; Law RIT
84/2001; CARDS and others ; programme based on cooperation with the regions of Tuscany, Veneto and Flanders; CEI ; EU programme; ISPA, PHARE, SAPARD; IPA.
Adriatic EuroregionCarrarina 1, 52100 PulaTel. +385 52 210 596Fax. +385 52 210 063e-mail: [email protected]
CONTACTS:REGION OF ISTRIAFlanatička ulica 29, 52100 PulaTel. +385 52 372 177Fax. +385 52 372 178e-mail: [email protected]
Department for international cooperation and European integrations – Euro info pointCarrarina 1, 52100 PulaTel. +385 52 210 596Tel. +385 52 210 063e-mail: [email protected]
Regional office in BruxellesRue du Commerce 49, 1000 BruxellesTel. +32 2 513 85 18Fax. +32 2 502 46 37e-mail: [email protected]

8
9
Istrian Citizens and Europe
Public Opinion Research
Authors:Dr. sc. Andrea Debeljuh
Dr. sc. Adrijana Hrelja
10
Contents
Introduction ....................................................................................................................................... 10
Research Methodology...................................................................................................................... 16
PART I. - MEMBERSHIP SUPPORT ........................................................................................................ 18
1. EU Membership ............................................................................................................... 18 1. 1. Support to the membership of Croatia in the European Union ............. 18 1. 2. Personal expectations related to Croatia’s accession to the European Union .......................................................................................... 19 1. 3. Expectations for the wellbeing of Istrian citizens related to the accession of Croatia to the EU ............................................................................. 21 1. 4. The fact that Croatia can become an EU member for Istria is .................22 1. 5. Feelings of European citizenship ....................................................................... 24
2. Perception of the EU ..................................................................................................... 26 2. 1. General perception of the EU ............................................................................ 26 2. 2. Personal perception of the EU ............................................................................ 27 2. 3. Principal reasons for benefits of EU membership for the Republic of Croatia ..........................................................................................28 2. 4. Principal reasons why the Republic of Croatia would not benefit fromEU membership ......................................................................30 2. 5. Attitude of acceptance of their own country’s interests in the EU........ 31 2. 6. Attitude about imposing views of the European Union to their own country .............................................................................................. 32
3. The future of the EU ....................................................................................................... 33 3. 1. Personal view on the future of the EU ............................................................. 33 3. 2. Opinion on the EU enlargement ...................................................................... 35 3. 3. Membership of the Western Balkans into the EU and its impact .........36
4. Confidence in European Institutions .....................................................................38 4. 1. Confidence in the European Parliament .........................................................38 4. 2. Confidence in the European Commission ...................................................... 39 4. 3. Confidence in the Council of the EU ................................................................. 414. 4. Confidence in the European Central Bank ..................................................... 43
5. Assessment of the situation in Croatia and the Region of Istria compared to the EU ........................................................................................................44
11
II. PART. - KNOWLEDGE OF THE EUROPEAN UNION AND INFORMING .................................................. 47
1. Knowledge of the European Union ....................................................................... 47 1. 1. Awareness of the accession process of Croatia............................................. 47 1. 2. Awareness of the activity of the EU and its institutions ............................48 1. 3. Understanding how the EU functions .............................................................50
2. Informing .......................................................................................................................... 52 2. 1. Way of informing ................................................................................................... 52 2. 2. Desired information about the EU and European integration ............... 52
III. PART. – THE REGION OF ISTRIA AND THE EU ................................................................................... 53
1. Activities of the Region of Istria in the area of the European Union ...... 53 1. 1. Awareness of cooperation activities between Region of Istria and the EU .................................................................................................................. 53 1. 2. Support for the activities of the Region of Istria in the sector of European integration and international cooperation .......................... 54 1. 3. Knowledge of Region of Istria activities in the sector of European Integration ..........................................................................................56
1. 3. 1. Informing the public about European integration through the activities of the Region of Istria ..........................................................58
1. 4. Awareness of European projects of the Region of Istria ........................... 59 1.4.1.Attitude about positive impact of European projects by the Region of Istria ....................................................................................... 61
2. Region of Istria and informing about the European Union ....................... 61 2. 1. Informing the public about European integration through the Region of Istria activities ............................................................................... 61 2. 2. Knowledge of the EuroInfo Newsletter of the Region of Istria.............. 62 2. 3. Knowledge of the Euro Info Point of the Region of Istria ......................... 63
2. 3. 1. Evaluating the Region of Istria Euro Info Point.....................................64
Conclusions .......................................................................................................................................... 65
Appendixes .........................................................................................................................................68
12
Introduction A scientific public opinion poll research, in other words collecting and analysing
real life data, was conducted in the Region of Istria among the citizens for the first time in order to come to new findings concerning the European Union
This is also the only research on the counties level, carried out in Croatia. Data collection was carried out from 19th February to 20th March 2008 and
surveyed 626 individuals from which a sample of 489 respondents aged over 14 years was determined. Respondents were divided into five age groups (from 14 to 25 years, from 26 to 35 years, from 36 to 50 years, from 51 to 65 years, 66 or more years) and four groups divided by level of education (low, intermediate, senior, and graduate), while territorially Istria was divided into North-western (Umag, Buje, Poreč, Vrsar, and Novigrad), North-eastern (Buzet, Pazin, and Labin) and South (Pula and Rovinj). The examination of the public opinion or study of the relationship between facts that are the subject of this research was carried out in a planned, thoughtful, and pre-planned way. Each phase was under the strict supervision of researchers and was conducted by the Eurobarometer standard [1], which allows comparison with other European regions, and Standard Eurobarometar Croatia [2].
The objective of this study is to identify the attitudes of public opinion in relation to knowledge of the European Union and the integration process of Croatia into the European Union. Attitudes were measured through the perception of the Region of Istria citizens on questions of their knowledge of the activities of the European Union and its institutions, comparison of situations in the country and Europe, the enlargement of the European Union and the integration process of Croatia, the assessment of the work of the Region of Istria in the segment of European integration, but also the questions about immediate quality of the horizontal communication of citizens and the Region of Istria. The research, in addition to identification of public opinion of citizens on European issues, tried to explore the similarities and differences in socio-political attitudes and its values in relation to the average Croatian and a European citizen.
[1] Eurobarometer (EB) is a special research project of inter-ethnic, comparative social research that is carried out for the needs of the European Commission. Using the Eurobarometer the Commission monitors the development of public opinion on social and political issues in the Member States. The EB standard was established in 1973. Each test consists of approximately 1000 interviews, face to face, by country member. A report is issued twice a year.
[2] The Standard Eurobarometer public opinion research is conducted twice a year in all 27 Member States of the European Union, the two candidate countries in the negotiations, Croatia and Turkey, then in the former Yugoslavian Republic of Macedonia, which has a candidate country status, but her start date for negotiations has not yet been determined, and among members of the community of Turkish Cyprus. The Standard Eurobarometer is the General administration for Communications of the European Commission, and was carried out by the consortium TNS Opinion & Social, which consists of Taylor Nelson Sofres and EOS Gallup Europe. In Croatia the data were collected by the agency Puls. EB 69 is the eighth research of the Standard Eurobarometer, that includes Croatia, while EB 70 was the ninth.
13
Additionally, although not less important, the goal is to set foundations for further development and improvement of the Region of Istria action in the area of European integration.
The internal political field, during the research, was marked by the preparations for regional and local elections also the announcement of the approaching economic recession, which was preparing to draw Croatia, dissatisfaction about the negotiations on the privatization of the Pula shipyard, and, mostly, dissatisfaction with the behaviour of Slovenia, that led to the question of Croatia’s accession to the European Union and NATO because of open bilateral issues. Nothing of the main points changed during data collection so the analysis and hypotheses are credible.
The main topics of this research developed through the three parts in which the public opinion of the Region of Istria citizens was analyzed regarding attitudes about the EU, information and knowledge of the European Union and the work of the Region of Istria in the sphere of EU integration.
To be analyzed in the first part was the support of Istrian citizens about Croatia’s process of accession into the EU as to enable comparison with the investigations of the Eurobarometer on the level of the citizens of Croatia and the European Union. The survey showed that the citizens of Istria are quite euro-optimistic, since the support to Croatia’s EU membership was declared by 44% of the population, while EU is negatively perceived by only 17%. The research has shown that there are more of those who do not expect a personal benefit from EU membership followed by the undecided, but those who expect a personal benefit; while more are the Istrian’s who believe that the Istrian citizens will be better when Croatia joins the EU than those who think the opposite. However, many are undecided. It is evident that more the questions are of general level, more are the optimists, and so to the question about estimation of Istria’s welfare through Croatia membership in the EU only 15% consider that it would be negative for the Region of Istria. Interesting is the fact that the number of respondents that considered itself a European citizen is much larger than the number of respondents who supported membership, from those who think that the membership will contribute to them in person and of those who think that is positive for Istria that Croatia can become a member of the European Union.
In the first part was analyzed even how the citizens of Istria perceive the European Union.
Almost one third of Istrian respondents perceive positively the European Union, while half of this percentage has a negative view on Europe. The substantial majority in Istria and Croatia are those for which the European Union has a neutral meaning. The position of those who see the Union negatively, is the same among the European and Istrian respondents and is 17%, while in Croatia, the number of those who see the Union in a negative light is increasing and amounts to 29%. Also, the Istrian citizens should have selected three characteristics that for them represent the EU. It was found that for the Citizens of the Region of Istria, the European Union means primarily the freedom to travel, study and work anywhere within the Union, followed by democracy and economic prosperity, then by the euro and peace.
14
Compared with the citizens of Croatia and the European Union is evident the similarity in the fact that for all European Union means above all freedom to travel, study and work in any country member; while in second place for Croatians there is the fear of loss of their cultural identity, and for the citizens of the EU the common currency being the euro. The citizens of Istria, unlike the citizens of Croatia, are not so much afraid of the loss of their cultural identity: the fear is that in the European Union they will lose the cultural identity as Croatian citizens. In the past half year this rose by two percent to 24%, after the reduction of four percent in the previous period. However, in the Region of Istria that fear is less present, and amounts to 18%, while among the European respondents amounts to only 11%. We asked the Istrian citizens which for them are the main reasons why Croatia will benefit from membership in the European Union and which are the main reasons for why they felt there would be no benefit.
The Istrian citizens in the first place expect from the European Union improvement of the cooperation between Croatia and the other country members, followed by the contribution to economic growth, employment opportunities and contribution to peace, security and democracy.
The survey also showed that very few respondents in the Region of Istria believe that the citizens will have an influence on decisions at European level.
Compared to European citizens, respondents in the Region of Istria share position that the most important benefits arising from membership is a better cooperation with other countries, while the average citizen believes that the membership will contribute to economic growth of Croatia. For Croatian and European citizens in second place there is contribution to peace and security, while in the Region of Istria the second place goes to the contribution to the economy (30%). The research has shown that Croatian citizens and respondents from the Region of Istria believe that the contribution to democracy is something that should be expected from the European Union, while such Europeans are almost half this. While almost half of Croatian respondents, more than double of the EU, fear that with the entry of Croatia into the European Union their standard of living will be reduced, the respondents in Istria fear that the Croatian citizens will not have an impact on decisions at European level.
Almost one third of respondents in the Region of Istria believe that the accession to the European Union will reduce the standard of living of Croatian citizens, followed by fear of loss of jobs and a bad influence on economic growth. The Istrian respondents who think that the membership in the European Union will badly affect the economic growth and that will put them in danger of losing their jobs is just slightly less than those who think that it will be exactly the opposite. We researched even the perception of citizens about taking into account the interests of their Country and whether the EU imposes its views and was found that the majority of the Region of Istria citizens, as well as Croatian, considers that the interests of the Republic of Croatia does not affect the events in the European Union, while most of Istrian, and Croatian and European respondents consider that the EU imposes its views to their country.
In the first part even personal views on the future of Europe were analyzed. A
15
comparison was made which showed that the optimism about the future of the European Union in Croatian and European respondents is less than half a year ago, but the optimistic ones still is almost a two third majority in the EU, in Croatia is half, and in the Region of Istria is a simple majority. However, while among the European respondents has simultaneously slightly increased the percentage of pessimists, there is less of them now than half a year ago, and with much more undecided. In the Region of Istria the percentage of pessimists and those undecided is less than in Croatia, but is still higher than in the European Union. The policy of enlargement of the EU enjoys the majority of support from the citizens of Istria and Croatia and Europe. However, citizens of the Region of Istria are slightly less opposed than in Croatia, while there are more undecided citizens. The majority of the citizens of Istria agree with the statement that the entering of the Western Balkan countries (Bosnia-Herzegovina, Serbia, Montenegro, Kosovo, The former Yugoslavian Republic of Macedonia, Croatia and Albania) in the European Union would help stabilize this part of Europe, more than a quarter do not agree, while the rest remain undecided. This attitude is very close to the whole Croatian population, while less than half of the respondents Europeans agree, and almost two quarters are against it. It is the turn of the analysis of citizens’ trust in European institutions from which results that the confidence in Croatia is in mild fall, and distrust is on the rise since the previous Eurobarometer survey, which is a trend even in the European Union. However, in the Region of Istria this state was recorded with a much larger percentage of citizens being undecided. While among the European citizens there are more who believe in European institutions than those who do not, in Croatia it is much more visible the distrust for difference of the Region of Istria, where the trust is much more visible, with the exception of the European Central Bank.
At the end of the first part of the survey was made the analysis of the comparison status of certain categories (economy, employment, cost of living, prices of energy and quality of life) in Croatia and Istria with the EU. The research has shown that the economic situation in his country is considered worse than state average in the European Union by more than four fifths of Croatians and the majority of Europeans, and even less are those who think good about the Croatian economy in Istria. Although most of the average Istrian citizens think that the state of the economy in Istria is worse compared to the European economy, the research has shown that Istrian’s experience economy in Istria better, compared with the current state of the Croatian economy. The same is for the employment, costs of living and prices of energy sources. As regards to the comparison to quality of life, almost three quarters of Croats consider that in the European Union they live better than in Croatia, and that opinion is shared by most of the citizens of Istria, almost half of the respondents. However, in Istria, in comparison with Croatia, there are a significantly larger number of citizens, almost two fifths, who believe that the quality of life in the Region of Istria is better than in the EU.
The second part of the research offers an analysis of the extent to which the Istrian citizens are knowledgeable of the accession process of Croatia to the European Union, the European Union’s activities and the manner of information sharing. The
16
survey showed that slightly more than two quarters of respondents believe that they are poorly introduced to the topic, while the rest said good or excellent. Respondents feel approximately 2.6 (from 1 to 5) familiar with the process of Croatia’s accession to the European Union. As for the content of the EU, only a third of the examinees of the Region of Istria believe that is well acquainted with the work of the European Union and its institutions, while the rest is not familiar. Something more than a third of examinees in Istria claim to understand how EU works, almost as much is those uncertain, while one quarter think that they do not understand how the EU works. In connection with the media, the research showed that the media are the main source of information, even 79% of the examinees inform themselves by watching television; while 69% receive information from the newspapers. Two quarters of examinees inform themselves through the Internet, half less listening to the radio, while by other ways of informing below 4% of the examinees.
Examinees are primarily interested in how the membership of the European Union will affect their daily life and what Europe brings to the local level, followed by interest to obtain information about the European institutions (25%) and its member countries.
Almost one fifth of examinees do not want to receive any type of information related to the European Union.
In the third and final part of our study, we analyzed the responses of Istrian examinees on the issue of evaluation of the work of the Region of Istria in the section of European integration, but also the question of the immediate quality of communication between citizens and the Region of Istria. As regards cooperation with the European Union we asked whether they think that the Region of Istria already cooperates with the EU and its institutions. The research has shown that almost two thirds of examinees consider that the Region of Istria is already cooperating with the European Union and its institutions, while as to the question whether they approve such activities, there is an almost equal number of Istrian citizens that supports these activities and those who do not know anything about them. However, the research has shown that the citizens are poorly familiar with the work of the Region of Istria in the segment of European integration, while citizens who are familiar with the activities of the Region of Istria in that segment, the 35%, judge them by the average grade of 3.1 (from 1 to 5). It is also interesting that between these 35% of examinees who are familiar with the work of the Region of Istria in European integration, only two quarters know some of the projects which the Region of Istria realized, or are still in progress. We also wanted to find out if citizens believe that the European projects have a positive impact on the development of the Region of Istria. To this question answered those examinees who were familiar with these projects and a number of citizens who had not heard of them, but possesses a defined opinion on their contribution. The conclusion was that there are more citizens who believe in their positive impact on the development of the Region of Istria, than those who think the opposite. With this study we wanted to check also how much citizens know about methods of informing the public used by the Region of Istria (EuroInfo Newsletter and Euro Info Point). More than four fifths of Istrian citizens haven’t heard about EuroInfo Newsletter of the Region of Istria as well
17
as of the Euro Info Point.Citizens who are familiar with the information centre of the Region of Istria, the
16%, judged its work with the average grade of 2.9 (from 1 to 5). The survey was conducted by the Association Informo, in the role of partner in the
project Istria Communicating Europe (I.C.E), whose project leader is the Foundation for the partnership and civil society development. The study was financed from the budget of the I.C.E. which provided funding through the European Community program ‘Europe for Citizens’ [1].
[1] The Community Program, which provides support for a wide range of activities and organizations that promote ‘Active European citizenship’ and especially the inclusion of citizens and organizations of civil society in the process of European integration. The program was established by the Decision of the European Parliament and the Council no. 1904/2006/EZ for the period 2007 – 2013. The budget is 215 million euros. The budget is managed at the EU level by the for Education, Audiovisual and Culture Executive Agency. Croatia has launched the process of negotiations for full participation in 2007.
18
Research MethodologyThe research was conducted on randomly stratified sample in order to have under
control the features and segments in the population relevant bearing in mind the goal of the research as well as to ensure the representative quality of relevant variables. In the case of this study sample was stratified by territorial affiliation, gender and age according to socio-demographic distribution of the Region of Istria.
The process of this scientific research includes three major phases of work. In the first phase, the research concepts were established. Precisely it was determined what the study intends to reveal, theme and reasons of research were chosen and defined. This part includes mainly the theoretical work, but also some empirical activities such as conducting of orientation research. In addition, in this phase the literature was examined, the hypothesis formulated, objectives of the research were defined as well as identification, classification and operation variables, and in the end the preliminary draft research was made.
The concept of research was designed by members of the Working Group of the ICE, while the professional and scientific coordination was held by Dr. Sc. Andrea Debeljuh.
Before the very beginning of the field research, in other words in the second stage, planning and preparation of research was undertaken whereby we determined the best way for implementing the planned research. Here our efforts were towards answering the question of how to investigate what was envisaged in the first phase.The process of realization and the development of the feasibility draft of the research were planned, the type of sample was selected, using randomly stratified sample. People were chosen for collecting data in the field, research and training for them was organized. The research instrument was made, and after the pilot research on a representative sample of examinees, in order to test the instruments, the sample and methods of research were selected. We have checked the examiners, a correction of individual questionnaires was carried out and the final survey was improved. At the end of this phase the plan and programme of the data processing was established.
The phase of the implementation of this research included the collection of data that was carried out in one month, from 19th February 2009 until March 20th 2009, in order to reduce the possibility of changes in public opinion due to external impact. This was important because at that time the solving of the border problem dispute with Slovenia was an issue. Any solution would certainly have had an impact on public opinion. There were no significant changes during this period of data collecting, so we can consider that there was no external impact on public opinion of citizens. During the data collection the process of conducting the research was controlled and the preparation of data for processing (coding, logic control, data input, control input) was made.
The research was conducted on a sample of 626 examinees of which 489 or 0.24% of Istrian population was selected for conducting the analysis in order to maintain socio-
19
demographic characteristics of the Region of Istria. Please note that the researches carried out by the Eurobarometer involved 1000 examinees at country level.
Since this is a representative sample obtained by random selection, we can generalize our hypotheses on the entire population with a high degree of reliability.
Data was collected by face to face interviews that our interviewers took all over Istria. The first experimental data collection was carried out at the end of January 2009, on a sample of 40 examinees. After that, some questions were improved, some were removed and some new questions were included, providing further information. Tests showed that the survey was well structured.
The reactions of examinees to the survey were positive; there were no significant problems in understanding the survey. We must point out that the elderly mostly refused to answer the survey, while younger people accepted much more easily their participation in the research.
After the appropriate logical checks, especially in the case of the so-called open questions, for which it was necessary to redefine some variables and create new ones, data was inserted into the computer programme and processed for statistical purposes. The results of the data, after the processing and the analysis, preparation of analytical tables and graphic displays, interpretation of the results and realization of conclusions are the foundation of this research report.
20
52%
71%
44%
34%
22%
39%
14%
7%
17%
0%
10%
20%
30%
40%
50%
60%
70%
80%
Eu 27 Croatia Istrian County
Favourable Against Do not know
38%
60%
38%
45%
26%
44%
17% 14%
17%
1%
0%
10%
20%
30%
40%
50%
60%
70%
North-Western Istria Nort-Eastern Istria Southern Istria
Territory Affiliation
Yes No Do not know n.a
I. Part. - MEMBERSHIP SUPPORT
1. EU Membership In this first part we will analyze the support of Istrian citizens to Croatia’s adhesion
to the EU, compare it with the Standard Eurobarometer at the level of citizens of Croatia and the European Union.
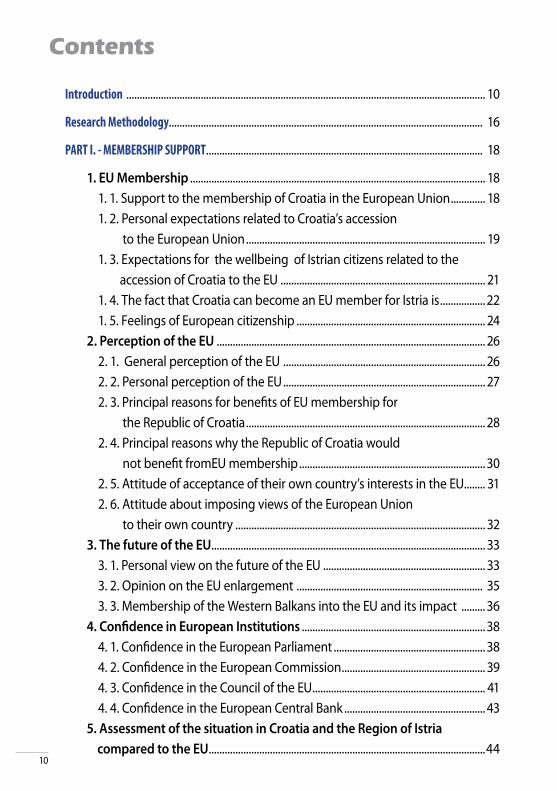
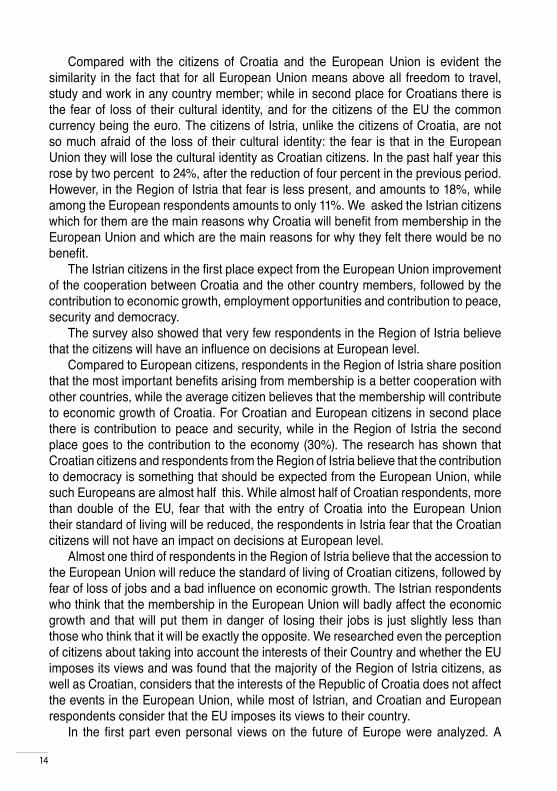
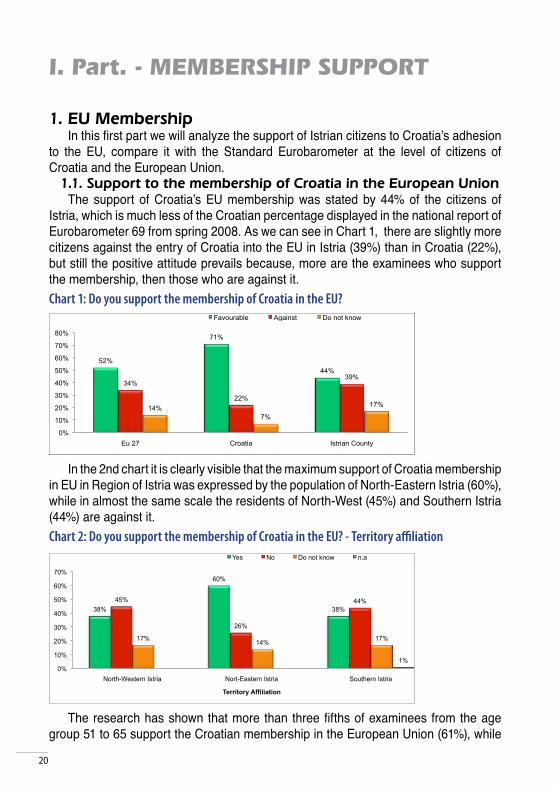
1.1. Support to the membership of Croatia in the European UnionThe support of Croatia’s EU membership was stated by 44% of the citizens of
Istria, which is much less of the Croatian percentage displayed in the national report of Eurobarometer 69 from spring 2008. As we can see in Chart 1, there are slightly more citizens against the entry of Croatia into the EU in Istria (39%) than in Croatia (22%), but still the positive attitude prevails because, more are the examinees who support the membership, then those who are against it. Chart 1: Do you support the membership of Croatia in the EU?
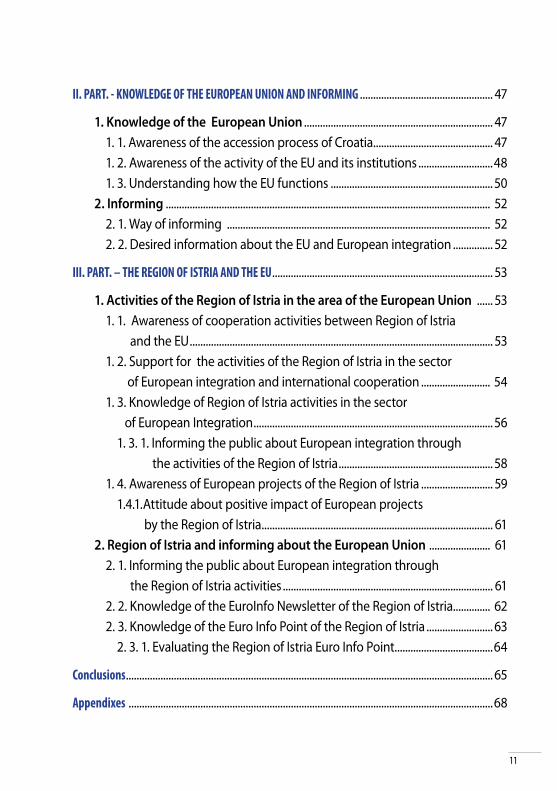
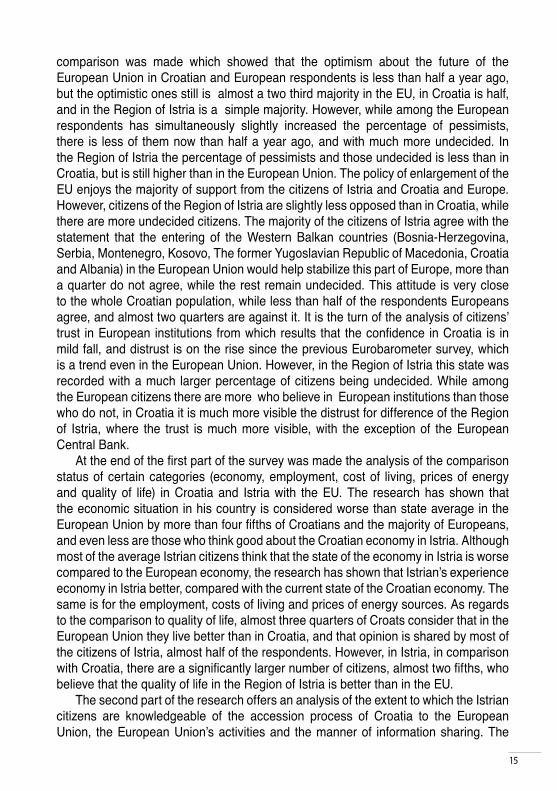
In the 2nd chart it is clearly visible that the maximum support of Croatia membership in EU in Region of Istria was expressed by the population of North-Eastern Istria (60%), while in almost the same scale the residents of North-West (45%) and Southern Istria (44%) are against it. Chart 2: Do you support the membership of Croatia in the EU? - Territory affiliation
The research has shown that more than three fifths of examinees from the age group 51 to 65 support the Croatian membership in the European Union (61%), while
21
35%
51%
42%
61%
38% 39%
45%
40%
28%
46%
25%
4%
17%
11%
16%
1% 1%
0%
10%
20%
30%
40%
50%
60%
70%
from 14 to 25 from 26 to 35 from 36 to 50 from 51 to 65 66 or more
Agre groups
Yes No Do not know n.a
34%
42%
56%
50%
34%
46%
32%
43%
31%
12% 12%
7%
1%
0%
10%
20%
30%
40%
50%
60%
Low Secondary High-higher Masetr-Doctorate
Level of education
Yes No Do not know n.a
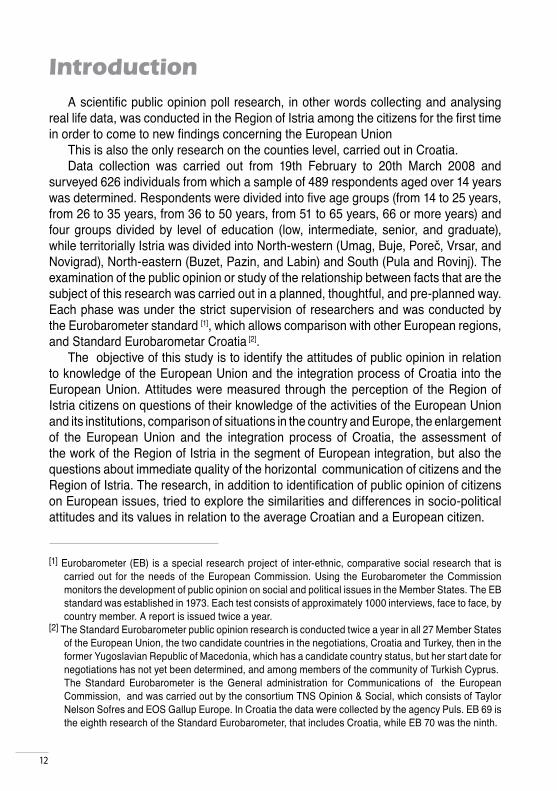
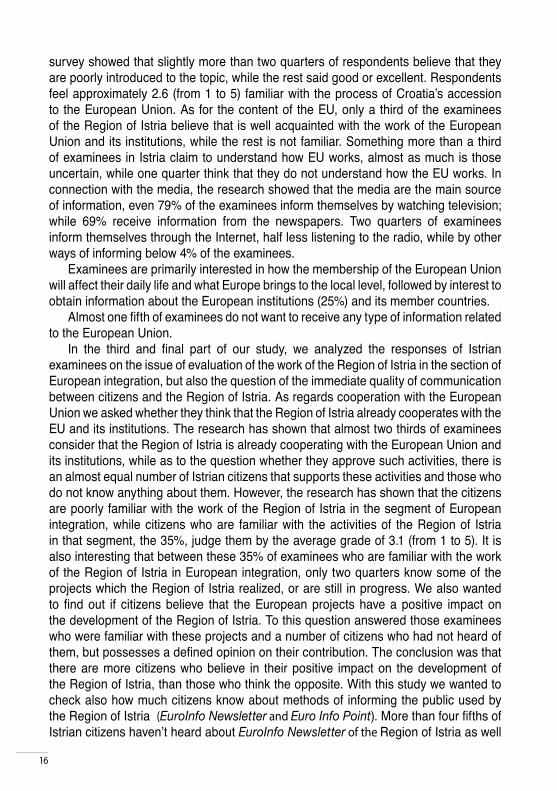
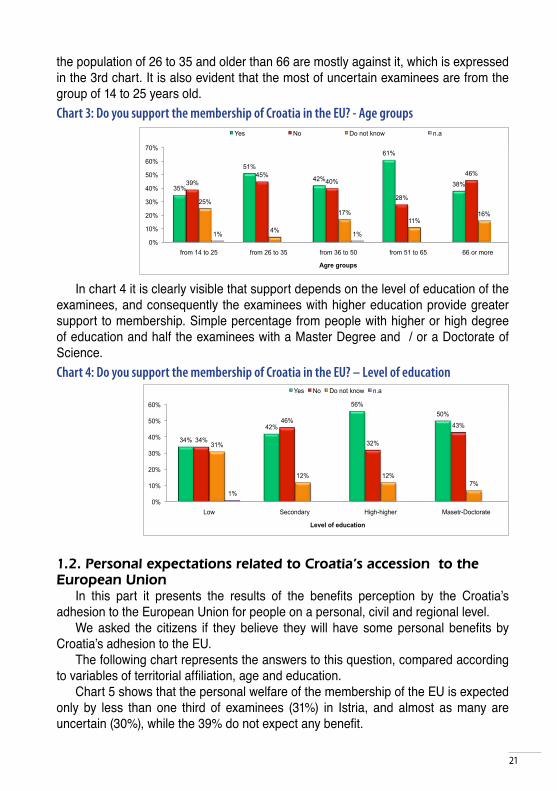
the population of 26 to 35 and older than 66 are mostly against it, which is expressed in the 3rd chart. It is also evident that the most of uncertain examinees are from the group of 14 to 25 years old. Chart 3: Do you support the membership of Croatia in the EU? - Age groups
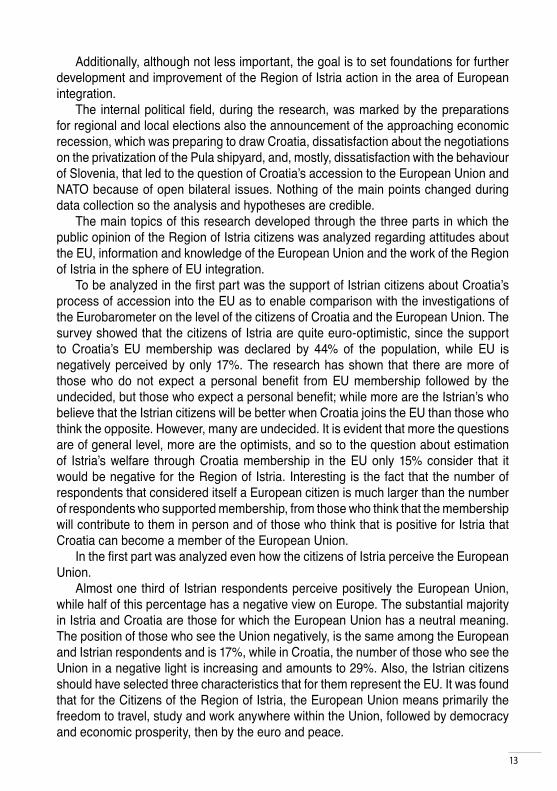
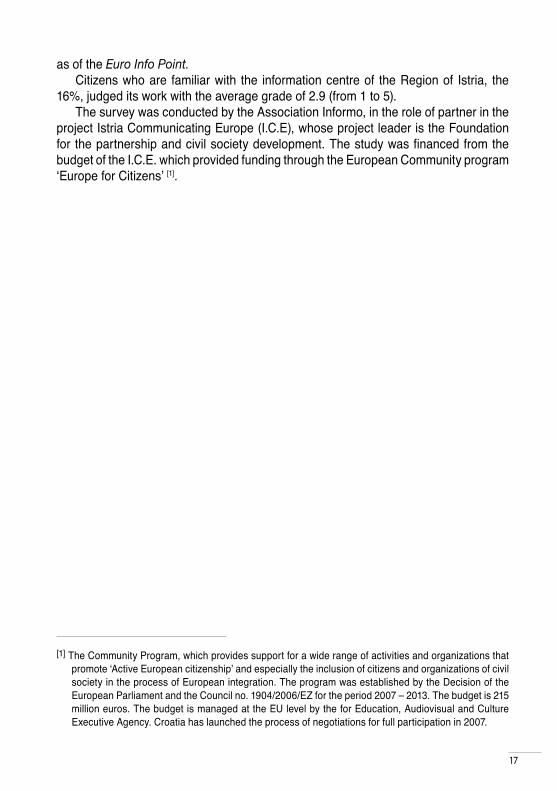
In chart 4 it is clearly visible that support depends on the level of education of the examinees, and consequently the examinees with higher education provide greater support to membership. Simple percentage from people with higher or high degree of education and half the examinees with a Master Degree and / or a Doctorate of Science. Chart 4: Do you support the membership of Croatia in the EU? – Level of education
1.2. Personal expectations related to Croatia’s accession to the European Union
In this part it presents the results of the benefits perception by the Croatia’s adhesion to the European Union for people on a personal, civil and regional level.
We asked the citizens if they believe they will have some personal benefits by Croatia’s adhesion to the EU.
The following chart represents the answers to this question, compared according to variables of territorial affiliation, age and education.
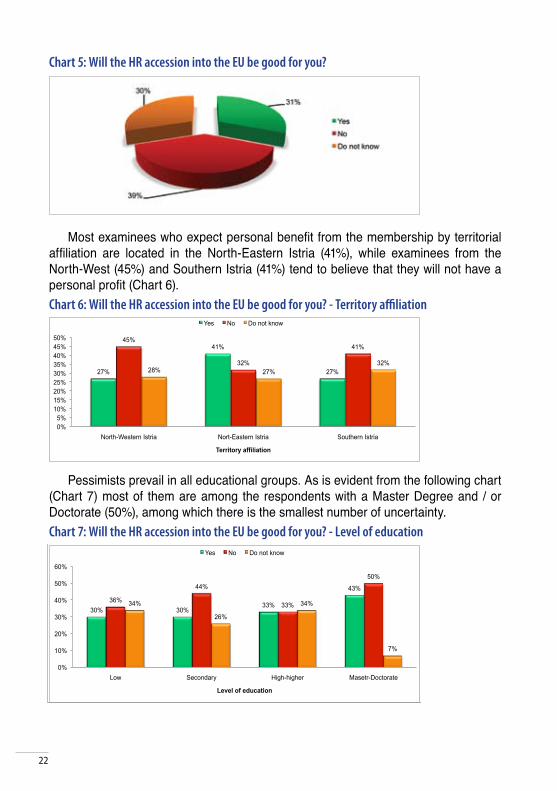
Chart 5 shows that the personal welfare of the membership of the EU is expected only by less than one third of examinees (31%) in Istria, and almost as many are uncertain (30%), while the 39% do not expect any benefit.
22
27%
41%
27%
45%
32%
41%
28% 27%
32%
0%
5%
10%
15%
20%
25%
30%
35%
40%
45%
50%
North-Western Istria Nort-Eastern Istria Southern Istria
Territory affiliation
Yes No Do not know
30% 30% 33%
43%
36%
44%
33%
50%
34%
26%
34%
7%
0%
10%
20%
30%
40%
50%
60%
Low Secondary High-higher Masetr-Doctorate
Level of education
Yes No Do not know
Chart 5: Will the HR accession into the EU be good for you?
Most examinees who expect personal benefit from the membership by territorial affiliation are located in the North-Eastern Istria (41%), while examinees from the North-West (45%) and Southern Istria (41%) tend to believe that they will not have a personal profit (Chart 6). Chart 6: Will the HR accession into the EU be good for you? - Territory affiliation
Pessimists prevail in all educational groups. As is evident from the following chart (Chart 7) most of them are among the respondents with a Master Degree and / or Doctorate (50%), among which there is the smallest number of uncertainty. Chart 7: Will the HR accession into the EU be good for you? - Level of education
23
31% 31% 29%
35%
23%
38%
42% 43%
33%
42%
31%
27% 28%
32% 35%
0%
5%
10%
15%
20%
25%
30%
35%
40%
45%
50%
from 14 to 25 from 26 to 35 from 36 to 50 from 51 to 65 66 or more
Age groups
Yes No Do not know
According to age groups, optimistic prevails only in the age group of 51 to 65, while in the other groups there are mostly pessimists. The highest level of undecided examinees is among those older than 66 years, as shown in the next chart (chart 8). Chart 8: Will the HR accession into the EU be good for you? Age groups
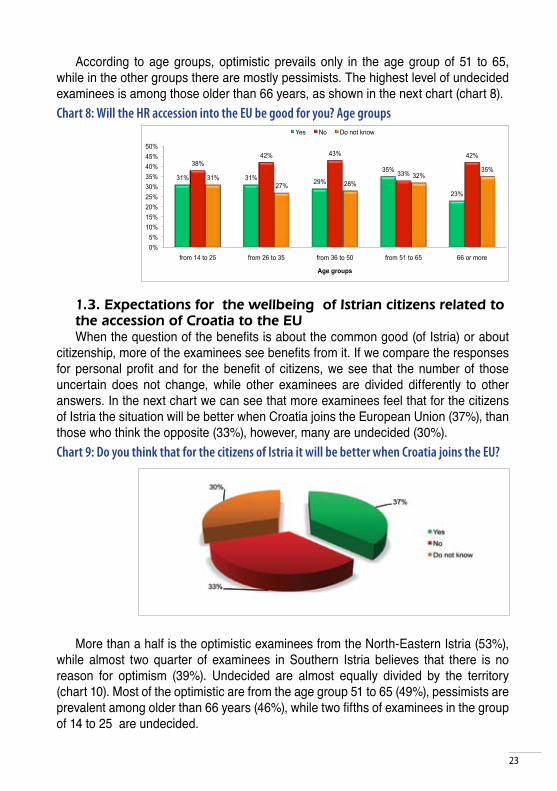
1.3. Expectations for the wellbeing of Istrian citizens related to the accession of Croatia to the EU When the question of the benefits is about the common good (of Istria) or about
citizenship, more of the examinees see benefits from it. If we compare the responses for personal profit and for the benefit of citizens, we see that the number of those uncertain does not change, while other examinees are divided differently to other answers. In the next chart we can see that more examinees feel that for the citizens of Istria the situation will be better when Croatia joins the European Union (37%), than those who think the opposite (33%), however, many are undecided (30%). Chart 9: Do you think that for the citizens of Istria it will be better when Croatia joins the EU?
More than a half is the optimistic examinees from the North-Eastern Istria (53%), while almost two quarter of examinees in Southern Istria believes that there is no reason for optimism (39%). Undecided are almost equally divided by the territory (chart 10). Most of the optimistic are from the age group 51 to 65 (49%), pessimists are prevalent among older than 66 years (46%), while two fifths of examinees in the group of 14 to 25 are undecided.
24
30%
53%
32%
38%
18%
39%
32% 28% 29%
1%
0%
10%
20%
30%
40%
50%
60%
North-Western Istria North-Eastern Istria Southern Istria
Territory Affiliation
Yes No Do not know n.a.
28%
35%
48%
36% 32%
37%
25%
36% 40%
27% 27% 28%
1%
0%
10%
20%
30%
40%
50%
60%
Low Secondary High-higher Master-Doctorate
Level of educaion
Yes No Do not know n.a.
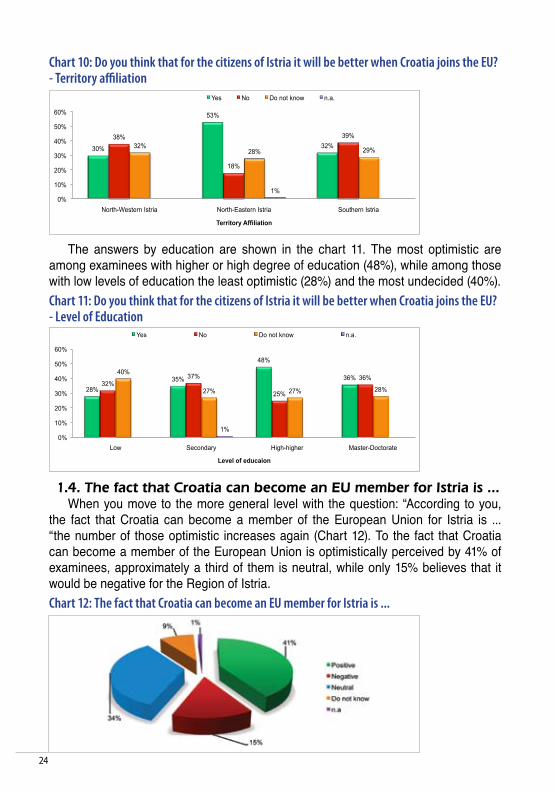
Chart 10: Do you think that for the citizens of Istria it will be better when Croatia joins the EU? - Territory affiliation
The answers by education are shown in the chart 11. The most optimistic are among examinees with higher or high degree of education (48%), while among those with low levels of education the least optimistic (28%) and the most undecided (40%). Chart 11: Do you think that for the citizens of Istria it will be better when Croatia joins the EU? - Level of Education
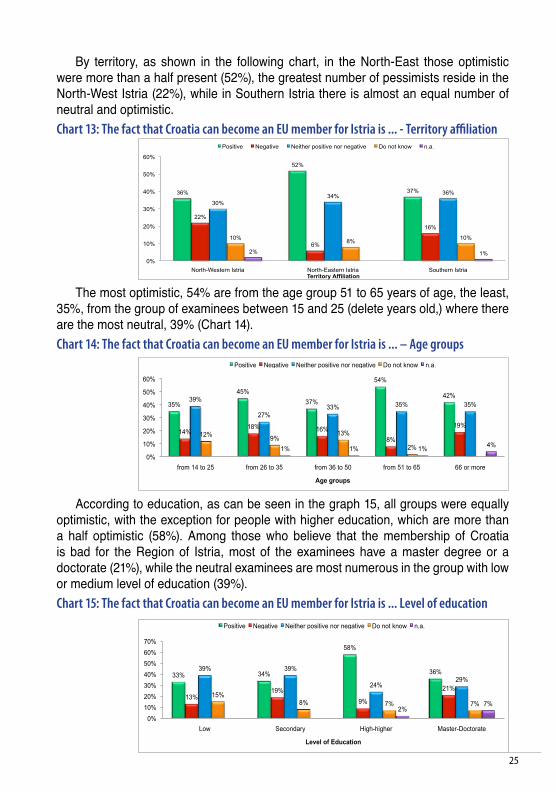
1.4. The fact that Croatia can become an EU member for Istria is ... When you move to the more general level with the question: “According to you,
the fact that Croatia can become a member of the European Union for Istria is ... “the number of those optimistic increases again (Chart 12). To the fact that Croatia can become a member of the European Union is optimistically perceived by 41% of examinees, approximately a third of them is neutral, while only 15% believes that it would be negative for the Region of Istria. Chart 12: The fact that Croatia can become an EU member for Istria is ...
25
36%
52%
37%
22%
6%
16%
30%
34% 36%
10% 8%
10%
2% 1%
0%
10%
20%
30%
40%
50%
60%
North-Western Istria North-Eastern Istria Southern Istria Territory Affiliation
Positive Negative Neither positive nor negative Do not know n.a.
35%
45%
37%
54%
42%
14% 18% 16%
8%
19%
39%
27% 33% 35% 35%
12% 9%
13%
2% 1% 1% 1% 4%
0%
10%
20%
30%
40%
50%
60%
from 14 to 25 from 26 to 35 from 36 to 50 from 51 to 65 66 or more
Age groups
Positive Negative Neither positive nor negative Do not know n.a.
33% 34%
58%
36%
13% 19%
9%
21%
39% 39%
24% 29%
15% 8% 7% 7%
2% 7%
0%
10%
20%
30%
40%
50%
60%
70%
Low Secondary High-higher Master-Doctorate
Level of Education
Positive Negative Neither positive nor negative Do not know n.a.
By territory, as shown in the following chart, in the North-East those optimistic were more than a half present (52%), the greatest number of pessimists reside in the North-West Istria (22%), while in Southern Istria there is almost an equal number of neutral and optimistic. Chart 13: The fact that Croatia can become an EU member for Istria is ... - Territory affiliation
The most optimistic, 54% are from the age group 51 to 65 years of age, the least, 35%, from the group of examinees between 15 and 25 (delete years old,) where there are the most neutral, 39% (Chart 14). Chart 14: The fact that Croatia can become an EU member for Istria is ... – Age groups
According to education, as can be seen in the graph 15, all groups were equally optimistic, with the exception for people with higher education, which are more than a half optimistic (58%). Among those who believe that the membership of Croatia is bad for the Region of Istria, most of the examinees have a master degree or a doctorate (21%), while the neutral examinees are most numerous in the group with low or medium level of education (39%). Chart 15: The fact that Croatia can become an EU member for Istria is ... Level of education
26
48%
68%
48%
71%
54%
38%
20%
34%
14%
27%
13% 12%
18% 15%
19%
1%
0%
10%
20%
30%
40%
50%
60%
70%
80%
from 14 to 25 from 26 to 35 from 36 to 50 from 51 to 65 66 or more
Age groups
Yes No Do not know n.a
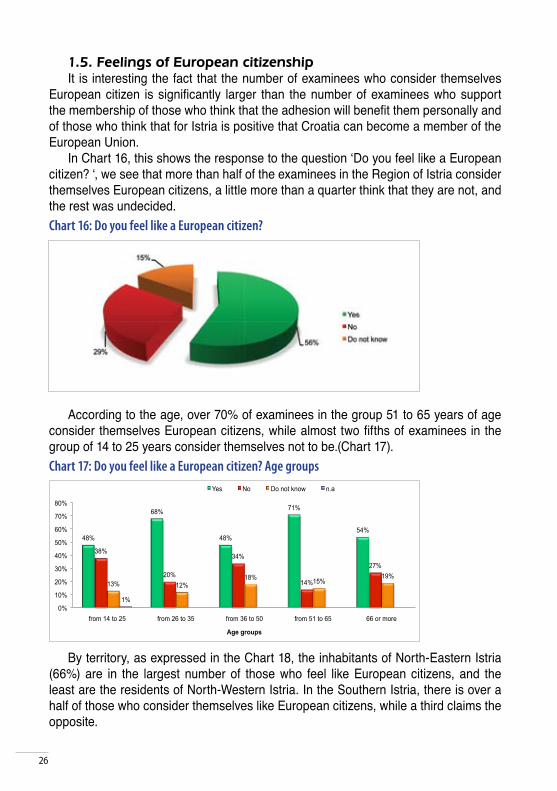
1.5. Feelings of European citizenship It is interesting the fact that the number of examinees who consider themselves
European citizen is significantly larger than the number of examinees who support the membership of those who think that the adhesion will benefit them personally and of those who think that for Istria is positive that Croatia can become a member of the European Union.
In Chart 16, this shows the response to the question ‘Do you feel like a European citizen? ‘, we see that more than half of the examinees in the Region of Istria consider themselves European citizens, a little more than a quarter think that they are not, and the rest was undecided. Chart 16: Do you feel like a European citizen?
According to the age, over 70% of examinees in the group 51 to 65 years of age consider themselves European citizens, while almost two fifths of examinees in the group of 14 to 25 years consider themselves not to be.(Chart 17). Chart 17: Do you feel like a European citizen? Age groups
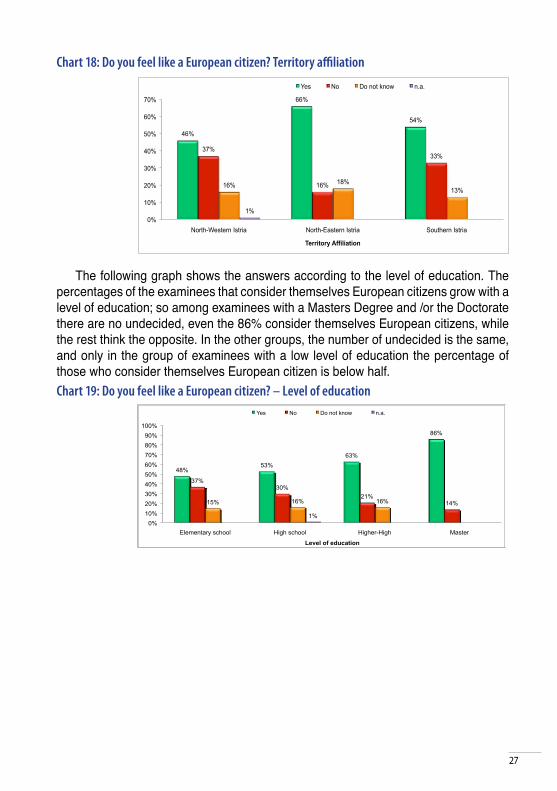
By territory, as expressed in the Chart 18, the inhabitants of North-Eastern Istria (66%) are in the largest number of those who feel like European citizens, and the least are the residents of North-Western Istria. In the Southern Istria, there is over a half of those who consider themselves like European citizens, while a third claims the opposite.
27
46%
66%
54%
37%
16%
33%
16% 18%
13%
1%
0%
10%
20%
30%
40%
50%
60%
70%
North-Western Istria North-Eastern Istria Southern Istria
Territory Affiliation
Yes No Do not know n.a.
48% 53%
63%
86%
37% 30%
21% 14% 15% 16% 16%
1%
0%
10%
20%
30%
40%
50%
60%
70%
80%
90%
100%
Elementary school High school Higher-High Master
Level of education
Yes No Do not know n.a.
Chart 18: Do you feel like a European citizen? Territory affiliation
The following graph shows the answers according to the level of education. The percentages of the examinees that consider themselves European citizens grow with a level of education; so among examinees with a Masters Degree and /or the Doctorate there are no undecided, even the 86% consider themselves European citizens, while the rest think the opposite. In the other groups, the number of undecided is the same, and only in the group of examinees with a low level of education the percentage of those who consider themselves European citizen is below half. Chart 19: Do you feel like a European citizen? – Level of education
28
26%
44%
32%
18%
11%
19%
48%
38%
43%
8% 7% 5%
1%
0%
10%
20%
30%
40%
50%
60%
North-Western Istria North-Eastern Istria Southern Istria
Territory affiliation
Positive Negative Neutral Do not know n.a.
45%
24%
34%
17%
29%
17%
36%
44% 43%
2% 3% 6%
0%
5%
10%
15%
20%
25%
30%
35%
40%
45%
50%
Eu 27 Croatia Istrian County
Level of education
Positive Negative Neutral Do not know
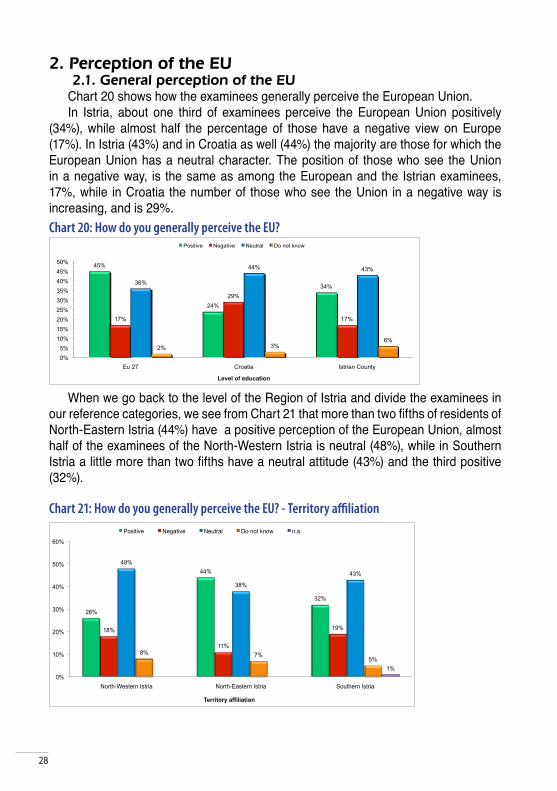
2. Perception of the EU 2.1. General perception of the EU Chart 20 shows how the examinees generally perceive the European Union. In Istria, about one third of examinees perceive the European Union positively
(34%), while almost half the percentage of those have a negative view on Europe (17%). In Istria (43%) and in Croatia as well (44%) the majority are those for which the European Union has a neutral character. The position of those who see the Union in a negative way, is the same as among the European and the Istrian examinees, 17%, while in Croatia the number of those who see the Union in a negative way is increasing, and is 29%. Chart 20: How do you generally perceive the EU?
When we go back to the level of the Region of Istria and divide the examinees in our reference categories, we see from Chart 21 that more than two fifths of residents of North-Eastern Istria (44%) have a positive perception of the European Union, almost half of the examinees of the North-Western Istria is neutral (48%), while in Southern Istria a little more than two fifths have a neutral attitude (43%) and the third positive (32%).
Chart 21: How do you generally perceive the EU? - Territory affiliation
29
23%
29%
48% 43%
17% 19%
13% 14%
48% 45%
36%
43%
12%
6% 3% 1%
0%
10%
20%
30%
40%
50%
60%
Low Secondary High-higher Master-Doctorate
Level of education
Positive Negative Neutral Do not know n.a
25%
37%
32%
48%
38%
18% 18% 20%
9%
15%
46% 43% 44%
38%
31%
11%
1% 4% 5%
12%
1% 4%
0%
10%
20%
30%
40%
50%
60%
from 14 to 25 from 26 to 35 from 36 to 50 from 51 to 65 66 or more
Age group
Positive Negative Neutral Do not know n.a
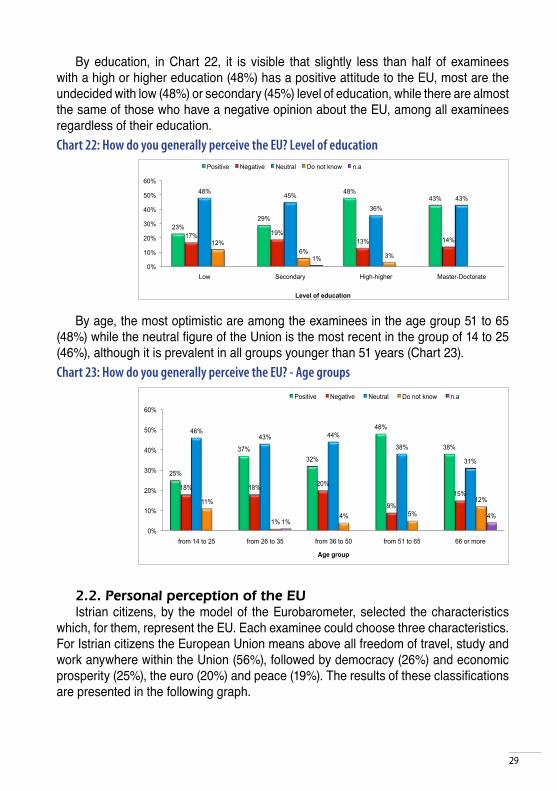
By education, in Chart 22, it is visible that slightly less than half of examinees with a high or higher education (48%) has a positive attitude to the EU, most are the undecided with low (48%) or secondary (45%) level of education, while there are almost the same of those who have a negative opinion about the EU, among all examinees regardless of their education. Chart 22: How do you generally perceive the EU? Level of education
By age, the most optimistic are among the examinees in the age group 51 to 65 (48%) while the neutral figure of the Union is the most recent in the group of 14 to 25 (46%), although it is prevalent in all groups younger than 51 years (Chart 23). Chart 23: How do you generally perceive the EU? - Age groups
2.2. Personal perception of the EUIstrian citizens, by the model of the Eurobarometer, selected the characteristics
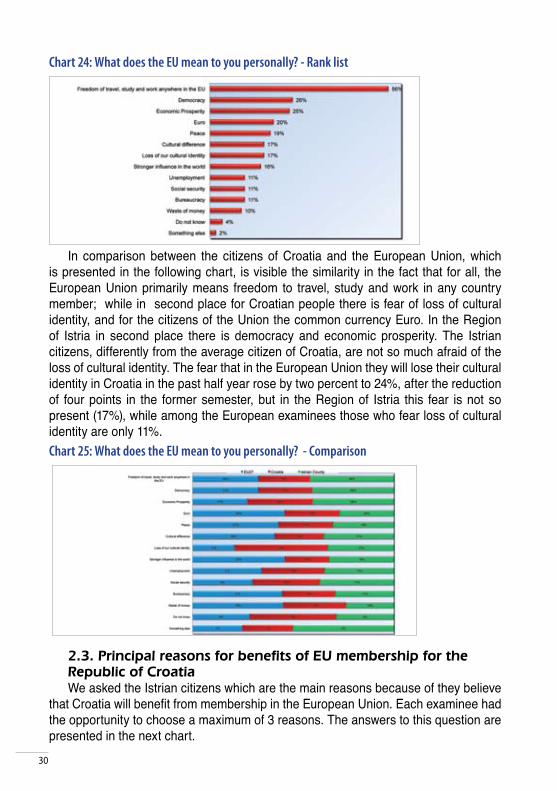
which, for them, represent the EU. Each examinee could choose three characteristics. For Istrian citizens the European Union means above all freedom of travel, study and work anywhere within the Union (56%), followed by democracy (26%) and economic prosperity (25%), the euro (20%) and peace (19%). The results of these classifications are presented in the following graph.
30
Chart 24: What does the EU mean to you personally? - Rank list
In comparison between the citizens of Croatia and the European Union, which is presented in the following chart, is visible the similarity in the fact that for all, the European Union primarily means freedom to travel, study and work in any country member; while in second place for Croatian people there is fear of loss of cultural identity, and for the citizens of the Union the common currency Euro. In the Region of Istria in second place there is democracy and economic prosperity. The Istrian citizens, differently from the average citizen of Croatia, are not so much afraid of the loss of cultural identity. The fear that in the European Union they will lose their cultural identity in Croatia in the past half year rose by two percent to 24%, after the reduction of four points in the former semester, but in the Region of Istria this fear is not so present (17%), while among the European examinees those who fear loss of cultural identity are only 11%. Chart 25: What does the EU mean to you personally? - Comparison
2.3. Principal reasons for benefits of EU membership for the Republic of Croatia We asked the Istrian citizens which are the main reasons because of they believe
that Croatia will benefit from membership in the European Union. Each examinee had the opportunity to choose a maximum of 3 reasons. The answers to this question are presented in the next chart.
31
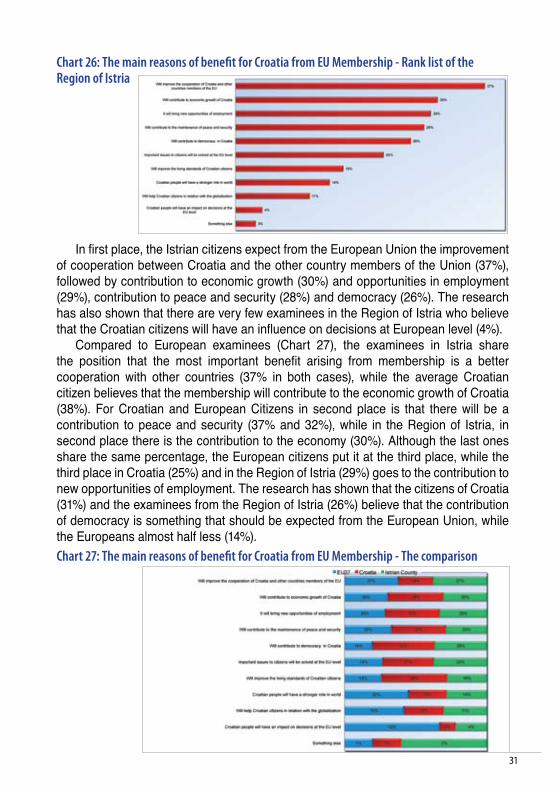
Chart 26: The main reasons of benefit for Croatia from EU Membership - Rank list of the Region of Istria
In first place, the Istrian citizens expect from the European Union the improvement of cooperation between Croatia and the other country members of the Union (37%), followed by contribution to economic growth (30%) and opportunities in employment (29%), contribution to peace and security (28%) and democracy (26%). The research has also shown that there are very few examinees in the Region of Istria who believe that the Croatian citizens will have an influence on decisions at European level (4%).
Compared to European examinees (Chart 27), the examinees in Istria share the position that the most important benefit arising from membership is a better cooperation with other countries (37% in both cases), while the average Croatian citizen believes that the membership will contribute to the economic growth of Croatia (38%). For Croatian and European Citizens in second place is that there will be a contribution to peace and security (37% and 32%), while in the Region of Istria, in second place there is the contribution to the economy (30%). Although the last ones share the same percentage, the European citizens put it at the third place, while the third place in Croatia (25%) and in the Region of Istria (29%) goes to the contribution to new opportunities of employment. The research has shown that the citizens of Croatia (31%) and the examinees from the Region of Istria (26%) believe that the contribution of democracy is something that should be expected from the European Union, while the Europeans almost half less (14%). Chart 27: The main reasons of benefit for Croatia from EU Membership - The comparison
32
2.4. Principal reasons why the Republic of Croatia would not benefit fromEU membershipWe have made the same question in a negative form, asking the citizens for the
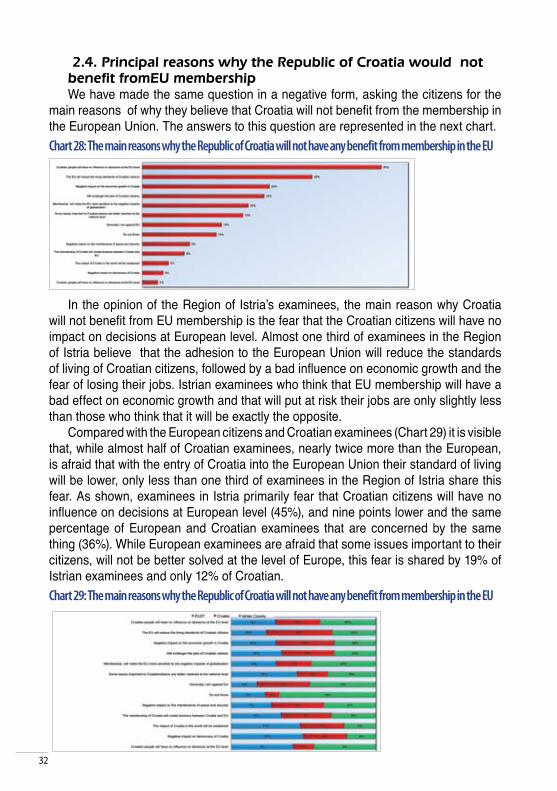
main reasons of why they believe that Croatia will not benefit from the membership in the European Union. The answers to this question are represented in the next chart. Chart 28: The main reasons why the Republic of Croatia will not have any benefit from membership in the EU
In the opinion of the Region of Istria’s examinees, the main reason why Croatia will not benefit from EU membership is the fear that the Croatian citizens will have no impact on decisions at European level. Almost one third of examinees in the Region of Istria believe that the adhesion to the European Union will reduce the standards of living of Croatian citizens, followed by a bad influence on economic growth and the fear of losing their jobs. Istrian examinees who think that EU membership will have a bad effect on economic growth and that will put at risk their jobs are only slightly less than those who think that it will be exactly the opposite.
Compared with the European citizens and Croatian examinees (Chart 29) it is visible that, while almost half of Croatian examinees, nearly twice more than the European, is afraid that with the entry of Croatia into the European Union their standard of living will be lower, only less than one third of examinees in the Region of Istria share this fear. As shown, examinees in Istria primarily fear that Croatian citizens will have no influence on decisions at European level (45%), and nine points lower and the same percentage of European and Croatian examinees that are concerned by the same thing (36%). While European examinees are afraid that some issues important to their citizens, will not be better solved at the level of Europe, this fear is shared by 19% of Istrian examinees and only 12% of Croatian. Chart 29: The main reasons why the Republic of Croatia will not have any benefit from membership in the EU
33
60%
36%
21%
31%
54% 54%
9% 10%
25%
0%
10%
20%
30%
40%
50%
60%
70%
EU 27 Croatia Istrian County
Mostly agree Mostly disagree Do not know
25%
16% 16%
24% 27%
51%
64%
56%
38%
54%
22% 20%
27%
38%
12%
2% 1%
7%
0%
10%
20%
30%
40%
50%
60%
70%
from 14 to 25 from 26 to 35 from 36 to 50 from 51 to 65 66 or more
Age groups
Mostly agree Mostly disagree Do not know n.a
2.5. Attitude of acceptance of their own country’s interests in the EUOn the question whether the interests of Croatia are taken in consideration in the
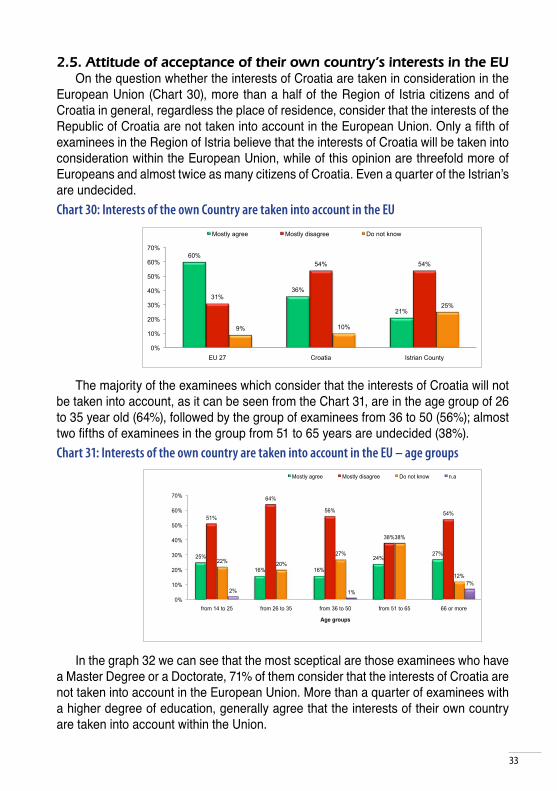
European Union (Chart 30), more than a half of the Region of Istria citizens and of Croatia in general, regardless the place of residence, consider that the interests of the Republic of Croatia are not taken into account in the European Union. Only a fifth of examinees in the Region of Istria believe that the interests of Croatia will be taken into consideration within the European Union, while of this opinion are threefold more of Europeans and almost twice as many citizens of Croatia. Even a quarter of the Istrian’s are undecided. Chart 30: Interests of the own Country are taken into account in the EU
The majority of the examinees which consider that the interests of Croatia will not be taken into account, as it can be seen from the Chart 31, are in the age group of 26 to 35 year old (64%), followed by the group of examinees from 36 to 50 (56%); almost two fifths of examinees in the group from 51 to 65 years are undecided (38%). Chart 31: Interests of the own country are taken into account in the EU – age groups
In the graph 32 we can see that the most sceptical are those examinees who have a Master Degree or a Doctorate, 71% of them consider that the interests of Croatia are not taken into account in the European Union. More than a quarter of examinees with a higher degree of education, generally agree that the interests of their own country are taken into account within the Union.
34
19% 20% 26%
7%
55% 52% 51%
71%
23% 27%
23%
14%
3% 1%
8%
0%
10%
20%
30%
40%
50%
60%
70%
80%
Low Secondary High-higher Master-Doctorate
Level of education
Mostly agree Mostly disagree Do not know n.a
60%
78%
63%
27%
15% 20%
13% 7%
17%
0%
10%
20%
30%
40%
50%
60%
70%
80%
90%
EU 27 Croatia Istrian County
Mostly agree Mostly disagree Do not know
65% 68%
63%
53% 58%
14%
24%
16%
28%
19% 18%
8%
20% 19% 19%
3% 1% 4%
0%
10%
20%
30%
40%
50%
60%
70%
80%
from 14 to 25 from 26 to 35 from 36 to 50 from 51 to 65 66 or more
Age groups
Mostly agree Mostly disagree Do not know n.a
Chart 32: Interests of the own country are taken into account in the EU – Level of education
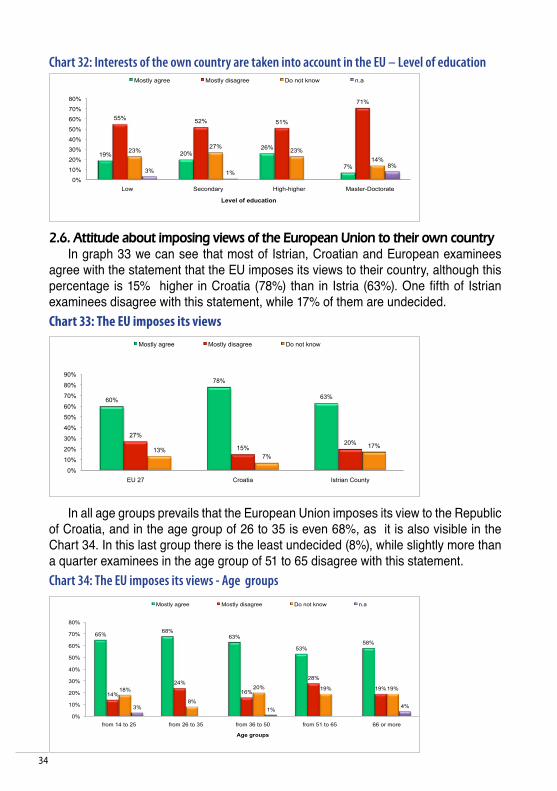
2.6. Attitude about imposing views of the European Union to their own countryIn graph 33 we can see that most of Istrian, Croatian and European examinees
agree with the statement that the EU imposes its views to their country, although this percentage is 15% higher in Croatia (78%) than in Istria (63%). One fifth of Istrian examinees disagree with this statement, while 17% of them are undecided. Chart 33: The EU imposes its views
In all age groups prevails that the European Union imposes its view to the Republic of Croatia, and in the age group of 26 to 35 is even 68%, as it is also visible in the Chart 34. In this last group there is the least undecided (8%), while slightly more than a quarter examinees in the age group of 51 to 65 disagree with this statement. Chart 34: The EU imposes its views - Age groups
35
62% 65%
61%
50%
13% 18%
24%
36%
21% 16% 15%
7% 4%
1% 7%
0%
10%
20%
30%
40%
50%
60%
70%
Low Secondary High-higher Master-Doctorate
Level of education
Mostly agree Mostly disagree Do not know n.a
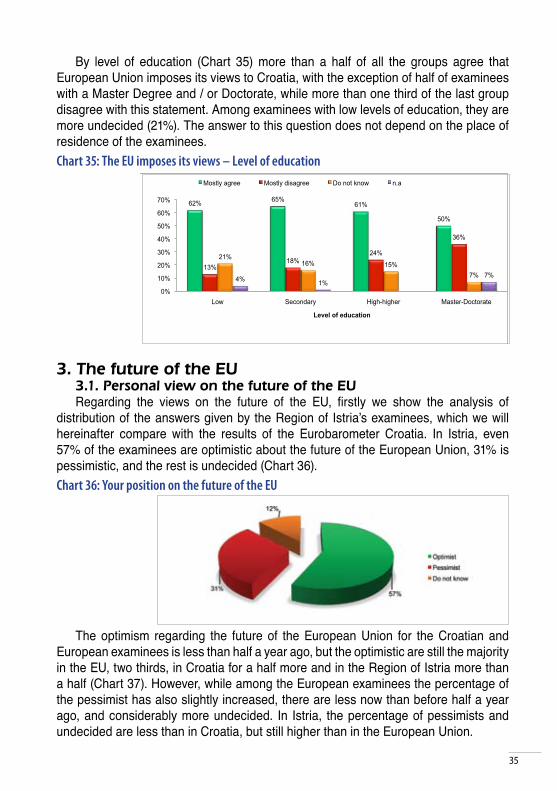
By level of education (Chart 35) more than a half of all the groups agree that European Union imposes its views to Croatia, with the exception of half of examinees with a Master Degree and / or Doctorate, while more than one third of the last group disagree with this statement. Among examinees with low levels of education, they are more undecided (21%). The answer to this question does not depend on the place of residence of the examinees. Chart 35: The EU imposes its views – Level of education
3. The future of the EU 3.1. Personal view on the future of the EURegarding the views on the future of the EU, firstly we show the analysis of
distribution of the answers given by the Region of Istria’s examinees, which we will hereinafter compare with the results of the Eurobarometer Croatia. In Istria, even 57% of the examinees are optimistic about the future of the European Union, 31% is pessimistic, and the rest is undecided (Chart 36). Chart 36: Your position on the future of the EU
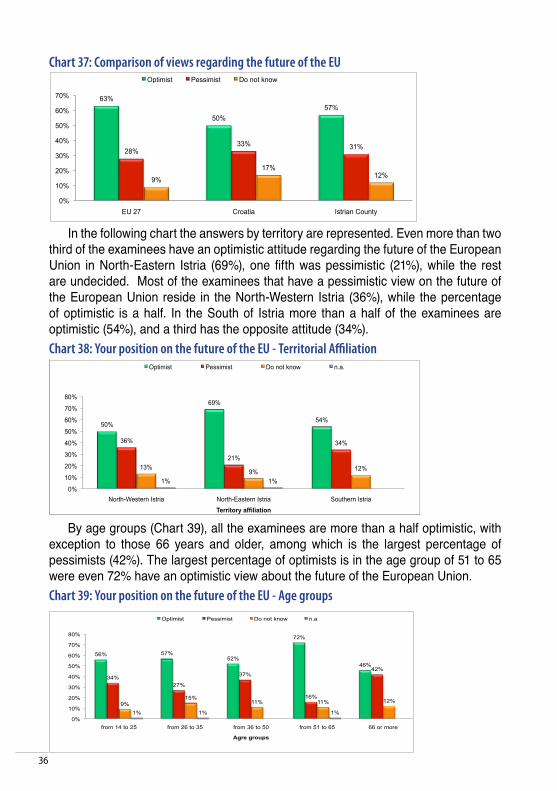
The optimism regarding the future of the European Union for the Croatian and European examinees is less than half a year ago, but the optimistic are still the majority in the EU, two thirds, in Croatia for a half more and in the Region of Istria more than a half (Chart 37). However, while among the European examinees the percentage of the pessimist has also slightly increased, there are less now than before half a year ago, and considerably more undecided. In Istria, the percentage of pessimists and undecided are less than in Croatia, but still higher than in the European Union.
36
63%
50%
57%
28% 33% 31%
9%
17% 12%
0%
10%
20%
30%
40%
50%
60%
70%
EU 27 Croatia Istrian County
Optimist Pessimist Do not know
50%
69%
54%
36%
21%
34%
13% 9%
12%
1% 1%
0%
10%
20%
30%
40%
50%
60%
70%
80%
North-Western Istria North-Eastern Istria Southern Istria
Territory affiliation
Optimist Pessimist Do not know n.a.
56% 57% 52%
72%
46%
34%
27%
37%
16%
42%
9%
15% 11% 11% 12%
1% 1% 1%
0%
10%
20%
30%
40%
50%
60%
70%
80%
from 14 to 25 from 26 to 35 from 36 to 50 from 51 to 65 66 or more
Agre groups
Optimist Pessimist Do not know n.a
Chart 37: Comparison of views regarding the future of the EU
In the following chart the answers by territory are represented. Even more than two third of the examinees have an optimistic attitude regarding the future of the European Union in North-Eastern Istria (69%), one fifth was pessimistic (21%), while the rest are undecided. Most of the examinees that have a pessimistic view on the future of the European Union reside in the North-Western Istria (36%), while the percentage of optimistic is a half. In the South of Istria more than a half of the examinees are optimistic (54%), and a third has the opposite attitude (34%). Chart 38: Your position on the future of the EU - Territorial Affiliation
By age groups (Chart 39), all the examinees are more than a half optimistic, with exception to those 66 years and older, among which is the largest percentage of pessimists (42%). The largest percentage of optimists is in the age group of 51 to 65 were even 72% have an optimistic view about the future of the European Union. Chart 39: Your position on the future of the EU - Age groups
37
52% 54%
67%
50%
37%
30% 27%
36%
9%
16%
5%
14%
2% 1%
0%
10%
20%
30%
40%
50%
60%
70%
80%
Low Secondary High-higher Master-Doctorate
Level of education
Optimist Pessimist Do not know n.a
44%
59%
52%
43%
23% 18%
13% 18%
30%
0%
10%
20%
30%
40%
50%
60%
70%
EU 27 Croatia Istrian County
Yes No Do not know
More are the pessimists among the examinees with low levels of education (37%), while even two thirds of examinees with high levels of education have a positive attitude regarding the future of the European Union. These results are shown in the following chart. Chart 40: Your position on the future of the EU - Level of Education
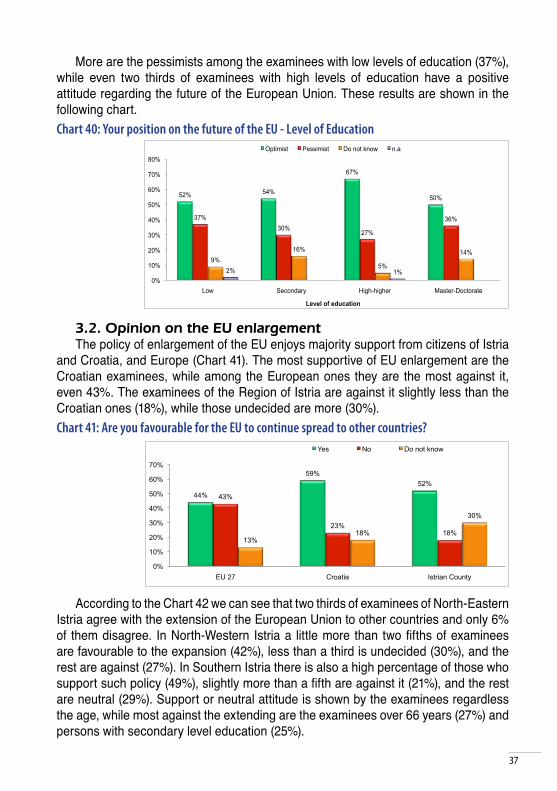
3.2. Opinion on the EU enlargementThe policy of enlargement of the EU enjoys majority support from citizens of Istria
and Croatia, and Europe (Chart 41). The most supportive of EU enlargement are the Croatian examinees, while among the European ones they are the most against it, even 43%. The examinees of the Region of Istria are against it slightly less than the Croatian ones (18%), while those undecided are more (30%). Chart 41: Are you favourable for the EU to continue spread to other countries?
According to the Chart 42 we can see that two thirds of examinees of North-Eastern Istria agree with the extension of the European Union to other countries and only 6% of them disagree. In North-Western Istria a little more than two fifths of examinees are favourable to the expansion (42%), less than a third is undecided (30%), and the rest are against (27%). In Southern Istria there is also a high percentage of those who support such policy (49%), slightly more than a fifth are against it (21%), and the rest are neutral (29%). Support or neutral attitude is shown by the examinees regardless the age, while most against the extending are the examinees over 66 years (27%) and persons with secondary level education (25%).
38
42%
66%
49%
27%
6%
21%
30% 26%
29%
1% 2% 1%
0%
10%
20%
30%
40%
50%
60%
70%
North-Western Istria North-Eastern Istria Southern Istria
Territory affiliation
Yes No Do not know n.a.
48%
62% 59%
39%
27% 28%
13% 11% 14%
0%
10%
20%
30%
40%
50%
60%
70%
EU 27 Croatia Istrian County
Agree Disagree Do not know
Chart 42: Are you favourable for the EU to continue spread to other countries? - Territory Affiliation
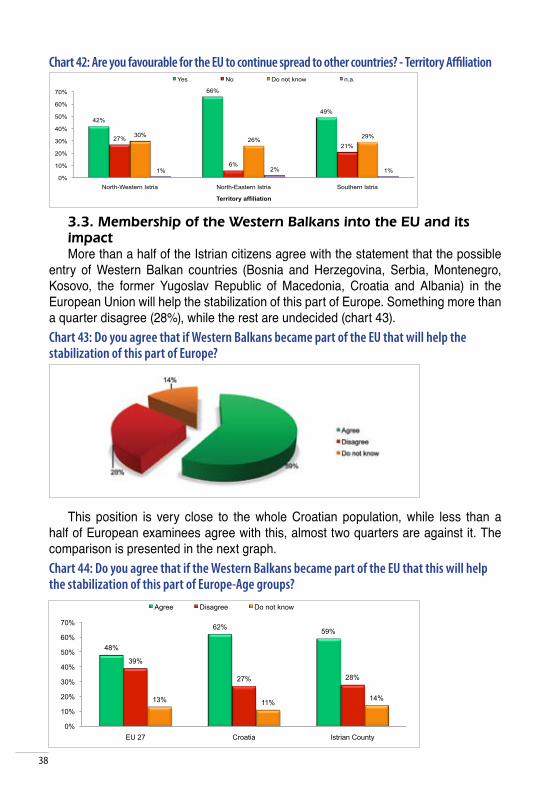
3.3. Membership of the Western Balkans into the EU and its impactMore than a half of the Istrian citizens agree with the statement that the possible
entry of Western Balkan countries (Bosnia and Herzegovina, Serbia, Montenegro, Kosovo, the former Yugoslav Republic of Macedonia, Croatia and Albania) in the European Union will help the stabilization of this part of Europe. Something more than a quarter disagree (28%), while the rest are undecided (chart 43). Chart 43: Do you agree that if Western Balkans became part of the EU that will help the stabilization of this part of Europe?
This position is very close to the whole Croatian population, while less than a half of European examinees agree with this, almost two quarters are against it. The comparison is presented in the next graph. Chart 44: Do you agree that if the Western Balkans became part of the EU that this will help the stabilization of this part of Europe-Age groups?
39
56% 59%
64% 61%
50%
29% 33%
20%
29% 31%
14%
8%
16%
10%
19%
1%
0%
10%
20%
30%
40%
50%
60%
70%
from 14 to 25 from 26 to 35 from 36 to 50 from 51 to 65 66 or more
Age groups
Agree Disagree Do not know n.a
51%
60%
65%
50%
28% 26%
28%
50%
20%
14%
7%
1%
0%
10%
20%
30%
40%
50%
60%
70%
Low Secondary High-higher Master-Doctorate
Level of education
Agree Disagree Do not know n.a
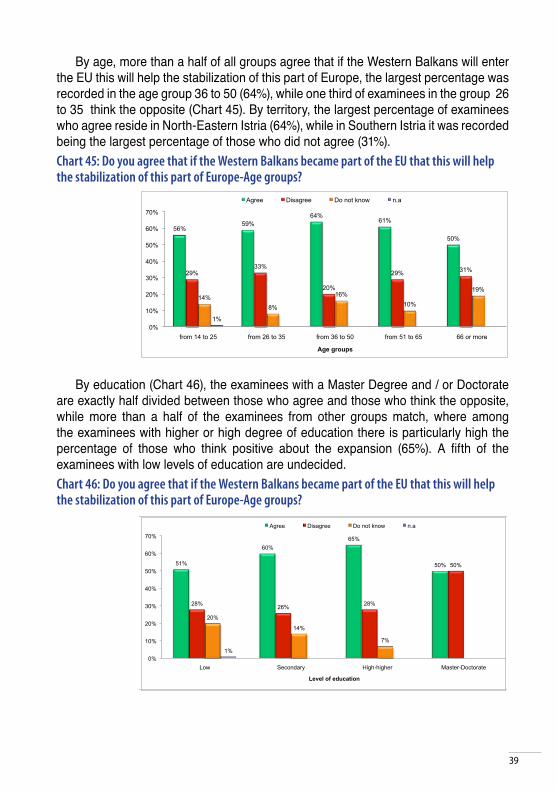
By age, more than a half of all groups agree that if the Western Balkans will enter the EU this will help the stabilization of this part of Europe, the largest percentage was recorded in the age group 36 to 50 (64%), while one third of examinees in the group 26 to 35 think the opposite (Chart 45). By territory, the largest percentage of examinees who agree reside in North-Eastern Istria (64%), while in Southern Istria it was recorded being the largest percentage of those who did not agree (31%). Chart 45: Do you agree that if the Western Balkans became part of the EU that this will help the stabilization of this part of Europe-Age groups?
By education (Chart 46), the examinees with a Master Degree and / or Doctorate are exactly half divided between those who agree and those who think the opposite, while more than a half of the examinees from other groups match, where among the examinees with higher or high degree of education there is particularly high the percentage of those who think positive about the expansion (65%). A fifth of the examinees with low levels of education are undecided. Chart 46: Do you agree that if the Western Balkans became part of the EU that this will help the stabilization of this part of Europe-Age groups?
40
51%
39% 37%
31%
41%
25%
18% 20%
38%
0%
10%
20%
30%
40%
50%
60%
EU 27 Croatia Istrian County
Yes No Do not know
30%
41%
38%
31%
16%
27%
38%
42%
33%
1% 1% 2%
0%
5%
10%
15%
20%
25%
30%
35%
40%
45%
North-Western Istria North-Eastern Istria Southern Istria
Territory affiliation
Yes No Do not know n.a.
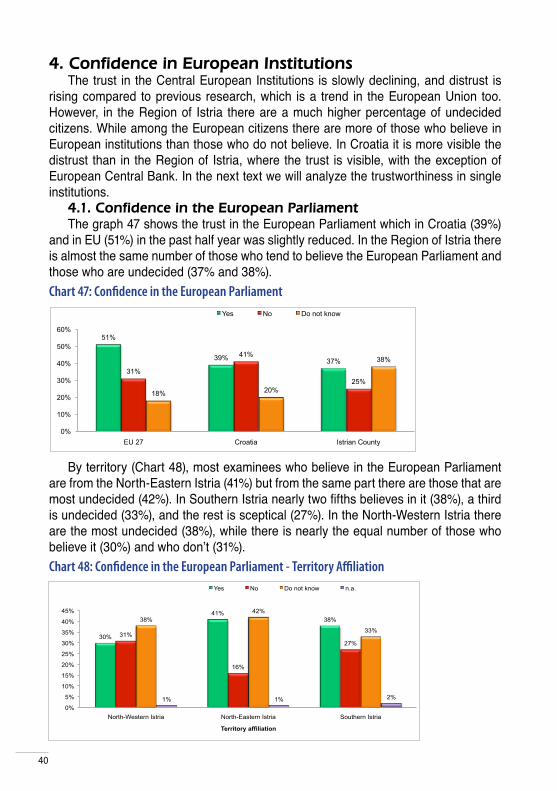
4. Confidence in European Institutions The trust in the Central European Institutions is slowly declining, and distrust is
rising compared to previous research, which is a trend in the European Union too. However, in the Region of Istria there are a much higher percentage of undecided citizens. While among the European citizens there are more of those who believe in European institutions than those who do not believe. In Croatia it is more visible the distrust than in the Region of Istria, where the trust is visible, with the exception of European Central Bank. In the next text we will analyze the trustworthiness in single institutions.
4.1. Confidence in the European Parliament The graph 47 shows the trust in the European Parliament which in Croatia (39%)
and in EU (51%) in the past half year was slightly reduced. In the Region of Istria there is almost the same number of those who tend to believe the European Parliament and those who are undecided (37% and 38%). Chart 47: Confidence in the European Parliament
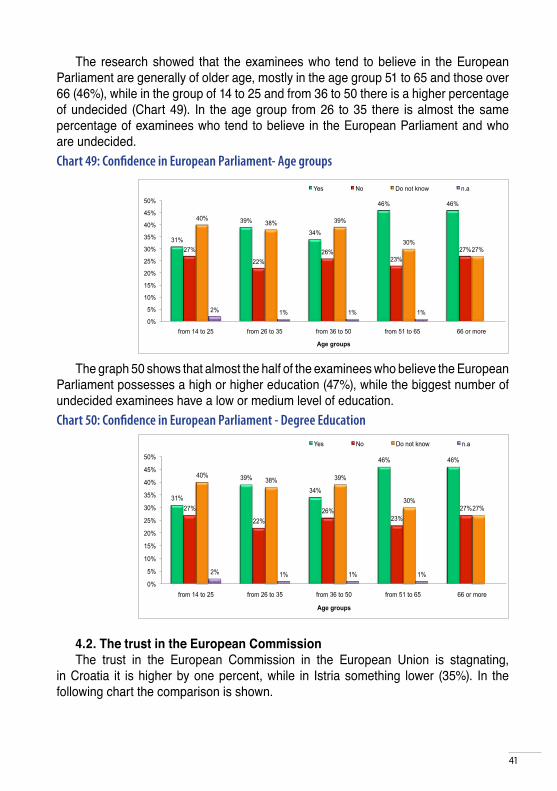
By territory (Chart 48), most examinees who believe in the European Parliament are from the North-Eastern Istria (41%) but from the same part there are those that are most undecided (42%). In Southern Istria nearly two fifths believes in it (38%), a third is undecided (33%), and the rest is sceptical (27%). In the North-Western Istria there are the most undecided (38%), while there is nearly the equal number of those who believe it (30%) and who don’t (31%). Chart 48: Confidence in the European Parliament - Territory Affiliation
41
31%
39%
34%
46% 46%
27%
22%
26%
23%
27%
40% 38% 39%
30%
27%
2% 1% 1% 1%
0%
5%
10%
15%
20%
25%
30%
35%
40%
45%
50%
from 14 to 25 from 26 to 35 from 36 to 50 from 51 to 65 66 or more
Age groups
Yes No Do not know n.a
31%
39%
34%
46% 46%
27%
22%
26%
23%
27%
40% 38% 39%
30%
27%
2% 1% 1% 1%
0%
5%
10%
15%
20%
25%
30%
35%
40%
45%
50%
from 14 to 25 from 26 to 35 from 36 to 50 from 51 to 65 66 or more
Age groups
Yes No Do not know n.a
The research showed that the examinees who tend to believe in the European Parliament are generally of older age, mostly in the age group 51 to 65 and those over 66 (46%), while in the group of 14 to 25 and from 36 to 50 there is a higher percentage of undecided (Chart 49). In the age group from 26 to 35 there is almost the same percentage of examinees who tend to believe in the European Parliament and who are undecided. Chart 49: Confidence in European Parliament- Age groups
The graph 50 shows that almost the half of the examinees who believe the European Parliament possesses a high or higher education (47%), while the biggest number of undecided examinees have a low or medium level of education. Chart 50: Confidence in European Parliament - Degree Education
4.2. The trust in the European Commission The trust in the European Commission in the European Union is stagnating,
in Croatia it is higher by one percent, while in Istria something lower (35%). In the following chart the comparison is shown.
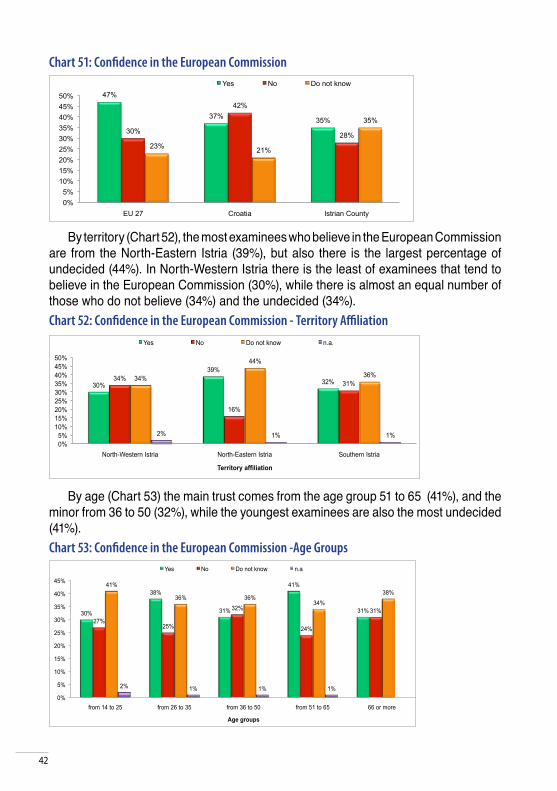
42
47%
37% 35%
30%
42%
28%
23% 21%
35%
0%
5%
10%
15%
20%
25%
30%
35%
40%
45%
50%
EU 27 Croatia Istrian County
Yes No Do not know
30%
39%
32% 34%
16%
31% 34%
44%
36%
2% 1% 1%
0%
5%
10%
15%
20%
25%
30%
35%
40%
45%
50%
North-Western Istria North-Eastern Istria Southern Istria
Territory affiliation
Yes No Do not know n.a.
30%
38%
31%
41%
31%
27% 25%
32%
24%
31%
41%
36% 36% 34%
38%
2% 1% 1% 1%
0%
5%
10%
15%
20%
25%
30%
35%
40%
45%
from 14 to 25 from 26 to 35 from 36 to 50 from 51 to 65 66 or more
Age groups
Yes No Do not know n.a
Chart 51: Confidence in the European Commission
By territory (Chart 52), the most examinees who believe in the European Commission are from the North-Eastern Istria (39%), but also there is the largest percentage of undecided (44%). In North-Western Istria there is the least of examinees that tend to believe in the European Commission (30%), while there is almost an equal number of those who do not believe (34%) and the undecided (34%). Chart 52: Confidence in the European Commission - Territory Affiliation
By age (Chart 53) the main trust comes from the age group 51 to 65 (41%), and the minor from 36 to 50 (32%), while the youngest examinees are also the most undecided (41%). Chart 53: Confidence in the European Commission -Age Groups
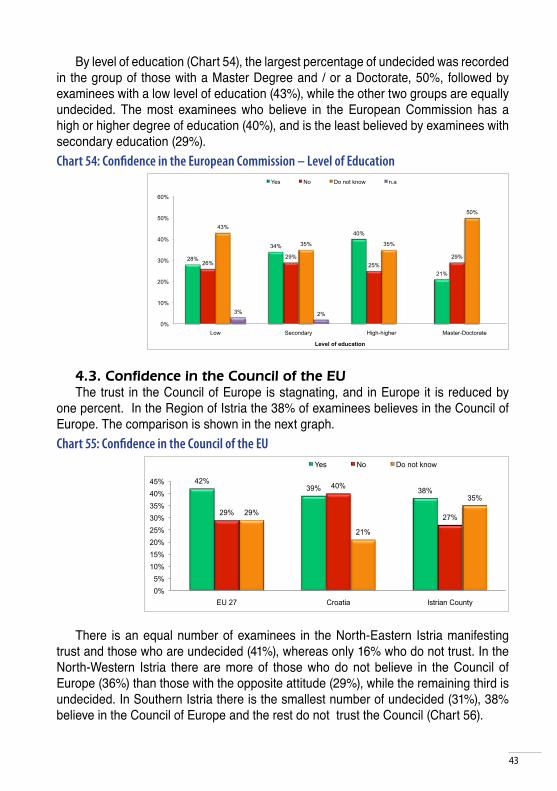
43
28%
34%
40%
21%
26% 29%
25%
29%
43%
35% 35%
50%
3% 2%
0%
10%
20%
30%
40%
50%
60%
Low Secondary High-higher Master-Doctorate
Level of education
Yes No Do not know n.a
42% 39% 38%
29%
40%
27% 29%
21%
35%
0%
5%
10%
15%
20%
25%
30%
35%
40%
45%
EU 27 Croatia Istrian County
Yes No Do not know
By level of education (Chart 54), the largest percentage of undecided was recorded in the group of those with a Master Degree and / or a Doctorate, 50%, followed by examinees with a low level of education (43%), while the other two groups are equally undecided. The most examinees who believe in the European Commission has a high or higher degree of education (40%), and is the least believed by examinees with secondary education (29%). Chart 54: Confidence in the European Commission – Level of Education
4.3. Confidence in the Council of the EU The trust in the Council of Europe is stagnating, and in Europe it is reduced by
one percent. In the Region of Istria the 38% of examinees believes in the Council of Europe. The comparison is shown in the next graph. Chart 55: Confidence in the Council of the EU
There is an equal number of examinees in the North-Eastern Istria manifesting trust and those who are undecided (41%), whereas only 16% who do not trust. In the North-Western Istria there are more of those who do not believe in the Council of Europe (36%) than those with the opposite attitude (29%), while the remaining third is undecided. In Southern Istria there is the smallest number of undecided (31%), 38% believe in the Council of Europe and the rest do not trust the Council (Chart 56).
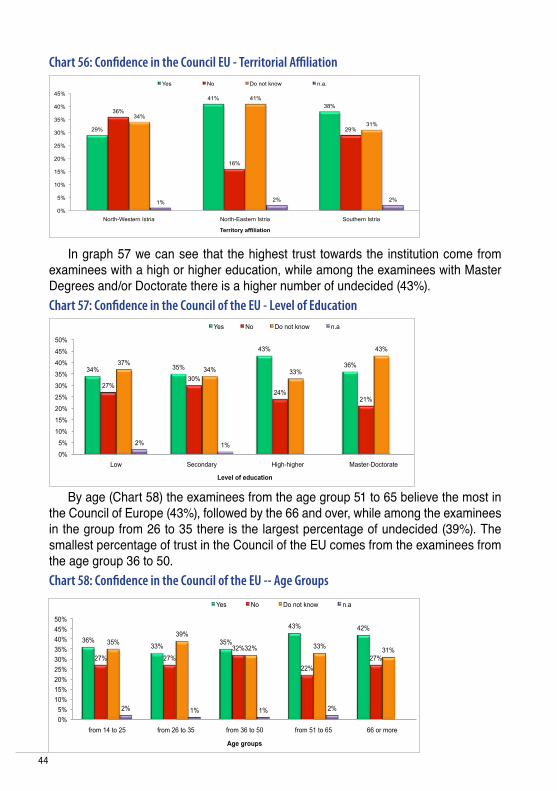
44
29%
41%
38% 36%
16%
29%
34%
41%
31%
1% 2% 2%
0%
5%
10%
15%
20%
25%
30%
35%
40%
45%
North-Western Istria North-Eastern Istria Southern Istria
Territory affiliation
Yes No Do not know n.a.
34% 35%
43%
36%
27% 30%
24% 21%
37% 34% 33%
43%
2% 1%
0%
5%
10%
15%
20%
25%
30%
35%
40%
45%
50%
Low Secondary High-higher Master-Doctorate
Level of education
Yes No Do not know n.a
36% 33%
35%
43% 42%
27% 27%
32%
22%
27%
35%
39%
32% 33% 31%
2% 1% 1% 2%
0%
5%
10%
15%
20%
25%
30%
35%
40%
45%
50%
from 14 to 25 from 26 to 35 from 36 to 50 from 51 to 65 66 or more
Age groups
Yes No Do not know n.a
Chart 56: Confidence in the Council EU - Territorial Affiliation
In graph 57 we can see that the highest trust towards the institution come from examinees with a high or higher education, while among the examinees with Master Degrees and/or Doctorate there is a higher number of undecided (43%). Chart 57: Confidence in the Council of the EU - Level of Education
By age (Chart 58) the examinees from the age group 51 to 65 believe the most in the Council of Europe (43%), followed by the 66 and over, while among the examinees in the group from 26 to 35 there is the largest percentage of undecided (39%). The smallest percentage of trust in the Council of the EU comes from the examinees from the age group 36 to 50. Chart 58: Confidence in the Council of the EU -- Age Groups
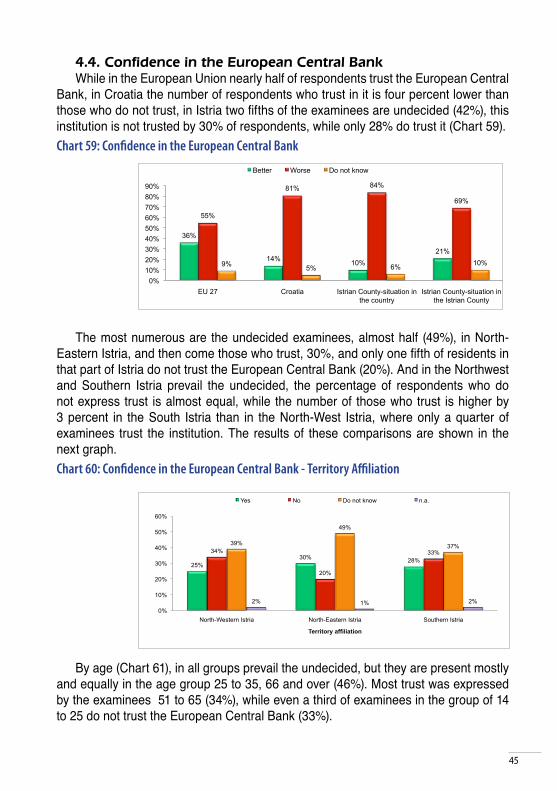
45
36%
14% 10%
21%
55%
81% 84%
69%
9% 5% 6%
10%
0%
10%
20%
30%
40%
50%
60%
70%
80%
90%
EU 27 Croatia Istrian County-situation in
the country
Istrian County-situation in
the Istrian County
Better Worse Do not know
25%
30% 28%
34%
20%
33%
39%
49%
37%
2% 1% 2%
0%
10%
20%
30%
40%
50%
60%
North-Western Istria North-Eastern Istria Southern Istria
Territory affiliation
Yes No Do not know n.a.
4.4. Confidence in the European Central Bank While in the European Union nearly half of respondents trust the European Central
Bank, in Croatia the number of respondents who trust in it is four percent lower than those who do not trust, in Istria two fifths of the examinees are undecided (42%), this institution is not trusted by 30% of respondents, while only 28% do trust it (Chart 59). Chart 59: Confidence in the European Central Bank
The most numerous are the undecided examinees, almost half (49%), in North-Eastern Istria, and then come those who trust, 30%, and only one fifth of residents in that part of Istria do not trust the European Central Bank (20%). And in the Northwest and Southern Istria prevail the undecided, the percentage of respondents who do not express trust is almost equal, while the number of those who trust is higher by 3 percent in the South Istria than in the North-West Istria, where only a quarter of examinees trust the institution. The results of these comparisons are shown in the next graph. Chart 60: Confidence in the European Central Bank - Territory Affiliation
By age (Chart 61), in all groups prevail the undecided, but they are present mostly and equally in the age group 25 to 35, 66 and over (46%). Most trust was expressed by the examinees 51 to 65 (34%), while even a third of examinees in the group of 14 to 25 do not trust the European Central Bank (33%).
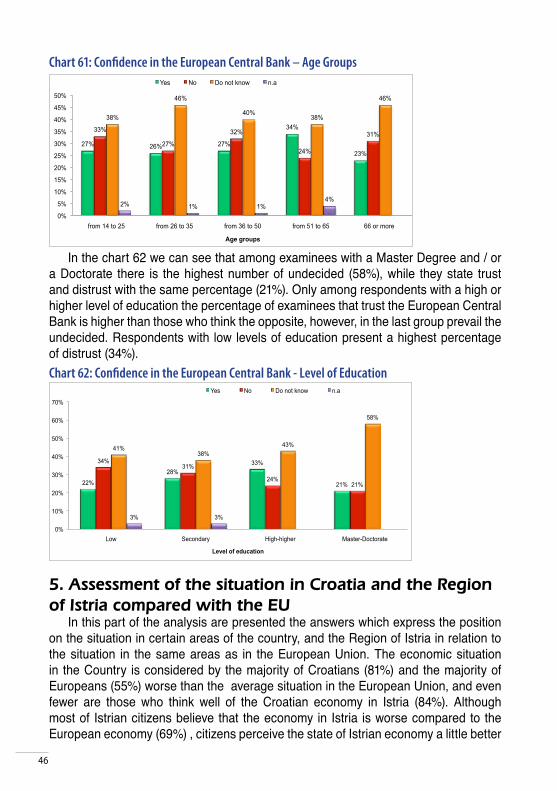
46
27% 26% 27%
34%
23%
33%
27%
32%
24%
31%
38%
46%
40% 38%
46%
2% 1% 1%
4%
0%
5%
10%
15%
20%
25%
30%
35%
40%
45%
50%
from 14 to 25 from 26 to 35 from 36 to 50 from 51 to 65 66 or more
Age groups
Yes No Do not know n.a
22%
28%
33%
21%
34% 31%
24% 21%
41% 38%
43%
58%
3% 3%
0%
10%
20%
30%
40%
50%
60%
70%
Low Secondary High-higher Master-Doctorate
Level of education
Yes No Do not know n.a
Chart 61: Confidence in the European Central Bank – Age Groups
In the chart 62 we can see that among examinees with a Master Degree and / or a Doctorate there is the highest number of undecided (58%), while they state trust and distrust with the same percentage (21%). Only among respondents with a high or higher level of education the percentage of examinees that trust the European Central Bank is higher than those who think the opposite, however, in the last group prevail the undecided. Respondents with low levels of education present a highest percentage of distrust (34%). Chart 62: Confidence in the European Central Bank - Level of Education
5. Assessment of the situation in Croatia and the Region of Istria compared with the EU
In this part of the analysis are presented the answers which express the position on the situation in certain areas of the country, and the Region of Istria in relation to the situation in the same areas as in the European Union. The economic situation in the Country is considered by the majority of Croatians (81%) and the majority of Europeans (55%) worse than the average situation in the European Union, and even fewer are those who think well of the Croatian economy in Istria (84%). Although most of Istrian citizens believe that the economy in Istria is worse compared to the European economy (69%) , citizens perceive the state of Istrian economy a little better
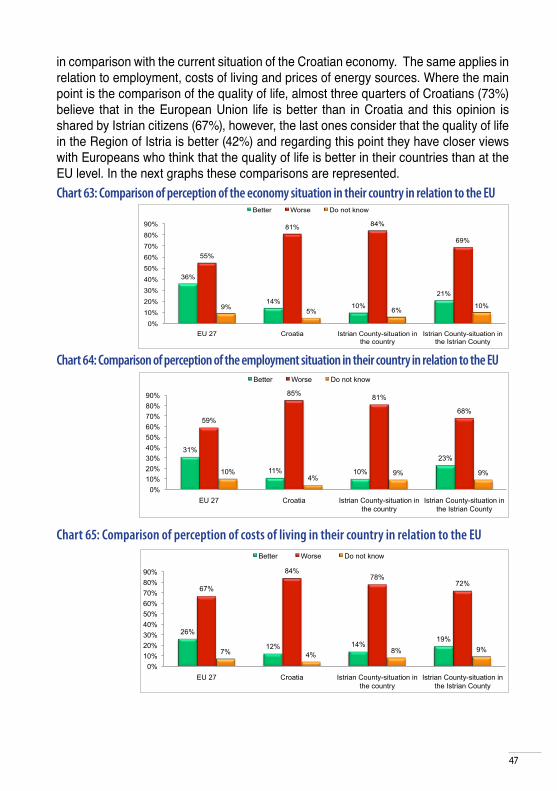
47
36%
14% 10%
21%
55%
81% 84%
69%
9% 5% 6%
10%
0%
10%
20%
30%
40%
50%
60%
70%
80%
90%
EU 27 Croatia Istrian County-situation in
the country
Istrian County-situation in
the Istrian County
Better Worse Do not know
31%
11% 10%
23%
59%
85% 81%
68%
10% 4%
9% 9%
0%
10%
20%
30%
40%
50%
60%
70%
80%
90%
EU 27 Croatia Istrian County-situation in
the country
Istrian County-situation in
the Istrian County
Better Worse Do not know
26%
12% 14% 19%
67%
84% 78%
72%
7% 4% 8% 9%
0%
10%
20%
30%
40%
50%
60%
70%
80%
90%
EU 27 Croatia Istrian County-situation in
the country
Istrian County-situation in
the Istrian County
Better Worse Do not know
in comparison with the current situation of the Croatian economy. The same applies in relation to employment, costs of living and prices of energy sources. Where the main point is the comparison of the quality of life, almost three quarters of Croatians (73%) believe that in the European Union life is better than in Croatia and this opinion is shared by Istrian citizens (67%), however, the last ones consider that the quality of life in the Region of Istria is better (42%) and regarding this point they have closer views with Europeans who think that the quality of life is better in their countries than at the EU level. In the next graphs these comparisons are represented. Chart 63: Comparison of perception of the economy situation in their country in relation to the EU
Chart 64: Comparison of perception of the employment situation in their country in relation to the EU
Chart 65: Comparison of perception of costs of living in their country in relation to the EU
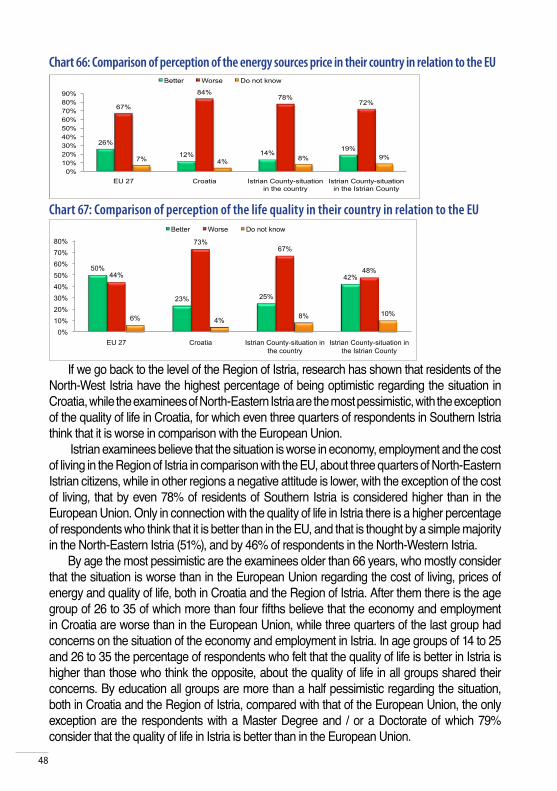
48
26%
12% 14% 19%
67%
84% 78%
72%
7% 4% 8% 9%
0%
10%
20%
30%
40%
50%
60%
70%
80%
90%
EU 27 Croatia Istrian County-situation
in the country
Istrian County-situation
in the Istrian County
Better Worse Do not know
50%
23% 25%
42% 44%
73% 67%
48%
6% 4% 8% 10%
0%
10%
20%
30%
40%
50%
60%
70%
80%
EU 27 Croatia Istrian County-situation in
the country
Istrian County-situation in
the Istrian County
Better Worse Do not know
Chart 66: Comparison of perception of the energy sources price in their country in relation to the EU
Chart 67: Comparison of perception of the life quality in their country in relation to the EU
If we go back to the level of the Region of Istria, research has shown that residents of the North-West Istria have the highest percentage of being optimistic regarding the situation in Croatia, while the examinees of North-Eastern Istria are the most pessimistic, with the exception of the quality of life in Croatia, for which even three quarters of respondents in Southern Istria think that it is worse in comparison with the European Union.
Istrian examinees believe that the situation is worse in economy, employment and the cost of living in the Region of Istria in comparison with the EU, about three quarters of North-Eastern Istrian citizens, while in other regions a negative attitude is lower, with the exception of the cost of living, that by even 78% of residents of Southern Istria is considered higher than in the European Union. Only in connection with the quality of life in Istria there is a higher percentage of respondents who think that it is better than in the EU, and that is thought by a simple majority in the North-Eastern Istria (51%), and by 46% of respondents in the North-Western Istria.
By age the most pessimistic are the examinees older than 66 years, who mostly consider that the situation is worse than in the European Union regarding the cost of living, prices of energy and quality of life, both in Croatia and the Region of Istria. After them there is the age group of 26 to 35 of which more than four fifths believe that the economy and employment in Croatia are worse than in the European Union, while three quarters of the last group had concerns on the situation of the economy and employment in Istria. In age groups of 14 to 25 and 26 to 35 the percentage of respondents who felt that the quality of life is better in Istria is higher than those who think the opposite, about the quality of life in all groups shared their concerns. By education all groups are more than a half pessimistic regarding the situation, both in Croatia and the Region of Istria, compared with that of the European Union, the only exception are the respondents with a Master Degree and / or a Doctorate of which 79% consider that the quality of life in Istria is better than in the European Union.
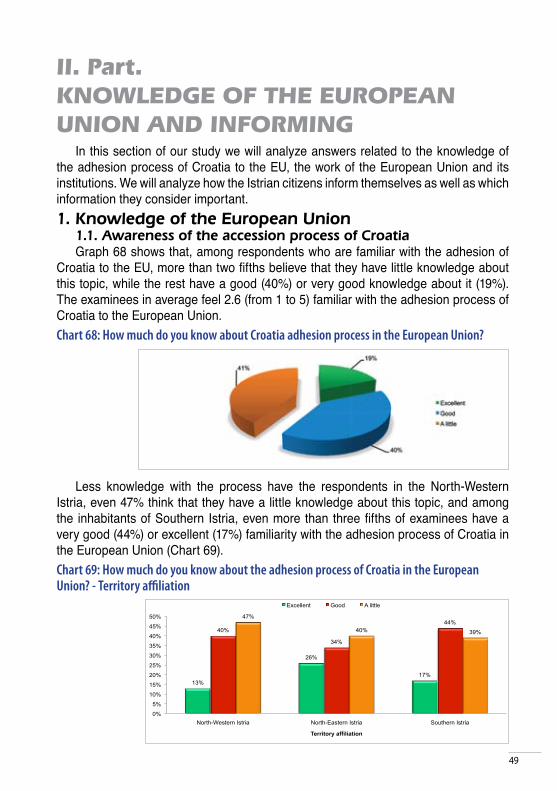
49
13%
26%
17%
40%
34%
44%
47%
40% 39%
0%
5%
10%
15%
20%
25%
30%
35%
40%
45%
50%
North-Western Istria North-Eastern Istria Southern Istria
Territory affiliation
Excellent Good A little
II. Part. KNOWLEDGE OF THE EUROPEAN UNION AND INFORMING
In this section of our study we will analyze answers related to the knowledge of the adhesion process of Croatia to the EU, the work of the European Union and its institutions. We will analyze how the Istrian citizens inform themselves as well as which information they consider important. 1. Knowledge of the European Union
1.1. Awareness of the accession process of CroatiaGraph 68 shows that, among respondents who are familiar with the adhesion of
Croatia to the EU, more than two fifths believe that they have little knowledge about this topic, while the rest have a good (40%) or very good knowledge about it (19%). The examinees in average feel 2.6 (from 1 to 5) familiar with the adhesion process of Croatia to the European Union. Chart 68: How much do you know about Croatia adhesion process in the European Union?
Less knowledge with the process have the respondents in the North-Western Istria, even 47% think that they have a little knowledge about this topic, and among the inhabitants of Southern Istria, even more than three fifths of examinees have a very good (44%) or excellent (17%) familiarity with the adhesion process of Croatia in the European Union (Chart 69). Chart 69: How much do you know about the adhesion process of Croatia in the European Union? - Territory affiliation
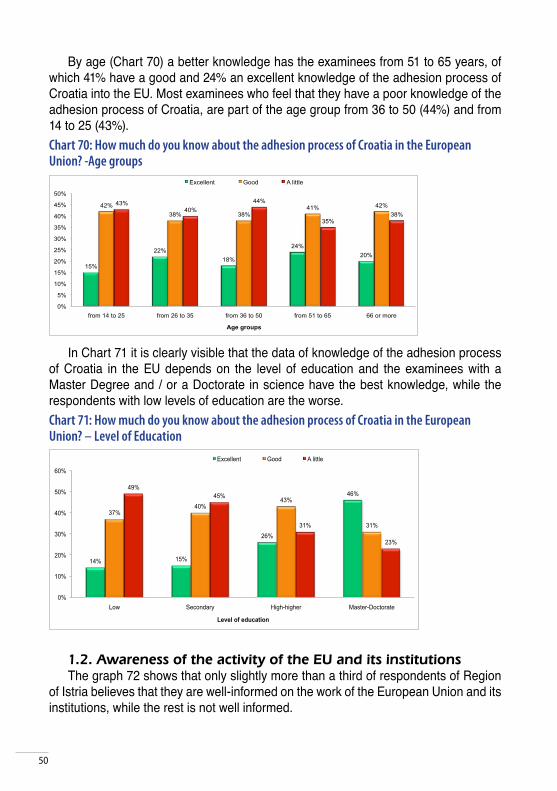
50
14% 15%
26%
46%
37% 40%
43%
31%
49%
45%
31%
23%
0%
10%
20%
30%
40%
50%
60%
Low Secondary High-higher Master-Doctorate
Level of education
Excellent Good A little
15%
22%
18%
24%
20%
42%
38% 38%
41% 42% 43%
40%
44%
35%
38%
0%
5%
10%
15%
20%
25%
30%
35%
40%
45%
50%
from 14 to 25 from 26 to 35 from 36 to 50 from 51 to 65 66 or more
Age groups
Excellent Good A little
By age (Chart 70) a better knowledge has the examinees from 51 to 65 years, of which 41% have a good and 24% an excellent knowledge of the adhesion process of Croatia into the EU. Most examinees who feel that they have a poor knowledge of the adhesion process of Croatia, are part of the age group from 36 to 50 (44%) and from 14 to 25 (43%). Chart 70: How much do you know about the adhesion process of Croatia in the European Union? -Age groups
In Chart 71 it is clearly visible that the data of knowledge of the adhesion process of Croatia in the EU depends on the level of education and the examinees with a Master Degree and / or a Doctorate in science have the best knowledge, while the respondents with low levels of education are the worse. Chart 71: How much do you know about the adhesion process of Croatia in the European Union? – Level of Education
1.2. Awareness of the activity of the EU and its institutionsThe graph 72 shows that only slightly more than a third of respondents of Region
of Istria believes that they are well-informed on the work of the European Union and its institutions, while the rest is not well informed.
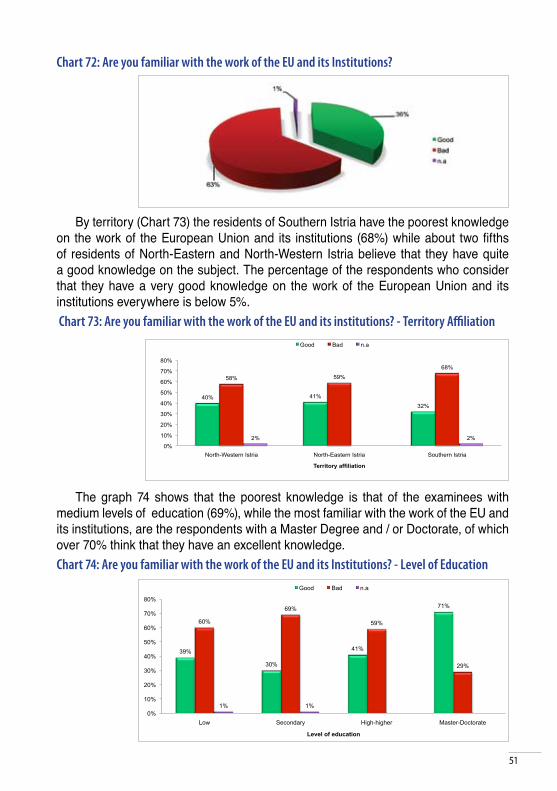
51
40% 41%
32%
58% 59%
68%
2% 2%
0%
10%
20%
30%
40%
50%
60%
70%
80%
North-Western Istria North-Eastern Istria Southern Istria
Territory affiliation
Good Bad n.a
39%
30%
41%
71%
60%
69%
59%
29%
1% 1%
0%
10%
20%
30%
40%
50%
60%
70%
80%
Low Secondary High-higher Master-Doctorate
Level of education
Good Bad n.a
Chart 72: Are you familiar with the work of the EU and its Institutions?
By territory (Chart 73) the residents of Southern Istria have the poorest knowledge on the work of the European Union and its institutions (68%) while about two fifths of residents of North-Eastern and North-Western Istria believe that they have quite a good knowledge on the subject. The percentage of the respondents who consider that they have a very good knowledge on the work of the European Union and its institutions everywhere is below 5%. Chart 73: Are you familiar with the work of the EU and its institutions? - Territory Affiliation
The graph 74 shows that the poorest knowledge is that of the examinees with medium levels of education (69%), while the most familiar with the work of the EU and its institutions, are the respondents with a Master Degree and / or Doctorate, of which over 70% think that they have an excellent knowledge. Chart 74: Are you familiar with the work of the EU and its Institutions? - Level of Education
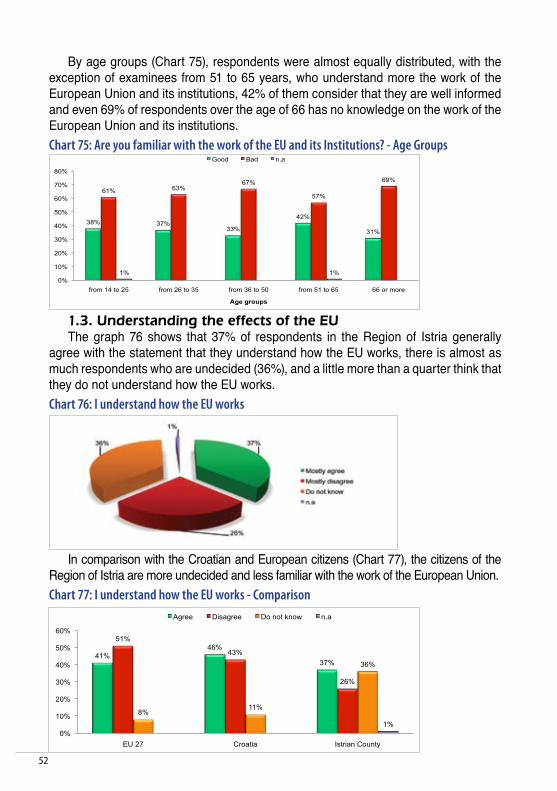
52
38% 37% 33%
42%
31%
61% 63%
67%
57%
69%
1% 1%
0%
10%
20%
30%
40%
50%
60%
70%
80%
from 14 to 25 from 26 to 35 from 36 to 50 from 51 to 65 66 or more
Age groups
Good Bad n.a
41%
46%
37%
51%
43%
26%
8% 11%
36%
1%
0%
10%
20%
30%
40%
50%
60%
EU 27 Croatia Istrian County
Agree Disagree Do not know n.a
By age groups (Chart 75), respondents were almost equally distributed, with the exception of examinees from 51 to 65 years, who understand more the work of the European Union and its institutions, 42% of them consider that they are well informed and even 69% of respondents over the age of 66 has no knowledge on the work of the European Union and its institutions. Chart 75: Are you familiar with the work of the EU and its Institutions? - Age Groups
1.3. Understanding the effects of the EUThe graph 76 shows that 37% of respondents in the Region of Istria generally
agree with the statement that they understand how the EU works, there is almost as much respondents who are undecided (36%), and a little more than a quarter think that they do not understand how the EU works. Chart 76: I understand how the EU works
In comparison with the Croatian and European citizens (Chart 77), the citizens of the Region of Istria are more undecided and less familiar with the work of the European Union. Chart 77: I understand how the EU works - Comparison
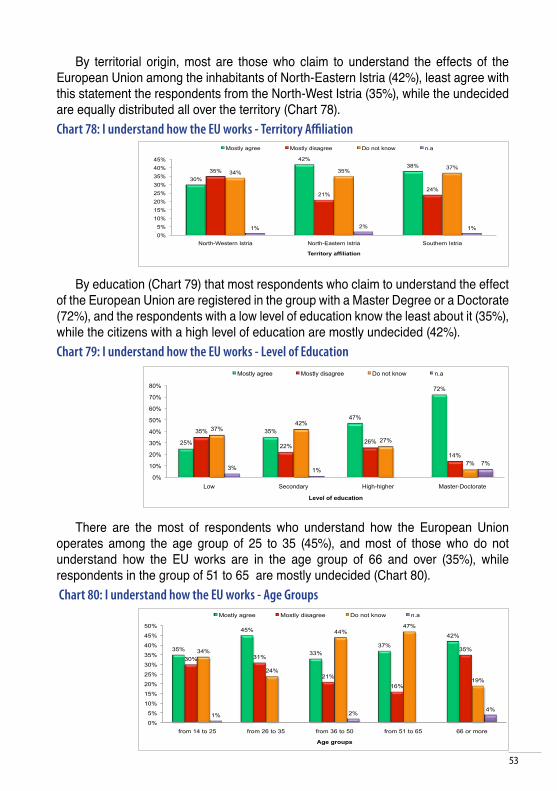
53
30%
42%
38% 35%
21% 24%
34% 35% 37%
1% 2% 1%
0%
5%
10%
15%
20%
25%
30%
35%
40%
45%
North-Western Istria North-Eastern Istria Southern Istria
Territory affiliation
Mostly agree Mostly disagree Do not know n.a
25%
35%
47%
72%
35%
22% 26%
14%
37% 42%
27%
7% 3% 1%
7%
0%
10%
20%
30%
40%
50%
60%
70%
80%
Low Secondary High-higher Master-Doctorate
Level of education
Mostly agree Mostly disagree Do not know n.a
35%
45%
33%
37%
42%
30% 31%
21%
16%
35% 34%
24%
44% 47%
19%
1% 2% 4%
0%
5%
10%
15%
20%
25%
30%
35%
40%
45%
50%
from 14 to 25 from 26 to 35 from 36 to 50 from 51 to 65 66 or more
Age groups
Mostly agree Mostly disagree Do not know n.a
By territorial origin, most are those who claim to understand the effects of the European Union among the inhabitants of North-Eastern Istria (42%), least agree with this statement the respondents from the North-West Istria (35%), while the undecided are equally distributed all over the territory (Chart 78). Chart 78: I understand how the EU works - Territory Affiliation
By education (Chart 79) that most respondents who claim to understand the effect of the European Union are registered in the group with a Master Degree or a Doctorate (72%), and the respondents with a low level of education know the least about it (35%), while the citizens with a high level of education are mostly undecided (42%). Chart 79: I understand how the EU works - Level of Education
There are the most of respondents who understand how the European Union operates among the age group of 25 to 35 (45%), and most of those who do not understand how the EU works are in the age group of 66 and over (35%), while respondents in the group of 51 to 65 are mostly undecided (Chart 80). Chart 80: I understand how the EU works - Age Groups
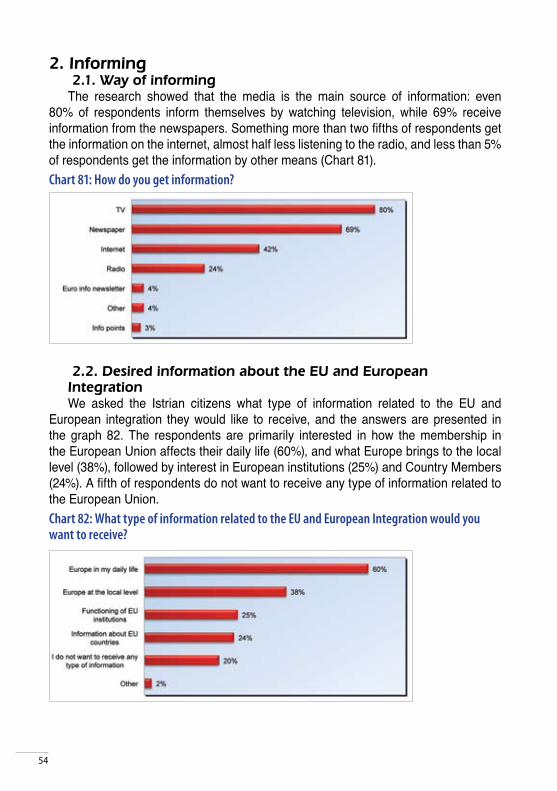
54
2. Informing 2.1. Way of informing The research showed that the media is the main source of information: even
80% of respondents inform themselves by watching television, while 69% receive information from the newspapers. Something more than two fifths of respondents get the information on the internet, almost half less listening to the radio, and less than 5% of respondents get the information by other means (Chart 81). Chart 81: How do you get information?
2.2. Desired information about the EU and European Integration We asked the Istrian citizens what type of information related to the EU and
European integration they would like to receive, and the answers are presented in the graph 82. The respondents are primarily interested in how the membership in the European Union affects their daily life (60%), and what Europe brings to the local level (38%), followed by interest in European institutions (25%) and Country Members (24%). A fifth of respondents do not want to receive any type of information related to the European Union. Chart 82: What type of information related to the EU and European Integration would you want to receive?
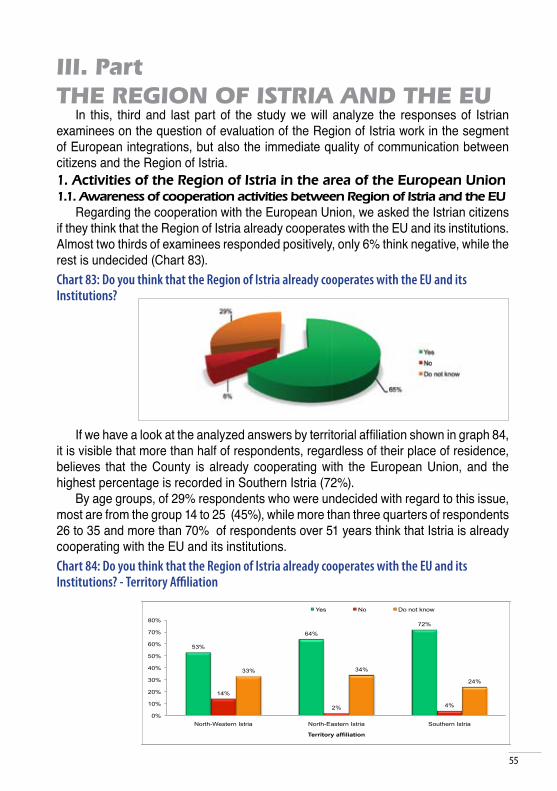
55
53%
64%
72%
14%
2% 4%
33% 34%
24%
0%
10%
20%
30%
40%
50%
60%
70%
80%
North-Western Istria North-Eastern Istria Southern Istria
Territory affiliation
Yes No Do not know
III. Part THE REGION OF ISTRIA AND THE EU
In this, third and last part of the study we will analyze the responses of Istrian examinees on the question of evaluation of the Region of Istria work in the segment of European integrations, but also the immediate quality of communication between citizens and the Region of Istria. 1. Activities of the Region of Istria in the area of the European Union 1.1. Awareness of cooperation activities between Region of Istria and the EU
Regarding the cooperation with the European Union, we asked the Istrian citizens if they think that the Region of Istria already cooperates with the EU and its institutions. Almost two thirds of examinees responded positively, only 6% think negative, while the rest is undecided (Chart 83). Chart 83: Do you think that the Region of Istria already cooperates with the EU and its Institutions?
If we have a look at the analyzed answers by territorial affiliation shown in graph 84, it is visible that more than half of respondents, regardless of their place of residence, believes that the County is already cooperating with the European Union, and the highest percentage is recorded in Southern Istria (72%).
By age groups, of 29% respondents who were undecided with regard to this issue, most are from the group 14 to 25 (45%), while more than three quarters of respondents 26 to 35 and more than 70% of respondents over 51 years think that Istria is already cooperating with the EU and its institutions. Chart 84: Do you think that the Region of Istria already cooperates with the EU and its Institutions? - Territory Affiliation
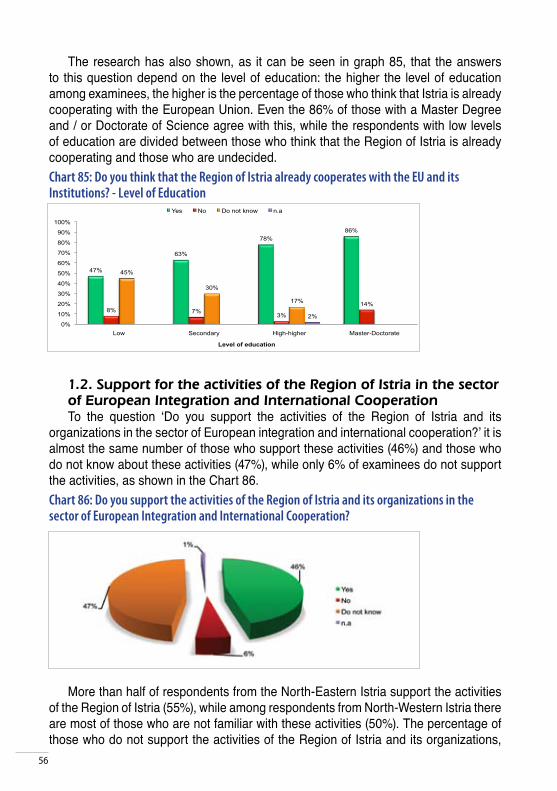
56
47%
63%
78%
86%
8% 7% 3%
14%
45%
30%
17%
2%
0%
10%
20%
30%
40%
50%
60%
70%
80%
90%
100%
Low Secondary High-higher Master-Doctorate
Level of education
Yes No Do not know n.a
The research has also shown, as it can be seen in graph 85, that the answers to this question depend on the level of education: the higher the level of education among examinees, the higher is the percentage of those who think that Istria is already cooperating with the European Union. Even the 86% of those with a Master Degree and / or Doctorate of Science agree with this, while the respondents with low levels of education are divided between those who think that the Region of Istria is already cooperating and those who are undecided. Chart 85: Do you think that the Region of Istria already cooperates with the EU and its Institutions? - Level of Education
1.2. Support for the activities of the Region of Istria in the sector of European Integration and International Cooperation To the question ‘Do you support the activities of the Region of Istria and its
organizations in the sector of European integration and international cooperation?’ it is almost the same number of those who support these activities (46%) and those who do not know about these activities (47%), while only 6% of examinees do not support the activities, as shown in the Chart 86.Chart 86: Do you support the activities of the Region of Istria and its organizations in the sector of European Integration and International Cooperation?
More than half of respondents from the North-Eastern Istria support the activities of the Region of Istria (55%), while among respondents from North-Western Istria there are most of those who are not familiar with these activities (50%). The percentage of those who do not support the activities of the Region of Istria and its organizations,
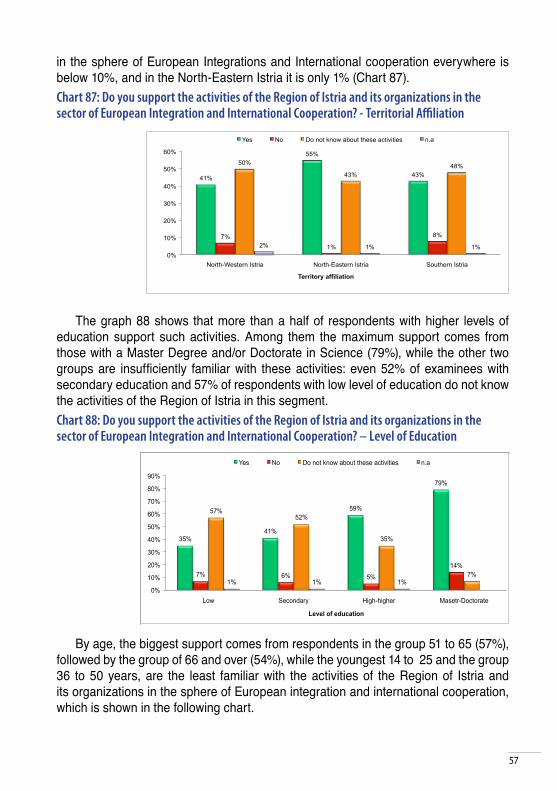
57
41%
55%
43%
7%
1%
8%
50%
43%
48%
2% 1% 1%
0%
10%
20%
30%
40%
50%
60%
North-Western Istria North-Eastern Istria Southern Istria
Territory affiliation
Yes No Do not know about these activities n.a
35% 41%
59%
79%
7% 6% 5%
14%
57% 52%
35%
7% 1% 1% 1%
0%
10%
20%
30%
40%
50%
60%
70%
80%
90%
Low Secondary High-higher Masetr-Doctorate
Level of education
Yes No Do not know about these activities n.a
in the sphere of European Integrations and International cooperation everywhere is below 10%, and in the North-Eastern Istria it is only 1% (Chart 87). Chart 87: Do you support the activities of the Region of Istria and its organizations in the sector of European Integration and International Cooperation? - Territorial Affiliation
The graph 88 shows that more than a half of respondents with higher levels of education support such activities. Among them the maximum support comes from those with a Master Degree and/or Doctorate in Science (79%), while the other two groups are insufficiently familiar with these activities: even 52% of examinees with secondary education and 57% of respondents with low level of education do not know the activities of the Region of Istria in this segment. Chart 88: Do you support the activities of the Region of Istria and its organizations in the sector of European Integration and International Cooperation? – Level of Education
By age, the biggest support comes from respondents in the group 51 to 65 (57%), followed by the group of 66 and over (54%), while the youngest 14 to 25 and the group 36 to 50 years, are the least familiar with the activities of the Region of Istria and its organizations in the sphere of European integration and international cooperation, which is shown in the following chart.
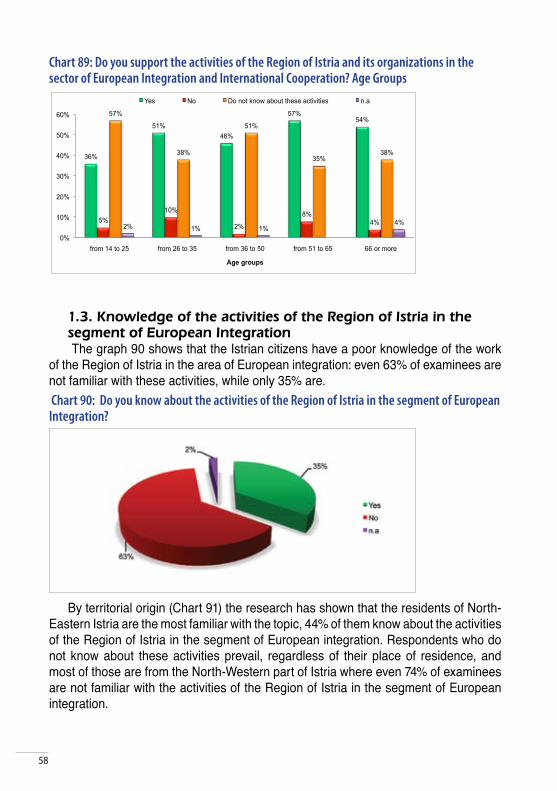
58
36%
51%
46%
57% 54%
5%
10%
2%
8%
4%
57%
38%
51%
35% 38%
2% 1% 1% 4%
0%
10%
20%
30%
40%
50%
60%
from 14 to 25 from 26 to 35 from 36 to 50 from 51 to 65 66 or more
Age groups
Yes No Do not know about these activities n.a
Chart 89: Do you support the activities of the Region of Istria and its organizations in the sector of European Integration and International Cooperation? Age Groups
1.3. Knowledge of the activities of the Region of Istria in the segment of European Integration The graph 90 shows that the Istrian citizens have a poor knowledge of the work
of the Region of Istria in the area of European integration: even 63% of examinees are not familiar with these activities, while only 35% are. Chart 90: Do you know about the activities of the Region of Istria in the segment of European Integration?
By territorial origin (Chart 91) the research has shown that the residents of North-Eastern Istria are the most familiar with the topic, 44% of them know about the activities of the Region of Istria in the segment of European integration. Respondents who do not know about these activities prevail, regardless of their place of residence, and most of those are from the North-Western part of Istria where even 74% of examinees are not familiar with the activities of the Region of Istria in the segment of European integration.
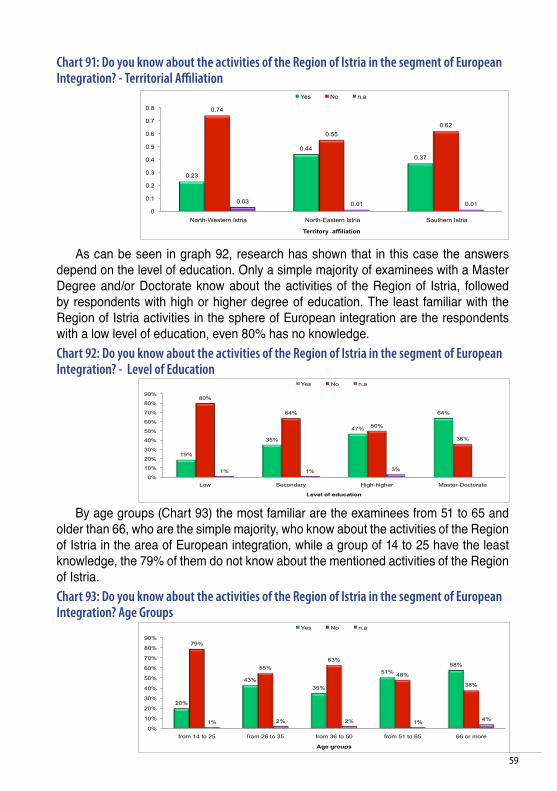
59
0.23
0.44
0.37
0.74
0.55
0.62
0.03 0.01 0.01
0
0.1
0.2
0.3
0.4
0.5
0.6
0.7
0.8
North-Western Istria North-Eastern Istria Southern Istria
Territory affiliation
Yes No n.a
19%
35%
47%
64%
80%
64%
50%
36%
1% 1% 3%
0%
10%
20%
30%
40%
50%
60%
70%
80%
90%
Low Secondary High-higher Master-Doctorate
Level of education
Yes No n.a
20%
43%
35%
51%
58%
79%
55%
63%
48%
38%
1% 2% 2% 1% 4%
0%
10%
20%
30%
40%
50%
60%
70%
80%
90%
from 14 to 25 from 26 to 35 from 36 to 50 from 51 to 65 66 or more
Age groups
Yes No n.a
Chart 91: Do you know about the activities of the Region of Istria in the segment of European Integration? - Territorial Affiliation
As can be seen in graph 92, research has shown that in this case the answers depend on the level of education. Only a simple majority of examinees with a Master Degree and/or Doctorate know about the activities of the Region of Istria, followed by respondents with high or higher degree of education. The least familiar with the Region of Istria activities in the sphere of European integration are the respondents with a low level of education, even 80% has no knowledge. Chart 92: Do you know about the activities of the Region of Istria in the segment of European Integration? - Level of Education
By age groups (Chart 93) the most familiar are the examinees from 51 to 65 and older than 66, who are the simple majority, who know about the activities of the Region of Istria in the area of European integration, while a group of 14 to 25 have the least knowledge, the 79% of them do not know about the mentioned activities of the Region of Istria. Chart 93: Do you know about the activities of the Region of Istria in the segment of European Integration? Age Groups
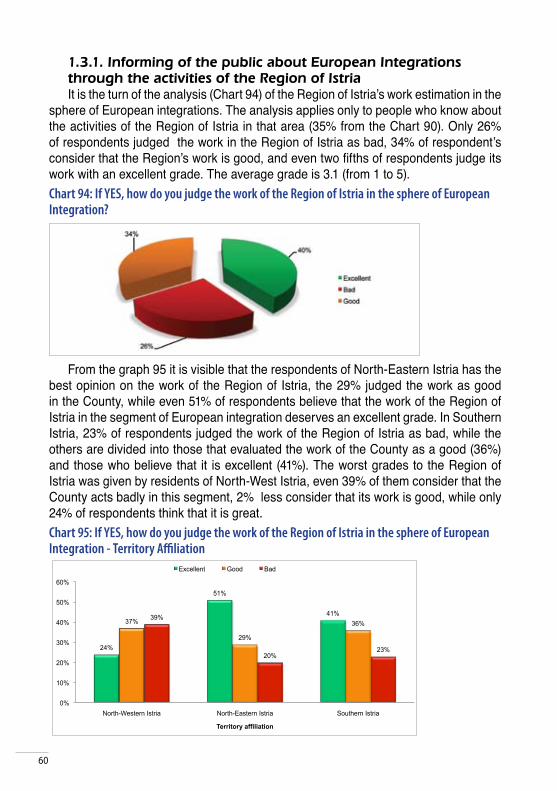
60
24%
51%
41%
37%
29%
36% 39%
20% 23%
0%
10%
20%
30%
40%
50%
60%
North-Western Istria North-Eastern Istria Southern Istria
Territory affiliation
Excellent Good Bad
1.3.1. Informing of the public about European Integrations through the activities of the Region of IstriaIt is the turn of the analysis (Chart 94) of the Region of Istria’s work estimation in the
sphere of European integrations. The analysis applies only to people who know about the activities of the Region of Istria in that area (35% from the Chart 90). Only 26% of respondents judged the work in the Region of Istria as bad, 34% of respondent’s consider that the Region’s work is good, and even two fifths of respondents judge its work with an excellent grade. The average grade is 3.1 (from 1 to 5). Chart 94: If YES, how do you judge the work of the Region of Istria in the sphere of European Integration?
From the graph 95 it is visible that the respondents of North-Eastern Istria has the best opinion on the work of the Region of Istria, the 29% judged the work as good in the County, while even 51% of respondents believe that the work of the Region of Istria in the segment of European integration deserves an excellent grade. In Southern Istria, 23% of respondents judged the work of the Region of Istria as bad, while the others are divided into those that evaluated the work of the County as a good (36%) and those who believe that it is excellent (41%). The worst grades to the Region of Istria was given by residents of North-West Istria, even 39% of them consider that the County acts badly in this segment, 2% less consider that its work is good, while only 24% of respondents think that it is great. Chart 95: If YES, how do you judge the work of the Region of Istria in the sphere of European Integration - Territory Affiliation
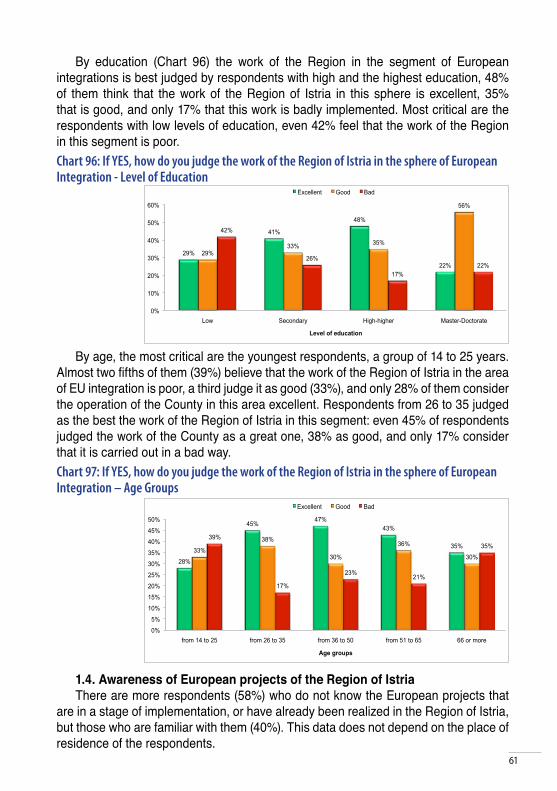
61
29%
41%
48%
22%
29% 33%
35%
56%
42%
26%
17%
22%
0%
10%
20%
30%
40%
50%
60%
Low Secondary High-higher Master-Doctorate
Level of education
Excellent Good Bad
28%
45% 47%
43%
35% 33%
38%
30%
36%
30%
39%
17%
23% 21%
35%
0%
5%
10%
15%
20%
25%
30%
35%
40%
45%
50%
from 14 to 25 from 26 to 35 from 36 to 50 from 51 to 65 66 or more
Age groups
Excellent Good Bad
By education (Chart 96) the work of the Region in the segment of European integrations is best judged by respondents with high and the highest education, 48% of them think that the work of the Region of Istria in this sphere is excellent, 35% that is good, and only 17% that this work is badly implemented. Most critical are the respondents with low levels of education, even 42% feel that the work of the Region in this segment is poor. Chart 96: If YES, how do you judge the work of the Region of Istria in the sphere of European Integration - Level of Education
By age, the most critical are the youngest respondents, a group of 14 to 25 years. Almost two fifths of them (39%) believe that the work of the Region of Istria in the area of EU integration is poor, a third judge it as good (33%), and only 28% of them consider the operation of the County in this area excellent. Respondents from 26 to 35 judged as the best the work of the Region of Istria in this segment: even 45% of respondents judged the work of the County as a great one, 38% as good, and only 17% consider that it is carried out in a bad way. Chart 97: If YES, how do you judge the work of the Region of Istria in the sphere of European Integration – Age Groups
1.4. Awareness of European projects of the Region of IstriaThere are more respondents (58%) who do not know the European projects that
are in a stage of implementation, or have already been realized in the Region of Istria, but those who are familiar with them (40%). This data does not depend on the place of residence of the respondents.
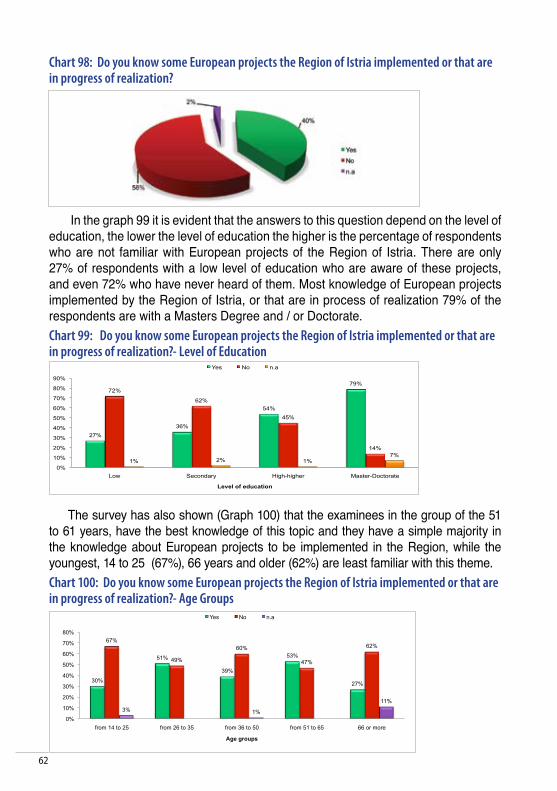
62
27%
36%
54%
79%
72%
62%
45%
14%
1% 2% 1% 7%
0%
10%
20%
30%
40%
50%
60%
70%
80%
90%
Low Secondary High-higher Master-Doctorate
Level of education
Yes No n.a
30%
51%
39%
53%
27%
67%
49%
60%
47%
62%
3% 1%
11%
0%
10%
20%
30%
40%
50%
60%
70%
80%
from 14 to 25 from 26 to 35 from 36 to 50 from 51 to 65 66 or more
Age groups
Yes No n.a
Chart 98: Do you know some European projects the Region of Istria implemented or that are in progress of realization?
In the graph 99 it is evident that the answers to this question depend on the level of education, the lower the level of education the higher is the percentage of respondents who are not familiar with European projects of the Region of Istria. There are only 27% of respondents with a low level of education who are aware of these projects, and even 72% who have never heard of them. Most knowledge of European projects implemented by the Region of Istria, or that are in process of realization 79% of the respondents are with a Masters Degree and / or Doctorate. Chart 99: Do you know some European projects the Region of Istria implemented or that are in progress of realization?- Level of Education
The survey has also shown (Graph 100) that the examinees in the group of the 51 to 61 years, have the best knowledge of this topic and they have a simple majority in the knowledge about European projects to be implemented in the Region, while the youngest, 14 to 25 (67%), 66 years and older (62%) are least familiar with this theme.Chart 100: Do you know some European projects the Region of Istria implemented or that are in progress of realization?- Age Groups
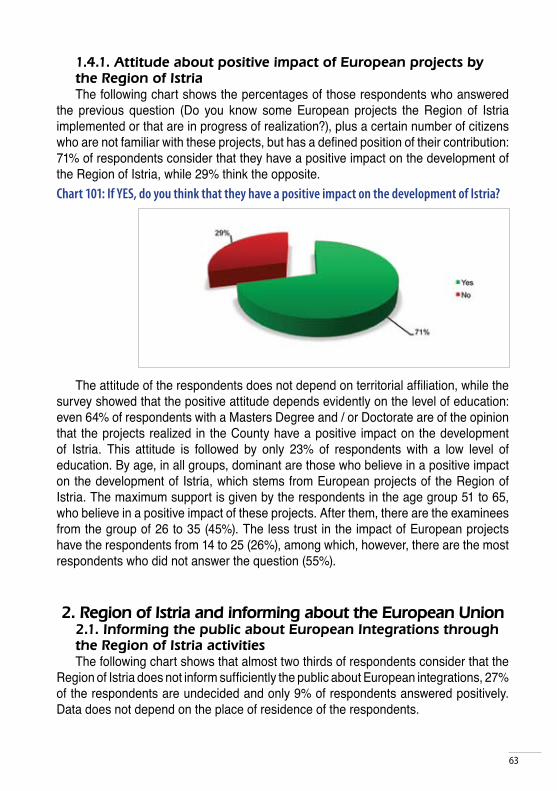
63
1.4.1. Attitude about positive impact of European projects by the Region of Istria The following chart shows the percentages of those respondents who answered
the previous question (Do you know some European projects the Region of Istria implemented or that are in progress of realization?), plus a certain number of citizens who are not familiar with these projects, but has a defined position of their contribution: 71% of respondents consider that they have a positive impact on the development of the Region of Istria, while 29% think the opposite. Chart 101: If YES, do you think that they have a positive impact on the development of Istria?
The attitude of the respondents does not depend on territorial affiliation, while the survey showed that the positive attitude depends evidently on the level of education: even 64% of respondents with a Masters Degree and / or Doctorate are of the opinion that the projects realized in the County have a positive impact on the development of Istria. This attitude is followed by only 23% of respondents with a low level of education. By age, in all groups, dominant are those who believe in a positive impact on the development of Istria, which stems from European projects of the Region of Istria. The maximum support is given by the respondents in the age group 51 to 65, who believe in a positive impact of these projects. After them, there are the examinees from the group of 26 to 35 (45%). The less trust in the impact of European projects have the respondents from 14 to 25 (26%), among which, however, there are the most respondents who did not answer the question (55%).
2. Region of Istria and informing about the European Union 2.1. Informing the public about European Integrations through the Region of Istria activitiesThe following chart shows that almost two thirds of respondents consider that the
Region of Istria does not inform sufficiently the public about European integrations, 27% of the respondents are undecided and only 9% of respondents answered positively. Data does not depend on the place of residence of the respondents.
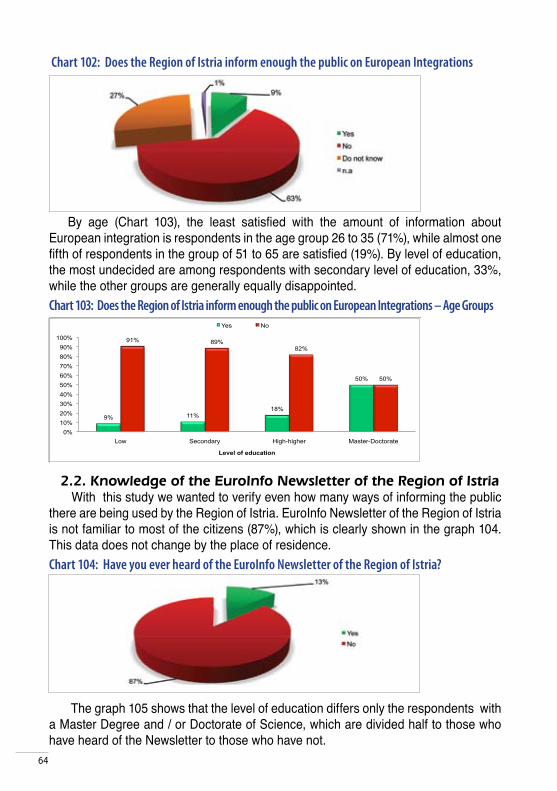
64
9% 11% 18%
50%
91% 89% 82%
50%
0%
10%
20%
30%
40%
50%
60%
70%
80%
90%
100%
Low Secondary High-higher Master-Doctorate
Level of education
Yes No
Chart 102: Does the Region of Istria inform enough the public on European Integrations
By age (Chart 103), the least satisfied with the amount of information about European integration is respondents in the age group 26 to 35 (71%), while almost one fifth of respondents in the group of 51 to 65 are satisfied (19%). By level of education, the most undecided are among respondents with secondary level of education, 33%, while the other groups are generally equally disappointed. Chart 103: Does the Region of Istria inform enough the public on European Integrations – Age Groups
2.2. Knowledge of the EuroInfo Newsletter of the Region of Istria
With this study we wanted to verify even how many ways of informing the public there are being used by the Region of Istria. EuroInfo Newsletter of the Region of Istria is not familiar to most of the citizens (87%), which is clearly shown in the graph 104. This data does not change by the place of residence. Chart 104: Have you ever heard of the EuroInfo Newsletter of the Region of Istria?
The graph 105 shows that the level of education differs only the respondents with a Master Degree and / or Doctorate of Science, which are divided half to those who have heard of the Newsletter to those who have not.
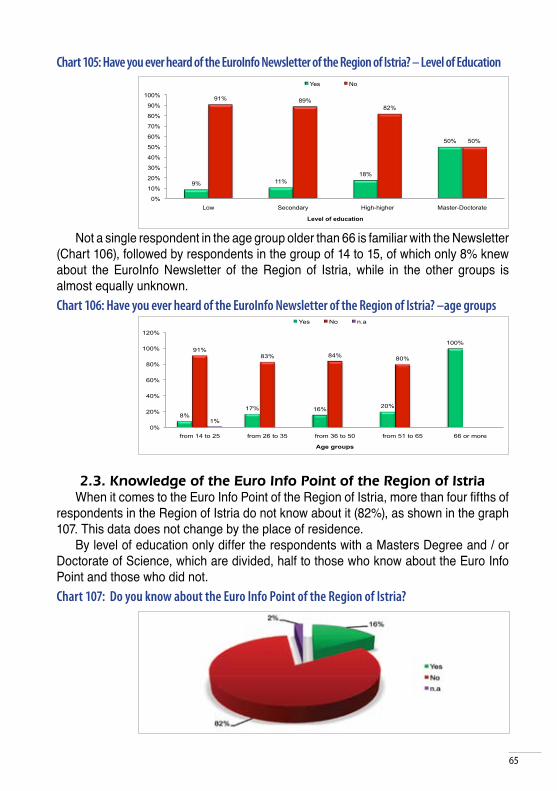
65
9% 11%
18%
50%
91% 89%
82%
50%
0%
10%
20%
30%
40%
50%
60%
70%
80%
90%
100%
Low Secondary High-higher Master-Doctorate
Level of education
Yes No
8%
17% 16% 20%
100%
91%
83% 84% 80%
1%
0%
20%
40%
60%
80%
100%
120%
from 14 to 25 from 26 to 35 from 36 to 50 from 51 to 65 66 or more
Age groups
Yes No n.a
Chart 105: Have you ever heard of the EuroInfo Newsletter of the Region of Istria? – Level of Education
Not a single respondent in the age group older than 66 is familiar with the Newsletter
(Chart 106), followed by respondents in the group of 14 to 15, of which only 8% knew about the EuroInfo Newsletter of the Region of Istria, while in the other groups is almost equally unknown. Chart 106: Have you ever heard of the EuroInfo Newsletter of the Region of Istria? –age groups
2.3. Knowledge of the Euro Info Point of the Region of Istria When it comes to the Euro Info Point of the Region of Istria, more than four fifths of
respondents in the Region of Istria do not know about it (82%), as shown in the graph 107. This data does not change by the place of residence.
By level of education only differ the respondents with a Masters Degree and / or Doctorate of Science, which are divided, half to those who know about the Euro Info Point and those who did not. Chart 107: Do you know about the Euro Info Point of the Region of Istria?
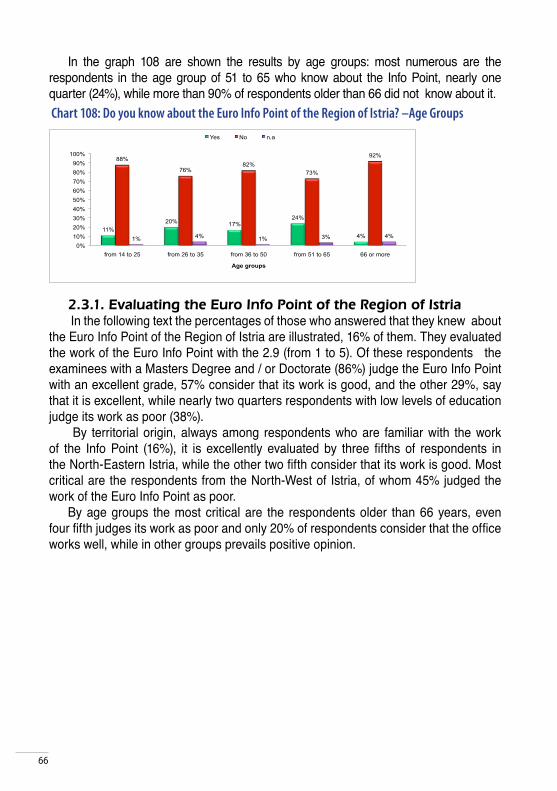
66
11%
20% 17%
24%
4%
88%
76%
82%
73%
92%
1% 4%
1% 3% 4%
0%
10%
20%
30%
40%
50%
60%
70%
80%
90%
100%
from 14 to 25 from 26 to 35 from 36 to 50 from 51 to 65 66 or more
Age groups
Yes No n.a
In the graph 108 are shown the results by age groups: most numerous are the respondents in the age group of 51 to 65 who know about the Info Point, nearly one quarter (24%), while more than 90% of respondents older than 66 did not know about it. Chart 108: Do you know about the Euro Info Point of the Region of Istria? –Age Groups
2.3.1. Evaluating the Euro Info Point of the Region of Istria In the following text the percentages of those who answered that they knew about
the Euro Info Point of the Region of Istria are illustrated, 16% of them. They evaluated the work of the Euro Info Point with the 2.9 (from 1 to 5). Of these respondents the examinees with a Masters Degree and / or Doctorate (86%) judge the Euro Info Point with an excellent grade, 57% consider that its work is good, and the other 29%, say that it is excellent, while nearly two quarters respondents with low levels of education judge its work as poor (38%).
By territorial origin, always among respondents who are familiar with the work of the Info Point (16%), it is excellently evaluated by three fifths of respondents in the North-Eastern Istria, while the other two fifth consider that its work is good. Most critical are the respondents from the North-West of Istria, of whom 45% judged the work of the Euro Info Point as poor.
By age groups the most critical are the respondents older than 66 years, even four fifth judges its work as poor and only 20% of respondents consider that the office works well, while in other groups prevails positive opinion.
67
Conclusions The research of public opinion of the Region of Istria citizens related to the European
Union and the adhesion process of Croatia, which was carried out from 19th of February to 20th of March 2009. The survey has included 626 individuals who were selected through a methodological approach by accidentally stratified sample. For collection and processing the respondents were divided into three categories: by age groups, by level of education and in the territorial affiliation.
The research was carried out by semi-structured interviewing, a ‘face to face’ approach. After the collection of data, the sample was subsequently developed with the aim of stratification according to socio-demographic distribution of the Region of Istria. This formed a pattern of 489 respondents whose answers were statistically processed. This scientific report, and conclusions that arise from it, are the result of the analysis of this data. The data were analyzed, and also compared with the results of the Standard Eurobarometer - Eurobarometer Croatia 70 (Public Opinion on the European Union) from Autumn 2008 and the Eurobarometer Croatia 69 Spring 2008, in the case that in Autumn a specific question was not made to the citizens.
Given the different circumstances, especially in connection with an open issue with Slovenia, which in our terms and conditions may significantly affect the validity of this research of the public opinion, and significantly hardened the process of determining their validity, the survey however, was carried out successfully, and thanks to the fact that there was no significant changes by this and other matters related to the perception of the EU, the analysis can be considered authentic.
In the Region of Istria citizens are in principle euro optimistic, although in relation to Croatia in much fewer numbers. The support to the adhesion of the EU was declared by something less than a half of our respondents, which is much less than the percentage represented in the national report of Eurobarometer 69 Spring 2008. In Istria there are almost twice as many citizens who are against the entry of Croatia into the EU than in the entire of Croatia which indicates that in the Region of Istria the number of euro-sceptics is far higher than at the level of the state. Despite this, important data which can be taken as a measure of euro-optimism of Istrian citizens, is the answer to the question ‘How do you generally perceive the EU? ‘. Looking at the available data we can say that most Istrians are not euro-sceptics. Only less than twenty percent of respondents have a negative perception of the European Union which is less than the average Croatian citizens, but at the same level of the European Union For one-third of respondents can be said that they are euro-optimistic which is ten percent more if we compare them with the Croatian citizens and ten percent less than the average in the European Union. The largest number of citizens of Istria and Croatia there is not a defined position on the European Union. Euro-optimists prevail in the North-Eastern Istria, while in Western and Southern Istria prevail those who are neutral. Optimistic grows in percentages as increases in the level of education, to high or higher level of education, while respondents with a Master Degree do not follow
68
this trend. The maximum number of optimist is among respondents with high and higher level of education. The information that is in this category there is the least of examinees that have a negative attitude towards the European Union confirms the thesis that the group is the most optimistic. The most optimistic among respondents are in the age group of 51 to 65 years while they are the least among the youngest. In the last group there is the largest percentage of neutral examinees. We asked the citizens about the benefit they think will be received with the adhesion of Croatia in the European Union to the personal level, the civic level and at the level of the Region of Istria. Upon analysis we can conclude that respondents in the lowest number expect benefit on a personal level. A number of citizens who expect a benefit from it increases when the question is put to the general level. Personal benefit from membership in the EU is expected by only a little less than a third of respondents, while almost two fifths think that the adhesion will be good for citizens. The number grows to 4% when the question is even more general that is whether the adhesion will be good for Istria.
We can therefore conclude that the perception of the benefits to a greater extent appears as increases the generality of the questions and that means that the perception of well-being is present in the citizens, but that the smaller number considers that this will affect their personal well-being.This is confirmed by the fact that when it comes to questions of information that citizens want to join in the first place, is the information on how Europe will affect their daily life and of Europe at the local level. Despite this, the number of respondents who consider themselves to be European citizens is quite high and exceeds the number of citizens who think that the membership will bring benefit. To the question if they feel like a European citizen more than a half of examinees answered positively, which is a much greater number than citizens who expect a profit from the European Union. From this data we can conclude that for a certain number of citizens who consider themselves European citizens, this fact does not affect positively the perception of the benefits of the adhesion process of Croatia into the European Union. When it comes to perception of the European Union, to a large number of citizens it represents freedom of travel, study and work anywhere within the Union which is in accordance with the responses of European and Croatian citizens who, in the majority, although on a smaller scale, selected this characteristic. Compared with the citizens of Croatia and the European Union, in second place for Croatian citizens is the fear of losing their cultural identity and for the citizens of the EU the common currency being the Euro, for the Region of Istria citizens the second place is shared by democracy and economic prosperity. The citizens of Istria, as opposed to the average citizen of Croatia, are not so much afraid of losing their cultural identity. The Istrian citizens of the European Union in the first place expect the improvement of cooperation between Croatia and EU Member Countries. Follow the contribution to economic growth and opportunities in employment and contribution to peace, security and democracy. In the Region of Istria less than five percent of respondents believe that EU membership will not let Croatian citizens have influence on the decision on the European level. Most citizens consider that membership will reduce the influence of Croatia on the decisions being made at the level of EU. A large number of citizens also consider that the adhesion to the EU will reduce the standard
69
of living, which adds another reason for scepticism towards the European Union.Most Istrian citizens believe that the EU does not take into account the interests of Croatia and that it imposes its views. This lack of confidence in European Institutions is confirmed by the majority of citizens when they should answer about individual institutions (through the trust that they were given) which they perceive as quite distant. Furthermore, one of the most important conclusions of this research is that people judge the integration and the EU according to the mechanism of experience, and without adequate knowledge about the work of the EU and its institutions. Specifically, we believe that the answers given were on the basis of poor perception of the situation in the country, more than on real benefits that membership brings and on knowledge of EU Institutions. Such a conclusion comes not only on the basis of trust that Istrian people give the European Institutions, but also through other answers such as belief of the citizens of Croatia and the respondents from the Region of Istria that the contribution to democracy is something that should be expected from the European Union. We believe that this response and others similar are based on everyday experience in relation to the institutions they know about, and that the domestic government institutions to which citizens of Croatia give little trust. These conclusions are confirmed by the fact that despite the euro-scepticism more than half respondents support the further expansion of the Union, and almost 60 percent of them believe that the entry of the Western Balkan Countries will contribute to the stabilization of the region and perceive Europe as a factor of stability. Both in Croatia and Istria, it is greater the number of citizens who think that things in their countries are worse than in the EU, although this trend is stronger in Croatia than in Istria where, as regards the quality of life, more than 40 percent of residents think that it is better than in the EU. By comparison with all other segments (economy, employment, prices fuel and the cost of living the percentage of respondents who considered that in Istria is better, does not reach the two fifths.The basic findings of the research point to the conclusion that it is difficult to compose a unique socio-demographic profile of Istrian citizens regarding attitudes about the EU and European integrations. According to McLaren’s theories, the older and less educated respondents, the so-called transition losers, tend to isolationism, euro-scepticism, but in this research that has not proved to be true. It is also evident that the attitude about the European Union is not defined by the human capital (education), and our research results indicate according to the conclusion that the perception of the EU in Croatia is based on subjective motifs. The survey confirmed that people are still not sufficiently familiar with the work of European Institutions, while a large number is well, or very well familiar with the adhesion process of Croatia into the Union. In accordance with these facts we believe that the Croatian political elite did not manage to provide citizens the true nature of the European Union, and on the County level, it is clear the need to draw a close and interest the citizens on the activities implemented in the Region of Istria in the sphere of European integrations and international cooperation. This does not mean that these activities are negatively perceived as confirmed by the fact that citizens, who are familiar with the initiatives that the Region of Istria implemented, evaluated them positively, and we consider them as an important part of the future daily life of Istrian citizens.
70
QUESTIONNAIRE ABOUT THE EUROPEAN UNION
1. How old are you?2. Your occupation (profession)?3. Your level of education?
1. Low qualification 2. Secondary education 3. High qualification 4. Higher qualification 5. Master 6. Doctorate
4. Your current job?5. Do you support the membership of Croatia in the EU?
1. Yes 2. No 3. I do not know6. Do you think that the HR accession into the EU will be good for you?
1. Yes 2. No 3. I do not know7. The situation in Croatia in the following segments, in your opinion, is better or worse than the average situation in European countries?
Much better Something better Something worse Definitely worse I do not knowEconomyJobsCost of LivingPrices of energy sourcesQuality of life
8. Which of the following are the main reasons why you believe that Croatia will benefit from membership in the European Union? (up to three answers)1. It will contribute to the democratization of Croatia2. It will contribute to maintenance of peace and security3. It will contribute to economic growth of Croatia4. Some of the issues that are important to the Croatian citizens will be better
solved at the European Union level5. Membership in the European Union will improve cooperation between
Croatia and other European Union countries6. Croatian citizens will have a significant impact on decisions made at the
European Union level
Appendixes
71
7. It will give to Croatian citizens a stronger role in the world8. It will improve the standard of living of Croatian citizens9. It will help the Croatian citizens to deal easily with new challenges of
globalization10. It will bring to the Croatian citizens new employment opportunities11. Generally I am for the EU12. Something else13. I do not know9. What are the next most important reasons why you believe that Croatia will not benefit from membership in the European Union? (up to three answers)1. It will have a negative impact on the democratization of Croatia
2. It will have a negative impact on the maintenance of peace and guarantee of security
3. It will have a negative impact on economic growth of Croatia4. Some issues that are important to the Croatian citizens are better solved
on the national level5. Membership in the European Union will create a certain tension between
Croatia and other European Union countries6. Croatian citizens will have an insignificant impact on the decisions made at
the European Union level7. Influences of Croatia in the world will be weaken because of membership in
the European Union8. The European Union will reduce the living standards of Croatian citizens9. Membership in the European Union will make Croatia more sensitive to the
negative impacts of globalization10. It will Croatian citizens endanger jobs11. Generally I am against the European Union12. Other13. I do not know10. Do you know the activities of the Istrian County in the segment of EU integration? 1. Yes 2. No 11. If Yes, how do you assess the work of the Istrian County in the section of EU integration? (Poor) 1 2 3 4 5 (Excellent) 12. Do you know some European projects the County of Istria implemented or that are in progress of realization?
1. Yes 2.No13. If YES, do you think that they have a positive impact on the development of Istria?
1. Yes 2.No
72
14. Do you support the activities of the Istrian County and its organizations in the sphere of European Integration and International Cooperation?
1. Yes 2.No 3. I do not know about these activities15. Do you think that for the citizens of Istria the situation will get better when Croatia joins the European Union?
1. Yes 2.No 3. I do not know16. Do you think that the Istrian County inform enough the public on European Integrations?
1. Yes 2.No 3. I do not know17. Have you ever heard of the EuroInfo Newsletter of the Istrian County?
1. Yes 2.No18. Do you know about the Euro Info Point of the Istrian County?
1. Yes 2.No19. If Yes, how do you assess its work?
(Very negative) 1 2 3 4 5 (Excellent)20. In your opinion, the fact that Croatia can become an EU member for Istria is... (one answer)
1. Positive2. Negative3. Neither positive nor negative4. I do not know
21. Do you think that the Istrian County already cooperates with the EU and its Institutions?
1. Yes 2.No 3. I do not know22. The situation in Croatia in the following segments, in your opinion, is better or worse than the average situation in European countries?
Much better Something better Something worse Definitely worse I do not knowEconomyJobsCost of LivingPrices of energy sourcesQuality of life
23. Do you feel like a European citizen? 1. Yes 2.No 3. I do not know
24. Are you familiar with the work of the European Union and its institutions? 1. Very Good 2. Good 3. Pretty bad 4. Very bad
73
25. If Yes, how do you get the information? (multiple answers possible)1. TV2. Newspapers3. Radio4. Internet5. Info desks6. EuroInfo Newsletter of the Istrian County7. Other (specify)
26. What type of information related to the EU and European Integration would you want to receive? (multiple answers possible)
1. Europe at the local level2. Europe in my daily life3. Functioning of EU institutions4. Information about EU countries5. Other (specify)6. I do not want to receive any type of information
27. Do you want to receive monthly news from the European Union EuroInfo Newsletter of the Istrian County?
1. Yes, on my e-mail address (specify)2. No, I’m not interested in
28. How do you generally perceive the EU?1. Positive2. Negative3. Neither positive nor negative4. I do not know
29. What does the European Union mean to you? (specify a maximum of three answers)
1. Peace2. Economic Prosperity3. Democracy4. Social security5. Freedom of travel, study and work anywhere in the EU6. Cultural Diversity7. Stronger influence in the world8. Euro9. Unemployment10. Bureaucracy11. Waste of money12. Loss of our own cultural identity
13. More Crime14. Insufficient controls on external borders15. Something else (specify)16. I do not know
30. Do you feel familiar with the adhesion process in the EU? (No knowledge) 1 2 3 4 5 (Excellent knowledge)31. Are you favourable for the EU to continue spread to other countries?
1. Yes 2. No 3. I do not know32. Please state your opinion for each of the next statements
Mostly agree Mostly I do not agree I do not knowI understand how the EuropeanUnion worksCroatian interests are taken intoaccount in the European UnionEuropean Union imposesits views to CroatiaEuropean Union imposesits views to Croatia
33. Can you trust the following institutions? Yes No I don’t know
European ParliamentEuropean CommissionCouncil of the European UnionEuropean Central Bank
34. What is your position regards the future of the European Union?1. Very optimistic2. Slightly optimistic3. Slightly pessimistic4. Very pessimistic5. I do not know
35. Would you agree or not with the following statement: If the countries and the territory of the Western Balkans (Bosnia and Herzegovina, Serbia, Montenegro, Kosovo, Macedonia, Croatia and Albania) do enter the European Union, this will help the stabilization of this part of Europe.
1. Fully agree2. Mostly agree3. Generally do not agree4. Do not agree5. I do not know
Thank you!
75
This study was created with financial support of the European Union. The European Union unites 27 Member States that decided to pool their
knowledge, resources and destinies. During the 50 years of the enlargement process, a zone was established of stability, democracy and sustainable development, maintaining cultural diversity, tolerance and individual freedom.
The European Union committed itself to sharing its achievements and values with countries, neighbouring nations, with which it has common geographical borders.
The European Commission is an executive body of the European Union. The content of this study is the exclusive responsibility of the Foundation
for Partnership and Civil Society Development, this does not reflect the views of the European Union.
76
is a non-governmental and a non-profit organization whose priorities are education and professional consulting.
The main objective of the association is the forming of new professional profiles, which should be dovetailed into the labour market with improved private potential, equipped with professional terms and a better orientation in the new multimedia technologies.
The mission of the association ‘Informo’ is an active support to the development of the territory through education and consulting on human resources, using the ‘Know How’ and management technique, with direct participation in the evolution of the company.
Association: - Acts with the aim of improving the conditions of living of citizens in various
segments, especially of the young. - Designs and carries out training for employed and the unemployed, their retraining
for easier inclusion in the labour market, with particular attention to those in a high-risk status, women and representatives of small and medium-sized businesses.
- Conducts training programmes in order to meet the demand of labour market in an innovative and appropriate way.
- Provides support for direct participation, leads solution projects to their implementation.
- Promotes research and sociological studies on the processes of education and integration of systems, with particular attention to the experience and European demand for the globalization of new markets.
- Researches opportunities for securing financial resources from EU funds The association ‘Informo’ has experience in the field of public information
for opportunities related to the European Union and its institutions. From the very beginning it has been involved in the writing of the EuroInfo newsletter of the Istrian County, through which it informs the general public about the events in the EU and the opportunities that these procedures provide to Croatia. So far, various training for the youth were conducted, linked with the EU programme ‘Youth in Action’, and training on the possibilities of financing from the EU funds with a focus on FP7 and IPA programmes. The Association is involved in projects for the support to advocacy for the establishment of enterprise incubators for young people in Croatia, Bosnia and Herzegovina and Serbia.
With the partnership of the Foundation for Partnerships and Civil Society Development of the Istrian County, the Association ‘Informo’ is included in the I.C.E. project. The main role of NGOs in this project is the carrying out of the opinion poll in the Istrian County on the EU and its institutions.
‘INFORMO’ believes in constant research of organizational quality. Participates directly and professionally in finding solutions and development of projects.
77
Andrea Debeljuh, President of the Association Informo, was born in 1979 in Pula. He finished his secondary education in Portorož, Slovenia. He graduated from the Faculty of Science of Education at the University of Bologna, completed his Master in Tourism at the University Uniadrion and got his Doctorate in Pedagogy at the University of Bologna. He spent one academic year at Universidad de Murcia, Spain. Participated in various training and seminars of which the most important are those related to the area of Education, Management of European Community founds and the Protection of National Minorities. He worked as a Scientist in various research projects for the Research Centre CIPO and the Italian Union. He was a guest as a University Scientist at the University ‘Brown University’ in Providence (USA). Currently he teaches ‘Alternative Theories of Preschool Education’ at the Faculty of Arts in Pula, and ‘Adult Education in an International Context’ at the Faculty of Arts in Rijeka.
Adriana Hrelja, collaborator for research projects, was born in Pula, the 13th July 1980. She went to the Italian school and completed her secondary education in languages in 1998 in Pula. She graduated in 2004 with International Affairs from the Faculty of Political Science at the University of Trieste with the research in the archives of Berlin and Warsaw. She participated in a one year course in EU Projects Management, IQ Euro in Izola, Slovenia, 2006. She participated in the programme of Professional Training in the Representative Office of the Region of Istria in Brussels in 2008. She got her Doctorate in 2009 at the International University Institute for European Studies in Gorizia, Italy, with research work on the topic of added value of the cross-border cooperation, with special emphasis on the Region of Istria.
78
Charts: Boris BabićText corrections by: Monika Brščić, mag.
Translated by: Lorena Oplanić, mag.
Design:
Artepublika
Print: Angolo Tim
79
Charts: Boris BabićText corrections by: Monika Brščić, mag.
Translated by: Lorena Oplanić, mag.
Design:
Artepublika
Print: Angolo Tim
This project is co-financed by the European Union trough the programme „Europe for Citizens“