Embed Size (px)
Citation preview
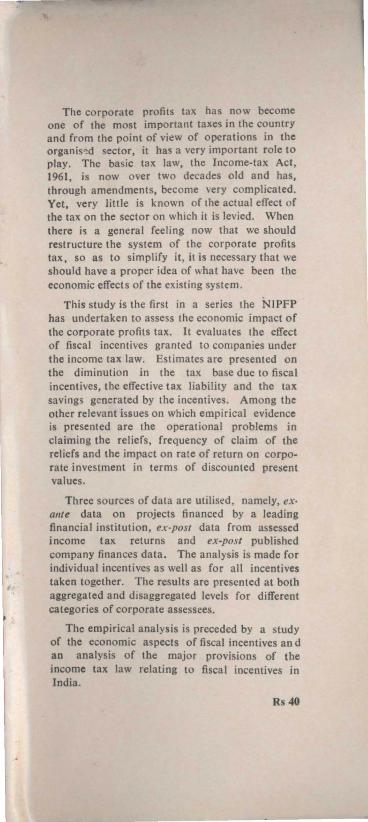
The corporate profits tax has now become one of the most important taxes in the country and from the point of view of operations in the organis~d sector, it has a very important role to play. The basic tax law, the Income-tax Act, 1961, is now over two decades old and has, through amendments, become very complicated. Yet, very little is known of the actual effect of the tax on the sector on which it is levied. When there is a general feeling now that we should restructure the system of the corporate profits tax, so as to simplify it, it is necessary that we should have a proper idea of what have been the economic effects of the existing system.
This study is the first in a series the NJPFP has undertaken to assess the economic impact of the corporate profits tax. It evaluates the effect of fiscal incentives granted to companies under the income tax law. Estimates are presented on the diminution in the tax base due to fiscal incentives, the effective tax liability and the tax savings generated by the incentives. Among the other relevant issues on which empirical evidence is presented are the operational problems in claiming the reliefs, frequency of claim of the reliefs and the impact on rate of return on corporate investment in terms of discounted present values.
Three sources of data are utilised, namely, ex· allte dala on projects financed by a leading financial institution, ex-post data from assessed income tax returns and ex-post published company finances data. The analysis is made for individual incentives as well as for all incentives taken together. The results are presented at both aggregated and disaggregated levels for different categories of corporate assessees.
The empirical analysis is preceded by a study of the economic aspects of fiscal incentives an d an analysis of the major provisions of the income tax law relating to fiscal incentives in India.
Rs 40

(I'd
FISCAL INCENTIVES AND CORPORATE TAX SAVING
FISCAL INCENTIVES
AND CORPORATE TAX SAVING
VINAY D. LALL
NATIONAL INSTITUTE OF PUBLIC FINANCE AND POLICY
NEW DELHI 110067
Published, by V.S. Renganathan
National Institute of Public Finance and Policy
18/2, Satsang Vihar Marg
Special Institutional Area
New Delhi 110067
©NATIONAL INSTITUTE OF PUBLIC FINANCE AND POLICYFIRST PUBLISHED 1983
Printed in India
Print India, A-38/2, Phase I, Mayapuri, New Delhi-110064
Preface
The National Institute of Public Finance and Policy is an
autonomous, non-profit organisation whose major functions
are to carry out research, do consultancy work and undertake
training in the area of public finance and policy. In addition
to carrying out, on its own, research studies on subjects that
are considered to be important from the national point of view
in terms of policy formulation, the Institute also undertakes
research projects on subjects of public interest, sponsored by
member governments and other institutions.
The present study is a part of an overall study of the
theoretical and quantitative aspects of corporate profits taxation
in India. The corporate profits tax has now become one of
the most important taxes in the country and from the point of
view of operations in the organised sector, it has a very important
role to play. The basic tax law, the Income-tax Act, 1961, is
now over two decades old and has, through amendments, become
very complicated. Yet, very little is known of the actual effect
of the tax on the sector on which it is levied. When there is a
general feeling now that we should restructure the system of the
corporate profits tax, so as to simplify it, it is necessary that we
should have a proper idea of what have been the economic effects
of the existing system. We have also to have a proper idea of
the alternatives that can be thought about. It is for the purpose
of enabling an informed discussion on the lines of corporate tax
reform that this study was undertaken.
The present study assesses the impact of the various fiscal
incentives that are available to companies in India, either when
they undertake an investment programme or any other specified
activity, such as export development and scientific research. This
study could be successfully completed only because we obtained
valuable co-operation and support from the Central Board of

VI
Direct Taxes (CBDT), Ministry of Finance, Government of
Ind;a and the Industrial Credit and Investment Corporation of
India Ltd. (ICfCI), both of which made available to us primary
data on the basis of which the quantitative exercises could be
undertaken.
The study was conducted by Vinay D Lall, who has also drafted
the Report. S Gopalakrishnan and A K Gupta rendered research
assistance almost throughout the project. They also compiled
the data from the appraisal reports in the ICICI. Towards the
end, Gautam Naresh and Sonika Jethwaney helped in preparing
the final tables. K K Atri and A K Halen processed the data on
the NIPFP computer.
The Governing Body of the Institute does not take respon
sibility for any of the views expressed by the author in the
Report. The responsibility for the conclusions arrived at and
the views expressed belongs to the Director and the staff of the
Institute and more particularly to the author of the Report.
February 17, 1983 R J CHELLIAH
Vice Chairman
Acknowledgements
The empirical exercises in this study have been possibledue to generous access to primary data granted by the CentralBoard of Direct Taxes (CBDT), Ministry of Finance, Government of India, and the Industrial Credit and Investment Corpo
ration of India Ltd. (ICICI). When this study was undertakenin the middle of 1979, V V Badami, then Chairman of the CBDT,
gave us the necessary access to data from assessed income tax
returns of major corporate assessees and S Kumarasundaram,
then Joint Managang Director, ICICI, gave us access to invest
ment appraisal reports of ICICI-assisted companies. C C Choksi,
Senior Partner, C C Choksi and Co., Chartered Accountants,Bombay, provided to us information from assessed income taxreturns of their clients. But for the co-operation of these organi
sations, the study could not have been undertaken.
Several officials from the Income Tax Department and the
ICICI made available to me their time, expertise and in-depth
knowledge of the intricacies of the income tax law and financing
of industrial projects, clarified many misgivings, helped to
develop the methodology, select the proper sample and interpret
the results more satisfyingly than would have been otherwise
possible. Among the discussions I had with several Commis
sioners and Assistant Commissioners of the Income Tax Depart
ment, I would like to especially recall those with K K Sen, B
Laxmipathy, R N Bose and W A Khan. Among the officials of
the ICICI, I wish to mention in particular, the discussions with
S Kumarasundaram, S V Shah and V C Shah.
Among my colleagues whose time and expertise I exten
sively exploited are R J Chelliah, K Srinivasan, A Bagchi and
J S Kapoor. Apart from giving suggestions on methodological
issues, R J Chelliah went through earlier drafts and suggested
changes, the impact of which is evident in the study.
Vlll
K Srinivasan and A Bagchi made suggestions on the part relating
to the fiscal reliefs under the income tax law, and the analysis of
CBDT data. Valuable suggestions were also made by some
senior Assistant Commissioners of income tax who attended a
course on Economics of Income Taxation at the Institute in May,
1981, and where 1 had the opportunity to present some of the
empirical results.
The data were processed on the NIPFP computer by K K
Atri and A K Halen. Other NIPFP colleagues who were asso
ciated with the project in the collection, processing and tabula
tion of the data at some point of time arc S Gopalakrishnan,
A K Gupta, Gautam Naresh and Sonika Jcthwaney.
The secretarial assistance was provided by N Natarajan
and the final typing was done by K R Subramaniam. Neeru
Uppal helped in checking the typescript. C. Cecil suggested
editorial improvements and also saw the publication through the
press.
VINAY D LALL
Feburary 17, 1983
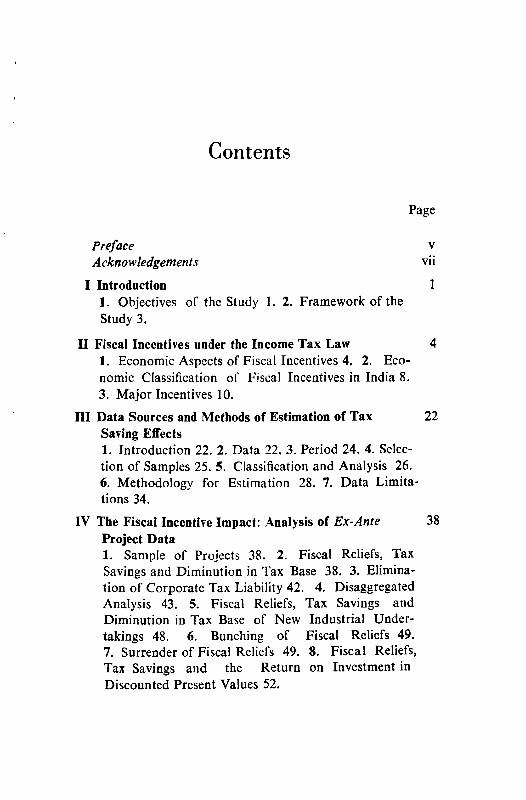
Contents
Page
Preface v
Acknowledgements vii
I Introduction 1
1. Objectives of the Study 1. 2. Framework of the
Study 3.
II Fiscal Incentives under the Income Tax Law 4
1. Economic Aspects of Fiscal Incentives 4. 2. Eco
nomic Classification of Fiscal Incentives in India 8.
3. Major Incentives 10.
III Data Sources and Methods of Estimation of Tax 22
Saving Effects
1. Introduction 22. 2. Data 22. 3. Period 24. 4. Selec
tion of Samples 25. 5. Classification and Analysis 26.
6. Methodology for Estimation 28. 7. Data Limita
tions 34.
IV The Fiscal Incentive Impact: Analysis of Ex-Ante 38
Project Data
1. Sample of Projects 38. 2. Fiscal Reliefs, Tax
Savings and Diminution in Tax Base 38. 3. Elimina
tion of Corporate Tax Liability 42. 4. Disaggregated
Analysis 43. 5. Fiscal Reliefs, Tax Savings and
Diminution in Tax Base of New Industrial Under
takings 48. 6. Bunching of Fiscal Reliefs 49.
7. Surrender of Fiscal Reliefs 49. 8. Fiscal Reliefs,
Tax Savings and the Return on Investment in
Discounted Present Values 52.
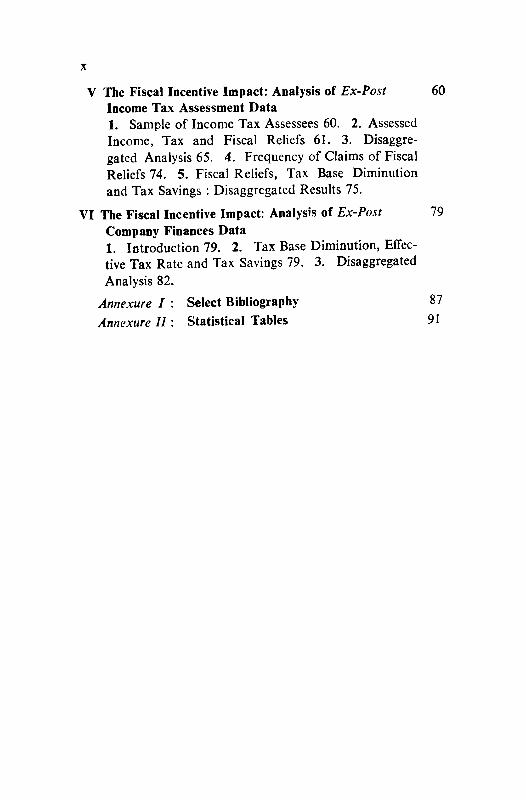
V The Fiscal Incentive Impact: Analysis of Ex-Post 60
Income Tax Assessment Data
1. Sample of Income Tax Assessees 60. 2. Assessed
Income, Tax and Fiscal Reliefs 61. 3. Disaggre
gated Analysis 65. 4. Frequency of Claims of Fiscal
Reliefs 74. 5. Fiscal Reliefs, Tax Base Diminution
and Tax Savings : Disaggregated Results 75.
VI The Fiscal Incentive Impact: Analysis of Ex-Post 79
Company Finances Data
1. Introduction 79. 2. Tax Base Diminution, Effec
tive Tax Rate and Tax Savings 79. 3. Disaggregated
Analysis 82.
Annexure I : Select Bibliography 87
Annexure II: Statistical Tables 91
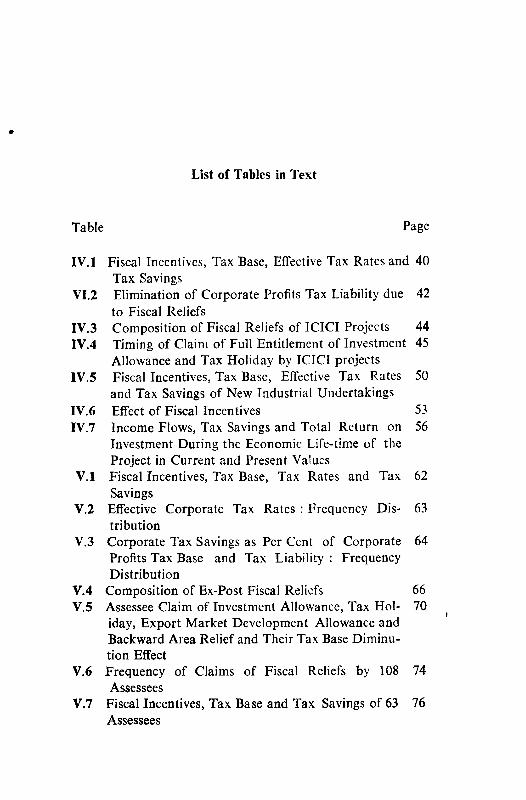
List of Tables in Text
Table Page
IV.l Fiscal Incentives, Tax Base, Effective Tax Rates and 40
Tax Savings
VI.2 Elimination of Corporate Profits Tax Liability due 42
to Fiscal Reliefs
IV.3 Composition of Fiscal Reliefs of ICICI Projects 44
IV.4 Timing of Claim of Full Entitlement of Investment 45
Allowance and Tax Holiday by ICICI projects
IV.5 Fiscal Incentives, Tax Base, Effective Tax Rates 50
and Tax Savings of New Industrial Undertakings
IV.6 Effect of Fiscal Incentives 53
IV.7 Income Flows, Tax Savings and Total Return on 56
Investment During the Economic Life-time of the
Project in Current and Present Values
V.I Fiscal Incentives, Tax Base, Tax Rates and Tax 62
Savings
V.2 Effective Corporate Tax Rates : Frequency Dis- 63
tribution
V.3 Corporate Tax Savings as Per Cent of Corporate 64
Profits Tax Base and Tax Liability : Frequency
Distribution
V.4 Composition of Ex-Post Fiscal Reliefs 66
V.5 Assessee Claim of Investment Allowance, Tax Hoi- 70
iday, Export Market Development Allowance and
Backward Area Relief and Their Tax Base Diminu
tion Effect
V.6 Frequency of Claims of Fiscal Reliefs by 108 74
Assessees
V.7 Fiscal Incentives, Tax Base and Tax Savings of 63 76
Assessees
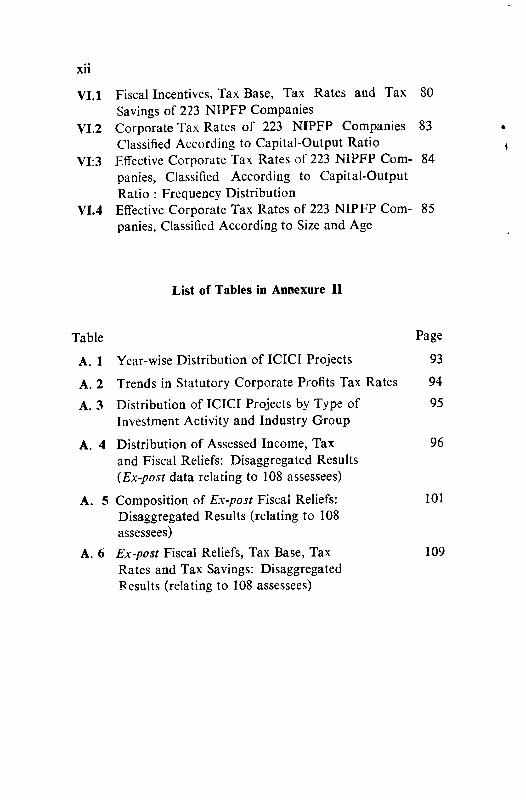
Xll
VI.l Fiscal Incentives, Tax Base, Tax Rates and Tax 80
Savings of 223 NIPFP Companies
VI.2 Corporate Tax Rates of 223 NIPFP Companies 83
Classified According to Capital-Output Ratio
VI:3 Effective Corporate Tax Rates of 223 NIPFP Com- 84
panies, Classified According to Capital-Output
Ratio : Frequency Distribution
VI.4 Effective Corporate Tax Rates of 223 NIPFP Com- 85
panies, Classified According to Size and Age
List of Tables in Annexure II
Table Page
A. 1 Year-wise Distribution of ICICI Projects 93
A. 2 Trends in Statutory Corporate Profits Tax Rates 94
A. 3 Distribution of ICICI Projects by Type of 95
Investment Activity and Industry Group
A. 4 Distribution of Assessed Income, Tax 96
and Fiscal Reliefs: Disaggregated Results
(Ex-post data relating to 108 assessees)
A. 5 Composition of Ex-post Fiscal Reliefs: 101
Disaggregated Results (relating to 108
assessees)
A. 6 Ex-post Fiscal Reliefs, Tax Base, Tax 109
Rates and Tax Savings: Disaggregated
Fesults (relating to 108 assessees)
I. Introduction
1. Objectives of the Study
The corporate profits tax system in Tndia has remained largely
unchanged for over two decades. The last major change was
made in the year 1959-60 when the partial imputation system
was replaced by the classical system of taxation of corporate-
source income. Under the present system, the company is
treated as a separate economic entity and the shareholder gets
no credit or allowance for any part of the tax levied at the
corporate level. Under the earlier system, the shareholder was
given credit for the corporate tax paid by the company on the
distributed component of profits.
The present Income-tax Act, 1961, which replaced the Indian
Income-tax Act of 1922, is also now over two decades old. Over
the years, the Act has been subject to several revisions off and
on through amendments, additions of new provisions and
important judicial rulings. As a result, what Kaldor (1956)
observed a quarter century ago is perhaps even truer today.
The company tax provisions in India are, to quote Kaldor, "a
perfect maze of unnecessary complications, the accretion of
years of futile endeavour. . ." (p 84).
There has been some discussion during the last few years on
the need to replace the Income-tax Act, 1961. A number of
Commissions/Committees have examined particular aspects of
the income tax system. The Economic Administration Reforms
Commission (Jha Commission) is also seized of the problem.
At the same time, there has been a noticeable absence of
scientific quantitative studies on the actual operations and effects
of the income tax system. This may be attributed partly to
inadequacies in the data base.
However, to keep any discussion on tax reform in its proper
perspective, it is necessary to analyse the impact of the existing
2 FISCAL INCENTIVES AND CORPORATE TAX SAVING
system, identify its weaknesses and propose and assess an alterna
tive tax system. Such a study is all the more desirable in the case
of the corporate profits tax, as not only is this tax a major instru
ment for mobilising resources but it also directly affects
operations in a growth-oriented segment of the economy.
There have been few studies of issues relating to the Indian
corporate profits tax. Sahota (1961), Rao (1979) and Khadye
(1981) presented estimates on the elasticity and buoyancy of the
corporate profits tax system on the basis of time-series data,
but they did not offer any economic explanation for the results
obtained. Lall (1967), the Expert Committee on Unemploy
ment, Ministry of Labour and Rehabilitation (1972), Jhaveri
(1973), NCAER (1976), Somayajulu (1977) and the Expert
Committee on Tax Measures to Promote Employment (Dande-
kar Committee, 19 0) presented some estimates on the
tax-saving effect of selected fiscal incentives, in particular, the
development rebate, investment allowance and tax holiday,
mainly on the basis of ex-post data from published annual
reports and assessment data from income tax returns. These
studies related to selected years and did not cover all the fiscal
incentives. Laumas (1966), Lall (1967, 1974), Gandhi (1968)
and Rao (1980) presented some evidence on the shifting of the
corporate profits tax in India. A few econometric studies on
corporate finances in India have been made over the last
decade and a half, but these [for example, Sastry (1966),
Krishnamurty and Sastry (1971, 1975), Swamy and Rao (1975)J
have not assessed the impact of the corporate profits tax; only
Venkatachalam and Sarma (1978) and Lall, Srinivasa and Atri
(1982) have assessed econometrically the effect of the corporate
profits tax on selected aspects of corporate operations, namely,
retentions, gross resource mobilisation, equity finance to debt
finance ratio and retentions to fresh issues ratio.
This study presents empirical evidence on one aspect of the
operations of the corporate profits tax in India, namely, the
effect of fiscal incentives.1 Specifically, the objectives of the
Another study, Economic Impact of the Corporate Profits Tax (due in
January 1983), provides empirical evidence on the sensitivity of the cor
porate profits tax and its effect on corporate operations, such as the
level of corporate investment, profitability, dividend policy and capital
structure.
INTRODUCTION 3
study are:
(i) To quantify the extent of diminution in the corporate
profits tax base due to fiscal incentives (at aggregate
level and for individual incentives), estimate the effective
corporate tax liability and the corporate tax savings
or gains to the companies;2
(ii) To examine at the disaggregated level whether factors like
age, size and capital intensity of operations have a
bearing on the extent of the diminution in the tax base
and on the level of tax savings;
(iii) To measure the effect of tax savings generated by fiscal
incentives on the total return over the 'economic' life of
a project; and
(iv) To measure the proportion of expected corporate tax
savings generated by fiscal incentives to the anticipated
project cost.
2. Framework of the Study
In order to place the quantitative analysis in proper perspec
tive, the following chapter discusses the economic aspects ot
fiscal incentives and examines the provisions under the income
tax law relating to fiscal incentives granted to companies. The
methodology developed to assess the tax-saving effect of fiscal
incentives is explained in Chapter III. Empirical evidence on
the tax-saving effect of fiscal incentives is presented in the next
three chapters: on the basis of ex-ante data relating to project
proposals (Chapter IV), on the basis of ex-post data on income-
tax assessments of major corporate assessees (Chapter V), and
on the basis of ex-post data on company finances relating to
major companies (Chapter VI).
2. The study does not attempt to quintify the tax loss to the national ex
chequer because of the fiscal incentives, nor does it attempt to identify
and quantify the impact of the fiscal incentives on the attainment of
the objectives for which they were formulated. Further, the fiscal in
centives linked to indirect taxes, state taxes and municipal levies fall
outside, the purview of the study^
II. Fiscal Incentives
Under The Income Tax Law
1. Economic Aspects of Fiscal Incentives
a. Purpose and definition. Under the Indian Income-tax Act,
1961, fiscal incentives can be broadly classified into two
categories:
(i) Those designed to help the taxpayer to replace his
assets or to expand his business, particularly in direc
tions in which Government is, for the time being,
interested; and
(ii) Those designed to serve extraneous purposes not con
nected with or incidental to the taxpayer's business or
other sources of income.
From the point of view of the economist and the corporate
tax planner, the purpose of a fiscal incentive is somewhat
different. The primary function is to make the specific activity
which is sought to be encouraged more attractive or rewarding
by improving its net profitability or, in other words, raising the
total return on the investment and reducing the capital risk
involved. A recent definition of an investment incentive by
Bracewell-Milnes, B and Huiskamp, J C L (1980, p. 20) brings
out clearly the economic character of a fiscal incentive as well
as its primary purpose: ". . . We define an investment incentive
as any measure conditional on new investment taking place
which is designed to increase the prospective net-of-tax return
from the investment relatively to its cost at the time of the
investment decision."
b. Characteristics of fiscal incentives. The timing of the
incentive, thus, is crucial—it should be known before the
specific investment or expenditure is incurred or the activity is
undertaken. The gains from a fiscal incentive improve the
FISCAL INCENTIVES UNDER THE INCOME TAX LAW 5
profit prospects before the investment decision is made and is
not available on investments already made. A fiscal incentive
cannot therefore be considered a windfall, as its availability is
known or expected when the investment is being planned.
Further, it is, to quote Bracewell-Milnes and Huiskamp (1980,
p. 20) again, "not a command", but a "carrot" which makes
investment (or the activity) more attractive to the investor
"absolutely as well as relatively". There is no forced action as
happens, for example, in a scheme of a tax levy or a tax rate
change. Thus, when a tax is introduced or the tax rate is raised
on retained profits or is reduced on distributed profits, there is
forced action or command to increase distribution and to reduce
retention.
Fiscal incentives are, by and large, of a temporary nature
for a specified period of time and for specific purposes. Further,
in some cases the fiscal incentive may be restricted to certain
industries and/or operations in selected locations.
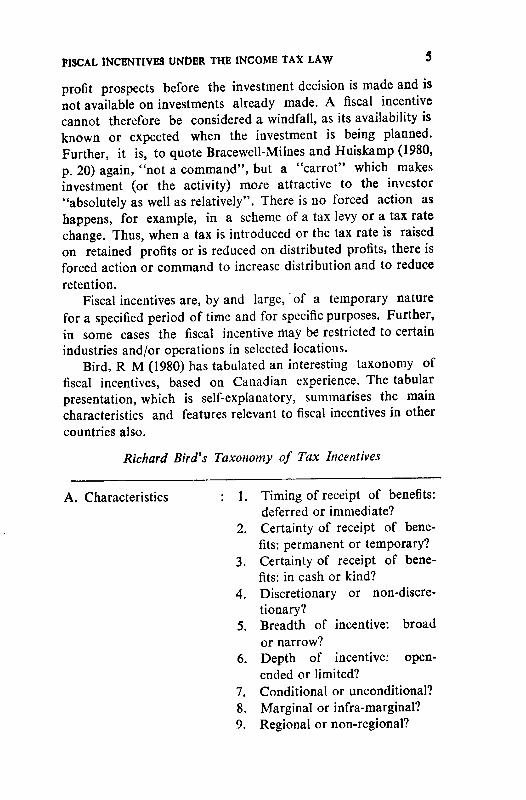
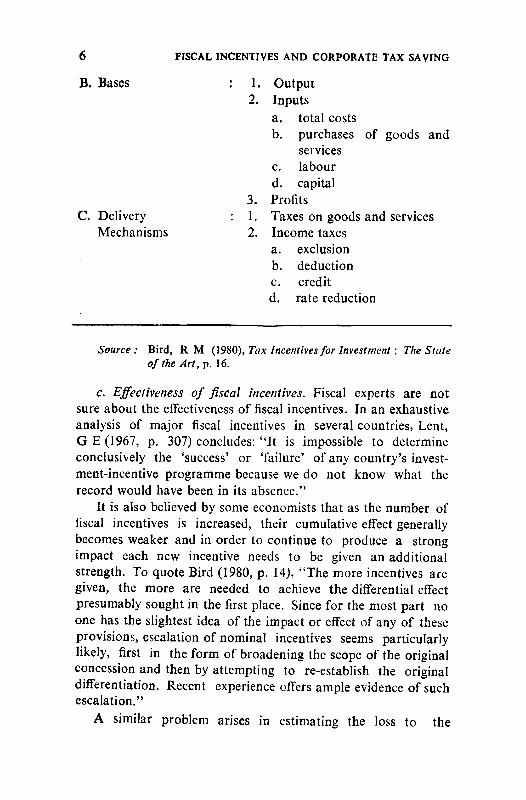
Bird, R M (1980) has tabulated an interesting taxonomy of
fiscal incentives, based on Canadian experience. The tabular
presentation, which is self-explanatory, summarises the main
characteristics and features relevant to fiscal incentives in other
countries also.
Richard Bird's Taxonomy of Tax Incentives
A. Characteristics : 1. Timing of receipt of benefits:
deferred or immediate?
2. Certainty of receipt of bene
fits: permanent or temporary?
3. Certainty of receipt of bene
fits: in cash or kind?
4. Discretionary or non-discre
tionary?
5. Breadth of incentive: broad
or narrow?
6. Depth of incentive: open-
ended or limited?
7. Conditional or unconditional?
8. Marginal or infra-marginal?
9. Regional or non-regional?
FISCAL INCENTIVES AND CORPORATE TAX SAVING
B. Bases
C. Delivery
Mechanisms
: 1.
2.
3.
: 1.
2.
Output
Inputs
a. total costs
b. purchases of goods and
services
c. labour
d. capital
Profits
Taxes on goods and services
Income taxes
a. exclusion
b. deduction
c. credit
d. rate reduction
Source : Bird, R M (1980), Tax Incentives for Investment: The State
of the Art, p. 16.
c. Effectiveness of fiscal incentives. Fiscal experts are not
sure about the effectiveness of fiscal incentives. In an exhaustive
analysis of major fiscal incentives in several countries, Lent,
GE(1967, p. 307) concludes: "It is impossible to determine
conclusively the 'success' or 'failure' of any country's invest
ment-incentive programme because we do not know what the
record would have been in its absence."
It is also believed by some economists that as the number of
fiscal incentives is increased, their cumulative effect generally
becomes weaker and in order to continue to produce a strong
impact each new incentive needs to be given an additional
strength. To quote Bird (1980, p. 14), "The more incentives are
given, the more are needed to achieve the differential effect
presumably sought in the first place. Since for the most part no
one has the slightest idea of the impact or effect of any of these
provisions, escalation of nominal incentives seems particularly
likely, first in the form of broadening the scope of the original
concession and then by attempting to re-establish the original
differentiation. Recent experience offers ample evidence of suchescalation."
A similar problem arises in estimating the loss to the
FISCAL INCENTIVES UNDER THE INCOME TAX LAW 7
national exchequer as a result of the fiscal incentives. Exercises
on estimating the 'revenue loss' or 'revenue sacrifice' become
largely academic as the loss or sacrifice is notional rather than
real. They tend to overlook the likely and desired snowballing
effect of the fiscal incentive on economic activities, resulting in
a higher level of corporate income, profits and tax revenue.
While it is, in principle, to quote Bird, (1980, pp. 15-16) "at
least as difficult to measure the cost of tax incentives as of tax
expenditures," in practice, "it is probably harder because one
would expect the behavioural changes induced by incentives to
be more marked since their purpose is precisely to change
behaviour." He, therefore, suggests that "incentive studies must
be concerned not only with how much the provision costs but
also with the benefits that result from it . . ."
Thus, according to fiscal experts, it is not possible to come
to any definite conclusion as to what the investment situation
(or export or research activity) would have been in the absence of
the fiscal incentive or to point out the exact relationship between
a fiscal incentive and the specific activity which is sought to be
encouraged. Two possibilities can, however, be visualised on a
priori basis: First, some of the activity which is sought to be
encouraged would have taken place even without the relevant
fiscal incentive, and, secondly, the fiscal incentive may influence,
at least to some extent, the formulation of an investment
proposal. What cannot be denied, however, is that the tax relief
generated by a fiscal incentive diminishes the corporate profits
tax base by allowing some expenditure as a deduction (which
would not have been allowed in its absence) by either exempting
some part of corporate profits or income from the tax base or
levying a preferential tax rate. The fiscal incentive, thus, reduces
the effective tax liability and so generates, in terms of the
original tax liability, some tax savings or gains to the corpora
tion. Such tax savings have a bearing on the net rate of return
on the investment and also the total return over the economic
life of the project.
Tax savings to the companies can also be taken to represent
the maximum level of 'revenue loss' that would be sustained
by the national exchequer, if additional economic activities as
envisaged do not take place and, consequently, no additional pro
fits are generated. If, however, some part of the envisaged increase
8 FJSCAL INCENTIVES AND CORPORATE TAX SAVING
in economic activities materialises, the 'revenue loss' would be
less than the tax savings to the companies. It cannot be ruled
out that the additional tax revenue due to the increased level of
economic activities might exceed the tax savings or the initial
'revenue loss' suffered by the national exchequer.3
2. Economic Classification of Fiscal Incentives in India
Fiscal incentives in India may be classified on economic
considerations broadly into three categories:
a. Investment-linked fiscal incentive;
b. Expenditure-linked fiscal incentive; and
c. Income-linked or profits and gains-linked fiscal incentive.
Essentially, the investment-linked and expenditure-linkedfiscal incentives have the same base, i.e., expenditure, but while
the former is based on expenditure on capital account and can,
therefore, be taken to reflect corporate investment, the latter is
based on expenditure on current account. Expenditure-linkedfiscal incentives may be further sub-divided into two categories,depending on whether the expenditure is related to actualoperations or promotion of the business of the company or is
unrelated to such operations and incurred on programmes of
national importance, which the government may seek topromote.
Investment-linked incentives, as the term suggests, are
dependent upon actual investment being made in the industrial
sector in general, in selected industries or in backward areas.
The development rebate and investment allowance (sections 33
and 32A)4 relate to this category. It is sometimes held that
these reliefs constitute corporate savings, which are retained in
business. This view is partially correct. In the short-run, these
reliefs constitute corporate savings but they are subsequently
used for day to day corporate operations. In fact, such reliefs
3. Speeches of Finance Ministers, when introducing a fiscal incentive,
invariably lay emphasis on what is sought to be attained, i.e., the activity to be encouraged. The loss in revenue is hardly given any impor
tance, as the Ministers anticipate the snowballing effect of the incen
tive on the specific sector and also on the economy to compensate forany loss in tax revenue.
4. Sections mentioned, unless otherwise specified, refer to those under theIndian Income-tax Act, 1961.
fISCAL INCENTIVES UNDER THE INCOME TAX LAW 9
are obtained with reference to expenditure already incurred on
capital account. Tax holiday (section 80J) as it existed upto
March 31, 1981, belonged to this category of fiscal incentives,
but now (section 801) belongs to the income-linked category,
after its base was changed from capital employed to profits and
gains, effective for new businesses becoming operative after
March 31, 1981.
The current account expenditure-linked fiscal incentives are
related to specified expenditures already incurred. These
expenditures are either fully or partly deductible, and in some
cases on some weighted basis also. A relief accrues from such
expenditure as the admissible deduction exceeds what would
have been ordinarily allowed. Such reliefs, which are related to
expenditure connected with corporate business operations,
include those on scientific research (section 35), on acquisition
of patent rights or copy rights (section 35H), export market
development (section 35B), selected agricultural development
(section 35C), amortization of certain preliminary expenses
(section 35D) and prospecting for certain minerals (section 35E).
Expenditure not related to corporate business operations but
which also provides tax relief includes expenditure encouraged
by the company in approved programmes of national impor
tance, such as rural development (section 80CC and section
80CCA), promotion of family planning among employees
(section 36(l)(ix)), donations to eligible charitable institutions
(section 80G) and donations for scientific research or for rural
development (section 80GGA).
The third group of fiscal incentives is linked to specific
types of income and generate tax savings as part of such income
is deductible from the tax base. These tax reliefs relate to income
originating from priority industry (former section 801), units
located in backward areas (section 80HH) and rural areas
(section 80HHA), construction contracts abroad (section
80HHB), exports of specified products (section 89A), new
investments in selected industries (section 801) and also such
income as originating in the form of dividends (paid out of
tax-holiday profits) from new industrial undertakings, ships and
hotels (section 80K), inter-corporate dividends from companies
engaged in manufacture of specified articles (section 80M), and
royalties, commission, fees, etc., received from selected foreign
10 FISCAL INCENTIVES AND CORPORATE TAX SAVING
companies (section 80O).
Major Incentives
a. Development rebate. The development rebate (section 33)
was incorporated into the Indian corporate profits tax system
in 1955 on the recommendation of the Taxation Enquiry
Commission (Matthai Commission, 1954)5. The development
rebate was abolished in 1974, to be subsequently replaced in
1976 by the investment allowance. During the intervening period,
1975 to 1976, an additional initial depreciation was allowed, and
the unabsorbed portion of this allowance could be carried for
ward indefinitely, just as the usual depreciation.
The development rebate was related to the actual cost of
new machinery and plant installed by the company after March
31, 1954. No rebate was allowed on old assets installed before
this date as the objective of the incentive was to stimulate new
investment for replacement of an old asset, or for expansion of
an existing unit or for setting up a new enterprise. The rate of
the rebate was uniform at 25 per cent, but subsequently, the
Finance Act, 1958, introduced a special rate of 40 per cent for
ships acquired after December 31, 1957. Frequent changes in the
rate of the rebate were made between 1963 and 1974, when the
incentive was withdrawn. At the time of its abolition, the rate of
the development rebate was 40 per cent for ships, 20 per cent for
machinery and plant in non-priority sector industries6 and 35 per
cent for plant and machinery in priority sector industries, if the
machinery and plant were installed before April 1, 1970, and the
rates were 15 per cent and 25 per cent, respectively, if the
machinery and plant were installed on or after that date.
A major change in the scheme of the development rebate
was made through the Finance Act. 1958, when three condi-
5. Prior to the development rebate, an initial depreciation allowance at
the rate of 20 per cent of the cost of new plant and machinery installed
after March 31, 1945, was available under the Income tax (Amendment)
Act, 1946. The Matthai Commission recommended a development
rebate as the initial depreciation allowance was not found to be a
sufficient stimulus for new investments in the industrial sector.
6. The rate was reduced from 25 per cent by the Finance Act, 1961.
FISCAL INCENTIVES UNDER THE INCOME TAX LAW 11
tions were imposed,7 viz.,
(i) A separate development rebate reserve was to be created
by transferring from the profits and loss account an
amount equivalent to 75 per cent of the rebate actually
allowed (50 per cent in the case of ships acquired after
February 28, 1966, vide Finance Act, 1966);
(ii) The development rebate reserve could not be utilised
for 10 years for distribution of dividends or for remit
tance outside India either as profits or for creation of
an asset outside India;8 and
(iii) The asset could not be sold or transferred for 10 years,
except to the government.
The development rebate was allowed over and above the
depreciation allowance and as such there was no reduction in
the written-down value of the asset. The rebate was not avail
able for road transport vehicles and office appliances, with
effect from April 1, 1960.
The abolition of the development rebate was strongly
recommended in the Bhoothalingam Report (1967) and its aboli
tion, proposed in the Budget speech of 1971, was also supported
by the Wanchoo Committee (1971), as the incentive resulted in
"the more liberal and less careful use of capital resources than
otherwise", to quote Bhoothalingam (p. 23) and had "outlived
its utility", to quote the Wanchoo Committee (p. 113).
b. Investment allowance. The investment allowance (section
32A), like the development rebate, is related to the actual cost
of investment in machinery and plant. The purpose is also to
stimulate new investment in such capital assets. The rate for
the investment allowance is 25 per cent or 35 per cent, the
higher rate being applicable to machinery and plant utilising
indigenous techniques and know-how process developed in
approved national research institutions. The relief is not avail
able for machinery and plant installed in office premises or in
7. These conditions were imposed on the basis of the recommendation of
the Direct Taxes Enquiry Committee (Tyagi Committee) (1958), which
observed that the relief was being misused by the assessees who used
the tax savings generated by the relief to incur expenses or to pay
dividends.
8. The reserve could, however, be used for other purposes in the business
such as to meet liabilities, acquire stocks or to make investments.
12 FISCAL INCENTIVES AND CORPORATE TAX SAVING
residences, or to office appliances and road transport vehicles.
The investment allowance is available on entitled ship or
aircraft acquired and machinery and plant installed after
March 31, 1976. The eligible industries, apart from shipping
and airways, are power generation, industries engaged in cons
truction, manufacture or production of items not specified in
the Eleventh Schedule of the Income-tax Act, 1961 (which lists
low priority industries) and all small-scale industries (i.e., units
with a value of installed machinery and plant not exceeding
Rs 20 lakh effective from August 1, 1980 and Rs 10 lakh prior
to that date), even if they manufacture the Eleventh Schedule
listed items. In fact, the investment allowance is available to
other units also when they manufacture an Eleventh Schedule
listed item, provided the machinery and plant is used mainly
to manufacture non-Eleventh Schedule articles.
Like the development rebate, the investment allowance
can be availed of only if an amount equivalent to 75 per cent
of the allowance (50 per cent in the case of ships) is debited
from the profits and loss account and credited to a specially
created investment allowance reserve. Similarly, the investment
allowance reserve cannot be utilised for a 10-year period to
declare dividends, to make remittances outside India as profits
or for creation of assets outside India.
The investment allowance provides for carry-forward of the
unavailed relief upto eight years. In the case of multi-plant
companies, available profits from units other than the one
wherein the relief-generating investment has been made, can be
used to set off the unabsorbed relief.
Recently, the Choksi Committee (1978) recommended
further liberalisation of the investment allowance scheme. It
recommended that the allowance should be granted even if the
asset acquired/installed is not brought into use in the year of
installation or in the immediately succeeding year and that
assessees engaged in the business of operation of ships or air
craft should be granted the investment allowance in respect of
any new machinery and plant installed for the purpose of their
business. The Choksi Committee's recommendations have not
yet been implemented.
c. Tax holiday. Tax holiday (section 801) is available on
profits and gains generated by newly established industrial
FISCAL INCENTIVES UNDER THE INCOME TAX LAW 13
undertakings, engaged in the manufacture of articles not listed
in the Eleventh Schedule of the Income-tax Act, 1961, and
also to a ship, cold storage and eligible hotel business which
became operative from April 1, 1981. The rate of the relief is
25 per cent and it is available for eight assessment years.
The tax holiday is granted to an industrial undertaking
subject to the conditions that
(i) the company is not formed by the splitting up, or the
reconstruction, of a business already in existence, but
that it is formed by the transfer to a new business of
machinery or plant previously used for any purposes;
(ii) it manufactures or produces any article or thing not
specified in the Eleventh Schedule or operates a cold
storage plant; and
(iii) in case of an industrial undertaking, it employs ten or
more workers using power or 20 or more workers
without using power.9
In the case of a ship, tax holiday is granted if it is owned
by an Indian company and was not, prior to its acquisition,
owned or used in Indian territorial waters by a person resident
in India. For a hotel to be eligible for the relief, it is necessary
that,
(i) the business should not have been formed by the
splitting up, or the reconstruction of a business already
in existence or by the transfer to a new business, of a
building previously used as a hotel or of any machinery
or plant previously used for any purpose;
(ii) the business is owned and carried on by a company
registered in India with a paid-up share capital of not
less than Rs. 5 lakh; and
(iii) the hotel should be approved by the Central Govern
ment for the purpose of the relief.
Prior to April 1,1981, the base of the tax holiday was different.
The tax holiday (then section 80J) was calculated with reference
to the amount of capital employed. The definition of capital
employed was intended to include owned capital (paid-up share
capital plus reserves, i.e., net worth), but this was not originally
9. The Eleventh Schedule condition, however, is not applicable to a small-
scale industrial undertaking.
14 FISCAL INCENTIVES AND CORPORATE TAX SAVING
specified. Several High Courts, on appeals by assessees, held
that the restricted definition of capital employed was ultra vires
of the Income-tax Act as it excluded borrowed capital.10 The
Central Board of Direct Taxes (CBDT), Ministry of Finance,
Government of India, subsequently amended Rule 19A of the
Income Tax Rules 1962, through the Income Tax (Third
Amendment) Rules, 1971, on May 28, 1971, to specifically
exclude borrowed 'moneys and debt' from the definition of
capital employed, effective from the assessment year 1972-73.
The scope of section 80J (tax holiday) was considerably
reduced with effect from April 1, 1979, when articles specified in the
Eleventh Schedule were excluded from the relief. The rate of the
tax holiday was 7.5 per cent of the qualifying capital employed
and the relief was available for the first five years after the
commencement of the business. Prior to March 31, 1976, and
before the abolition of the relief to shareholders on dividends
from new industrial undertakings, hotels and ships (under
section 80K), the relief was allowed at the rate of six per cent
of the capital employed. Any 'deficiency' in tax holiday in the
event of insufficiency of profits could be set off in any of the
seven immediately following assessment years but only from
future profits relating to the plant in which the relief-qualifying
investment was made, and not, as in the case of the develop
ment rebate and the investment allowance, against the profits
from other plants in the case of companies owning more than
one plant.
The tax holiday for the current year (under both section
80J and section 801) and the deficiency for earlier years under
section 80J) are allowed only after some of the other reliefs,
like -investment allowance and backward area relief, have been
fully utilized.
d. Comparative assessment of investment allowance and tax
holiday. It might be useful to compare the main merits of
10. In two cases relating to Century Enka Ltd. the Calcutta High Court
held Rule 19A to be ultra vires for this reason (see Income Tax Re
porter [ITR] 107 ITR 909 and 107 ITR 123). The Madras High Court
gave a similar judgement, in the case of Madras Industrial Linings Ltd.
(110 ITR 256), the Allahabad High Court in the case of Kota Box
Manufacturing Co. (1978, Tax Law Report, 640) and the Gujarat High
Court in the case of Cibatul Ltd. (115 ITR 879).
FISCAL'INCENTIVES UNDER THE INCOME TAX LAW 15
investment allowance and tax holiday, the two major fiscal
incentives now available under the Indian corporate profits tax
system:
(i) While investment allowance is in the nature of an
outright grant, which falls due in the first year of the
installation of the machinery and plant, tax holiday is in
the form of a deduction from income. As such,
investment allowance is due even in the absence of
profits, but tax holiday can arise only when profits
accrue.
(ii) The discounted value of a similar amount of tax
holiday and investment allowance in current values
would be higher in the case of the latter as it can be
claimed fully in the first assessment year if profits are
available but tax holiday can bs claimed fully not before
the end of the fifth assessment year.
(iii) In the event of insufficient profits generated by the
new investment against which the investment allowance
may be claimed in the year due, it can be adjusted
against profits from earlier investments and from other
plants within the company, in the case of a multi-plant
company. This is not the case with tax holiday. In the
absence of profits from the specific tax holiday generat
ing investment, the relief cannot be utilised. Therefore,
in terms of profits against which the reliefs can be
claimed, investment allowance is more flexible; tax
holiday, in fact, is less beneficial to, and discriminatory
against, new companies.
(iv) In the event of insufficient profits, the unavailed portion
of the investment allowance due, can be carried forward.
There cannot be any carry forward in the case of the
tax holiday. In the absence of profits, the relief cannot
be utilised.
(v) Investment allowance is admissible with reference to
a new qualifying asset falling in the prescribed categor
ies even if it is acquired second-hand, outside the
country. Investment allowance, thus, aims at specifical
ly encouraging the expansion of an existing industry or
replacement of assets which have outlived their utility;
in effect, it bridges, to some extent, the gap between
16 FISCAL INCENTIVES AND CORPORATE TAX SAVING
the original cost of the asset to be replaced and its
increased replacement cost. Tax holiday, on the other
hand, being in the form of a deduction from taxable
profits (and even earlier, before April 1, 1981, when it
was granted upto a percentage of capital employed),
need not wholly reflect or represent additional fixed
assets. Even though both the reliefs are designed to
raise the rate of return, only the investment allowance is
directly related to the level of fixed assets formation.
(vi) Investment allowance is biased in favour of capital-
intensive operations while tax holiday is neutral
between capital-intensive and labour-intensive techni
ques of operations. While the former is linked to a
capital base such as the value of plant and machinery
installed, the latter is linked to profits and gains which
makes it neutral between the use of alternative produc
tion techniques. Even in the case of the earlier method
of granting the tax holiday, the bias towards capital-
intensive techniques may be said to have been less acute
than in the case of the investment allowance, as the
whole of the incremental capital employed might not
be necessarily invested in machineiy and plant,
(vii) The tax benefit to the company and the tax revenue
loss to the national exchequer is limited and known in
advance in the case of the investment allowance. In the
case of tax holiday, its open-ended feature allows an
uncertain tax benefit and the revenue loss is also uncer
tain. This open-ended feature of tax holiday can be
plugged by restricting the tax benefit to some specified
ratio of investment.
(viii) The open-ended feature of tax holiday, however, has a
plus point; it carries the advantage of permitting a
discrimination in favour of growing, efficient and
profit-making companies, as such companies would
stand to gain more; the incentive, thus, in a way, also
penalises inefficiency.
e. Backward area relief. The backward area relief (section
80HH) is granted in the form of a reduction in taxable profits
and gains of an industrial unit or hotel located in a backward
area, as listed in the Eighth Schedule of the Inome-tax Act,
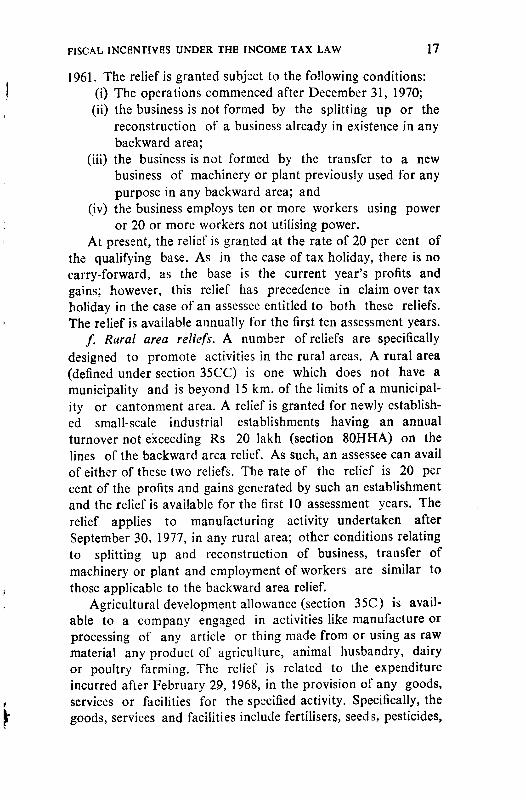
FISCAL INCENTIVES UNDER THE INCOME TAX LAW 17
1961. The relief is granted subject to the following conditions:
(i) The operations commenced after December 31, 1970;
(ii) the business is not formed by the splitting up or the
reconstruction of a business already in existence in any
backward area;
(iii) the business is not formed by the transfer to a new
business of machinery or plant previously used for any
purpose in any backward area; and
(iv) the business employs ten or more workers using power
or 20 or more workers not utilising power.
At present, the relief is granted at the rate of 20 per cent of
the qualifying base. As in the case of tax holiday, there is no
carry-forward, as the base is the current year's profits and
gains; however, this relief has precedence in claim over tax
holiday in the case of an assessee entitled to both these reliefs.
The relief is available annually for the first ten assessment years.
/. Rural area reliefs. A number of reliefs are specifically
designed to promote activities in the rural areas. A rural area
(defined under section 35CC) is one which does not have a
municipality and is beyond 15 km. of the limits of a municipal
ity or cantonment area. A relief is granted for newly establish
ed small-scale industrial establishments having an annual
turnover not exceeding Rs 20 lakh (section 80HHA) on the
lines of the backward area relief. As such, an assessee can avail
of either of these two reliefs. The rate of the relief is 20 per
cent of the profits and gains generated by such an establishment
and the relief is available for the first 10 assessment years. The
relief applies to manufacturing activity undertaken after
September 30, 1977, in any rural area; other conditions relating
to splitting up and reconstruction of business, transfer of
machinery or plant and employment of workers are similar to
those applicable to the backward area relief.
Agricultural development allowance (section 35C) is avail
able to a company engaged in activities like manufacture or
processing of any article or thing made from or using as raw
material any product of agriculture, animal husbandry, dairy
or poultry farming. The relief is related to the expenditure
incurred after February 29, 1968, in the provision of any goods,
services or facilities for the specified activity. Specifically, the
goods, services and facilities include fertilisers, seeds, pesticides,
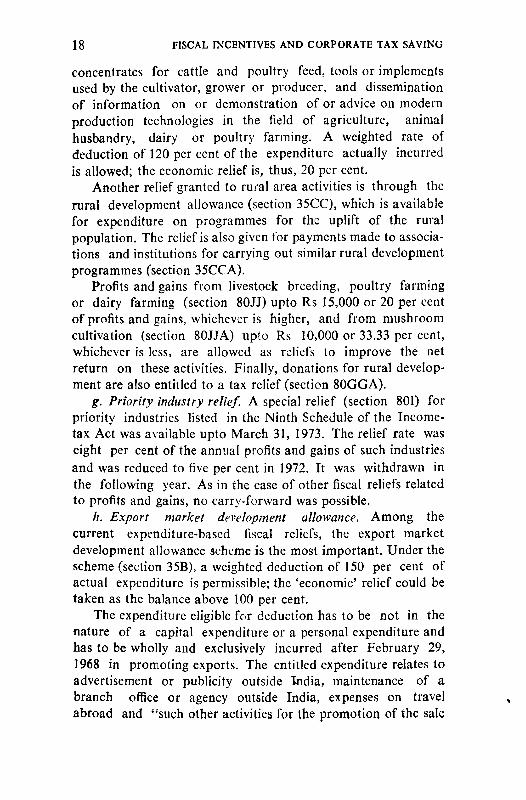
18 FISCAL INCENTIVES AND CORPORATE TAX SAVING
concentrates for cattle and poultry feed, tools or implements
used by the cultivator, grower or producer, and dissemination
of information on or demonstration of or advice on modern
production technologies in the field of agriculture, animal
husbandry, dairy or poultry farming. A weighted rate of
deduction of 120 per cent of the expenditure actually incurred
is allowed; the economic relief is, thus, 20 per cent.
Another relief granted to rural area activities is through the
rural development allowance (section 35CC), which is available
for expenditure on programmes for the uplift of the rural
population. The relief is also given for payments made to associa
tions and institutions for carrying out similar rural development
programmes (section 35CCA).
Profits and gains from livestock breeding, poultry farming
or dairy farming (section 80JJ) upto Rs 15,000 or 20 per cent
of profits and gains, whichever is higher, and from mushroom
cultivation (section 80JJA) upto Rs 10,000 or 33.33 per cent,
whichever is less, are allowed as reliefs to improve the net
return on these activities. Finally, donations for rural develop
ment are also entitled to a tax relief (section 80GGA).
g. Priority industry relief. A special relief (section 801) for
priority industries listed in the Ninth Schedule of the Income-
tax Act was available upto March 31, 1973. The relief rate was
eight per cent of the annual profits and gains of such industries
and was reduced to five per cent in 1972. It was withdrawn in
the following year. As in the case of other fiscal reliefs related
to profits and gains, no carry-forward was possible.
h. Export market development allowance. Among the
current expenditure-based fiscal reliefs, the export market
development allowance scheme is the most important. Under the
scheme (section 35B), a weighted deduction of 150 per cent of
actual expenditure is permissible; the 'economic' relief could be
taken as the balance above 100 per cent.
The expenditure eligible for deduction has to be not in the
nature of a capital expenditure or a personal expenditure and
has to be wholly and exclusively incurred after February 29,
1968 in promoting exports. The entitled expenditure relates to
advertisement or publicity outside India, maintenance of a
branch office or agency outside India, expenses on travel
abroad and "such other activities for the promotion of the sale
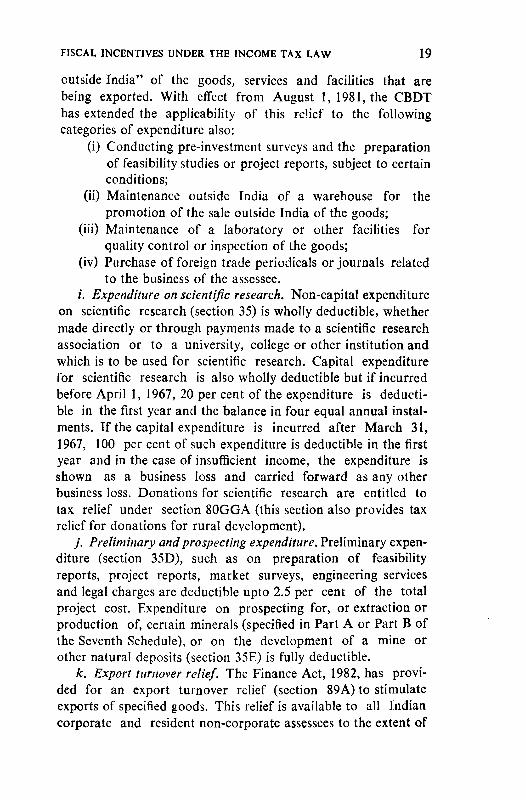
FISCAL INCENTIVES UNDER THE INCOME TAX LAW 19
outside India" of the goods, services and facilities that are
being exported. With effect from August 1, 1981, the CBDT
has extended the applicability of this relief to the following
categories of expenditure also:
(i) Conducting pre-investment surveys and the preparation
of feasibility studies or project reports, subject to certain
conditions;
(ii) Maintenance outside India of a warehouse for the
promotion of the sale outside India of the goods;
(iii) Maintenance of a laboratory or other facilities for
quality control or inspection of the goods;
(iv) Purchase of foreign trade periodicals or journals related
to the business of the assessee.
/. Expenditure on scientific research. Non-capital expenditure
on scientific research (section 35) is wholly deductible, whether
made directly or through payments made to a scientific research
association or to a university, college or other institution and
which is to be used for scientific research. Capital expenditure
for scientific research is also wholly deductible but if incurred
before April 1, 1967, 20 per cent of the expenditure is deducti
ble in the first year and the balance in four equal annual instal
ments. If the capital expenditure is incurred after March 31,
1967, 100 per cent of such expenditure is deductible in the first
year and in the case of insufficient income, the expenditure is
shown as a business loss and carried forward as any other
business loss. Donations for scientific research are entitled to
tax relief under section 80GGA (this section also provides tax
relief for donations for rural development).
j. Preliminary andprospecting expenditure. Preliminary expen
diture (section 35D), such as on preparation of feasibility
reports, project reports, market surveys, engineering services
and legal charges are deductible upto 2.5 per cent of the total
project cost. Expenditure on prospecting for, or extraction or
production of, certain minerals (specified in Part A or Part B of
the Seventh Schedule), or on the development of a mine or
other natural deposits (section 35E) is fully deductible.
k. Export turnover relief. The Finance Act, 1982, has provi
ded for an export turnover relief (section 89A) to stimulate
exports of specified goods. This relief is available to all Indian
corporate and resident non-corporate assessees to the extent of
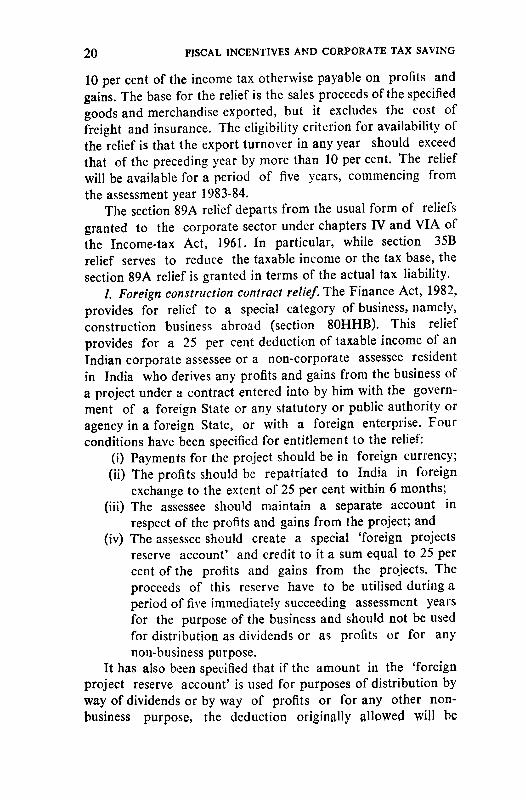
20 FISCAL INCENTIVES AND CORPORATE TAX SAVING
10 per cent of the income tax otherwise payable on profits and
gains. The base for the relief is the sales proceeds of the specified
goods and merchandise exported, but it excludes the cost of
freight and insurance. The eligibility criterion for availability of
the relief is that the export turnover in any year should exceed
that of the preceding year by more than 10 per cent. The relief
will be available for a period of five years, commencing from
the assessment year 1983-84.
The section 89A relief departs from the usual form of reliefs
granted to the corporate sector under chapters IV and VIA of
the Income-tax Act, 1961. In particular, while section 35B
relief serves to reduce the taxable income or the tax base, the
section 89A relief is granted in terms of the actual tax liability.
/. Foreign construction contract relief. The Finance Act, 1982,
provides for relief to a special category of business, namely,
construction business abroad (section 80HHB). This relief
provides for a 25 per cent deduction of taxable income of an
Indian corporate assessee or a non-corporate assessee resident
in India who derives any profits and gains from the business of
a project under a contract entered into by him with the govern
ment of a foreign State or any statutory or public authority or
agency in a foreign State, or with a foreign enterprise. Four
conditions have been specified for entitlement to the relief:
(i) Payments for the project should be in foreign currency;
(ii) The profits should be repatriated to India in foreign
exchange to the extent of 25 per cent within 6 months;
(iii) The assessee should maintain a separate account in
respect of the profits and gains from the project; and
(iv) The assessee should create a special 'foreign projects
reserve account' and credit to it a sum equal to 25 per
cent of the profits and gains from the projects. The
proceeds of this reserve have to be utilised during a
period of five immediately succeeding assessment years
for the purpose of the business and should not be used
for distribution as dividends or as profits or for any
non-business purpose.
It has also been specified that if the amount in the 'foreign
project reserve account' is used for purposes of distribution by
way of dividends or by way of profits or for any other non-
business purpose, the deduction originally allowed will be
FISCAL INCENTIVES UNDER THE INCOME TAX LAW 21
deemed to have been wrongly allowed. Moreover, the income
tax officer will be competent to recompute the total income of
the assessee for the relevant assessment year and to withdraw
the tax benefit granted to the taxpayer within a period of 4
years from the end of the accounting year in which the foreign
projects reserve account was utilised for a non-authorisedpurpose.
m. Other incentives. The other fiscal incentives available to
corporate assessees are deductions in respect of certain inter
corporate dividends (section 80M), royalties, etc., received for
the provision of technical know-how in India (section 80MM),
dividends received from certain foreign companies (section 80N),
royalties, etc., received from certain foreign enterprises (section
80O) and profits and gains from the business of publication of
books (section 80QQ).
III. Data Sources and Methods of
Estimation of Tax Saving Effects
1. Introduction
In order to estimate the effect of fiscal incentives on the tax
liability of companies and also to estimate the tax savings, the
hypothetical tax liability in the absence of the reliefs has to be
first worked out. The hypothetical tax base and the tax liability
would depend upon the incentives available and the incentives
actually utilised. The amount of the reliefs would, in turn,
depend upon the rate at which the fiscal reliefs are granted. In
this study, we examine the effects of three major fiscal incentives
on the basis of ex-ante data and all the available incentives on
the basis of ex-post data.
2. Data
a. Ex-ante project data. The ex-ante data consist of investment
and cash flow information on 88 major investment schemes of
73 projects received, processed and accepted by one of the
leading financial institutions, namely, the Industrial Credit and
Investment Corporation of India Ltd. (hereinafter, called the
1CICI). The data obtained from the appraisal reports are the
institutionally-revised estimates of the promoter's original
estimates of cash flows. The revised estimates, nevertheless, give
an idea of the expectations of the promoter and also of the
experienced financial and technical analysts in the financial
institution. It would have been interesting to have the projec
tions of the gains from the fiscal incentives as made by the
promoter, but these were not available for most of the projects,
as such data are not called for by the financial institution.
The ICICI data relate to investment and the anticipated
flow of income without the fiscal reliefs. These data were used
DATA SOURCES AND METHODS OF ESTIMATION 23
by us to estimate the tax savings arising from investment
allowance, tax holiday (under section 80J, which was operative
when the projects were envisaged and implemented) and back
ward area relief during each of the first eight years of the
operations of the 73 projects. In the case of investment
allowance and tax holiday, we have also estimated the unavailed
or 'lost' relief at the end of the eight-year period. Such an
estimate is not made for the backward area relief as the incen
tive is non-operative in the absence of profits and gains which
constitute the base for the relief.
The ex-ante analysis is restricted to the first eight years of
the operations of the project, as unabsorbed investment allow
ance and unabsorbed tax holiday (in the form it existed during
the study period) could be carried forward upto the end of this
period. Upto the eighth year, there could, therefore, arise some
variation between the total income stream including the fiscal
reliefs and excluding them, as well as in the subsequent tax
liabilities. After the first eight years and upto the end of the
economic life of the project (varying from, say, 10 to 15 years),
there would be no such variation (except, due to the backward
area relief, upto the tenth year) between the income flow with
and without the gains from fiscal incentives.
b. Ex-post assessed income tax data. Ex-post data on each of
the assessed fiscal reliefs, taxable income and tax were made
available mainly by the CBDT and partly by a leading chartered
accountant's firm. The source of the data is the assessed
income tax returns of corporate assessees for seven assess
ment years, 1970-71 to 1976-77. In case an appeal was
pending, the data relate to the stage upto which the Income-
Tax Department had made the assessment. While the CBDT
made available data for 99 corporate assessees, the chartered
accountant's firm provided data for nine corporate assessees.
The CBDT obtained the data through its 'field formation'
offices and the data collection was co-ordinated by its Directorate
of Inspection (Research, Statistics and Publications) in New
Delhi.
The data from the assessed income tax returns were obtain
ed separately for 10 fiscal incentives, namely, investment
allowance, tax holiday, backward area relief, priority industry
relief, export market development allowance, exemption of
24 FISCAL INCENTIVES AND CORPORATE TAX SAVING
specified inter-corporate dividends, exemption of dividends
received from new industrial undertakings, deduction of expen
diture on scientific research, deduction of donations to charit
able institutions and exemption of royalty, commission, fees and
other payments received from abroad. The reliefs due to all
other fiscal incentives are shown together under 'other reliefs'.
Data were also obtained on assessed depreciation, income tax,
surcharge on income tax and on capital gains tax.
c. Ex-post company finances data. The analysis of ex-post
assessed income tax data is supplemented by that of company
finances data on corporate tax provision and corporate profits
before tax (non-assessed). These data relate to a sample of 223
public limited companies (hereinafter, called the NIPFP com
panies) operating in the manufacturing segment of the private
corporate sector. They are for a 15-year period, 1961-62 to
1975-76. The main reason for undertaking this exercise is to
allow a comparative evaluation of the results with those of some
earlier studies, which were based only on such data. It was also
felt that an analysis of the effective tax rates at the disaggrega
ted level for different categories of companies classified accord
ing to their capital-output ratio, age and size (measured in terms
of total assets) might be interesting.
3. Period
The analysis of ex-ante project data relates to the first eight
years of the operation of a project. ICICI projections were
generally available for five years, and in some cases upto seven.
In the case of six projects, the projections were available only
for the first three years of their operations and, in the case of
25 others, for the first four years.
In the case of the projects for which data were not available
for all the years the estimates upto the sixth year were based on
the observed growth rate between the last two years for which
data were available, and the sixth year's estimate was repeated
for the seventh and eighth years, on the assumption that the
project would have reached its 'peak' level by the end of the
sixth year.
On the basis of data for the year when the projects were
approved by the ICICI, it is seen that as many as 54 of the 73
projects were approved between 1972 and 1975. Only six
DATA SOURCES AND METHODS Of ESTIMATION 25
projects were approved later and 13 prior to 1972 (Table A.I).
The analysis of ex-post assessed income tax data relates to
seven assessment years, 1970-71 to 1976-77. In the case of 10
assessees, data were not available for one or two of the inter
vening years and in the case of 35 others, for the first or second
and/or sixth or seventh year; the missing data were estimated
on the basis of the data for the preceding and/or following
years. Thus, for as many as 63 assessees, all data were available
for seven years; for 85 assessees for six years and for 98
assessees for five years. A separate analysis is made for the 63
assessees for whom no data had to be estimated by us for any
of the seven years.
The company finances data for 223 NIPFP companies were
analysed for a 15-year period, 1961-62 to 1975-76; the estima
tions are made on the basis of data on tax provision and profits
before tax. Analysis is also made for a seven-year period,
1969-70 to 1975-76, which period is comparable with that
relating to the assessment and project data.
4. Selection of Samples
a. ICICI projects. The objective was to obtain data on
major projects approved by the ICICI between 1970-71 and
1976-77, which could have, subsequent to their commercial
operations, actually gained from some of the fiscal reliefs. The
projects were selected from among those that ICICI approved
during the period in the light of discussions with several
officials in the appraisal, follow-up and merchant banking
departments of the ICICI as well as with senior managerial
personnel of the ICICI.
b. Income tax assessees. A list of major corporate assessees
was submitted to the Directorate of Inspection, CBDT, with a
request that the relevant data for about 80 per cent of the listed
companies might be made available, assessee-wise. The composi
tion of the list was decided upon on the basis of discussions
with the officials of the Income Tax Department, financial
institutions and industrial companies and with some leading
chartered accountants and tax lawyers. Discussions were held
with several Commissioners of Income Tax in Bombay, Calcutta
and Delhi, and officials in the Directorate of Inspection,
(Research, Statistics and Publications), CBDT. An attempt was
26 FISCAL INCENTIVES AND CORPORATE TAX SAVING
made to include a number of companies for which ex-ante data
had been obtained on some of their projects and to include
assessees who could be expected to have derived some benefit
from the fiscal reliefs in at least some of the assessment years.
The assessees included growing companies, large-sized and
medium-sized companies and companies operating in different
industries and assessed in major centres. The Directorate of
Inspection (Research, Statistics and Publications), CBDT, made
available to us the data from among the listed corporate
assessees without indicating at any stage the identity of the
assessees to whom the data related. The data from the chartered
accountant's firm relate to some of the major clients but again
the identity of the assessee was not disclosed. From earlier
discussions with the senior partner of the firm, it can be said
that the assessees are mainly from Bombay and Ahmedabad
and they are generally engaged in large-scale manufacturing
activities.
c. NIPFP companies. The company finances data relate to
223 companies having a combined paid-up share capital of
Rs 873.2 crore in 1975-76; these companies account for 42.2
per cent of the paid-up capital of all the 7626 non-government
public limited companies (i.e., Rs 2066.8 crore) and 56.8 per
cent of those companies having a paid-up share capital of
Rs 50 lakh or more (i.e., Rs 1537.0 crore). Each sample com
pany had a paid-up share capital of Rs 50 lakh or more in
1975-76. The data, compiled from the Bombay Stock Exchange
Directory, relate to tax provision in the respective financial year
and not assessment year. The company finances data cannot be
presumed to be the data indicated in the income tax returns for
the relevant assessment year, filed subsequently by the assessee.
The company finances data may be expected, a priori, to under
estimate the tax liability, as some of the deductions might not
be allowed at the assessment stage.
5. Classification and Analysis
a. Ex-ante project data. The analysis on the basis of the
ex-ante data on ICICI projects is made at the aggregate level.
b. Ex-post assessed income tax data. The analysis of the
ex-post assessed income tax data is made at the aggregate level
as well as at the disaggregated level for groups of corporate
DATA SOURCES AND METHODS OF ESTIMATION 27
assessees classified according to three criteria, namely, their
location, the capital intensity of operations and the type of
industrial activity.
On the basis of the available information on the centre at
which the assessment was made, the 108 assessees are classified
into six groups, namely, Ahmedabad, Bombay, Calcutta, Delhi
and Madras assessees, with the sixth group including assessees
for whom location data were not available. While centre-wise
revenue data are not published by the Income Tax Department
in their annual publication All India Income Tax Statistics
(AIITS), it is found that the five States in which the five major
centres are located together accounted for 82.1 per cent of the
corporate assessees, 79.6 per cent of the assessed corporate
income and 79.7 per cent of the assessed corporate tax collec
tions during the assessment year 1975-76.
The 108 corporate assessees whose data are studied account
for a substantial proportion of the total assessed corporate
income and tax in the five respective States, even though in
terms of numbers they constitute a small proportion, between
0.7 per cent and 2.7 per cent. While the 22 Bombay assessees
(0.7 per cent of a total of 3183 Maharashtra corporate assessees)
account for 27.1 per cent and 26.3 per cent, respectively, of
the total assessed income and assessed tax of all Maharashtra
assessees, the proportionate contributions of Calcutta assessees
in our sample are 56.5 per cent and 57.8 per cent, respectively,
of the total assessed corporate income and tax of all West
Bengal corporate assessees. In the case of Delhi assessees, the
corresponding proportions are 56.6 per cent and 53.7 per cent,
respectively, in the case of Ahmedabad assessees they are 60.1
per cent and 58.7 per cent, respectively, of corporate assessees in
Gujarat and in the case of Madras, they are as high as 93.7 per
cent and 94.2 per cent, respectively, of corporate assessees in
Tamil Nadu.
Capital intensity is judged on the basis of available data on
assessed depreciation. The assessees are grouped into 'highly
capital-intensive' (average annual assessed depreciation above
Rs 1 crore), 'moderately capital-intensive' (above Rs 50 lakh
and less than Rs 1 crore) and 'less capital-intensive' (below
Rs 50 lakh) assessees.
The industry-wise classification is based on the available
28 FISCAL INCENTIVES AND CORPORATE TAX SAVING
data on the product/activities with which the assessees are
associated. The assessees are classified into five broad industry
groups, namely, 'chemicals', 'engineering', 'textiles', 'diversified',
and 'miscellaneous', including unclassified assessees.
c. Ex-post company finances data. The analysis of ex-post
NIPFP sample company data is made at the aggregate level as
also at disaggregated levels, according to the capital intensity
of the sample companies, their size and age. In the absence of
company finances data on each of the individual fiscal incen
tives, the analysis is restricted to the estimation of the actual
tax base, the effective tax rate and tax savings inclusive of all
the incentives.
Capital intensity is measured by the ratio of total assets to
the value of production (i.e., net sales plus change in stock of
finished goods and work-in-progress). Companies are classified
into those having 'high' capital-intensity or high capital-output
ratio (the ratio exceeding 1:1.50),'moderate' capital-intensity
(between 1:0.75 and 1:1.50) and 'low' capital-intensity (below
1:0.75).
The size of a company is measured in terms of total assets
in 1975-76, the terminal year of the study. Companies are
classified into small companies (less than Rs 15 crore), medium-
size companies (between Rs 15 crore and Rs 30 crore), large
companies (above Rs 30 crore but below Rs 50 crore) and
larger companies (above Rs 50 crore).
The age of a company is determined with reference to the
year of its incorporation as a public limited company under the
Indian Companies Act, 1956. Sample companies are accordingly
classified into old, if incorporated before 1951, and new, if
incorporated between 1956 and 1961.
While the results derived from the aggregate analysis may
be taken to broadly hold good for the corporate sector as a
whole, the findings for the specific groups of companies are
likely to be subject to error, because no attempt has been made
to give proper representation to these groups on the basis of
stratified random sampling.
6. Methodology for Estimation
a. Introduction. While in the case of the income tax assess
ment data, the information on each fiscal relief was available,
DATA SOURCES AND METHODS OF ESTIMATION 29
in the case of the ex-ante project data, the amount of each
selected fiscal relief had to be first computed. In the case of theNIPFP sample companies, data are available for development
rebate and it was possible to only estimate the aggregate
amount of all fiscal reliefs taken together.
b. Ex-ante project data. The estimates of effective tax rates,
fiscal reliefs and tax savings are made project-wise for each of
the first eight years of operation of the 73 projects studied. The
individual years are not identical calendar years but are identical
years with reference to the commencement of the project. Thus,
the data for the first year of the project are those for the first
year of commercial operation of the project. The first year of
project operation was generally between 1973 and 1977.
The ICICI data that are used relate to the capital cost of
the project, including the break-up into four categories of gross
fixed assets (namely, land, buildings, plant and machinery andother assets) and the projected estimates of net worth (paid-up
share capital plus reserves) and operating profits before depreciation for the first five or six years of commercial operations.
All computations were done by us applying the relevant rates
for depreciation, fiscal reliefs and tax to the ICICI data, takingthe order of priority of deductions as stipulated under theincome tax law. This was done because the projected figure of
depreciation in the ICICI appraisal reports was computed usingthe straight-line method which is not acceptable under the
Income-tax Act11.
The depreciation provision for the first year was estimated
on the basis of the data on gross fixed assets expected to be
fully installed in the first year. The depreciation provision for
subsequent years was computed on the value of the net fixed
assets at the beginning of the relevant year. The annualdepreciation provision was computed using the reducing-balance
method (as against the straight-line method used in the apprai
sal report). The estimates of depreciation were computed
11. The ICICI estimates tax liability on the basis of profits, net ofdepreciation computed according to the reducing-balance method,
but these estimates are not presented in the appraisal reports. Thestraight-line method of computing depreciation is preferred for estimat
ing the cash flow, because of its simplicity. There, however, seems to
be no justification for adopting this practice.
30 FISCAL INCENTIVES AND CORPORATE TAX SAVING
separately for each of the components of gross fixed assets atrates specified under the income tax law. While no depreciation
is provided for land, the depreciation rate for building has been
taken at five per cent, for miscellaneous fixed assets at 20 per
cent and for machinery and plants, generally at 10, 15, 20 or 30
per cent, as permissible under the income tax law, depending
upon the broad category of the plant (identified from appraisal
reports and discussion with the ICICI officials). However, as
different plants and machinery within a company are eligible
for depreciation at different rates, the selection of a single rate
for the entire machinery and plant in each company leads to
some degree of under-estimation or over-estimation, depending
upon the exact composition of the machinery and plant.
The data on estimated commercial or business profits before
depreciation were obtained from the appraisal reports. The
profit estimates were derived from the total sales income, net of
cost of selling, maintenance, overheads and other miscellaneous
expenses, and they formed the starting point for our exercises.
Depreciation, as computed by us, is deducted from business
profits to derive the operating profits for the current year. The
order of priority for major deductions, including depreciation,
is as follows in accordance with the provisions of the incometax law:
(i) Current year's depreciation and amortised expenditure
on scientific research (sections 32 and 35).
(ii) Carried forward losses of earlier years (only from
business under certain conditions) [section 72(1)].
(iii) Unabsorbed depreciation and amortised expenditure on
scientific research for earlier years [sections 32(2) and35(4)]
(iv) Unabsorbed development rebate [section 33(2) (ii)].
(v) Current development rebate [section 33(2) (i)].
(vi) Unabsorbed development allowance [section 33A(2) (ii)].
(vii) Current development allowance [section 33A(2) (1)1.(viii) Unabsorbed investment allowance [section 33A(3) (ii)].(ix) Current investment allowance [section 33A(3) (i)].
(x) Unabsorbed capital expenditure on scientific research
[section 35(4)].
(xi) Expenditure on prospecting for certain minerals [sec
tion 35E(4)].
DATA SOURCES AND METHODS OF ESTIMATION 31
"• (xii) Expenditure for promoting family planning [section 36
(xiii) Backward area relief (section 80HH)
(xiv) Deduction in respect of profits from a new industrial
undertaking, ship or hotel [section 801(3)].
We thus see that the deductions under chapter VI A (under
section 80) can be made only if the income after adjustment of
all other allowances, rebates and losses is positive. The amount
that is left after all chapter VI A deductions are made, con
stitutes taxable profits or the actual tax base and the statutory
tax rate is applied to this base to estimate the actual tax
liability. When the amount of fiscal reliefs is added back to the
actual tax base, we get the hypothetical tax base on which the
statutory tax rate would have applied in the absence of the fiscal
reliefs.
In the absence of adequate profits, unavailed investment allow
ance can be carried forward upto the end of eight years; the old
section 80J tax holiday had a similar carry forward provision.Bus-
iness losses can also be carried forward upto the end of eight years
but unabsorbed depreciation can be carried forward indefinitely.
The set-off of the old tax holiday in subsequent years was, how
ever, restricted to profits from the plant in which the incentive-
linked investment was made but such restriction does not apply to
set-off of investment allowance and other permissible deductions.
We have taken as the statutory tax rate for each project the
rate that was in force in the year when the project was appro
ved even though the rate might have changed when the project
went into stream and definitely did change during the eight-year
period. In six of the nine years during the period from 1970-71,
the starting point for the ex-ante data, to 1978-79, when the
project reports were actually studied at the ICICI and data
were compiled, the statutory corporate tax rate for Indian
public limited companies in which the public are substantially
interested was 57.75 per cent, inclusive of the income tax at the
rate of 55 per cent and a surcharge at 5 per cent of the income
tax. The income tax rate of 55 per cent has remained unchang
ed since the starting year of the study period but while there
was no surcharge in 1970-71 and 1971-72, it was introdnced in
1972-73 at the rate of 2.5 percent of the income tax and
increased to 5.0 per cent the following year (Table A.2).
32 FISCAL INCENTIVES AND CORPORATE TAX SAVING
The following computations are made to estimate the tax
savings arising from the fiscal reliefs:
The hypothetical corporate profits tax base, which includes
corporate profits before fiscal reliefs and tax are deducted,
is first worked out. The hypothetical tax base amounts to
operating profits net of brought-forward loss and deprecia
tion. The hypothetical corporate tax liability is derived by
applying the statutory tax rate to the hypothetical tax base.
In other words, the hypothetical tax base is multiplied by
the statutory tax rate. Each of the three fiscal reliefs is
estimated, project-wise, by applying the fiscal relief rate as
under the income tax law when the project was approved
to the projected data on the relevant base, subject to the
availability of profits. The actual corporate tax base is
then estimated by deducting the amount of fiscal reliefs
from the hypothetical corporate tax base and it is this base
which represents the 'taxable profits'. The actual corporate
tax liability is then determined by multiplying the actual
corporate tax base by the statutory corporate tax rate. The
effective corporate tax rate is estimated by dividing the
actual corporate tax liability by the hypothetical corporate
tax base. Corporate tax savings are estimated by deducting
the actual corporate tax liability from the hypothetical
corporate tax liability. Alternatively, these can be
derived by multiplying the amount of fiscal reliefs by the
statutory tax rate. Fiscal reliefs as per cent of the hypotheti
cal tax base are computed to estimate the diminution in the
hypothetical tax base caused by the fiscal reliefs. Tax
savings as per cent of the hypothetical tax liability (which
works out to be the same) indicate the extent of diminution
of tax liability arising from the tax savings.
The estimates of fiscal reliefs and tax savings were first
made for each of the 73 projects, annually, for first eight years
of their operations and then the estimates of the individual
projects for each year were added up to derive the estimates at
the aggregate level for the year concerned. An alternative
method could have been to aggregate the basic data for the 73
projects and then estimate the tax savings for the projects
taken together. The main reason for not adopting the latter
alternative was that the first step in the computational exercises,
DATA SOURCES AND METHODS OF ESTIMATION 33
namely, the estimation of depreciation would have created
problems because of the existence of different rates of deprecia
tion for different categories of plant and machinery. The second
problem in adopting the aggregate-level method of estimation
of tax savings directly arises from the differences between the
statutory tax rates in different years. (We have used the tax
rate in the year in which the project was approved as being
applicable throughout the first eight years of its operations).
Thirdly, the negative profits of some of the projects (in which
ever years these arise) would reduce the profits against which
fiscal reliefs can be claimed by the other projects having positive
profits. And, finally, all the projects were not entitled to claim
all the three fiscal reliefs that were being studied.
c. Ex-post assessed income tax data. The computation of
tax savings generated by fiscal reliefs in the case of assessed
income tax data was simple. The assessment data on individual
fiscal reliefs were added together to arrive at the total assessed
fiscal reliefs, year-wise, for each assessee. The amounts of these
fiscal reliefs were then added to the net assessed income, to
derive the hypotheticar corporate tax base on which the
statutory tax rate would have been applicable in the absence of
the fiscal reliefs. The standard statutory corporate tax rate (actual
tax liability as percent of the assessed income) was applied to the
hypothetical tax base to compute the hypothetical tax liability.
The difference between the hypothetical tax liability and the
actual tax liability shows the amount of tax sav'ngs as a result
of the diminution in the tax base caused by the fiscal reliefs.
Alternatively, the tax savings can be estimated by applying the
standard tax rate to the amount of fiscal reliefs.
The assessed fiscal reliefs and the estimated tax savings
generated by the reliefs for each assessee were added up for
each assessment year to obtain the combined yearly value of
fiscal reliefs and tax savings for the 108 assessees.
b. Ex-post NIPFP company finances data. The company
finances data include those on tax provision, profits before tax,
and development rebate or investment allowance. Profits before
tax may be considered to represent the hypothetical tax base
and fiscal reliefs may be assumed to be implicitly taken into
account when determining the tax provision, as presented in the
profits and loss account statements. Evidence of this implicit
34 FISCAL INCENTIVES AND CORPORATE TAX SAVING
consideration lies in the fact that tax provision as per cent of
profits before tax (called the effective tax rate) is generally lower
than the statutory tax rate. Earlier studies have taken the
difference between the effective lax rate and the statutory tax
rate as the tax savings rate.
The actual tax base was determined by dividing the tax
provision by the statutory tax rate to determine the actual base
from which it is derived. The method of estimating the actual
tax base can be put in the following form:
ATB = ?- x 10°D
where, a = tax provision.
b = statutory tax rate, and
ATB = actual tax base
The statutory tax rates for different years were taken as
applicable, under the income tax law in the respective years,
to Indian public limited companies in whom the public are
substantially interested.
7. Data Limitations
The ex-ante and the ex-post data suffer from a number of
limitations which are now pointed out.
a. Ex-ante project data. Data on possible or expected fiscal
reliefs were not available in the appraisal reports and had to be
computed by us on the basis of the rates on which these reliefs
are available according to the income tax law. The starting
point for the computation of the incentives was the data on
gross fixed assets in the first year and the annual data on net
worth as given in the appraisal reports. To the extent the ICICI
estimates of project costs were subsequently revised or did not
materialise, our estimates of fiscal reliefs would be prone to
error.
The analysis of ex-ante data does not take into account the
changes in the rates of corporate tax during the period 1970-71
to 1976-77, when the ICICI projects were approved. We have
used for each project the statutory tax rate that existed in the
year when the project was approved and the rate might have
changed after the project went into stream. As such, for the
same year, different statutory tax rates were used for different
projects, the statutory tax rates ranging between 55.0 per cent
DATA SOURCES AND METHODS OF ESTIMATION 35
and 57.75 per cent. Further, it was assumed that all the projects
would be liable to the statutory tax rate as applicable to Indian
companies in which the public are substantially interested. As
such, the estimation of corporate tax savings could be inaccu
rate if the companies were actually subject to different statutory
tax rates.
Another limitation stems from the use of a common rate of
depreciation for the machinery and plant project-wise, for it is
likely that a project may have different types of machinery and
plant which would be, according to the income tax law, entitled
to depreciation at different rates.
Finally, in the case of tax holiday, the estimates of both the
entitlement and the relief are on the higher side. The over-
estimation is caused by our use of estimates of total profits of
the company (including probably those generated from earlier
investments in the same plant as well as in other plants of the
company) as the base for computing the fiscal reliefs. While
such a base for the computation of fiscal reliefs provides a
proper estimate of investment allowance, which can be claimed
from profits generated by earlier investments also and which
gets priority over other fiscal reliefs, the appropriate profits
base for computing tax holiday would have been the profits
generated by the new investment. To arrive at such an estimate
of profits, project-wise break-up of income and expenditure
would be required. Some idea about the extent of over-estima
tion of tax holiday on this ground is obtained from a compari
son of the proportions of tax holiday that can be claimed from
the tax holiday entitlement at the aggregate level and at the
disaggregated level for new industrial undertakings. Some
degree of over-estimation in the case of the tax holiday entitle
ment and claim arises also because of our treating all the
investment schemes studied as being eligible for the relief on the
assumption that each of the investment projects would be
treated by the tax authorities as a new unit. To the extent some
of the projects relating to substantial expansion, diversification
and modernisation may not be so treated under the income tax
law, the estimates would be on the higher side.
b. Ex-post assessed income tax data. The statutory tax rate
(called by us, the standard statutory tax rate, which is the
assessed tax as per cent of the assessed income) for the com-
36 FISCAL INCENTIVES AND CORPORATE TAX SAVING
putation of tax savings generated by the fiscal reliefs is different
from what might have been applicable in individual assessments.
This is due to the fact that the identity of the assessee was not
known to us to enable us to use the appropriate statutory tax
rate; therefore estimated averages were used.
In the case of expenditure type of fiscal reliefs, the 'econo
mic relief could be taken to be the difference between what would
have been ordinarily allowed and what is specifically allowed.
This is true of the weighted deductions like the export market
development allowance and the agricultural development allow
ance; only the eligible expenditure above the normal 100 per
cent (i.e., 50 per cent or 20 per cent) could be regarded as tax
relief. In the case of income-type fiscal reliefs, like inter-corpo
rate dividends and the dividends from priority industries, the
full amount of dividends would be taken as the relief.
The estimates of tax savings might be on the lower side for
assessments on which there are some appeals pending before
various appellate authorities, such as the Income-tax Appellate
Tribunal, the High Courts and the Supreme Court, as some of
the pending appeals might go in favour of the assessees.
c. Ex-post company finances data. The main limitation arises
from the use of the statutory tax rate as applicable to Indian
companies, in which the public are substantially interested, even
though some of the sample companies might be liable to
different statutory tax rates. The estimation of fiscal reliefs is
also made only at the aggregate level for all reliefs and, that
too, indirectly.
The NIPFP data are also subject to the usual limitations
applicable to any study based on aggregation of data contained
in the annual reports of the companies, namely, problems
arising from a change in the accounting years, the changes in
currency values and also from amalgamations of companies
within the study period.
d. Classifications. The classification of corporate assessees
has some limitations. The purpose of the classification was to
study at the disaggregated level whether there were any marked
differences in the tax base diminution and in tax savings
for corporate assessees having different characteristics.
Depreciation as the measure of capital intensity for the ex-post
assessed income-tax data has been used in the absence of a

DATA SOURCES AND METHODS OF ESTIMATION 37
superior alternative measure. The use of this measure suffers
from the limitation that depreciation is dependent upon the age
of the plant and equipment, apart from the value of the capital
assets.
The classification of ex-post company finances data, size-
wise and age-wise, is for facilitating comparisons among the
sample companies and does not represent, in the global context,
what the terms 'large', 'small', 'old' and 'new', generally
connote.
IV. The Fiscal Incentive Impact:
Analysis of Ex-ante Project Data
1. Sample of Projects
The analysis of ex-ante data relates to 73 ICICI-financed
projects (hereinafter called ICICI projects) covering 88 invest
ment schemes. As much as 38.6 per cent of the invest
ment schemes represented substantial expansion of existing
undertakings, 22.7 per cent were for setting up new units by
existing undertakings, 20.5 per cent for setting up new industrial
undertakings and the remaining schemes were for diversification
(10.2 per cent) or modernisation programmes (8.0 per cent) of
existing undertakings. The bulk of the ICICI projects were
proposed to be located in non-backward areas (70.5 per cent).
(Table A.3).
Industry-wise, the distribution of investment schemes, in
terms of numbers, is representative of the situation in the private
corporate sector. Chemicals, inclusive of fertilisers, form the
most important industry group for schemes both in backward
and non-backward areas with 28 of the 88 schemes being in this
line. There are, among the selected projects, 18 schemes for the
manufacture of machinery and 12 for iron and steel products.
Other ICICI projects were ventures in textiles, tyres and tubes,
paper and paper products, cement, food and finished leather.
2. Fiscal Reliefs, Tax Savings and Diminution in Tax Base
a. Overall results. The 73 ICICI projects are estimated to
receive by way of the three fiscal reliefs studied an amount of
Rs 464.4 crore during the first eight years of their operations.
The tax savings generated by these reliefs would amount to
Rs 266.7 crore and represent 38.5 per cent of the total envisaged
project cost of Rs 692.0 crore in current values. In discounted
ANALYSIS OF PROJECT DATA 39
present values,12 the lax savings would amount to Rs 187.86
crore, forming 27.1 per cent of the total project cost (Table
1V.1).The three fiscal reliefs would together, in effect, reduce the
tax base of the 73 projects during the first eight years of their
operations by 24.2 per cent. The tax savings, similarly, would
reduce to the same extent the hypothetical tax liability that
would have arisen in the absence of the fiscal reliefs. In other
words, the actual corporate tax base would be reduced to 75.8
per cent of the hypothetical tax base. The effect of the diminu
tion in the tax base is reflected in the effective tax rate which
would be 43.5 per cent as compared to the average annual statutory
tax rate of 57.4 per cent that was applicable to public limited
companies in which the public are substantially interested during
the study period.
Among the three fiscal reliefs studied, the most important,
in terms of its share of the total reliefs, would be tax holiday
(amounting to 63.8 per cent of the total of the three reliefs).
The investment allowance would be the second important relief
(23.5 per cent), followed by backward area relief (12.7 per cent).
The high proportionate contribution of tax holiday arises
from our assumption that all the 73 projects whose data were
studied are eligible to claim tax holiday and investment allow
ance. Such an assumption results in the estimates of tax holiday
being on the higher side, as all the projects may not be entitled
to the relief.13
The aggregate-level analysis of the relative importance of
12. The rate of discount used being 10 per cent.
13. Various criteria have been identified on the basis of court decisions as
being necessary to be met for determining the eligibility of a new invest
ment for this relief. These include investment of fresh capital, employ
ment of the required number of workers, manufacture of items not
listed in the Seventh Schedule, earning of profits that is distinctly
attributable to the new undertakings and distinct and separate identity
of the new unit, say, through maintenance of separate books of
accounts. As such, even diversification and modernisation programmes
were eligible to claim the relief. For details see, 107 ITR 195 (Textile
Machinery Corporation Ltd. v. CIT (1977), 108 ITR 367 (C1T v. Indian
Aluminium Co. Ltd.) (1977), 107 ITR 164 (CIT v. Hindustan Motors
Ltd.) (1977), 94 ITR 73 (CIT v. Orient Paper Mills) (1974) and 92 ITR
173 (CIT v. Ganga Sugar Corporation Ltd.) (1973).
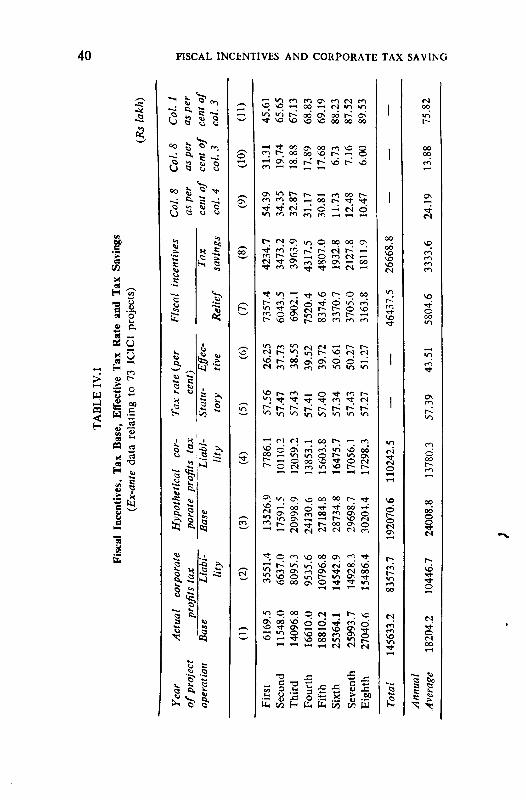
40 FISCAL INCENTIVES AND CORPORATE TAX SAVING
1/1
X
H
OS 'c?
o.
U
if
03 «
8 I
r« s 5 olj 3 y 2
S -i
S
11
•2 -~
<*3
>^ c> o1
00 00 NO f~-vo O
^* on oo r~ r*~ vo r~-
r^ 1^- VO ^
r-' o6 g; on o o —'
N N rt 00 ^ H
—■ o oo « ^ OO(Niovor
ir> on vo oq oo
-' M O * ^
•o js
■is 8 2 o 5 .B ^ -5Ptl^ W h^ fc fe V3 W W
vorr
oCO
ANALYSIS OF PROJECT DATA 41
the three fiscal reliefs conceals the role of the backward area
relief, which would be claimed by about one-fourth of the ICICI
projects whose data were studied. An analysis of only backward
area projects, which is more appropriate to assess the impor
tance of this relief, brings out a somewhat different picture, the
contribution of the relief going up substantially, as is seen later
in this chapter (sub-section 4c).
The tax base diminution effect of investment allowance
(assuming it was the only relief in operation) for the 73 ICICI
projects taken together is expected to be 5.7 per cent and the
effective tax rate would be 51.8 per cent instead of 57.75 per
cent in its absence. The tax base diminution effect of tax holiday
is estimated to be 15.4 per cent and the effective tax rate would
be 46.4 per cent.
b. Annual trends. Estimated annual data on tax savings and
effective tax rates point to a clear trend. There are three
distinct phases: the impact of fiscal reliefs is most pronounced
in the first year of operations, it is substantial yet gradually
declining during the next four years and is moderate during
the sixth to eighth year.
The diminution in the hypothetical tax base (and also in tax
liability) due to the three fiscal reliefs is as much as 54.4 per
cent in the first year of operations, the actual corporate tax
base being 45.6 per cent of the hypothetical tax base. The
extent of diminution in the tax base decreases thereafter. The
tax base diminution is 34.4 per cent in the second year and
gradually falls to 30.8 per cent by the end of the fifth year of
operations. The diminution in the tax base is substantially
lower from the sixth to the eighth year.
This trend in the extent of diminution in the tax base is
reflected in the effective tax rates as well as other indicators of
the tax-saving effect of the fiscal reliefs, such as the proportion
of tax savings to the hypothetical tax base and to the hypotheti
cal tax liability and that of the actual tax base to the hypothetical tax base.
The ICICI projects have, on the average, an effective tax
rate of 26.3 per cent in the first year of the operations, a result
of the substantial tax savings through utilisation of availablefiscal reliefs. The effective tax rate rises to 37.7 per cent in the
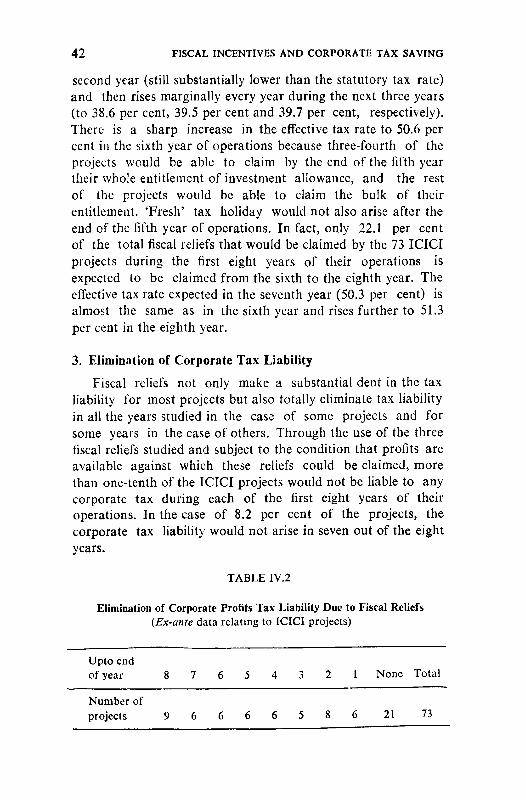
42 FISCAL INCENTIVES AND CORPORATE TAX SAVING
second year (still substantially lower than the statutory tax rate)
and then rises marginally every year during the next three years
(to 38.6 per cent, 39.5 per cent and 39.7 per cent, respectively).
There is a sharp increase in the effective tax rate to 50.6 per
cent in the sixth year of operations because three-fourth of the
projects would be able to claim by the end of the fifth year
their whole entitlement of investment allowance, and the rest
of the projects would be able to claim the bulk of their
entitlement. 'Fresh' tax holiday would not also arise after the
end of the fifth year of operations. In fact, only 22.1 per cent
of the total fiscal reliefs that would be claimed by the 73 ICICI
projects during the first eight years of their operations is
expected to be claimed from the sixth to the eighth year. The
effective tax rate expected in the seventh year (50.3 per cent) is
almost the same as in the sixth year and rises further to 51.3
per cent in the eighth year.
3. Elimination of Corporate Tax Liability
Fiscal reliefs not only make a substantial dent in the tax
liability for most projects but also totally eliminate tax liability
in all the years studied in the case of some projects and for
some years in the case of others. Through the use of the three
fiscal reliefs studied and subject to the condition that profits are
available against which these reliefs could be claimed, more
than one-tenth of the ICICI projects would not be liable to any
corporate tax during each of the first eight years of their
operations. In the case of 8.2 per cent of the projects, the
corporate tax liability would not arise in seven out of the eight
years.
TABLE IV.2
Elimination of Corporate Profits Tax Liability Due to Fiscal Reliefs
{Ex-ante data relating to ICICI projects)
Upto end
of year i
Number of
projects S
! 7
) 6
6
6
5
6
4
6
3
5
2
8
1
6
None
21
Total
73
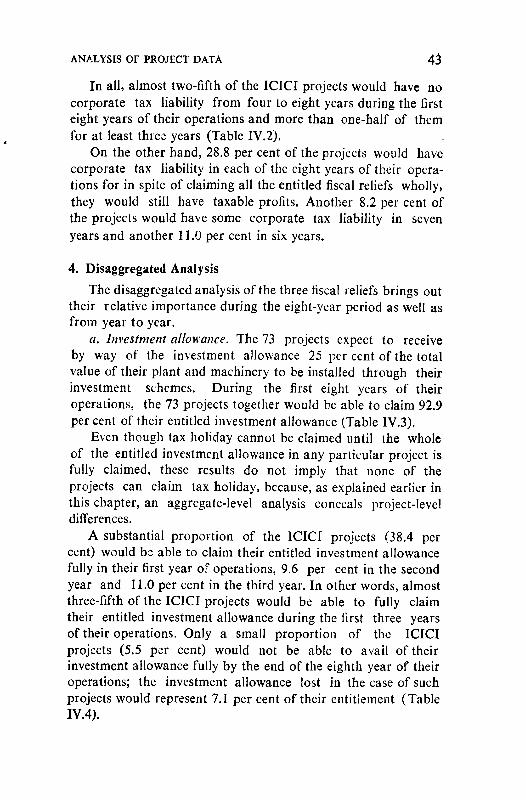
ANALYSIS OF PROJECT DATA 43
In all, almost two-fifth of the ICICI projects would have no
corporate tax liability from four to eight years during the first
eight years of their operations and more than one-half of them
for at least three years (Table IV.2).
On the other hand, 28.8 per cent of the projects would have
corporate tax liability in each of the eight years of their opera
tions for in spite of claiming all the entitled fiscal reliefs wholly,
they would still have taxable profits. Another 8.2 per cent of
the projects would have some corporate tax liability in seven
years and another 11.0 per cent in six years.
4. Disaggregated Analysis
The disaggregated analysis of the three fiscal reliefs brings out
their relative importance during the eight-year period as well as
from year to year.
a. Investment allowance. The 73 projects expect to receive
by way of the investment allowance 25 per cent of the total
value of their plant and machinery to be installed through their
investment schemes. During the first eight years of their
operations, the 73 projects together would be able to claim 92.9
per cent of their entitled investment allowance (Table 1V.3).
Even though tax holiday cannot be claimed until the whole
of the entitled investment allowance in any particular project is
fully claimed, these results do not imply that none of the
projects can claim tax holiday, because, as explained earlier in
this chapter, an aggregate-level analysis conceals project-level
differences.
A substantial proportion of the ICICI projects (38.4 per
cent) would be able to claim their entitled investment allowance
fully in their first year of operations, 9.6 per cent in the second
year and 11.0 per cent in the third year. In other words, almost
three-fifth of the ICICI projects would be able to fully claim
their entitled investment allowance during the first three years
of their operations. Only a small proportion of the ICICI
projects (5.5 per cent) would not be able to avail of their
investment allowance fully by the end of the eighth year of their
operations; the investment allowance lost in the case of such
projects would represent 7.1 per cent of their entitlement (Table
IV.4).
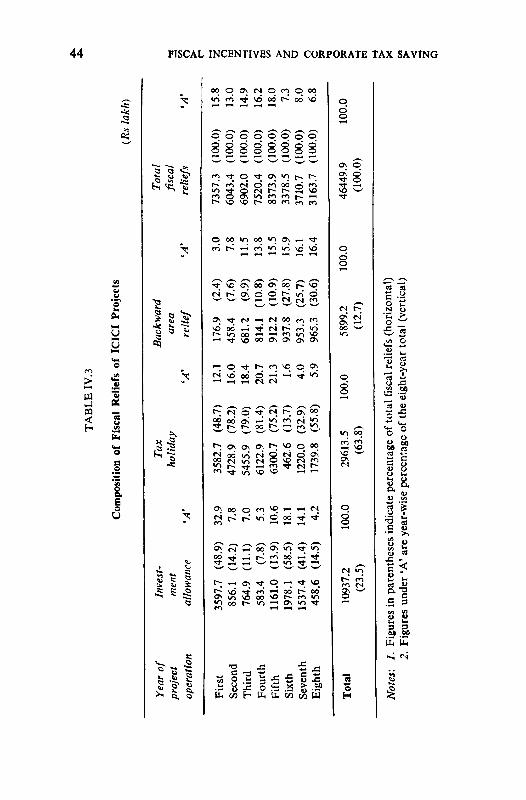
TABLE
IV.3
Composition
of
Fiscal
Reliefs
ofICICI
Projects
(Rslakh)
Yearof
project
operation
First
Second
Third
Fourth
Fifth
Sixth
Seventh
Eighth
Total
Notes:
1. 2.
Invest
ment
allowance
3597.7
(48.9)
856.1
(14.2)
764.9
(11.1)
583.4
(7.8)
1161.0
(13.9)
1978.1
(58.5)
1537.4
(41.4)
458.6
(14.5)
10937.2
(23.5)
'A'
32.9
7.8
7.0
5.3
10.6
18.1
14.1
4.2
100.0
Tax
holiday
3582.7
(48.7)
4728.9
(78.2)
5455.9
(79.0)
6122.9
(81.4)
6300.7
(75.2)
4626
(13.7)
1220.0
(32.9)
1739.8
(55.8)
29613.5
(63.8)
'A'
12.1
16.0
18.4
20.7
21.3
1.6
4.0
5.9
100.0
Backward
area
relief
176.9
(2.4)
458.4
(7.6)
681.2
(9.9)
814.1
(10.8)
912.2
(10.9)
937.8
(27.8)
953.3
(25.7)
965.3
(30.6)
5899.2
(12.7)
Figuresin
parenthesesindicatepercentageofto
tal
fiscal
reliefs(horizontal)
Figuresunder'A'areyear-wisepercentageoftheeight-yeartotal(v
erti
cal)
'A1 3.0
7.8
11.5
13.8
15.5
15.9
16.1
16.4
100.0
Total
fiscal
reliefs
7357.3
(100.0)
6043.4
(100.0)
6902.0
(100.0)
7520.4
(100.0)
8373.9
(100.0)
3378.5
(100.0)
3710.7
(100.0)
3163.7
(100.0)
46449.9
(100.0)
M'
15.8
13.0
14.9
16.2
18.0
7.3
8.0
6.8
100.0
2 O z yJ
ta
-?4*
H < t/3
|^.
z D % O 5s
»w
(^
H W > SAVING
ANALYSIS OF PROJECT DATA 45
TABLE IV.4
Timing of Claim of Full Entitlement of Investment Allowance and
Tax Holiday by ICICI Projects
(Number of projects)
Year of project
operation
First
Second
Third
Fourth ")
Fifth |
sixth y
Seventh |
Eighth J
Relief lost
Investment
allowance
28
7
8
262
4(8.41)3
Tax holiday
NAi
NA
NA
NA
46
6
4
7
10(23.94) 3
Notes: 1. NA: Not applicable as tax holiday is annually available for five
years and so the full entitlement can be claimed earliest
in the fifth year.
2. From the fourth to the eighth year.
3. Amount of relief (in parentheses) in Rs crore. The relief is lost
if there is inadequacy of profits.
The investment allowance, because its claim is to be met
fully before that of the other two fiscal reliefs, becomes the
most important fiscal relief in the first year of operations. As
long as profits are available, the entitled investment allowance
is claimed, partly or fully, depending on the level of profits, and
only thereafter the available profits can be used to meet the
claim of backward area relief (if applicable) and of tax holiday.
As such, at the aggregate level, almost one-third of the toial
investment allowance expected to be claimed by the ICICI
projects during the first eight years of their operations is expec
ted to be claimed in the first year itself. Also, in the first year,
investment allowance would be the most important fiscal relief
(accounting for 48.9 per cent of the total of the three fiscal
reliefs in that year). In the following four years, tax holiday would
be the most important, accounting for between 75.2 per cent and
81.4 per cent of the total fiscal reliefs that can be claimed by
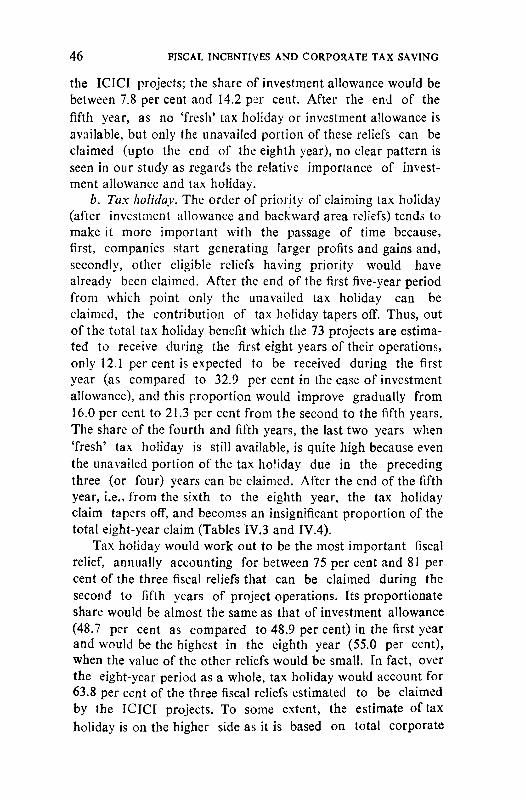
46 FISCAL INCENTIVES AND CORPORATE TAX SAVING
the ICICI projects; the share of investment allowance would be
between 7.8 per cent and 14.2 per cent. After the end of the
fifth year, as no 'fresh' tax holiday or investment allowance is
available, but only the unavailed portion of these reliefs can be
claimed (upto the end of the eighth year), no clear pattern is
seen in our study as regards the relative importance of invest
ment allowance and tax holiday.
b. Tax holiday. The order of priority of claiming tax holiday
(after investment allowance and backward area reliefs) tends to
make it more important with the passage of time because,
first, companies start generating larger profits and gains and,
secondly, other eligible reliefs having priority would have
already been claimed. After the end of the first five-year period
from which point only the unavailed tax holiday can be
claimed, the contribution of tax holiday tapers off. Thus, out
of the total tax holiday benefit which the 73 projects are estima
ted to receive during the first eight years of their operations,
only 12.1 per cent is expected to be received during the first
year (as compared to 32.9 per cent in the case of investment
allowance), and this proportion would improve gradually from
16.0 per cent to 21.3 per cent from the second to the fifth years.
The share of the fourth and fifth years, the last two years when
'fresh' tax holiday is still available, is quite high because even
the unavailed portion of the tax holiday due in the preceding
three (or four) years can be claimed. After the end of the fifth
year, i.e., from the sixth to the eighth year, the tax holiday
claim tapers off, and becomes an insignificant proportion of the
total eight-year claim (Tables IV.3 and IV.4).
Tax holiday would work out to be the most important fiscal
relief, annually accounting for between 75 per cent and 81 per
cent of the three fiscal reliefs that can be claimed during the
second to fifth years of project operations. Its proportionate
share would be almost the same as that of investment allowance
(48.7 per cent as compared to 48.9 per cent) in the first year
and would be the highest in the eighth year (55.0 per cent),
when the value of the other reliefs would be small. In fact, over
the eight-year period as a whole, tax holiday would account for
63.8 per cent of the three fiscal reliefs estimated to be claimed
by the ICICI projects. To some extent, the estimate of tax
holiday is on the higher side as it is based on total corporate
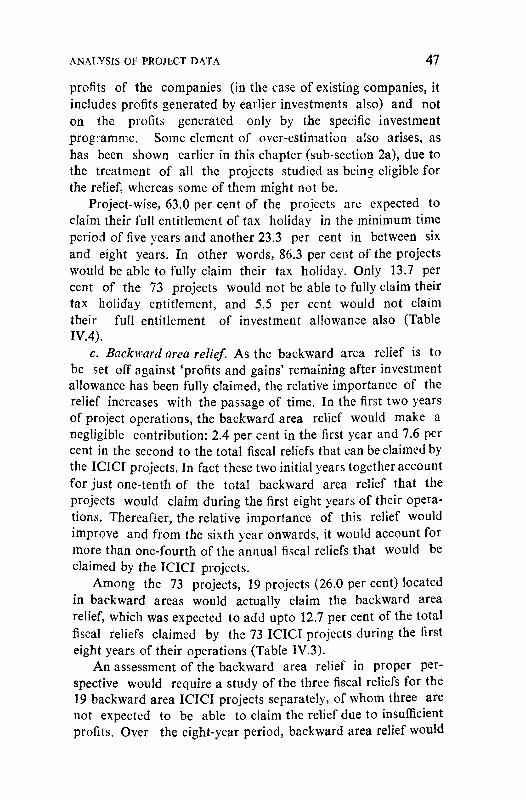
ANALYSIS OF PROJECT DATA 47
profits of the companies (in the case of existing companies, it
includes profits generated by earlier investments also) and not
on the profits generated only by the specific investment
programme. Some element of over-estimation also arises, as
has been shown earlier in this chapter (sub-section 2a), due to
the treatment of all the projects studied as being eligible for
the relief, whereas some of them might not be.
Project-wise, 63.0 per cent of the projects are expected to
claim their full entitlement of tax holiday in the minimum time
period of five years and another 23.3 per cent in between six
and eight years. In other words, 86.3 per cent of the projects
would be able to fully claim their tax holiday. Only 13.7 per
cent of the 73 projects would not be able to fully claim their
tax holiday entitlement, and 5.5 per cent would not claim
their full entitlement of investment allowance also (Table
IV.4).
c. Backward area relief. As the backward area relief is to
be set off against 'profits and gains' remaining after investment
allowance has been fully claimed, the relative importance of the
relief increases with the passage of time. In the first two years
of project operations, the backward area relief would make a
negligible contribution: 2.4 per cent in the first year and 7.6 per
cent in the second to the total fiscal reliefs that can be claimed by
the ICICI projects. In fact these two initial years together account
for just one-tenth of the total backward area relief that the
projects would claim during the first eight years of their opera
tions. Thereafter, the relative importance of this relief would
improve and from the sixth year onwards, it would account for
more than one-fourth of the annual fiscal reliefs that would be
claimed by the ICICI projects.
Among the 73 projects, 19 projects (26.0 per cent) located
in backward areas would actually claim the backward area
relief, which was expected to add upto 12.7 per cent of the total
fiscal reliefs claimed by the 73 ICICI projects during the first
eight years of their operations (Table IV.3).
An assessment of the backward area relief in proper per
spective would require a study of the three fiscal reliefs for the
19 backward area ICICI projects separately, of whom three are
not expected to be able to claim the relief due to insufficient
profits. Over the eight-year period, backward area relief would
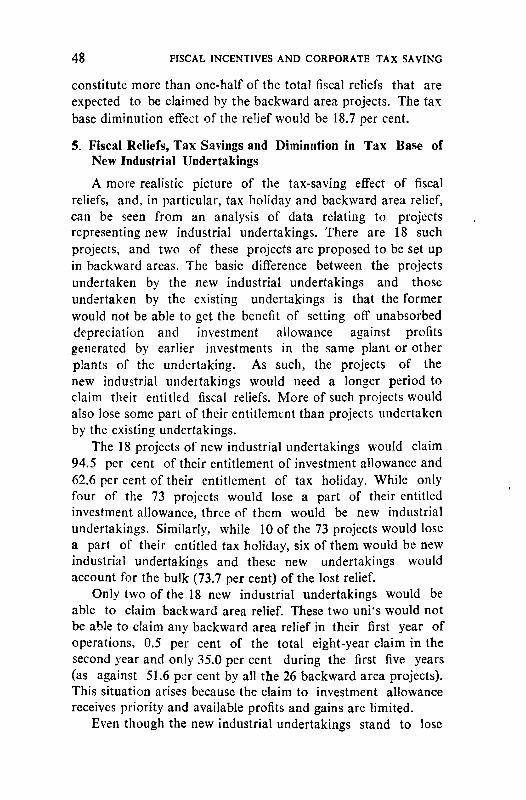
48 FISCAL INCENTIVES AND CORPORATE TAX SAVING
constitute more than one-half of the total fiscal reliefs that are
expected to be claimed by the backward area projects. The tax
base diminution effect of the relief would be 18.7 per cent.
5. Fiscal Reliefs, Tax Savings and Diminution in Tax Base of
New Industrial Undertakings
A more realistic picture of the tax-saving effect of fiscal
reliefs, and, in particular, tax holiday and backward area relief,
can be seen from an analysis of data relating to projects
representing new industrial undertakings. There are 18 such
projects, and two of these projects are proposed to be set up
in backward areas. The basic difference between the projects
undertaken by the new industrial undertakings and those
undertaken by the existing undertakings is that the former
would not be able to get the benefit of setting off unabsorbed
depreciation and investment allowance against profits
generated by earlier investments in the same plant or other
plants of the undertaking. As such, the projects of the
new industrial undertakings would need a longer period to
claim their entitled fiscal reliefs. More of such projects would
also lose some part of their entitlement than projects undertaken
by the existing undertakings.
The 18 projects of new industrial undertakings would claim
94.5 per cent of their entitlement of investment allowance and
62.6 per cent of their entitlement of tax holiday. While only
four of the 73 projects would lose a part of their entitled
investment allowance, three of them would be new industrial
undertakings. Similarly, while 10 of the 73 projects would lose
a part of their entitled tax holiday, six of them would be new
industrial undertakings and these new undertakings would
account for the bulk (73.7 per cent) of the lost relief.
Only two of the 18 new industrial undertakings would be
able to claim backward area relief. These two uni!s would not
be able to claim any backward area relief in their first year of
operations, 0.5 per cent of the total eight-year claim in the
second year and only 35.0 per cent during the first five years
(as against 51.6 per cent by all the 26 backward area projects).
This situation arises because the claim to investment allowance
receives priority and available profits and gains are limited.
Even though the new industrial undertakings stand to lose
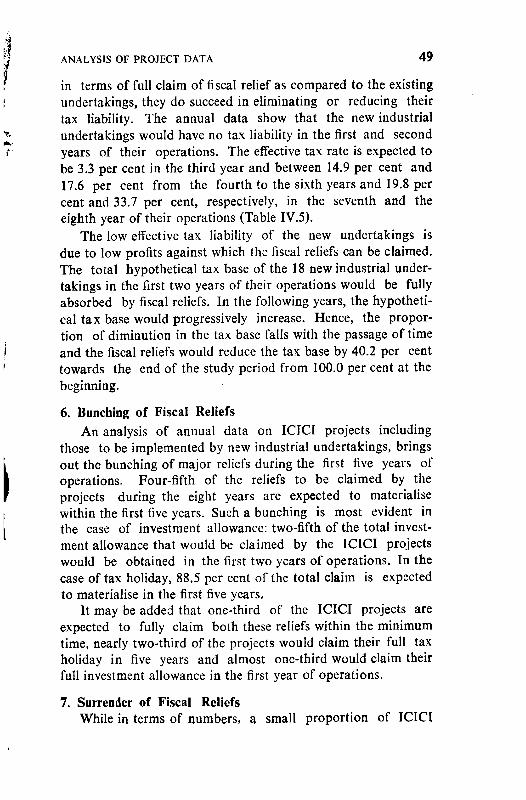
ANALYSIS OF PROJECT DATA 49
in terms of full claim of fiscal relief as compared to the existing
undertakings, they do succeed in eliminating or reducing their
tax liability. The annual data show that the new industrial
undertakings would have no tax liability in the first and second
years of their operations. The effective tax rate is expected to
be 3.3 per cent in the third year and between 14.9 per cent and
17.6 per cent from the fourth to the sixth years and 19.8 per
cent and 33.7 per cent, respectively, in the seventh and the
eighth year of their operations (Table IV.5).
The low effective tax liability of the new undertakings is
due to low profits against which the fiscal reliefs can be claimed.
The total hypothetical tax base of the 18 new industrial under
takings in the first two years of their operations would be fully
absorbed by fiscal reliefs. In the following years, the hypotheti
cal tax base would progressively increase. Hence, the propor
tion of diminution in the tax base falls with the passage of time
and the fiscal reliefs would reduce the tax base by 40.2 per cent
towards the end of the study period from 100.0 per cent at the
beginning.
6. Bunching of Fiscal Reliefs
An analysis of annual data on ICICI projects including
those to be implemented by new industrial undertakings, brings
out the bunching of major reliefs during the first five years of
operations. Four-fifth of the reliefs to be claimed by the
projects during the eight years are expected to materialise
within the first five years. Such a bunching is most evident in
the case of investment allowance: two-fifth of the total invest
ment allowance that would be claimed by the ICICI projects
would be obtained in the first two years of operations. In the
case of tax holiday, 88.5 per cent of the total claim is expected
to materialise in the first five years.
It may be added that one-third of the ICICI projects are
expected to fully claim both these reliefs within the minimum
time, nearly two-third of the projects would claim their full tax
holiday in five years and almost one-third would claim their
full investment allowance in the first year of operations.
7. Surrender of Fiscal Reliefs
While in terms of numbers, a small proportion of ICICI
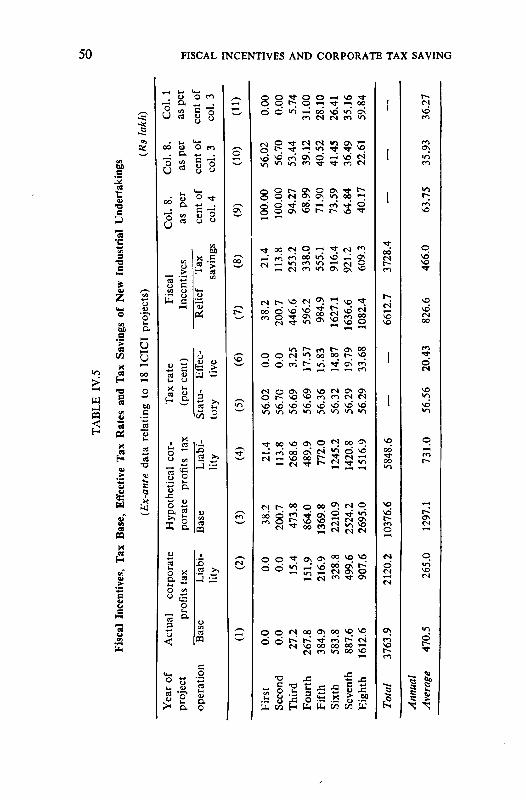
TABLE
IV.5
Fisc
alIncentives,Tax
Base,
EflFective
Tax
Rates
andTax
Savings
ofNew
Indu
stri
alUndertakings
(Ex-ante
data
relating
to
18ICICI
projects)
lakh)
Yearof
Actual
corporate
Hypothetical
cor-
project
operation
profitstax
porate
profits
tax
Base
Liabi
lity
Base
Liabi
lity
Tax
rate
(percent)
Statu-
Effec-
tory
tive
Fiscal
Incentives
Relief
Tax"
savings
Col.
8.Col.
8.Col.
1
as
per
asper
asper
centof
centof
centof
col.
4co
l.3
col.
3
(1)
(2)
(3)
(4)
(5)
(6)
(7)
(8)
(9)
(10)
(ID
First
Second
Third
Fourth
Fifth
Sixth
Seventh
Eighth
0.0
0,0
27.2
267.8
384.9
583.8
887.6
1612.6
0.0
0.0
15.4
151.9
216.9
328.8
499.6
907.6
38.2
200.7
473.8
864.0
1369.8
2210.9
2524.2
2695.0
21.4
113.8
268.6
489.9
772.0
1245.2
1420.8
1516.9
56.02
0.0
56.7C
0.0
56.69
56.69
56.36
56.32
56.29
56.29
3.25
17.57
15.83
14.87
19.79
33.68
38.2
200.7
446.6
596.2
984.9
1627.1
1636.6
1082.4
21.4
113.8
253.2
338.0
555.1
916.4
921.2
609.3
100.00
56.02
0.00
100.00
94.27
68.99
71.90
73.59
64.84
56.70
53.44
39.12
40.52
41.45
36.49
0.00
5.74
31.00
28.10
26.41
35.16
m in
> Z a o o o
40.17
22.61
59.84
Total
3763.9
2120.2
10376.6
5848.6
——
6612.7
3728.4
Annual
Average
470.5
265.0
1297.1
731.0
56.56
20.43
826.6
466.0
63.75
35.93
36.27
ANALYSIS OF PROJECT DATA 51
projects would not be able to fully claim their investment
allowance and tax holiday (5.5 per cent and 13.7 per cent,
respectively), in terms of their actual loss with respect to their
entitlement, the proportion would be substantial. Four ICICI
projects would lose 32.2 per cent of their entitlement of invest
ment allowance, the loss for individual projects ranging from
15.7 per cent to 69.2 per cent. Similarly, 10 ICICI projects
would lose 80.7 per cent of their entitlement of tax holiday, the
project-wise loss being 100.0 per cent in the case of the four
projects which would also lose some proportion of their
entitled investment allowance and from 46.2 per cent to 94.2
per cent in the case of the other six projects.
The inability to benefit from the fiscal reliefs is more clearly
brought out in the analysis of new industrial undertakings, for
in their case profits generated by earlier investments are not
available for set-off. It is, therefore, seen that six of the
10 tax holiday-losing projects are those of new industrial
undertakings and these units would account for almost three-
fourth of the total tax holiday loss. Similarly, three of the four
investment allowance-losing projects would be those undertaken
by new companies and they would account for 70.3 per cent of
the total loss of investment allowance by the ICICI projects,
whose data were studied.
In the case of projects of the new industrial undertakings,
many of the fiscal incentives are, thus, in effect, incentives only
in name. It needs to be pointed out here that the ex-ante ICICI
data, which reflect the optimistic and hopeful expectations of
the entrepreneur and of the financial institution, tend to conceal
the actual extent of surrender of fiscal reliefs. The conclusion
on surrender and loss of the reliefs would become even sharper
if ex-post data on ICICI projects are studied. Such data are
not uniformly available, and only for the last two to three years,
some data are now being called for by the ICICI.
Inadequacy of profits and restriction on the time limit within
which more than one relief has to be simultaneously claimed
are the main reasons for the redundancy of some of the fiscal
reliefs. As much as 54.8 per cent of the ICICI projects are not
expected to avail themselves of investment allowance in the
first year of their operations because they would not be able to
fully claim their current year's depreciation due to inadequacy
52 FISCAL INCENTIVES AND CORPORATE TAX SAVING
of commercial profits14. In subsequent years, the proportion is
expected to be much smaller: 8.2 per cent of the projects would
carry forward some proportion of unabsorbed depreciation
and/or loss. Inadequacy of profits, thus, not only defers the claim
of depreciation but also delays the utilisation of fiscal reliefs, and
when profits continue to be inadequate uptothe end of the period
within which the reliefs are to be claimed, the fiscal reliefs are lost.
It is, therefore, not surprising to find as was shown in
section 5 of this chapter, that the new industrial undertakings,
which are more likely to encounter the problem of inadequate
profits especially in the initial years, are expected to claim in the
first year of their operations only 1.1 per cent of their eight-year
investment allowance claim, whereas the 73 projects together
are expected to claim 32.9 per cent.
8. Fiscal Reliefs, Tax Savings and the Return on Investment
in Discounted Present Values
a. The problem. The impact of fiscal incentives is normally
measured in terms of the reduction in the effective tax rate or
in the diminution in the tax base, as has been shown in the
preceding sections. But the problem is that the return from
earlier investments and from the new investments get mixed in
the case of existing undertakings, and, therefore, we are unable
to quantify the tax-saving impact of the fiscal incentive. This
problem arises because there are various types of companies
that may be eligible for the fiscal incentives. Table IV.6 presents
the estimates of the tax-saving effect of investment allowance for
three types of companies, namely,
(i) a new company with inadequate or low profits (A);
(ii) an existing company with low profits (B); and
(iii) an existing company with large profits (C), including
those from earlier investments.
We, thus, see that the tax base diminution effect and the
effective tax rate would vary, depending on the level of profits
before tax and before fiscal reliefs are claimed. A more appro
priate analysis would be in terms of tax saving flows generated
14. It is interesting to see that in the case of existing undertakings, none of
the projects would have loss brought forward from earlier investments
jn the same plants or other plants within the company.
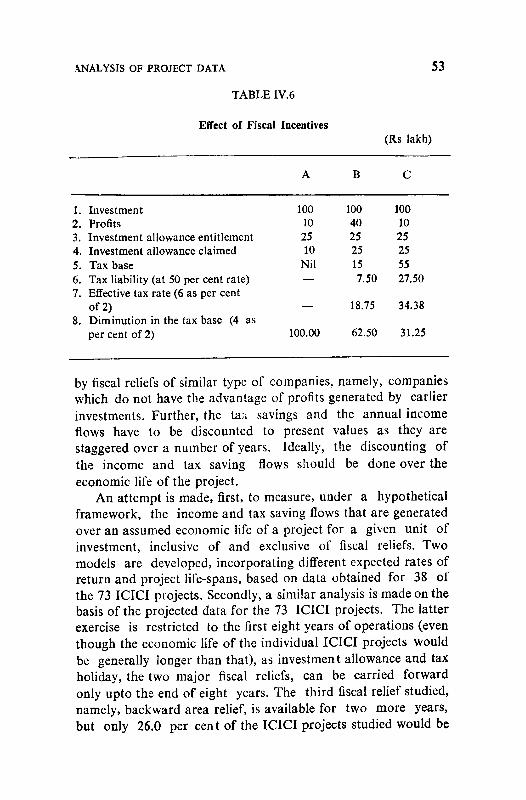
\NALYSIS OF PROJECT DATA 53
TABLE 1V.6
Effect of Fiscal Incentives
(Rs lakh)
1. Investment
2. Profits
3. Investment allowance entitlement
4. Investment allowance claimed
5. Tax base
6. Tax liability (at 50 per cent rate)
7. Effective tax rate (6 as per cent
of 2)
8. Diminution in the tax base (4 as
per cent of 2)
A
100
10
25
10
Nil
—
—
100.00
B
100
40
25
25
15
7.50
18.75
62.50
C
100
10
25
25
55
27.50
34.38
31.25
by fiscal reliefs of similar type of companies, namely, companies
which do not have the advantage of profits generated by earlier
investments. Further, the tax savings and the annual income
flows have to be discounted to present values as they are
staggered over a number of years. Ideally, the discounting of
the income and tax saving flows should be done over the
economic life of the project.
An attempt is made, first, to measure, under a hypothetical
framework, the income and tax saving flows that are generated
over an assumed economic life of a project for a given unit of
investment, inclusive of and exclusive of fiscal reliefs. Two
models are developed, incorporating different expected rates of
return and project life-spans, based on data obtained for 38 of
the 73 ICICI projects. Secondly, a similar analysis is made on the
basis of the projected data for the 73 ICICI projects. The latter
exercise is restricted to the first eight years of operations (even
though the economic life of the individual ICICI projects would
be generally longer than that), as investment allowance and tax
holiday, the two major fiscal reliefs, can be carried forward
only upto the end of eight years. The third fiscal relief studied,
namely, backward area relief, is available for two more years,
but only 26.0 per cent of the ICICI projects studied would be
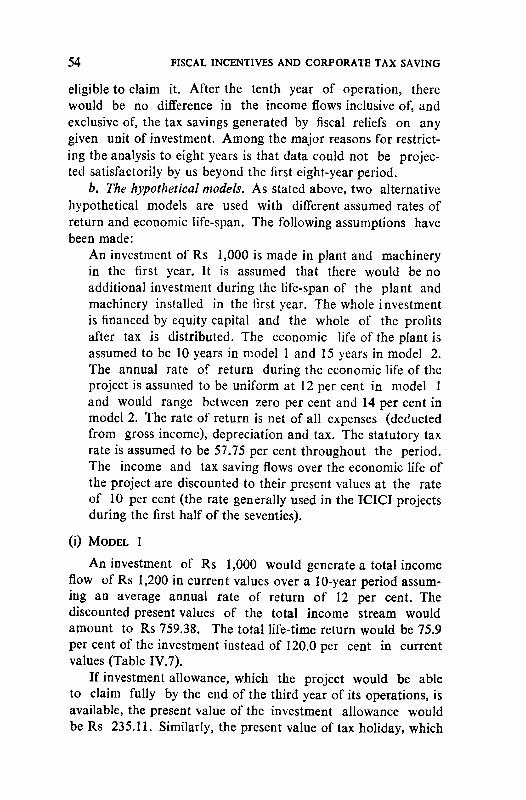
54 FISCAL INCENTIVES AND CORPORATE TAX SAVING
eligible to claim it. After the tenth year of operation, there
would be no difference in the income flows inclusive of, and
exclusive of, the tax savings generated by fiscal reliefs on any
given unit of investment. Among the major reasons for restrict
ing the analysis to eight years is that data could not be projec
ted satisfactorily by us beyond the first eight-year period.
b. The hypothetical models. As stated above, two alternative
hypothetical models are used with different assumed rates of
return and economic life-span. The following assumptions have
been made:
An investment of Rs 1,000 is made in plant and machinery
in the first year. It is assumed that there would be no
additional investment during the life-span of the plant and
machinery installed in the first year. The whole investment
is financed by equity capital and the whole of the profits
after tax is distributed. The economic life of the plant is
assumed to be 10 years in model 1 and 15 years in model 2.
The annual rate of return during the economic life of the
project is assumed to be uniform at 12 per cent in model 1
and would range between zero per cent and 14 per cent in
model 2. The rate of return is net of all expenses (deducted
from gross income), depreciation and tax. The statutory tax
rate is assumed to be 57.75 per cent throughout the period.
The income and tax saving flows over the economic life of
the project are discounted to their present values at the rate
of 10 per cent (the rate generally used in the ICICI projects
during the first half of the seventies).
(i) Model 1
An investment of Rs 1,000 would generate a total income
flow of Rs 1,200 in current values over a 10-year period assum
ing an average annual rate of return of 12 per cent. The
discounted present values of the total income stream would
amount to Rs 759.38. The total life-time return would be 75.9
per cent of the investment instead of 120.0 per cent in current
values (Table IV.7).
If investment allowance, which the project would be able
to claim fully by the end of the third year of its operations, is
available, the present value of the investment allowance would
be Rs 235.11. Similarly, the present value of tax holiday, which
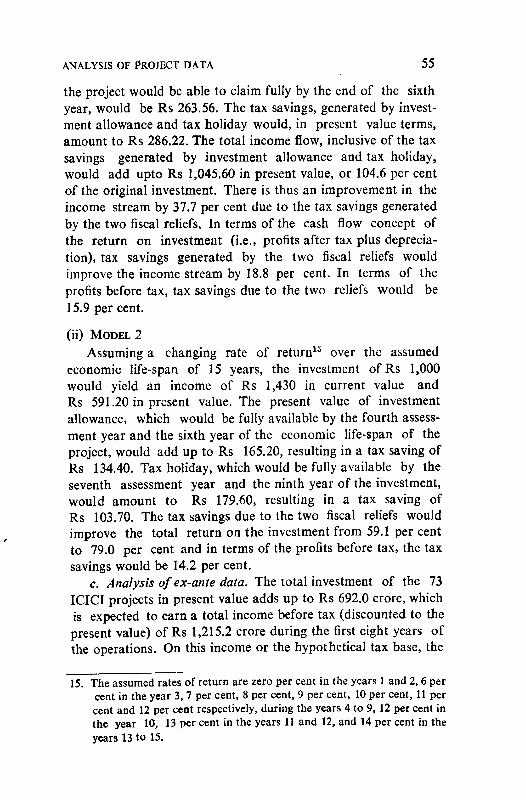
ANALYSIS OF PROJECT DATA 55
the project would be able to claim fully by the end of the sixth
year, would be Rs 263.56. The tax savings, generated by invest
ment allowance and tax holiday would, in present value terms,
amount to Rs 286.22. The total income flow, inclusive of the tax
savings generated by investment allowance and tax holiday,
would add upto Rs 1,045.60 in present value, or 104.6 per cent
of the original investment. There is thus an improvement in the
income stream by 37.7 per cent due to the tax savings generated
by the two fiscal reliefs. In terms of the cash flow concept of
the return on investment (i.e., profits after tax plus deprecia
tion), tax savings generated by the two fiscal reliefs would
improve the income stream by 18.8 per cent. In terms of the
profits before tax, tax savings due to the two reliefs would be
15.9 per cent.
(ii) Model 2
Assuming a changing rate of return15 over the assumed
economic life-span of 15 years, the investment ofRs 1,000
would yield an income of Rs 1,430 in current value and
Rs 591.20 in present value. The present value of investment
allowance, which would be fully available by the fourth assess
ment year and the sixth year of the economic life-span of the
project, would add up to Rs 165.20, resulting in a tax saving of
Rs 134.40. Tax holiday, which would be fully available by the
seventh assessment year and the ninth year of the investment,
would amount to Rs 179.60, resulting in a tax saving of
Rs 103.70. The tax savings due to the two fiscal reliefs would
improve the total return on the investment from 59.1 per cent
to 79.0 per cent and in terms of the profits before tax, the tax
savings would be 14.2 per cent.
c. Analysis of ex-ante data. The total investment of the 73
ICICI projects in present value adds up to Rs 692.0 crore, which
is expected to earn a total income before tax (discounted to the
present value) of Rs 1,215.2 crore during the first eight years of
the operations. On this income or the hypothetical tax base, the
15. The assumed rates of return are zero per cent in the years 1 and 2, 6 per
cent in the year 3, 7 per cent, 8 per cent, 9 per cent, 10 per cent, 11 per
cent and 12 per cent respectively, during the years 4 to 9, 12 per cent in
the year 10, 13 per cent in the years 11 and 12, and 14 per cent in the
years 13 to 15.
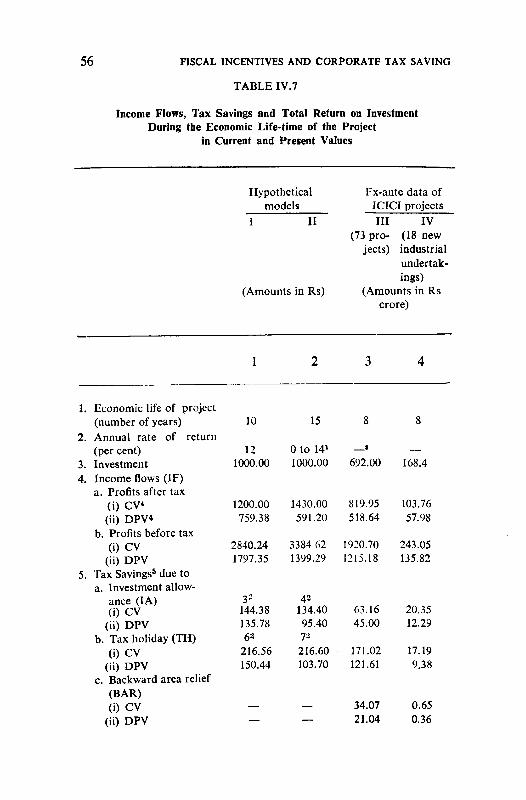
56 FISCAL INCENTIVES AND CORPORATE TAX SAVING
TABLE IV.7
Income Flows, Tax Savings and Total Return on Investment
During the Economic Life-time of the Project
in Current and Present Values
1.
2.
3.
4.
5.
Economic life of project
(number of years)
Annual rate of return
(per cent)
Investment
Income flows (IF)
a. Profits after tax
(i) CV*
(ii) DPV*
b. Profits before tax
(i) CV
(ii) DPV
Tax Savings5 due to
a. Investment allow
ance (IA)
(i) CV
(ii) DPV
b. Tax holiday (TH)
(i) CV
(ii) DPV
c. Backward area relief
(BAR)
(i) CV
(ii) DPV
Hypothetical
models
I II
(Amounts in Rs)
1
10
12
1000.00
1200.00
759.38
2840.24
1797.35
3*144.38
135.78
62
216.56
150.44
—
—
2
15
0 to 141
1000.00
1430.00
591.20
3384.62
1399.29
42
134.40
95.40
72
216.60
103.70
—
—
Ex-ante data of
ICICI projects
III
(73 pro
jects)
IV
(18 new
industrial
undertak
ings)
(Amounts in Rs
crore)
3
8
i
692.00
819.95
518.64
1920.70
1215.18
63.16
45.00
171.02
121.61
34.07
21.04
4
8
—
168.4
103.76
57.98
243.05
135.82
20.35
12.29
17.19
9.38
0.65
0,36
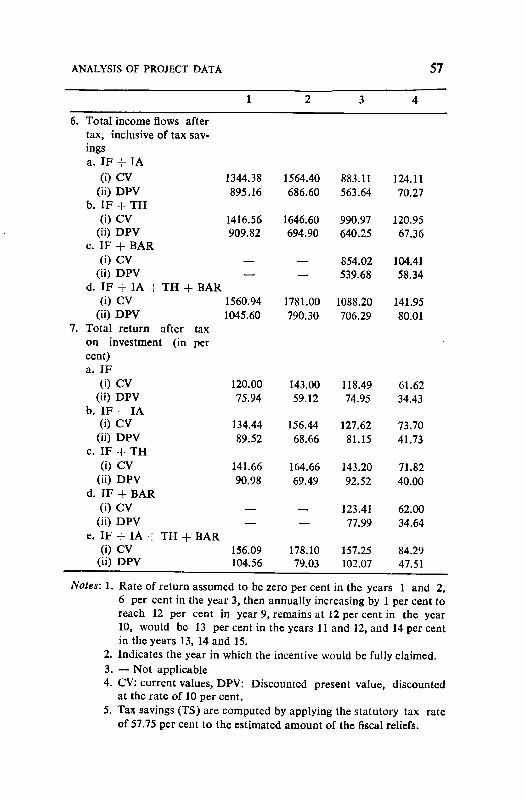
ANALYSIS OF PROJECT DATA 57
6. Total income flows after
tax, inclusive of tax sav
ings
a. IF + IA
(OCV
(ii) DPV
b. IF + TH
(i) CV
(ii) DPV
c. IF + BAR
(OCV
(ii) DPV
d. IF + IA + TH + BAR
(i) CV
(ii) DPV
7. Total return after tax
on investment (in per
cent)
a. IF
(i) CV
(ii) DPV
b. IF + IA
(OCV
(ii) DPV
c. IF + TH
(i) CV
(ii) DPV
d. IF + BAR
(OCV
(ii) DPV
e. IF + IA + TH + BAR
(i) CV(ii) DPV
1
1344.38
895.16
1416.56
909.82
—
—
1560.94
1045.60
120.00
75.94
134.44
89.52
141.66
90.98
—
—
156.09
104.56
2
1564.40
686.60
1646.60
694.90
—
—
1781.00
790.30
143.00
59.12
156.44
68.66
164.66
69.49
—..
—
178.10
79.03
3
883.11
563.64
990.97
640.25
854.02
539.68
1088.20
706.29
118.49
74.95
127.62
81.15
143.20
92.52
123.41
77.99
157.25
102.07
4
124.11
70.27
120.95
67.36
104.41
58.34
141.95
80.01
61.62
34.43
73.70
41.73
71.82
40.00
62.00
34.64
84.29
47.51
Notes: 1. Rate of return assumed to be zero per cent in the years 1 and 2,
6 per cent in the year 3, then annually increasing by 1 per cent to
reach 12 per cent in year 9, remains at 12 per cent in the year
10, would be 13 per cent in the years 11 and 12, and 14 per cent
in the years 13, 14 and 15.
2. Indicates the year in which the incentive would be fully claimed.
3. — Not applicable
4. CV: current values, DPV: Discounted present value, discounted
at the rate of 10 per cent.
5. Tax savings (TS) are computed by applying the statutory tax rate
of 57.75 per cent to the estimated amount of the fiscal reliefs.
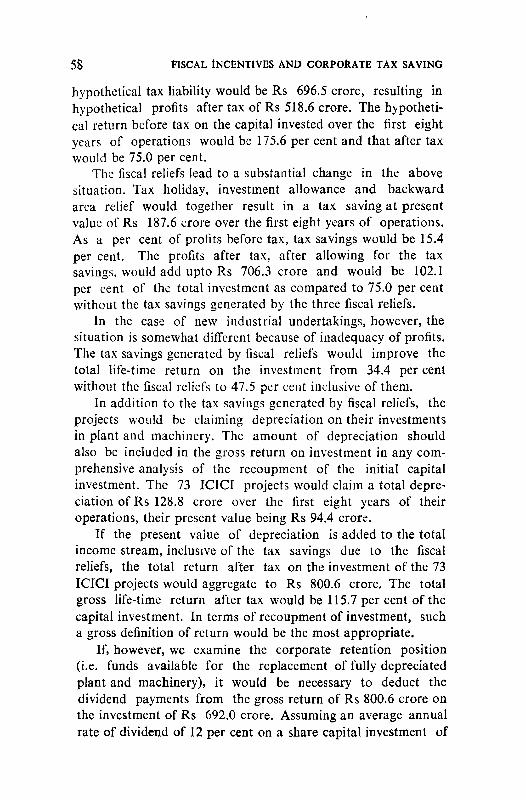
58 fiscal Incentives and corporate tax saving
hypothetical tax liability would be Rs 696.5 crore, resulting in
hypothetical profits after tax of Rs 518.6 crore. The hypotheti
cal return before tax on the capital invested over the first eight
years of operations would be 175.6 per cent and that after tax
would be 75.0 per cent.
The fiscal reliefs lead to a substantial change in the above
situation. Tax holiday, investment allowance and backward
area relief would together result in a tax saving at present
value of Rs 187.6 crore over the first eight years of operations.
As a per cent of profits before tax, tax savings would be 15.4
per cent. The profits after tax, after allowing for the tax
savings, would add upto Rs 706.3 crore and would be 102.1
per cent of the total investment as compared to 75.0 per cent
without the tax savings generated by the three fiscal reliefs.
In the case of new industrial undertakings, however, the
situation is somewhat diflferent because of inadequacy of profits.
The tax savings generated by fiscal reliefs would improve the
total life-time return on the investment from 34.4 per cent
without the fiscal reliefs to 47.5 per cent inclusive of them.
In addition to the tax savings generated by fiscal reliefs, the
projects would be claiming depreciation on their investments
in plant and machinery. The amount of depreciation should
also be included in the gross return on investment in any com
prehensive analysis of the recoupment of the initial capital
investment. The 73 ICICI projects would claim a total depre
ciation of Rs 128.8 crore over the first eight years of their
operations, their present value being Rs 94.4 crore.
If the present value of depreciation is added to the total
income stream, inclusive of the tax savings due to the fiscal
reliefs, the total return after tax on the investment of the 73
ICICI projects would aggregate to Rs 800.6 crore. The total
gross life-time return after tax would be 115.7 per cent of the
capital investment. In terms of recoupment of investment, such
a gross definition of return would be the most appropriate.
If, however, we examine the corporate retention position
(i.e. funds available for the replacement of fully depreciated
plant and machinery), it would be necessary to deduct the
dividend payments from the gross return of Rs 800.6 crore on
the investment of Rs 692.0 crore. Assuming an average annual
rate of dividend of 12 per cent on a share capital investment of
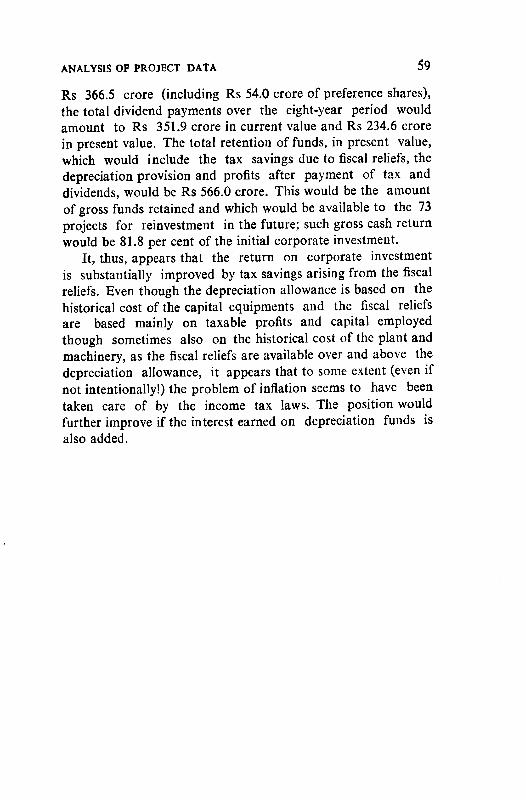
ANALYSIS OF PROJECT DATA 59
Rs 366.5 crore (including Rs 54.0 crore of preference shares),
the total dividend payments over the eight-year period would
amount to Rs 351.9 crore in current value and Rs 234.6 crore
in present value. The total retention of funds, in present value,
which would include the tax savings due to fiscal reliefs, the
depreciation provision and profits after payment of tax and
dividends, would be Rs 566.0 crore. This would be the amount
of gross funds retained and which would be available to the 73
projects for reinvestment in the future; such gross cash return
would be 81.8 per cent of the initial corporate investment.
It, thus, appears that the return on corporate investment
is substantially improved by tax savings arising from the fiscal
reliefs. Even though the depreciation allowance is based on the
historical cost of the capital equipments and the fiscal reliefs
are based mainly on taxable profits and capital employed
though sometimes also on the historical cost of the plant and
machinery, as the fiscal reliefs are available over and above the
depreciation allowance, it appears that to some extent (even if
not intentionally!) the problem of inflation seems to have been
taken care of by the income tax laws. The position would
further improve if the interest earned on depreciation funds is
also added.
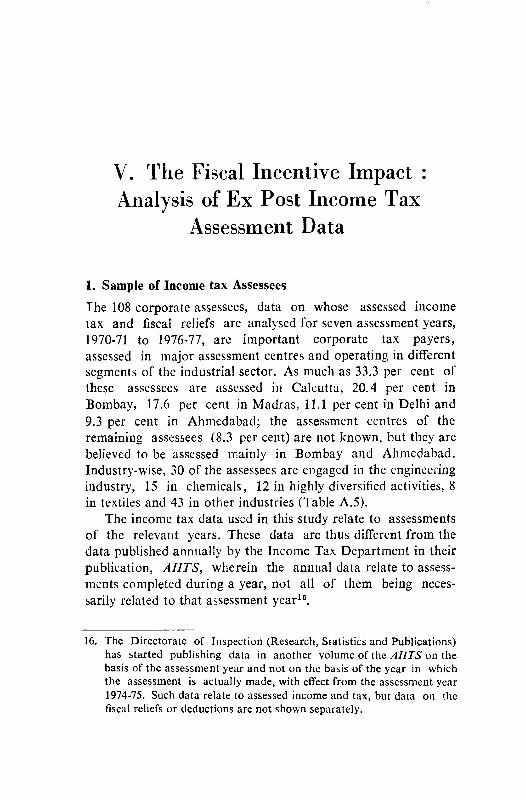
V. The Fiscal Incentive Impact :
Analysis of Ex Post Income Tax
Assessment Data
1. Sample of Income tax Assessees
The 108 corporate assessees, data on whose assessed income
tax and fiscal reliefs are analysed for seven assessment years,
1970-71 to 1976-77, are important corporate tax payers,
assessed in major assessment centres and operating in different
segments of the industrial sector. As much as 33,3 per cent of
these assessees are assessed in Calcutta, 20.4 per cent in
Bombay, 17.6 per cent in Madras, 11.1 per cent in Delhi and
9.3 per cent in Ahmedabad; the assessment centres of the
remaining assessees (8.3 per cent) are not known, but they are
believed to be assessed mainly in Bombay and Ahmedabad.
Industry-wise, 30 of the assessees are engaged in the engineering
industry, 15 in chemicals, 12 in highly diversified activities, 8
in textiles and 43 in other industries (Table A.5).
The income tax data used in this study relate to assessments
of the relevant years. These data are thus different from the
data published annually by the Income Tax Department in their
publication, AIITS, wherein the annual data relate to assess
ments completed during a year, not all of them being neces
sarily related to that assessment year16.
16. The Directorate of Inspection (Research, Statistics and Publications)
has started publishing data in another volume of the AIITS on the
basis of the assessment year and not on the basis of the year in which
the assessment is actually made, with effect from the assessment year
1974-75. Such data relate to assessed income and tax, but data on the
fiscal reliefs or deductions are not shown separately.
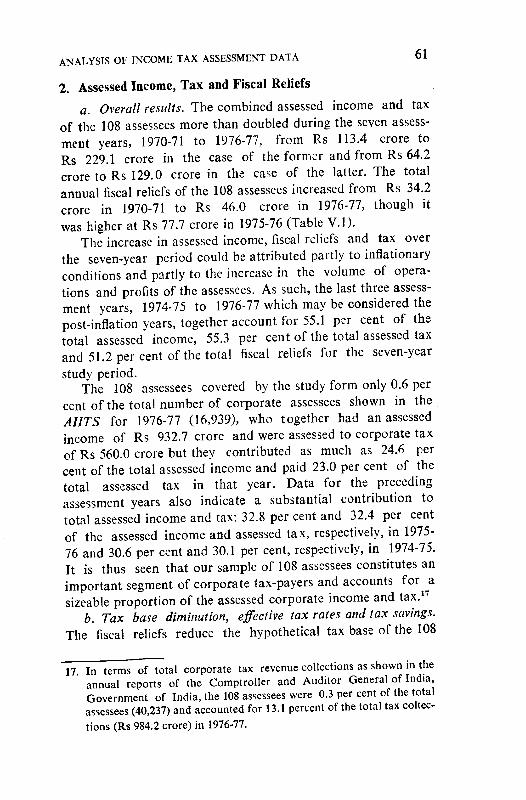
ANALYSIS OF INCOME TAX ASSESSMENT DATA 61
2. Assessed Income, Tax and Fiscal Reliefs
a. Overall results. The combined assessed income and tax
of the 108 assessees more than doubled during the seven assess
ment years, 1970-71 to 1976-77, from Rs 113.4 crore to
Rs 229.1 crore in the case of the former and from Rs 64.2
crore to Rs 129.0 crore in the case of the latter. The total
annual fiscal reliefs of the 108 assessees increased from Rs 34.2
crore in 1970-71 to Rs 46.0 crore in 1976-77, though it
was higher at Rs 77.7 crore in 1975-76 (Table V.I).
The increase in assessed income, fiscal reliefs and tax over
the seven-year period could be attributed partly to inflationary
conditions and partly to the increase in the volume of opera
tions and profits of the assessees. As such, the last three assess
ment years, 1974-75 to 1976-77 which may be considered thepost-inflation years, together account for 55.1 per cent of the
total assessed income, 55.3 per cent of the total assessed tax
and 51.2 per cent of the total fiscal reliefs for the seven-year
study period.The 108 assessees covered by the study form only 0.6 per
cent of the total number of corporate assessees shown in the
AIITS for 1976-77 (16,939), who together had an assessed
income of Rs 932.7 crore and were assessed to corporate tax
of Rs 560.0 crore but they contributed as much as 24.6 per
cent of the total assessed income and paid 23.0 per cent of thetotal assessed tax in that year. Data for the preceding
assessment years also indicate a substantial contribution to
total assessed income and tax: 32.8 per cent and 32.4 per cent
of the assessed income and assessed tax, respectively, in 1975-
76 and 30.6 per cent and 30.1 per cent, respectively, in 1974-75.
It is thus seen that our sample of 108 assessees constitutes an
important segment of corporate tax-payers and accounts for a
sizeable proportion of the assessed corporate income and tax.17b. Tax base diminution, effective tax rates and tax savings.
The fiscal reliefs reduce the hypothetical tax base of the 108
17 In terms of total corporate tax revenue collections as shown in the' annual reports of the Comptroller and Auditor General of India,Government of India, the 108 assessees were 0.3 per cent of the totalassessees (40,237) and accounted for 13.1 percent of the total tax collec
tions (Rs 984.2 crore) in 1976-77.
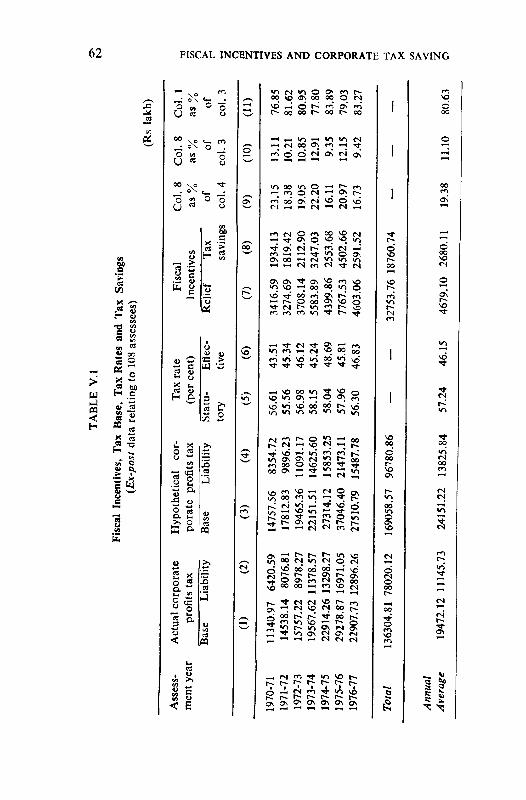
TABLE
V.I
Fiscal
Incentives,Tax
Base,TaxRates
andTax
Savings
(Ex-postdata
relatingto108assessees)
o to
(Rs
lakh)
Assess
mentyear
1970-71
1971-72
1972-73
1973-74
1974-75
1975-76
1976-77
Total
Annual
Average
Actualcorporate
profitstax
Base
Liability
(0
(2)
11340.97
6420.59
14538.14
8076.81
15757.22
8978.27
19567.62
11378.57
22914.26
13298.27
29278.87
16971.05
22907.73
12896.26
136304.81
78020.12
19472.12
11145.73
Hypothetical
cor
porate
profitstax
Base
:
(3)
14757.56
17812.83
19465.36
22151.51
27314.12
37046.40
27510.79
169058.57
24151.22
Liability
(4)
8354.72
9896.23
11091.17
14625.60
15853.25
21473.11
15487.78
96780.86
13825.84
Tax
rate
(percent)
Statu
tory (5
)
56.61
55.56
56.98
58.15
58.04
57.96
56.30
—
57.24
Effec
tive (6
)
43.51
45.34
46.12
45.24
48.69
45.81
46.83
—
46.15
Fiscal
Incentives
Relief
(7)
3416.59
3274.69
3708.14
5583.89
4399.86
7767.53
4603.06
32753.76
4679.10
Tax
savings
(8)
1934.13
1819.42
2112.90
3247.03
2553.68
4502.66
2591.52
18760.74
2680.11
Col.
8
as^
of
col.4
(9)
23.15
18.38
19.05
22.20
16.11
20.97
16.73
—
19.38
Col.8
as% of
col.3
(10)
13.11
10.21
10.85
12.91
9.35
12.15
9.42
— 11.10
Col.
1
Of
col.
3
(11)
76.85
81.62
80.95
77.80
83.89
79.03
83.27
— 80.63
o > z /-\
CO
Z 'IVE!> Z o o S )RAT1 ETAXSAVI2 O
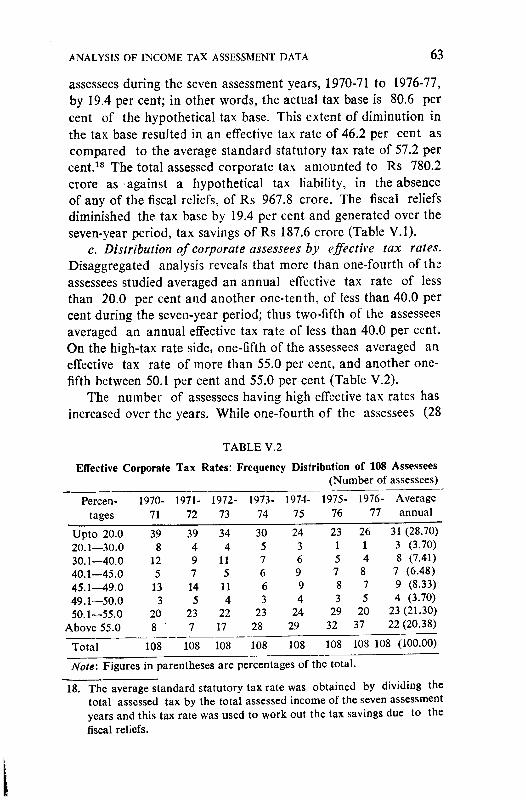
ANALYSIS OF INCOME TAX ASSESSMENT DATA 63
assessees during the seven assessment years, 1970-71 to 1976-77,
by 19.4 per cent; in other words, the actual tax base is 80.6 per
cent of the hypothetical tax base. This extent of diminution in
the tax base resulted in an effective tax rate of 46.2 per cent as
compared to the average standard statutory tax rate of 57.2 per
cent.18 The total assessed corporate tax amounted to Rs 780.2
crore as against a hypothetical tax liability, in the absence
of any of the fiscal reliefs, of Rs 967.8 crore. The fiscal reliefs
diminished the tax base by 19.4 per cent and generated over the
seven-year period, tax savings of Rs 187.6 crore (Table V.I).
c. Distribution of corporate assessees by effective tax rates.
Disaggregated analysis reveals that more than one-fourth of ths
assessees studied averaged an annual effective tax rate of less
than 20.0 per cent and another one-tenth, of less than 40.0 per
cent during the seven-year period; thus two-fifth of the assessees
averaged an annual effective tax rate of less than 40.0 per cent.
On the high-tax rate side, one-fifth of the assessees averaged an
effective tax rate of more than 55.0 per cent, and another one-
fifth between 50.1 per cent and 55.0 per cent (Table V.2).
The number of assessees having high effective tax rates has
increased over the years. While one-fourth of the assessees (28
TABLE V.2
Effective Corporate Tax Rates: Frequency Distribution of 108 Assessees
(Number of assessees)
Percen
tages
1970-
71
1971-
72
1972-
73
1973-
74
1974-
75
1975-
76
1976-
77
Average
annual
Upto 20.0
20.1—30.0
30.1—40.0
40.1—45.0
45.1—49.0
49.1—50.0
50.1—55.0
Above 55.0
Total
39
8
12
5
13
3
20
8 '
108
39
4
9
7
14
5
23
7
108
34
4
11
5
11
4
22
17
108
30
5
7
6
6
3
23
28
108
24
3
6
9
9
4
24
29
108
23
1
5
7
8
3
29
32
108
26
1
4
8
7
5
20
37
108
31 (28.70)
3 (3.70)
8 (7.41)
7 (6.48)
9 (8.33)
4 (3.70)
23 (21.30)
22 (20.38)
108 (100.00)
Note: Figures in parentheses are percentages of the total.
18. The average standard statutory tax rate was obtained by dividing the
total assessed tax by the total assessed income of the seven assessment
years and this tax rate was used to work out the tax savings due to the
fiscal reliefs.
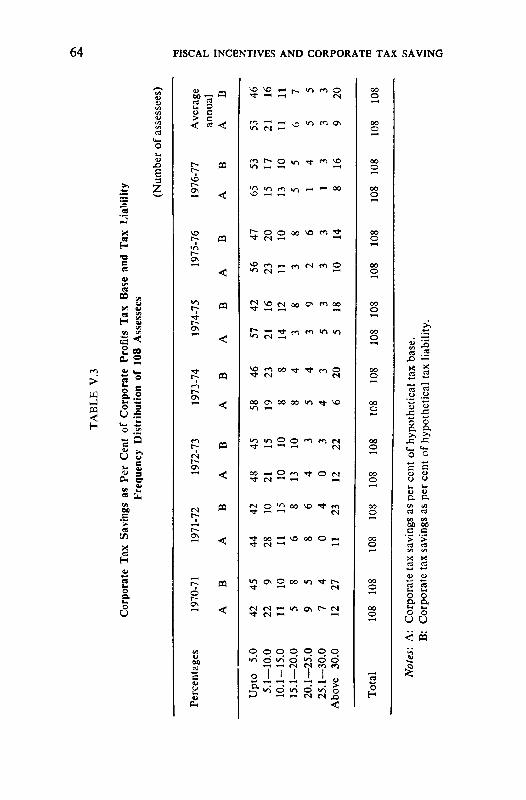
TABLE
V.3
CorporateTax
Savings
asPerCent
ofCorporate
ProfitsTax
Base
andTax
Liability
Frequency
Distribution
of108
Assessees
(Numberofassessees)
Percentages
Upto
5.0
5.1—10.0
10.1-15.0
15.1—20.0
20.1—25.0
25.1—30.0
Above
30.0
Total Notes'.
A:
B:
1970-71
A 42
22
11 5 9 7
12
108
B 45 9 10 8 5 4
27
108
1971-72
A 44
28 11 6 8 0
11
108
B 42
10 15 8 6 4
23
108
1972-73
A 48
21 10
13 4 0
12
108
B 45
15 10
10 3 3
22
108
1973-74
A 58
19 8 8 5 4 6
108
B 46
23 8 4 4 3
20
108
1974-75
A
57
21
14 3 3 5 5
108
Corporatetaxsavingsaspercentofhypotheticaltaxbase.
Corporatetaxsavingsaspercentofhypotheticaltax
liab
ilit
y.
B 42
16
12 8 9 3
18
108
1975-76
A
56
23
11 3 2 3 10
108
B 47
20
10 8 6 3 14
108
1976-77
A 65
15
13 5 1 1 8
108
B 53
17
10 5 4 3
16
108
Average
annual
A 53
21
11 6 5 3 9
108
B 46
16
11 7 5 3
20
108
FISCAr z o H > 25 o o 50 POR/HETA)> VING
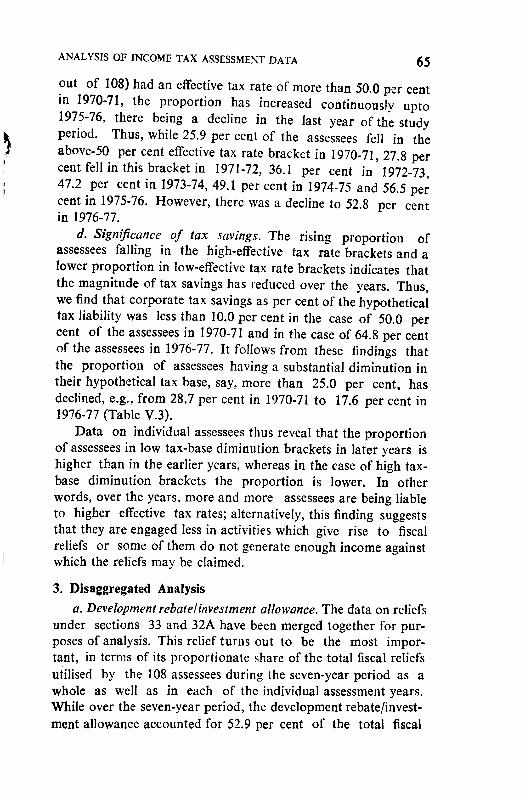
ANALYSIS OF INCOME TAX ASSESSMENT DATA 65
out of 108) had an effective tax rate of more than 50,0 per cent
in 1970-71, the proportion has increased continuously upto1975-76, there being a decline in the last year of the study
period. Thus, while 25.9 per cent of the assessees fell in the
above-50 per cent effective tax rate bracket in 1970-71, 27.8 per
cent fell in this bracket in 1971-72, 36.1 per cent in 1972-73,
47.2 per cent in 1973-74, 49.1 per cent in 1974-75 and 56.5 per
cent in 1975-76. However, there was a decline to 52.8 per cent
in 1976-77.
d. Significance of tax savings. The rising proportion of
assessees falling in the high-effective tax rate brackets and a
lower proportion in low-effective tax rate brackets indicates that
the magnitude of tax savings has reduced over the years. Thus,
we find that corporate tax savings as per cent of the hypothetical
tax liability was less than 10.0 per cent in the case of 50.0 per
cent of the assessees in 1970-71 and in the case of 64.8 per cent
of the assessees in 1976-77. It follows from these findings that
the proportion of assessees having a substantial diminution in
their hypothetical tax base, say, more than 25.0 per cent, has
declined, e.g., from 28.7 per cent in 1970-71 to 17.6 per cent in
1976-77 (Table V.3).
Data on individual assessees thus reveal that the proportion
of assessees in low tax-base diminution brackets in later years is
higher than in the earlier years, whereas in the case of high tax-
base diminution brackets the proportion is lower. In other
words, over the years, more and more assessees are being liable
to higher effective tax rates; alternatively, this finding suggests
that they are engaged less in activities which give rise to fiscal
reliefs or some of them do not generate enough income against
which the reliefs may be claimed.
3. Disaggregated Analysis
a. Development rebate/investment allowance. The data on reliefs
under sections 33 and 32A have been merged together for pur
poses of analysis. This relief turns out to be the most impor
tant, in terms of its proportionate share of the total fiscal reliefs
utilised by the 108 assessees during the seven-year period as a
whole as well as in each of the individual assessment years.
While over the seven-year period, the development rebate/invest
ment allowance accounted for 52.9 per cent of the total fiscal
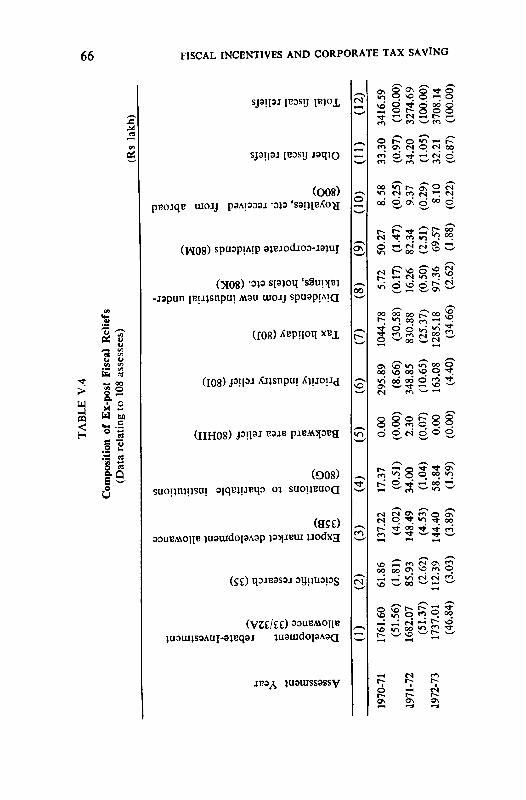
SOv©^O>i-OpJ
*?r9-4~J-4OJK>H-
O\Nl«
oobw•**S--J
w;s-*:ss^^s
u.oob5Inwvo*>.-UO>-*J
ppOMpP
febQwpo
\^iOooooen
bb\ooo\oooowiuia«
oo|^>>eu»y>¥*pp
qah>s^o
pt»P^pP°NUNWMCH
boK)bw'«v*>-J—.O.O-4O
00Oo5
AssessmentYear
Developmentrebate-Investment
allowance(33/32A)
Scientificresearch(35)
Exportmarketdevelopmentallowance
(35B)
Donationstocharitableinstitutions
(80G)
Backwardarearelief(80HH)
Priorityindustryrelief(801)
Taxholiday(80J)
Dividendsfromnewindustrialunder
takings,hotelsetc.(80K)
Inter-corporatedividends(80M)
Royalties,etc.receivedfromabroad
(800)
Otherfiscalreliefs
Totalfiscalreliefs
9
53r1
°1wsi< GO^*-*»^
ONIAVSXVIaiVHOd^ODQNVSaAUNaONl1VDSH99
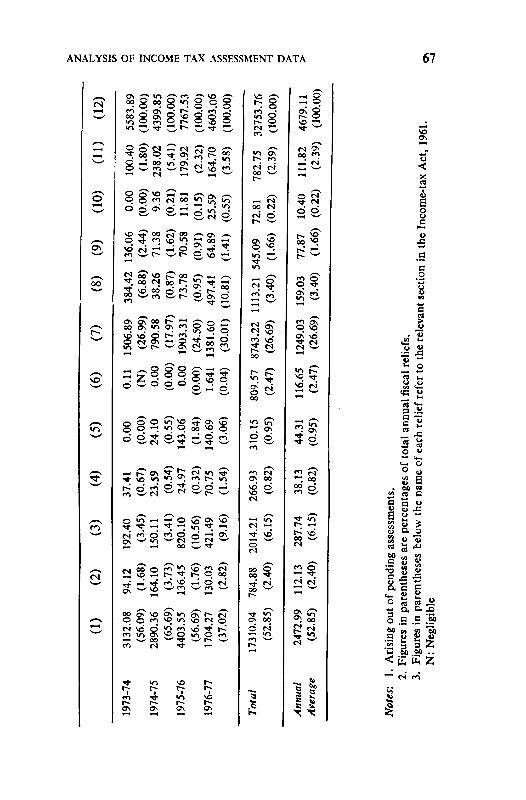
(0
(2)
(3)
(4)
(5)
(6)
(7)
(8)
(9)
(10)
(11)
(12)
1973-74
1974-75
1975-76
1976-77
Total
Annual
Average
3132.08
(56.09)
2890.36
(65.69)
4403.55
(56.69)
1704.27
(37.02)
17310.94
(52.85)
2472.99
(52.85)
94.12
(1.68)
164.10
(3.73)
136.45
(1.76)
130.03
(2.82)
784.88
(2.40)
112.13
(2.40)
192.40
(3.45)
150.11
(3.41)
820.10
(10.56)
421.49
(9.16)
2014.21
(6.15)
287.74
(6.15)
37.41
(0.67)
23.59
(0.54)
24.97
(0.32)
70.75
(1.54)
266.93
(0.82)
38.13
(0.82)
0.00
(0.00)
24.10
(0.55)
143.06
(1.84)
140.69
(3.06)
310.15
(0.95)
44.31
(0.95)
0.11
(N)
0.00
(0.00)
0.00
(0.00)
1.641
(0.04)
809.57
(2.47)
116.65
(2.47)
1506.89
(26.99)
790.58
(17.97)
1903.31
(24.50)
1381.60
(30.01)
8743.22
(26.69)
1249.03
(26.69)
384.42
(6.88)
38.26
(0.87)
73.78
(0.95)
497.41
(10.81)
1113.21
(3.40)
159.03
(3.40)
136.06
(2.44)
71.38
(1.62)
70.58
(0.91)
64.89
(1.41)
545.09
(1.66)
77.87
(1.66)
0.00
(0.00)
9.36
(0.21)
11.81
(0.15)
25.59
(0.55)
72.81
(0.22)
10.40
(0.22)
100.40
(1.80)
238.02
(5.41)
179.92
(2.32)
164.70
(3.58)
782.75
(2.39)
111.82
(2.39)
5583.89
(100.00)
4399.85
(100.00)
7767.53
(100.00)
4603.06
(100.00)
32753.76
(100.00)
4679.11
(100.00)
O —j
on
C/3
m oo
ffl
0 H
Notes:
1.Arisingoutofpendingassessments.
2.Figures
inparenthesesarepercentagesof
tota
lannual
fisc
alre
lief
s.
3.Figures
inparenthesesbelow
ihename
ofeach
relief
refe
rto
there
leva
ntsection
intheIncome-tax
Act
1961
N:
Negligible
68 FISCAL INCENTIVES AND CORPORATE TAX SAVING
reliefs received by the 108 assessees, the share was more than
50.0 per cent in five years and in the remaining two years, it was
46.8 per cent and 37.0 per cent, respectively (Table V.4).
b. Tax holiday. Tax holiday ranks second in importance
among the fiscal reliefs utilized by the corporate assessees.
Over the seven-year period, the contribution of this relief to the
total fiscal reliefs was more than one-fourth. The annual pro
portionate share of tax holiday in total fiscal reliefs ranged from
18.0 per cent in 1974-75 to 30.6 per cent in 1970-71. In each of
the seven assessment years, the proportionate share of tax holi
day was next only to that of the development rebate/investment
allowance (Table V.4).
The development rebate/investment allowance and tax holi
day are, thus, found to be, for the assessees studied, the two
most important fiscal reliefs in the corporate tax system. These
two fiscal reliefs together account for between a minimum of
67.0 per cent of the total fiscal reliefs utilized by the assessees
to a maximum of 83.7 per cent in different assessment years, the
seven-year average being 79.6 per cent.
In terms of the diminution in the tax base and also in terms
of tax savings, the effect of these two reliefs is, therefore, most
significant. The development rebate/investment allowance would
diminish the hypothetical tax base over the seven-year period by
10.2 per cent and in the absence of any other fiscal reliefs, the
tax rate would have fallen from 57.2 per cent (standard statutory
rate) to 51.4 per cent (effective rate), owing to the tax-reducing
effect of this relief alone. The tax base-diminution impact of the
tax holiday is less, roughly one-half of that of the investment
allowance: the hypothetical tax base would be diminished over
the seven-year period by 5.2 per cent and the effective tax rate
would fall to 54.2 per cent due to this relief alone.
A more meaningful estimate of the tax base diminution
effect of investment allowance and tax holiday can be obtained
from an analysis of only those assessees who received the res
pective reliefs. Such a study reveals that the tax base diminu
tion effect in their case works out to 11.6 per cent due to invest
ment allowance alone and the tax base diminution effect due to
the holiday alone is 10.6 per cent. The effective tax rate if only
the investment allowance was operational would have been
50.6 per cent (instead of the average statutory tax rate of
ANALYSIS OF INCOME TAX ASSESSMENT DATA 69
57.2 per cent) and it would have been 51.1 per cent if only tax
holiday was available (Table V.5).
c. Comparative analysis of the estimates of the Dandekar
Committee, AIITS and NIPFP. Some additional data are now
available for tax holiday and investment allowance for four
assessment years, 1975-76 to 1978-79. The Expert Committee
on Tax Measures to Promote Employment (Dandekar Commit
tee, 1980) in their Report (p. 32) estimated, on a census basis,
tax holiday at Rs 32.3 crore for 1975-76 as against our
estimate of Rs 19.0 crore for 108 major assessees; our estimate
is, thus, 58.9 per cent of the total assessed tax holiday in the
year. Similarly, for 1976-77, our estimate of Rs 13.8 crore is
41.1 per cent of the Dandekar Committee's estimate of the
total assessed tax holiday of Rs 33.6 crore. In other words,
comparable data for two assessment years show that the 108
assessees account for between two-fifth and three-fifth of the
total assessed annual tax holiday.
The Dandekar Committee's estimates of tax holiday on a
census basis are substantially higher than the figures shown in
the AIITS. According to the AIITS, tax holiday received by 550
assessees amounted to Rs 3.5 crore (the tax relief being Rs 2.0
crore) in the assessment year 1975-76 which is only 11.2 per
cent of the Dandekar Committee's census estimate and 18.4 per
cent of our estimate for 108 assessees. Similarly, for the assess
ment year 1976-77, the AIITS figure of tax holiday for 427
assessees at Rs 3.7 crore (the tax relief being Rs 2.1 crore) is
only 11.0 per cent of the census estimate presented by the
Dandekar Committee and 26.8 per cent of our estimate for 108
assessees. One possible explanation for the large difference
between the figures given in the AIITS and by the Dandekar
Committee is that while the former relate to assessments
completed during the year, the latter relate to assessments for
the specific year. Another reason could be that the AIITS
figures relate to original assessments (i.e. the first assessment at
the Income Tax Officer's level) and do not take into account
subsequent revisions, which would have been taken into account
in the estimates of the Dandekar Committee and ours. How
ever, the extent of the variations is large enough to question
the reliability of the AIITS figures. The evidence provided by
our data for only 108 assessees also suggests that the AIITS
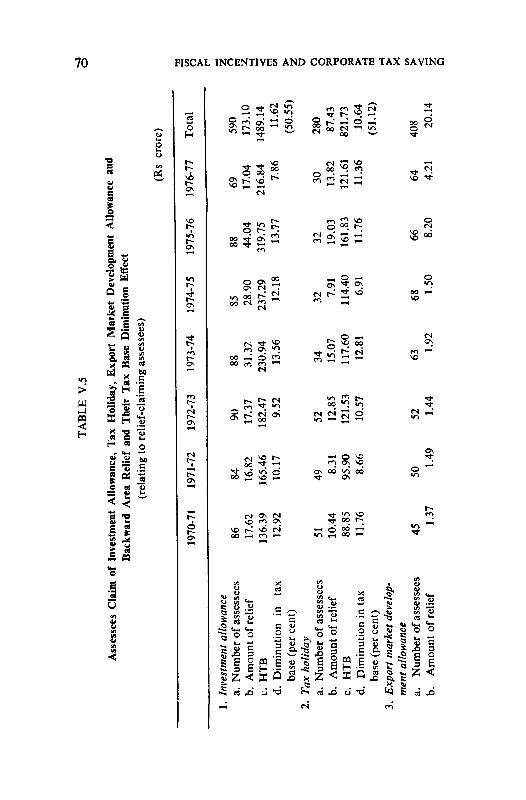
TABLE
V.5
AssesseesClaim
ofIn
vest
ment
Allowance,Tax
Holiday,
ExportMarket
Development
Allowance
and
Backward
Area
Reliefand
TheirTax
Base
Diminution
Effect
(relatingtorelief-claimingassessees)
(Rs
crore)
1.Investmentallowance
a.Numberofassessees
b.Amount
ofrelief
c.HTB
d.Diminution
in
tax
base(percent)
2.Tax
holiday
a.Numberofassessees
b.Amount
ofrelief
c.HTB
d.
Diminution
intax
base(percent)
3.Exportmarketdevelop
mentallowance
a.Number
ofassessees
b.Amount
ofrelief
1970-71
86
17.62
136.39
12.92
51
10.44
88.85
11.76
45
1.37
1971-72
84
16.82
165.46
10.17
49 8.31
95.90
8.66
50
1.49
1972-73
90
17.37
182.47
9.52
52 12.85
121.53
10.57
52 1.44
1973-74
88
31.32
230.94
13.56
34
15.07
117.60
12.81
63 1.92
1974-75
85
28.90
237.29
12.18
32 7.91
114.40
6.91
68 1.50
1975-76
88
44.04
319.75
13.77
32
19.03
161.83
11.76
66 8.20
1976-77
69
17.04
216.84
7.86
30
13.82
121.61
11.36
64
4.21
Total
590
173.10
1489.14
11.62
(50.55)
280
87.43
821.73
10.64
(51.12)
408 20.14
FISCAIi. o < > V O o o n .<
X 5 1
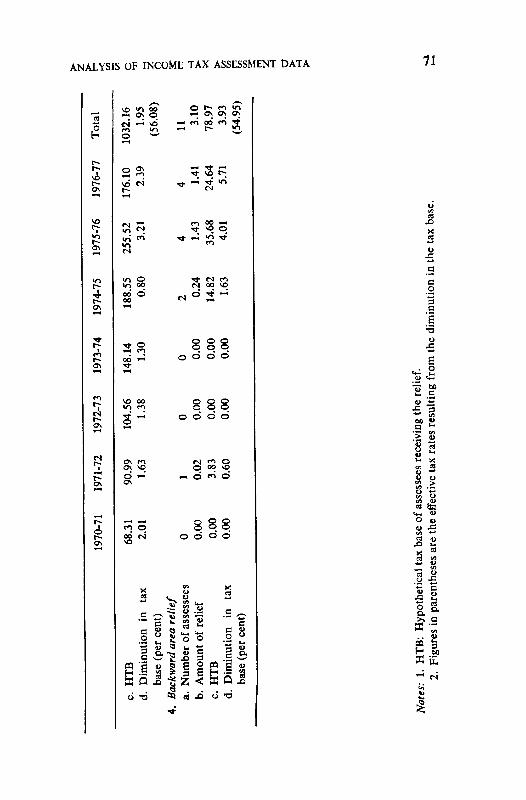
1970-71
1971-72
1972-73
1973-74
1974-75
1975-76
1976-77
Total
c.HTB
d.Diminution
in
tax
base(percent)
4.Backwardarea
relief
a.Number
ofassessees
b.Amount
of
relief
c.HTB
d.Diminution
in
tax
base(percent)
68.31
2.01
0 0.00
0.00
0.00
90.99
1.63
1 0.02
3.83
0.60
104.56
1.38
0 0.00
0.00
0.00
148.14
1.30
0 0.00
0.00
0.00
188.55
0.80
2 0.24
14.82
1.63
255.52
3.21
4 1.43
35.68
4.01
176.10
2.39
4 1.41
24.64
5.71
1032.16
1.95
(56.08)
11 3.10
78.97
3.93
(54.95)
z > z o I m X m Z H 1 >
Notes:
1.HTB:
Hypotheticaltaxbaseofassesseesreceivingthe
relief.
2.Figures
inparenthesesareth
eef
fect
ivetaxra
tesre
sult
ingfrom
thediminution
inth
etaxba
se.
72 FISCAL INCENTIVES AND CORPORATE TAX SAVING
figures are far from complete. The apparent incompleteness ofthe AIITS figures emphasises the need for the collection andpublication of more comprehensive data.
A study sponsored by the Dandekar Committee and under
taken by the Indian Institute of Management, Ahmedabad,estimated tax holiday for 95 corporate assessees at Rs 10.7
crore in 1977-78 and Rs 15.1 crore in 1978-79 and investment
allowance at Rs 12.2 crore and Rs 20.5 crore, respectively.19The per assessee tax holiday in this study works out to Rs 0.11
crore in 1977-78 and Rs 0.16 crore in 1978-79 and the per
assessee investment allowance to Rs 0.13 crore and Rs 0.22
crore, respectively. Our average annual per assessee estimates
are found to be comparable: Rs 0.12 crore for tax holiday andRs 0.23 crore for development rebate/investment allowance onthe basis of data of 108 assessees.
d. Export market development allowance. The most impor
tant among the other eight individual fiscal reliefs which werestudied is the export market development allowance, which is inthe form of a weighted deduction. This relief is found to bethird in order of importance for the assessees studied, accounting for 6 2 per cent of the total fiscal reliefs in the seven assessment years (Table V.4).
The diminution in the hypothetical tax base of the 108 assessees taken together, because of the export market development
allowance was found to be 1.2 per cent and the tax rate (effective) would be reduced from 57.2 per cent to 56.6 per centowing to this relief alone. If, however, an analysis is made of
only the assessees taking advantage of this relief, which is moreappropnate, the magnitude of the tax base diminution effect,assuming no other reliefs were claimed, would be 2.0 per cent
and the effective tax rate would have been 56.1 per cent (Table
e. Income-Jinked reliefs. Among the income-linked reliefsdividends received from new industrial undertakings, hotels',etc. account for 3.4 per cent of the total fiscal reliefs that theassessees received during the seven-year period, deductions of
19. Expert Committee on Tax Measures to Promote Employment(Dandekar Committee, 1980), Report, p. 32.
ANALYSIS OF INCOME TAX ASSESSMENT DATA 73
selected inter-corporate dividends account for another 1.7 per
cent and deductions for royalties, fees, etc. received from selected
foreign enterprises, 0.2 per cent. Together, these three fiscal
reliefs generated from preferential tax treatment to corporate
income from specific sources, not directly related to their manu
facturing operations, would reduce the hypothetical tax base by
1.0 per cent (Table V.4).
/. Backward area relief. Backward area relief was claimed
by only four assessees studied because most of the asscssees
did not operate in backward areas. Over the seven-year
period, this relief cumulatively accounted for only 1.0 per cent
of the total reliefs claimed by the assessees studied (Table V.4).
If we consider only the assessees receiving the backward
area relief, it is found that the tax base diminution effect is
3.9 per cent and the effective tax rate would be reduced to
55.0 per cent owing to this relief alone (Table V.5).
g. Deductionsfor scientific research. The contribution of the
relief available through deduction of expenditure on scientific
research amounted to 2.4 per cent of all fiscal reliefs claimed by
the assessees during the seven-year period. As much as 51.9 per
cent of the 108 assessees whose assessment data were
studied had undertaken expenditure which enable them to claim
this relief, and among them 8.3 per cent of the assessees availed
of the relief in all the seven assessment years (Tables V.5 and
V.6).
h. Other reliefs. Priority industry relief was an important
relief, accounting for between 4.4 per cent and 10.7 per cent of
all the reliefs received from 1970-71 to 1972-73, when it was
operative. More than one-sixth of the assessees studied received
this relief in all the three assessment years.
Deduction of donations to charitable institutions was claimed
by one-sixth of the total assessees in each of the seven assess
ment years, one-tenth in six years and one-fifth in four or five
years. The total amount of the relief, during the seven-year
period, accounts for 0.8 per cent of the total fiscal reliefs claimed
by the 108 assessees.
Disaggregated annual data on each of the ten fiscal reliefs
for different categories of assessees are presented in Table A.5.
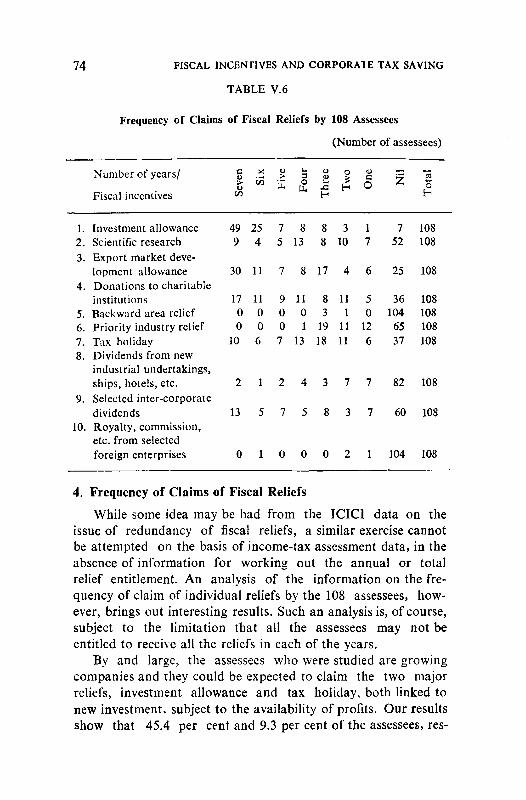
74 FISCAL INCENTIVES AND CORPORATE TAX SAVING
TABLE V.6
Frequency of Claims of Fiscal Reliefs by 108 Assessees
(Number of assessees)
Number of years/
Fiscal incentives
1. Investment allowance
2. Scientific research
3. Export market deve
lopment allowance
4. Donations to charitable
institutions
5. Backward area relief
6. Priority industry relief
7. Tax holiday
8. Dividends from new
industrial undertakings,
ships, hotels, etc.
9. Selected inter-corporate
dividends
10. Royalty, commission,
etc. from selected
foreign enterprises
even49
9
30
17
0
0
10
2
13
0
Six25
4
11
11
0
0
6
1
5
1
Five7579
0
0
7
2
7
0
Four8
13
8
11
0
1
13
4
5
0
hreeH
8
8
17
8
3
19
18
3
8
0
Two3
10
4
11
1
11
11
7
3
2
One1
7
6
5
0
12
6
7
7
1
Nil7
52
25
36
104
65
37
82
60
104
'otalf
108
108
108
108
108
108
108
108
108
108
4. Frequency of Claims of Fiscal Reliefs
While some idea may be had from the ICIC1 data on the
issue of redundancy of fiscal reliefs, a similar exercise cannot
be attempted on the basis of income-tax assessment data, in the
absence of information for working out the annual or total
relief entitlement. An analysis of the information on the fre
quency of claim of individual reliefs by the 108 assessees, how
ever, brings out interesting results. Such an analysis is, of course,
subject to the limitation that all the assessees may not be
entitled to receive all the reliefs in each of the years.
By and large, the assessees who were studied are growing
companies and they could be expected to claim the two major
reliefs, investment allowance and tax holiday, both linked to
new investment, subject to the availability of profits. Our results
show that 45.4 per cent and 9.3 per cent of the assessees, res-
ANALYSIS OF INCOME TAX ASSESSMENT DATA 75
pectively, received these two reliefs in all the seven years,
another 23.1 per cent and 5.6 per cent, respectively, in six years
and another 6.5 per cent received both the reliefs in five years.
However, as much as 34.3 per cent of the assessees did not
receive tax holiday in any assessment year and 6.5 per cent did
not, similarly, receive investment allowance in any single year.
These findings, while not throwing any light on the issue of
redundancy of the reliefs, however, suggest that all the assessees
did not embark on fresh investment and capital formation acti
vity and of those who did. their new investment programmes
were not productive of sufficient income to benefit from the
entitled reliefs to the maximum extent (Table V.6).
Among the other reliefs, export market development
allowance was received by 27.8 per cent of the assessees in all
the seven assessment years, by 10.2 per cent in six assessment
years and by 6.5 per cent in five assessment years. About one-
fourth of the assessees did not receive this relief in any single
year, either because they did not undertake any relief-generating
activity or because they did not generate enough profits against
which to claim the relief.
5. Fiscal Reliefs, Tax Base Diminution and Tax Savings:
Disaggregated Results
a. Location, capital intensity and industry groups. The extent
of diminution in the tax base as a result of fiscal reliefs varies
among the different categories of assessees. This has already
been noted earlier in this chapter (sub-section 2c) in the analysis
of the 108 assessees distributed by different effective tax rate
brackets. Equally revealing are the results for assessees classi
fied into various groups. While the detailed results are presented
for each assessment year in Tables A.5 and A.6, the salient
findings are presented below :
(i) In all the centres, the effective tax rate is found to be
lower than the average statutory tax rate but the tax
base diminution effect of the fiscal reliefs is found
to be the most pronounced in the case of Bombay
assessees and the least in the case of Calcutta
assessees. The low impact of fiscal reliefs in the case of
Calcutta assessees is linked to the low capital formation
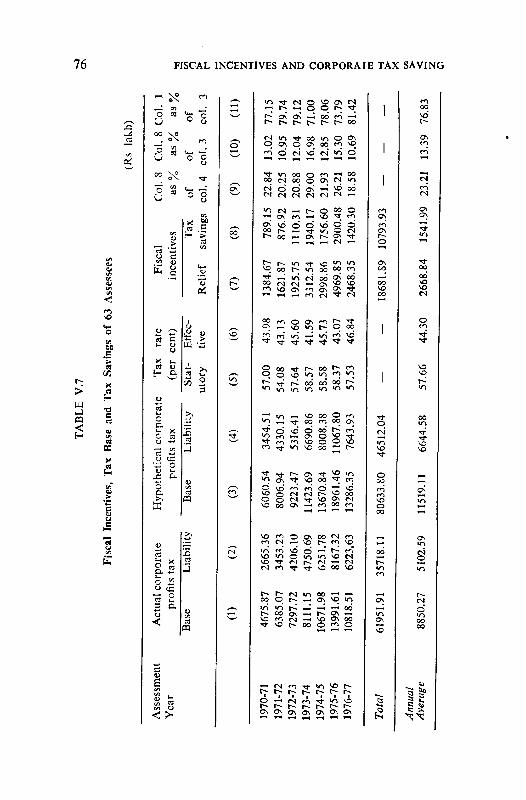
TABLE
V.7
Fiscal
Incentives,Tax
Base
andTax
Savings
of63
Assessees
(Rs
lakh)
Assessment
Year
1970-71
1971-72
1972-73
1973-74
1974-75
1975-76
1976-77
Total
Annual
Average
Actualcorporate
profitstax
Base
(1)
4675.87
6385.07
7297.72
8111.15
10671.98
13991.61
10818.51
61951.91
8850.27
Liability
(2)
2665.36
3453.23
4206.10
4750.69
6251.78
8167.32
6223.63
35718.11
5102.59
Hypotheticalcorporate
profitstax
Base
(3)
6060.54
8006.94
9223.47
11423.69
13670.84
18961.46
13286.35
80633.80
11519.11
Liability
(4)
3454.51
4330.15
5316.41
6690.86
8008.38
11067.80
7643.93
46512.04
6644.58
Tax
(per
Stat
utory
(5)
57.00
54.08
57.64
58.57
58.58
58.37
57.53
—
57.66
rate
cent)
Effec
tive
(6)
43.98
43.13
45.60
41.59
45.73
43.07
46.84
—
44.30
Fiscal
incentives
Relief
(7)
1384.67
1621.87
1925.75
3312.54
2998.86
4969.85
2468.35
18681.89
2668.84
Tax
savings
(8)
789.15
876.92
1110.31
1940.17
1756.60
2900.48
1420.30
10793.93
1541.99
Col.
8
of
col.4
(9)
22.84
20.25
20.88
29.00
21.93
26.21
18.58
—
23.21
Col.
8
as%
of
col.
3
(10)
13.02
10.95
12.04
16.98
12.85
15.30
10.69
—
13.39
Col.
1
as%
of
col.
3
(ID
77.15
79.74
79.12
71.00
78.06
73.79
81.42
—
76.83
C/J
o r1 NCEN1tn
Z r-i
n o 50
*Q )RAIra
H > ><<
oo VING
ANALYSIS OF INCOME TAX ASSESSMENT DATA 77
of the Calcutta companies, as compared to those
assessed elsewhere. To some extent the effect may also
be due to inadequate generation of profits from existing
as well as newly undertaken projects. Data on invest
ment allowance, which is the only fiscal relief to be
directly linked to additional capital formation, provides
evidence on the slow-down in capital formation activity
of the Calcutta companies.
(ii) The maximum benefit of fiscal incentives is obtained by
assessees engaged in highly capital-intensive industries
and there seems to be a direct relationship between the
level of capital intensity of an assessee's operations and
the tax base diminution effect of the fiscal incentives.
As such, therefore, the effective tax rate was found to be
inversely related to the capital intensity of the assessee's
operations.
(iii) Among the broad industry groups under which the
assessees were classified, the tax base diminution effect
of fiscal incentives is the highest in engineering industry,
followed by textiles, highly diversified industry and
chemicals.
b. Analysis of 63 assessees. Out of the 108 assessees included
in the study, data were estimated for one or more years for
41.7 per cent of them to complete the seven-year series; actual
data were thus available for the seven assessment years for 63
assessees (58.3 per cent). The analysis was made of these 63
assessees to see whether there was any marked difference in the
diminution of the corporate tax base and in tax liability and tax
savings of such assessees for whom all data were actuals as com
pared to assessees including those for whom some data were
estimated.
The impact of fiscal reliefs is found to be more pronounced
for assessees for whom all data are actuals than for the sample
as a whole, which includes assessees for whom some data are
estimated. The diminution in the tax base for the former group
of assessees is higher at 23.2 per cent as compared to 19.4 per
cent for the latter. This results in a lower average annual effec
tive tax rate in their case: 44.3 per cent as compared to 46.2 per
cent (Table V.7).
78 FISCAL INCENTIVES AND CORPORATE TAX SAVING
It follows from these results that the estimation of fiscal
reliefs for the assessment years for which data were not available
for 45 assessees might have been on the lower side. Alternatively,
these assessees had a relatively smaller assessed income and
assessed tax and they claimed smaller amounts of fiscal reliefs
either because they were so entitled or because they did not earn
enough profits to claim the whole of their entitlement of the
fiscal reliefs.
VI. The Fiscal Incentive Impact :
Analysis of Ex-Post Company
Finances Data
1. Introduction
The company finances data relate to 223 companies having
a combined paid-up share capital of Rs 873.2 crore in 1975-76;
these companies accounted for 42.2 per cent of the paid-up
capital of all the 7626 non-government public limited companies
and 56.8 per cent of those companies having a paid-up share
capital of Rs 50 lakh or more. Each sample company had a
paid-up share capital of Rs 50 lakh or more in 1975-76. Thetax data, compiled from the Bombay Stock Exchange Directory,
relate to tax provision in the respective financial year and not in
the assessment year.
2. Tax Base Diminution, Effective Tax Rate
and Tax Savings
The 223 NIPFP companies provided for a total corporate tax
liability of Rs 1758.1 crore over the 15-year period, 1961-62 to
1975-76 on an estimated actual corporate tax base of Rs 3202.7
crore. The hypothetical tax base of the sample companies for
the 15-year period is estimated to be Rs 3844.2 crore and theamount of the fiscal reliefs is estimated at Rs 641.5 crore. The
fiscal reliefs would, thus, diminish the hypothetical tax base by
as much as 16.7 per cent, generating corporate tax savings ofRs 352.7 crore. These tax savings would form 9.2 per cent of
the hypothetical tax base (Table VI. 1).As a result of the diminution in the hypothetical tax base,
the actual tax base of the NIPFP companies would on theaverage be only 83.3 per cent of it. The effective tax rate would
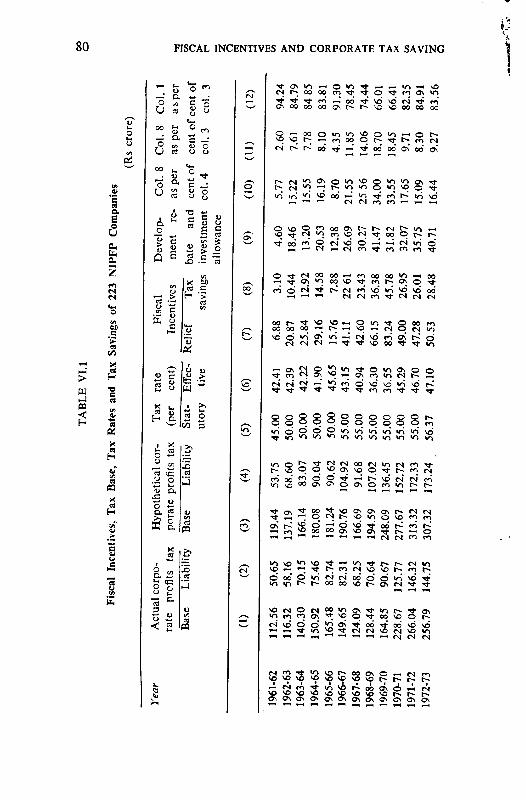
80 FISCAL INCENTIVES AND CORPORATE TAX SAVING
a,
6
*
o
U
00
—"
1/2
C3
t-.
O
O.
c^
w
C<u
o
o
"c
o
o
m
o_9
a.
Q
5 « oa a c
S S o
I X
S 2
y o
1 £
s E.
I 2< 2
« * od x o\ »' o\
i^ioooo>H^Ttcnr<ovd»-i'-1'-1 CS M M n « m i-i
^OOM^NvOO-<HNiflO
(*^ «^j« fsi oo oo ^h f/^ oo oo 'o ^^ ooi ^^ Os *n oo vo ^^ d f^ O^ ^^ ^^
r-i*"11"1 N (N M ^ N N (N
SO O ""* ^ *^ ^H ^N vo f*% O\ t** ©
e!odM0®*"''1'VDNNf»i
Nvo6 6l0o!*M<t(icvovd««^inVO^NNVONV010^i-i«-i!"-i'""l'-"-*'-i»-itNCvlCS
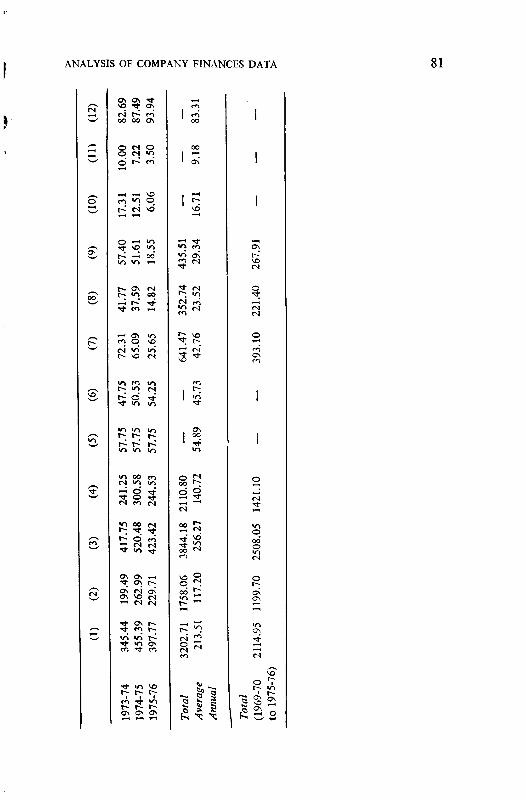
ANALYSIS OF COMPANY FINANCES DATA 81
© <s o© C*! *O
o•«r
t~
en
NO
«n
ON
ONq
\o
oo'
oo
«oVO_
>o"
3
On
«N
a
VO
rn
Is-" © Tfr"
on rs onOn NO <n« C-4 (S
t r r
ro ■>:}• <Ar- r~- t>-On On On
3a
NO
o T
— pn E:8
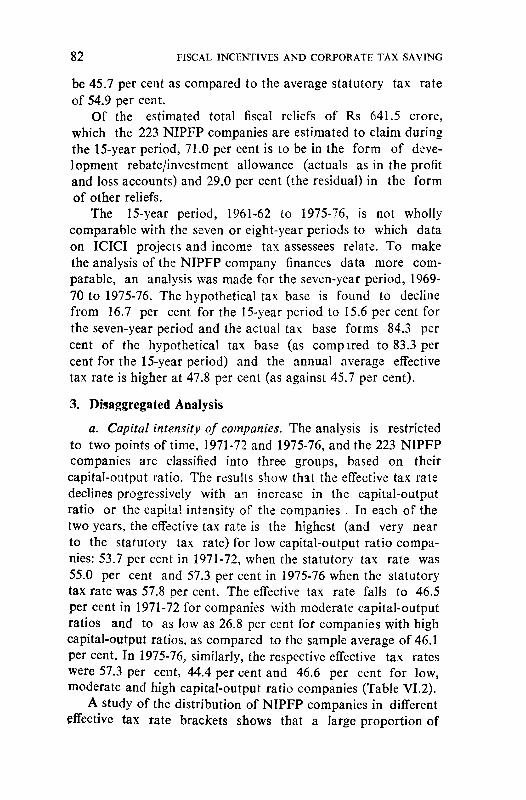
82 FISCAL INCENTIVES AND CORPORATE TAX SAVTNG
be 45.7 per cent as compared to the average statutory tax rate
of 54.9 per cent.
Of the estimated total fiscal reliefs of Rs 641.5 crore,
which the 223 NIPFP companies are estimated to claim during
the 15-year period, 71.0 per cent is to be in the form of deve
lopment rebate/investment allowance (actuals as in the profit
and loss accounts) and 29.0 per cent (the residual) in the form
of other reliefs.
The 15-year period, 1961-62 to 1975-76, is not wholly
comparable with the seven or eight-year periods to which data
on ICICI projects and income tax assessees relate. To make
the analysis of the NIPFP company finances data more com
parable, an analysis was made for the seven-year period, 1969-
70 to 1975-76. The hypothetical tax base is found to decline
from 16.7 per cent for the 15-year period to 15.6 per cent for
the seven-year period and the actual tax base forms 84.3 per
cent of the hypothetical tax base (as compired to 83.3 per
cent for the 15-year period) and the annual average effective
tax rate is higher at 47.8 per cent (as against 45.7 per cent).
3. Disaggregated Analysis
a. Capital intensity of companies. The analysis is restricted
to two points of time, 1971-72 and 1975-76, and the 223 NIPFP
companies are classified into three groups, based on their
capital-output ratio. The results show that the effective tax rate
declines progressively with an increase in the capital-output
ratio or the capita! intensity of the companies . In each of the
two years, the effective tax rate is the highest (and very near
to the statutory tax rate) for low capital-output ratio compa
nies: 53.7 per cent in 1971-72, when the statutory tax rate was
55.0 per cent and 57.3 per cent in 1975-76 when the statutory
tax rate was 57.8 per cent. The effective tax rate falls to 46.5
per cent in 1971-72 for companies with moderate capital-output
ratios and to as low as 26.8 per cent for companies with high
capital-output ratios, as compared to the sample average of 46.1
per cent. In 1975-76, similarly, the respective effective tax rates
were 57.3 per cent, 44.4 per cent and 46.6 per cent for low,
moderate and high capital-output ratio companies (Table VI.2).
A study of the distribution of NIPFP companies in different
effective tax rate brackets shows that a large proportion of
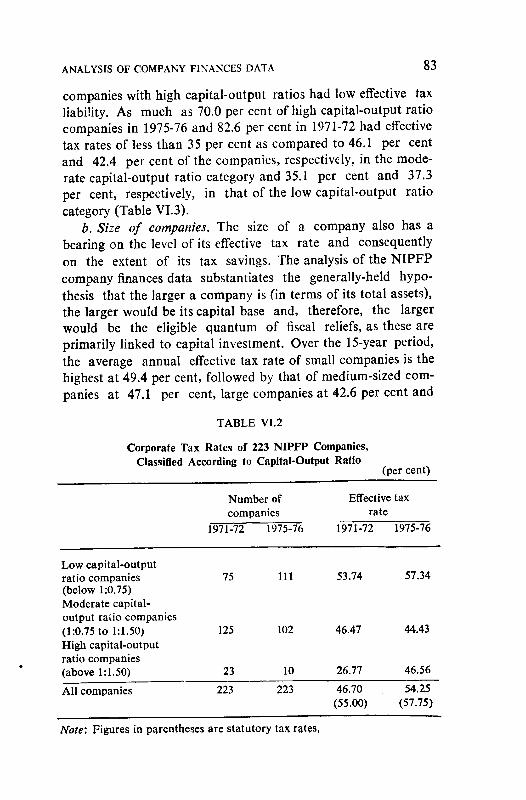
ANALYSIS OF COMPANY FINANCES DATA 83
companies with high capital-output ratios had low effective tax
liability. As much as 70.0 per cent of high capital-output ratio
companies in 1975-76 and 82.6 per cent in 1971-72 had effective
tax rates of less than 35 per cent as compared to 46.1 per cent
and 42.4 per cent of the companies, respectively, in the mode
rate capital-output ratio category and 35.1 per cent and 37.3
per cent, respectively, in that of the low capital-output ratio
category (Table VI.3).
b. Size of companies. The size of a company also has a
bearing on the level of its effective tax rate and consequently
on the extent of its tax savings. The analysis of the NIPFP
company finances data substantiates the generally-held hypo
thesis that the larger a company is (in terms of its total assets),
the larger would be its capital base and, therefore, the larger
would be the eligible quantum of fiscal reliefs, as these are
primarily linked to capital investment. Over the 15-year period,
the average annual effective tax rate of small companies is the
highest at 49.4 per cent, followed by that of medium-sized com
panies at 47.1 per cent, large companies at 42.6 per cent and
TABLE VI.2
Corporate Tax Rates of 223 NIPFP Companies,
Classified According to Capital-Output Ratio(per cent)
Low capital-output
ratio companies
(below 1:0.75)
Moderate capital-
output ratio companies
(1:0.75 to 1:1.50)
High capital-output
ratio companies
(above 1:1.50)
All companies
Number of
companies
1971-72 1975-76
75 111
125 102
23 10
223 223
Effective tax
rate
1971-72
53.74
46.47
26.77
46.70
(55.00)
1975-76
57.34
44.43
46.56
54.25
(57.75)
Note'. Figures in parentheses are statutory tax rates,
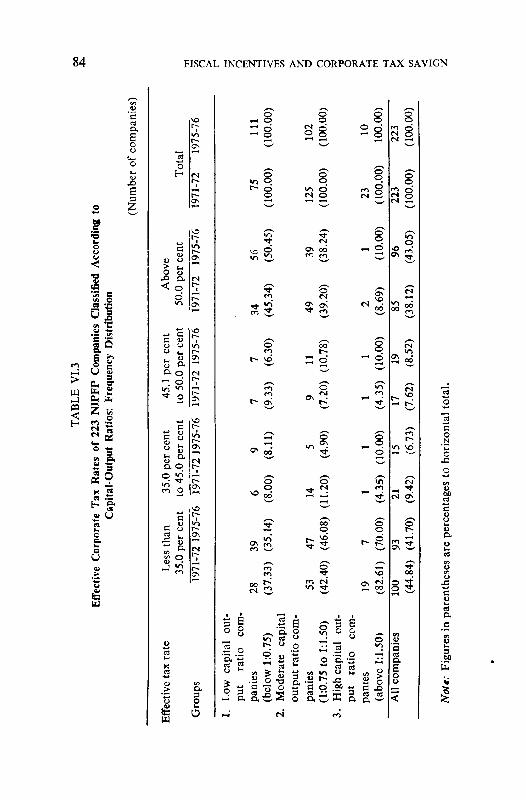
TABLE
VI.3
EffectiveCorporateTax
Rates
of223NIPFP
Companies
ClassifiedAccording
to
Capital-Output
Ratios:
Frequency
Distribution
(Number
ofcompanies)
Effectivetaxrate
Groups
1.Low
capital
out
put
ratio
com
panies
(below
1:0.75)
2.Moderate
capital
outputratiocom
panies
(1:0.75to
1:1.50)
3.High
capital
out
put
ratio
com
panies
(above
1:1.50)
AHcompanies
Lessthan
35.0percent
35.0percent
to45.0percent
1971-72
1975-76
1971-721975-76
28
39
(37.33)
(35.14)
53
47
(42.40)
(46.08)
19
7
(82.61)
(70.00)
100
93
(44.84)
(41.70)
6
(8.00)
14
(11.20)
1
(4.35)
21
(9.42)
9
(8.1
1)
5
(4.90)
1
(10.00)
15 (6.73)
45.1per
cent
to50.0percent
1971-72
1975-76
7
(9.33)
9
(7.20)
1
(4.35)
17
(7.62)
7 (6.30)
11
(10.78)
1
(10.00)
19
(8.52)
Above
50.0percent
1971-72
34
(45.34)
49
(39.20)
2
(8.69)
85
(38.12)
1975-76
56
(50.45)
39
(38.24)
1
(10.00)
96
(43.05)
Total
1971-72
75
(100.00)
125
(100.00)
23
(100.00)
223
(100.00)
1975-76
111
(100.00)
102
(100.00)
10
100.00)
223
(100.00)
> o ra
2!H < m > a o o -a
> H tn
H > X in
>
Note:
Figuresinparenthesesarepercentagestohorizontal
tota
l.
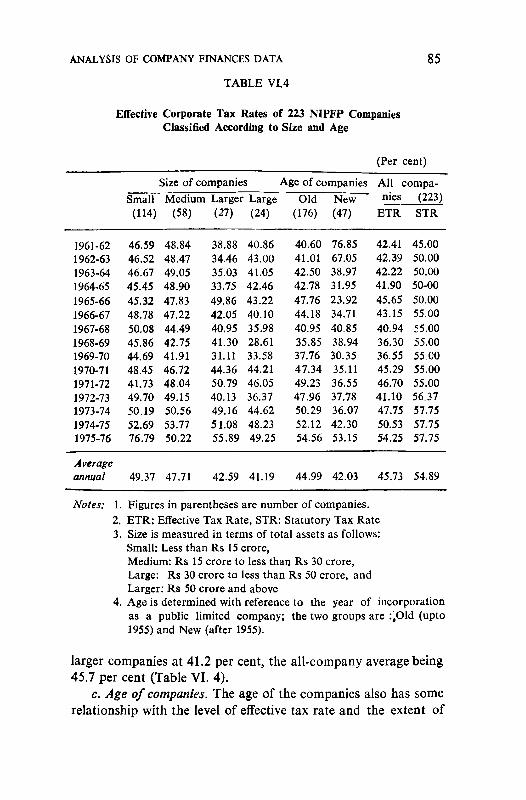
ANALYSIS OF COMPANY FINANCES DATA
TABLE VI.4
Effective Corporate Tax Rates of 223 NIPFP Companies
Classified According to Size and Age
85
(Per cent)
1961-62
1962-63
1963-64
1964-65
1965-66
1966-67
1967-68
1968-69
1969-70
1970-71
1971-72
1972-73
1973-74
1974-75
1975-76
Average
annual
Small
(114)
46.59
46.52
46.67
45.45
45.32
48.78
50.08
45.86
44.69
48.45
41.73
49.70
50.19
52.69
76.79
49.37
Size of companies
Medium
(58)
48.84
48.47
49.05
48.90
47.83
47.22
44.49
42.75
41.91
46.72
48.04
49.15
50.56
53.77
50.22
47.71
Larger
(27)
38.88
34.46
35.03
33.75
49.86
42.05
40.95
41.30
31.11
44.36
50.79
40.13
49.16
51.08
55.89
42.59
i
Large
(24)
40.86
43.00
41.05
42.46
43.22
40.10
35.98
28.61
33.58
44.21
46.05
36.37
44.62
48.23
49.25
41.19
Age of companies
Old
(176)
40.60
41.01
42.50
42.78
47.76
44.18
40.95
35.85
37.76
47.34
49.23
47.96
50.29
52.12
54.56
44.99
New
(47)
76.85
67.05
38.97
31.95
23.92
34.71
40.85
38.94
30.35
35.11
36.55
37.78
36.07
42.30
53.15
42.03
All compa
nies
ETR
42.41
42.39
42.22
41.90
45.65
43.15
40.94
36.30
36.55
45.29
46.70
41.10
47.75
50.53
54.25
45.73
(223)
STR
45.00
50.00
50.00
50-00
50.00
55.00
55.00
55.00
55.00
55.00
55.00
56.37
57.75
57.75
57.75
54.89
Notes: 1. Figures in parentheses are number of companies.
2. ETR: Effective Tax Rate, STR: Statutory Tax Rate
3. Size is measured in terms of total assets as follows:
Small: Less than Rs 15 crore,
Medium: Rs 15 crore to less than Rs 30 crore,
Large: Rs 30 crore to less than Rs 50 crore, and
Larger: Rs 50 crore and above
4. Age is determined with reference to the year of incorporation
as a public limited company; the two groups are ^Old (upto
1955) and New (after 1955).
larger companies at 41.2 per cent, the all-company average being
45.7 per cent (Table VI. 4).
c. Age of companies. The age of the companies also has some
relationship with the level of effective tax rate and the extent of
86 FISCAL INCENTIVES AND CORPORATE TAX SAVING
tax savings. By and large, the older companies have few expan
sion programmes. Conversely, new companies with their various
expansion programmes have a lower effective tax liability as
fiscal reliefs are generally linked to fresh investments. Further, in
the case of the fiscal reliefs that are available upto a specific
period, the incentives are more important for new companies.
Thus, we find that among the NIPFP companies, those esta
blished before 1956 averaged an annual effective tax rate of
45.0 per cent, while those established between 1956 and 1961,
averaged 42.0 per cent (Table VI.4).
Annexure I
SELECT BIBLIOGRAPHY
Bagchi, A., (1980), "Is New Tax Holiday Less Beneficial to
Industry?", 15 Economic and Political Weekly, (July 26),
1271.
Bhoothalingam, S., (1967), Final Report on Rationalisation
and Simplification of the Tax Structure, Ministry of Finance,
Government of India, New Delhi.
Bird, Richard M., (1980), Tax Incentives for Investment: The
State of the Art, Canadian Tax Foundation, Toronto.
Boadway, Robin (1978), "Investment Incentives, Corporate
Taxation, and Efficiency in the Allocation of Capital", 88
Economic Journal, 470.
Bracewell-Milnes, Barry, and J.C.L. Huiskamp, (1977) Invest
ment Incentives: A Comparative Analysis of the Systems in
the EEC, the USA and Sweden, Deventer: Kluwer.
Chen-Young, Paul, L. (1967), "A Study of Tax Incentives in
Jamaica", 20 National Tax Journal, 292.
Choksi, C.C., (1978), Direct Tax Laws Committee, Final Report,
Government of India, Ministry of Finance, New Delhi.
Commission of the European Communities (1975), Tax Policy
and Investment in the European Communities, Studies Taxa
tion Series No. 1, Brussels.
Dandekar, V.M. (1980), Expert Committee on Tax Measures to
Promote Employment, Report, Ministry of Finance, Govern
ment of India, New Delhi.
Eisner, Robert (1973), "Incentives for Investment", 26 National
Tax Journal, 397.
Eisner, Robert, and Patrick J. Lawler (1975), "Tax Policy and
Investment; An Analysis of Survey Responses", 65 American
Economic Review, 206.
Fromm, G. ed. (1971), Tax Incentives and Capital Spending, The
Brookings Institution, Washington.
88 FISCAL INCENTIVES AND CORPORATE TAX SAVING
Gandhi, Vcd P., (1968), 'The Incidence of Company Tax in
India'; "Suggested Hypothesis", Artha Vijnana, (March)
110.
Gill, D., (1980), Increasing the Flow of Financial Savings Into
Equities: Fiscal Policies and other Issues (mimeo), Inter
national Finance Corporation, Washington, D.C.
Hall, R., and D. Jorgenson, (1967), "Tax Policy and Investment
Behaviour", 57 American Economic Review, 391.
Heller, Jack, and Kenneth M. Kauffman (1963), Tax Incentives
for Industry in Less Developed Countries, International Tax
Program, Harvard Law School, Cambridge, Mass.
International Bureau of Fiscal Documentation (Loose Leaf
Service),
(i) The Taxation of Companies in Europe,
(ii) Corporation Taxation in Latin America,
(iii) Taxes and Investment in the Middle East,
(iv) Taxes and Investment in Asia and the Pacific, Inter
national Bureau of Fiscal Documentation, Amsterdam.
Jhaveri, N.J. (1973), ''Development Rebate and its Alternatives",
8 Economic and Political Weekly, (February 24) 443.
Kaldor, Nicholas, (1956), Indian Tux Reform: Report ofa Survey,
Ministry of Finance, Government of India, New Delhi.
Kapoor, J.S. (1980), "Tax Incentives", 3 Taxation, (February)
61.
King, M.A. (1977), Public Policy and the Corporation, Chapman
and Hall, London.
Krishnamurty, K. and D.U. Sastry (1975), Investment and Finan
cing in the Corporate Sector in India, Tata McGraw Hill
Publishing Co. Ltd., New Delhi,
Khadye, I. K. (1981), "The Responsiveness of Tax Revenues to
National Income in India 1960-61 to 1978-79, Reserve Bank/
Occasional Papers (June), 21.
Lall, Vinay D. (1967),"Tax Saving Eflect of Development Rebate:
An estimate", 2 Economic and Political Weekly, (April) 651.
, (1967), "Shifting of Tax by Companies", Economic and
Political Weekly, No. 18 (May).
, (1974),"Corporate Taxation", The Economic Times Annual,
Times of India Press, Bombay.
, (1979). "Fiscal Reliefs, Corporate Saving and Investment,"
SELECT BIBLIOGRAPHY 89
12 Margin, (October), 58. •
Lall, Vinay D., Srinivasa Madhur and K.K. Atri (1982),
Resource Mobilisation in the Private Corporate Sector, NIPFP,
New Delhi.
Laumas, Gurcharan, S. (1966), "The Shifting of the Corpora
tion Income Tax—A Study With Reference to Indian
Companies", Public Finance, 462.
Lent, G.E., (1967). "Tax Incentives for Investment in Develop
ing Countries," 14 IMF StaffPapers, 249.
Lent, G.E. (1971), "Tax Incentives for the Promotion of Indus
trial Employment in Developing Countries", 18, IMF Staff
Papers, 339.
NCAER, (1976), Tax Incentives and their Effects on Investment,
(mimeo), NCAER, New Delhi.
Rao, V.G., and Rao, K.S.H. (1975), "The Corporate Income
Tax and Corporate Debt Policy", Indian Economic Review, 1.
Rao, V.G., (1979), The Responsiveness of the Indian Tax
System 1960-61 to 1973-74. Allied Publishers Private Ltd.
Bombay.
Rao, V. G., (1980), Corporation Income Tax in India 1950-1965,
Concept Publishing Co., New Delhi.
Sahota, G.S. (1961), Indian Tax Structure and Economic
Development, Allied Publishers Private Ltd., New Delhi.
Somayajulu, V.V.N., (1977), "Tax Incentives and Investment
Behaviour in Indian Industries, 1965-66 through 1970-71
—An Economic Analysis", 9 Margin, 31.
Sumner M.T. (1973), "Investment and Corporate Taxation",
81, Journal of Political Economy, 982.
Swamy, Dalip, S., and Rao, V.G. (1975), 'The Flow of Funds
in Indian Manufacturing Sector', Sankhya, Vol. 37, Series
C, Part 4, 185.
Tideman, T.N. (1978), "Integration and Investment Incentives",
in 1978 Compendium of Tax Research, p. 285, Office of Tax
Analysis, U.S. Department of the Treasury, Washington,
D.C.
Usher, Dan (1977), "The Economics of Tax Incentives to
Encourage Investment in Less Developed Countries", 4
Journal of Development Economics, 119.
Venkatachalam, T.R. and Sarma, Y.S.R. (1978), "'An Econo-

90 FISCAL INCENTIVES AND CORPORATE TAX SAVING
metric Analysis of Financial Behaviour of the Private
Corporate Sector in India', Reserve Bank Staff Occasional
Papers (December), 69.
Wall, P. (1980), Tax Policies and Equity Markets in Selected
Countries: Some brief case studies (mimeo), International
Finance Corporation, Washington, D.C.
Wanchoo, K.N., (1971), Direct Taxes Enquiry Committee: Final
Report, Ministry of Finance, Government of India.
Woo, Sik Kee, (1976), Review of Tax Incentives in Selected
Asian Countries, (mimeo), The World Bank, Washington.
Annexure 11
STATISTICAL TABLES
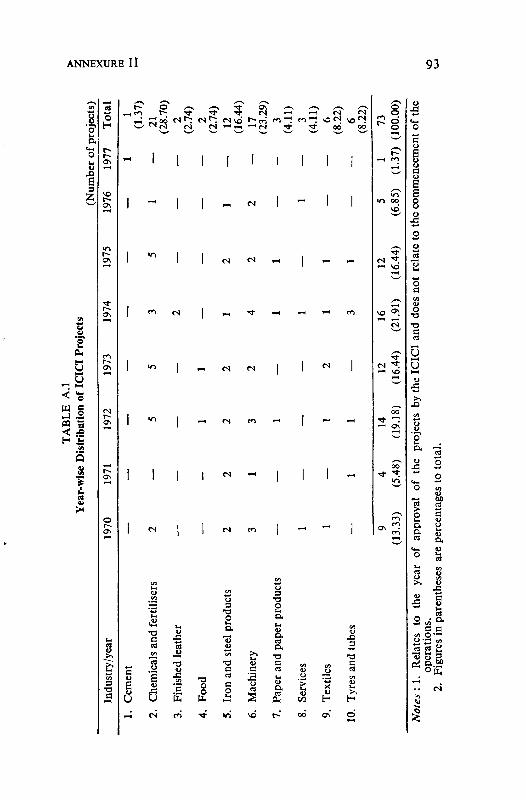
Industry/year
1.Cement
2.Chemicalsand
fertilisers
3.Finishedleather
4.Food
5.Ironand
steelproducts
6.Machinery
7.Paperandpaperproducts
8.Services
9.Textiles
10.
Tyresandtubes
TABLE
A.I
Year-wiseDistributionofICICIProjects
1970
2
—
—
2 3
—
1 1
—
9
(13.33)
1971
—
_
2 1
—
1 4
(5.48)
1972
5
—
1 2 3 1 1 1
14
(19.18)
1973
5
—
1 2 2
—
2
— 12
(16.44)
1974
3 2
—
1 4 1 1 1 3
16
(21.91)
1975
—
5
—
— 2 2 1 1 1
12
(16.44)
(Numberofprojects)
1976
1
— —
1 2 —
1
— —
5
(6.85)
1977
Total
11
(1.37)
—21
(28.70)
—2
(2.74)
—2
(2.74)
—12
(16.44)
—17
(23.29)
3
(411)
—3
(4.1
1)
—6
(8.22)
—6
(8.22)
173
(1.37)
(100.00)
> z a G ra
Notes:
1.Relates
to
the
year
of
approval
of
the
projectsbytheICICIanddoesnot
relatetothecommencementofthe
operations.
2.Figures
inparentheses
arepercentagesto
total.
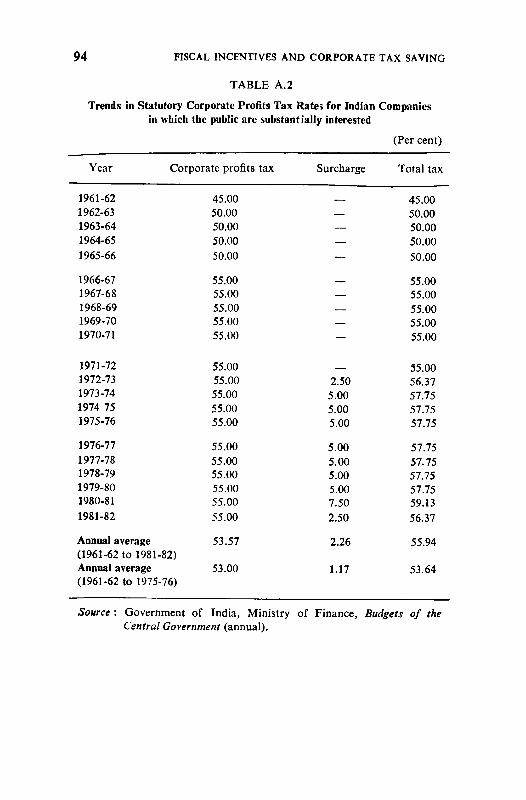
94 FISCAL INCENTIVES AND CORPORATE TAX SAVING
TABLE A.2
Trends in Statutory Corporate Profits Tax Rate? for Indian Companies
in which the public are substantially interested
(Per cent)
Year Corporate profits tax
1961-62
1962-63
1963-64
1964-65
1965-66
1966-67
1967-68
1968-69
1969-70
1970-71
1971-72
1972-73
1973-74
1974 75
1975-76
1976-77
1977-78
1978-79
1979-80
1980-81
1981-82
Annual average
(1961-62 to 1981-82)
Annual average
(1961-62 to 1975-76)
45.00
50.00
50.00
50.00
50.00
55.00
55.00
55.00
55.00
55.00
55.00
55.00
55.00
55.00
55.00
55.00
55.00
55.00
55.00
55.00
55.00
53.57
53.00
Surcharge
—
—
—
—
__
—
—
2.50
5.00
5.00
5.00
5.00
5.00
5.00
5.00
7.50
2.50
2.26
1.17
Total tax
45.00
50.00
50.00
50.00
50.00
55.00
55.00
55.00
55.00
55.00
55.00
56.37
57.75
57.75
57.75
57.75
57.75
57.75
57.75
59.13
56.37
55.94
53.64
Source : Government of India, Ministry of Finance, Budgets of the
Central Government (annual).
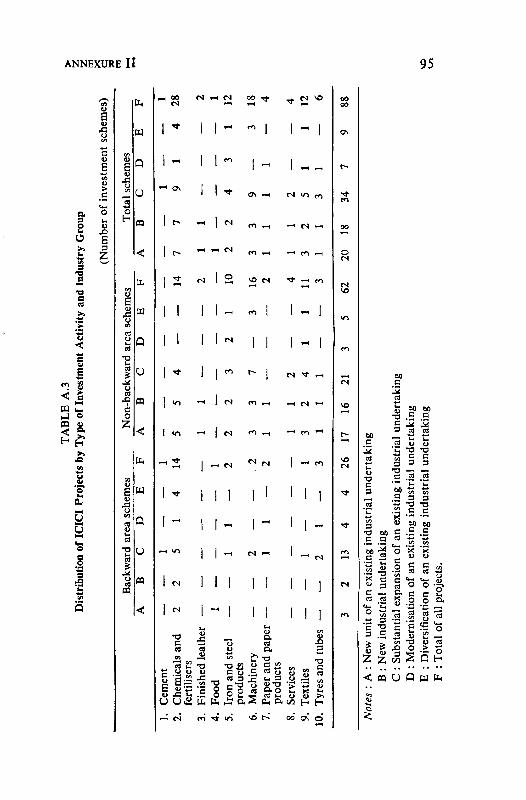
TABLE
A.3
DistributionofICICI
ProjectsbyTypeofInvestment
ActivityandIndustryGroup
A
Backward
BC
areaschemes
DE
F
Non-backward
ABC
areaschemes
DE
F
(Number
ofinvestmentschemes)
Totalschemes
AB
CD
EF
1.Cement
——
1—
—
2.Chemicalsand
22
514
fertilisers
3.Finishedleather—
——
——
4.Food
1—
——
—
5.Ironand
stee
l—
—11
—products
6.Machinery
——
2—
—
7.Paperandpaper—
—1
1—
products
8.Services
——
——
—
9.Textiles
——
1—
—
10.
Tyresand
tubes—
—2
1—
1 14
2 2 2 1 3
— 5 1 2 3 1 1 3 1
—
5 1 2 3 1 1 2 1
4 3 7
— 2 4 1
— 1 3 — 1
—
14 2 — 10
16 2 4
11 3
—
7 1 1 2 3 1 1 3 1
— 7 1
—
2 3 1 1 2 1
1 9
— 4 9 1 2 51
31
1 3
1—
1
28 2 1
12
18 4 4 12 6
13
26
17
16
21
62
20
18
34
88
Notes
:A
:New
unitofan
existingindustrialundertaking
B:New
industrialundertaking
C:Substantialexpansionofan
existingindustrialundertaking
DModernisationofan
existingindustrialundertaking
Diversificationofan
existingindustrialundertaking
Totalof
allprojects.
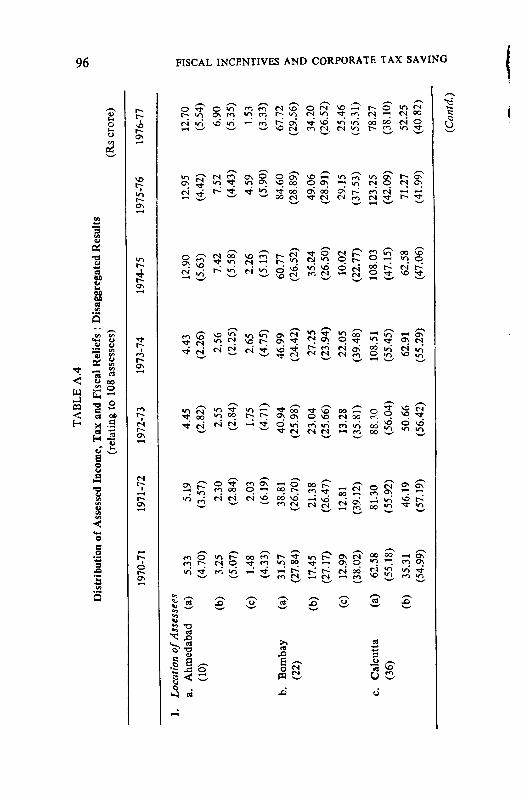
TABLEA
.4
DistributionofAssessedIncome,TaxandFiscalReliefs
:
1.LocationofAssessees
a.Ahmedabad
(10)
b.Bombay
(22)
c.Calcutta
(36)
1(a)
(b)
(c)
(a)
(b)
(c)
(a)
(b)
1970-71
5.33
(4.70)
3.25
(5.07)
1.48
(4.33)
31.57
(27.84)
17.45
{21M)
12.99
(38.02)
62.58
(55.18)
35.31
(54.99)
1971-72
5.19
(3.57)
2.30
(2.84)
2.03
(6.19)
38.81
(26.70)
21.38
(26.47)
12.81
(39.12)
81.30
(55.92)
46.19
(57.19)
(relatingto108
1972-73
4.45
(2.82)
2.55
(2.84)
1.75
(4.71)
40.94
(25.98)
23.04
(25.66)
13.28
(35.81)
88.30
(56.04)
50.66
(56.42)
assessees)
1973-74
4.43
(2.26)
2.56
(2.25)
2.65
(4.75)
46.99
(24.42)
27.25
(23.94)
22.05
(39.48)
108.51
(55.45)
62.91
(55.29)
DisaggregatedResults
1974-75
12.90
(5.63)
7.42
(5.58)
2.26
(5.13)
60.77
(26.52)
35.24
(26.50)
10.02
(22.77)
108.03
(47.15)
62.58
(47.06)
1975-76
12.95
(4.42)
7.52
(4.43)
4.59
(5.90)
84.60
(28.89)
49.06
(28.91)
29.15
(37.53)
123.25
(42.09)
71.27
(41.99)
(Rscrore)
1976-77
12.70
(5.54)
6.90
(5.35)
1.53
(3.33)
67.72
(29.56)
34.20
(26.52)
25.46
(55.31)
78.27
(38.10)
52.25
(40.82)
55 o [—4
o tn
H ra
Z o § 3 70
H rn
H ><
C/3 AVING
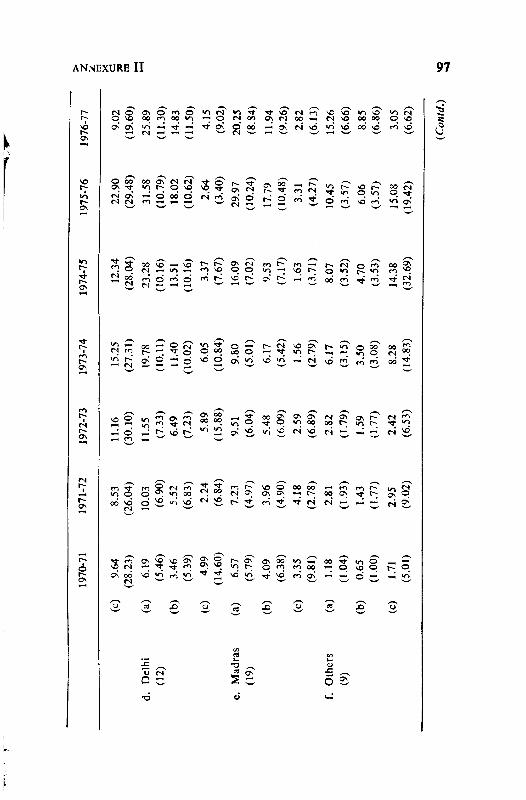
ANNEXURB II 97
on © «*■> © <o«noo w oo in !®
—1 (N -H -H —I
3On O
VO r<0 "O ON
OO io—
CJ 00
« « In o n
- o 2
— «s / S^ oo ^
oo oo - q
""> !° as" vo — « *-> rJ «
oooo -h
■*f<i Onvovoon g;g r-ON onoo m^oo^v^© « ^vi <\j —< -<t -^ en on no "^ r-_ o en en oo — p no O r~ p
On 00 VO* «n. f^ ^, "*" 2 * id * S m> * « —' O -< —' <n
•a
2•a
is
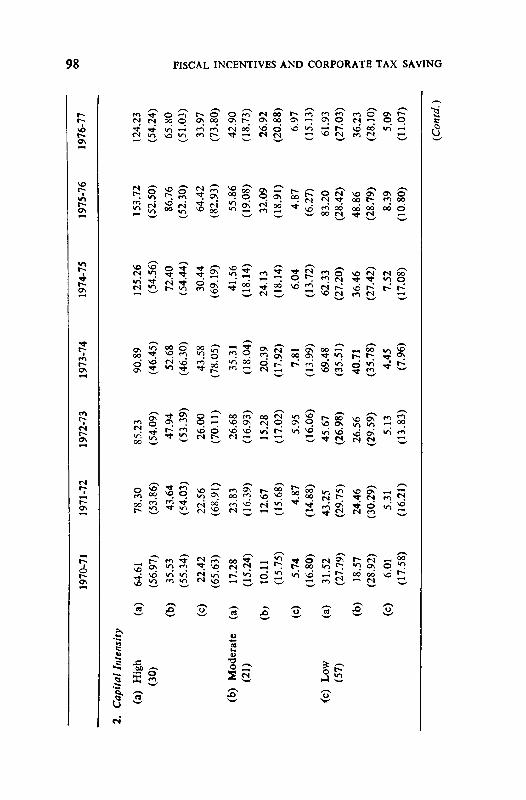
2.CapitalIntensity
(a)
High
(30)
(b)
Moderate
(21)
(c)Low
(57)
(a)
(b)
(c)
(a)
(b;
(c)
(a)
(b)
(c)
1970-71
64.61
(56.97)
35.53
(55.34)
22.42
(65.63)
17.28
(15.24)
10.11
(15.75)
5.74
(16.80)
31.52
(27.79)
18.57
(28.92)
6.01
(17.58)
1971-72
78.30
(53.86)
43.64
(54.03)
22.56
(68.91)
23.83
(16.39)
12.67
(15.68)
4.87
(14.88)
43.25
(29.75)
24.46
(30.29)
5.31
(16.21)
1972-73
85.23
(54.09)
47.94
(53.39)
26.00
(70.11)
26.68
(16.93)
15.28
(17.02)
5.95
(16.06)
45.67
(26.98)
26.56
(29.59)
5.13
(13.83)
1973-74
90.89
(46.45)
52.68
(46.30)
43.58
(78.05)
35.31
(18.04)
20.39
(17.92)
7.81
(13.99)
69.48
(35.51)
40.71
(35.78)
4.45
(7.96)
1974-75
125.26
(54.56)
72.40
(54.44)
30.44
(69.19)
41.56
(18.14)
24.13
(18.14)
6.04
(13.72)
62.33
(27.20)
36.46
(27.42)
7.52
(17.08)
1975-76
153.72
(52.50)
86.76
(52.30)
64.42
(82.93)
55.86
(19.08)
32.09
(18.91)
4.87
(6.27)
83.20
(28.42)
48.86
(28.79)
8.39
(10.80)
1976-77
124.23
(54.24)
65.80
(51.03)
33.97
(73.80)
42.90
(18.73)
26.92
(20.88)
6.97
(15.13)
61.93
(27.03)
36.23
(28.10)
5.09
(11.07)
(Contd.)
oo
1/3
Ii
> o m Z H < m oi
>-
o o o 50 8 50 ^* H ra
^j
> < 3
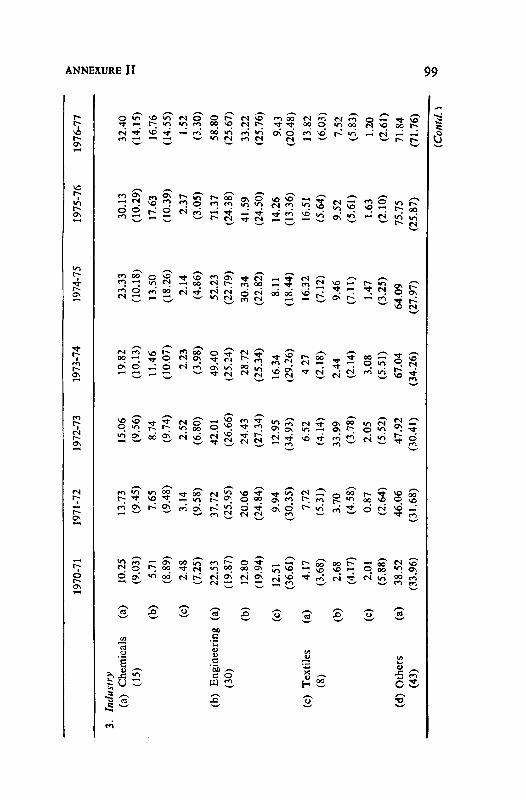
3.Industry
(a)
Chemicals
(15)
(b)
Engineering
(30)
(c)
Textiles
(8)
(d)Others
(43)
(a)
(b)
(c)
(a)
(b)
(c)
(a)
(b)
(c)
(a)
1970-71
10.25
(9.03)
5.71
(8.89)
2.48
(7.25)
22.53
(19.87)
12.80
(19.94)
12.51
(36.61)
4.17
(3.68)
2.68
(4.17)
2.01
(5.88)
38.52
(33.96)
1971-72
13.73
(9.45)
7.65
(9.48)
3.14
(9.58)
37.72
(25.95)
20.06
(24.84)
9.94
(30.35)
7.72
(5.31)
3.70
(4.58)
0.87
(2.64)
46.06
(31.68)
1972-73
15.06
(9.56)
8.74
(9.74)
2.52
(6.80)
42.01
(26.66)
24.43
(27.34)
12.95
(34.93)
6.52
(4.14)
33.99
(3.78)
2.05
(5.52)
47.92
(30.41)
1973-74
19.82
(10.13)
11.46
(10.07)
2.23
(3.98)
49.40
(25.24)
28.72
(25.34)
16.34
(29.26)
427
(2.18)
2.44
(2.14)
3.08
(5.51)
67.04
(34.26)
1974-75
23.33
(10.18)
13.50
(18.26)
2.14
(4.86)
52.23
(22.79)
30.34
(22.82)
8.11
(18.44)
16.32
(7.12)
9.46
(7.11)
1.47
(3.25)
64.09
(27.97)
1975-76
30.13
(10.29)
17.63
(10.39)
2.37
(3.05)
71.37
(24.38)
41.59
(24.50)
14.26
(13.36)
16.51
(5.64)
9.52
(5.61)
1.63
(2.10)
75.75
(25.87)
1976-77
32.40
(14.15)
16.76
(14.55)
1.52
(3.30)
58.80
(25.67)
33.22
(25.76)
9.43
(20.48)
13.82
(6.03)
7.52
(5.83)
1.20
(2.61)
71.84
(71.76)
ANNEXURra
NO
(Contd.
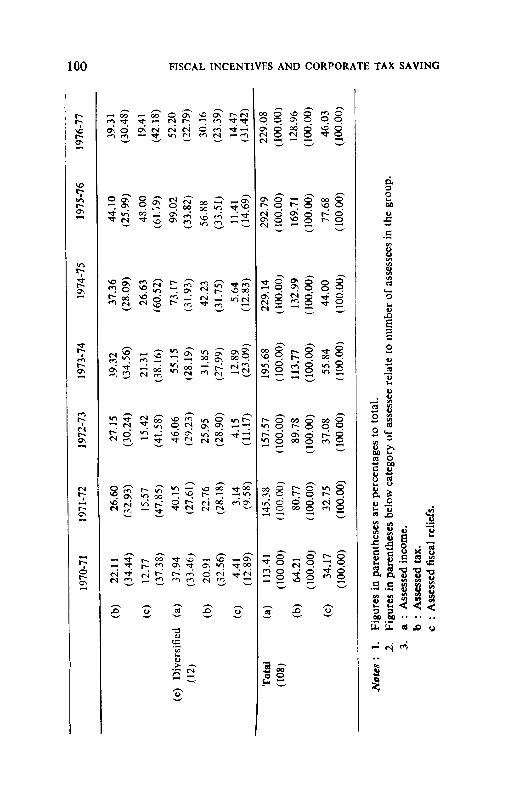
(e)
Diversified
(12)
Total
(108)
(b)
(c)
(a)
(b)
(c)
(a)
(b)
(c)
Notes:
1.Figure
1970-71
22.11
(34.44)
12.77
(37.38)
37.94
(33.46)
20.91
(32.56)
4.41
(12.89)
113.41
(100.00)
64.21
(100.00)
34.17
(100.00)
1971-72
26.60
(32.93)
15.57
(47.85)
40.15
(27.61)
22.76
(28.18)
3.14
(9.58)
145.38
(100.00)
80.77
(100.00)
32.75
(100.00)
1972-73
27.15
(30.24)
15.42
(41.58)
46.06
(29.23)
25.95
(28.90)
4.15
(11.17)
157.57
(100.00)
89.78
(100.00)
37.08
(100.00)
Jinparenthesesarepercentagesto
total.
1973-74
39.32
G4.56)
21.31
(38.16)
55.15
(28.19)
31.85
(27.99)
12.89
(23.09)
195.68
(100.00)
113.77
(100.00)
55.84
(100.00)
1974-75
37.36
(28.09)
26.63
(60.52)
73.17
(31.93)
42.23
(31.75)
5.64
(12.83)
229.14
(100.00)
132.99
(100.00)
44.00
(100.00)
1975-76
44.10
(25.99)
48.00
(61.-/9)
99.02
(33.82)
56.88
(33.51)
11.41
(14.69)
292.79
(100.00)
169.71
(100.00)
77.68
(100.00)
2.
Figures
inparenthesesbelowcategoryofassesseerelatetonumberofassesseesin
thegroup.
3.
a b c:
Assessedincome.
.Assessed
tax.
Assessed
fiscal
reliefs.
1976-77
39.31
(30.48)
19.41
(42.18)
52.20
(22.79)
30.16
(23.39)
14.47
(31.42)
229.08
(100.00)
128.96
(100.00)
46.03
(100.00)
001o >■
r 2 a H ffl
to
> Z o o Q o > ra
H > < 2
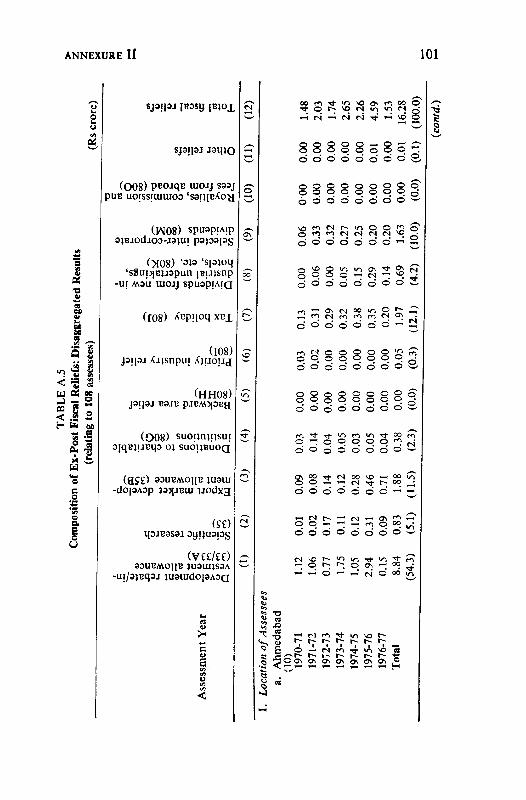
3<a
k-O-
n
00©N>J-1~©—>—
■—^opPppPpP
©o©®©©1^©^1
oppppppp'aoc>ooo'o'o(^©©©©©hJ1^
^PPPP-°P^ k
^oopppppP
pppppppp
P'o'o'<=>oooo^©©o©oo©©o
oooooooo
Developmentrebate/in
vestmentallowance
(33/33A)
Scientificresearch(35)
Exportmarketdevelop
mentallowance(35B)
Donationstocharitableinstitutions(80G)
Backwardarearelief(80HH)
Priorityindustryrelief(801)
Taxholiday(80J)
Dividendsfromnewin
dustrialundertakings,
hotels,etc.(80K)
Selectedinter-corporatedividends(80M)
Royalties,commissionand
feesfromabroad(80O)
Otherreliefs
Totalfiscalreliefs
9
ISIwB«■
«*1Ha5'>
to
Sr
101II
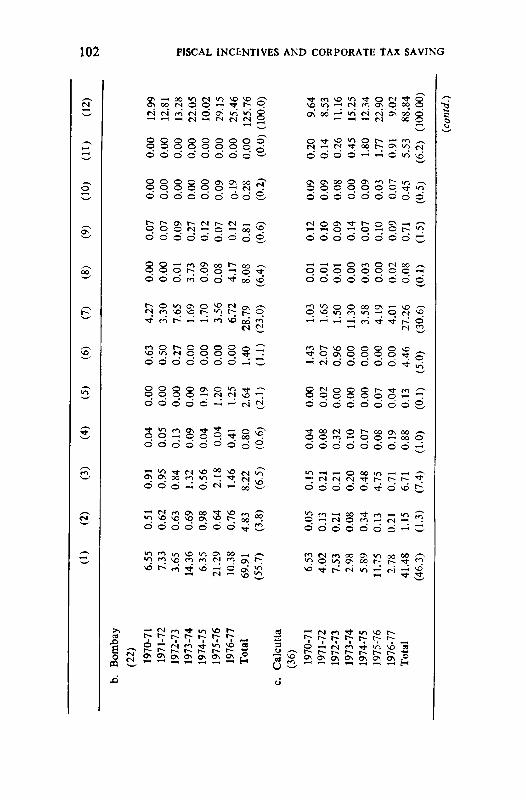
b.Bombay
(22)
1970-71
1971-72
1972-73
1973-74
1974-75
1975-76
1976-77
Total
c.Calcutta
(36)
1970-71
1971-72
1972-73
1973-74
1974-75
1975-76
1976-77
Total
(1)
6.55
7.33
3.65
14.36
6.35
21.29
10.38
69.91
(55.7)
6.53
4.02
7.53
2.98
5.89
11.75
2.78
41.48
(46.3)
(2)
0.51
0.62
0.63
0.69
0.98
0.64
0.76
4.83
(3.8)
0.05
0.13
0.21
0.08
0.34
0.13
0.21
1.15
(1.3)
(3)
0.91
0.95
0.84
1.32
0.56
2.18
1.46
8.22
(6.5)
0.15
0.21
0.21
0.20
0.48
4.75
0.71
6.71
(7.4)
(4)
0.04
0.05
0.13
0.09
0.04
0.04
0.41
0.80
(0.6)
0.04
0.08
0.32
0.10
0.07
0.08
0.19
0.88
(1.0)
(5)
0.00
0.00
0.00
0.00
0.19
1.20
1.25
2.64
(2.1)
0.00
0.02
0.00
0.00
0.00
0.07
0.04
0.13
(0.1)
(6)
0.63
0.50
0.27
0.00
0.00
0.00
0.00
1.40
(1.1)
1.43
2.07
0.96
0.00
0.00
0.00
0.00
4.46
(5.0)
(7)
4.27
3.30
7.65
1.69
1.70
3.56
6.72
28.79
(23.0)
1.03
1.65
1.50
11.30
3.58
4.19
4.01
27.26
(30.6)
(8)
0.00
0.00
0.01
3.73
0.09
0.08
4.17
8.08
(6.4)
0.01
0.01
0.01
0.00
0.03
0.00
0.02
0.08
(0.1
)
(9)
0.07
0.07
0.09
0.27
0.12
0.07
0.12
0.81
(0.6)
0.12
0.10
0.09
0.14
0.07
0.10
0.09
0.71
(1-5
)
(10)
0.00
0.00
0.00
0.00
0.00
0.09
0-19
0.28
(0.2)
0.09
0.09
0.08
0.00
0.09
0.03
0.07
0.45
(0.5)
(11)
0.00
0.00
0.00
0.00
0.00
0.00
0.00
0.00
(0.0)
0.20
0.14
0.26
0.45
1.80
1.77
0.91
5.53
(6.2)
(12)
12.99
12.81
13.28
22.05
10.02
29.15
25.46
125.76
(100.0)
9.64
8.53
11.16
15.25
12.34
22.90
9.02
88.84
(100.00)
1023 CO o > 5? *-*
0 m < C/i
Z O > H tn
> x WING
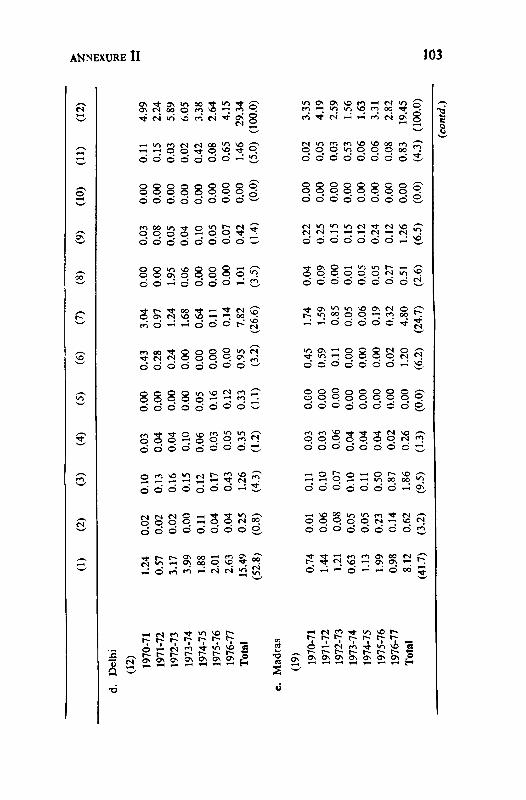
AKNEXURE II 103
"I © © Tt ©
OQOOOOOOO© © © © © q © q o*
o © © © © © o © ^
»q q q q q "°.
i66d^C
oo*
n n
o©
q q
o©qq©^^«^.
©©■©■©■©' d © ©
© © © ^, © q q f*)©'©'©' o' o' ©' o o
©©©ddddo'o.
tc in jo t^
q q o vj q q q oo .
© do do d d © 3-
q q q q © © © © °.ddddddddQ
d d © © © © © —! ^£,
© q q q q © f"* "o ^
ddododdoCi'
d © © © © © © ^ !£,
o©©ooo©©^o q © o © © © q °.©©'©©■© d d d ©,
© © © © © qq n «
© ©'©©© d © © C-
HHOHrtlflOOOO")
q © ©. q © cs ^ vo n
©d©d©d©©J2,
-< N « tt v) « r>r- r- <Y r~ r~- t*» t-
©•—ir^fN^>ovow
^ On On On On On On On -P
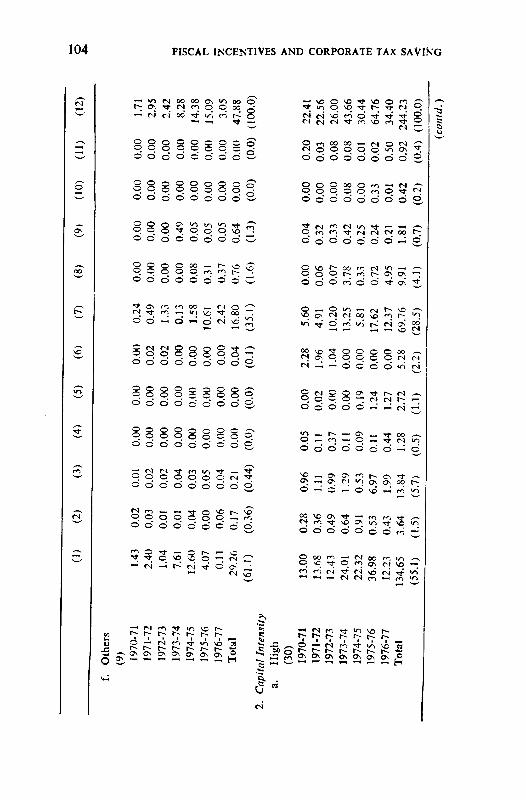
f.Others
(9)
1970-71
1971-72
1972-73
1973-74
1974-75
1975-76
1976-77
Total
2.CapitalIntensity
a.High
(30)
1970-71
1971-72
1972-73
1973-74
1974-75
1975-76
1976-77
Total
(1)
1.43
2.40
1.04
7.61
12.60
4.07
0.11
29.26
(61.1)
13.00
13.68
12.43
24.01
22.32
36.98
12.23
134.65
(55.1)
(2)
0.02
0.03
0.01
0.01
0.04
0.00
0.06
0.17
(0.36)
0.28
0.36
0.49
0.64
0.91
0.53
0.43
3.64
(1.5
)
(3)
0.01
0.02
0.02
0.04
0.03
0.05
0.04
0.21
(0.44)
0.96
1.11
0.99
1.29
0.53
6.97
1.99
13.84
(5.7)
(4)
0.00
0.00
0.00
0.00
0.00
0.00
0.00
0.00
(0.0)
0.05
0.11
0.37
0.11
0.09
0.11
0.44
1.28
(0.5)
(5)
0.00
0.00
0.00
0.00
0.00
0.00
0.00
0.00
(0.0)
0.00
0.02
0.00
0.00
0.19
1.24
1.27
2.72
(1.1)
(6)
0.00
0.02
0.02
0.00
0.00
0.00
0.00
0.04
(0.1)
2.28
1.96
1.04
0.00
0.00
0.00
0.00
5.28
(2.2)
(7)
0.24
0.49
1.33
0.13
1.58
10.61
2.42
16.80
(35.1)
5.60
4.91
10.20
13.25
5.81
17.62
12.37
69.76
(28.5)
(8)
0.00
0.00
0.00
0.00
0.08
0.31
0.37
0.76
(1.6
)
0.00
0.06
0.07
3.78
0.33
0.72
4.95
9.91
(4.1
)
(9)
0.00
0.00
0.00
0.49
0.05
0.05
0.05
0.64
(1.3
)
0.04
0.32
0.33
0.42
0.25
0.24
0.21
1.81
(0.7)
(10)
0.00
0.00
0.00
0.00
0.00
0.00
0.00
0.00
(0.0)
0.00
0.00
0.00
0.08
0.00
0.33
0.01
0.42
(0.2)
(11)
0.00
0.00
0.00
0.00
0.00
0.00
0.00
0.00
(0.0)
0.20
0.03
0.08
0.08
0.01
0.02
0.50
0.92
(0.4)
(12)
1.71
2.95
2.42
8.28
14.38
15.09
3.05
47.88
(100.0)
22.41
22.56
26.00
43.66
30.44
64.76
34.40
244.23
(100.0)
1—
*> FISo r 5? o m H s> o o o 33
O W H Bt
> GO
(contd.)
O
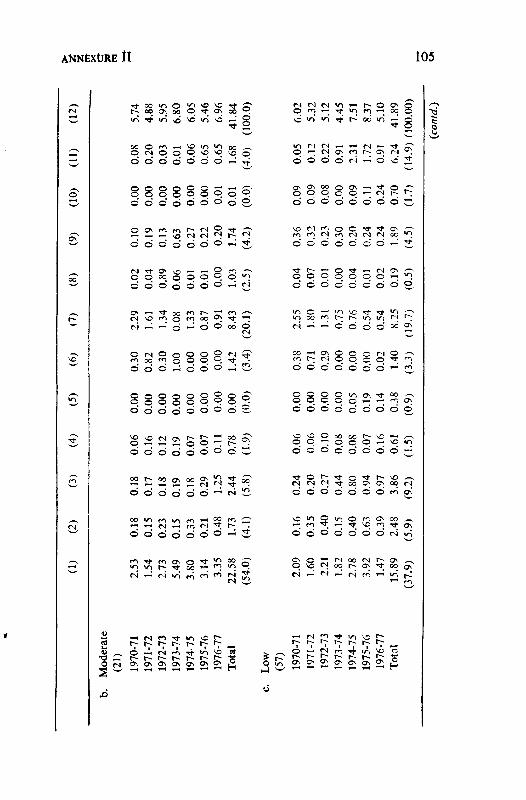
b.
Moderate
(21)
1970-71
1971-72
1972-73
1973-74
1974-75
1975-76
1976-77
Total
c.Low
(57)
1970-71
1971-72
1972-73
1973-74
1974-75
1975-76
1976-77
Total
(1)
2.53
1.54
2.73
5.49
3.80
3.14
3.35
22.58
(54.0)
2.09
1.60
2.21
1.82
2.78
3.92
1.47
15.89
(37.9)
(2)
0.18
0.15
0.23
0.15
0.33
0.21
0.48
1.73
(4.1)
0.16
0.35
0.40
0.15
0.40
0.63
0.39
2.48
(5.9)
(3)
0.18
0.17
0.18
0.19
0.18
0.29
1.25
2.44
(5.8)
0.24
0.20
0.27
0.44
0.80
0.94
0.97
3.86
(9.2)
(4)
0.06
0.16
0.12
0.19
0.07
0.07
0.11
0.78
(1.9)
0.06
0.06
0.10
0.08
0.08
0.07
0.16
0.61
(1.5)
(5)
0.00
0.00
0.00
0.00
0.00
0.00
0.00
0.00
(0.0)
0.00
0.00
0.00
0.00
0.05
0.19
0.14
0.38
(0.9)
(6;
0.30
0.82
0.30
1.00
0.00
0.00
0.00
1.42
(3.4)
0.38
0.71
0.29
0.00
0.00
0.00
0.02
1.40
(3-3)
(7)
2.29
1.61
1.34
0.08
1.33
0.87
0.91
8.43
(20.1)
2.55
1.80
1.31
0.75
0.76
0.54
0.54
8.25
(19.7)
(8)
0.02
0.04
0.89
0.06
0.01
0.01
0.00
1.03
(2.5)
0.04
0.07
0.01
0.00
0.04
0.01
0.02
0.19
(0.5)
(9)
0.10
0.19
0.13
0.63
0.27
0.22
0.20
1.74
(4.2)
0.36
0.32
0.23
0.30
0.20
0.24
0.24
1.89
(4.5)
(10)
0.00
0.00
0.00
0.00
0.00
0.00
0.01
0.01
(0.0)
0.09
0.09
0.08
0.00
0.09
0.11
0.24
0.70
0-7)
(11)
0.08
0.20
0.03
0.01
0.06
0.65
0.65
1.68
(4.0)
0.05
0.12
0.22
0.91
2.31
1.72
0.91
6.24
(14.9)
(12)
5.74
4.88
5.95
6.80
6.05
5.46
6.96
41.84
(100.0)
6.02
5.32
5.12
4.45
7.51
8.37
5.10
41.89
(100.00)
Z z w few
*■■
h—<
(contd.)
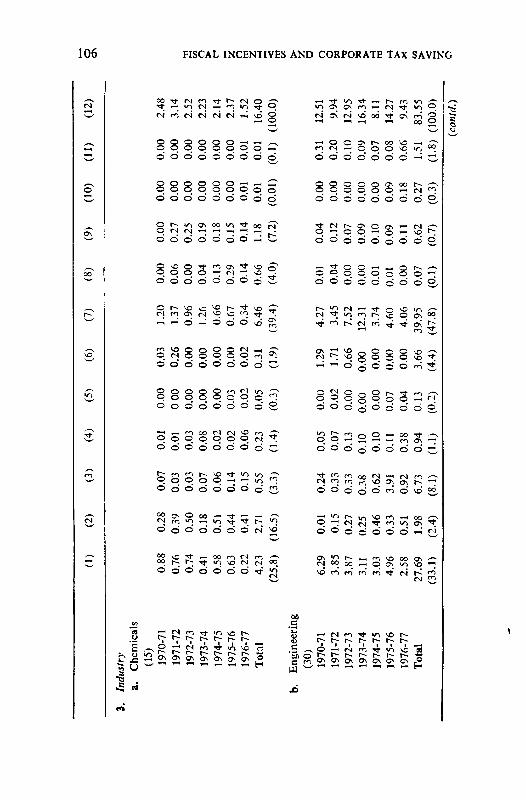
106 FISCAL INCENTIVES AND CORPORATE TAX SAVING
qqqoqqoqM
ddddddddd
© © © © © o —■ —i £2pppppoppo© © do do © © d
ddddddo—i^Z*
~ ~ © -; © d ©' v© {*
o n o q o q o I<i *.© © © © © d d d w
©ppp©p©pr?
odddddddS-
© © © © o © © cn ^]
© © © © © © © © w*
© o © © © ^^ ^^ V) *^1
©©©©©©"©"©£2,
V^ONONrO'-iCNTtio'.
"—' <—i >—l »-i 00 ©
©©!J\tOOOF<fO fN — © © © VO >O
© d © ©' © d © -^
a -1 cs m
ppp^o-Hor:©©©©©©©d©
© O p © © o ©. © 1
^r^t^Cvirn^TfoNli
ONr-|NO_,©o©^o^ci f". 'c g q q q vo t
©.©O. ©©'"'.©'©©odd©'©©^
©"©' © d ©'©"©'©' O
^ M M » N •-1 N m p
© © © o © f^ © no ^
^^ ^ I— V> NO <^1 ^-H 00 '""^
© © d © © © © ^ <n,
NO rn co ro co ^}" M t^ ^
en©t~~'f^r~-t~~r;;-t^r~-'%'C fO ^ ON ON On On On On ^
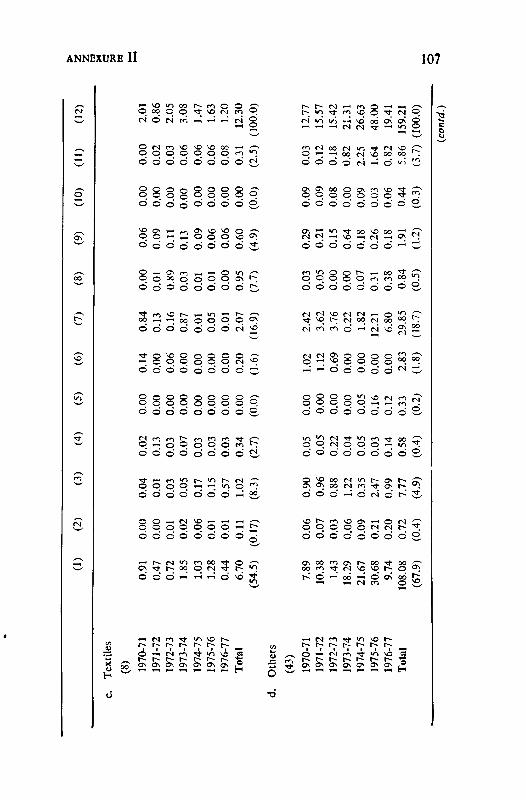
c.Textiles
(8)
1970-71
1971-72
1972-73
1973-74
1974-75
1975-76
1976-77
Total
d.
Others
(43)
1970-71
1971-72
1972-73
1973-74
1974-75
1975-76
1976-77
Total
(1)
0.91
0.47
0.72
1.85
1.03
1.28
0.44
6.70
(54.5)
7.89
10.38
1.43
18.29
21.67
30.68
9.74
108.08
(67.9)
(2)
0.00
0.00
0.01
0.02
0.06
0.01
0.01
0.11
(0.17)
0.06
0.07
0.03
0.06
0.09
0.21
0.20
0.72
(0.4)
(3)
0.04
0.01
0.03
0.05
0.17
0.15
0.57
1.02
(8.3)
0.90
0.96
0.88
1.22
0.35
2.47
0.99
7.77
(4.9)
(4)
0.02
0.13
0.03
0.07
0.03
0.03
0.03
0.34
(2.7)
0.05
0.05
0.22
0.04
0.05
0.03
0.14
0.58
(0.4)
(5)
0.00
0.00
0.00
0.00
0.00
0.00
0.00
0.00
(0.0)
0.00
0.00
0.00
0.00
0.05
0.16
0.12
0.33
(0.2)
(6)
0.14
0.00
0.06
0.00
0.00
0.00
0.00
0.20
(1.6)
1.02
1.12
0.69
0.00
0.00
0.00
0.00
2.83
(1.8)
(7)
0.84
0.13
0.16
0.87
0.01
0.05
0.01
2.07
(16.9)
2.42
3.62
3.76
0.22
1.82
12.21
6.80
29.85
(18.7)
(8)
0.00
0.01
0.89
0.03
0.01
0.01
0.00
0.95
(7.7)
0.03
0.05
0.00
0.00
0.07
0.31
0.38
0.84
(0.5)
(9)
0.06
0.09
0.11
0.13
0.09
0.06
0.06
0.60
(4.9)
0.29
0.21
0.15
0.64
0.18
0.26
0.18
1.91
(1.2)
(10)
0.00
0.00
0.00
0.00
0.00
0.00
0.00
0.00
(0.0)
0.09
0.09
0.08
0.00
0.09
0.03
0.06
0.44
(0.3)
(11)
0.00
0.02
0.03
0.06
0.06
0.06
0.08
0.31
(2.5)
0.03
0.12
0.18
0.82
2.25
1.64
0.82
5.86
(3.7)
(12)
2.01
0.86
2.05
3.08
1.47
1.63
1.20
12.30
(100.0)
12.77
15.57
15.42
21.31
26.63
48.00
19.41
159.21
(100.0)
ANN!X a ra
>—
t—
©
{contd.)
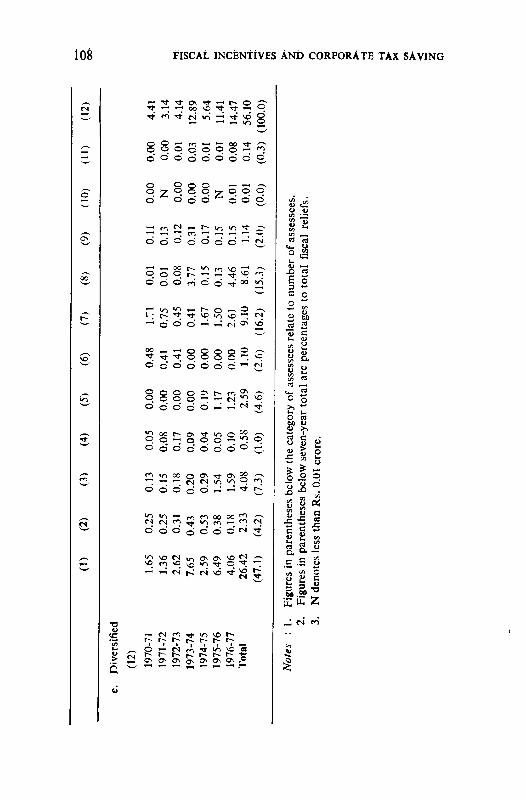
(1)
(2)
(3)
(4)
(5)
(6)
(7)
(8)
(9)
(10)
(11)
(12)
o
e.Diversified
(12)
1970-71
1971-72
1972-73
1973-74
1974-75
1975-76
1976-77
Total
Notes
:1. 2. 3.
1.65
1.36
2.62
7.65
2.59
6.49
4.06
26.42
(47.1)
0.25
0.25
0.31
0.43
0.53
0.38
0.18
2.33
(4.2)
0.13
0.15
0.18
0.20
0.29
1.54
1.59
4.08
(7.3)
Figures
inparenthesesbelow
i
0.05
0.08
0.17
0.09
0.04
0.05
0.10
0.58
(1.0)
0.00
0.00
0.00
0.00
0.19
1.17
1.23
2.59
(4.6)
0.48
0.41
0.41
0.00
0.00
0.00
0.00
1.10
(2.6)
1.71
0.75
0.45
0.41
1.67
1.50
2.61
9.10
(16.2)
thecategoryofassesseesrelateto
Figures
inparenthesesbelowseven-yearto
talarepercentages
i
Ndenotes
less
thanRs.0.01crore.
0.01
0.01
0.08
3.77
0.15
0.13
4.46
8.61
(15.3)
0.11
0.13
0.12
0.31
0.17
0.15
0.15
1.14
(2.0)
0.00
N
0.00
0.00
0.00
N
0.01
0.01
(0.0)
numberofassessees.
tototal
fisc
alreliefs.
0.00
0.00
0.01
0.03
0.01
0.01
0.08
0.14
(0.3)
4.41
3.14
4.14
12.89
5.64
11.41
14.47
56.10
(100.0)
53 O > c O re
z IVESZ o CORPORATETAXSAVING
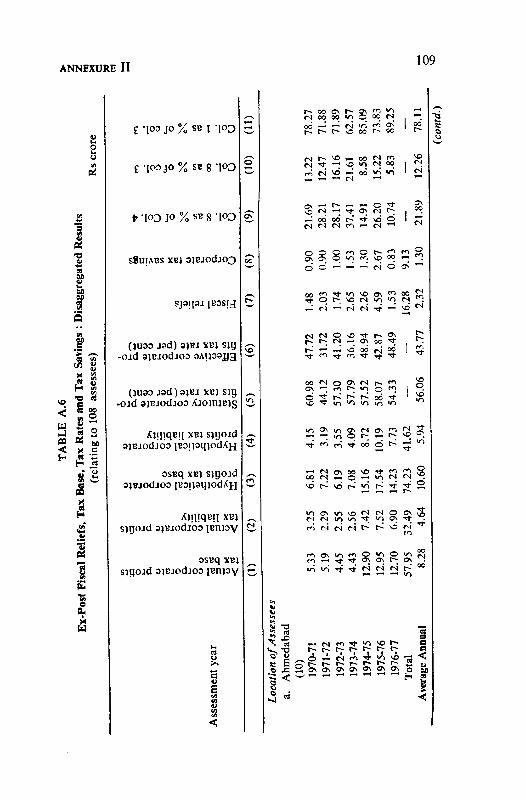
>l.3an.o
v>v
2"*
«K)M^H'O'-'NJOO
•_lwOIn>iwUVO
^I00H00CT\—r*H^jji.00VO'—K)sisi
■wioinwno\'sib*
^*IC^s^4^*^J0000^~*
bo'j^gi2ib"cjhiS
J3|yiyioop—o\w^
si.00-jOOONslsJ-~455vowwn--oo
'»-'ts>boQOhOp00U00
601
Actualcorporateprofits
taxbase
Actualcorporateprofits
taxliability
Hypotheticalcorporate
profitstaxbase
Hypotheticalcorporate
profitstaxliability
Statutorycorporatepro
fitstaxrate(percent)
Effectivecorporatepro
fitstaxrate(percent)
Fiscalreliefs
Corporatetaxsavings
Col.8as%ofCol.4
Col.8as%ofcol.3
Col.1as%ofcol.3
II
£*>
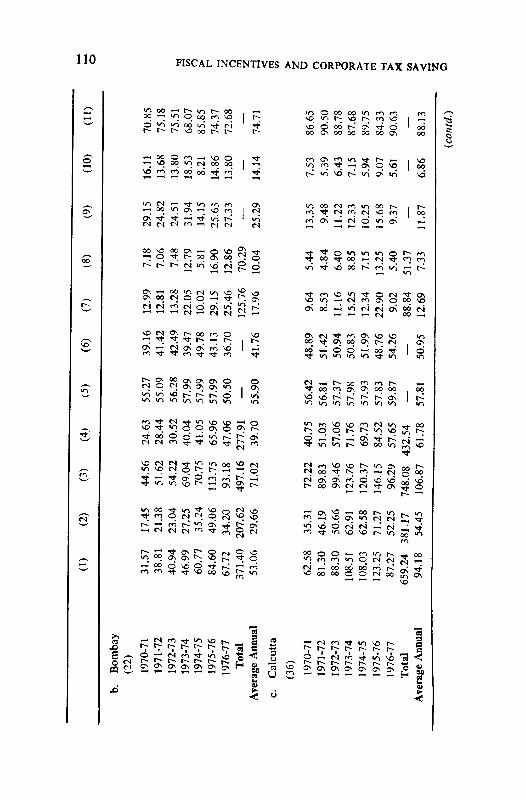
(1)
(2)
(3)
(4)
(5)
(6)
(7)
(8)
(9)
(10)
(11)
b.Bombay
(22)
1970-71
1971-72
1972-73
1973-74
1974-75
1975-76
1976-77
Total
AverageAnnual
c.Calcutta
(36)
1970-71
1971-72
1972-73
1973-74
1974-75
1975-76
1976-77
Total
AverageAnnual
31.57
38.81
40.94
46.99
60.77
84.60
67.72
371.40
53.06
17.45
21.38
23.04
27.25
35.24
49.06
34.20
207.62
29.66
44.56
51.62
54.22
69.04
70.75
113.75
93.18
497.16
71.02
24.63
28.44
30.52
40.04
41.05
65.96
47.06
277.91
39.70
55.27
55.09
56.28
57.99
57.99
57.99
50.50
—
55.90
39.16
41.42
42.49
39.47
49.78
43.13
36.70
—
41.76
12.99
12.81
13.28
22.05
10.02
29.15
25.46
125.76
17.96
7.18
7.06
7.48
12.79
5.81
16.90
12.86
70.29
10.04
29.15
24.82
24.51
31.94
14.15
25.63
27.33
25.29
16.11
13.68
13.80
18.53
8.21
14.86
13.80
14.14
70.85
75.18
75.51
68.07
85.85
74.37
72.68
74.71
62.58
81.30
88.30
108.51
108.03
123.25
87.27
659.24
94.18
35.31
46.19
50.66
62.91
62.58
71.27
52.25
381.17
54.45
72.22
89.83
99.46
123.76
120.37
146.15
96.29
748.08
106.87
40.75
51.03
57.06
71.76
69.73
84.52
57.65
432.54
61.78
56.42
56.81
57.37
57.98
57.93
57.83
59.87
57.81
48.89
51.42
50.94
50.83
51.99
48.76
54.26
50.95
9.64
8.53
11.16
15.25
12.34
22.90
9.02
88.84
12.69
5.44
4.84
6.40
8.85
7.15
13.25
5.40
51.37
7.33
13.35
9.48
11.22
12.33
10.25
15.68
9.37
11.87
7.53
5.39
6.43
7.15
5.94
9.07
5.61
86.65
90.50
88.78
87.68
89.75
84.33
90.63
6.86
88.13
(contd.)
o O O 73 s H ra
H
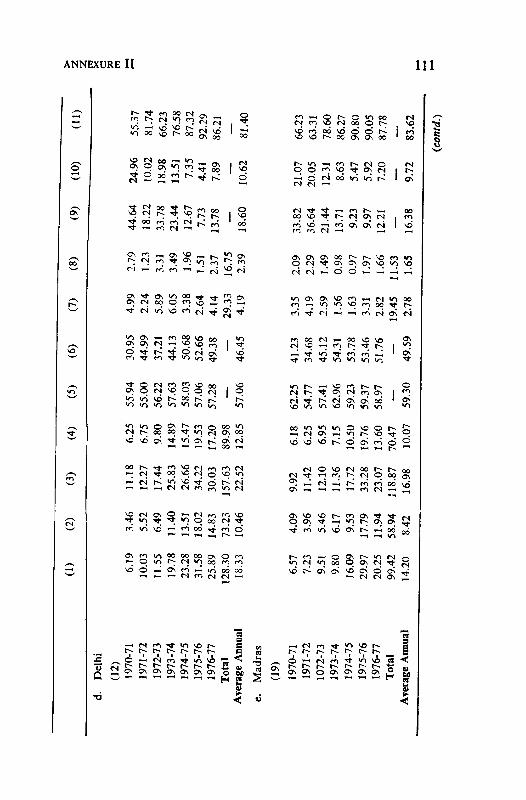
(1)
(2)
(3)
(4)
(5)
(6)
(7)
(8)
(9)
(10)
(11)
d.
Delhi
(12)
1970-71
1971-72
1972-73
1973-74
1974-75
1975-76
1976-77
Total
AverageAnnual
e.Madras
(19)
1970-71
1971-72
1072-73
1973-74
1974-75
1975-76
1976-77
Total
AverageAnnual
6.19
10.03
11.55
19.78
23.28
31.58
25.89
128.30
18.33
6.57
7.23
9.51
9.80
16.09
29.97
20.25
99.42
14.20
3.46
5.52
6.49
11.40
13.51
18.02
14.83
73.23
10.46
4.09
3.96
5.46
6.17
9.53
17.79
11.94
58.94
8.42
11.18
12.27
17.44
25.83
26.66
34.22
30.03
157.63
22.52
9.92
11.42
12.10
11.36
17.72
33.28
23.07
118.87
16.98
6.25
6.75
9.80
14.89
15.47
19.53
17.20
89.98
12.85
6.18
6.25
6.95
7.15
10.50
19.76
13.60
70.47
10.07
55.94
55.00
56.22
57.63
58.03
57.06
57.28
—
57.06
62.25
54.77
57.41
62.96
59.23
59.37
58.97
—
59.30
30.95
44.99
37.21
44.13
50.68
52.66
49.38
—
46.45
41.23
34.68
45.12
54.31
53.78
53.46
51.76
—
49.59
4.99
2.24
5.89
6.05
3.38
2.64
4.14
29.33
4.19
3.35
4.19
2.59
1.56
1.63
3.31
2.82
19.45
2.78
2.79
1.23
3.31
3.49
1.96
1.51
2.37
16.75
2.39
2.09
2.29
1.49
0.98
0.97
1.97
1.66
11.53
1.65
44.64
18.22
33.78
23.44
12.67
7.73
13.78
18.60
33.82
36.64
21.44
13.71
9.23
9.97
12.21
16.38
24.96
10.02
18.98
13.51
7.35
4.41
7.89
10.62
21.07
20.05
12.31
8.63
5.47
5.92
7.20
9.72
55.37
81.74
66.23
76.58
87.32
92.29
86.21
81.40
66.23
63.31
78.60
86.27
90.80
90.05
87.78
83.62
(contd.)
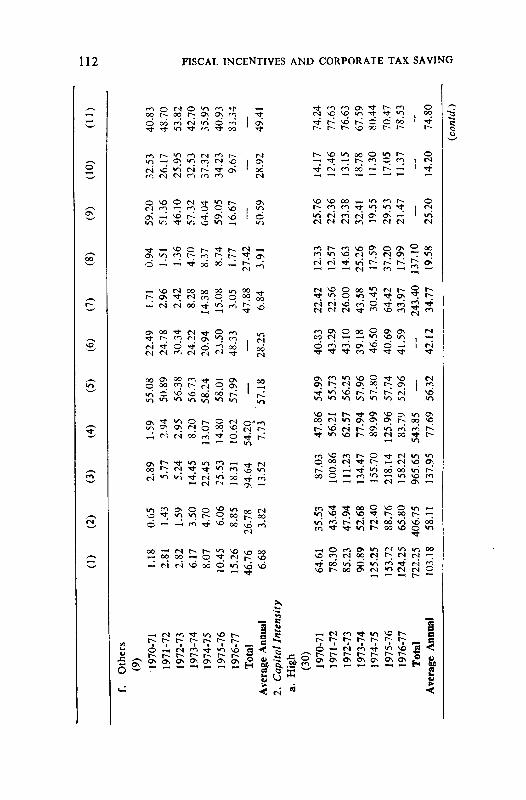
112 FISCAL INCENTIVES AND CORPORATE TAX SAVING
rn ^^ r^i ^5 in f* ^i* ^*00 [-. 00 ("-; ON ON r*} Tf
6 CO ^ N "i 6 i*i On^■^■"n^r^^oo Tf
tn I—• *^ '"*"* f*1! '"^ r^ fNin —r On in co fN \o I On
fN no «"> CN K rt on 'ooro <N tN f) rn en <S
OnoOcnt}-1Oi~- on(n| cn ^~^ r^ f^ t i ^^ . i/^
On '■^ ^ t*^ ^}" O\ no I O
^ — ^Oh.'tNM-^on !n ^^ r^- r<i t^ r— ^J o^
— no fM oo oo ^^ in oo _^t— On ^" fN co ^^ ^^ oo qq
On O0 ^ C^ ^ O <*■> jy-^
^ t ° ■* o 2 * od
3O O\ M M ^. -■ O QQ
ooornr-^r^qoN |i_iin d ^o « 06 oo t^ '^in ") "i in in "> ^ !n
Os ■* in O t-~ O fN ©*ro
^Nrioo'ri^dTtt^r-l " —I in
On[^;^^>^>J^}-h^(n
in^OsOoiS^oofN«^ininisqo0f;«
«N
00 "■H fN ^ t— "^ NO NO OOr—• OO OO -^ O ^ fN f— NO
OnonOnOnonOnonP m'B.
1^
in Tt vt
r^ o c-o oo r~-
.761NO
.36J .38
00
00
41
©en
—
.55o
r-
.53—i
S!£
OOoOON^ >— «n vo <n
m On ^ O -^'^-Tttt
(^s On in ro enr-~ oo <n oo Tt
^ in
oo O -.
rr>TtTt00O NO O in >—iin * o> \o t h oo t^ ii
O r*v On <n n in in oo
NOONt^Nlt
r^s
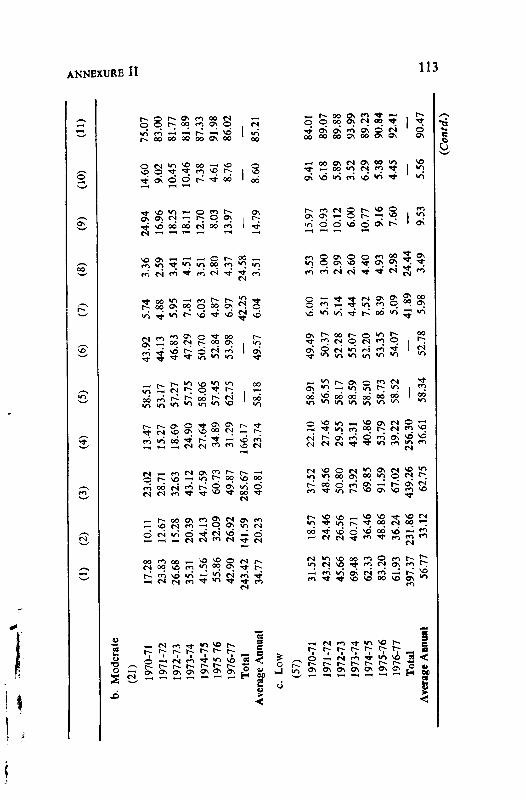
b.Moderate
(21)
1970-71
1971-72
1972-73
1973-74
1974-75
197576
1976-77
Total
AverageAnnual
c.Low
(57)
1970-71
1971-72
1972-73
1973-74
1974-75
1975-76
1976-77
Total
AverageAnnual
(1)
17.28
23.83
26.68
35.31
41.56
55.86
42.90
243.42
34.77
31.52
43.25
45.66
69.48
62.33
83.20
61.93
397.37
56.77
(2)
10.11
12.67
15.28
20.39
24.13
32.09
26.92
141.59
20.23
18.57
24.46
26.56
40.71
36.46
48.86
36.24
231.86
33.12
(3)
23.02
28.71
32.63
43.12
47.59
60.73
49.87
285.67
40.81
37.52
48.56
50.80
73.92
69.85
91.59
67.02
439.26
62.75
(4)
13.47
15.27
18.69
24.90
27.64
34.89
31.29
166.17
23.74
22.10
27.46
29.55
43.31
40.86
53.79
39.22
256.30
36.61
(5)
58.51
53.17
57.27
57.75
58.06
57.45
62.75
—
58.18
58.91
56.55
58.17
58.59
58.50
58.73
58.52
—
58.34
(6)
43.92
44.13
46.83
47.29
50.70
52.84
53.98
—
49.57
49.49
50.37
52.28
55.07
52.20
53.35
54.07
—
52.78
(7)
5.74
4.88
5.95
7.81
6.03
4.87
6.97
42.25
6.04
6.00
5.31
5.14
4.44
7.52
8.39
5.09
41.89
5.98
(8)
3.36
2.59
3.41
4.51
3.51
2.80
4.37
24.58
3.51
3.53
3.00
2.99
2.60
4.40
4.93
2.98
24.44
3.49
(9)
24.94
16.96
18.25
18.11
12.70
8.03
13.97
—
14.79
15.97
10.93
10.12
6.00
10.77
9.16
7.60
— 9.53
(10)
14.60
9.02
10.45
10.46
7.38
4.61
8.76
— 8.60
9.41
6.18
5.89
3.52
6.29
5.38
4.45
— 5.56
(ID
75.07
83.00
81.77
81.89
87.33
91.98
86.02
—
85.21
84.01
89.07
89.88
93.99
89.23
90.84
92.41
—
90.47
ANNE:?*
e w i— >
(Contd.)
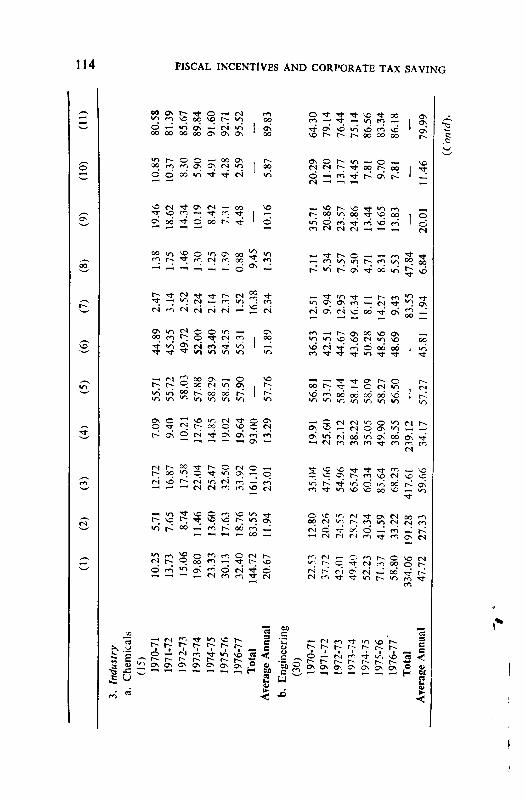
(D
(2)
(3)
(4)
(5)
(6)
(7)
(8)
(9)
(10)
(ID
3.Industry
a.Chemicals
(15)
1970-71
1971-72
1972-73
1973-74
1974-75
1975-76
1976-77
Total
AverageAnnual
b.Engineering
(30)
1970-71
1971-72
1972-73
1973-74
1974-75
1975-76
1976
-77"
Total
AverageAnnual
10.25
13.73
15.06
19.80
23.33
30.13
32.40
144.72
20.67
22.53
37.72
42.01
49.40
52.23
71.37
58.80
334.06
47.72
5.71
7.65
8.74
11.46
13.60
17.63
18.76
83.55
11.94
12.80
20.26
24.55
28.72
30.34
41.59
33.22
191.28
27.33
12.72
16.87
17.58
22.04
25.47
32.50
33.92
161.10
23.01
35.04
47.66
54.96
65.74
60.34
85.64
68.23
417.61
59.66
7.09
9.40
10.21
12.76
14.85
19.02
19.64
93.00
13.29
19.91
25.60
32.12
38.22
35.05
49.90
38.55
239.12
34.17
55.71
55.72
58.03
57.88
58.29
58.51
57.90
56.81
53.71
58.44
58.14
58.09
58.27
56.50
57.27
44.89
45.35
49.72
52.00
53.40
54.25
55.31
57.76
51.89
36.53
42.51
44.67
43.69
50.28
48.56
48.69
45.81
2.47
3.14
2.52
2.24
2.14
2.37
1.52
16.38
2.34
12.51
9.94
12.95
16.34
8.11
14.27
9.43
83.55
11.94
1.38
1.75
1.46
1.30
1.25
1.39
0.88
9.45
1.35
7.11
5.34
7.57
9.50
4.71
8.31
5.53
47.84
6.84
19.46
18.62
14.34
10.19
8.42
7.31
4.48
10.16
35.71
20.86
23.57
24.86
13.44
16.65
13.83
20.01
10.85
10.37
8.30
5.90
4.91
4.28
2.59
20.29
11.20
13.77
14.45
7.81
9.70
7.81
80.58
81.39
85.67
89.84
91.60
92.71
95.52
5.87
89.83
64.30
79.14
76.44
75.14
86.56
83.34
86.18
O r*
o m Z H
11.46
79.99
(Contd).
2
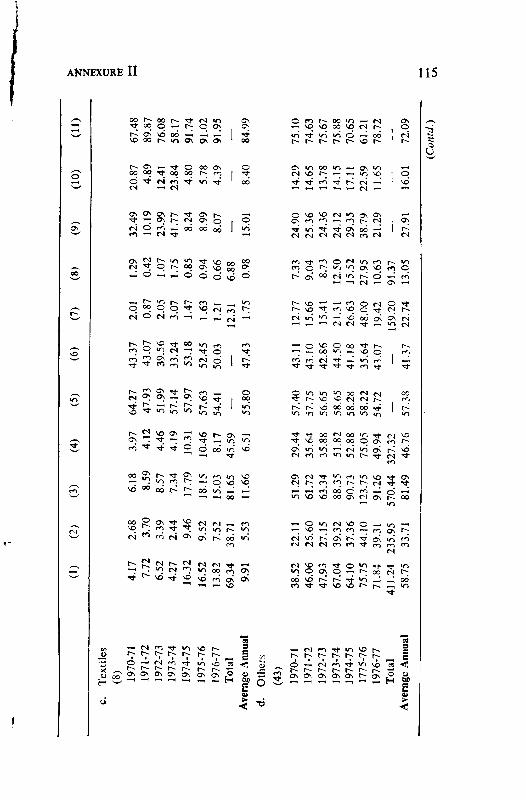
c.Textiles
(8)
1970-71
1971-72
1972-73
1973-74
1974-75
1975-76
1976-77
Total
AverageAnnual
d.Others
(43)
1970-71
1971-72
1972-73
1973-74
1974-75
1775-76
1976-77
Total
AverageAnnual
(1)
4.17
7.72
6.52
4.27
16.32
16.52
13.82
69.34
9.91
38.52
46.06
47.93
67.04
64.10
75.75
71.84
411.24
58.75
(2)
2.68
3.70
3.39
2.44
9.46
9.52
7.52
38.71
5.53
22.11
25.60
27.15
39.32
37.36
44.10
39.31
235.95
33.71
(3) 6.18
8.59
8.57
7.34
17.79
18.15
15.03
81.65
11.66
51.29
61.72
63.34
88.35
90.73
123.75
91.26
570.44
81.49
(4)
3.97
4.12
4.46
4.19
10.31
10.46
8.17
45.59
6.51
29.44
35.64
35.88
51.82
52.88
75.05
49.94
327.32
46.76
(5)
64.27
47.93
51.99
57.14
57.97
57.63
54.41
—
55.80
57.40
57.75
56.65
58.65
58.28
58.22
54.72
— 57.38
(6)
43.37
43.07
39.56
33.24
53.18
52.45
50.03
— 47.43
43.11
43.10
42.86
44.50
41.18
35.64
43.07
41.37
(7)
2.01
0.87
2.05
3.07
1.47
1.63
1.21
12.31
1.75
12.77
15.66
15.41
21.31
26.63
48.00
19.42
159.20
22.74
(8)
1.29
0.42
1.07
1.75
0.85
0.94
0.66
6.88
0.98
7.33
9.04
8.73
12.50
15.52
27.95
10.63
91.37
13.05
(9)
32.49
10.19
23.99
41.77
8.24
8.99
8.07
—
15.01
24.90
25.36
24.36
24.12
29.35
38.79
21.29
—
27.91
(10)
20.87
4.89
12.41
23.84
4.80
5.78
4.39
— 8.40
14.29
14.65
13.78
14.15
17.11
22.59
11.65
—.
16.01
(11)
67.48
89.87
76.08
58.17
91.74
91.02
91.95
— 84.99
75.10
74.63
75.67
75.88
70.65
61.21
78.72
— 72.09
ANN EXUREi—
t—
(Contd.)
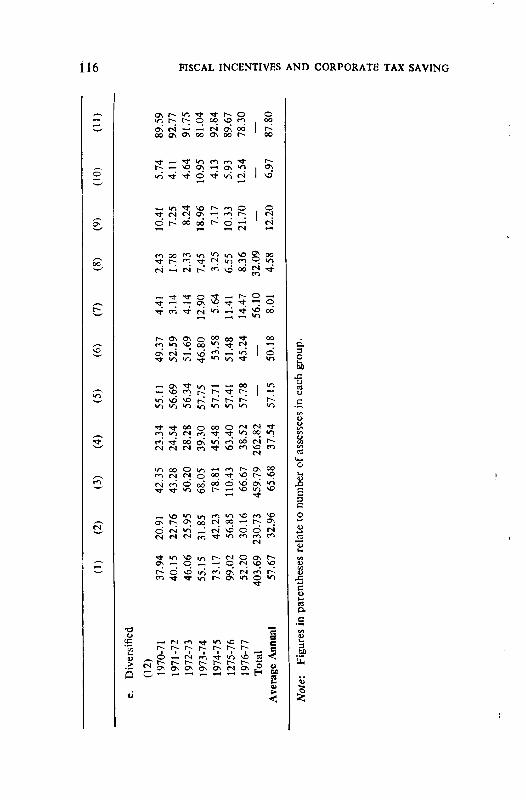
116 FISCAL INCENTIVES AND CORPORATE TAX SAVING
I °>I VO
o r-- oo oo © — ™
—. qs 5 in r-
is N t Iin in in >n
O\ >n © in
VO B
O 4)
2DC
The National Institute of Public Finance and Policy, New Delhi is an autonomous, non-profit organisation, whose main functions are to carry out research, do consultancy work for governments, and impart training to the officials of various governments in public finance and related fields of policy. In addition to undertaking original research work, the Institute strives to fulfil the role of a vehicle for transferring the results of applied research to policy making in the country in the realm of public finance.
The Institute also acts as a forum in which officials belonging to the Central and State governments, representatives of the private sector. leading financial institutions and academicians can exchange ideas and information. With this end in view, seminars and conferences are organised by the Institute from time to time. However, its main activities relate to research conducted on its own initiative and that sponsored by the member governments. Among the recent reports completed by the staff of the Institute, which have been or are being published are:
Incidence of Indirect Taxation in India 1973-74 (1978). NIPFP Trends and Issues in Indian Federal Finance (1981). Alied Publishers
Sales Tax System in Bihar (1981). Somaiya Publications
Incidence of Indirect Taxation in India (Hindi Version) (1981). NIPFP
Resource Mobilisation in the Private Corporate Sector (1982). NIPFP
Measurement of Tax Effort of State Governments 1973-76 (1982). Somaiya Publications
Resource Mobilisation in the Private Corporate Sector (National Institute of Public Finance and Policy)
VINAY D. LALL, SRINIVASA MAOHUR and K.K. ATRI
The stujy pr.!sent~ a detailed a,sessment of the resource mobilisation effort in the large-scale segment of the Indian private corporate sector, engaged in manufacturing activities. The study covers the period 1962-63 to 1975-76, but the analysis of the major trends has been extended upto 1979-80. The study contains an analysis of trends in the mobilisation of gross resources (inclusive of depreciation), an assessment of the composition of resources mobilised and an econometric exercise on the determinants of gross resources mobilised. While the econometric exercises are related to aggregate data, the analysis of the trends and structural compos 'tion of mobilised resources is made both for the corporate sector as a whole and for different categories of companies classified according to the size of their total assets, their age and level of efficiency. An important contribution of the study consists of the empirical evaluation of the impact of government policies (in particular, fiscal and monetary policies) on the ratio of equity to debt finance and the composition of owned funds . Some policy implications are drawn on the basis of the empirical evidence, keeping in perspective the qualitative assessments by the leaders of industry, financial institutions and the government on thc problems of resource mobilisation in the private corporate sector.
1982 188pp Rs 50
The Impact of the Personal Income Tax (National Institute of Public Finance and Policy)
ANUPAM GUPTA, with contributions by PAWAN K. AGGARWAL
This study is the first of its kind in India in as much as no attempt has so far been made to empirically examine the manner in which the personal income tax affects the distribution of income and distributes the tax burden. The form and content of the personal income tax in India are intended to impart elements of elasticity and progressivity to the tax system. The tax is rightly considered an instrument not only for regulating the flow of purchasing power but also for reducing economic inequalities.
The study seeks to examine the impact of the personal income tax on the basis of the data published by the Income Tax Department. It first examines critically the available data on income tax assessments and the characteristics of assessees in order to evaluate their reliability and comparability over time. Recommendations for improvement in the collection and presentation of the data are put forward. Secondly, estimates of the elasticity of the personal income tax with respect to the tax base and income are computed and are explained in terms of the progressivity of the tax structure and distribution of income. Thirdly, the impact of the personal income tax on the distribution of income among the tax payers is examined on the basis of the comparisons of pre-tax and posttax distributions.
Further, the redistributive impact of the tax is explained in terms of the progressivity of the tax structure and the distribution of the real burden of the tax.
This significant study is likely to be of interest not only to scholars but also to policy makers and the lay reader.
1982 140pp Rs.35.OO