Embed Size (px)
Citation preview
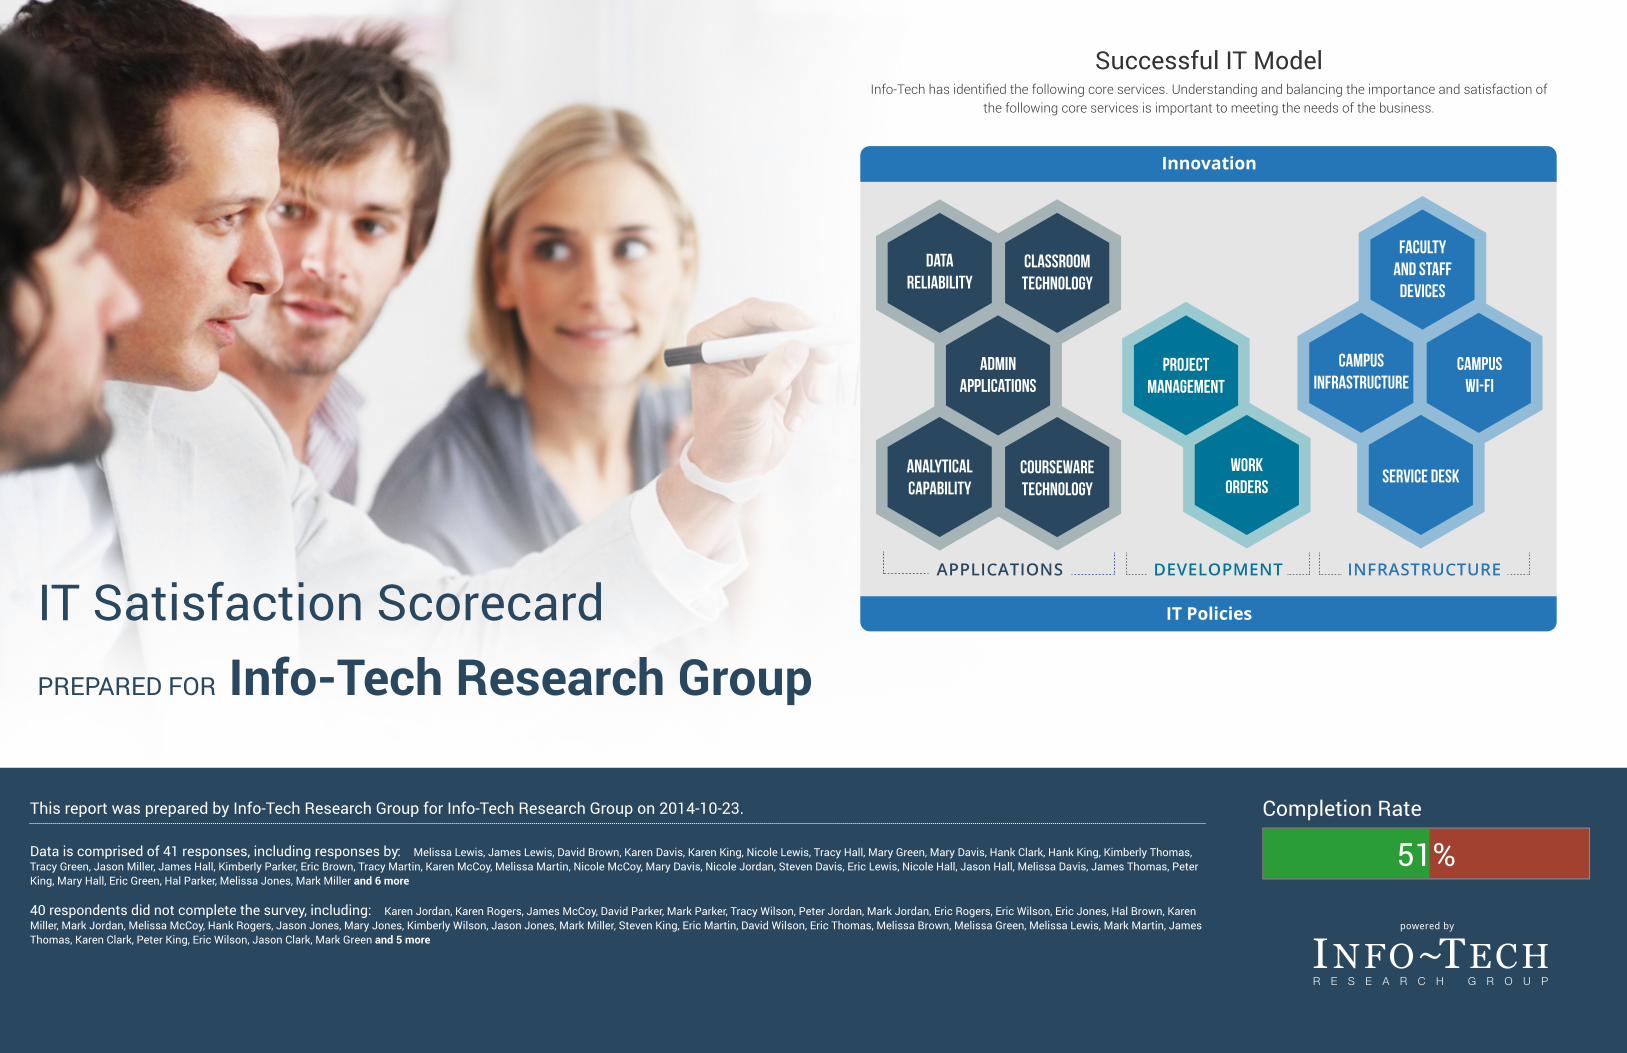
Successful IT ModelInfo-Tech has identified the following core services. Understanding and balancing the importance and satisfaction of
the following core services is important to meeting the needs of the business.
IT Satisfaction ScorecardPREPARED FOR Info-Tech Research Group
This report was prepared by Info-Tech Research Group for Info-Tech Research Group on 2014-10-23.
Data is comprised of 41 responses, including responses by: Melissa Lewis, James Lewis, David Brown, Karen Davis, Karen King, Nicole Lewis, Tracy Hall, Mary Green, Mary Davis, Hank Clark, Hank King, Kimberly Thomas,Tracy Green, Jason Miller, James Hall, Kimberly Parker, Eric Brown, Tracy Martin, Karen McCoy, Melissa Martin, Nicole McCoy, Mary Davis, Nicole Jordan, Steven Davis, Eric Lewis, Nicole Hall, Jason Hall, Melissa Davis, James Thomas, PeterKing, Mary Hall, Eric Green, Hal Parker, Melissa Jones, Mark Miller and 6 more
40 respondents did not complete the survey, including: Karen Jordan, Karen Rogers, James McCoy, David Parker, Mark Parker, Tracy Wilson, Peter Jordan, Mark Jordan, Eric Rogers, Eric Wilson, Eric Jones, Hal Brown, KarenMiller, Mark Jordan, Melissa McCoy, Hank Rogers, Jason Jones, Mary Jones, Kimberly Wilson, Jason Jones, Mark Miller, Steven King, Eric Martin, David Wilson, Eric Thomas, Melissa Brown, Melissa Green, Melissa Lewis, Mark Martin, JamesThomas, Karen Clark, Peter King, Eric Wilson, Jason Clark, Mark Green and 5 more
Completion Rate
51%
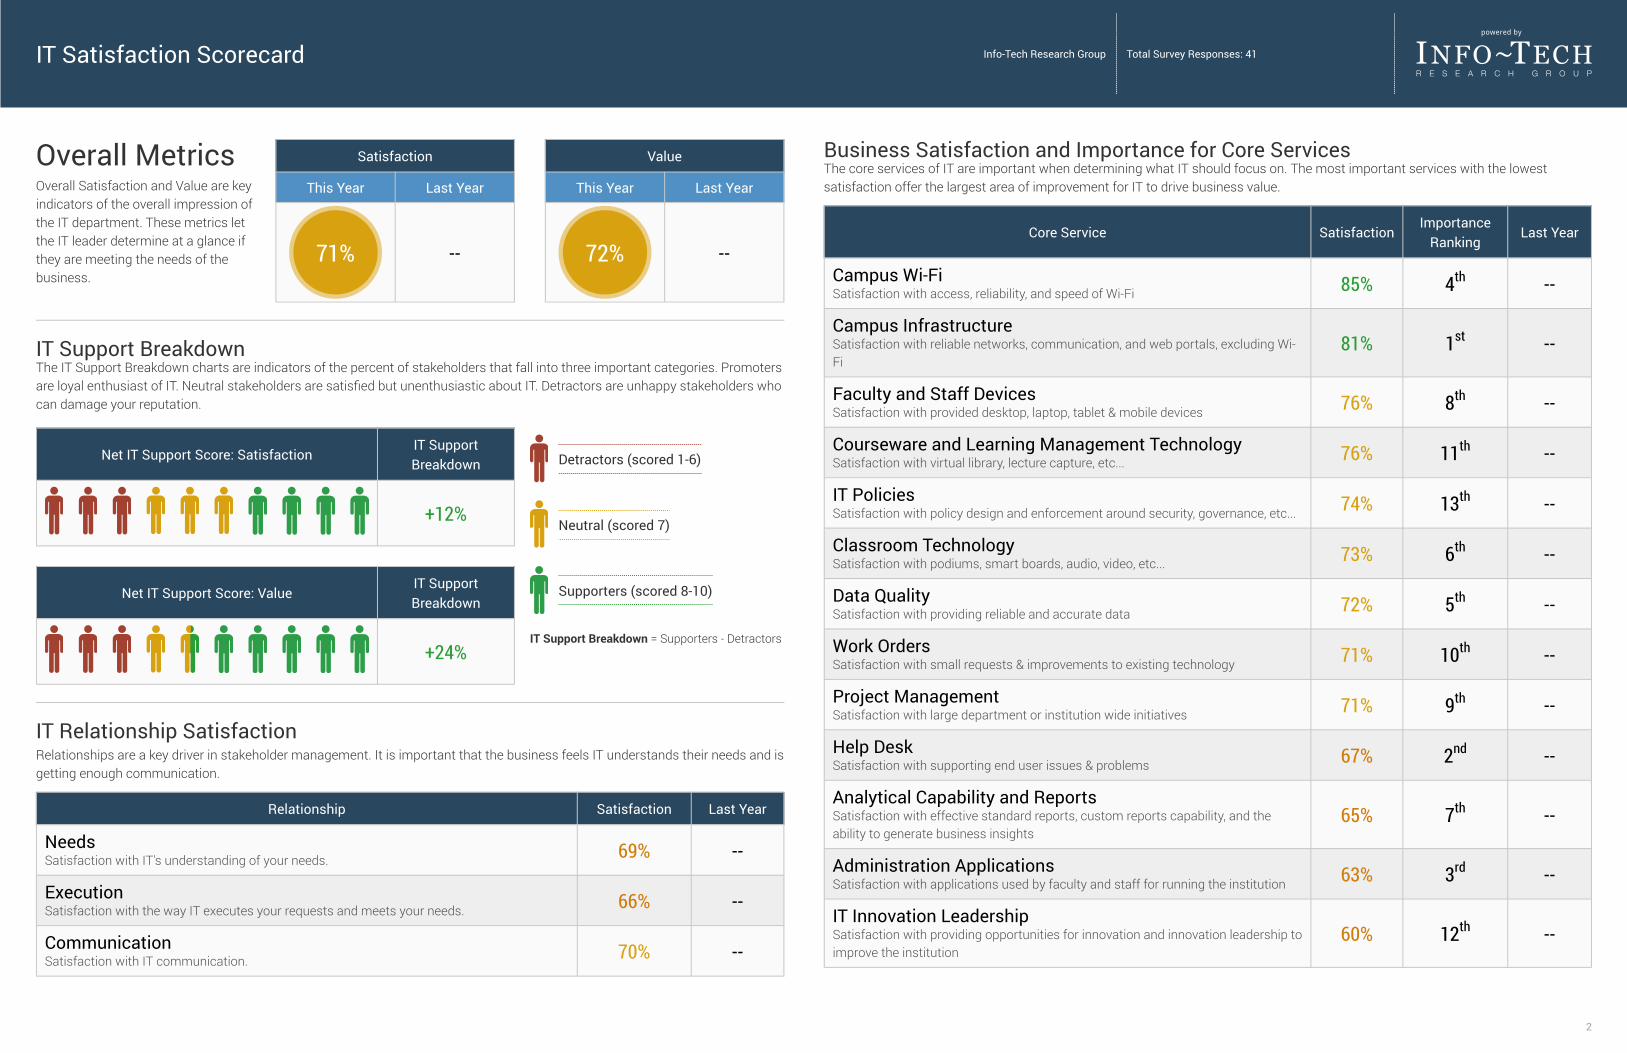
Satisfaction
This Year Last Year
71% --
Value
This Year Last Year
72% --
Detractors (scored 1-6)
Neutral (scored 7)
Supporters (scored 8-10)
IT Support Breakdown = Supporters - Detractors
Net IT Support Score: SatisfactionIT SupportBreakdown
+12%
Net IT Support Score: ValueIT SupportBreakdown
+24%
IT Support BreakdownThe IT Support Breakdown charts are indicators of the percent of stakeholders that fall into three important categories. Promotersare loyal enthusiast of IT. Neutral stakeholders are satisfied but unenthusiastic about IT. Detractors are unhappy stakeholders whocan damage your reputation.
IT Relationship SatisfactionRelationships are a key driver in stakeholder management. It is important that the business feels IT understands their needs and isgetting enough communication.
Relationship Satisfaction Last Year
NeedsSatisfaction with IT's understanding of your needs. 69% --
ExecutionSatisfaction with the way IT executes your requests and meets your needs. 66% --
CommunicationSatisfaction with IT communication. 70% --
Overall MetricsOverall Satisfaction and Value are keyindicators of the overall impression ofthe IT department. These metrics letthe IT leader determine at a glance ifthey are meeting the needs of thebusiness.
Business Satisfaction and Importance for Core ServicesThe core services of IT are important when determining what IT should focus on. The most important services with the lowestsatisfaction offer the largest area of improvement for IT to drive business value.
Core Service SatisfactionImportance
RankingLast Year
Campus Wi-FiSatisfaction with access, reliability, and speed of Wi-Fi 85% 4th --
Campus InfrastructureSatisfaction with reliable networks, communication, and web portals, excluding Wi-Fi
81% 1st --
Faculty and Staff DevicesSatisfaction with provided desktop, laptop, tablet & mobile devices 76% 8th --
Courseware and Learning Management TechnologySatisfaction with virtual library, lecture capture, etc... 76% 11th --
IT PoliciesSatisfaction with policy design and enforcement around security, governance, etc... 74% 13th --
Classroom TechnologySatisfaction with podiums, smart boards, audio, video, etc... 73% 6th --
Data QualitySatisfaction with providing reliable and accurate data 72% 5th --
Work OrdersSatisfaction with small requests & improvements to existing technology 71% 10th --
Project ManagementSatisfaction with large department or institution wide initiatives 71% 9th --
Help DeskSatisfaction with supporting end user issues & problems 67% 2nd --
Analytical Capability and ReportsSatisfaction with effective standard reports, custom reports capability, and theability to generate business insights
65% 7th --
Administration ApplicationsSatisfaction with applications used by faculty and staff for running the institution 63% 3rd --
IT Innovation LeadershipSatisfaction with providing opportunities for innovation and innovation leadership toimprove the institution
60% 12th --
IT Satisfaction Scorecard Info-Tech Research Group Total Survey Responses: 41
2
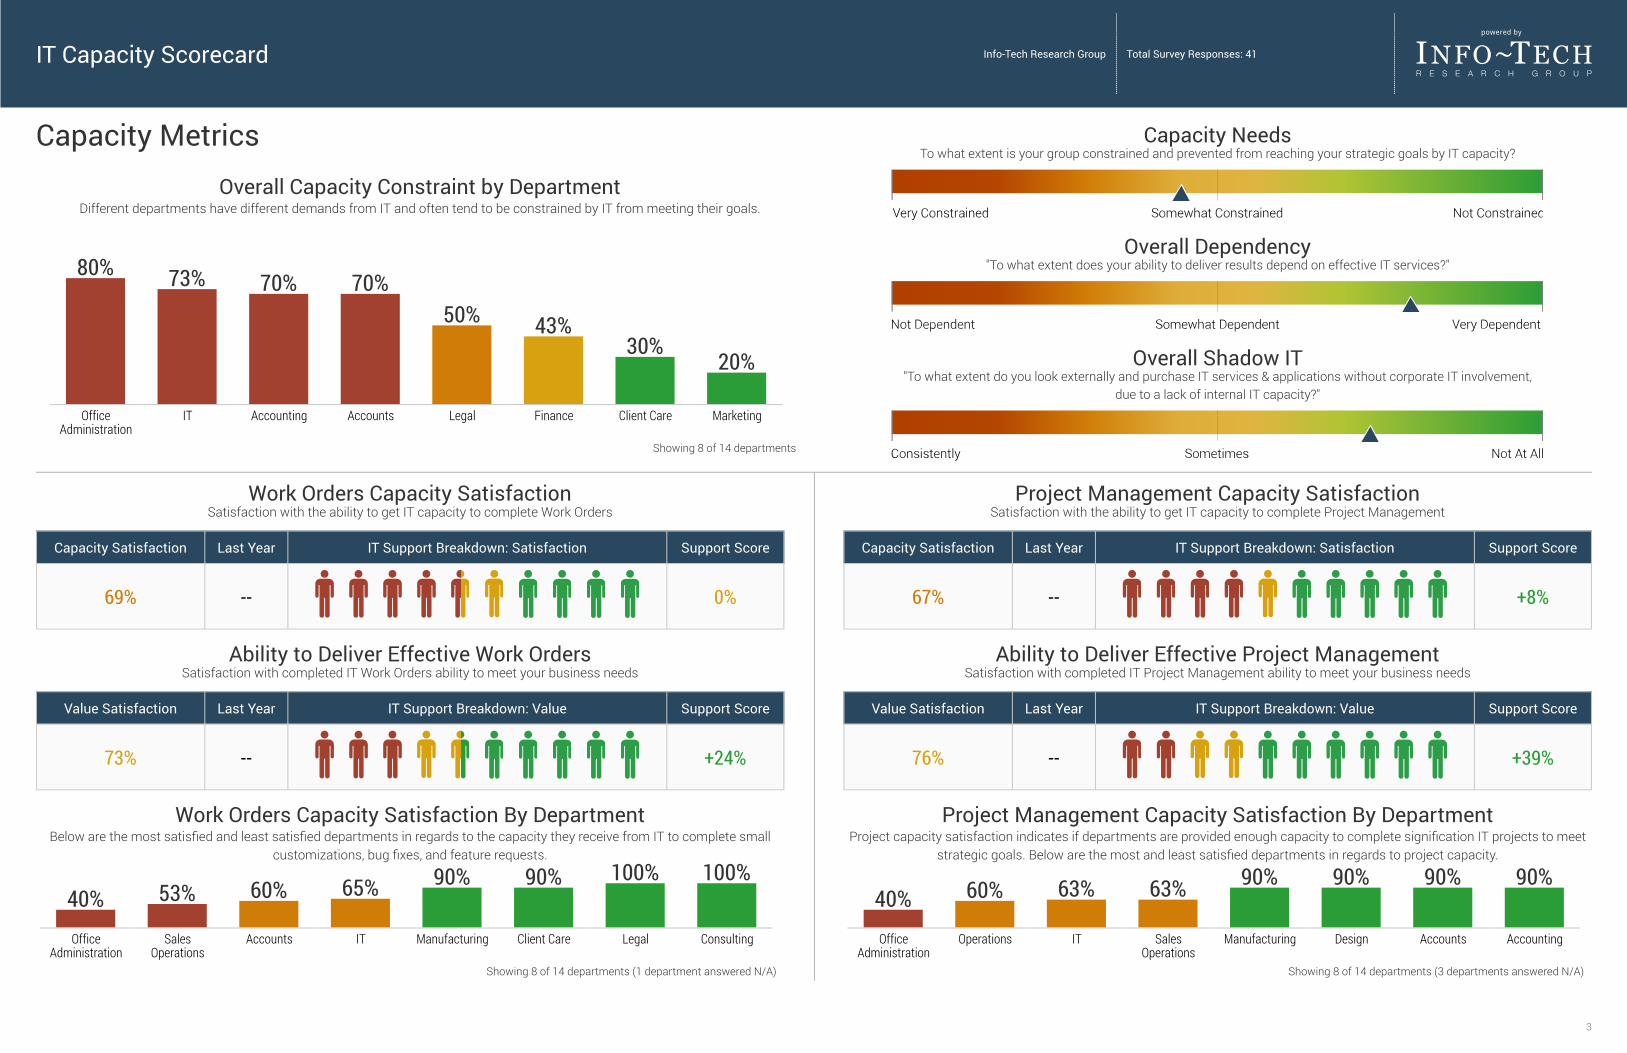
OfficeAdministration
80%
IT
73%
Accounting
70%
Accounts
70%
Legal
50%
Finance
43%
Client Care
30%
Marketing
20%
Capacity MetricsOverall Capacity Constraint by Department
Different departments have different demands from IT and often tend to be constrained by IT from meeting their goals.
Showing 8 of 14 departments
Capacity NeedsTo what extent is your group constrained and prevented from reaching your strategic goals by IT capacity?
Overall Dependency"To what extent does your ability to deliver results depend on effective IT services?"
Overall Shadow IT"To what extent do you look externally and purchase IT services & applications without corporate IT involvement,
due to a lack of internal IT capacity?"
OfficeAdministration
40%Sales
Operations
53%
Accounts
60%
IT
65%
Manufacturing
90%
Client Care
90%
Legal
100%
Consulting
100%
Work Orders Capacity SatisfactionSatisfaction with the ability to get IT capacity to complete Work Orders
Capacity Satisfaction Last Year IT Support Breakdown: Satisfaction Support Score
69% -- 0%
Ability to Deliver Effective Work OrdersSatisfaction with completed IT Work Orders ability to meet your business needs
Value Satisfaction Last Year IT Support Breakdown: Value Support Score
73% -- +24%
Work Orders Capacity Satisfaction By DepartmentBelow are the most satisfied and least satisfied departments in regards to the capacity they receive from IT to complete small
customizations, bug fixes, and feature requests.
Showing 8 of 14 departments (1 department answered N/A)
OfficeAdministration
40%Operations
60%
IT
63%
SalesOperations
63%
Manufacturing
90%
Design
90%
Accounts
90%
Accounting
90%
Project Management Capacity SatisfactionSatisfaction with the ability to get IT capacity to complete Project Management
Capacity Satisfaction Last Year IT Support Breakdown: Satisfaction Support Score
67% -- +8%
Ability to Deliver Effective Project ManagementSatisfaction with completed IT Project Management ability to meet your business needs
Value Satisfaction Last Year IT Support Breakdown: Value Support Score
76% -- +39%
Project Management Capacity Satisfaction By DepartmentProject capacity satisfaction indicates if departments are provided enough capacity to complete signification IT projects to meet
strategic goals. Below are the most and least satisfied departments in regards to project capacity.
Showing 8 of 14 departments (3 departments answered N/A)
IT Capacity Scorecard Info-Tech Research Group Total Survey Responses: 41
3
-1%
2%
3%
12%
14%
16%
18%
22%
23%
24%
26%
32%
44%
Service Gap ScoreThe chart below shows a comparison of satisfaction vs. Importance for all core services. Redbars with a negative score indicate an underserved core service. Green bars with a positivescore highlight core services that are potentially over-provisioned.
Service Gap Score
Administration Applications
Help Desk
Campus Infrastructure
Analytical Capability andReports
Data Quality
Classroom Technology
IT Innovation Leadership
Project Management
Campus Wi-Fi
Faculty and Staff Devices
Work Orders
Courseware and LearningManagement Technology
IT Policies
Score: Satisfaction - Importance
Importance Variation Core Service Satisfaction Variation
Administration Applications
Help Desk
Campus Infrastructure
Analytical Capability andReports
Data Quality
Classroom Technology
IT Innovation Leadership
Project Management
Campus Wi-Fi
Faculty and Staff Devices
Work Orders
Courseware and LearningManagement Technology
IT Policies
6 63%
6 67%
4 81%
7 65%
6 72%
7 73%
9 60%
8 71%
6 85%
7 76%
8 71%
8 76%
10 74%
Importance Variation by Core ToolFocusing on core services have a high degree ofconsensus around a high importance score willhave a broad impact across the organization.
Satisfaction Variation by Core ToolOutlying satisfaction scores can artificially inflateor defalte the average satisfaction score. Whenthis occurs, take a closer look at specificdepartments that are pulling the score down toisolate the pain point.
Core Service Overview Info-Tech Research Group Total Survey Responses: 41
4
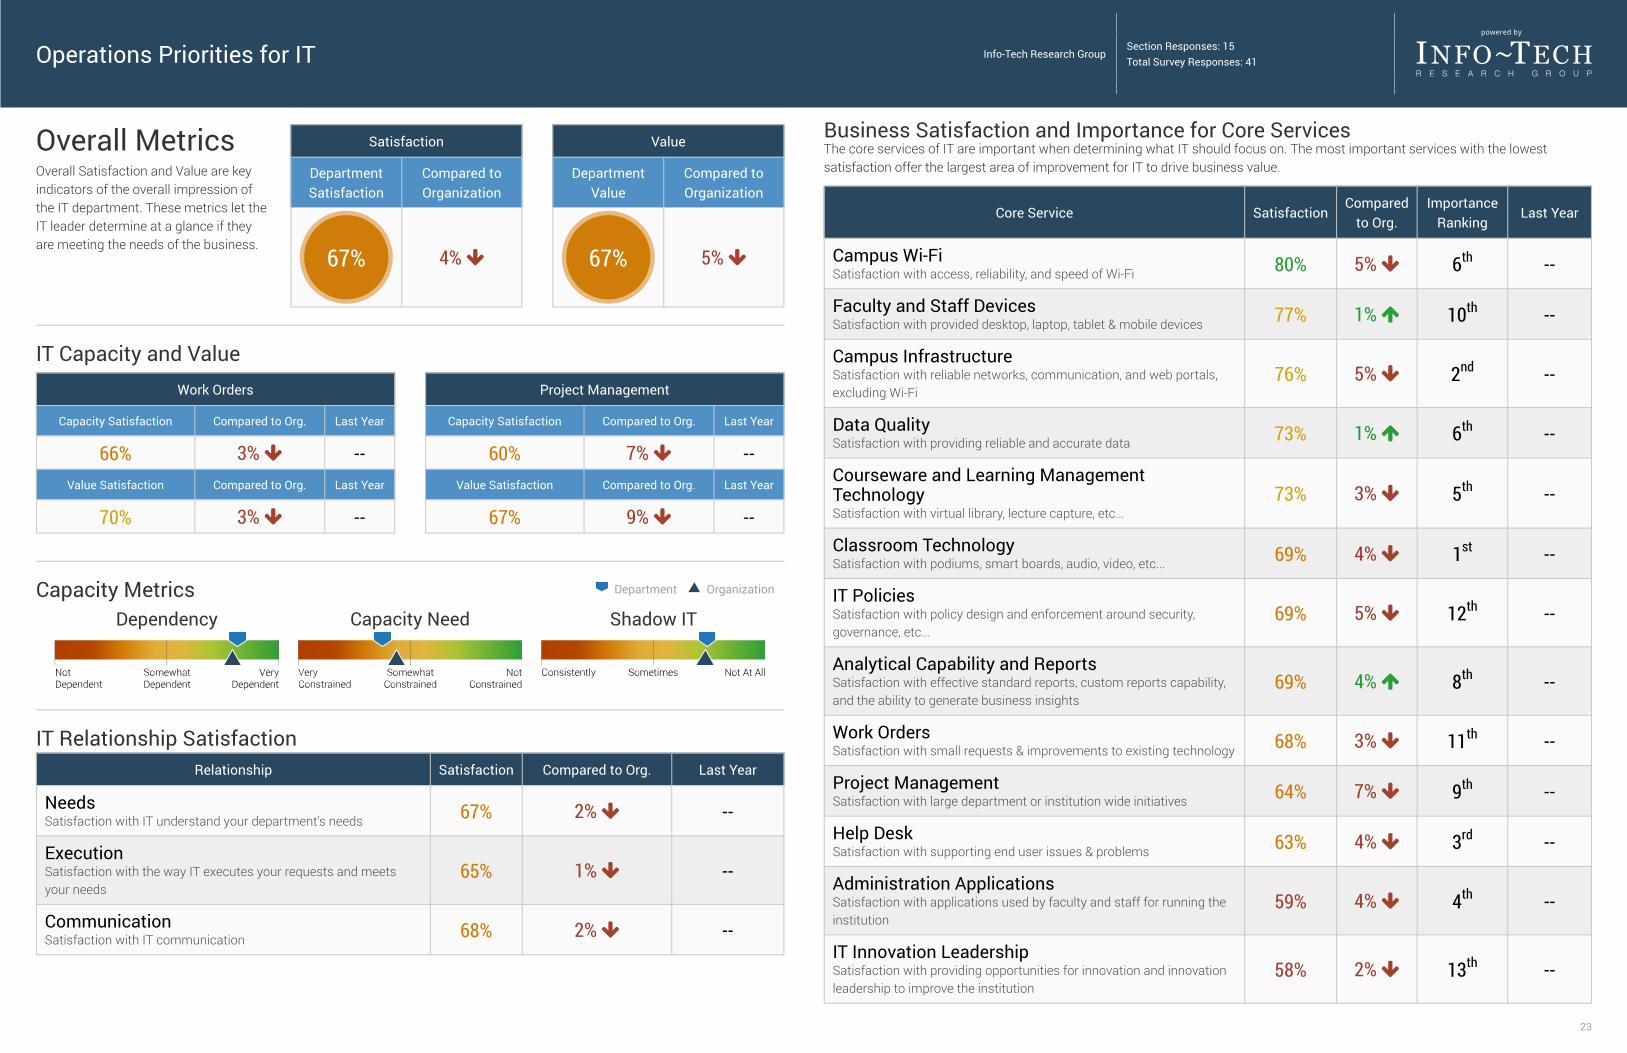
Work Orders
Capacity Satisfaction Compared to Org. Last Year
66% 3% --Value Satisfaction Compared to Org. Last Year
70% 3% --
Project Management
Capacity Satisfaction Compared to Org. Last Year
60% 7% --Value Satisfaction Compared to Org. Last Year
67% 9% --
IT Capacity and Value
IT Relationship SatisfactionRelationship Satisfaction Compared to Org. Last Year
NeedsSatisfaction with IT understand your department's needs 67% 2% --
ExecutionSatisfaction with the way IT executes your requests and meetsyour needs
65% 1% --
CommunicationSatisfaction with IT communication 68% 2% --
Overall MetricsOverall Satisfaction and Value are keyindicators of the overall impression ofthe IT department. These metrics let theIT leader determine at a glance if theyare meeting the needs of the business.
Satisfaction
DepartmentSatisfaction
Compared toOrganization
67% 4%
Value
DepartmentValue
Compared toOrganization
67% 5%
Dependency Capacity Need Shadow ITCapacity Metrics Department Organization
Business Satisfaction and Importance for Core ServicesThe core services of IT are important when determining what IT should focus on. The most important services with the lowestsatisfaction offer the largest area of improvement for IT to drive business value.
Core Service SatisfactionCompared
to Org.Importance
RankingLast Year
Campus Wi-FiSatisfaction with access, reliability, and speed of Wi-Fi 80% 5% 6th --
Faculty and Staff DevicesSatisfaction with provided desktop, laptop, tablet & mobile devices 77% 1% 10th --
Campus InfrastructureSatisfaction with reliable networks, communication, and web portals,excluding Wi-Fi
76% 5% 2nd --
Data QualitySatisfaction with providing reliable and accurate data 73% 1% 6th --
Courseware and Learning ManagementTechnologySatisfaction with virtual library, lecture capture, etc...
73% 3% 5th --
Classroom TechnologySatisfaction with podiums, smart boards, audio, video, etc... 69% 4% 1st --
IT PoliciesSatisfaction with policy design and enforcement around security,governance, etc...
69% 5% 12th --
Analytical Capability and ReportsSatisfaction with effective standard reports, custom reports capability,and the ability to generate business insights
69% 4% 8th --
Work OrdersSatisfaction with small requests & improvements to existing technology 68% 3% 11th --
Project ManagementSatisfaction with large department or institution wide initiatives 64% 7% 9th --
Help DeskSatisfaction with supporting end user issues & problems 63% 4% 3rd --
Administration ApplicationsSatisfaction with applications used by faculty and staff for running theinstitution
59% 4% 4th --
IT Innovation LeadershipSatisfaction with providing opportunities for innovation and innovationleadership to improve the institution
58% 2% 13th --
Operations Priorities for IT Info-Tech Research GroupSection Responses: 15Total Survey Responses: 41
23
Feedback Provided By: Melissa Lewis - Asst Dean, WCB Grad Programs, Karen Davis - Dean, CSSHE, Karen King - Assoc Dean, CAS, Mary Davis - Director, Graduate Services, Hank King - Dir,Health Svcs Administration, Jason Miller - Dir, WeekendDegree Program, James Hall - Dir, Student-Athl Acad Support, David Brown - Associate Dean, CAS, Kimberly Thomas - Director, Montessori Programs, Hank Clark - Assoc Provost,Academic Affairs,
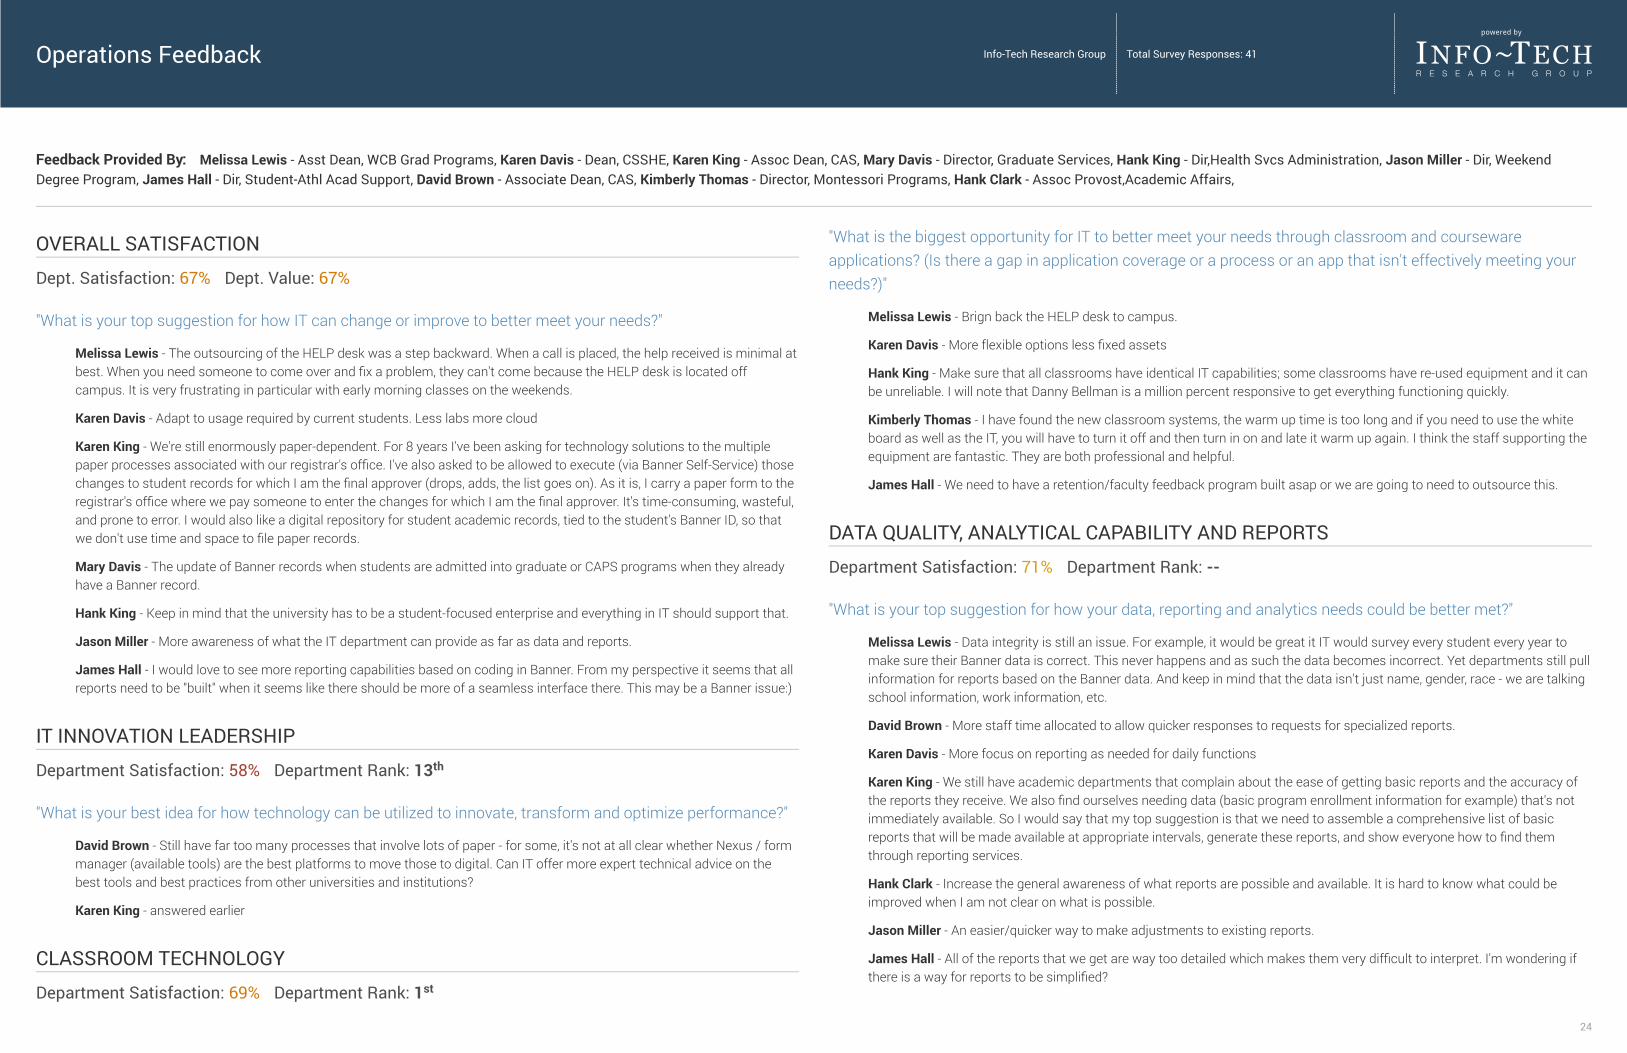
OVERALL SATISFACTION
Dept. Satisfaction: 67% Dept. Value: 67%
"What is your top suggestion for how IT can change or improve to better meet your needs?"
Melissa Lewis - The outsourcing of the HELP desk was a step backward. When a call is placed, the help received is minimal atbest. When you need someone to come over and fix a problem, they can't come because the HELP desk is located offcampus. It is very frustrating in particular with early morning classes on the weekends.
Karen Davis - Adapt to usage required by current students. Less labs more cloud
Karen King - We're still enormously paper-dependent. For 8 years I've been asking for technology solutions to the multiplepaper processes associated with our registrar's office. I've also asked to be allowed to execute (via Banner Self-Service) thosechanges to student records for which I am the final approver (drops, adds, the list goes on). As it is, I carry a paper form to theregistrar's office where we pay someone to enter the changes for which I am the final approver. It's time-consuming, wasteful,and prone to error. I would also like a digital repository for student academic records, tied to the student's Banner ID, so thatwe don't use time and space to file paper records.
Mary Davis - The update of Banner records when students are admitted into graduate or CAPS programs when they alreadyhave a Banner record.
Hank King - Keep in mind that the university has to be a student-focused enterprise and everything in IT should support that.
Jason Miller - More awareness of what the IT department can provide as far as data and reports.
James Hall - I would love to see more reporting capabilities based on coding in Banner. From my perspective it seems that allreports need to be "built" when it seems like there should be more of a seamless interface there. This may be a Banner issue:)
IT INNOVATION LEADERSHIP
Department Satisfaction: 58% Department Rank: 13th
"What is your best idea for how technology can be utilized to innovate, transform and optimize performance?"
David Brown - Still have far too many processes that involve lots of paper - for some, it's not at all clear whether Nexus / formmanager (available tools) are the best platforms to move those to digital. Can IT offer more expert technical advice on thebest tools and best practices from other universities and institutions?
Karen King - answered earlier
CLASSROOM TECHNOLOGY
Department Satisfaction: 69% Department Rank: 1st
"What is the biggest opportunity for IT to better meet your needs through classroom and coursewareapplications? (Is there a gap in application coverage or a process or an app that isn't effectively meeting yourneeds?)"
Melissa Lewis - Brign back the HELP desk to campus.
Karen Davis - More flexible options less fixed assets
Hank King - Make sure that all classrooms have identical IT capabilities; some classrooms have re-used equipment and it canbe unreliable. I will note that Danny Bellman is a million percent responsive to get everything functioning quickly.
Kimberly Thomas - I have found the new classroom systems, the warm up time is too long and if you need to use the whiteboard as well as the IT, you will have to turn it off and then turn in on and late it warm up again. I think the staff supporting theequipment are fantastic. They are both professional and helpful.
James Hall - We need to have a retention/faculty feedback program built asap or we are going to need to outsource this.
DATA QUALITY, ANALYTICAL CAPABILITY AND REPORTS
Department Satisfaction: 71% Department Rank: --
"What is your top suggestion for how your data, reporting and analytics needs could be better met?"
Melissa Lewis - Data integrity is still an issue. For example, it would be great it IT would survey every student every year tomake sure their Banner data is correct. This never happens and as such the data becomes incorrect. Yet departments still pullinformation for reports based on the Banner data. And keep in mind that the data isn't just name, gender, race - we are talkingschool information, work information, etc.
David Brown - More staff time allocated to allow quicker responses to requests for specialized reports.
Karen Davis - More focus on reporting as needed for daily functions
Karen King - We still have academic departments that complain about the ease of getting basic reports and the accuracy ofthe reports they receive. We also find ourselves needing data (basic program enrollment information for example) that's notimmediately available. So I would say that my top suggestion is that we need to assemble a comprehensive list of basicreports that will be made available at appropriate intervals, generate these reports, and show everyone how to find themthrough reporting services.
Hank Clark - Increase the general awareness of what reports are possible and available. It is hard to know what could beimproved when I am not clear on what is possible.
Jason Miller - An easier/quicker way to make adjustments to existing reports.
James Hall - All of the reports that we get are way too detailed which makes them very difficult to interpret. I'm wondering ifthere is a way for reports to be simplified?
Operations Feedback Info-Tech Research Group Total Survey Responses: 41
24
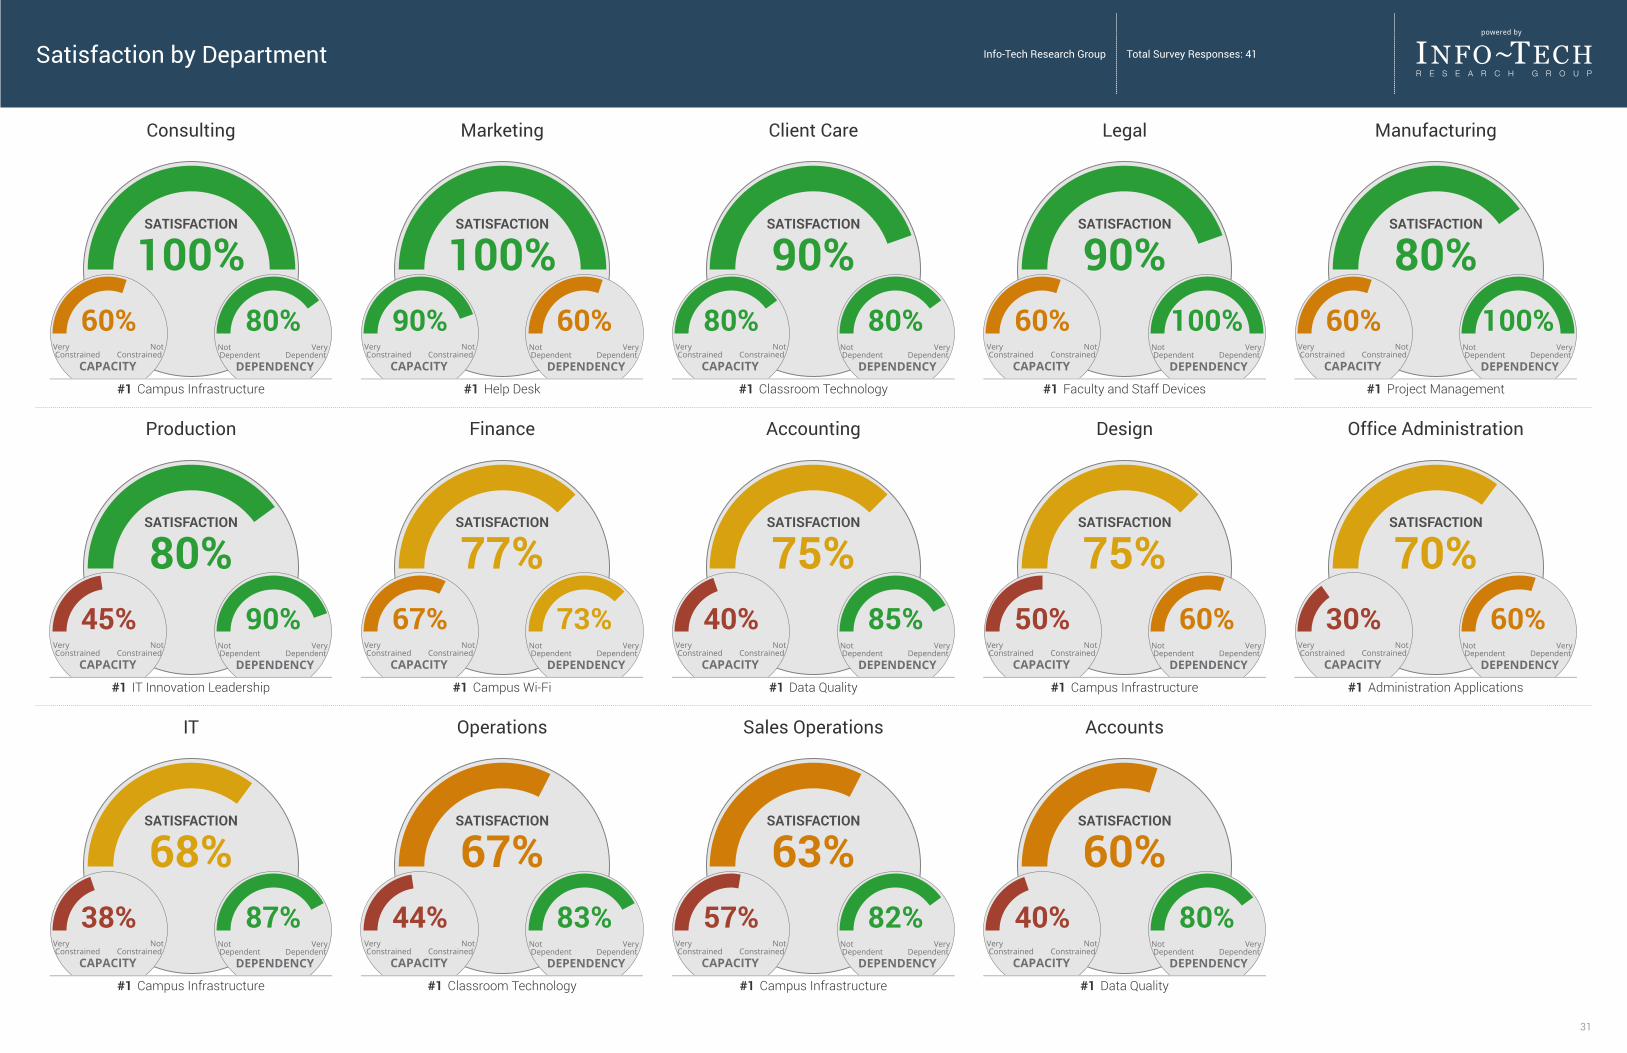
Consulting
SATISFACTION
100%60% 80%
#1 Campus Infrastructure
Marketing
SATISFACTION
100%90% 60%
#1 Help Desk
Client Care
SATISFACTION
90%80% 80%
#1 Classroom Technology
Legal
SATISFACTION
90%60% 100%
#1 Faculty and Staff Devices
Manufacturing
SATISFACTION
80%60% 100%
#1 Project Management
Production
SATISFACTION
80%45% 90%
#1 IT Innovation Leadership
Finance
SATISFACTION
77%67% 73%
#1 Campus Wi-Fi
Accounting
SATISFACTION
75%40% 85%
#1 Data Quality
Design
SATISFACTION
75%50% 60%
#1 Campus Infrastructure
Office Administration
SATISFACTION
70%30% 60%
#1 Administration Applications
IT
SATISFACTION
68%38% 87%
#1 Campus Infrastructure
Operations
SATISFACTION
67%44% 83%
#1 Classroom Technology
Sales Operations
SATISFACTION
63%57% 82%
#1 Campus Infrastructure
Accounts
SATISFACTION
60%40% 80%
#1 Data Quality
Satisfaction by Department Info-Tech Research Group Total Survey Responses: 41
31
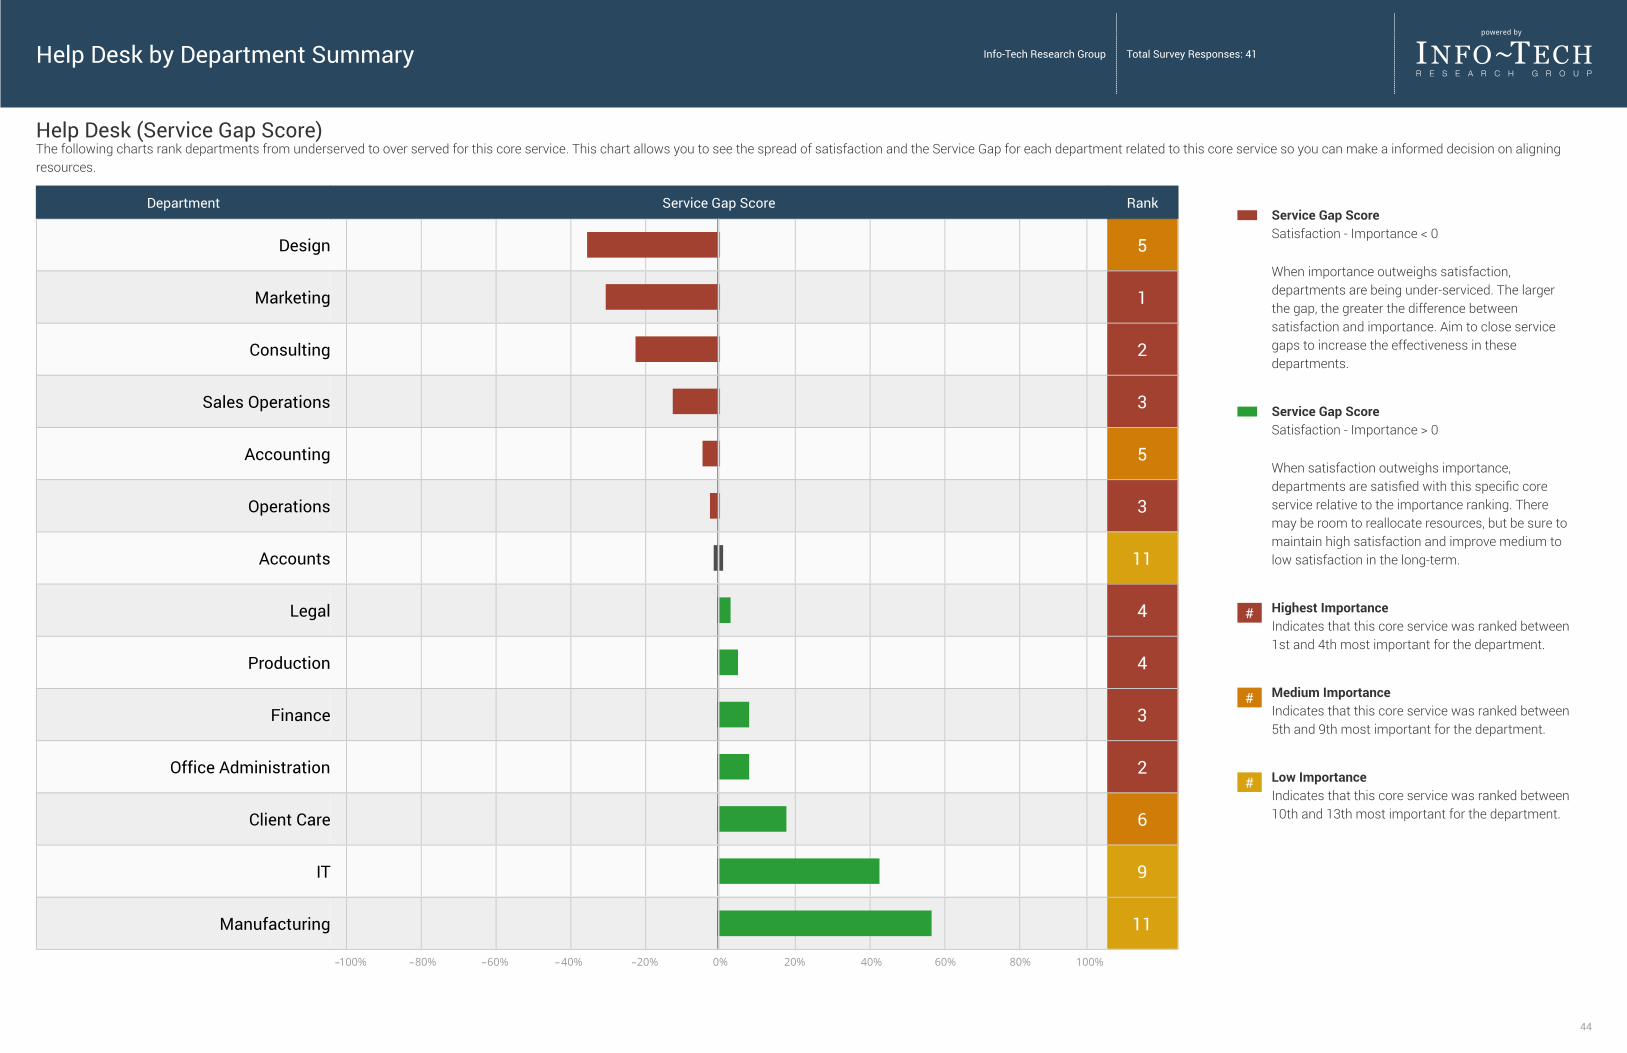
Department Service Gap Score Rank
Design 5
Marketing 1
Consulting 2
Sales Operations 3
Accounting 5
Operations 3
Accounts 11
Legal 4
Production 4
Finance 3
Office Administration 2
Client Care 6
IT 9
Manufacturing 11
Service Gap ScoreSatisfaction - Importance < 0
When importance outweighs satisfaction,departments are being under-serviced. The largerthe gap, the greater the difference betweensatisfaction and importance. Aim to close servicegaps to increase the effectiveness in thesedepartments.
Service Gap ScoreSatisfaction - Importance > 0
When satisfaction outweighs importance,departments are satisfied with this specific coreservice relative to the importance ranking. Theremay be room to reallocate resources, but be sure tomaintain high satisfaction and improve medium tolow satisfaction in the long-term.
# Highest ImportanceIndicates that this core service was ranked between1st and 4th most important for the department.
# Medium ImportanceIndicates that this core service was ranked between5th and 9th most important for the department.
# Low ImportanceIndicates that this core service was ranked between10th and 13th most important for the department.
Help Desk (Service Gap Score)The following charts rank departments from underserved to over served for this core service. This chart allows you to see the spread of satisfaction and the Service Gap for each department related to this core service so you can make a informed decision on aligningresources.
Help Desk by Department Summary Info-Tech Research Group Total Survey Responses: 41
44