Embed Size (px)
Citation preview
IT6711 DATA MINING LABORATORY
DEPARTMENT OF INFORMATION TECHNOLOGY
IT6711 – DATA MINING LABORATORY
IV Year VII Semester
Prepared By,
D.SUDHAGAR,
Asst.Professor-III, Department Of Information Technology,
Jerusalem College of Engineering, Pallikkaranai, Chennai – 600100.
Jerusalem College of Engineering Department of IT
IT6413 DATA MINING LABORATORY 1
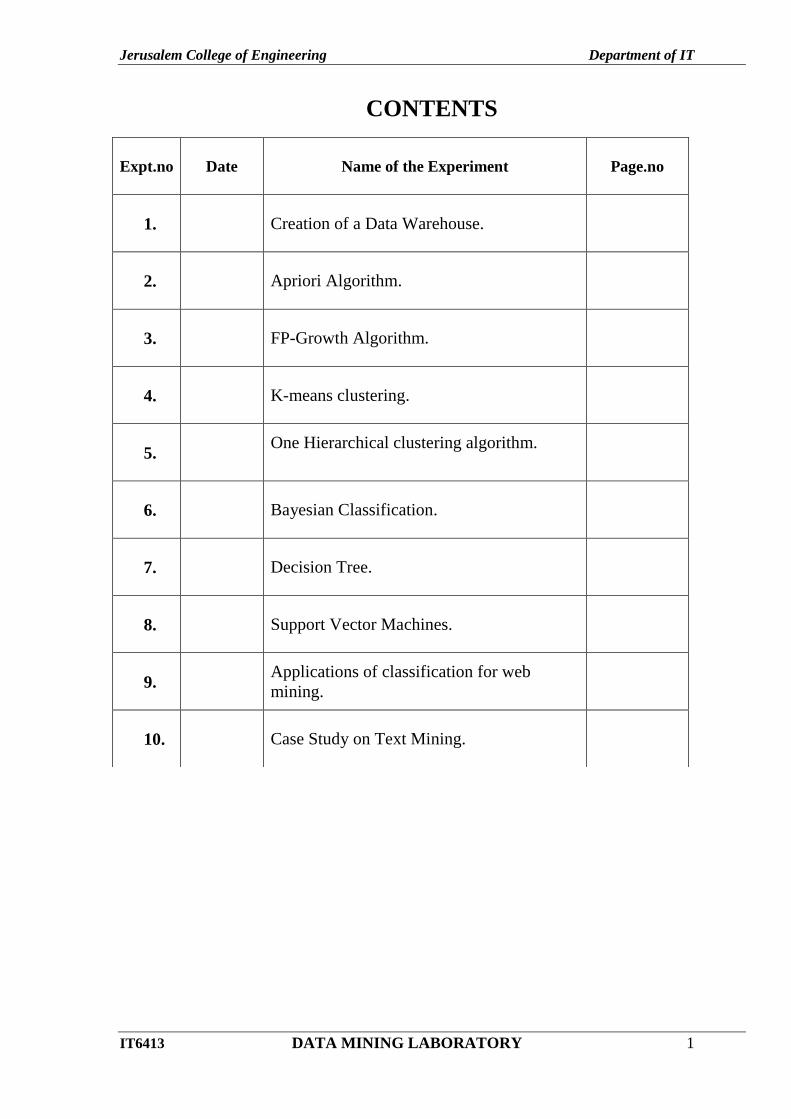
CONTENTS
Expt.no Date Name of the Experiment Page.no
1.
Creation of a Data Warehouse.
2.
Apriori Algorithm.
3.
FP-Growth Algorithm.
4.
K-means clustering.
5.
One Hierarchical clustering algorithm.
6.
Bayesian Classification.
7.
Decision Tree.
8.
Support Vector Machines.
9.
Applications of classification for web
mining.
10.
Case Study on Text Mining.
Jerusalem College of Engineering Department of IT
IT6413 DATA MINING LABORATORY 2
(Using ETL Tool – Extract -Transform-Load)
AIM:
To create a data warehouse from various .csv files using Postgrsql tool.
WHAT IS A DATA WAREHOUSE?
Data warehouse databases are designed for query and analysis, not transactions. The data
that is collected from various sources is separated into analytic and transaction workloads while
enabling extraction, reporting, data mining and a number of different capabilities that transform
the information into actionable, useful applications.
The main data warehouse structures listed are the basic architecture, which is a simple set
up that allows end-users to directly access the data from numerous sources through the
warehouse, a second architecture is a warehouse with a staging area that simplifies warehouse
management and helps with cleaning and processing the data before it is loaded into the
warehouse. And finally there is the architecture with both a staging area and a data mart. Data
marts are used to create and maintain custom categories in organizations with specialized
database designed for specific businesses, so for example if an organization had a data warehouse
for sales, separate from advertising, then the data mart setup would best serve their needs. To
further understand a data warehouse, it is important to look at its characteristics, which are
subject orientation, integration, non-volatility, and time variance.
Subject Oriented: This refers to when data is giving information on a particular subject.
For example, a company could use data to analyze their company‘s marketing data, and it‘s
effectiveness. The devotion of a data warehouse to a specific matter is the key component
of a subject-oriented warehouse.
Integrated: This is when data gathered from a number of disparaging sources, and then all
gathered into a coherent whole. By organizing differing data into consistent formats,
companies can resolve problems and inconsistencies among units of measurement and
promote better results.
Nonvolatile: This refers to data that remains stable and unaffected by new developments.
Once entered into the system, this data should not change, ensuring comparison analysis
over a long period of time.
Time Variant: This refers to data gathered is identified with a particular time period and
focuses on change over time. By using a large amount of data, spread over a long time
Ex no: 1
Date: CREATION OF A DATA WAREHOUSE
Jerusalem College of Engineering Department of IT
IT6413 DATA MINING LABORATORY 3
period, analysts can decipher patterns, and business relationships that would have
otherwise been overlooked.
DATA WAREHOUSE INTEGRATION PROCESS
The whole purpose of data mining is to facilitate business analysis. And to accomplish
this, raw data must be arranged and consolidated into an information base usable by the firm.
This process is referred to as ETL (Extract, Transform, & Load), which though it may seem like
specified steps, is in opposition referring to a broader concept.
EXTRACTION
This step in the process refers to removing the data from its source and making it
accessible for further processing. All the needed data is retrieved without affecting the source
system‘s performance, response time or locking in a negative manner. This first step in the ETL
process usually involves a cleaning phase in which data quality is ensured through data
unification. The rules of unification should include things such as making identifiers unique such
as gender categories, phone number, and zip code conversions into standard form and validation
of address fields converted into the proper format.
TRANSFORMATION This step applies a set of rules to change source data into similar dimensions so the same
units of measurement can be used. This transformation step also joins data from a variety of
sources, generates aggregates, surrogate keys and applies validation and new values.
LOADING The loading phase is a two-part process of disabling constraints and indexes before the
load process starts and then enables them once the load is completed. In this step, the target of the
load process is often a database.
SETTING UP A DATA WAREHOUSE
The main purpose of a data warehouse is to organize large amounts of stable data to be
easily retrieved and analyzed. So when setting up, care must be taken to ensure the data is rapidly
accessible and easily analyzed. One way of designing this system is with the use of dimensional
modeling, which allows large volumes of data to be efficiently queried and examined. Since
much of the data in warehouses is stable, that is, unchanging, there is hardly a need for repetitive
backup methods. Also, once new data is loaded it can be updated and backed up right away by
way of, in some cases, the data preparation database, so it becomes available for easy access.
There are four categories of data warehousing tools; these are extraction, table management,
query management and data integrity tools. All these tools can be used in the setup and
Jerusalem College of Engineering Department of IT
IT6413 DATA MINING LABORATORY 4
maintenance of the best technology to manage and store the huge amounts of data a company
collects, analyzes and reviews.
COMPANY ANALYSIS
The first step, in setting up the company‘s data warehouse, is to evaluate the firm‘s
objectives, For example, a growing company might set the objective to engage customers in
building rapport. By examining what the company needs to do to achieve these tasks, what will
need to be tracked, the key performance indicators to be noted and a numeric evaluation of the
company‘s activities the company can note and evaluate where they need to get started.
EXISTING SYSTEM ANALYSIS
By asking customers and various stakeholders pointed questions, Business Intelligence
leaders can gather the performance information they currently have in place that is or isn‘t
effective. Reports can be collected from various departments in the company, and they may even
be able to collect analytical and summary reports from analysts and supervisors.
INFORMATION MODELING OF CORE BUSINESS PROCESSES
An information model is conceptual, and allows for one to form ideas of what business
processes need to be interrelating and how to get them linked. Since the data warehouse is a
collection of correlating structures, creating a concept of what indicators need to be linked
together to create top performance levels is a vital step in the information modeling stage. A
simple way to design this model is to gather key performance indicators into fact tables and relate
them to dimensions such as customers, salespeople, products and such.
DESIGN AND TRACK
Once all those concepts are set in place, the next critical step is to move data into the
warehouse structure and track where it comes from and what it relates to. In this phase of design,
it is crucial to plan how to link data in the separate databases so that the information can be
connected as it is loaded into the data warehouse tables. The ETL process can be pretty complex
and require specialized programs with sophisticated algorithms, so the right tools have to be
chosen at the right, and most cost effective price for the job. Because the data is to be tracked
over time, the data will need to be available for a very long period. However the grain (atoms or
make up) of the data will defer over time, but the system should be set that the differing
granularity is still consistent throughout the singular data structure.
IMPLEMENTATION OF THE PLAN
Once the plan is developed, there is a viable basis for scheduling the project. Because the
project is grand, there should be phases of completion scheduled and then fit together upon
Jerusalem College of Engineering Department of IT
IT6413 DATA MINING LABORATORY 5
completion. With careful planning, the system can provide much-needed information on how
factors work together to help the organizations activities.
UPDATES
Since the data warehouse is set to retain data for long stretches at many levels of
granularity and has already been set to be consistent throughout the system, in the design phase
of the warehouse setup, there can be various storage plans that tie into the non-repetitive update.
As an example, an IT manager could set up a week and monthly grain storage systems. In the day
grain, data is stored in its original format for 2-3 years, after which it is summarized and moved
to the weekly grain structure where it could remain for another 3-5 years and then finally to a
monthly grain structure. This can all be set at the design phase to work with the different grains
based on data age and be done automatically.
DATA WAREHOUSE COMPONENTS
So as was the case in the design and set up phase of the warehouse, data was merged from
varying sources into a single related database. And so far we have seen that the point of creating
this warehouse structure is to retrieve information faster and more easily so a firm can market
faster, create more revenue, improve service standards and manage industry changes.
LOAD MANAGEMENT
Load management refers to the collection of information from varying internal and
external sources and summarizing, manipulating and changing the data into a format that allows
for analysis. To manage the load, raw data must be kept along with the changed versions to
enable construction of different representations as needed.
WAREHOUSE MANAGEMENT
Warehouse management is the day-by-day management of a data warehouse that ensures
the information is available and effectively backed up and secure.
QUERY MANAGEMENT
Query management allows access to the warehouse contents and may even include the
tasks of separating information into various categories to be presented to different users. Users
may access information through query tools or custom built applications.
DATA WAREHOUSE BACKUP, STORAGE & TOOLS
Like any other program, data warehouses can be tedious to design create and implement,
so special measures should be in place to ensure the information is not lost.
BACKUP AND RESTORATION
An automatic system should be put in place to ensure the information is secure and that if
needed data can be restored quickly and with little or no negative alterations. The first and most
vital step is to ensure the original information source is backed up and then following that a
Jerusalem College of Engineering Department of IT
IT6413 DATA MINING LABORATORY 6
weekly backup of the entire warehouse as it could prove costly to have to recreate the entire
system from scratch. The use of cold and multiplexing backup systems will ensure less need for
restoration. However, a disaster recovery site should be made available for copies of all key
system components. The simplest way to achieve this is using a system that automatically creates
copies and sends them to the disaster site. But there are systems that can copy hybrid database
systems and create the backup if that is needed as well.
ONLINE AND OFFLINE STORAGE
Data storage should be done both online and offline to avoid overwhelming the system or
having ―disk full‖ issues. With the system setup to store data in different granularity settings,
one could stash older, raw data and unused or rarely used reports and multimedia offline. The
implementation of hierarchical storage management (storing files automatically to a secondary
source while allowing users access) is a smart move after implementing the data warehouse
setup.
STORAGE TOOLS
There are a few tools being created to rectify the storage issues that occur with data warehouses.
Storage Manager takes care of all the storage objects such as file systems, database,
network intelligence devices and disk and tape arrays. This system also collects data about
data, performs administrative duties and among other things let you see the health of your
data warehouse.
Storage Optimizer is another product that can be used for recommendations of actions
that will remove hot spots and improve online performance and reliability. It will also
include actions to take for offline storage based on historical patterns.
Storage Planner enables planning for large online and offline database capacity. This
program focuses on large, international databases and warehouses.
Jerusalem College of Engineering Department of IT
IT6413 DATA MINING LABORATORY 7
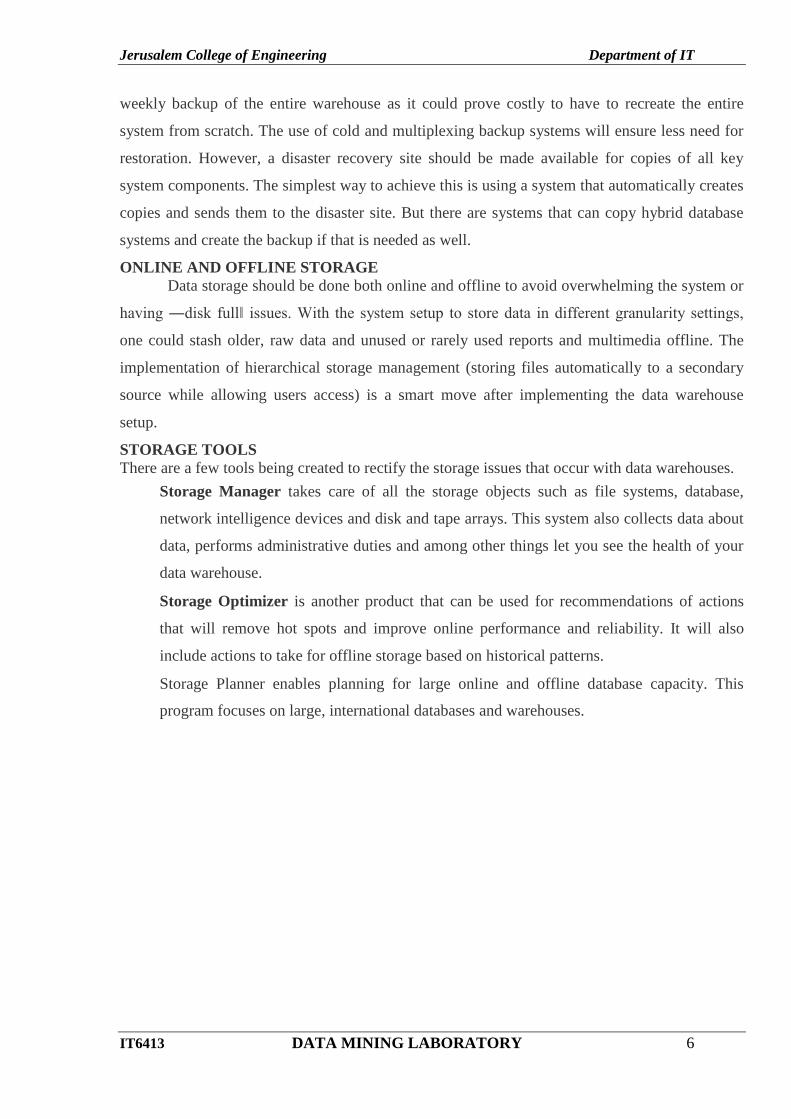
Create Data Warehouse using Postgresql tool (ETL Tool) STEPS:
1.Click Start –AllPrograms – PostgreSQL 9.3 – click pgAdmin III
2.Click this icon
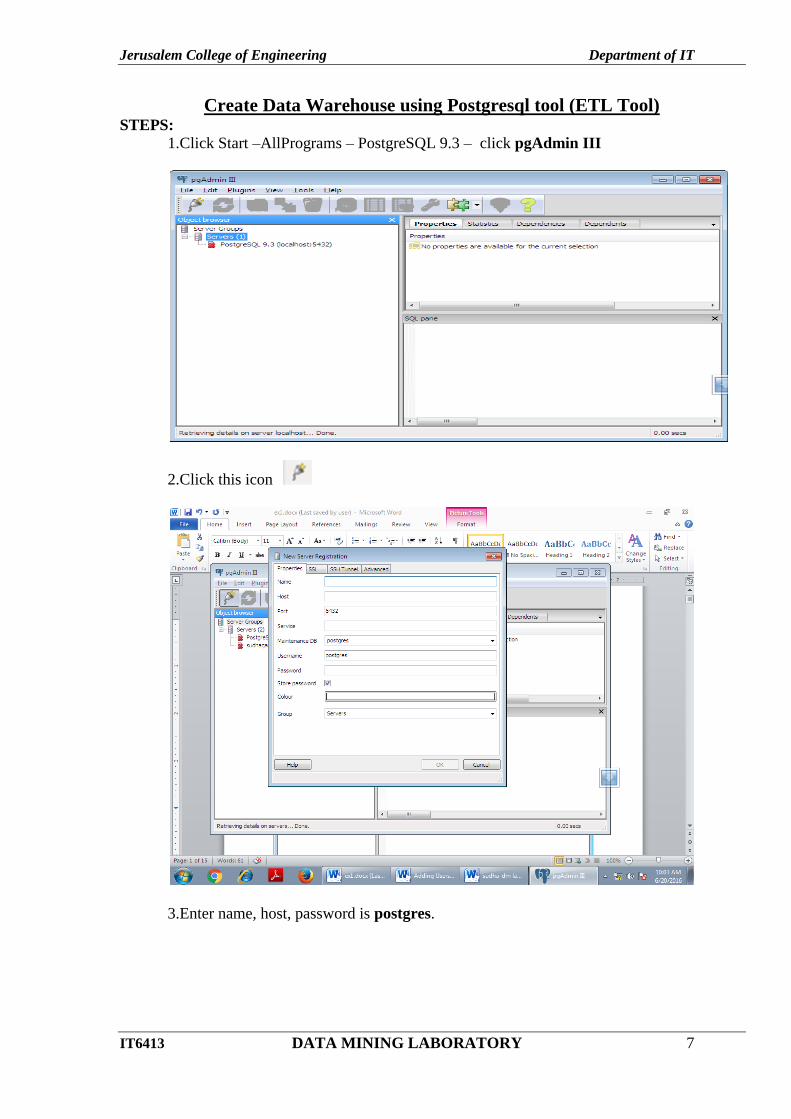
3.Enter name, host, password is postgres.
Jerusalem College of Engineering Department of IT
IT6413 DATA MINING LABORATORY 8
4. Double click sudhagar(localhost:5432)
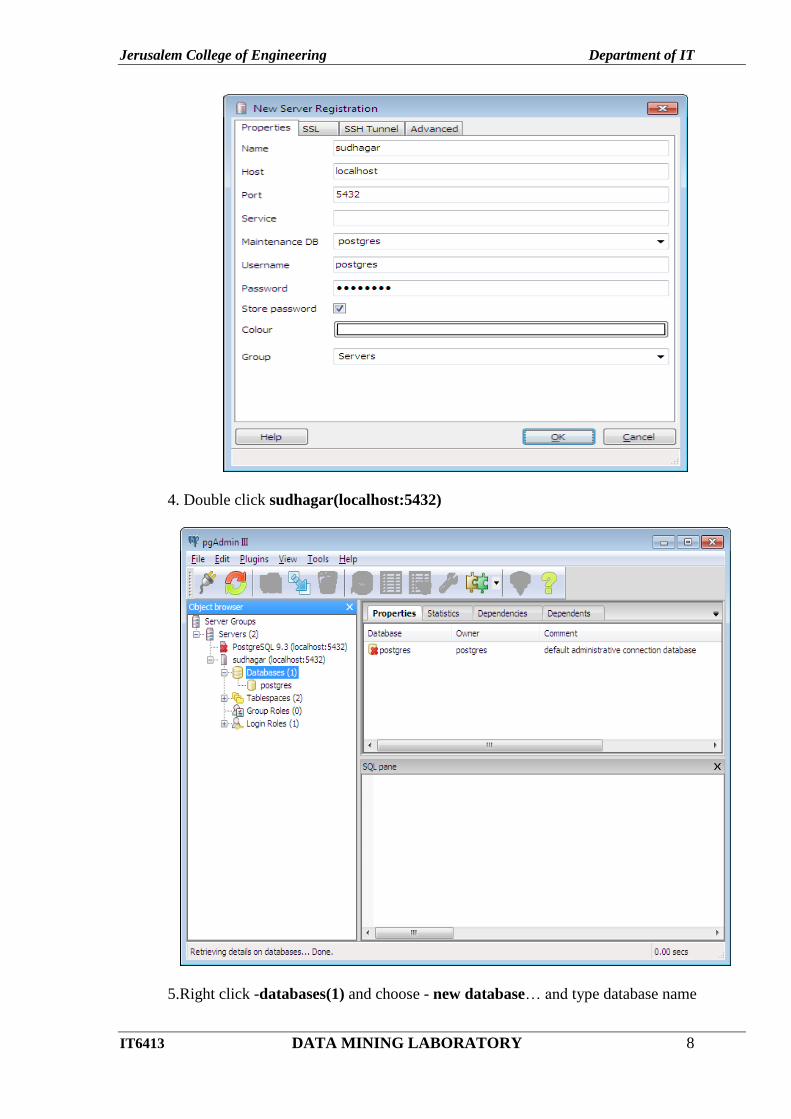
5.Right click -databases(1) and choose - new database… and type database name
Jerusalem College of Engineering Department of IT
IT6413 DATA MINING LABORATORY 9
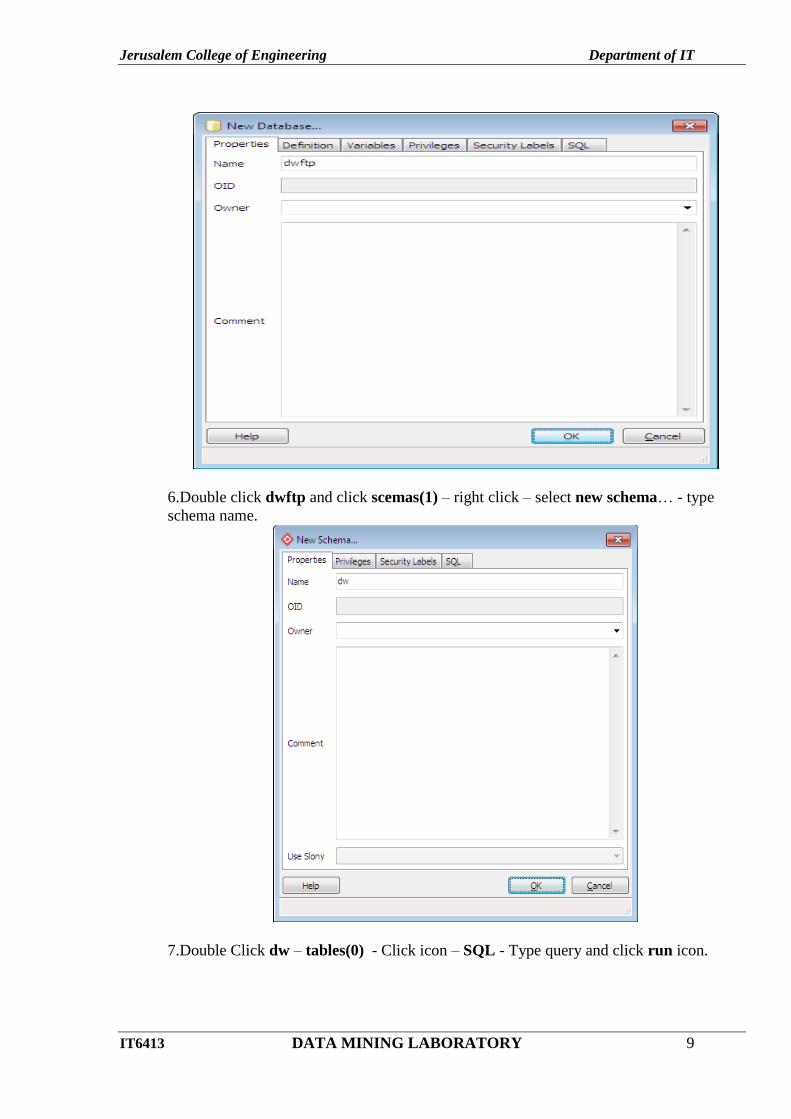
6.Double click dwftp and click scemas(1) – right click – select new schema… - type
schema name.
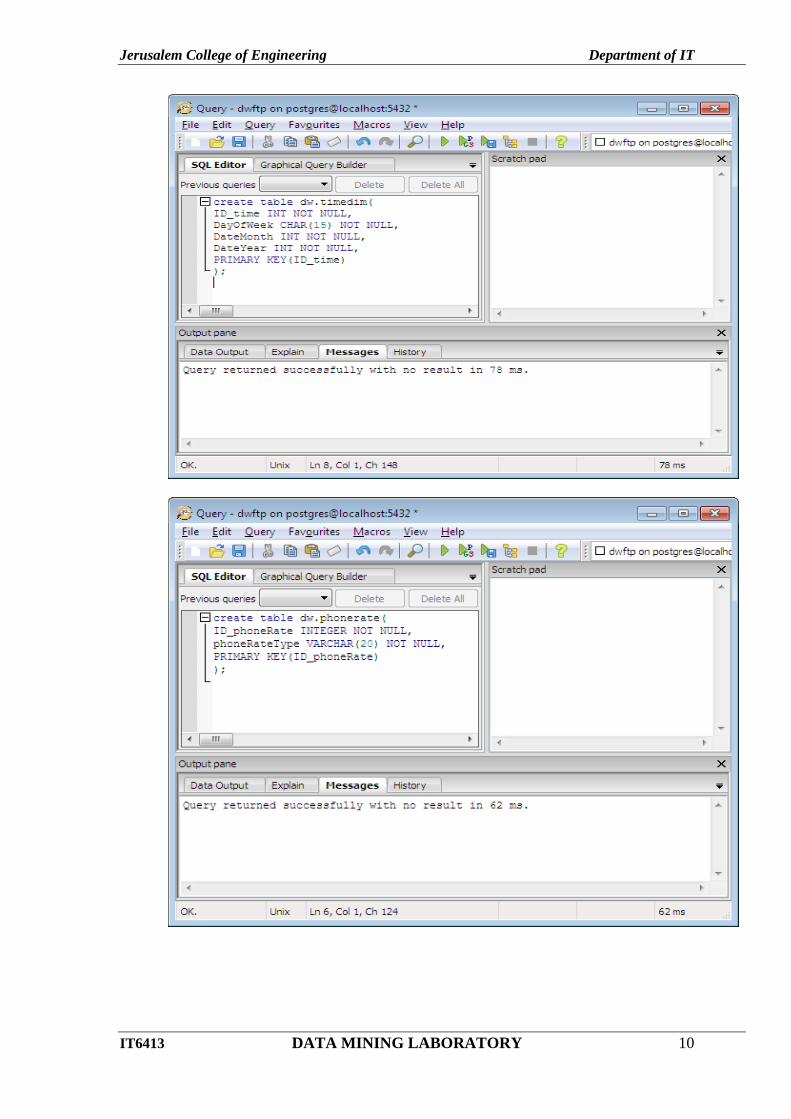
7.Double Click dw – tables(0) - Click icon – SQL - Type query and click run icon.
Jerusalem College of Engineering Department of IT
IT6413 DATA MINING LABORATORY 10
Jerusalem College of Engineering Department of IT
IT6413 DATA MINING LABORATORY 11
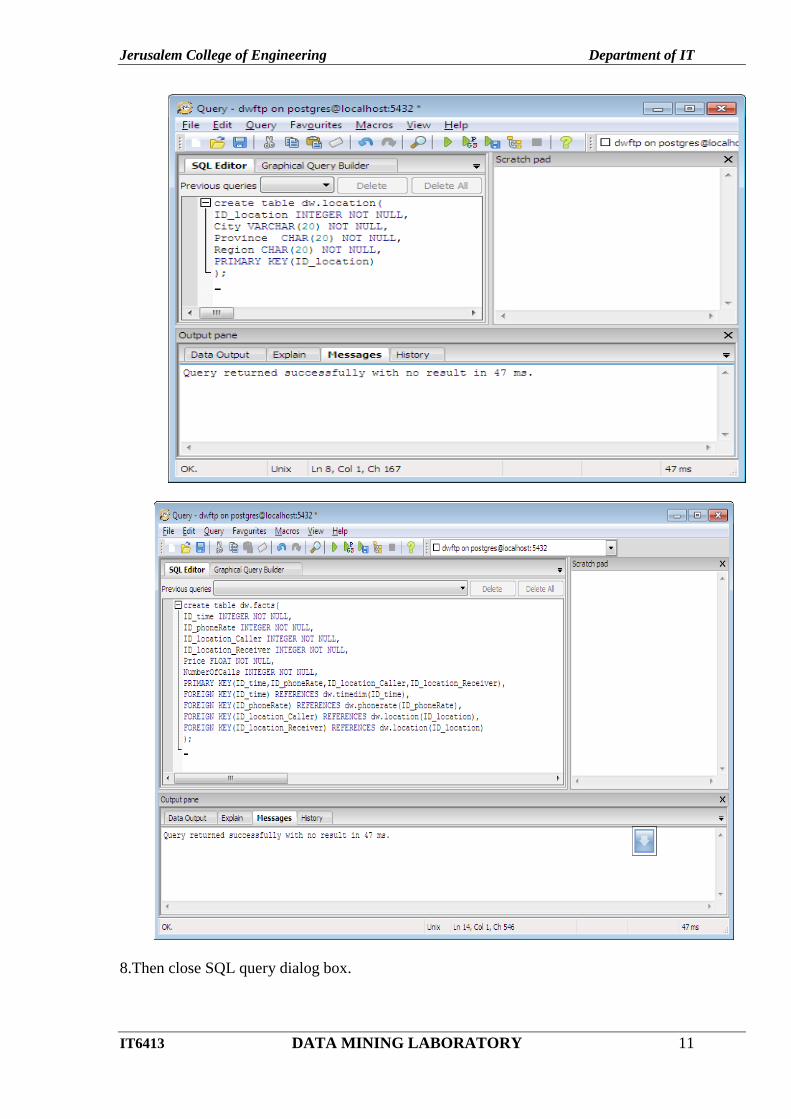
8.Then close SQL query dialog box.
Jerusalem College of Engineering Department of IT
IT6413 DATA MINING LABORATORY 12
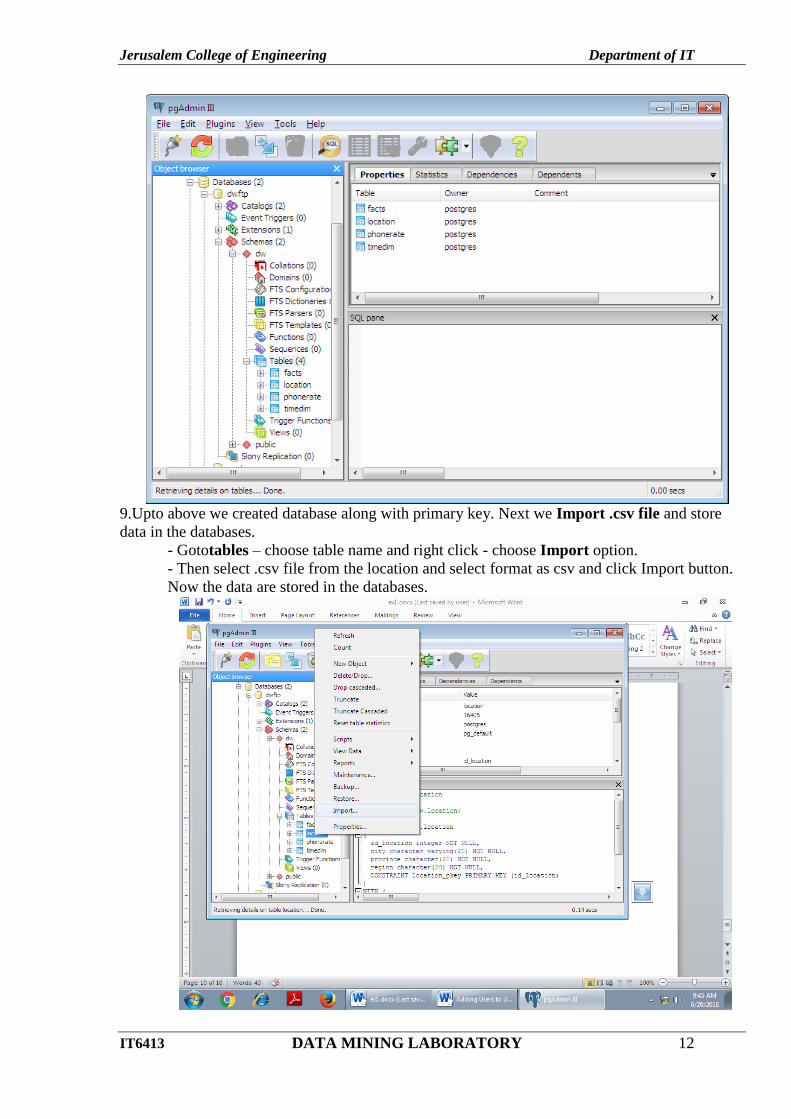
9.Upto above we created database along with primary key. Next we Import .csv file and store
data in the databases.
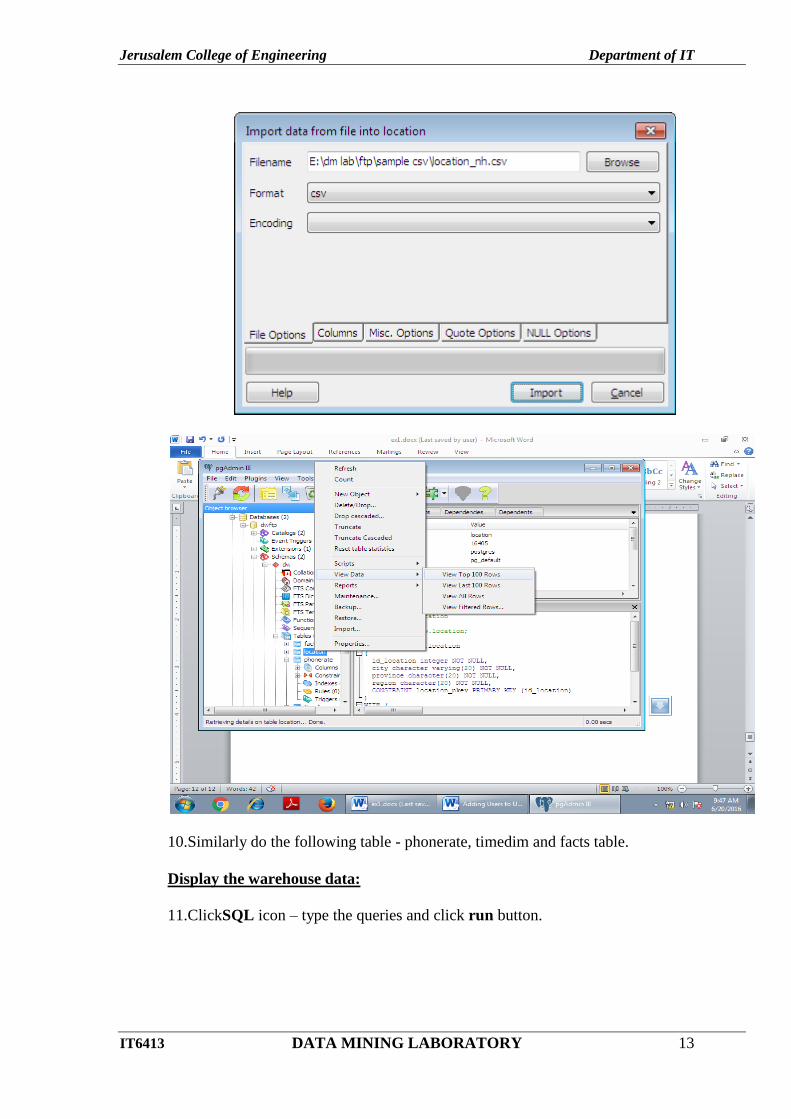
- Gototables – choose table name and right click - choose Import option.
- Then select .csv file from the location and select format as csv and click Import button.
Now the data are stored in the databases.
Jerusalem College of Engineering Department of IT
IT6413 DATA MINING LABORATORY 13
10.Similarly do the following table - phonerate, timedim and facts table.
Display the warehouse data:
11.ClickSQL icon – type the queries and click run button.
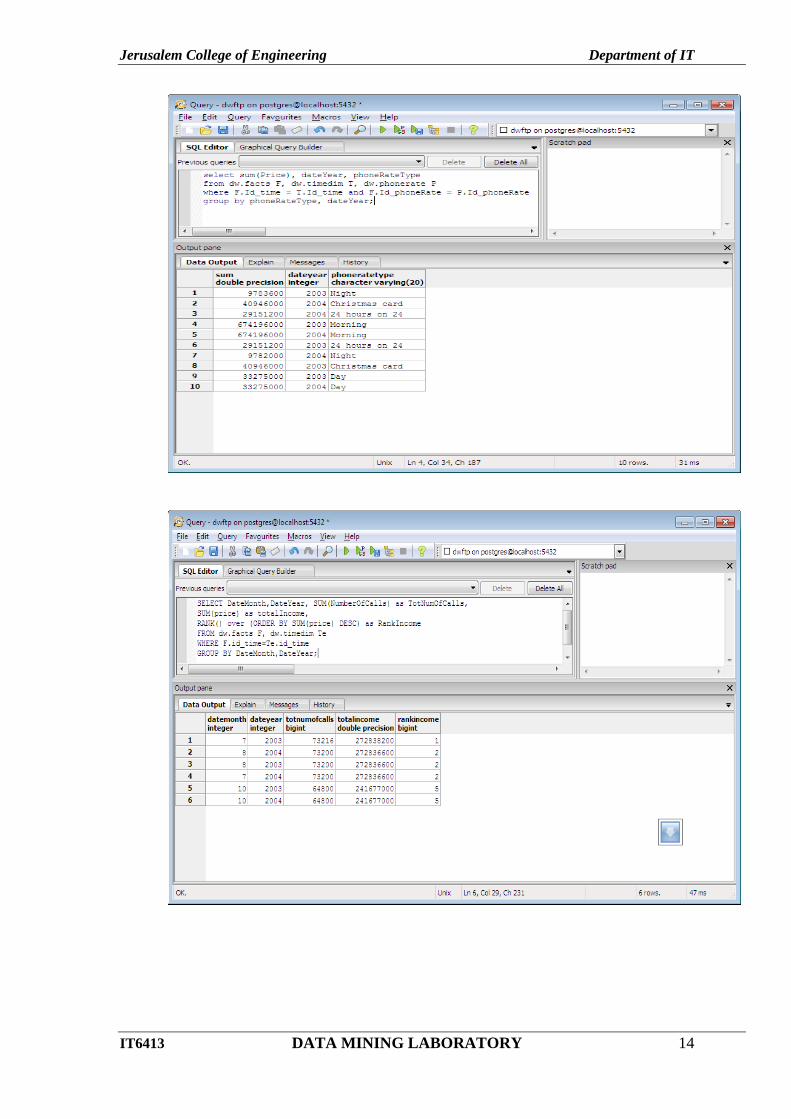
Jerusalem College of Engineering Department of IT
IT6413 DATA MINING LABORATORY 14
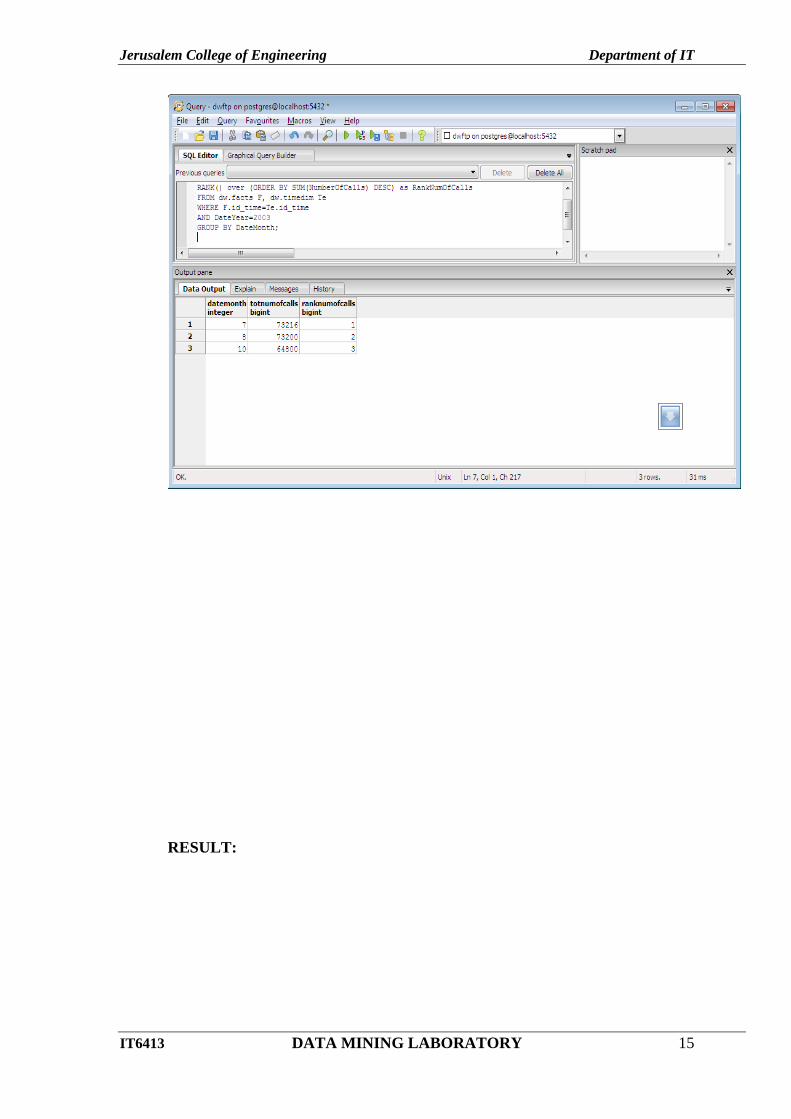
Jerusalem College of Engineering Department of IT
IT6413 DATA MINING LABORATORY 15
RESULT:
Jerusalem College of Engineering Department of IT
IT6413 DATA MINING LABORATORY 16
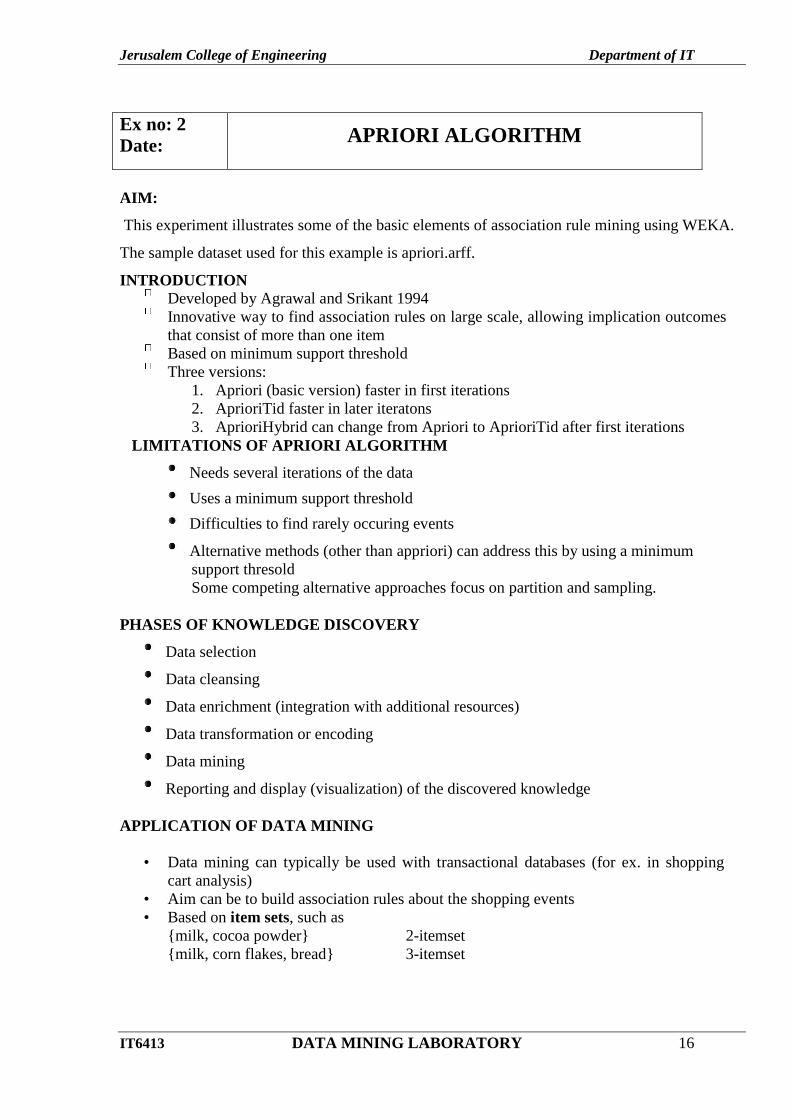
Ex no: 2
Date: APRIORI ALGORITHM
AIM:
This experiment illustrates some of the basic elements of association rule mining using WEKA.
The sample dataset used for this example is apriori.arff.
INTRODUCTION
Developed by Agrawal and Srikant 1994
Innovative way to find association rules on large scale, allowing implication outcomes
that consist of more than one item
Based on minimum support threshold
Three versions:
1. Apriori (basic version) faster in first iterations
2. AprioriTid faster in later iteratons
3. AprioriHybrid can change from Apriori to AprioriTid after first iterations
LIMITATIONS OF APRIORI ALGORITHM
Needs several iterations of the data
Uses a minimum support threshold
Difficulties to find rarely occuring events
Alternative methods (other than appriori) can address this by using a minimum
support thresold
Some competing alternative approaches focus on partition and sampling.
PHASES OF KNOWLEDGE DISCOVERY
Data selection
Data cleansing
Data enrichment (integration with additional resources)
Data transformation or encoding
Data mining
Reporting and display (visualization) of the discovered knowledge
APPLICATION OF DATA MINING
• Data mining can typically be used with transactional databases (for ex. in shopping
cart analysis)
• Aim can be to build association rules about the shopping events
• Based on item sets, such as
{milk, cocoa powder} 2-itemset
{milk, corn flakes, bread} 3-itemset
Jerusalem College of Engineering Department of IT
IT6413 DATA MINING LABORATORY 17
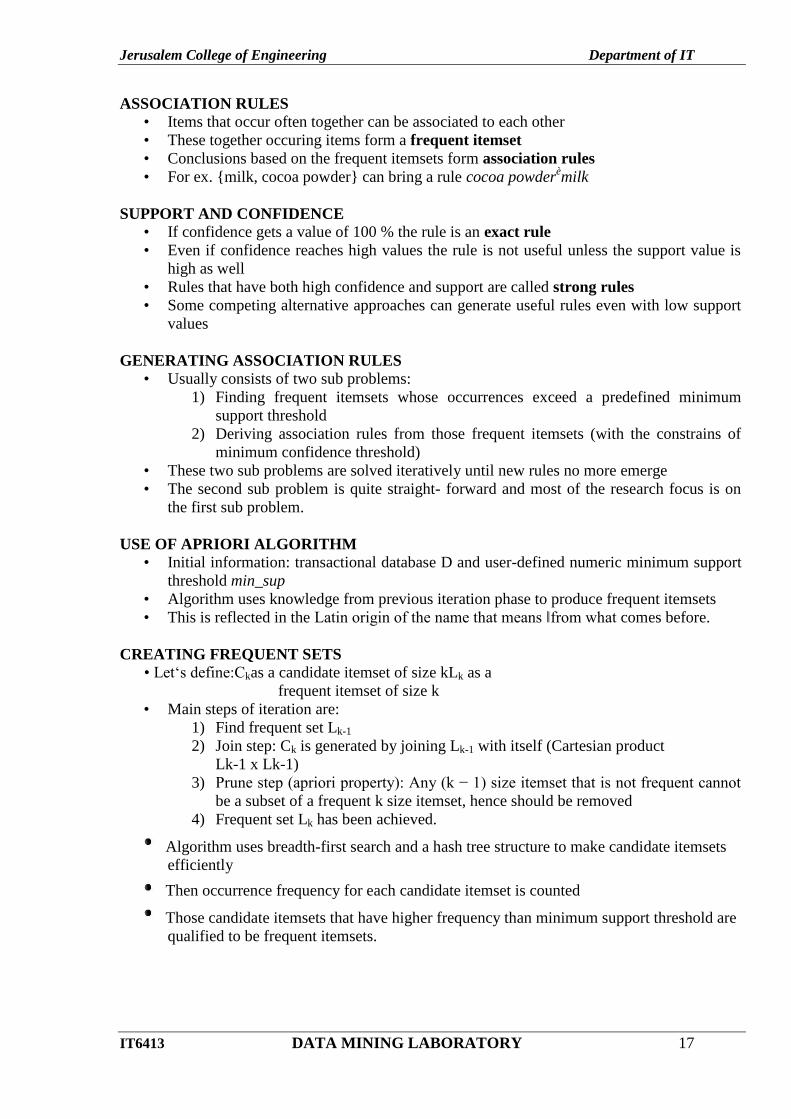
ASSOCIATION RULES
• Items that occur often together can be associated to each other
• These together occuring items form a frequent itemset
• Conclusions based on the frequent itemsets form association rules
• For ex. {milk, cocoa powder} can bring a rule cocoa powderèmilk
SUPPORT AND CONFIDENCE
• If confidence gets a value of 100 % the rule is an exact rule
• Even if confidence reaches high values the rule is not useful unless the support value is
high as well
• Rules that have both high confidence and support are called strong rules
• Some competing alternative approaches can generate useful rules even with low support
values
GENERATING ASSOCIATION RULES
• Usually consists of two sub problems:
1) Finding frequent itemsets whose occurrences exceed a predefined minimum
support threshold
2) Deriving association rules from those frequent itemsets (with the constrains of
minimum confidence threshold)
• These two sub problems are solved iteratively until new rules no more emerge
• The second sub problem is quite straight- forward and most of the research focus is on
the first sub problem.
USE OF APRIORI ALGORITHM
• Initial information: transactional database D and user-defined numeric minimum support
threshold min_sup
• Algorithm uses knowledge from previous iteration phase to produce frequent itemsets
• This is reflected in the Latin origin of the name that means ‖from what comes before.
CREATING FREQUENT SETS
• Let‘s define:Ckas a candidate itemset of size kLk as a
frequent itemset of size k
• Main steps of iteration are:
1) Find frequent set Lk-1
2) Join step: Ck is generated by joining Lk-1 with itself (Cartesian product
Lk-1 x Lk-1)
3) Prune step (apriori property): Any (k − 1) size itemset that is not frequent cannot
be a subset of a frequent k size itemset, hence should be removed
4) Frequent set Lk has been achieved.
Algorithm uses breadth-first search and a hash tree structure to make candidate itemsets
efficiently
Then occurrence frequency for each candidate itemset is counted
Those candidate itemsets that have higher frequency than minimum support threshold are
qualified to be frequent itemsets.

Jerusalem College of Engineering Department of IT
IT6413 DATA MINING LABORATORY 18
APRIORI ALGORITHM IN PSEUDOCODE
L1= {frequent items};
for(k= 2; Lk-1!=∅; k++) do begin
Ck= candidates generated from Lk-1 (that is: Cartesian product Lk-1 x Lk-1 and eliminating
any k-1 size itemset that is not frequent); for each transaction t in database do
increment the count of all candidates in Ck that are contained in t
Lk = candidates in Ck with min_sup
end
return kLk;
STEPS:
1.Open Excel and prepare dataset and save as apriori.csv
2. Open weka tool and click Explorer button.

Jerusalem College of Engineering Department of IT
IT6413 DATA MINING LABORATORY 19
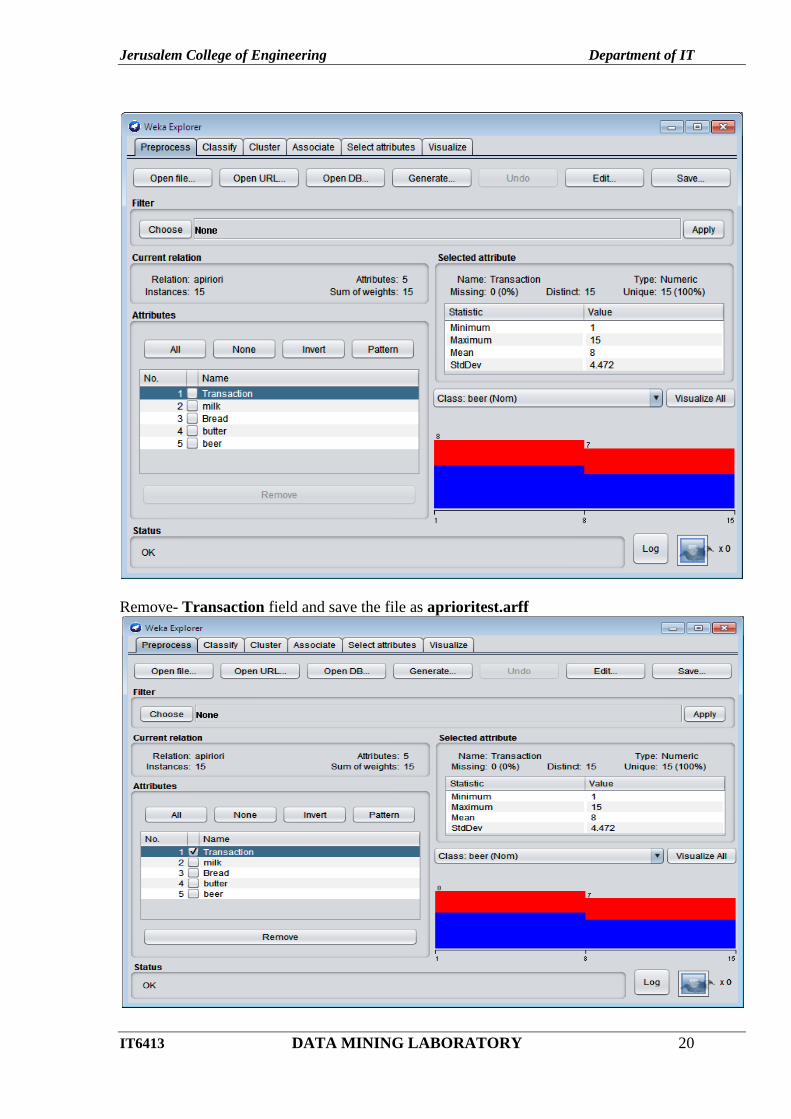
Click open file..button in Preprocess tab and select apriori.csv.
Jerusalem College of Engineering Department of IT
IT6413 DATA MINING LABORATORY 20
Remove- Transaction field and save the file as aprioritest.arff

Jerusalem College of Engineering Department of IT
IT6413 DATA MINING LABORATORY 21
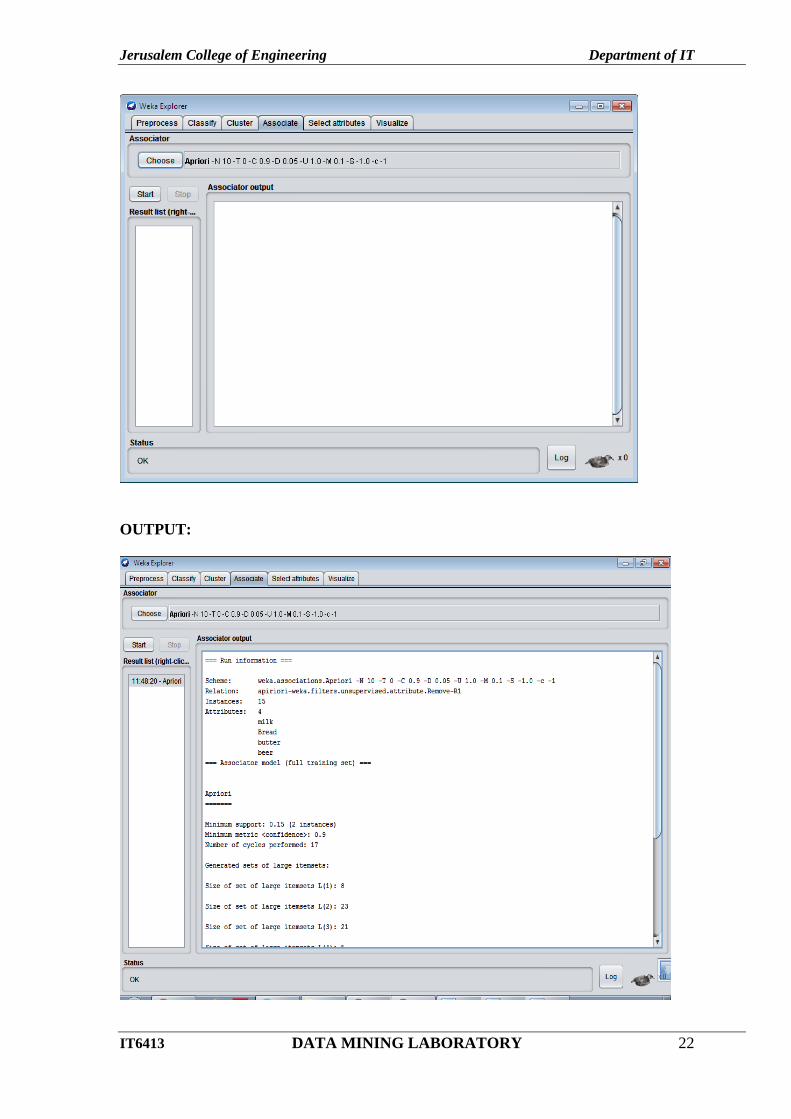
Goto Associate tab – choose Apriori and click Start button.
Jerusalem College of Engineering Department of IT
IT6413 DATA MINING LABORATORY 22
OUTPUT:
Jerusalem College of Engineering Department of IT
IT6413 DATA MINING LABORATORY 23
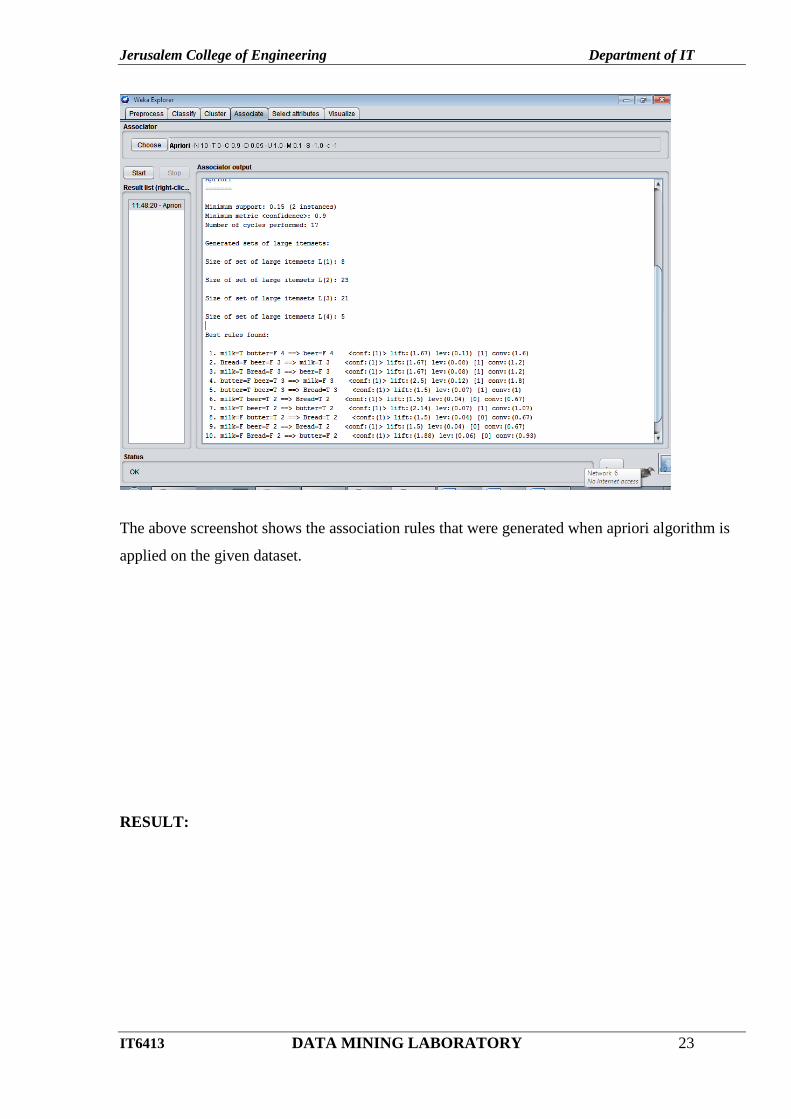
The above screenshot shows the association rules that were generated when apriori algorithm is
applied on the given dataset.
RESULT:
Jerusalem College of Engineering Department of IT
IT6413 DATA MINING LABORATORY 24
Ex no: 3
Date:
FP GROWTH ALGORITHM
AIM:
This experiment illustrates the use of FP-Growth associate in weka. The sample data set
used in this experiment is apriori.arff. This document assumes that appropriate data
preprocessing has been performed.
INTRODUCTION
Apriori: uses a generate-and-test approach – generates candidate itemsets and tests if they are frequent.
– Generation of candidate itemsets is expensive (in both space and time)
– Support counting is expensive
• Subset checking (computationally expensive)
• Multiple Database scans (I/O)
FP-Growth: allows frequent itemset discovery without candidate itemset generation. Two step approach:
– Step 1: Build a compact data structure called the FP-tree.
Built using 2 passes over the data-set.
– Step 2: Extracts frequent item sets directly from the FP-tree STEP 1: FP-TREE CONSTRUCTION
Ø FP-Tree is constructed using 2 passes over the data-set: Pass 1:
Scan data and find support for each item.
Discard infrequent items.
Sort frequent items in decreasing order based on their support. Pass 2:
Nodes correspond to items and have a counter
1. FP-Growth reads 1 transaction at a time and maps it to a path
– Fixed order is used, so paths can overlap when transactions share items. In this case,
counters are incremented
2. Pointers are maintained between nodes containing the same item, creating singly linked
lists (dotted lines)
– The more paths that overlap, the higher the compression. FP-tree may fit in
memory.
3. Frequent itemsets extracted from the FP-Tree.
Jerusalem College of Engineering Department of IT
IT6413 DATA MINING LABORATORY 25
PROCEDURE:
1. Open the data file in Weka Explorer. It is presumed that the required data fields have been
discretized.
2. Clicking on the associate tab will bring up the interface for association rule algorithm.
3. We will use FP-Growth algorithm.
4. In order to change the parameters for the run (example support, confidence etc) we click on the
text box immediately to the right of the choose button.
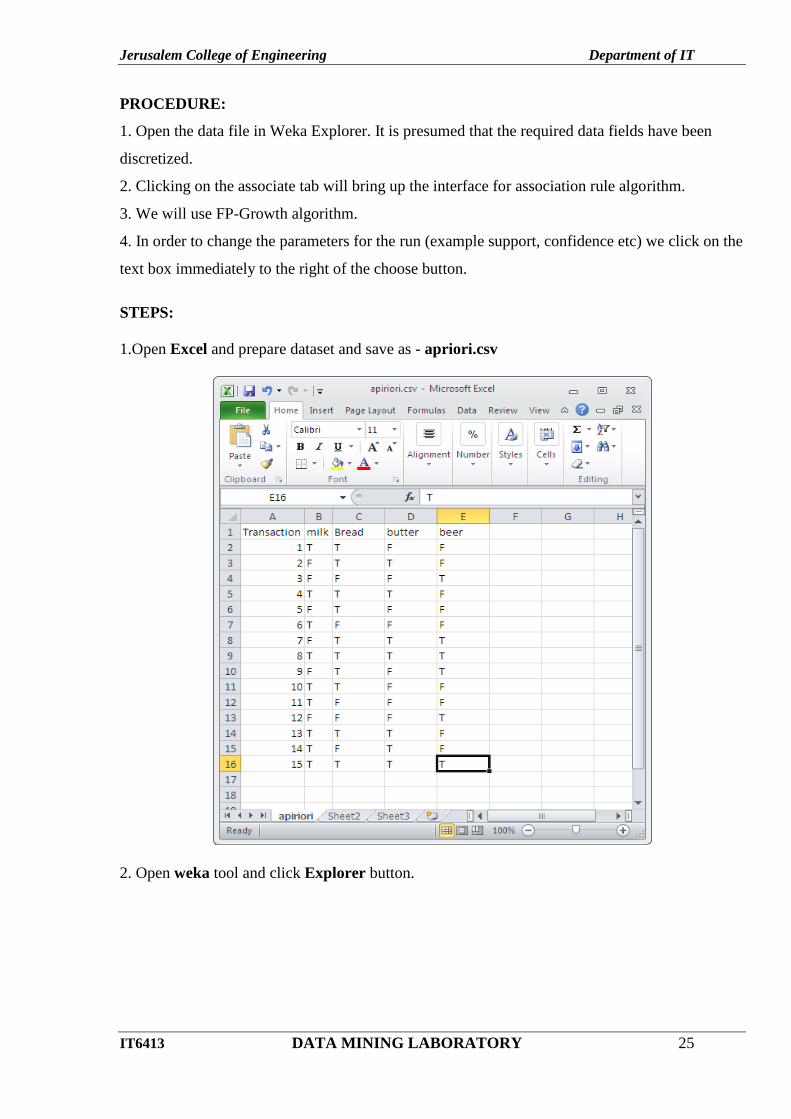
STEPS:
1.Open Excel and prepare dataset and save as - apriori.csv
2. Open weka tool and click Explorer button.
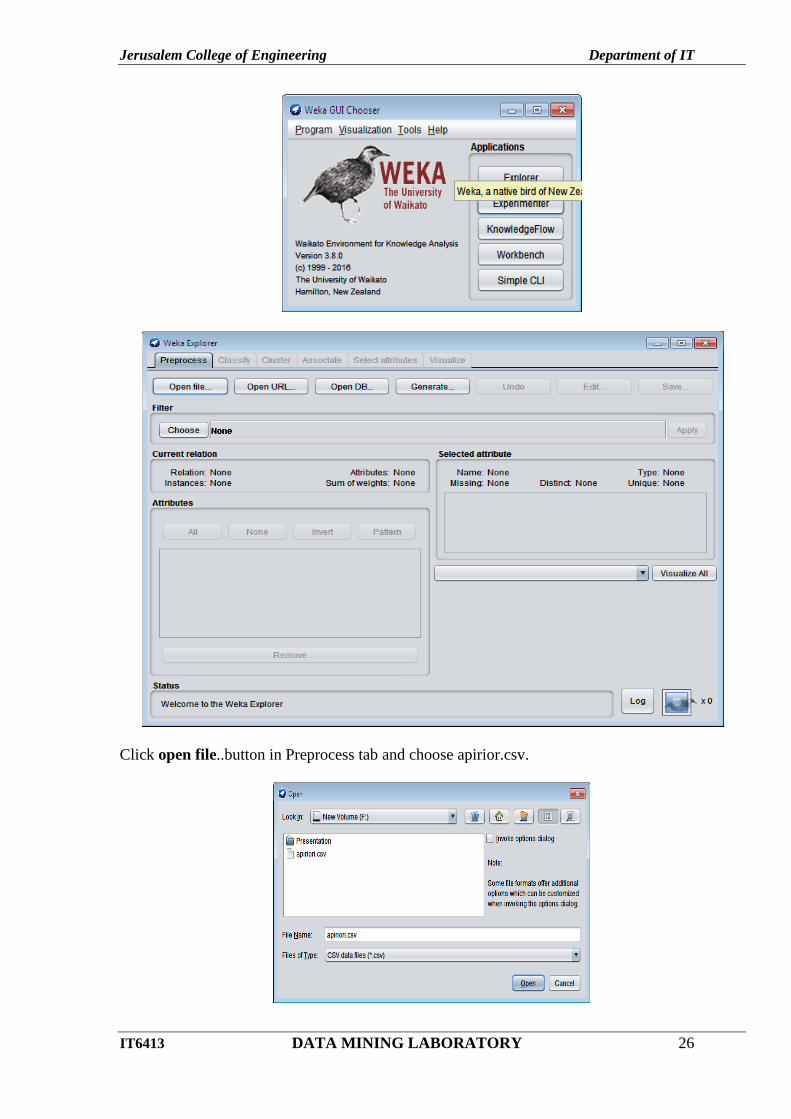
Jerusalem College of Engineering Department of IT
IT6413 DATA MINING LABORATORY 26
Click open file..button in Preprocess tab and choose apirior.csv.
Jerusalem College of Engineering Department of IT
IT6413 DATA MINING LABORATORY 27
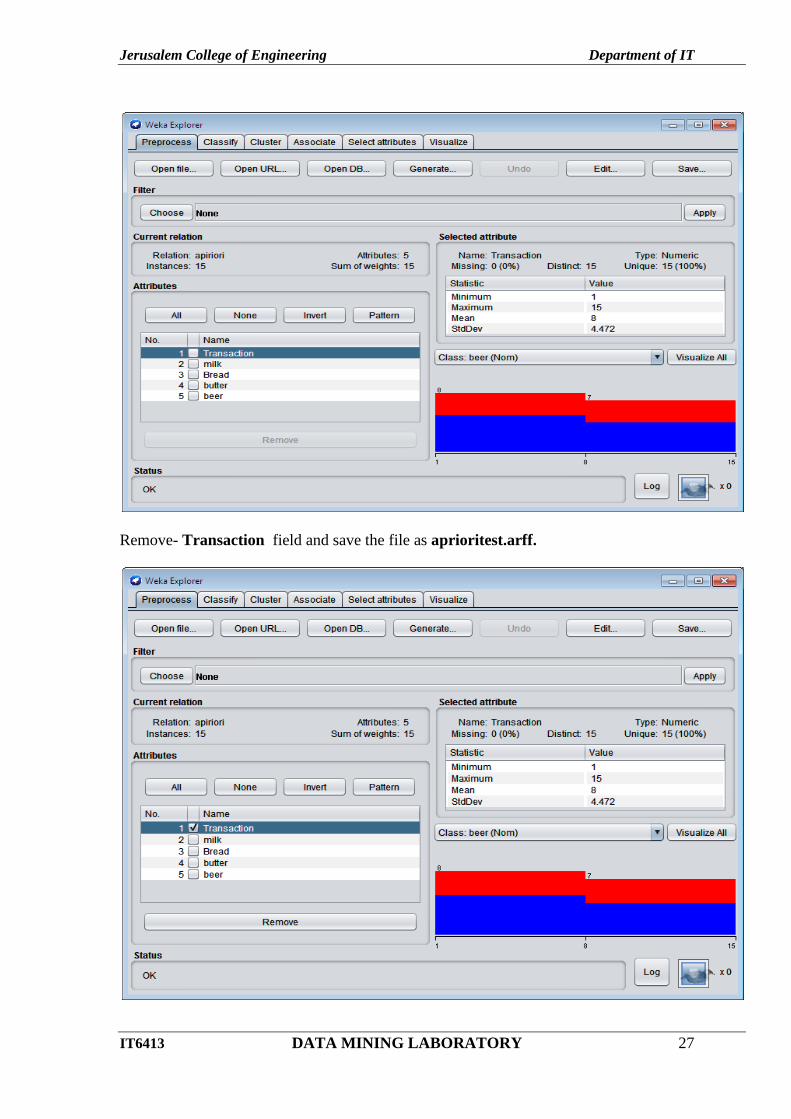
Remove- Transaction field and save the file as aprioritest.arff.
Jerusalem College of Engineering Department of IT
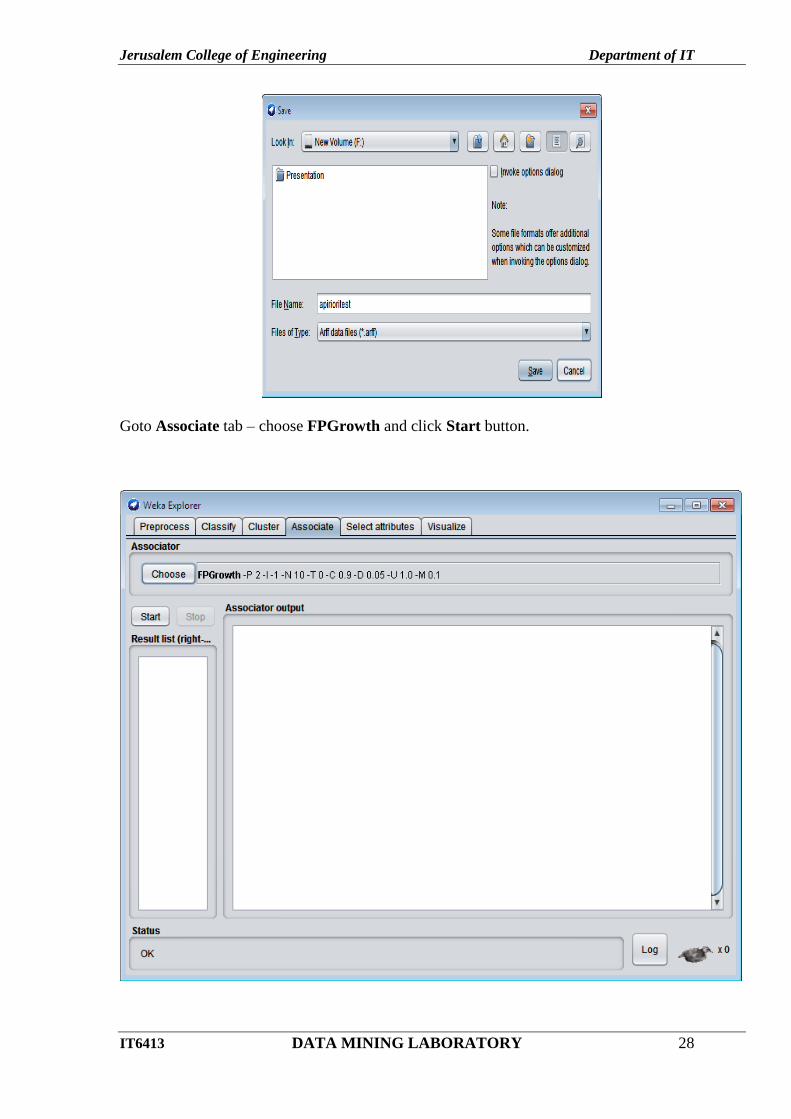
IT6413 DATA MINING LABORATORY 28
Goto Associate tab – choose FPGrowth and click Start button.
Jerusalem College of Engineering Department of IT
IT6413 DATA MINING LABORATORY 29
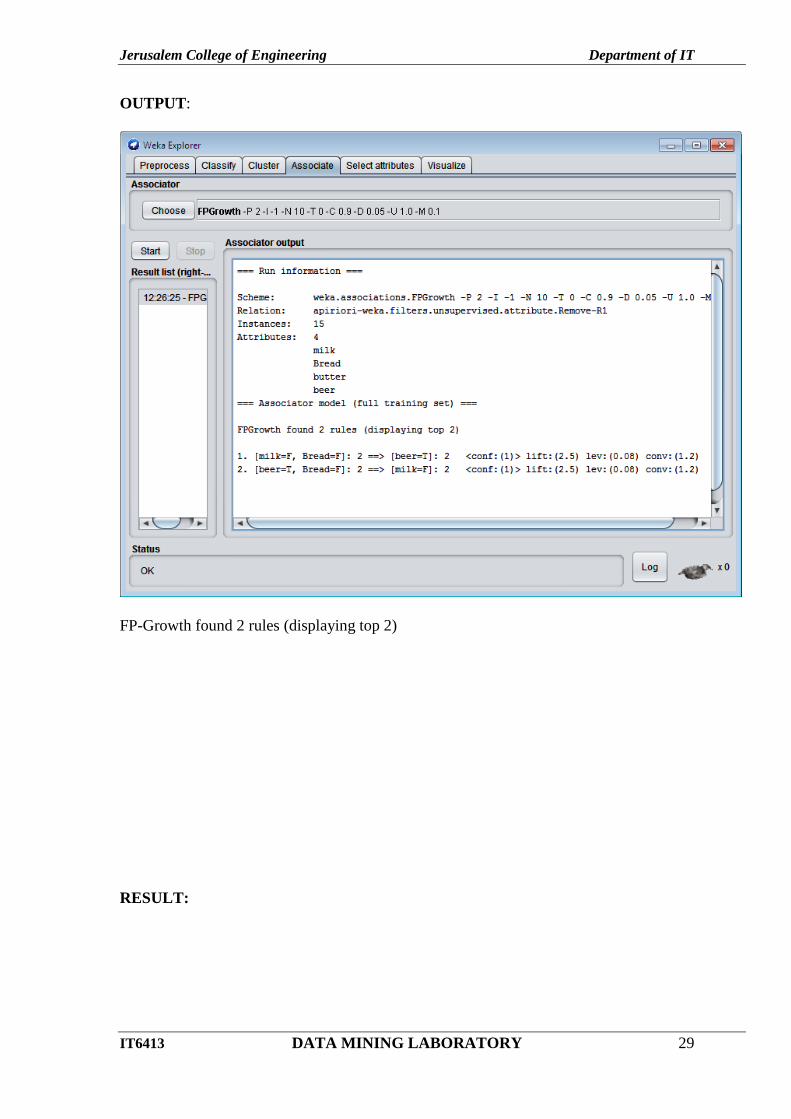
OUTPUT:
FP-Growth found 2 rules (displaying top 2)
RESULT:
Jerusalem College of Engineering Department of IT
IT6413 DATA MINING LABORATORY 30
Ex no: 4
Date:
K-MEANS CLUSTERING
AIM:
This experiment illustrates the use of simple k-mean clustering with Weka explorer. The
sample data set used for this example is based on the vote.arffdata set. This document assumes
that appropriate pre-processing has been performed.
WHAT IS CLUSTERING?
• Organizing data into classes such that there is
high intra-class similarity
low inter-class similarity
• Finding the class labels and the number of classes directly from the data (in contrast to
classification).
• More informally, finding natural groupings among objects. K-MEANS CLUSTERING K-Means is simplest unsupervised learning algorithms that solve the well-known
clustering problem. The procedure follows a simple and easy way to classify a given data
set through a certain number of clusters (assume k clusters) fixed apriori. The main idea is to
define k centers, one for each cluster. These centers should be placed in a cunning way because
of different location causes different result. So, the better choice is to place them as much as
possible far away from each other. The next step is to take each point belonging to a given data
set and associate it to the nearest center. When no point is pending, the first step is completed and
an early group age is done.
The k-means algorithm is an algorithm to cluster n objects based on attributes into
kpartitions, where k<n.
It is similar to the expectation-maximization algorithm for mixtures of Gaussians in that
they both attempt to find the centers of natural clusters in the data.
It assumes that the object attributes form a vector space.
Simply speaking k-means clustering is an algorithm to classify or to group the objects
based on attributes/features into K number of group.
K is positive integer number.
The grouping is done by minimizing the sum of squares of distances between data and the
corresponding cluster centroid.

Jerusalem College of Engineering Department of IT
IT6413 DATA MINING LABORATORY 31
How the K-Mean Clustering algorithm works? Step 1: Begin with a decision on the value of k = number of clusters. Step 2: Put any initial partition that classifies the data into k clusters. The training samples
randomly or systematically as the following:
1. Take the first k training sample as single-element clusters
2. Assign each of the remaining (N-k) training samples to the cluster with the nearest centroid. After each assignment, recomputed the centroid of the gaining cluster. Step 3: Take each sample in sequence and compute its distance from the centroid of each of the
clusters. If a sample is not currently in the cluster with the closest centroid, switch this sample to
that cluster and update the centroid of the cluster gaining the new sample and the cluster losing
the sample. Step 4: Repeat step 3 until convergence is achieved, that is until a pass throughthe training
sample causes no new assignments.
PROCEDURE:
1. Run the Weka explorer and load the data file vote.arff in preprocessing interface.
2. In order to perform clustering select the ‘cluster’ tab in the explorer and click on the choose
button. This step results in a dropdown list of available clustering algorithms.
3. In this case we select ‘simple k-means’.
4. Next click in text button to the right of the choose button to get popup window shown in the
screenshots. In this window we enter six on the number of clusters and we leave the value of the
seed on as it is. The seed value is used in generating a random number which is used for making
the internal assignments of instances of clusters.
5. Once of the option have been specified. We run the clustering algorithm there we must make
sure that they are in the ‘cluster mode’ panel. The use of training set option is selected and then
we click ‘start’ button. This process and resulting window are shown in the following
screenshots.

Jerusalem College of Engineering Department of IT
IT6413 DATA MINING LABORATORY 32
STEPS: (Using Weka Explorer)
1.Open weka tool and click Explorer.
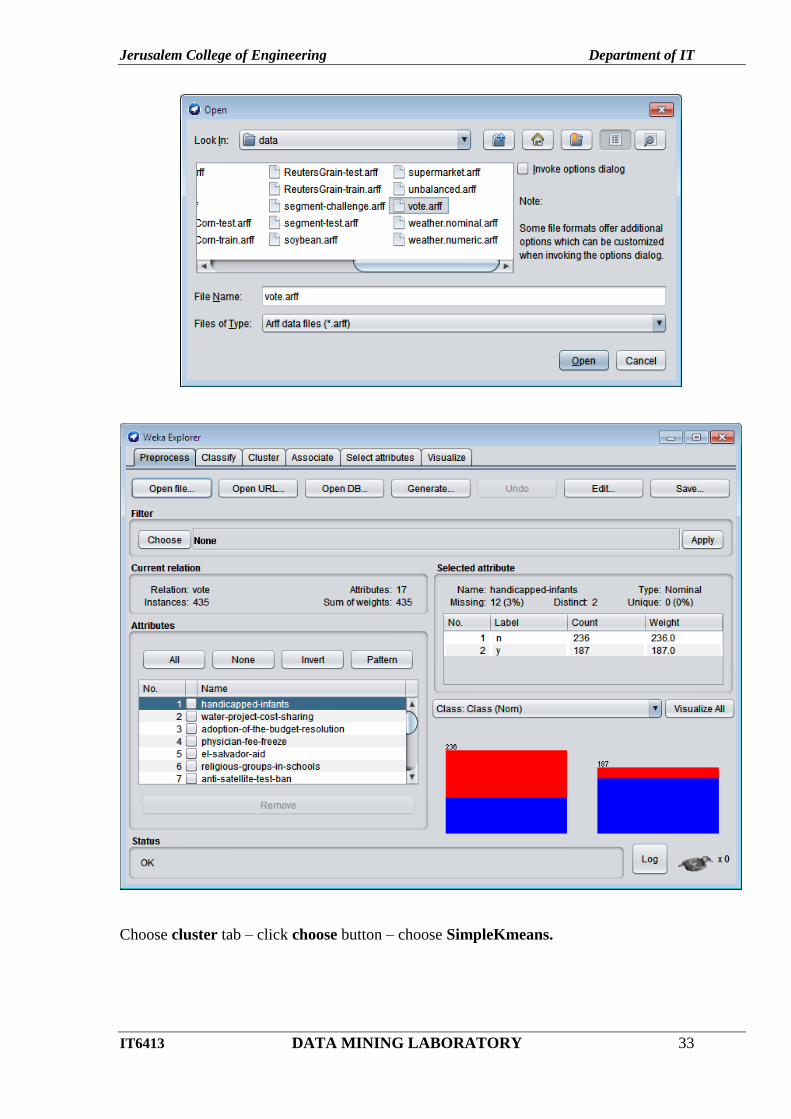
2. clickOpen file…in Preprocess tab.- choose vote.arff
Jerusalem College of Engineering Department of IT
IT6413 DATA MINING LABORATORY 33
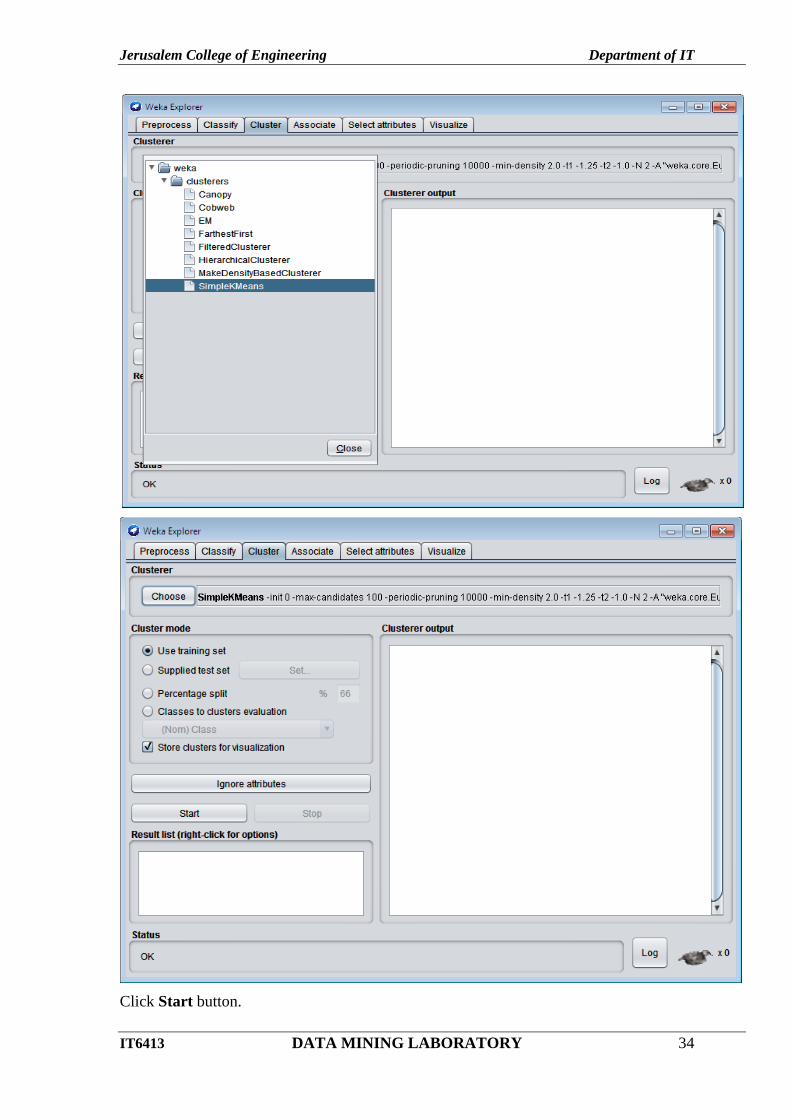
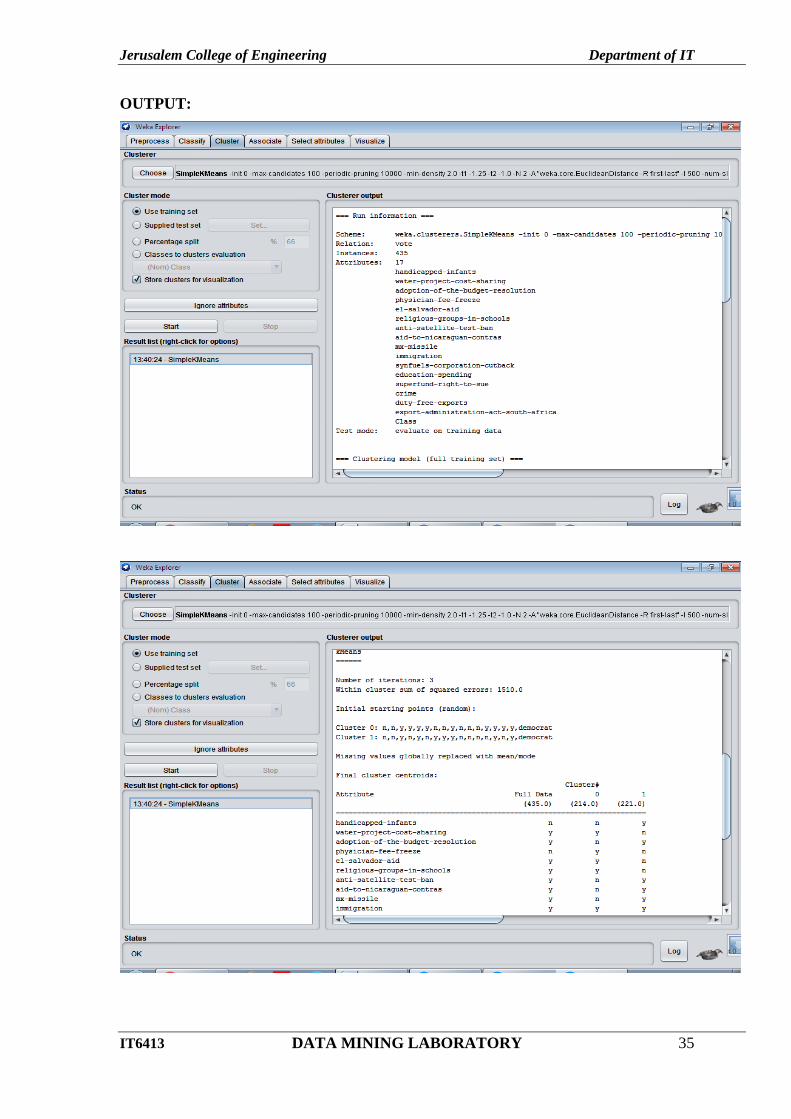
Choose cluster tab – click choose button – choose SimpleKmeans.
Jerusalem College of Engineering Department of IT
IT6413 DATA MINING LABORATORY 34
Click Start button.
Jerusalem College of Engineering Department of IT
IT6413 DATA MINING LABORATORY 35
OUTPUT:

Jerusalem College of Engineering Department of IT
IT6413 DATA MINING LABORATORY 36
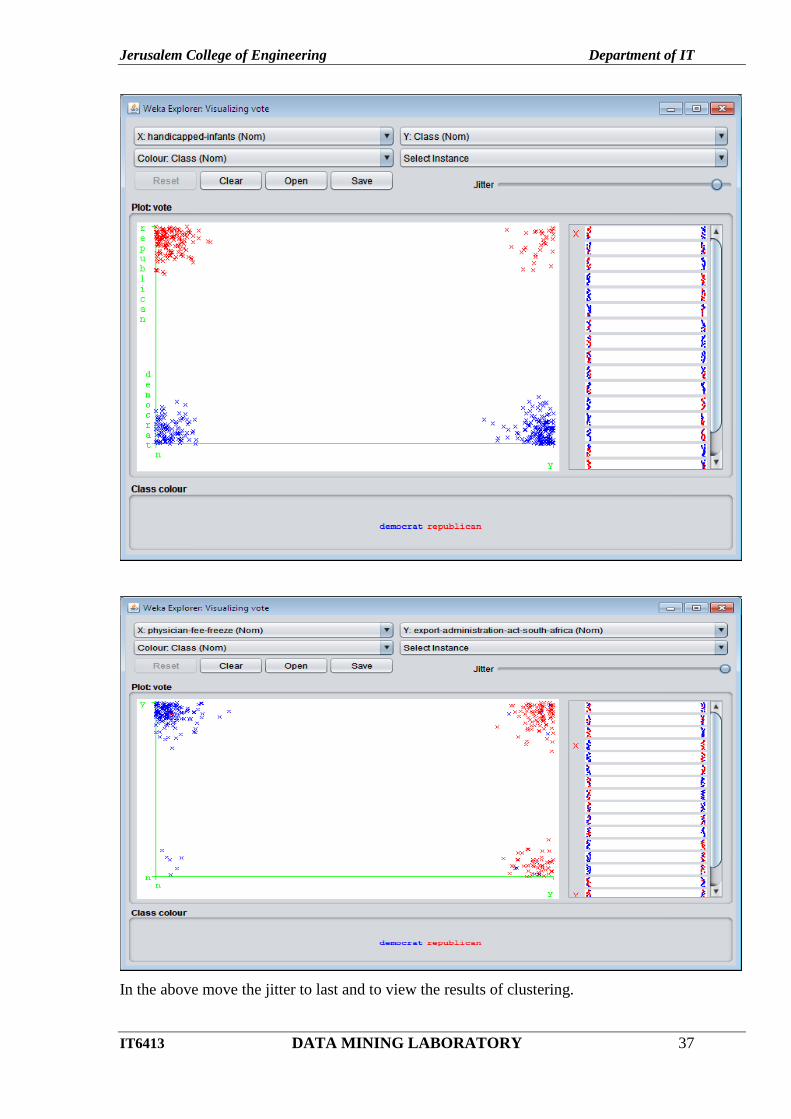
Goto - Visualize tab- click one box any visualize.
Jerusalem College of Engineering Department of IT
IT6413 DATA MINING LABORATORY 37
In the above move the jitter to last and to view the results of clustering.

Jerusalem College of Engineering Department of IT
IT6413 DATA MINING LABORATORY 38
STEPS: (Using WekaKnowledgeFlow)
1.Open weka tool and click Explorer.
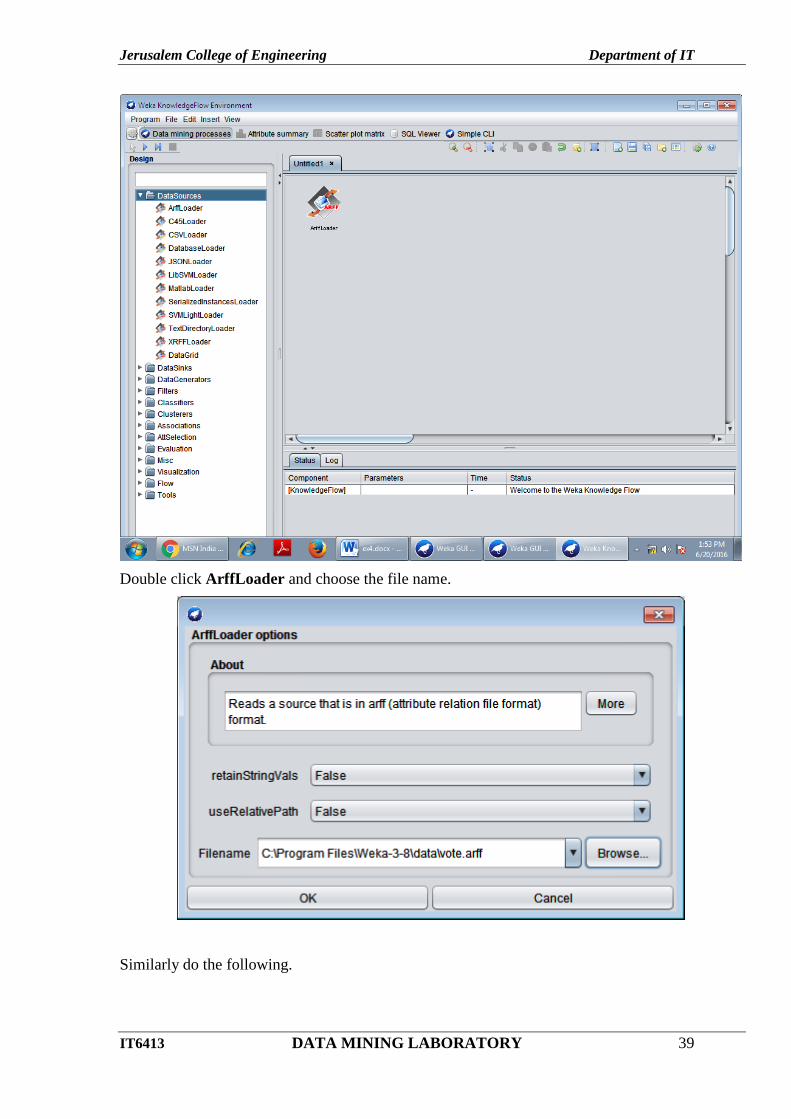
Click DataSources in the left side window and choose ArffLoader and draw in right side
window.
Jerusalem College of Engineering Department of IT
IT6413 DATA MINING LABORATORY 39
Double click ArffLoader and choose the file name.
Similarly do the following.
Jerusalem College of Engineering Department of IT
IT6413 DATA MINING LABORATORY 40
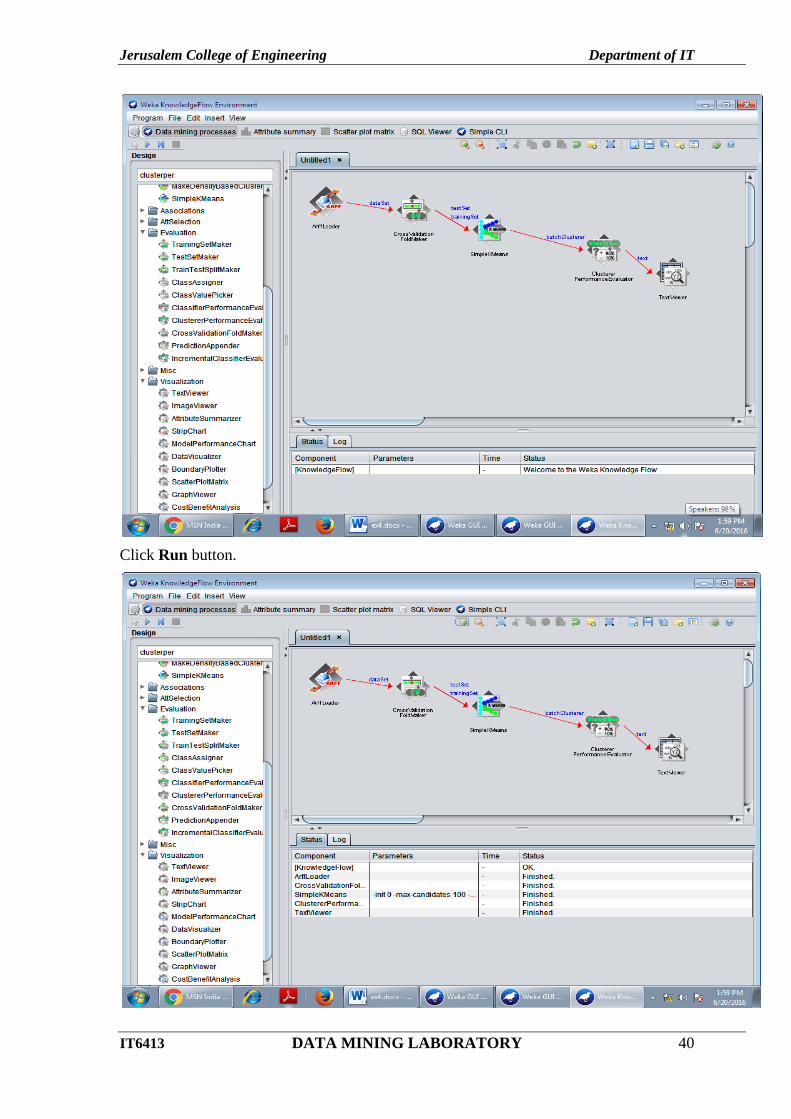
Click Run button.
Jerusalem College of Engineering Department of IT
IT6413 DATA MINING LABORATORY 41
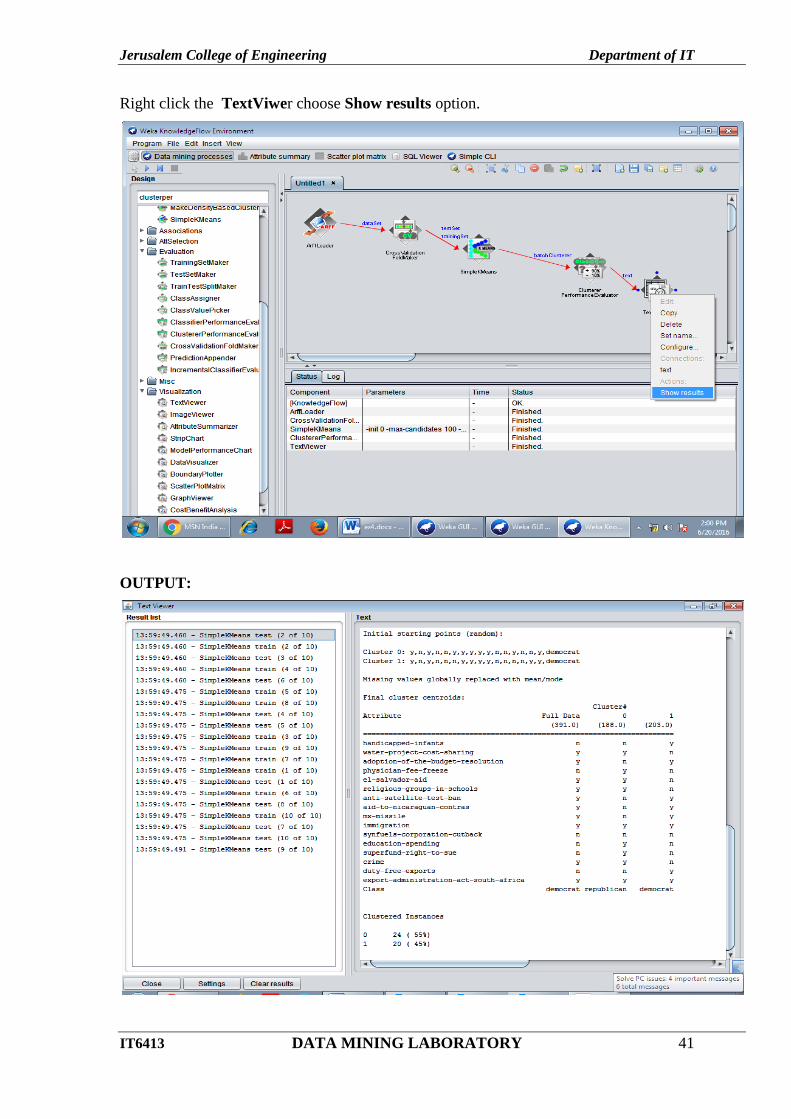
Right click the TextViwer choose Show results option.
OUTPUT:

Jerusalem College of Engineering Department of IT
IT6413 DATA MINING LABORATORY 42
RESULT:
Jerusalem College of Engineering Department of IT
IT6413 DATA MINING LABORATORY 43
Ex no: 5
Date:
HIERARCHICAL CLUSTERING
AIM:
This experiment illustrates the use of one hierarchical clustering with Weka explorer. The
sample data set used for this example is based on the vote.arff data set. This document assumes
that appropriate pre-processing has been performed.
HIERARCHICAL CLUSTERING
Hierarchical clustering is a method of cluster analysis which seeks to build a hierarchy of
clusters. Strategies for hierarchical clustering generally fall into two types. Agglomerative is a
"bottom up" approach: each observation starts in its own cluster, and pairs of clusters are merged
as one moves up the hierarchy. Divisive is a "top down" approach: all observations start in one
cluster, and splits are performed recursively as one moves down the hierarchy.
PROCEDURE:
1.Open the data file in Weka Explorer. It is presumed that the required data fields have been
discretized.
2. Clicking on the cluster tab will bring up the interface for cluster algorithm.
3. We will use hierarchical clustering algorithm.
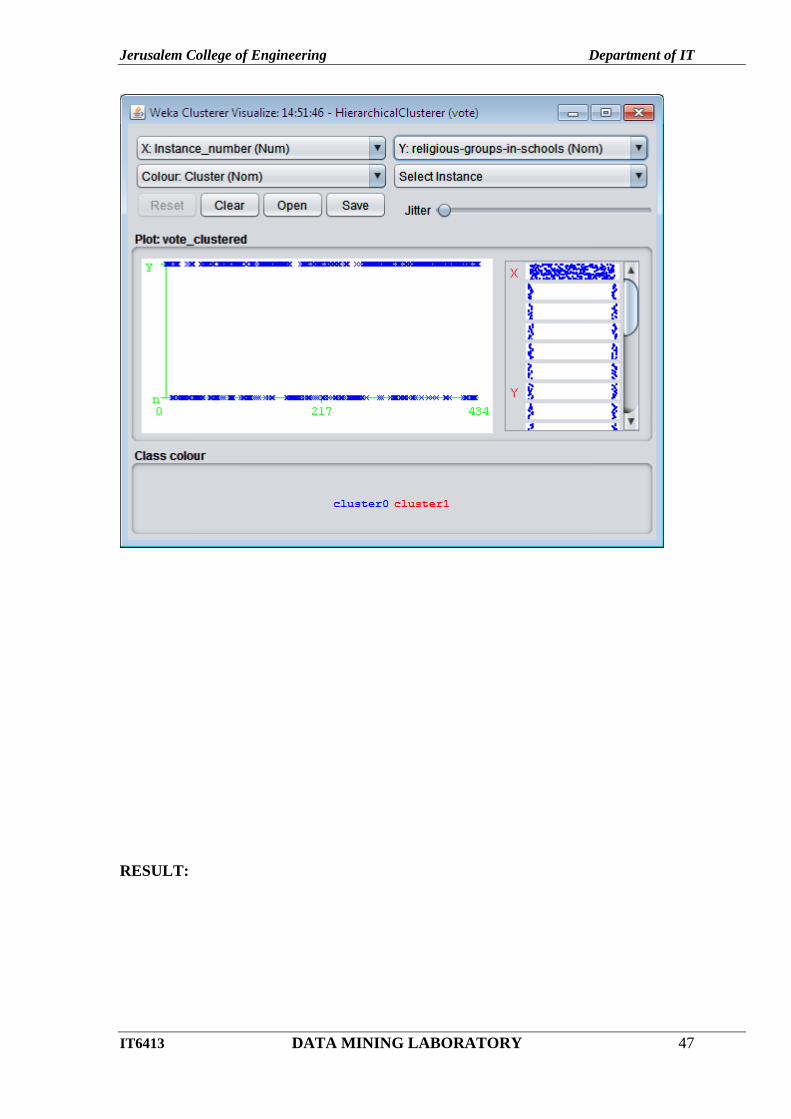
4. Visualization of the graph
STEPS:
The following screenshot shows the clustering rules that were generated when hierarchical
clustering algorithm is applied on the given dataset.
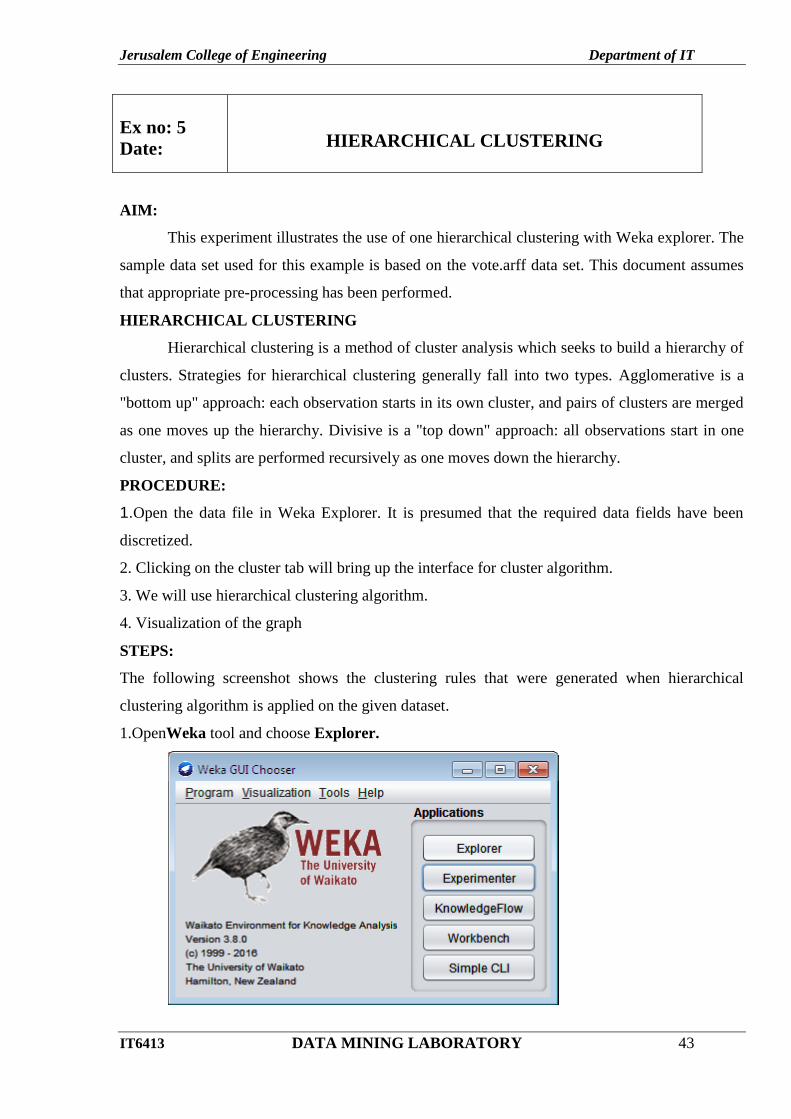
1.OpenWeka tool and choose Explorer.
Jerusalem College of Engineering Department of IT
IT6413 DATA MINING LABORATORY 44
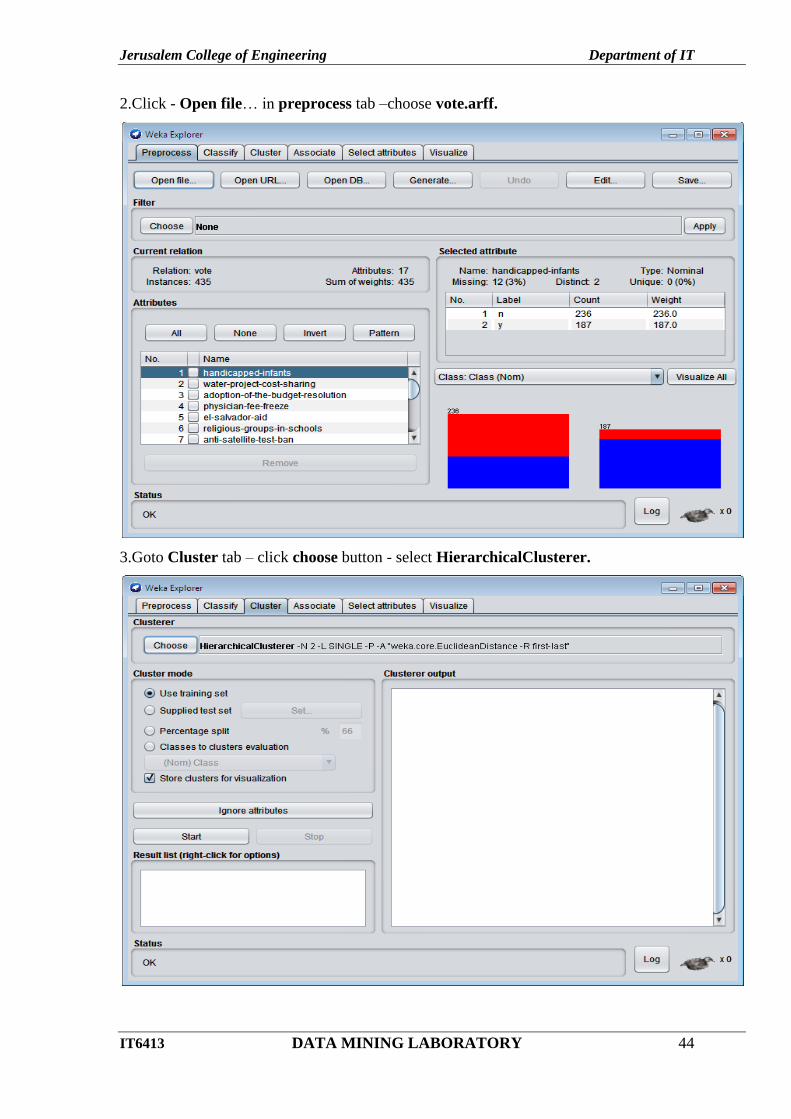
2.Click - Open file… in preprocess tab –choose vote.arff.
3.Goto Cluster tab – click choose button - select HierarchicalClusterer.
Jerusalem College of Engineering Department of IT
IT6413 DATA MINING LABORATORY 45
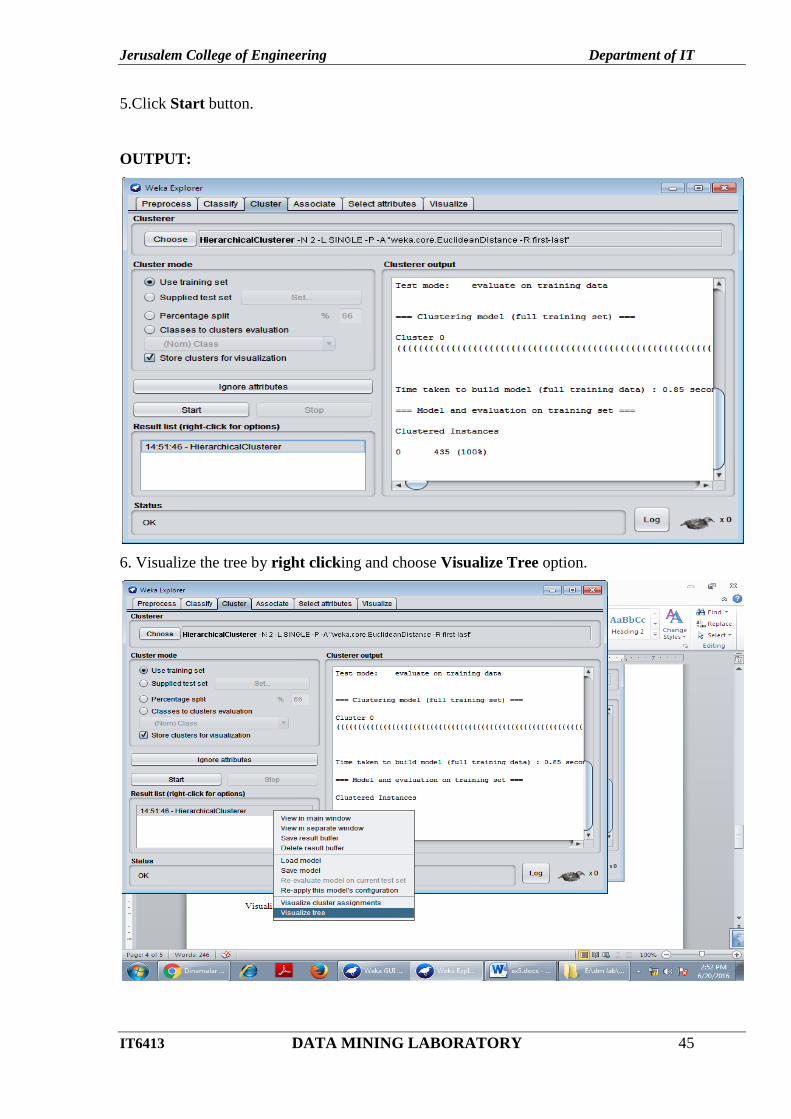
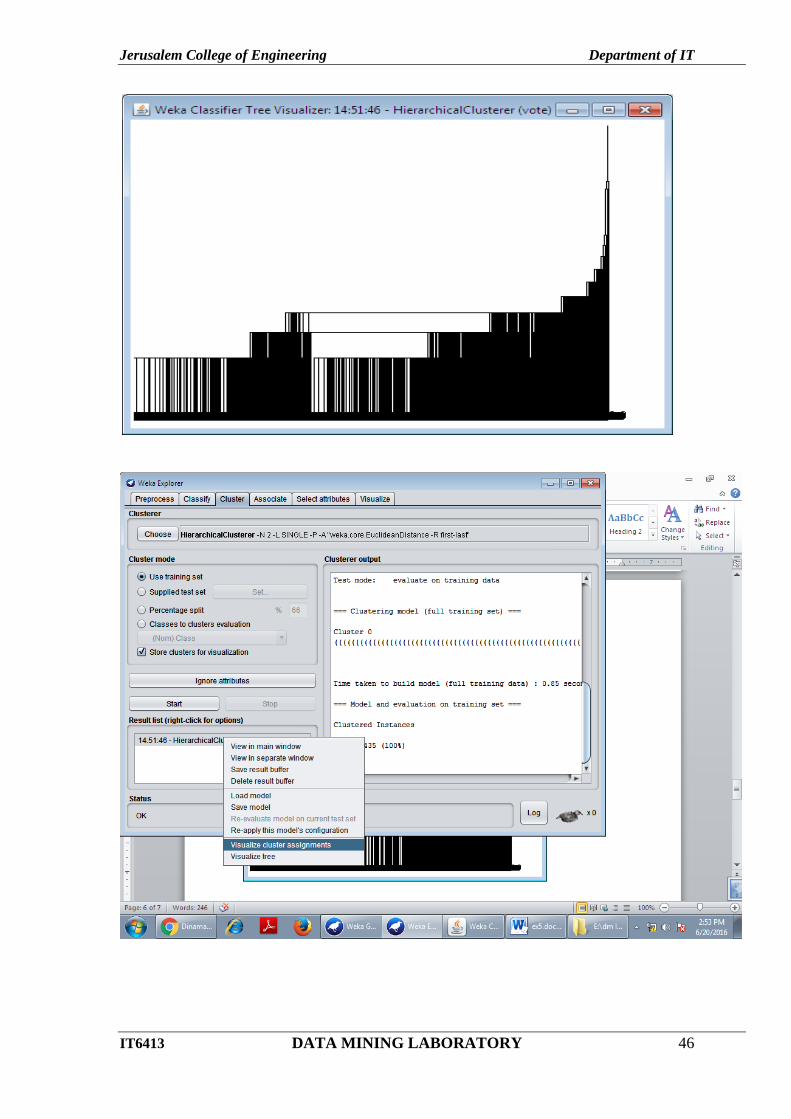
5.Click Start button.
OUTPUT:
6. Visualize the tree by right clicking and choose Visualize Tree option.
Jerusalem College of Engineering Department of IT
IT6413 DATA MINING LABORATORY 46
Jerusalem College of Engineering Department of IT
IT6413 DATA MINING LABORATORY 47
RESULT:
Jerusalem College of Engineering Department of IT
IT6413 DATA MINING LABORATORY 48
Ex no: 6
Date:
BAYESIAN CLASSIFICATION
AIM:
This experiment illustrates the use of Bayesian classifier with Weka explorer. The sample
data set used for this example is based on the weather.nominal.arff data set. This document
assumes that appropriate pre-processing has been performed.
BAYESIAN CLASSIFICATION
Bayesian classification is based on Bayes theorem. Bayesian classifiers are the statistical
classifiers. Bayesian classifiers can predict class membership probabilities such as the probability
that a given tuple belongs to a particular class.
Bayesian Classification: Why?
A statistical classifier: performs probabilistic prediction, i.e., predicts class membership
probabilities
Foundation: Based on Bayes‘ Theorem.
Performance: A simple Bayesian classifier, naïve Bayesian classifier, has comparable
performance with decision tree and selected neural network classifiers
Incremental: Each training example can incrementally increase/decrease the probability
that a hypothesis is correct — prior knowledge can be combined with observed data.
Standard: Even when Bayesian methods are computationally intractable, they can provide
a standard of optimal decision making against which other methods can be measured
PROCEDURE:
1. Open the data file in Weka Explorer. It is presumed that the required data fields have been
discretized.
2. Next we select the “classify” tab and click choose button to select the “NavieBayes” in the
classifier.
3. Now we specify the various parameters. These can be specified by clicking in the text box to
the right of the chose button. In this example, we accept the default values his default version
does perform some pruning but does not perform error pruning.
4. We select the 10-fold cross validation as our evaluation approach. Since we don’t have
separate evaluation data set, this is necessary to get a reasonable idea of accuracy of generated
model.
Jerusalem College of Engineering Department of IT
IT6413 DATA MINING LABORATORY 49
5. We now click start to generate the model .the ASCII version of the tree as well as evaluation
statistic will appear in the right panel when the model construction is complete.
6. Note that the classification accuracy of model is about 69%.this indicates that we may find
more work. (Either in preprocessing or in selecting current parameters for the classification)
7. Now weka also lets us a view a graphical version of the classification tree.
8. We will use our model to classify the new instances.
Bayesian Classification - For Training and Testing
How do I divide a dataset into training and test set?
You can use the RemovePercentage filter (package weka.filters.unsupervised.instance). In the
Explorer just do the following:
Training set:
Load the full dataset
select the RemovePercentage filter in the preprocess panel
set the correct percentage for the split
apply the filter
save the generated data as a new file
Test set:
Load the full dataset (or just use undo to revert the changes to the dataset)
select the RemovePercentage filter if not yet selected
set the invertSelection property to true
apply the filter
save the generated data as new file
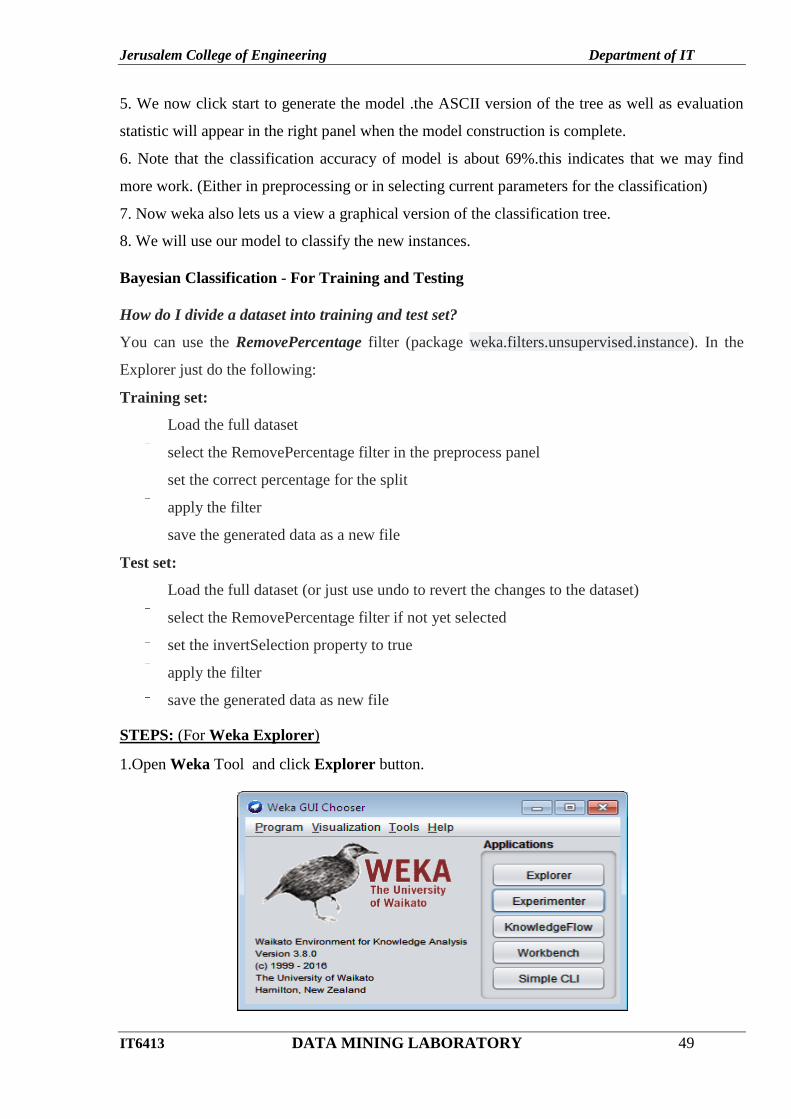
STEPS: (For Weka Explorer)
1.Open Weka Tool and click Explorer button.

Jerusalem College of Engineering Department of IT
IT6413 DATA MINING LABORATORY 50
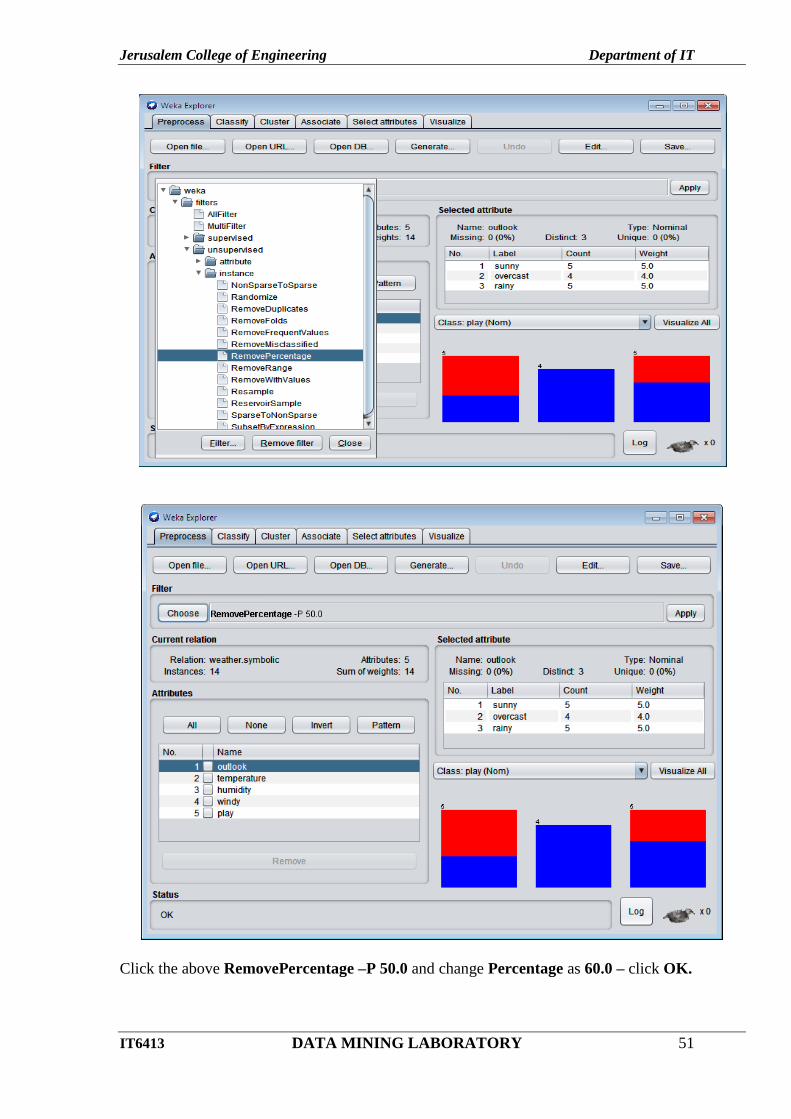
2. Open file in preprocess tab - weather.nominal.arff
Click Choose button in Preprocess tab.
Jerusalem College of Engineering Department of IT
IT6413 DATA MINING LABORATORY 51
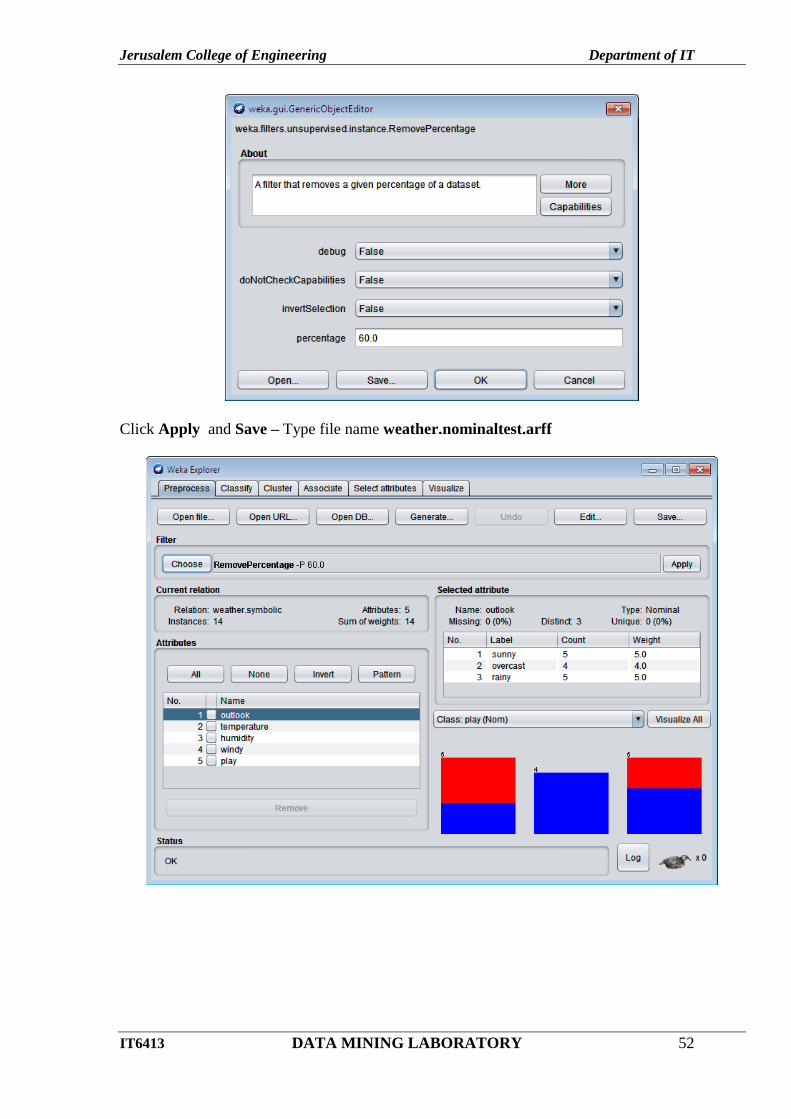
Click the above RemovePercentage –P 50.0 and change Percentage as 60.0 – click OK.
Jerusalem College of Engineering Department of IT
IT6413 DATA MINING LABORATORY 52
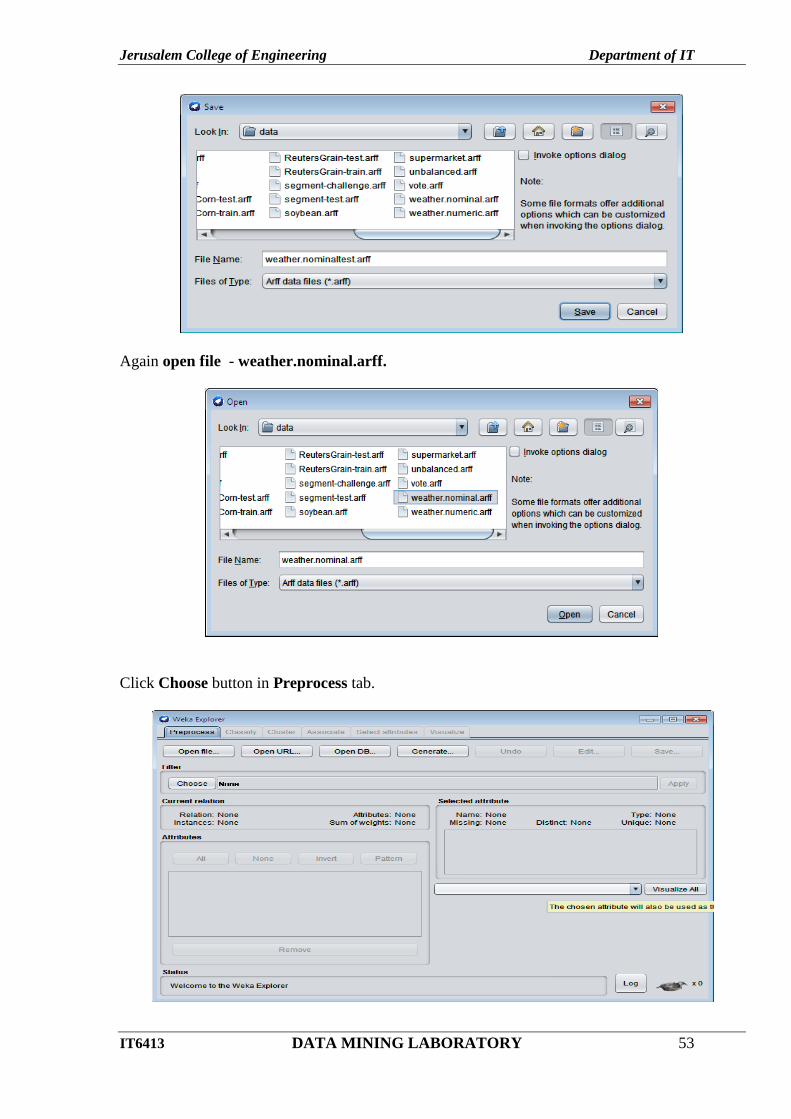
Click Apply and Save – Type file name weather.nominaltest.arff
Jerusalem College of Engineering Department of IT
IT6413 DATA MINING LABORATORY 53
Again open file - weather.nominal.arff.
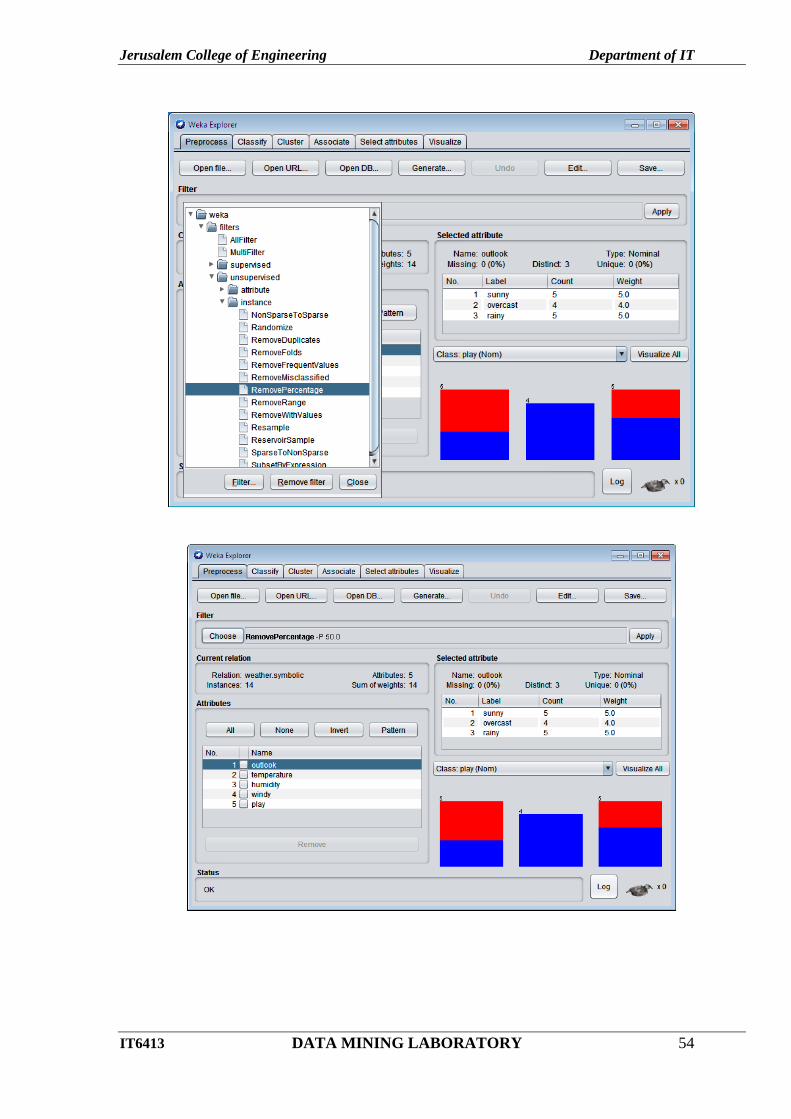
Click Choose button in Preprocess tab.
Jerusalem College of Engineering Department of IT
IT6413 DATA MINING LABORATORY 54

Jerusalem College of Engineering Department of IT
IT6413 DATA MINING LABORATORY 55
To change the InverSelection as True – click OK.
Click Apply and Save – Type file name weather.nominaltraining.arff.
Jerusalem College of Engineering Department of IT
IT6413 DATA MINING LABORATORY 56
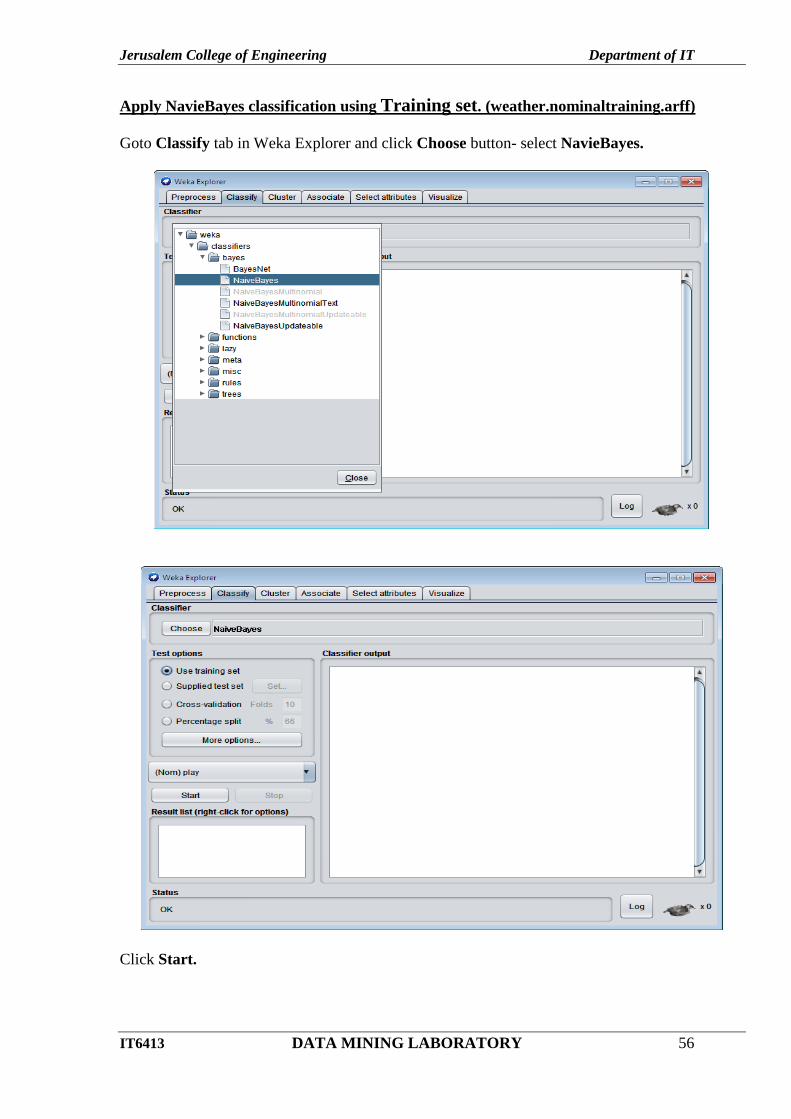
Apply NavieBayes classification using Training set. (weather.nominaltraining.arff)
Goto Classify tab in Weka Explorer and click Choose button- select NavieBayes.
Click Start.
Jerusalem College of Engineering Department of IT
IT6413 DATA MINING LABORATORY 57
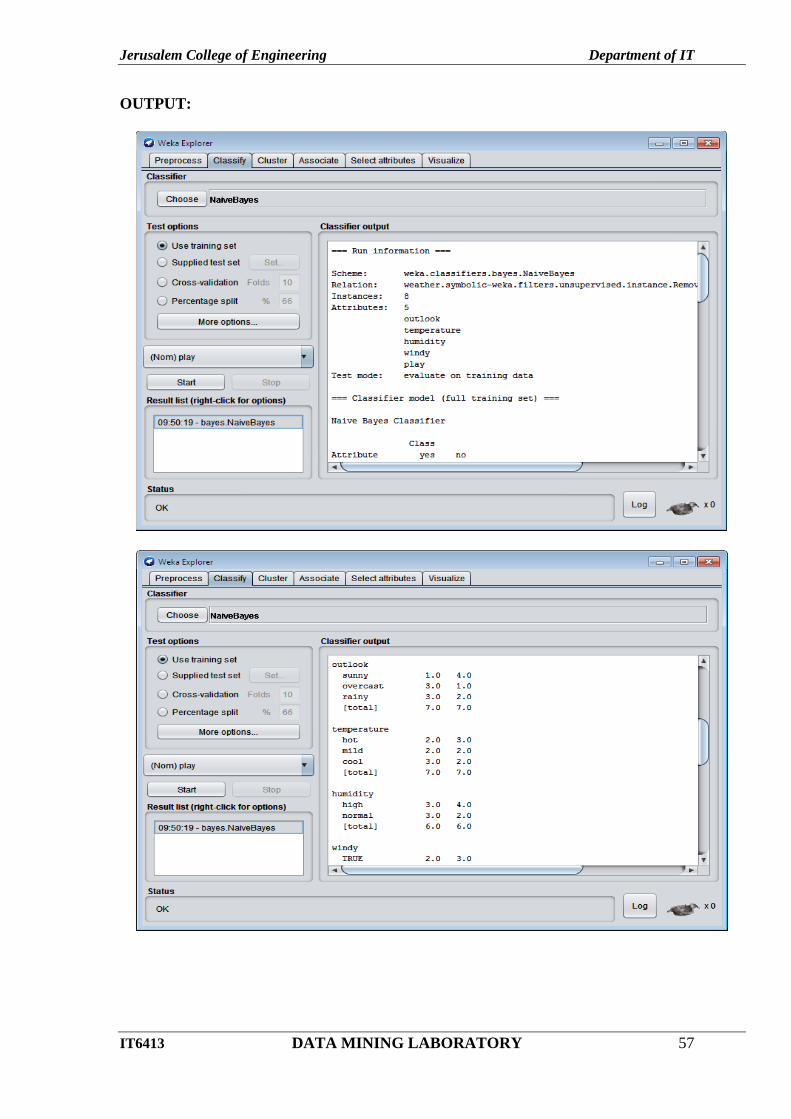
OUTPUT:
Jerusalem College of Engineering Department of IT
IT6413 DATA MINING LABORATORY 58
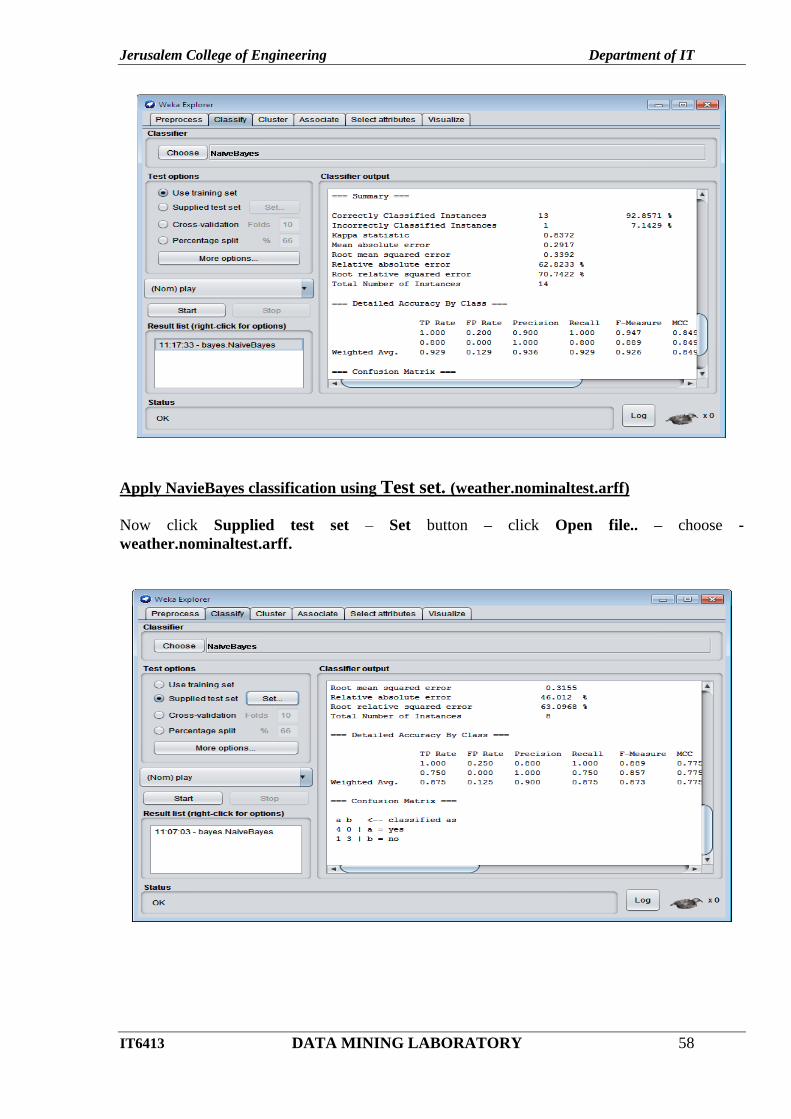
Apply NavieBayes classification using Test set. (weather.nominaltest.arff)
Now click Supplied test set – Set button – click Open file.. – choose -
weather.nominaltest.arff.

Jerusalem College of Engineering Department of IT
IT6413 DATA MINING LABORATORY 59
Click Start button.
OUTPUT:
Jerusalem College of Engineering Department of IT
IT6413 DATA MINING LABORATORY 60
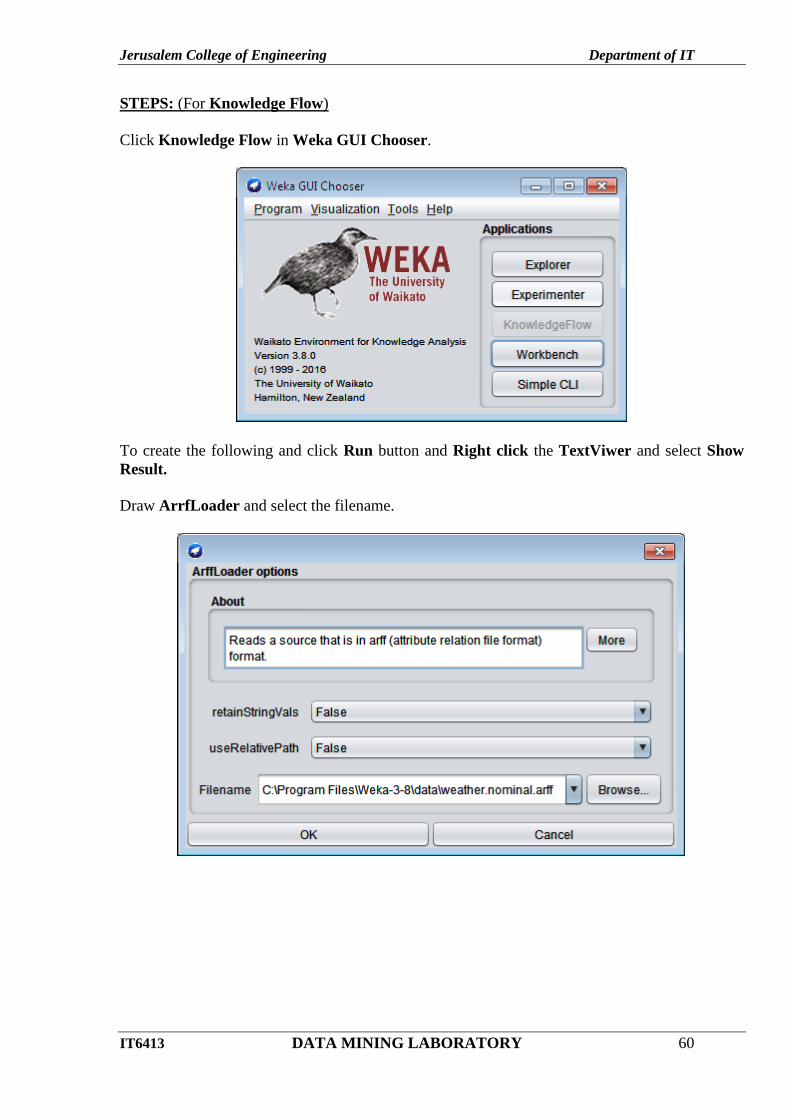
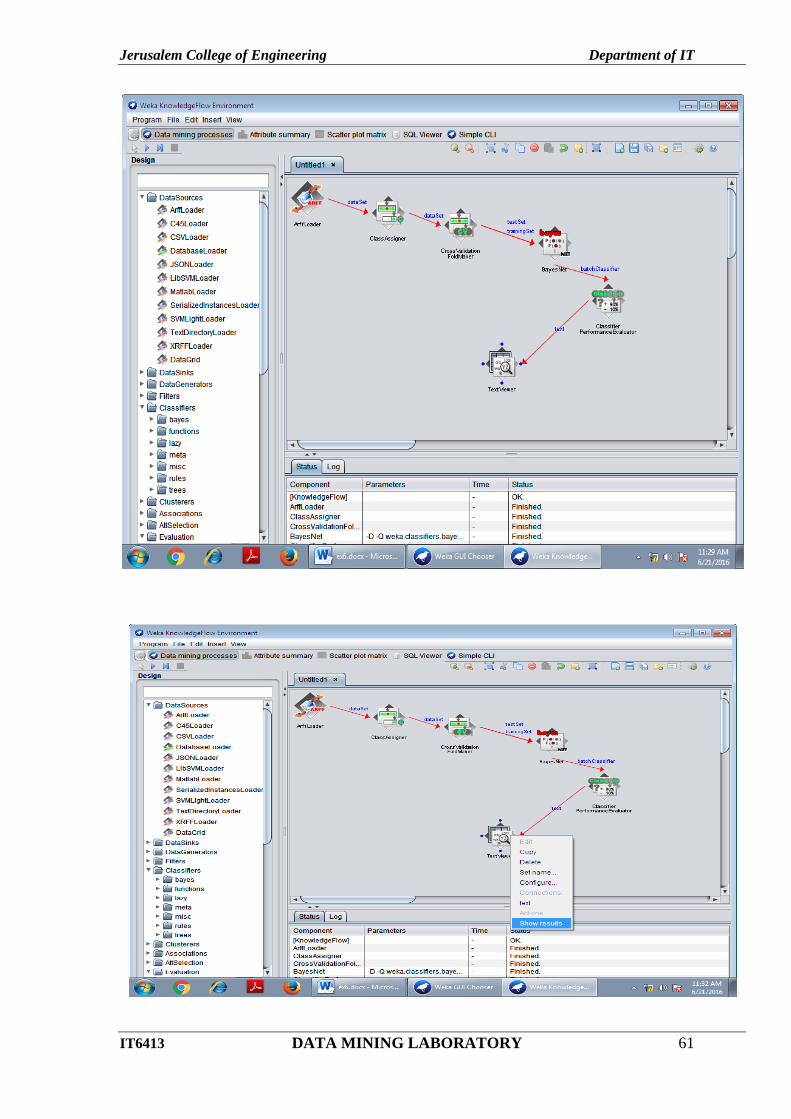
STEPS: (For Knowledge Flow)
Click Knowledge Flow in Weka GUI Chooser.
To create the following and click Run button and Right click the TextViwer and select Show
Result.
Draw ArrfLoader and select the filename.
Jerusalem College of Engineering Department of IT
IT6413 DATA MINING LABORATORY 61
Jerusalem College of Engineering Department of IT
IT6413 DATA MINING LABORATORY 62
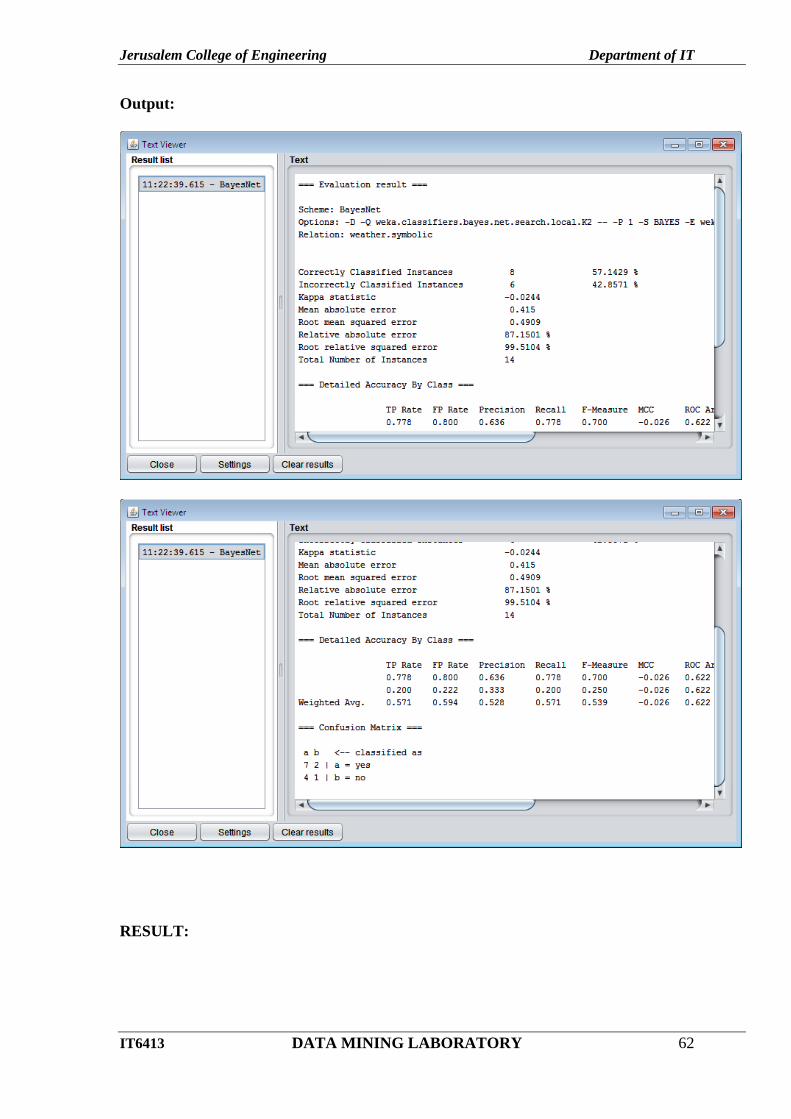
Output:
RESULT:
Jerusalem College of Engineering Department of IT
IT6413 DATA MINING LABORATORY 63
Ex no: 7
Date:
DECISION TREE
AIM:
This experiment illustrates the use of j-48 classifier in weka. The sample data set used in
this experiment is weather dataset available at arff format. This document assumes that
appropriate data preprocessing has been performed.
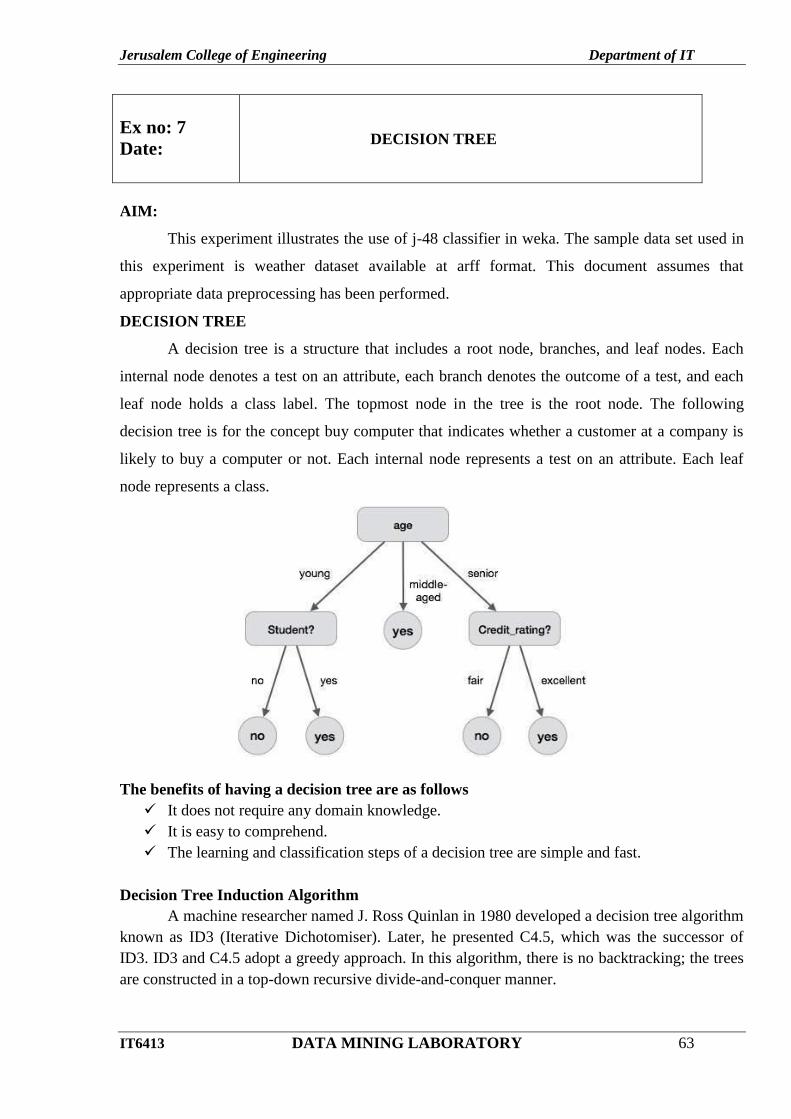
DECISION TREE
A decision tree is a structure that includes a root node, branches, and leaf nodes. Each
internal node denotes a test on an attribute, each branch denotes the outcome of a test, and each
leaf node holds a class label. The topmost node in the tree is the root node. The following
decision tree is for the concept buy computer that indicates whether a customer at a company is
likely to buy a computer or not. Each internal node represents a test on an attribute. Each leaf
node represents a class.
The benefits of having a decision tree are as follows
It does not require any domain knowledge.
It is easy to comprehend.
The learning and classification steps of a decision tree are simple and fast.
Decision Tree Induction Algorithm
A machine researcher named J. Ross Quinlan in 1980 developed a decision tree algorithm
known as ID3 (Iterative Dichotomiser). Later, he presented C4.5, which was the successor of
ID3. ID3 and C4.5 adopt a greedy approach. In this algorithm, there is no backtracking; the trees
are constructed in a top-down recursive divide-and-conquer manner.
Jerusalem College of Engineering Department of IT
IT6413 DATA MINING LABORATORY 64
Algorithm :Generate_decision_tree
Input:
Data partition, D, which is a set of training tuples and their associated class labels.
attribute_list, the set of candidate attributes.
Attribute selection method, a procedure to determine the splitting criterion that best
partitions that the data tuples into individual classes.
This criterion includes a splitting_attribute and either a splitting point or splitting subset.
Output:
A Decision Tree
Method
Create a node N;
if tuples in D are all of the same class, C then
return N as leaf node labeled with class C;
if attribute_list is empty then
return N as leaf node with labeled with majority class in D;|| majority voting
applyattribute_selection_method(D, attribute_list)
to find the best splitting_criterion;
label node N with splitting_criterion;
if splitting_attribute is discrete-valued and
multiway splits allowed then // no restricted to binary trees
attribute_list = splitting attribute; // remove splitting attribute
for each outcome j of splitting criterion
// partition the tuples and grow subtrees for each partition
Let Dj be the set of data tuples in D satisfying outcome j; // a partition
If Dj is empty then
attach a leaf labeled with the majority
class in D to node N;
else
attach the node returned by Generate
decision tree(Dj, attribute list) to node N;
end for
return N;
Tree Pruning
Tree pruning is performed in order to remove anomalies in the training data due to noise or
outliers. The pruned trees are smaller and less complex.
Tree Pruning Approaches
Here is the Tree Pruning Approaches listed below –
Pre-pruning − the tree is pruned by halting its construction early.
Post-pruning - This approach removes a sub-tree from a fully grown tree.
Jerusalem College of Engineering Department of IT
IT6413 DATA MINING LABORATORY 65
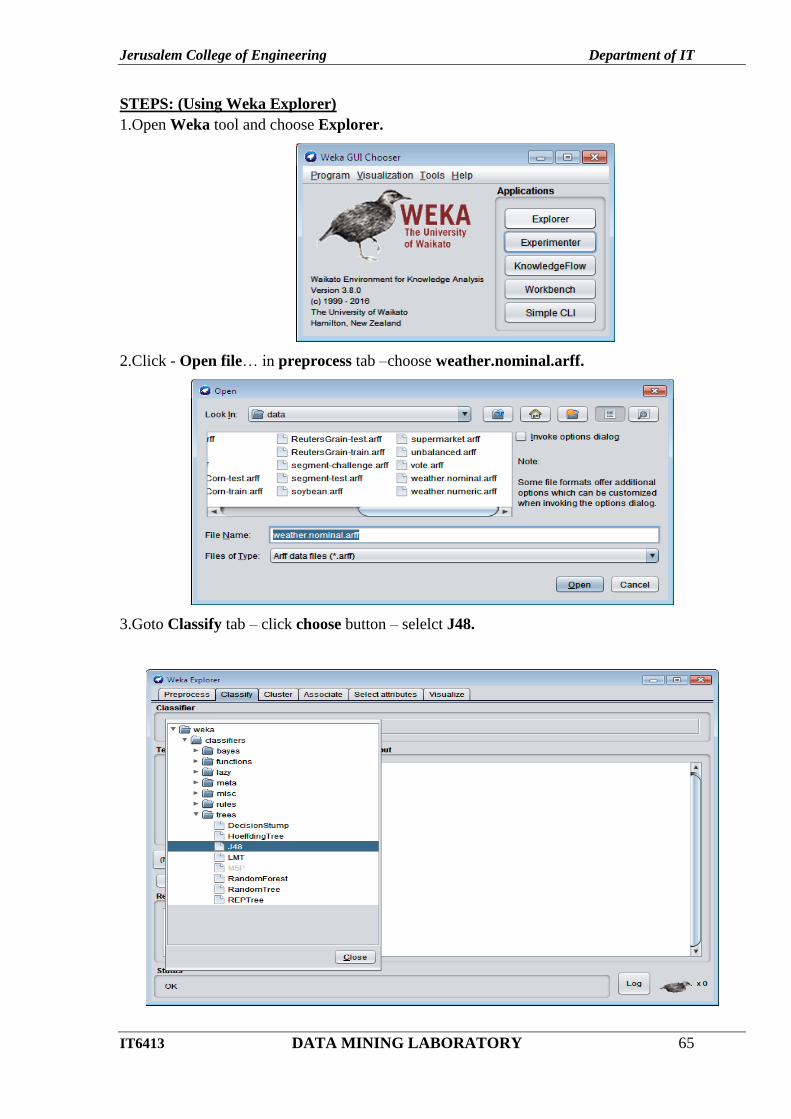
STEPS: (Using Weka Explorer)
1.Open Weka tool and choose Explorer.
2.Click - Open file… in preprocess tab –choose weather.nominal.arff.
3.Goto Classify tab – click choose button – selelct J48.
Jerusalem College of Engineering Department of IT
IT6413 DATA MINING LABORATORY 66
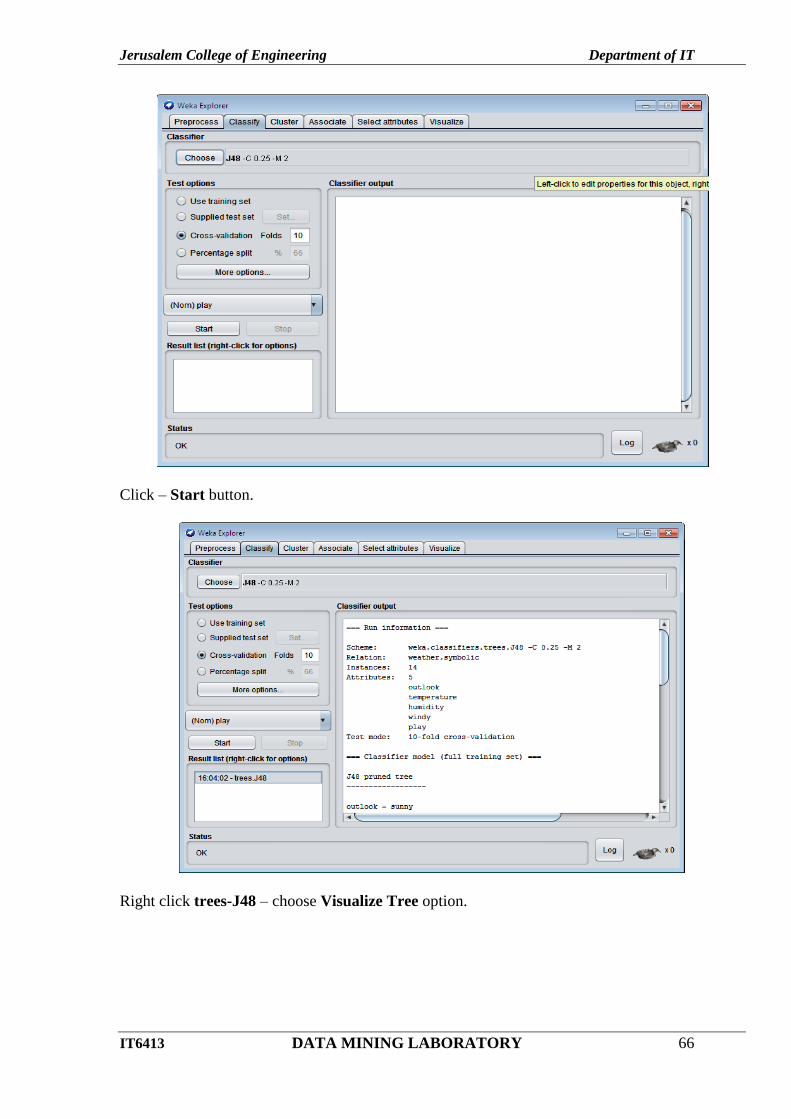
Click – Start button.
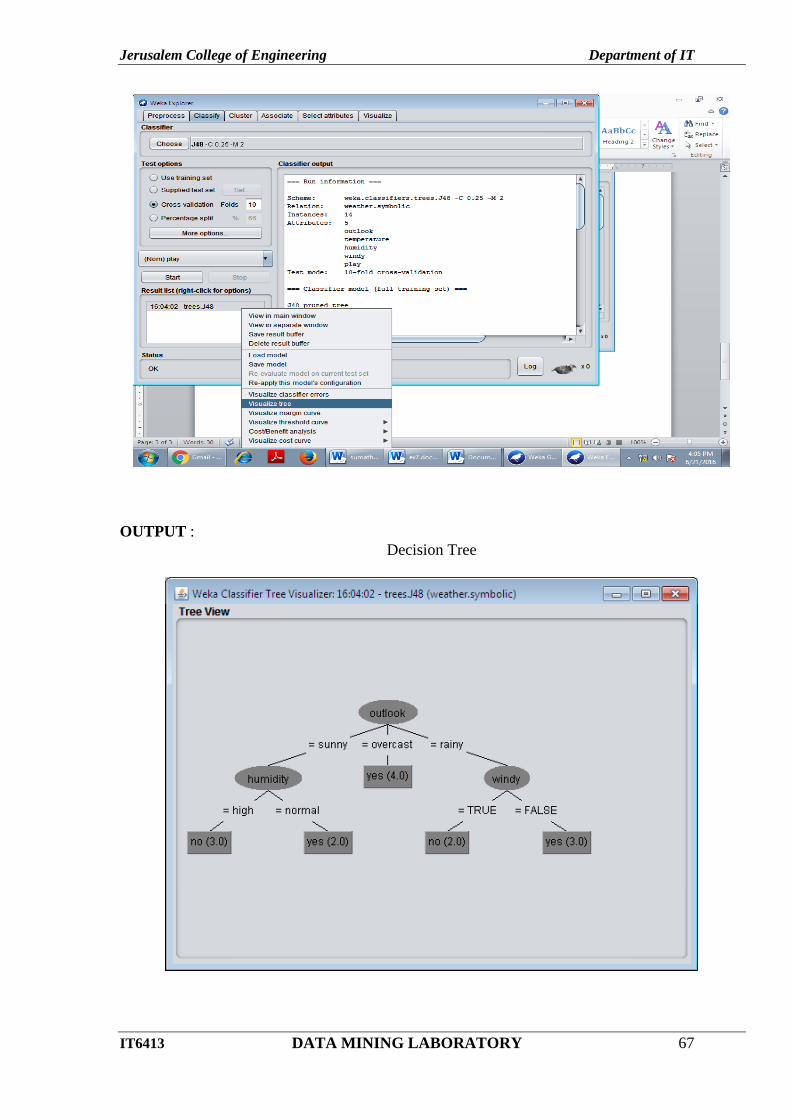
Right click trees-J48 – choose Visualize Tree option.
Jerusalem College of Engineering Department of IT
IT6413 DATA MINING LABORATORY 67
OUTPUT :
Decision Tree
Jerusalem College of Engineering Department of IT
IT6413 DATA MINING LABORATORY 68
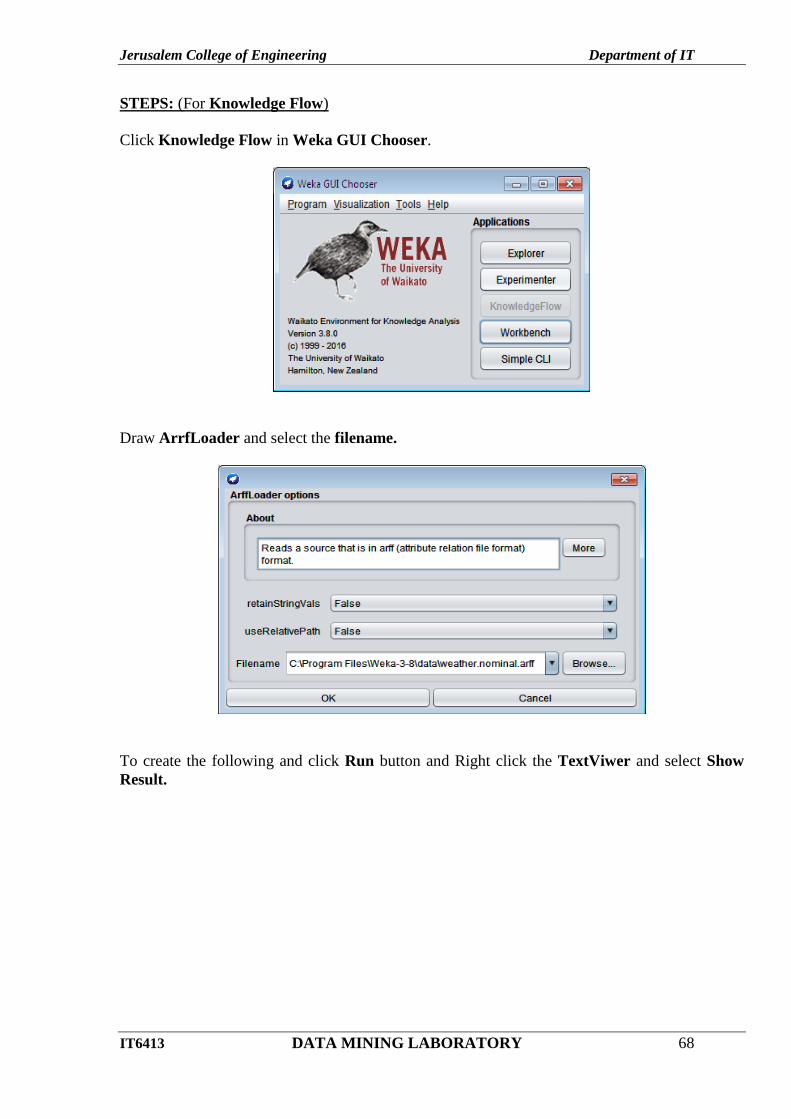
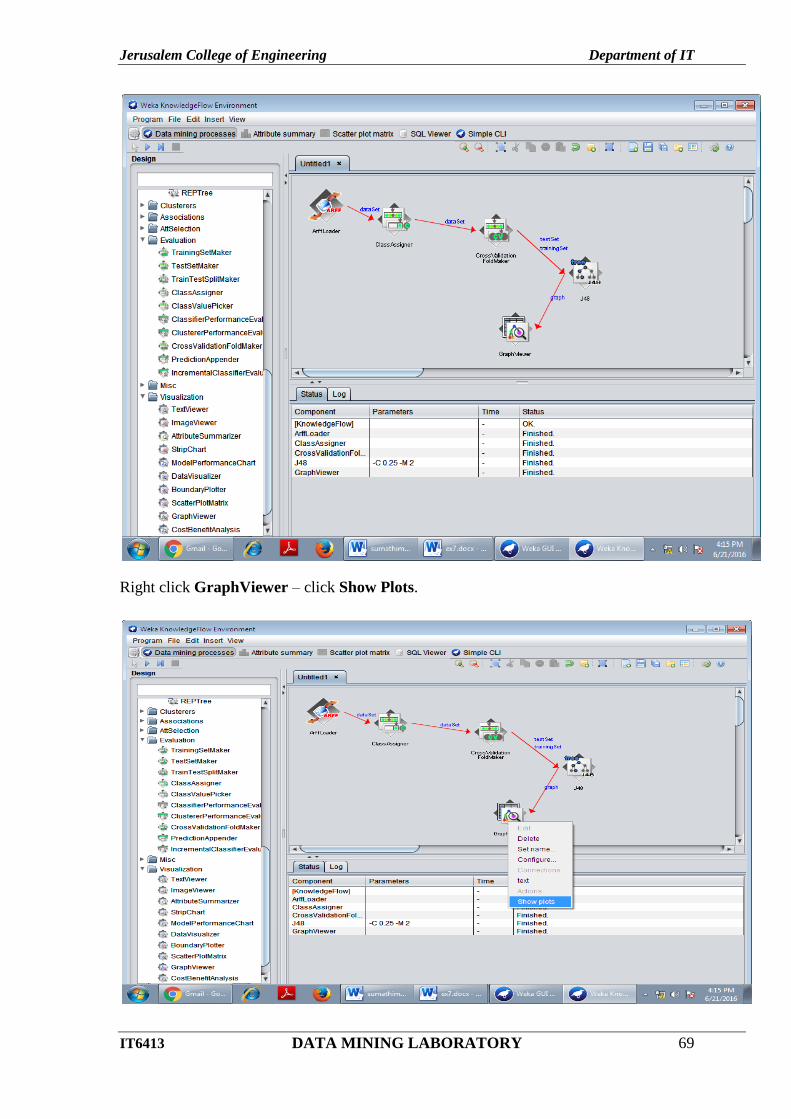
STEPS: (For Knowledge Flow)
Click Knowledge Flow in Weka GUI Chooser.
Draw ArrfLoader and select the filename.
To create the following and click Run button and Right click the TextViwer and select Show
Result.
Jerusalem College of Engineering Department of IT
IT6413 DATA MINING LABORATORY 69
Right click GraphViewer – click Show Plots.
Jerusalem College of Engineering Department of IT
IT6413 DATA MINING LABORATORY 70
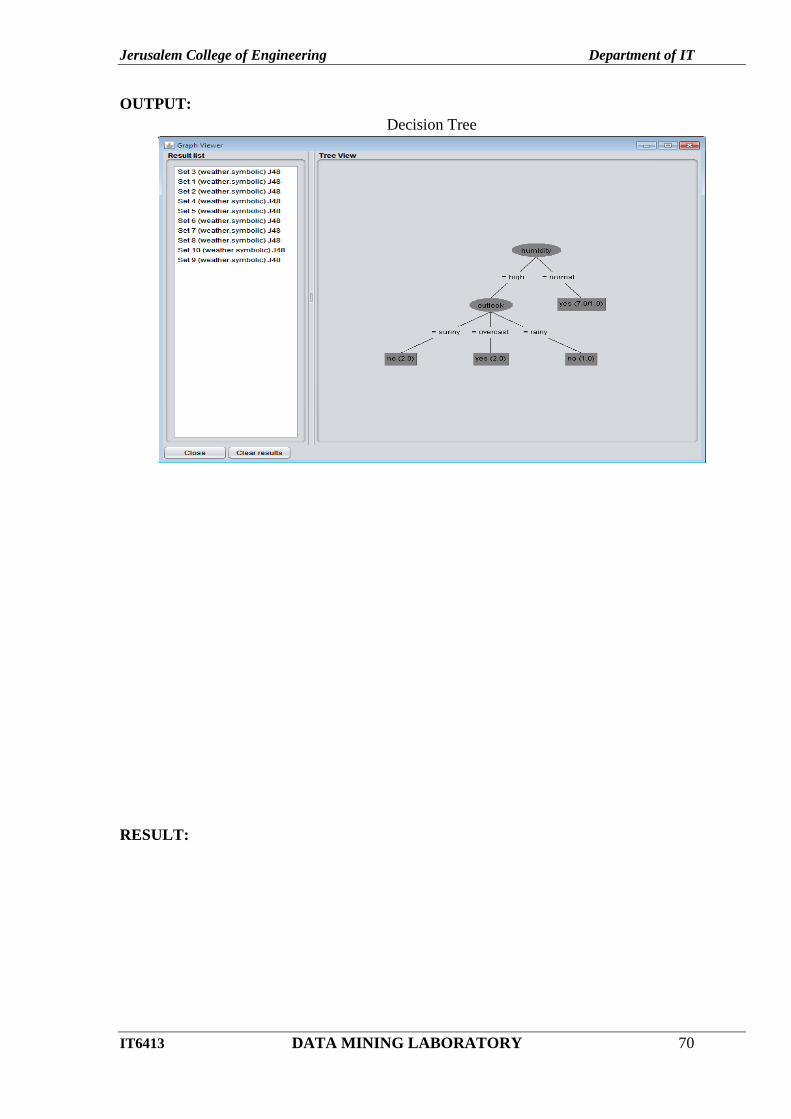
OUTPUT:
Decision Tree
RESULT:
Jerusalem College of Engineering Department of IT
IT6413 DATA MINING LABORATORY 71
Ex no: 8
Date: SUPPORT VECTOR MACHINES
AIM:
This experiment illustrates the use of Support vector classifier in weka. The sample data
set used in this experiment is vote dataset available in arff format. This document assumes that
appropriate data preprocessing has been performed.
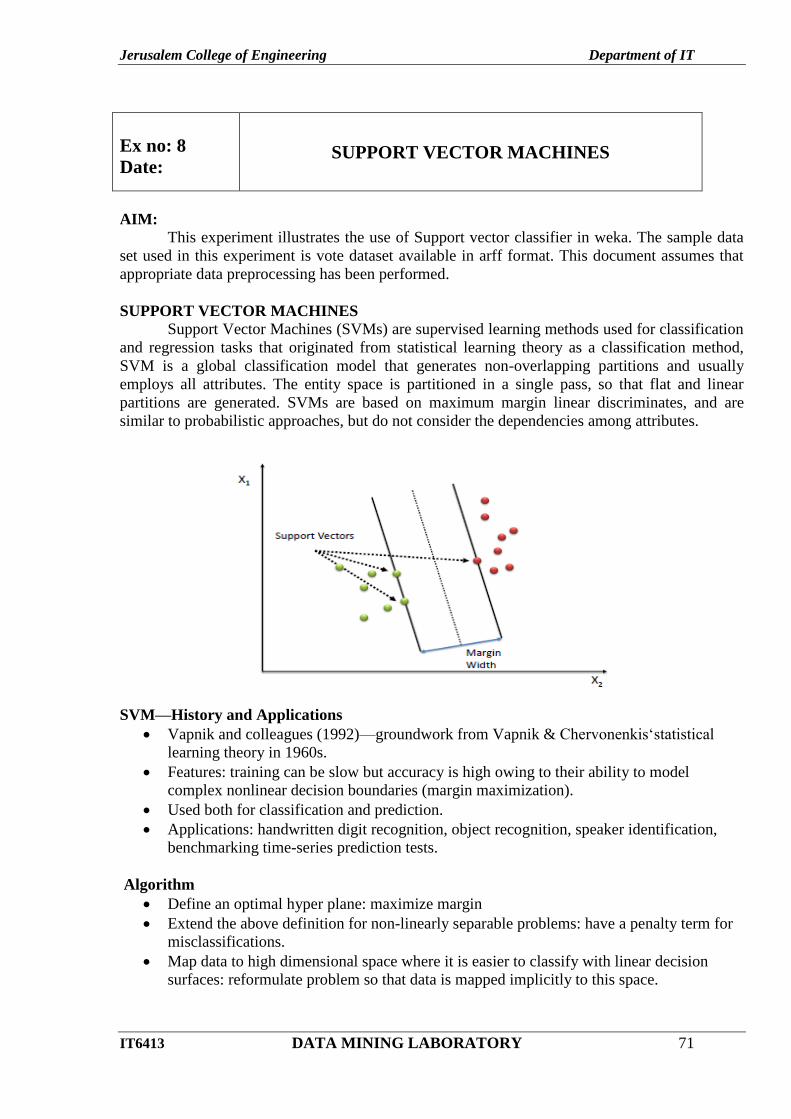
SUPPORT VECTOR MACHINES
Support Vector Machines (SVMs) are supervised learning methods used for classification
and regression tasks that originated from statistical learning theory as a classification method,
SVM is a global classification model that generates non-overlapping partitions and usually
employs all attributes. The entity space is partitioned in a single pass, so that flat and linear
partitions are generated. SVMs are based on maximum margin linear discriminates, and are
similar to probabilistic approaches, but do not consider the dependencies among attributes.
SVM—History and Applications
Vapnik and colleagues (1992)—groundwork from Vapnik & Chervonenkis‘statistical
learning theory in 1960s.
Features: training can be slow but accuracy is high owing to their ability to model
complex nonlinear decision boundaries (margin maximization).
Used both for classification and prediction.
Applications: handwritten digit recognition, object recognition, speaker identification,
benchmarking time-series prediction tests.
Algorithm
Define an optimal hyper plane: maximize margin
Extend the above definition for non-linearly separable problems: have a penalty term for
misclassifications.
Map data to high dimensional space where it is easier to classify with linear decision
surfaces: reformulate problem so that data is mapped implicitly to this space.
Jerusalem College of Engineering Department of IT
IT6413 DATA MINING LABORATORY 72
PROCEDURE:
1. We begin the experiment by loading the data (vote.arff) into weka.
2. Next we select the classify tab and click choose function button to select the Support vector
machine (SMO).
3. Now we specify the various parameters. These can be specified by clicking in the text box to
the right of the chose button.
4. Under the “text “options in the main panel. We select the 10-fold cross validation as our
evaluation approach. Since we don’t have separate evaluation data set, this is necessary to get a
reasonable idea of accuracy of generated model.
5. We now click ”start” to generate the model .the ASCII version of the tree as well as evaluation
statistic will appear in the right panel when the model construction is complete.
6. Note that the classification accuracy of model is about 69%.this indicates that we may find
more work. (Either in preprocessing or in selecting current parameters for the classification)
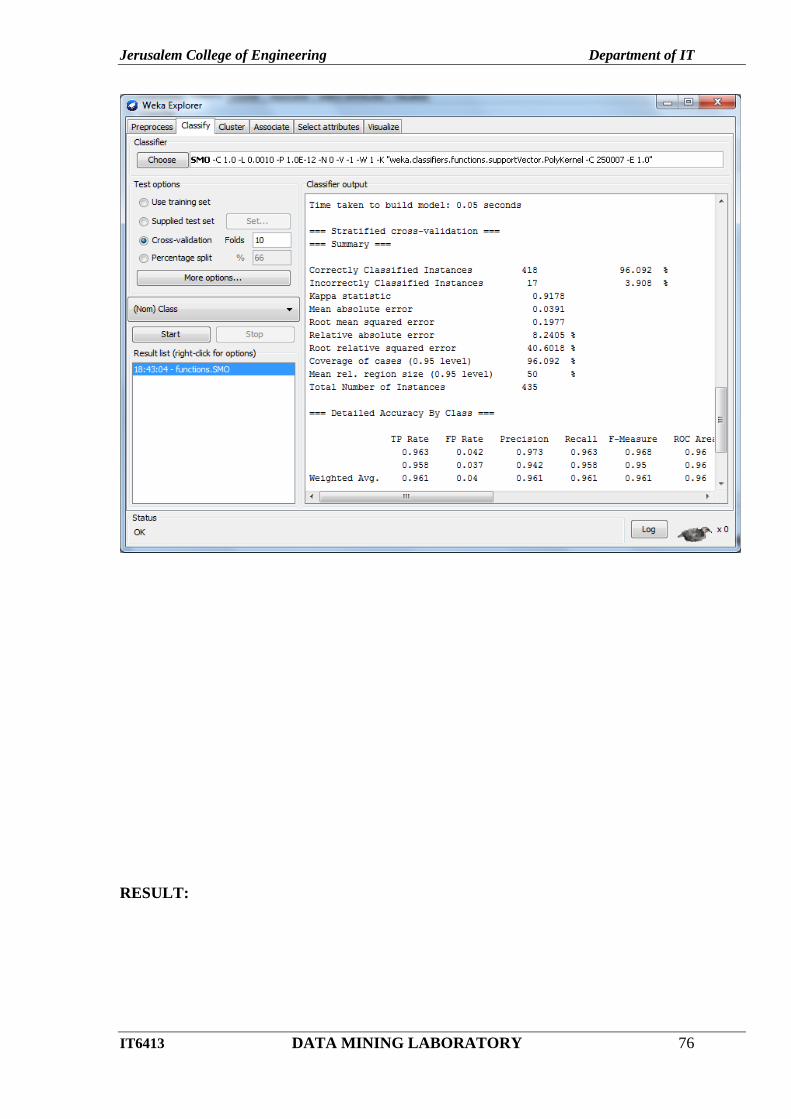
7. The run information of the support vector classifier will be displayed with the correctly and
incorrectly classified instances.
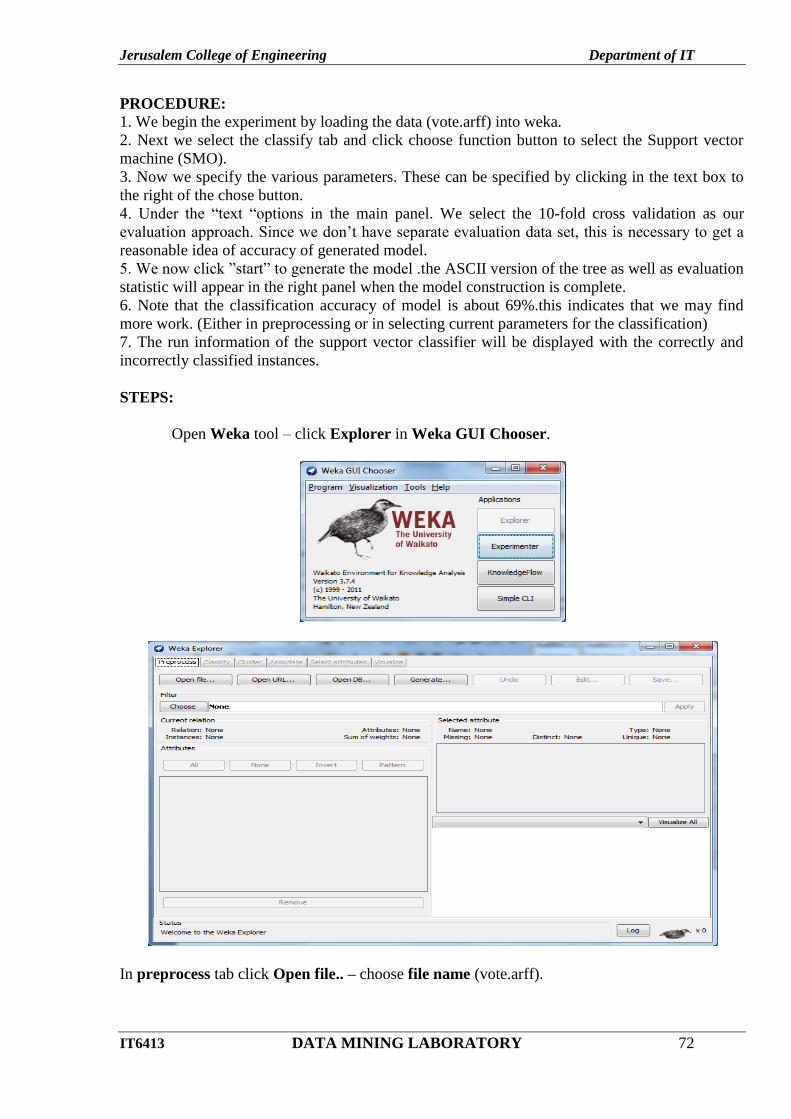
STEPS:
Open Weka tool – click Explorer in Weka GUI Chooser.
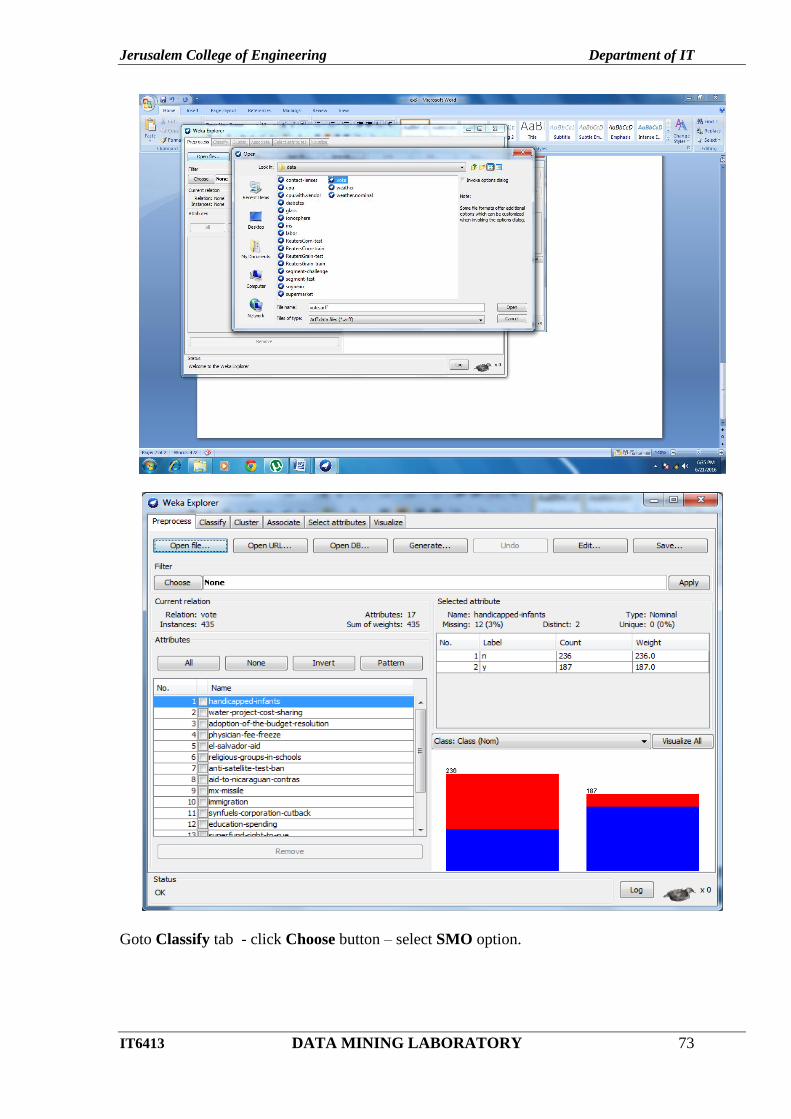
In preprocess tab click Open file.. – choose file name (vote.arff).
Jerusalem College of Engineering Department of IT
IT6413 DATA MINING LABORATORY 73
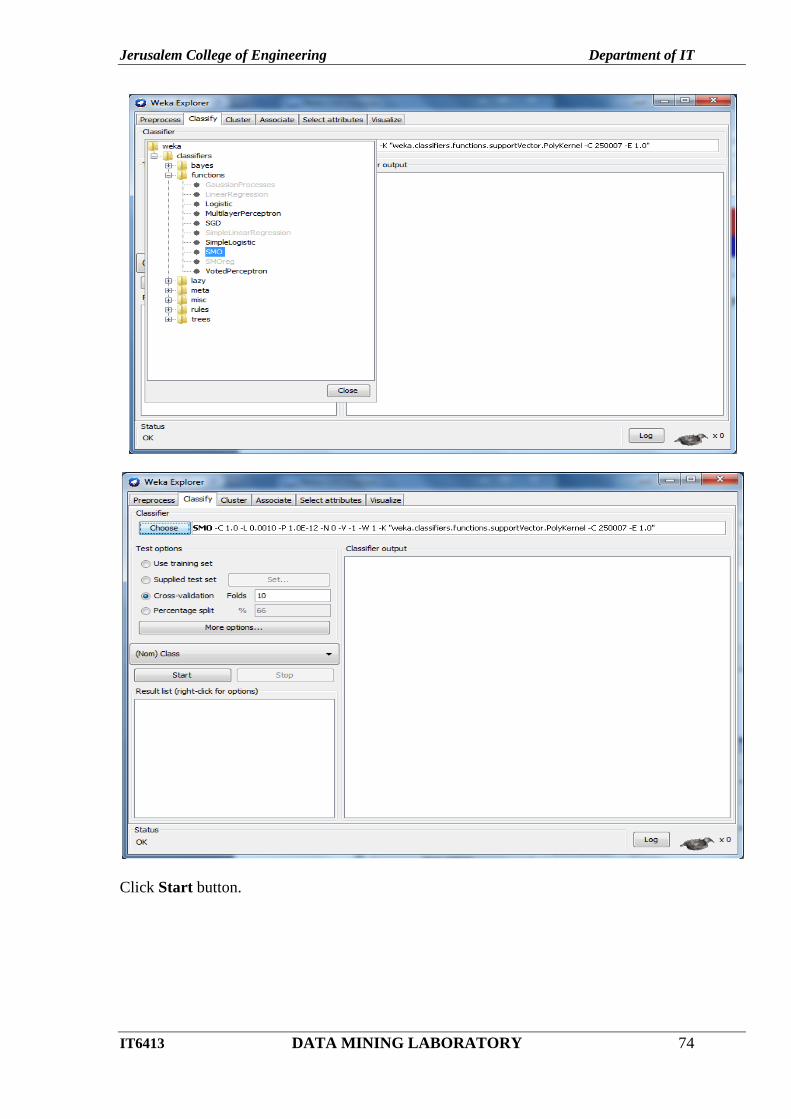
Goto Classify tab - click Choose button – select SMO option.
Jerusalem College of Engineering Department of IT
IT6413 DATA MINING LABORATORY 74
Click Start button.

Jerusalem College of Engineering Department of IT
IT6413 DATA MINING LABORATORY 75
OUTPUT:
Jerusalem College of Engineering Department of IT
IT6413 DATA MINING LABORATORY 76
RESULT:
Jerusalem College of Engineering Department of IT
IT6413 DATA MINING LABORATORY 77
Ex no: 9
Date:
APPLICATIONS OF CLASSIFICATION FOR WEB
MINING
AIM
To analyze an application using weka tool.
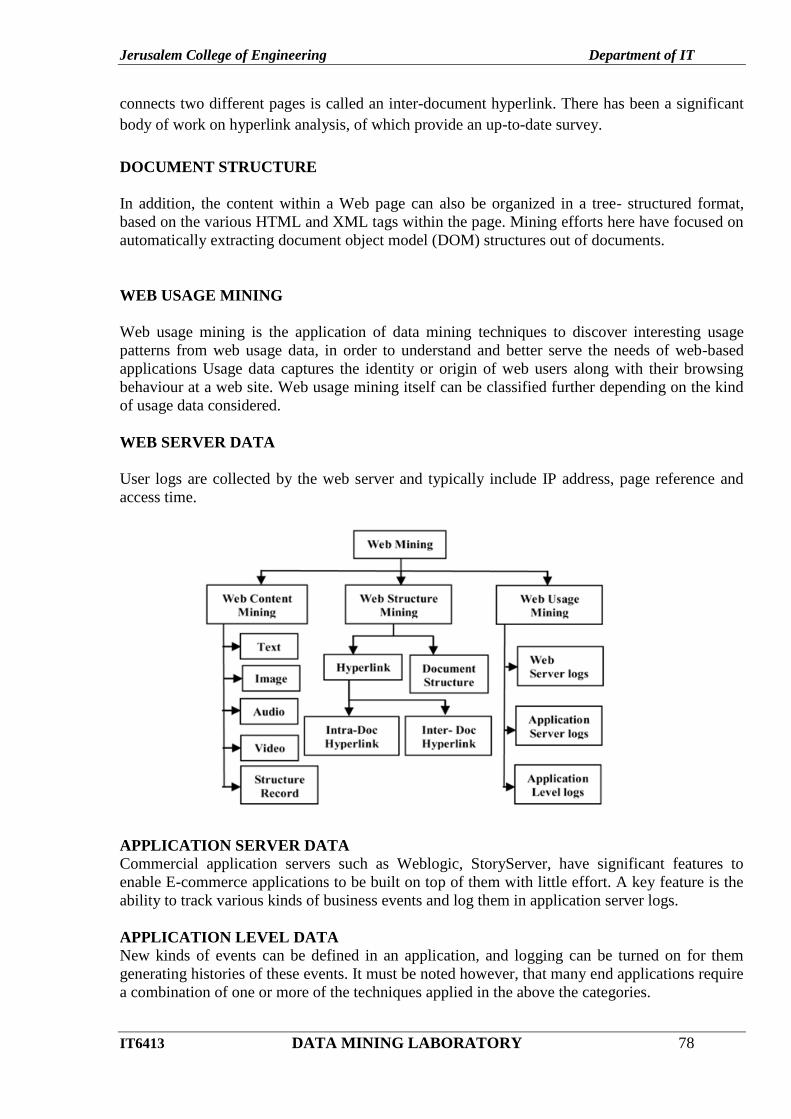
WEB MINING
Use of data mining techniques to automatically discover interesting and potentially useful
information from Web documents and services.
Web mining may be divided into three categories.
Web content mining.
Web structure mining.
Web usage mining.
Web mining is the application of data mining techniques to extract knowledge from web data, i.e.
web content, web structure, and web usage data.
WEB CONTENT MINING
Web content mining is the process of extracting useful information from the contents of web
documents. Content data is the collection of facts a web page is designed to contain. It may
consist of text, images, audio, video, or structured records such as lists and tables. Application of
text mining to web content has been the most widely researched. Issues addressed in text mining
include topic discovery and tracking, extracting association patterns, clustering of web
documents and classification of web pages. Research activities on this topic have drawn heavily
on techniques developed in other disciplines such as Information Retrieval (IR) and Natural
Language Processing (NLP). While there exists a significant body of work in extracting
knowledge from images in the fields of image processing and computer vision, the application of
these techniques to web content mining has been limited.
WEB STRUCTURE MINING
The structure of a typical web graph consists of web pages as nodes, and hyperlinks as edges
connecting related pages. Web structure mining is the process of discovering structure
information from the web. This can be further divided into two kinds based on the kind of
structure information used.
HYPERLINKS
A hyperlink is a structural unit that connects a location in a web page to a different location,
either within the same web page or on a different web page. A hyperlink that connects to a
different part of the same page is called an intra-document hyperlink, and a hyperlink that
Jerusalem College of Engineering Department of IT
IT6413 DATA MINING LABORATORY 78
connects two different pages is called an inter-document hyperlink. There has been a significant
body of work on hyperlink analysis, of which provide an up-to-date survey.
DOCUMENT STRUCTURE
In addition, the content within a Web page can also be organized in a tree- structured format,
based on the various HTML and XML tags within the page. Mining efforts here have focused on
automatically extracting document object model (DOM) structures out of documents.
WEB USAGE MINING
Web usage mining is the application of data mining techniques to discover interesting usage
patterns from web usage data, in order to understand and better serve the needs of web-based
applications Usage data captures the identity or origin of web users along with their browsing
behaviour at a web site. Web usage mining itself can be classified further depending on the kind
of usage data considered.
WEB SERVER DATA
User logs are collected by the web server and typically include IP address, page reference and
access time.
APPLICATION SERVER DATA
Commercial application servers such as Weblogic, StoryServer, have significant features to
enable E-commerce applications to be built on top of them with little effort. A key feature is the
ability to track various kinds of business events and log them in application server logs.
APPLICATION LEVEL DATA
New kinds of events can be defined in an application, and logging can be turned on for them
generating histories of these events. It must be noted however, that many end applications require
a combination of one or more of the techniques applied in the above the categories.
Jerusalem College of Engineering Department of IT
IT6413 DATA MINING LABORATORY 79

Jerusalem College of Engineering Department of IT
IT6413 DATA MINING LABORATORY 80
RESULT:
Jerusalem College of Engineering Department of IT
IT6413 DATA MINING LABORATORY 81
Ex no: 10
Date:
CASE STUDY ON TEXT MINING
AIM:
To perform the text mining using Weka tool.
What is text mining?
Data mining in text: find something useful and surprising from a text collection.
Text mining vs. information retrieval.
Data mining vs. database queries.
Types of text mining
Keyword (or term) based association analysis.
Automatic document (topic) classification similarity detection.
Cluster documents by a common author.
Cluster documents containing information from a common source.
Sequence analysis: predicting a recurring event, discovering trends.
Anomaly detection: find information that violates usual patterns.
Discovery of frequent phrases.
Text segmentation (into logical chunks).
Event detection and tracking.
Information Retrieval
Information retrieval deals with the retrieval of information from a large number of text-
based documents. Some of the database systems are not usually present in information retrieval
systems because both handle different kinds of data. Examples of information retrieval system
include.
Online Library catalogue system.
Online Document Management Systems.
Web Search Systems etc.
The main problem in an information retrieval system is to locate relevant documents in a
document collection based on a user's query. This kind of user's query consists of some keywords
describing an information need.
In such search problems, the user takes an initiative to pull relevant information out from
a collection. This is appropriate when the user has ad-hoc information need, i.e., a short-term
need. But if the user has a long-term information need, then the retrieval system can also take an
initiative to push any newly arrived information item to the user.
This kind of access to information is called Information Filtering. And the corresponding
systems are known as Filtering Systems or Recommender Systems.
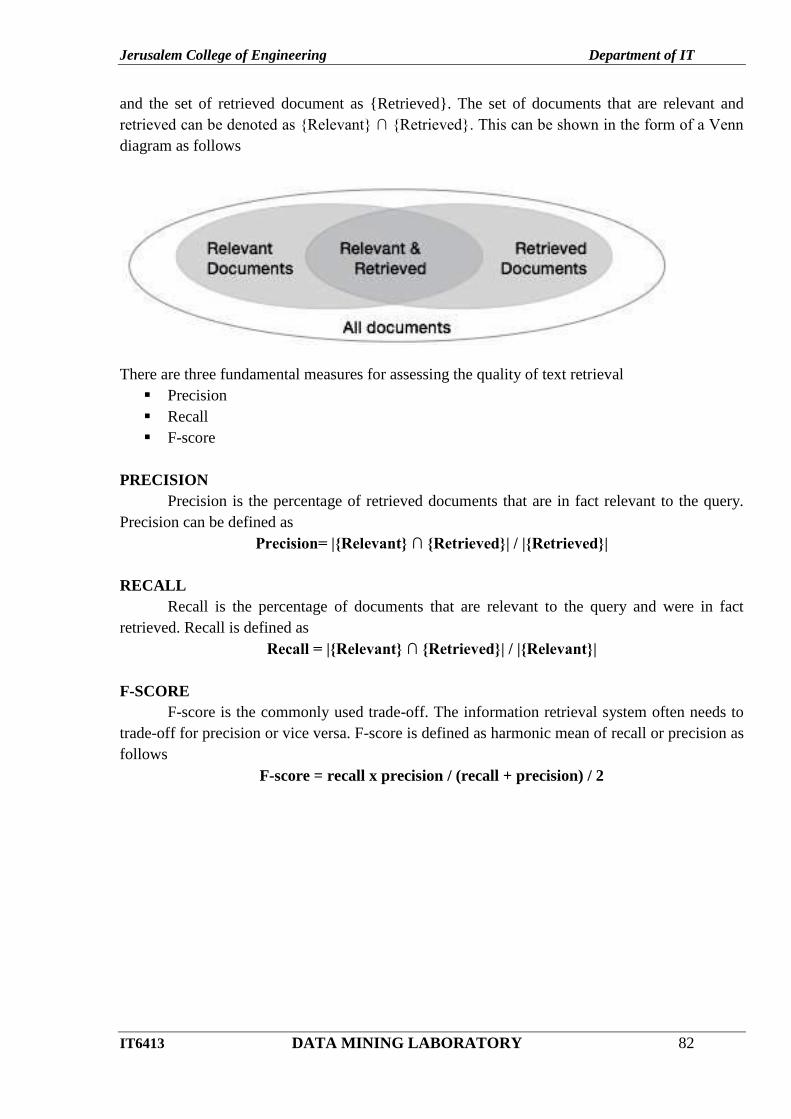
Basic Measures for Text Retrieval
We need to check the accuracy of a system when it retrieves a number of documents on
the basis of user's input. Let the set of documents relevant to a query be denoted as {Relevant}
Jerusalem College of Engineering Department of IT
IT6413 DATA MINING LABORATORY 82
and the set of retrieved document as {Retrieved}. The set of documents that are relevant and
retrieved can be denoted as {Relevant} ∩ {Retrieved}. This can be shown in the form of a Venn
diagram as follows
There are three fundamental measures for assessing the quality of text retrieval
Precision
Recall
F-score
PRECISION
Precision is the percentage of retrieved documents that are in fact relevant to the query.
Precision can be defined as
Precision= |{Relevant} ∩ {Retrieved}| / |{Retrieved}|
RECALL
Recall is the percentage of documents that are relevant to the query and were in fact
retrieved. Recall is defined as
Recall = |{Relevant} ∩ {Retrieved}| / |{Relevant}|
F-SCORE
F-score is the commonly used trade-off. The information retrieval system often needs to
trade-off for precision or vice versa. F-score is defined as harmonic mean of recall or precision as
follows
F-score = recall x precision / (recall + precision) / 2
Jerusalem College of Engineering Department of IT
IT6413 DATA MINING LABORATORY 83
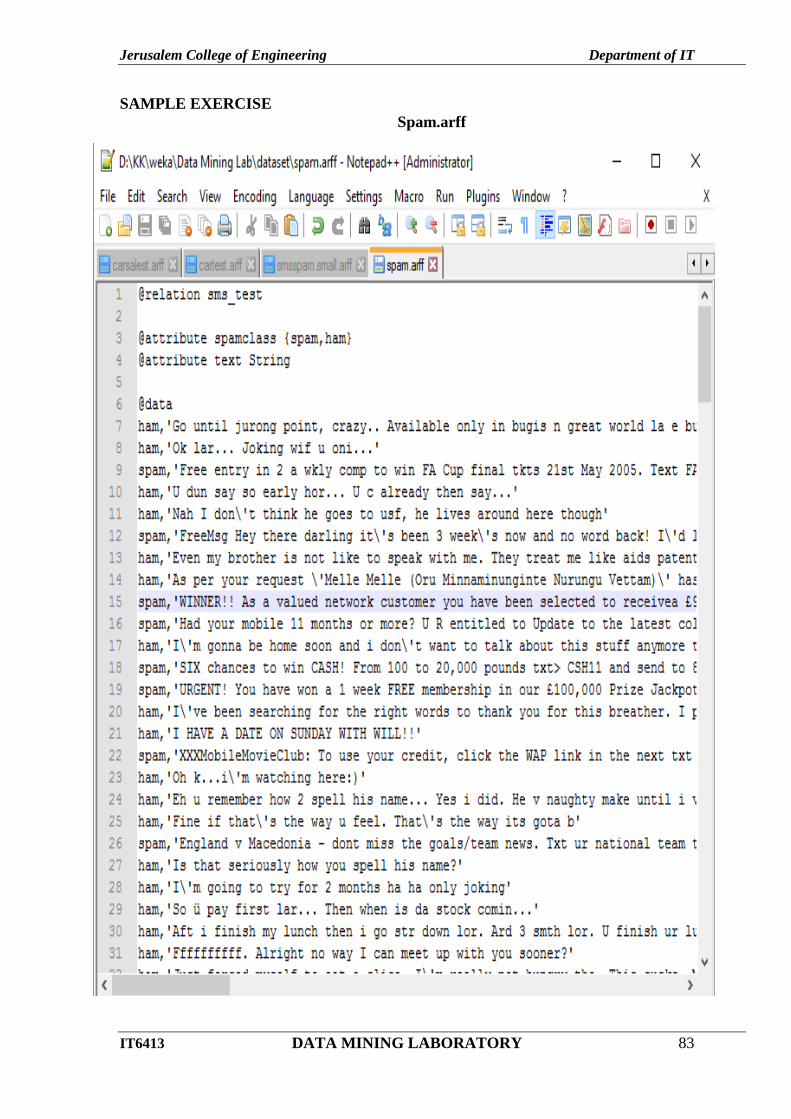
SAMPLE EXERCISE
Spam.arff
Jerusalem College of Engineering Department of IT
IT6413 DATA MINING LABORATORY 84
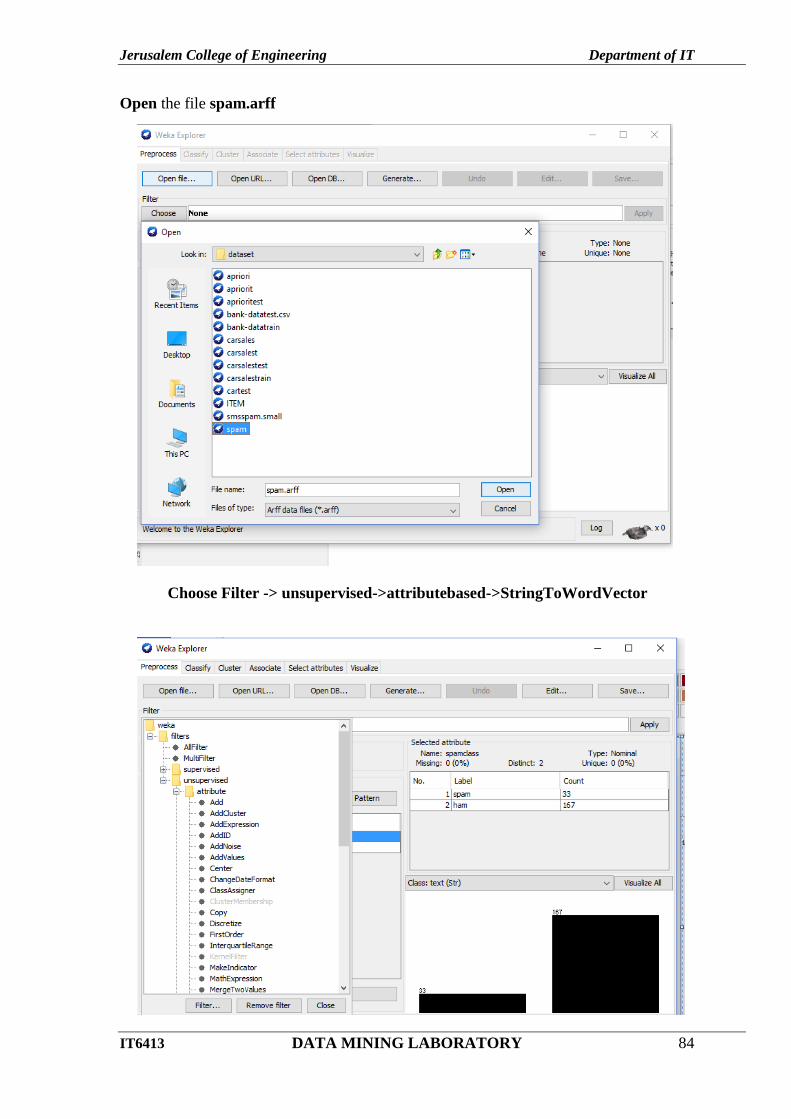
Open the file spam.arff
Choose Filter -> unsupervised->attributebased->StringToWordVector
Jerusalem College of Engineering Department of IT
IT6413 DATA MINING LABORATORY 85
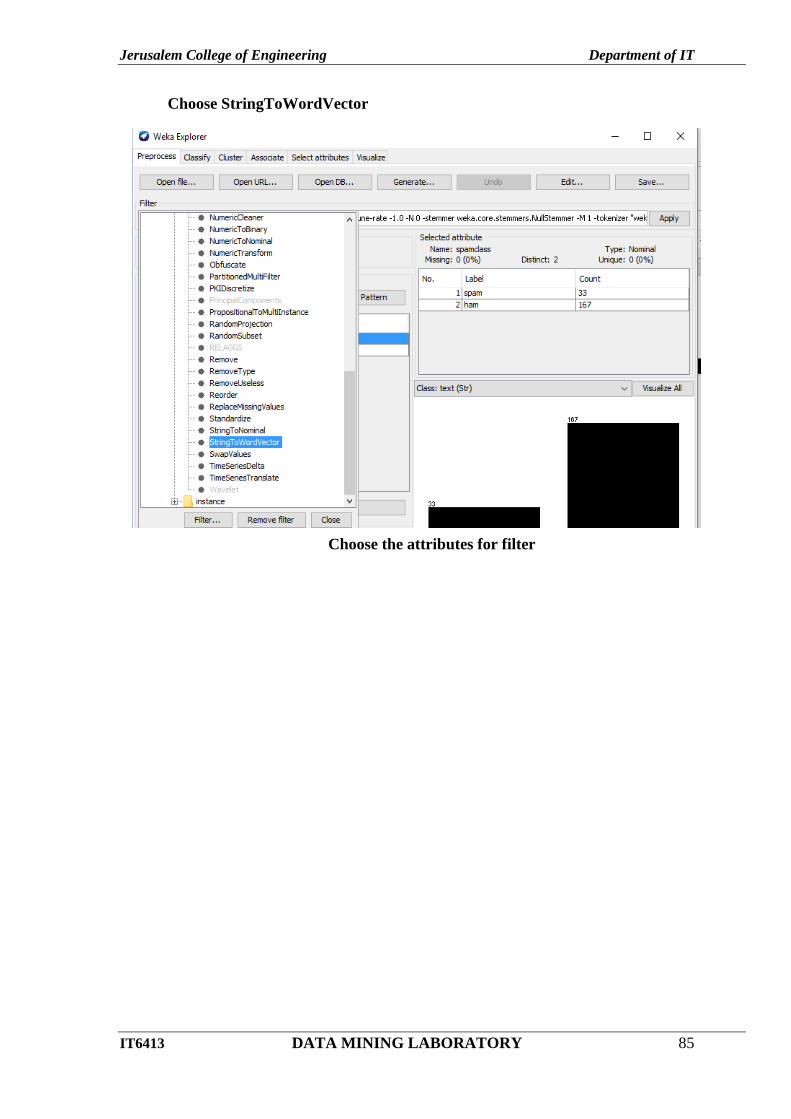
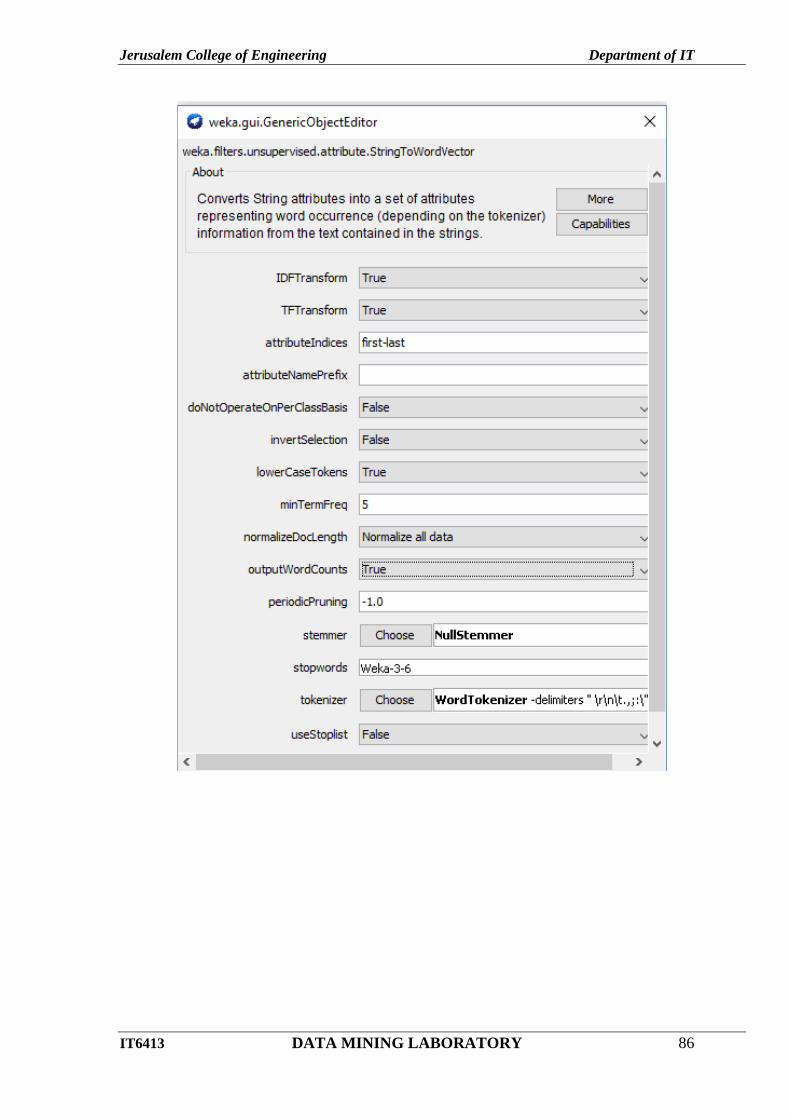
Choose StringToWordVector
Choose the attributes for filter
Jerusalem College of Engineering Department of IT
IT6413 DATA MINING LABORATORY 86
Jerusalem College of Engineering Department of IT
IT6413 DATA MINING LABORATORY 87
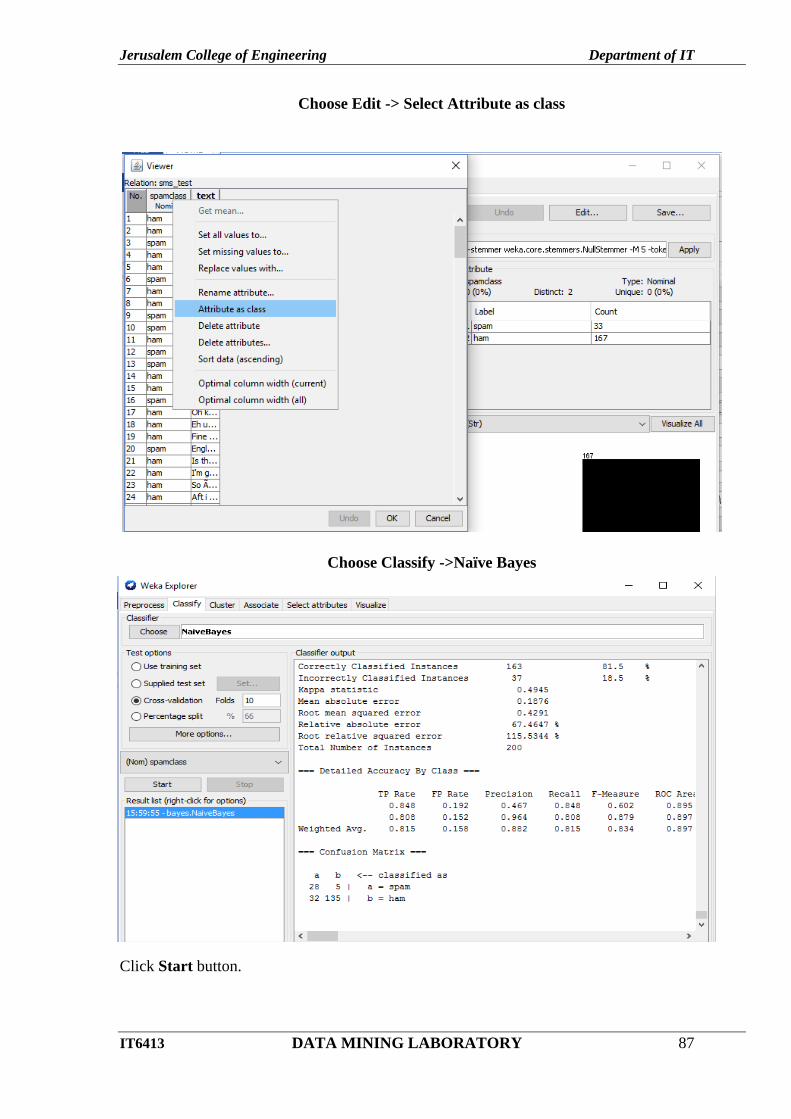
Choose Edit -> Select Attribute as class
Choose Classify ->Naïve Bayes
Click Start button.

Jerusalem College of Engineering Department of IT
IT6413 DATA MINING LABORATORY 88
OUTPUT:
RESULT: