Embed Size (px)
Citation preview
ITALIAN INSURANCEIN FIGURES
Year 2017
ITALIAN INSURANCE IN FIGURESYear 2017
Via di San Nicola da Tolentino 7200187 RomaT +39 06 326 881
Attuariato, Statistiche e Analisi Banche [email protected] www.ania.it
00 COP AssCifre 2017 ingl_ANIA 01/12/17 11:38 Pagina 1

The Italian insurance industry gives a significantcontribution to the economy and to the society, offeringa wide range of services aiming at risk protection:from motor liability to property protection insurance fordamage to property (house, industrial activities) ordamage caused to third parties (general liability), fromwelfare products to life insurance covers.By doing this, the insurance industry helps individuals,families and companies to manage risks and to recoupfinancial losses in the event of damage. Overall theindustry employs about 300 thousand people.
Ass in cifre-2017 inglese_ANIA 07/12/17 12:31 Pagina 1
INDEX
THE INSURANCE INDUSTRY WORLDWIDE 3
NON-LIFE INSURANCE 5
LIFE INSURANCE 10
BALANCE SHEET 14
THE RESULT OF THE INSURANCE FINANCIAL YEAR 16
THE ITALIAN INSURANCE COMPANIES AND THE HUMAN RESOURCES 17
HOW CUSTOMERS PURCHASE AN INSURANCE COVER 19
2
The figures published have been collected using balance sheets of national companiesand branches of foreign companies with registered offices in the European EconomicArea; for the year 2016 data are estimates and thus shall be considered provisional.Figures indicating I.d.b. refer to the Italian direct business. The data shown in thebrochure refer to local gaap balance sheets of Italian insurance companies except fordata in the graph on “Solvency II ratio” at page 15.
Ass in cifre-2017 inglese_ANIA 07/12/17 12:31 Pagina 2
3
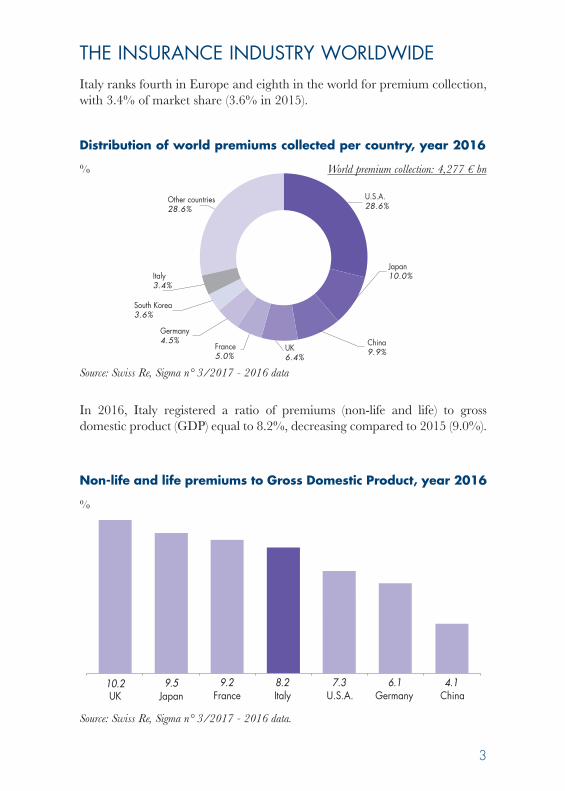
Italy ranks fourth in Europe and eighth in the world for premium collection,with 3.4% of market share (3.6% in 2015).
Distribution of world premiums collected per country, year 2016
In 2016, Italy registered a ratio of premiums (non-life and life) to grossdomestic product (GDP) equal to 8.2%, decreasing compared to 2015 (9.0%).
Non-life and life premiums to Gross Domestic Product, year 2016
THE INSURANCE INDUSTRY WORLDWIDE
Other countries28.6%
U.S.A.28.6%
Italy3.4%
South Korea3.6%
China9.9%
Germany4.5%
France5.0%
UK6.4%
Japan10.0%
Source: Swiss Re, Sigma n° 3/2017 - 2016 data
%
Japan10.2
Italy8.2
Germany6.1
China4.1
France9.2
UK9.5 7.3
U.S.A.
%
Source: Swiss Re, Sigma n° 3/2017 - 2016 data.
World premium collection: 4,277 € bn
Ass in cifre-2017 inglese_ANIA 07/12/17 12:31 Pagina 3
4
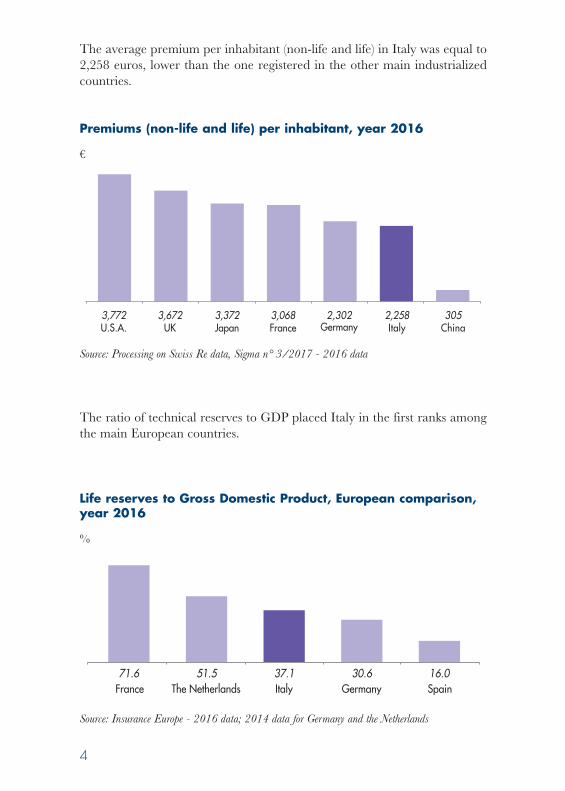
The average premium per inhabitant (non-life and life) in Italy was equal to2,258 euros, lower than the one registered in the other main industrializedcountries.
The ratio of technical reserves to GDP placed Italy in the first ranks amongthe main European countries.
3,672UK
3,068France
3,772U.S.A.
3,372Japan
2,302 2,258Italy
305ChinaGermany
71.6 51.5 37.1 30.6 16.0France The Netherlands GermanyItaly Spain
Life reserves to Gross Domestic Product, European comparison,year 2016
%
Source: Processing on Swiss Re data, Sigma n° 3/2017 - 2016 data
Source: Insurance Europe - 2016 data; 2014 data for Germany and the Netherlands
Premiums (non-life and life) per inhabitant, year 2016
€
Ass in cifre-2017 inglese_ANIA 07/12/17 12:31 Pagina 4

In 2016 non-life Italian direct business (I.d.b.) premiums wereequal to 32.0 billion (-1.0% compared to 2015):
5
direct market changeNon-life classes premiums share 2016/2015**
(€bn) (%) (%)
48%
52%
47%
53%
46%
54%
47%
53%
49%
51%
50%
50%
48%
52%
46%
54%
44%
56%
2010 2011 2012 20132007 2008 200905
1015
2025303540
2014 2015 2016
42%
58%
37.7 37.4 36.7 35.6 36.4 35.4 33.7 32.8 32.0 32.0
other non-life classes (excluding motor and marine liability)motor and marine liability
Italian non-life direct premiums per line of business, 2007-2016€ bn
I.d.b.
motor and marine liability 13.5 42.3 -5.6
accident and sickness 5.4 16.8 4.6
property* 5.1 16.1 0.6
general T.P.L. 2.9 9.1 -0.2
land vehicles 2.6 8.2 6.5
transport* 0.4 1.4 -1.6
credit and suretyship 0.5 1.4 5.9
other non-life classes* 1.5 4.7 1.6
TOTAL 32.0 100.0 -1.0
EU branches***:
motor and marine liability 0.6 14.4 -3.6other non-life classes (excl. motor and marine liability) 3.8 85.6 -0.3
Total 4.4 100.0 -0.8
* Property includes fire and other property damage; transport includes railway rolling stock classes,aircraft, ships and goods in transit; the other classes include financial loss, legal expenses andassistance.
** Changes in percentage are calculated in homogeneous terms.*** The figure refers only to branches of insurers with registered offices in the European Economic
Area that provide data to ANIA and that represent 95% of the total.
NON-LIFE INSURANCE
Ass in cifre-2017 inglese_ANIA 07/12/17 12:31 Pagina 5

6
The ceded ratio in the non-life classes, defined as the incidence ofpremiums ceded and retroceded to reinsurance on the total premiumscollected (direct and indirect), was equal to 11.6% in 2016, distributed asfollows:
In 2016, incurred claims cost, representing cost for settlements, wasequal to 20.0 billion, as in 2015.
11.67.215.5
other non-life classes(excluding motor and marine liability)
motor and marineliability
totalnon-life classes
0
5
10
15
20
25
30
2010 2011 20122007 2008 2009 2013 2014 2015
26.1 27.5 29.026.6 26.5 25.8
22.4 21.2 20.0
2016
20.0
56%
44%
53%
47%
52%
48%
55%
45%
56%
44%
51%
49%
52%
48%
51%
49%
52%
48%
52%
48%
other non-life classes (excluding motor and marine liability)motor and marine liability
Non-life incurred claims cost, 2007-2016
€ bn
I.d.b.
I.d.b.
Non-life ceded ratio (ceded and retroceded premiums/writtenpremiums), year 2016
%
Ass in cifre-2017 inglese_ANIA 07/12/17 12:31 Pagina 6
7
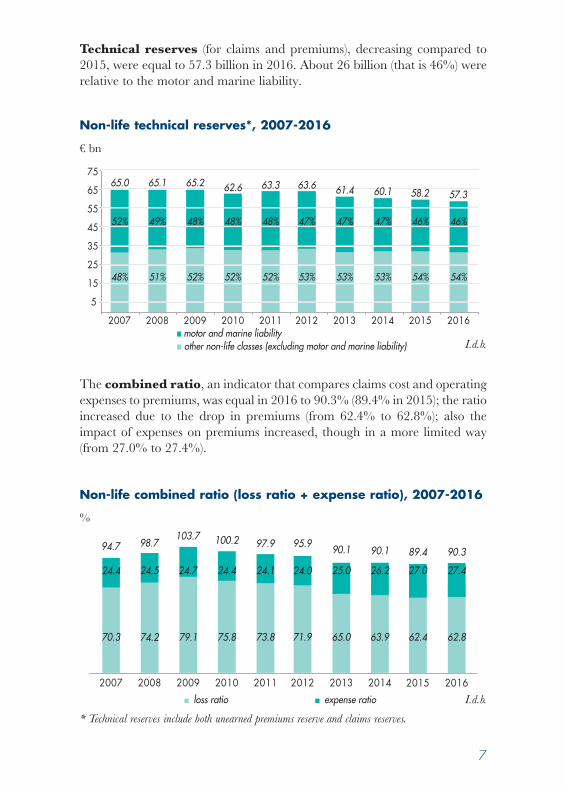
Technical reserves (for claims and premiums), decreasing compared to2015, were equal to 57.3 billion in 2016. About 26 billion (that is 46%) wererelative to the motor and marine liability.
The combined ratio, an indicator that compares claims cost and operatingexpenses to premiums, was equal in 2016 to 90.3% (89.4% in 2015); the ratioincreased due to the drop in premiums (from 62.4% to 62.8%); also theimpact of expenses on premiums increased, though in a more limited way(from 27.0% to 27.4%).
5
15
25
35
45
55
65
75
2010 2011 20122007 2008 2009 2013 2014 2015
65.0 65.1 65.2 62.6 63.3 63.6 61.4 60.1 58.2
52%
48%
49%
51%
48%
52%
48%
52%
48%
52%
47%
53%
47%
53%
47%
53%
46%
54%
2016
57.3
46%
54%
other non-life classes (excluding motor and marine liability)motor and marine liability
Non-life technical reserves*, 2007-2016
€ bn
94.7 98.7103.7 100.2 97.9
loss ratio expense ratio
2010 2011 20122007 2008 2009
24.4 24.5 24.7 24.4 24.1
73.8
95.9
24.0
71.9
2013 2014
90.1
25.0
65.075.874.2 79.170.3
90.1
26.2
63.9
2015 2016
89.4
27.0
62.4
90.3
27.4
62.8
Non-life combined ratio (loss ratio + expense ratio), 2007-2016
%
I.d.b.
* Technical reserves include both unearned premiums reserve and claims reserves.
I.d.b.
Ass in cifre-2017 inglese_ANIA 07/12/17 12:31 Pagina 7
8
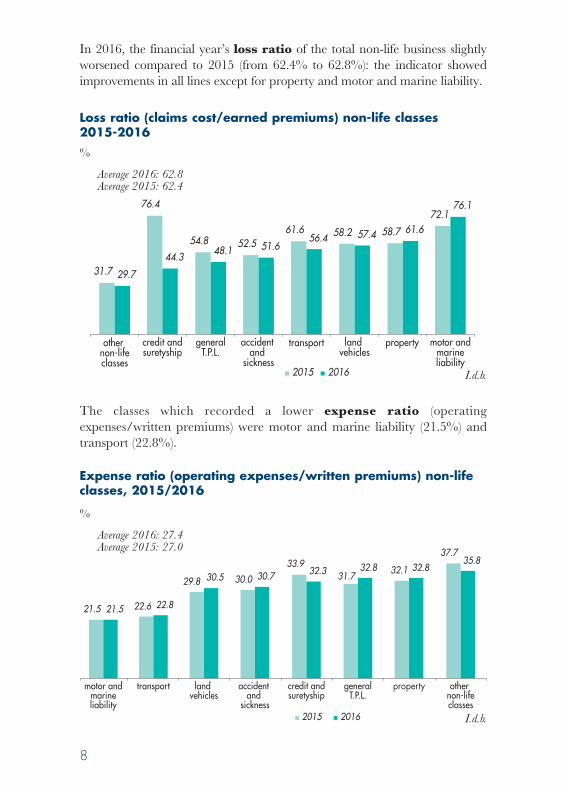
In 2016, the financial year’s loss ratio of the total non-life business slightlyworsened compared to 2015 (from 62.4% to 62.8%): the indicator showedimprovements in all lines except for property and motor and marine liability.
The classes which recorded a lower expense ratio (operatingexpenses/written premiums) were motor and marine liability (21.5%) andtransport (22.8%).
31.7
54.8 52.5
76.4
58.7
72.176.1
61.6
29.7
48.1 51.656.4
44.3
57.4 61.6
property
2015 2016
58.2
other non-lifeclasses
accident and
sickness
credit andsuretyship
transport land vehicles
generalT.P.L.
motor andmarineliability
2015 2016
property
21.5
30.0
33.931.7 32.1
37.735.8
29.8
21.5 22.6 22.8
30.5 30.7 32.3 32.8 32.8
other non-lifeclasses
accident and
sickness
credit andsuretyship
transport land vehicles
generalT.P.L.
motor andmarineliability
I.d.b.
I.d.b.
Loss ratio (claims cost/earned premiums) non-life classes 2015-2016%
Average 2016: 62.8Average 2015: 62.4
Expense ratio (operating expenses/written premiums) non-lifeclasses, 2015/2016
%
Average 2016: 27.4Average 2015: 27.0
Ass in cifre-2017 inglese_ANIA 07/12/17 12:32 Pagina 8
9
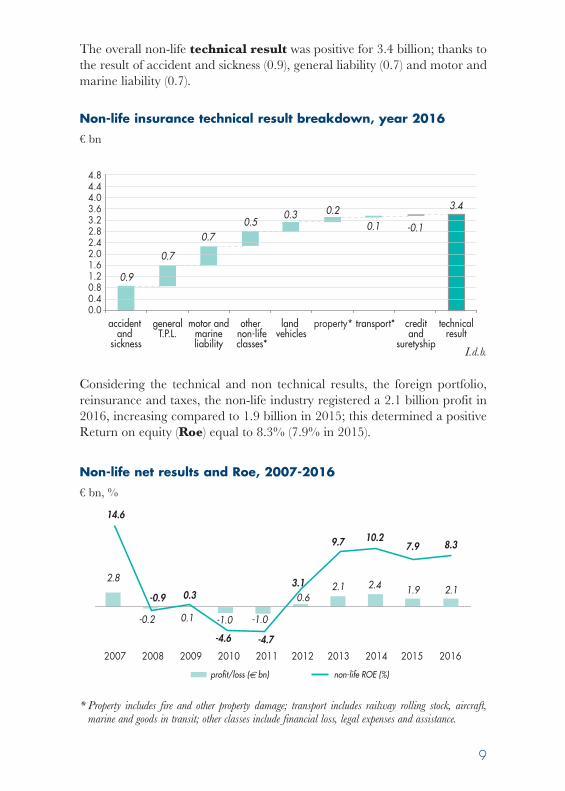
The overall non-life technical result was positive for 3.4 billion; thanks tothe result of accident and sickness (0.9), general liability (0.7) and motor andmarine liability (0.7).
Considering the technical and non technical results, the foreign portfolio,reinsurance and taxes, the non-life industry registered a 2.1 billion profit in2016, increasing compared to 1.9 billion in 2015; this determined a positiveReturn on equity (Roe) equal to 8.3% (7.9% in 2015).
property*0.00.40.81.21.62.02.42.83.23.64.04.44.8
0.9
0.7
0.70.5
0.3 0.2
-0.10.1
3.4
other non-lifeclasses*
accident and
sickness
creditand
suretyship
transport*land vehicles
generalT.P.L.
motor andmarineliability
technicalresult
Non-life insurance technical result breakdown, year 2016€ bn
2.8
-0.2
0.3
-1.0 -1.0
0.62.1 2.4
14.6
-0.9
0.1
-4.6 -4.7
3.1
9.7 10.2
2010 2011 2012 2013 20142007 2008 2009
non-life ROE (%)profit/loss ( bn)
1.9
7.9
2015
2.1
8.3
2016
Non-life net results and Roe, 2007-2016€ bn, %
I.d.b.
* Property includes fire and other property damage; transport includes railway rolling stock, aircraft,marine and goods in transit; other classes include financial loss, legal expenses and assistance.
Ass in cifre-2017 inglese_ANIA 07/12/17 12:32 Pagina 9
10
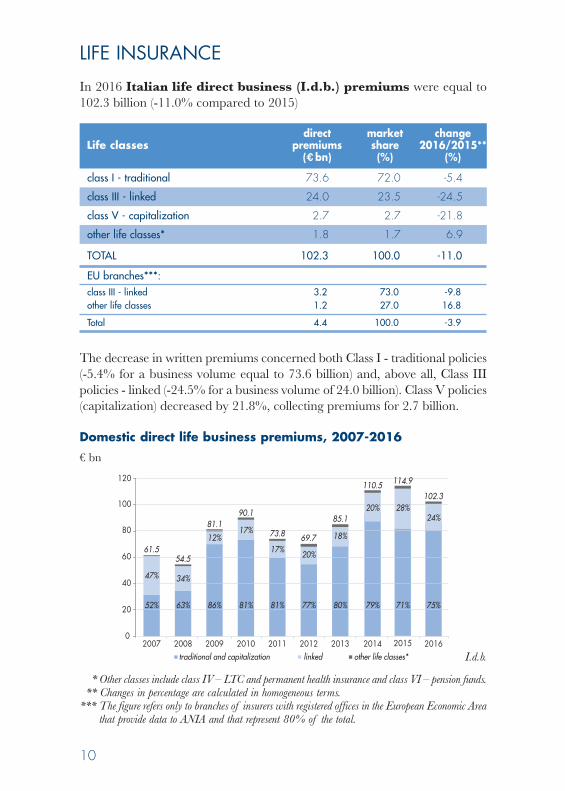
In 2016 Italian life direct business (I.d.b.) premiums were equal to102.3 billion (-11.0% compared to 2015)
The decrease in written premiums concerned both Class I - traditional policies(-5.4% for a business volume equal to 73.6 billion) and, above all, Class IIIpolicies - linked (-24.5% for a business volume of 24.0 billion). Class V policies(capitalization) decreased by 21.8%, collecting premiums for 2.7 billion.
LIFE INSURANCE
direct market changeLife classes premiums share 2016/2015**
(€bn) (%) (%)
class I - traditional 73.6 72.0 -5.4
class III - linked 24.0 23.5 -24.5
class V - capitalization 2.7 2.7 -21.8
other life classes* 1.8 1.7 6.9
TOTAL 102.3 100.0 -11.0
EU branches***:class III - linked 3.2 73.0 -9.8other life classes 1.2 27.0 16.8
Total 4.4 100.0 -3.9
* Other classes include class IV – LTC and permanent health insurance and class VI – pension funds.** Changes in percentage are calculated in homogeneous terms.
*** The figure refers only to branches of insurers with registered offices in the European Economic Areathat provide data to ANIA and that represent 80% of the total.
linked 2010 20112007 2008 2009
0
20
40
60
80
100
20152012 2013 2014
120
61.554.5
81.190.1
73.8 69.7
85.1
110.5 114.9
52% 63% 86% 81% 81% 77% 80% 79% 71%
47% 34%
12%17%
17% 20%
18%
20%
2016
102.3
75%
24%28%
traditional and capitalization other life classes* I.d.b.
Domestic direct life business premiums, 2007-2016€ bn
Ass in cifre-2017 inglese_ANIA 07/12/17 12:32 Pagina 10

11
In 2016 incurred claims cost, including the amounts paid and thechanges in the provisions for amounts to be paid, were equal to 62.9 billion,decreasing by over 11% compared to 2015.
In 2016 the technical provisions were equal to 616 billion, increasing by8.6% compared to 2015; the relative cover ratio was equal to 6.0 (4.9 in2015).
0
10
20
30
40
50
60
70
80
2010 20112007 2008 2009linked
2012 2013 2014 2015
74.365.5
57.2
66.874.0 75.0
66.8 64.671.2
39%35%
39%37%
32% 31%31% 28%
24%
61% 64% 60% 62% 68% 68% 68% 71% 74%
2016
62.9
24%
74%
traditional and capitalization other life classes*
Life incurred claims cost, 2007-2016
€ bn
2011 2012 2013 20142007 2008 2009 2010cover ratio
cove
r rat
io
0
100
200
300
400
500
600
700
0
1
2
3
4
5
6
7
tech
nica
l pro
visio
ns (
bn
)
20162015
360 338379
411 414 423 453515
567616
technical provisions
I.d.b.
I.d.b.
Life technical provisions and cover ratio, 2007-2016
Ass in cifre-2017 inglese_ANIA 07/12/17 12:32 Pagina 11
12
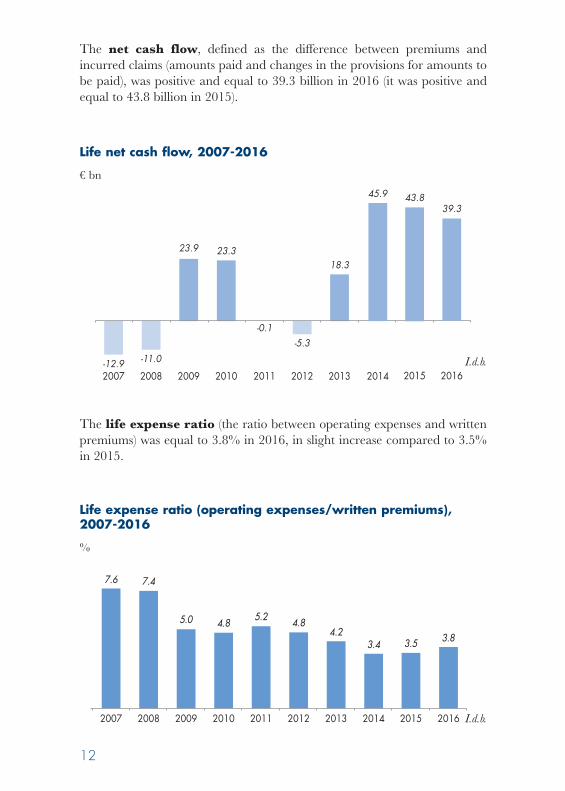
The net cash flow, defined as the difference between premiums andincurred claims (amounts paid and changes in the provisions for amounts tobe paid), was positive and equal to 39.3 billion in 2016 (it was positive andequal to 43.8 billion in 2015).
The life expense ratio (the ratio between operating expenses and writtenpremiums) was equal to 3.8% in 2016, in slight increase compared to 3.5%in 2015.
2010 20112007 2008 2009 2012 2013 2014
4.23.4
5.0
7.47.6
4.85.2 4.8
2015
3.5
2016
3.8
Life expense ratio (operating expenses/written premiums),2007-2016
%
-12.9
-0.1-5.3
23.9 23.3
-11.0
18.3
2010 2011 2012 2013
45.9
20142007 2008 2009
43.8
2015
39.3
2016
Life net cash flow, 2007-2016
€ bn
I.d.b.
I.d.b.
Ass in cifre-2017 inglese_ANIA 07/12/17 12:32 Pagina 12
13
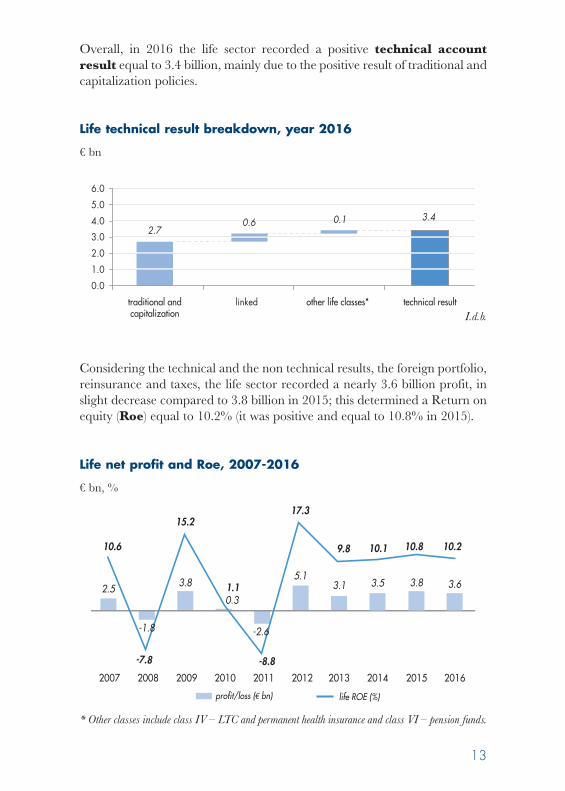
Overall, in 2016 the life sector recorded a positive technical accountresult equal to 3.4 billion, mainly due to the positive result of traditional andcapitalization policies.
Considering the technical and the non technical results, the foreign portfolio,reinsurance and taxes, the life sector recorded a nearly 3.6 billion profit, inslight decrease compared to 3.8 billion in 2015; this determined a Return onequity (Roe) equal to 10.2% (it was positive and equal to 10.8% in 2015).
linked
2.7
0.0
1.0
2.0
3.04.0
5.0
6.0
0.6 0.1 3.4
traditional andcapitalization
other life classes* technical result
5.11.1
10.6
15.2
-7.8
2010 2011 2012 2013 20142007 2008 2009
life ROE (%)profit/loss (€ bn)
-8.8
17.3
3.1
9.8
3.5
10.1
2.5 3.8
0.3
2015
3.8
10.8
2016
3.6
10.2
-1.8 -2.6
Life net profit and Roe, 2007-2016
€ bn, %
I.d.b.
* Other classes include class IV – LTC and permanent health insurance and class VI – pension funds.
Life technical result breakdown, year 2016
€ bn
Ass in cifre-2017 inglese_ANIA 07/12/17 12:32 Pagina 13
14
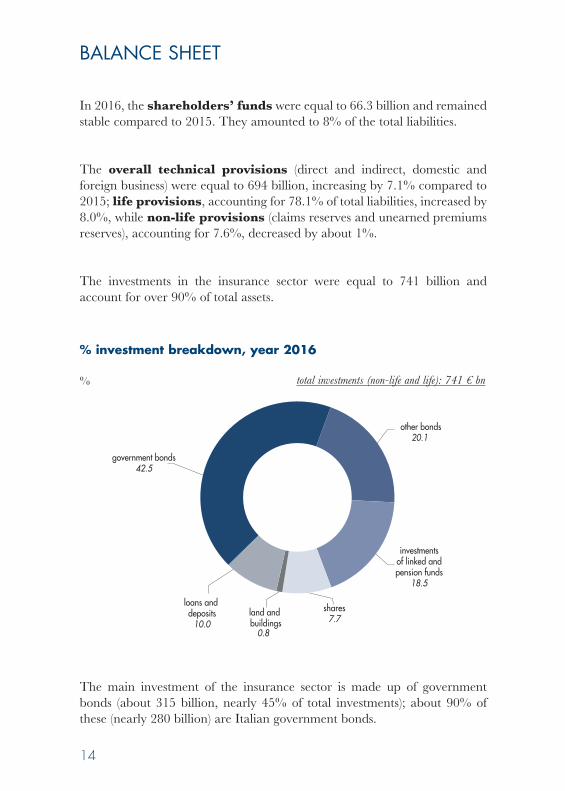
In 2016, the shareholders’ funds were equal to 66.3 billion and remainedstable compared to 2015. They amounted to 8% of the total liabilities.
The overall technical provisions (direct and indirect, domestic andforeign business) were equal to 694 billion, increasing by 7.1% compared to2015; life provisions, accounting for 78.1% of total liabilities, increased by8.0%, while non-life provisions (claims reserves and unearned premiumsreserves), accounting for 7.6%, decreased by about 1%.
The investments in the insurance sector were equal to 741 billion andaccount for over 90% of total assets.
The main investment of the insurance sector is made up of governmentbonds (about 315 billion, nearly 45% of total investments); about 90% ofthese (nearly 280 billion) are Italian government bonds.
BALANCE SHEET
shares7.7
investmentsof linked andpension funds
18.5
land and buildings
0.8
loans and deposits
10.0
other bonds20.1
government bonds42.5
% investment breakdown, year 2016
% total investments (non-life and life): 741 € bn
Ass in cifre-2017 inglese_ANIA 07/12/17 12:32 Pagina 14
15
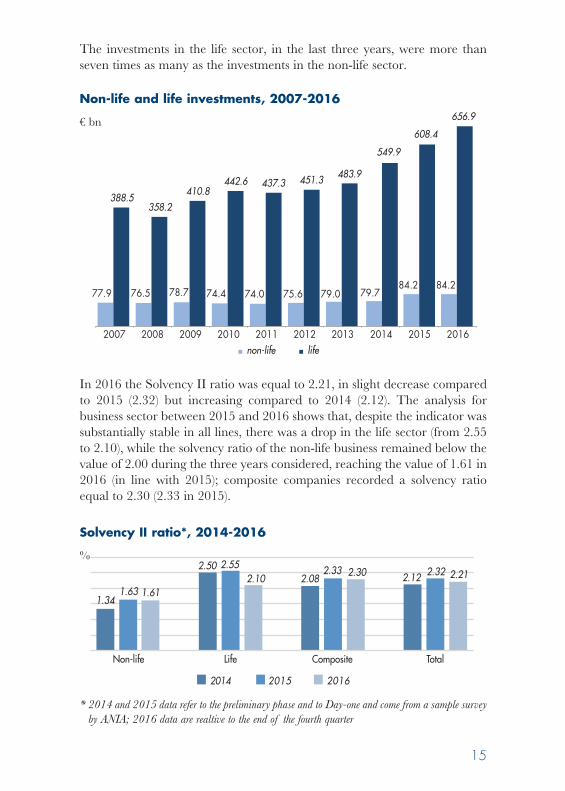
The investments in the life sector, in the last three years, were more thanseven times as many as the investments in the non-life sector.
In 2016 the Solvency II ratio was equal to 2.21, in slight decrease comparedto 2015 (2.32) but increasing compared to 2014 (2.12). The analysis forbusiness sector between 2015 and 2016 shows that, despite the indicator wassubstantially stable in all lines, there was a drop in the life sector (from 2.55to 2.10), while the solvency ratio of the non-life business remained below thevalue of 2.00 during the three years considered, reaching the value of 1.61 in2016 (in line with 2015); composite companies recorded a solvency ratioequal to 2.30 (2.33 in 2015).
2010 2011 20122007 2008 2009non-life life
74.4 74.077.9 76.5 78.7
388.5358.2
410.8442.6 437.3
75.6
451.3
2013 2014
79.0
483.9
79.7
549.9
2015 2016
84.2 84.2
608.4
656.9
LifeNon-life
2014 2015
Composite Total
2016
1.341.63 1.61
2.552.10 2.12
2.502.08
2.33 2.30 2.32 2.21
Non-life and life investments, 2007-2016
€ bn
Solvency II ratio*, 2014-2016
%
* 2014 and 2015 data refer to the preliminary phase and to Day-one and come from a sample surveyby ANIA; 2016 data are realtive to the end of the fourth quarter
Ass in cifre-2017 inglese_ANIA 07/12/17 12:32 Pagina 15
16
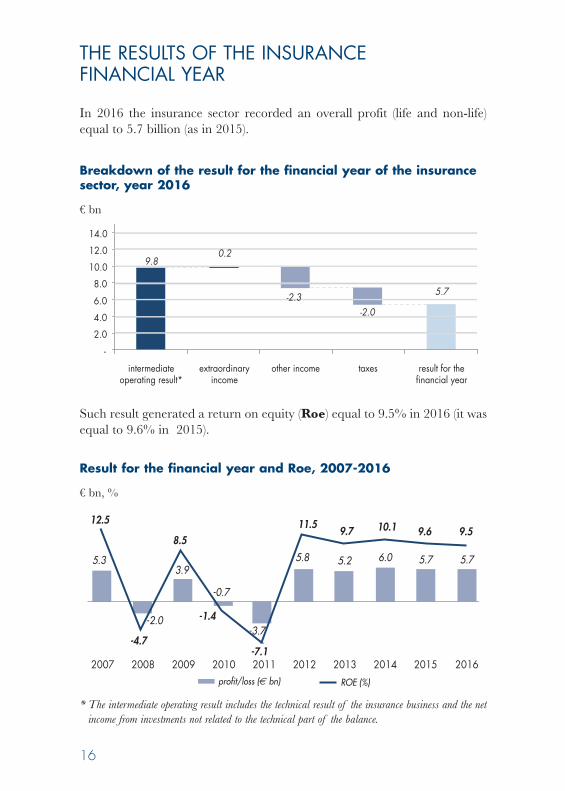
In 2016 the insurance sector recorded an overall profit (life and non-life)equal to 5.7 billion (as in 2015).
Such result generated a return on equity (Roe) equal to 9.5% in 2016 (it wasequal to 9.6% in 2015).
THE RESULTS OF THE INSURANCE FINANCIAL YEAR
-0.7
2011 2012 2013 20142007 2008 2009 2010ROE (%)profit/loss ( bn)
-7.1
5.33.9
-2.0
12.5
8.511.5
-1.4
-4.7-3.7
5.8
9.7
5.2
10.1
6.0
2015
9.6
5.7
2016
9.5
5.7
Result for the financial year and Roe, 2007-2016
€ bn, %
9.8
-
2.0
4.0
6.0
8.0
10.0
12.0
14.0
0.2
-2.3 -2.0
5.7
intermediateoperating result*
extraordinaryincome
other income taxes result for thefinancial year
* The intermediate operating result includes the technical result of the insurance business and the netincome from investments not related to the technical part of the balance.
Breakdown of the result for the financial year of the insurancesector, year 2016
€ bn
Ass in cifre-2017 inglese_ANIA 07/12/17 12:32 Pagina 16
17
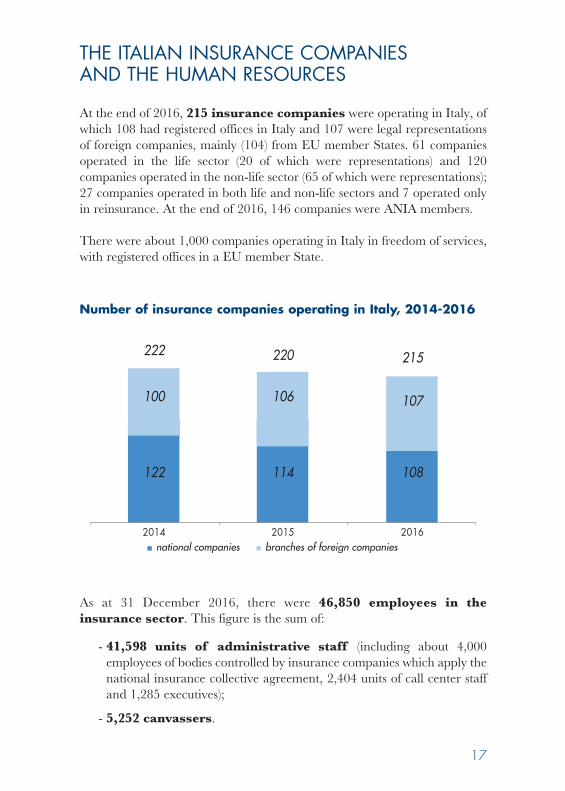
At the end of 2016, 215 insurance companies were operating in Italy, ofwhich 108 had registered offices in Italy and 107 were legal representationsof foreign companies, mainly (104) from EU member States. 61 companiesoperated in the life sector (20 of which were representations) and 120companies operated in the non-life sector (65 of which were representations);27 companies operated in both life and non-life sectors and 7 operated onlyin reinsurance. At the end of 2016, 146 companies were ANIA members.
There were about 1,000 companies operating in Italy in freedom of services,with registered offices in a EU member State.
As at 31 December 2016, there were 46,850 employees in theinsurance sector. This figure is the sum of:
- 41,598 units of administrative staff (including about 4,000employees of bodies controlled by insurance companies which apply thenational insurance collective agreement, 2,404 units of call center staffand 1,285 executives);
- 5,252 canvassers.
THE ITALIAN INSURANCE COMPANIESAND THE HUMAN RESOURCES
2014
222
100
122
2015
220
106
114
2016
215
107
108
national companies branches of foreign companies
Number of insurance companies operating in Italy, 2014-2016
Ass in cifre-2017 inglese_ANIA 07/12/17 12:32 Pagina 17

However, overall, the insurance sector employs approximately 300 thousandpeople, including the sales network and product distribution staff.
In particular, according to the data coming from the Single Register ofIntermediaries, as at 31 December 2016, 244,650 units were enrolled inthe following sections:
At the end of 2016 the number of Italian intermediaries enrolled was 236,597(244,688 at the end of 2015). The Single Register of Intermediaries alsoincludes a list concerning information on intermediaries – natural or legalpersons – having residence or registered office in other EU member States orbelonging to the European Economic Area allowed to take up insurance andreinsurance mediation activity in Italy in freedom of services or freedom ofestablishment. At the end of 2016, 8,053 EU intermediaries were enrolled inthis section of the Register (7.914 in 2015).
18
section legal nature 2014 2015 2016
Single Register of Intermediaries, 2014-2016
A (agents) Natural person 25,533 25,011 20,568Legal Person 9,515 9,405 9,263
B (broker) Natural person 4,015 4,136 4,017Legal Person 1,558 1,616 1,706
C (direct canvassers) Natural person 7,252 6,121 5,115
D (banks, financial intermediaries, stock brokerage companies and Poste Italiane Legal Person 642 611 563spa – Divisione servizi di bancoposta)
E (staff involved in mediation outside thepremises of the intermediary registered in section A, B or D, for which they
Natural person 183,488 185,582 182,896
conduct business, including their Legal Person 12,232 12,206 12,469
employees and/or collaborators
Attached list: (intermediaries havingresidence of registered office in another Subject 7,833 7,914 8,053EEA member state)
TOTAL 252,068 252,602 244,650
Source: Ivass
Ass in cifre-2017 inglese_ANIA 07/12/17 12:32 Pagina 18
19
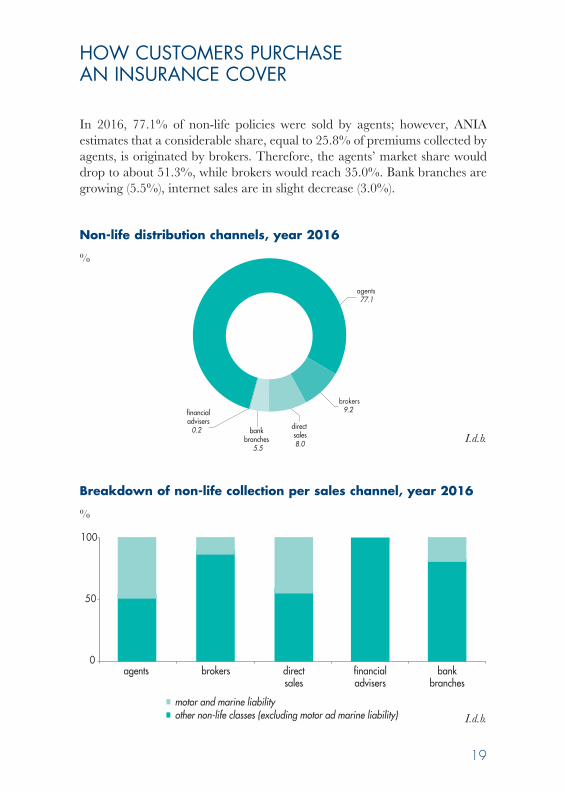
In 2016, 77.1% of non-life policies were sold by agents; however, ANIAestimates that a considerable share, equal to 25.8% of premiums collected byagents, is originated by brokers. Therefore, the agents’ market share woulddrop to about 51.3%, while brokers would reach 35.0%. Bank branches aregrowing (5.5%), internet sales are in slight decrease (3.0%).
HOW CUSTOMERS PURCHASE AN INSURANCE COVER
agents77.1
direct sales8.0
brokers9.2
bankbranches
5.5
financialadvisers
0.2
Non-life distribution channels, year 2016
%
0
50
100
directsales
financialadvisers
bankbranches
agents brokers
motor and marine liabilityother non-life classes (excluding motor ad marine liability)
Breakdown of non-life collection per sales channel, year 2016
%
I.d.b.
I.d.b.
Ass in cifre-2017 inglese_ANIA 07/12/17 12:32 Pagina 19
20
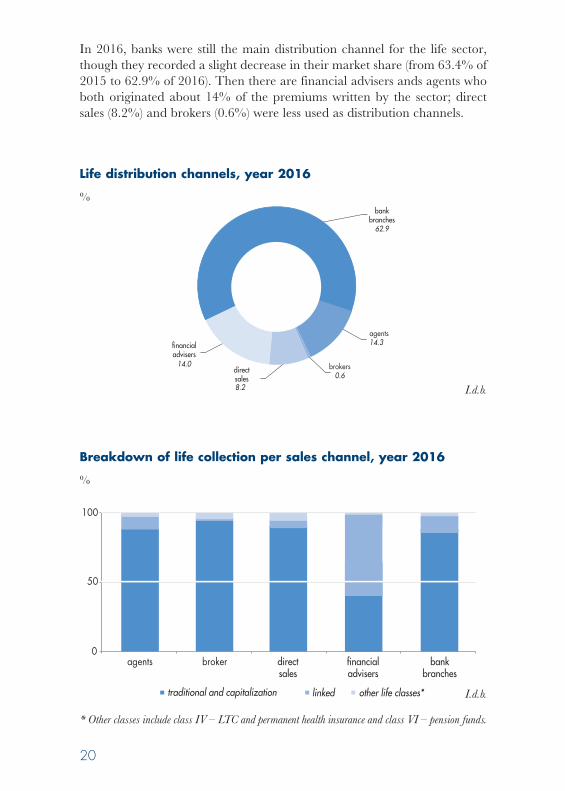
In 2016, banks were still the main distribution channel for the life sector,though they recorded a slight decrease in their market share (from 63.4% of2015 to 62.9% of 2016). Then there are financial advisers ands agents whoboth originated about 14% of the premiums written by the sector; directsales (8.2%) and brokers (0.6%) were less used as distribution channels.
bankbranches
62.9
brokers0.6
agents14.3
directsales8.2
financialadvisers
14.0
Life distribution channels, year 2016
%
agents broker directsales
financialadvisers
bankbranches
0
50
100
linkedtraditional and capitalization other life classes*
Breakdown of life collection per sales channel, year 2016
%
I.d.b.
I.d.b.
* Other classes include class IV – LTC and permanent health insurance and class VI – pension funds.
Ass in cifre-2017 inglese_ANIA 07/12/17 12:32 Pagina 20
ITALIAN INSURANCEIN FIGURES
Year 2017
ITALIAN INSURANCE IN FIGURESYear 2017
Via di San Nicola da Tolentino 7200187 RomaT +39 06 326 881
Attuariato, Statistiche e Analisi Banche [email protected] www.ania.it
00 COP AssCifre 2017 ingl_ANIA 01/12/17 11:38 Pagina 1