Embed Size (px)
Citation preview
8/12/2019 Italy Hydrogen Production Steam
http://slidepdf.com/reader/full/italy-hydrogen-production-steam 1/10
Simulation of an hydrogen production steam reforming
industrial plant for energetic performance prediction
A. Carrara, A. Perdichizzi, G. Barigozzi*
Dipartimento di Ingegneria Industriale, Universita degli Studi di Bergamo, Viale Marconi 5, 24044 Dalmine (BG), Italy
a r t i c l e i n f o
Article history:Received 7 October 2009
Received in revised form
23 December 2009
Accepted 24 December 2009
Available online 6 February 2010
Keywords:
Gas separation
Methane steam reforming
Hydrogen
a b s t r a c t
This paper presents the results of a theoretical investigation whose aim was the devel-opment of a simulation tool for performance prediction of a steam reforming hydrogen
production plant, and particularly of its overall energetic efficiency. A 1500 Nm3 /h
hydrogen production plant was simulated. Field data coming from an industrial plant were
used for model validation in both design and off design operating conditions. To evaluate
the plant performances in terms of energetic efficiency, a particular attention was paid to
the simulation of all plant auxiliaries consumptions. Nevertheless the large uncertainty in
most of the field data values, the model was able to capture all the relevant phenomena
taking place in all the plant components, from reformer reactor up to CO2 sequestration
unit, in the investigated plant capacity range (40–100%).
ª 2009 Professor T. Nejat Veziroglu. Published by Elsevier Ltd. All rights reserved.
1. Introduction
Alternative energy sources and power generation technolo-
gies are required to face the declining of fossil fuel stocks as
well as the effects of carbon dioxide (CO2) emission on global
warming. From these points of view, hydrogen (H2) is a very
promising clean fuel,as no CO2 is produced by its combustion,
available as fuel for distributed power systems [1], for example
fuel cell systems [2]. Hydrogen is also an important raw
material for the chemical and refining industries, e.g. for the
production of ammonia and methanol.
In the last years an increasing interest from the energysector on hydrogen production techniques has been
observed. Today most of hydrogen is produced from fossil
fuel sources [3]. Clean production of hydrogen, for example
by water electrolysis using renewable energy, seems not
to be yet competitive with present-day renewable energy
technologies.
Hydrogen production from fossil fuel has as a conse-
quence CO2 generation. Application of CO2 separation and
sequestration systems to hydrogen production process has
often as a consequence a considerable reduction of process
energetic efficiency. For the near and medium term, the use
of hydrogen as energy vector and fuel in distributed power
plant systems needs to increase the energetic efficiency of
hydrogen production system from fossil fuels.
About 50% of hydrogen production in the world today is
based on methane steam reforming [4]. The methane steam
reforming process is based on two main reactions: the
reforming reaction
CH4 þH2O ¼ CO2 þ 3H2 DH298 ¼ 206 kJ=mol (1)and the water gas shift reaction (WGS):
CO þH2O ¼ CO2 þH2 DH298 ¼ 41 kJ=mol (2)
In the last years many research activities have shown the
potentiality of membrane technology [5]. Removing one or
more of the products with a membrane would cause a shift in
the reaction thermodynamic equilibrium, increasing the yield
of CH4 and CO conversion [6].
* Corresponding author. þ39 035 2052317; fax: þ39 035 2052077.E-mail address: [email protected] (G. Barigozzi).
A v a i l a b l e a t w w w . s c i e n c e d i r e c t . c o m
j o u r n a l h o m e p a g e : w w w . e l s e v i e r . c o m/ l o c a t e / h e
i n t e r n a t i o n a l j o u r n a l o f h y d r o g e n e n e r g y 3 5 ( 2 0 1 0 ) 3 4 9 9 – 3 5 0 8
0360-3199/$ – see front matter ª 2009 Professor T. Nejat Veziroglu. Published by Elsevier Ltd. All rights reserved.
doi:10.1016/j.ijhydene.2009.12.156
8/12/2019 Italy Hydrogen Production Steam
http://slidepdf.com/reader/full/italy-hydrogen-production-steam 2/10

8/12/2019 Italy Hydrogen Production Steam
http://slidepdf.com/reader/full/italy-hydrogen-production-steam 3/10
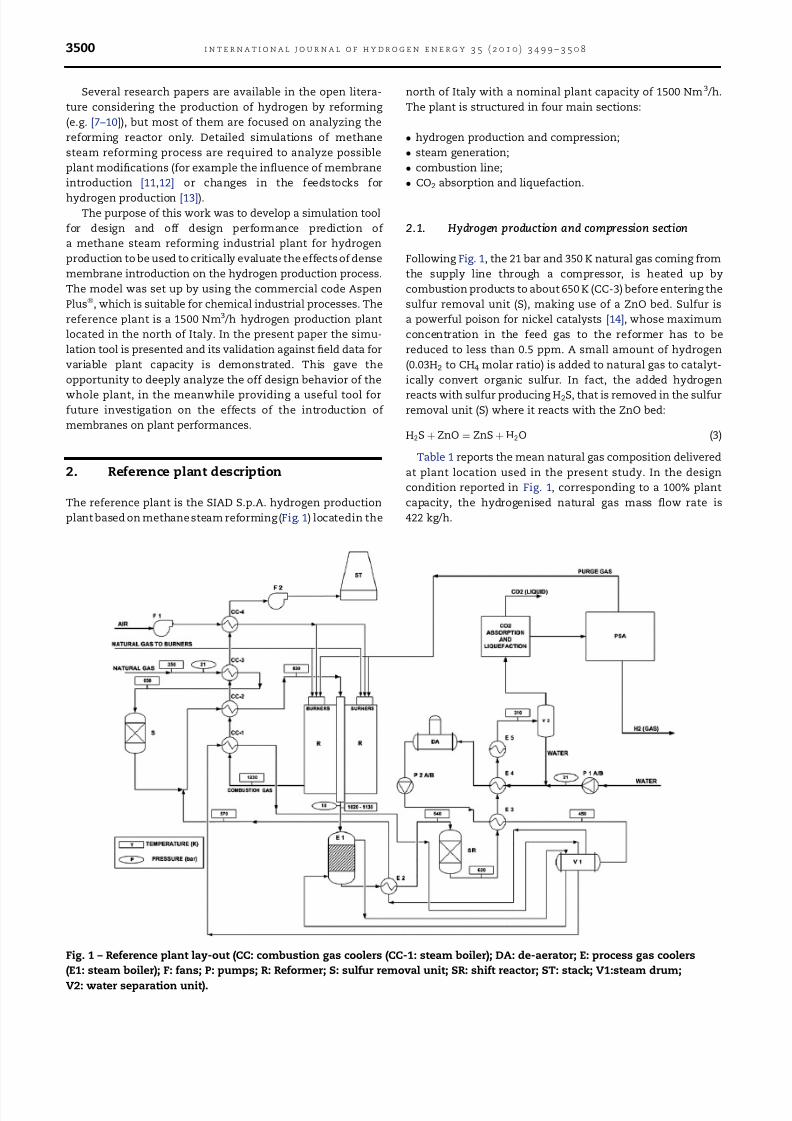
After sulfur removal, methane is mixed with superheated
steam with a design water to natural gas mass flow ratio
r ¼ 3.296 kg w /kg CH4, and then heated up by combustion
products to about 830 K (CC-2). The hot flow finally enters the
reformer unit (R), consisting in a radiant and a convectivesection. The radiant section includes eight reaction tubes,
with a Ni/CaO/Al2O3 catalyst, and two burners, making use of
methane and purge gas as fuel. The process gas leaves the
reformer at about 20 bar and at a temperature in the 1020–
1130 K range. Its design composition is reported in Table 2.
Before going to the shift reactor (SR), the process gas is cooled
to about 540 K, providing heat to the boiler (E1) for steam
generation and for superheated steam production (E2). The
mean temperature (570–670 K) adiabatic shift reactor makes
use of a Cu based catalyst, with a ZnO and Al2O3 support to
avoid sintering. The syngas then leaves the shift reactor at
about 18 bar and 620 K.
Syngas, H2 rich and CO poor, is then cooled down to about310 K for water condensation (V2) in three heat exchangers
(E3, E4, E5). The first two use the water process as cooling flow,
thus acting like an economizer providing pre-heated water to
the boiler. The third instead makes use of well water.
The dry syngas finally goes through the absorber unit for
CO2 sequestration. The remaining syngas stream, CO2 poor,
whose composition is reported in Table 2, enters the Pressure
Swing Adsorption (PSA) unit, for hydrogen separation. In the
PSA unit, thanks to the presence of molecular sieves and
a cyclic process, 82% of hydrogen is separated form syngas.
The remaining purge gas (Table 2) is used as fuel for the
burners in the reformer radiant section, while the hydrogen
flow is compressed from 16 bar to 200 bar.
2.2. Steam generation section
Condensed syngas water mixed with feed water is pressurized
to about 21 bar (P1 A/B), heated up (E4), de-aerated (DA) and
then pumped (P2 A/B) and heated up again (E3) by the process
gas before entering the LP drum (V1). From LP drum the feed
water goes through the boiler for steam generation at 26 bar.
Two boilers exist: the first one (E1) makes use of the processgas exiting the reformer reactor, while the second one (CC-1)
is located inside of the reformer convective section, recov-
ering heat from the combustion gas coming from the radiant
section. Steam is then superheated (E2) to about 570 K to be
finally mixed with the compressed natural gas and directed to
the reformer reactor.
2.3. Combustion line
The purge gas is burned with air in the reformer radiant
section, to generate the heat necessary for the reforming
process. Unfortunately, the purge gas mass flow rate is not
large enough to reach the right temperature in the reformerreactor, so natural gas is added. Purge gas combustion
supplies up to 80% of process heat, while natural gas allows
for bridgewall temperature control, that is the combustion gas
temperature at the exit of the reformer radiant section. In
design condition, the combustion products leave the reformer
radiant section at about 1230 K. The gas then enters the
convective section, where a boiler (CC-1) and three heat
exchangers (CC-2, CC-3, CC-4) exist: one for natural gas
heating before sulfur removal, one to heat the natural gas–
steam mixture before entering the reaction tubes and the
latter, located at the end of the convective section, to pre-heat
the combustion air. Combustion gases are finally released in
the atmosphere. The presence of two fans assures thecombustion products circulation through the reformer and
the heat exchangers.
2.4. CO2 absorption and liquefaction
After water separation, the syngas enters the absorption
tower (Fig. 2); the two stage absorption process is based on the
use of a mix of water and methyl-diethanolamine (MDEA).
While the syngas, CO2 poor, goes through the PSA unit for H2
separation, CO2, water and MDEA flow is regenerated in a sub-
atmospheric stripper tower. The pure CO2 flow then goes
through a two stages intercooled compressor before lique-
faction in a refrigerating thermodynamic cycle.
3. The model
The plant model was initially set up at design condition (100%
plant capacity) using the commercial code Aspen Plus
(version 2004.1). Aspen Plus software is a chemical engi-
neering process modeling tool suitable for steady state
simulation, design and performance monitoring. Aspen Plus
simulation software was used for the mass and energy
balance calculations. Plant model is structured, like the real
plant, in four sections: hydrogen production and compression,
water section, gas combustion line, and CO2 sequestration
Table 2 – Design gas compositions-plant capacity 100%.
Molar concentration %
Reformer exit PSA inlet PSA exit (purge gas)
CH4 3.10 4.91 18.64
H2 49.27 89.82 61.37
CO 8.98 2.534 9.63
CO2 5.60 2.06 7.81
H2O 32.84 0.34 1.30
N2 0.208 0.327 1.24
He 0.002 0.003 0.01
Table 1 – Design methane composition.
Element Molar concentration %
CH4 96.34
C2H6 1.79
C3H8 0.41
n-C4H10 0.08
i-C4H10 0.06n-C5H12 0.01
i-C5H12 0.01
C6H14 0.01
CO2 0.09
N2 1.19
He 0.01
S (mg/Nm3) 5
i n t e r n a t i o n a l j o u r n a l o f h y d r o g e n e n e r g y 3 5 ( 2 0 1 0 ) 3 4 9 9 – 3 5 0 8 3501
8/12/2019 Italy Hydrogen Production Steam
http://slidepdf.com/reader/full/italy-hydrogen-production-steam 4/10
8/12/2019 Italy Hydrogen Production Steam
http://slidepdf.com/reader/full/italy-hydrogen-production-steam 5/10
the reformer reactor exit section. The design specification for
the CH4 molar concentration has been again obtained from
measured data (4.0%).
In the shift reactor of course the only possible reaction is
the shift reaction (2). A major difference with respect to the
reformer is that the shift reactor has a fixed working pressure
of 18.3 bar and it is an adiabatic reactor. The chemical equi-
librium is anyways calculated defining the pressure value and
the already mentioned possible products, with CH4 defined as
an inert. Table 4 summarizes the main input data for both
reformer and shift reactor simulations.
All process gas coolers are simulated using classical heatexchangers, imposing the gas outlet temperature in the
design condition and computing the recovered heat. Pres-
sure losses are evenly distributed between the heat
exchangers in such a way to obtain the design PSA operating
pressure (17 bar). The PSA process is finally simply simulated
using a splitter, fixing the percentage of hydrogen separated
from the dry syngas at about 79%. This value is slightly
different from the design specification and was derived from
field data; moreover it was practically unaffected by changes
in plant capacity. The hydrogen is then pressurized using a 3
stage intercooled compressor, from which it is delivered at
200 bar and 297 K. A 50% overall compressor efficiency
was used. Table 5 summarizes the main input parametersfor the design of heat exchangers, PSA and hydrogen
compressor unit.
3.2. Steam generation section
The required water mass flow rate depends on the water to
natural gas mass flow ratio r, the fixed plant capacity and
the natural gas mass flow rate entering the reformer
reactor. Once the need of water for the reforming process is
known, the system calculates the feed water mass flow,
which depends on the condensed water and on the de-
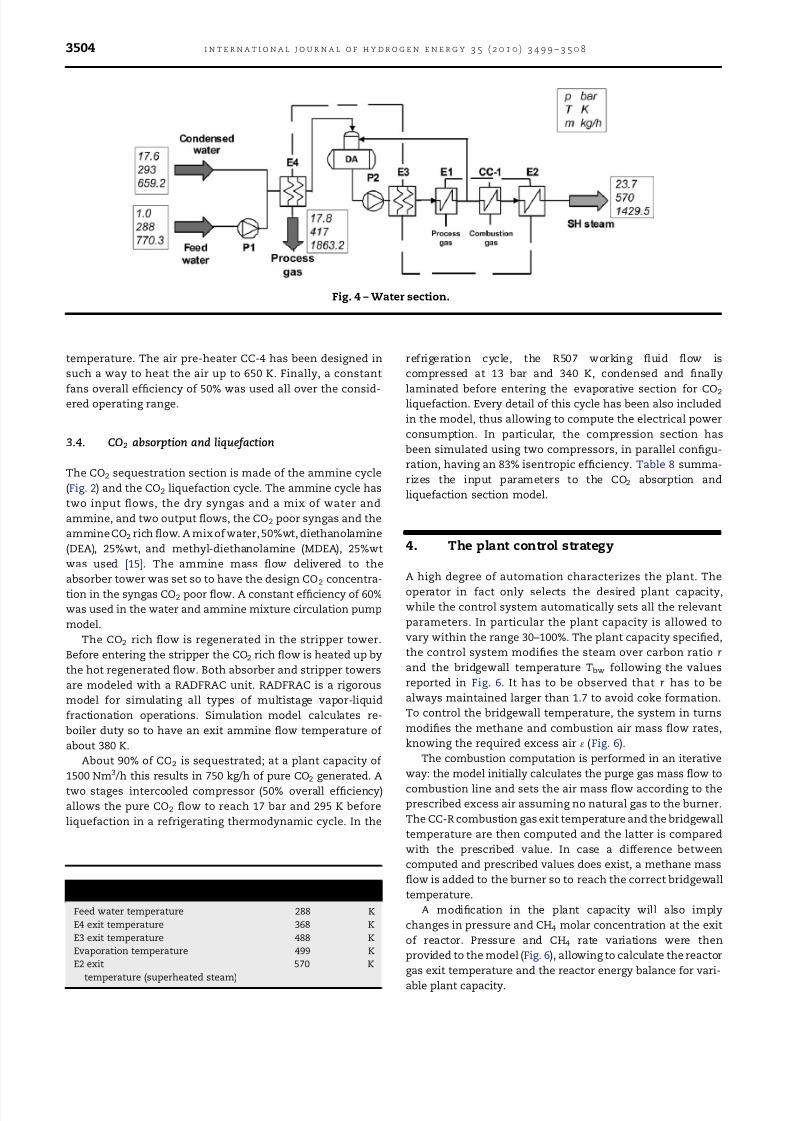
aerator requirements. Fig. 4 shows all the components thewater/steam flow encounters before mixing with the
methane.
It has to be observed that, in the real plant, two boilers
operating in a parallel configuration do exist. In the present
analysis the evaporative section was instead modeled using
a serial configuration. In this way, not a complete evaporation
takes place in the two boilers. In fact, the heat recovered from
E1 heat exchanger, already computed in the previous section,
is used to produce wet steam, that becomes saturated only at
the exit of CC-1 heat exchanger.
Finally, to correctly estimate the feed water pumps power
consumption, manufacturer supplied performance curves
were included into the model. All input parameters aresummarized in Table 6.
3.3. Combustion line
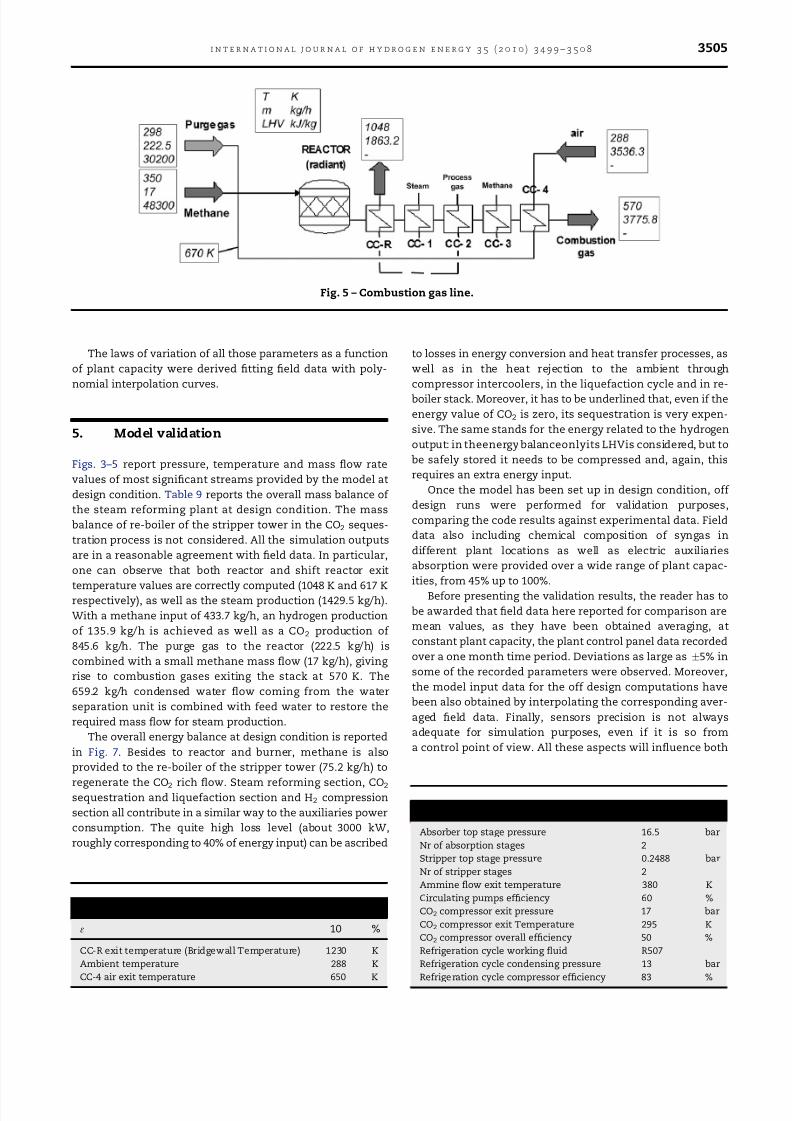
Fig. 5 shows the combustion products line while model input
parameters are summarized in Table 7. Three input flows do
exist (purge gas, natural gas and air) and one output flow (the
combustion gas discharged into the ambient at the stack).
The required natural gas mass flow is computed knowing the
purge gas energy input and the reformer reactor energy
requirement. The necessary air mass flow is then computed
specifying the excess air 3 in the model input data. A 10%
excess air applied to the 100% plant capacity designcondition.
The reformer radiant section is simulated using 2 units:
an RSTOIC reactor, for combustion simulation, and a heat
exchanger (CC-R) to simulate the heat exchange between
combustion gas and reformer reactor. An RSTOIC unit is
suitable to simulate a reactor when reaction kinetics are
unknown or unimportant and when stoichiometry and the
molar extent or conversion is known for each reaction. The
reformer reactor (R) already introduced in the hydrogen
production and compression section thus calculates the
heat necessary for the reforming process while CC-R
removes this heat from combustion gas, knowing the
combustion gas exit temperature, i.e. the bridgewall
Table 3 – Reactions taking place in the Reforming reactor.
CH4 þ H2O4 CO þ 3H2 NC5H12 þ 5H2O4 5CO þ 11H2
C2H6 þ 2H2O4 2CO þ 5H2 IC5H12 þ 5H2O4 5CO þ 11H2
C3H8 þ 3H2O4 3CO þ 7H2 C6H14 þ 6H2O4 6CO þ 13H2
NC4H10 þ 4H2O4 4CO þ 9H2 CO þ H2O4 CO2 þ H2
IC4H10 þ 4H2O4 4CO þ 9H2
Table 4 – Input data and main assumption for reformerand shift reactor.
Reformer Shift Reactor
Inputs p ¼ 19.7 bar p ¼ 18.3 bar
Assumptions – Adiabatic
Specifications Restrict chemical equilibrium.
Specify temperature approach or reaction.
Possible products CH4, H2, CO, CO2, H2O, N2, He, Ar
Property method SRK IDEAL
Inert – %CH4 ¼ 1
Restricted
equilibrium
See Table 3 Individual reaction:
CO þ
H2O¼
CO2þ
H2
Table 5 – Design data for heat exchangers, PSA and H2
compressor.
Natural gas supply temperature 350 K
Natural gas supply pressure 21 bar
CC-2 exit Temperature 830 K
CC-3 exit Temperature 650 K
E2 exit Temperature 540 KE5 exit Temperature 310 K
PSA pressure 17 bar
PSA %H2 separation 79 %
H2 compressor exit pressure 200 bar
H2 compressor efficiency 50 %
1 Intercooler
exit temperature
306 K
2 Intercooler
exit temperature
307 K
3 Intercooler
exit temperature
297 K
i n t e r n a t i o n a l j o u r n a l o f h y d r o g e n e n e r g y 3 5 ( 2 0 1 0 ) 3 4 9 9 – 3 5 0 8 3503
8/12/2019 Italy Hydrogen Production Steam
http://slidepdf.com/reader/full/italy-hydrogen-production-steam 6/10
temperature. The air pre-heater CC-4 has been designed in
such a way to heat the air up to 650 K. Finally, a constant
fans overall efficiency of 50% was used all over the consid-ered operating range.
3.4. CO2 absorption and liquefaction
The CO2 sequestration section is made of the ammine cycle
(Fig. 2) and the CO2 liquefaction cycle. The ammine cycle has
two input flows, the dry syngas and a mix of water and
ammine, and two output flows, the CO2 poor syngas and the
ammine CO2 rich flow. A mix of water, 50%wt, diethanolamine
(DEA), 25%wt, and methyl-diethanolamine (MDEA), 25%wt
was used [15]. The ammine mass flow delivered to the
absorber tower was set so to have the design CO2 concentra-
tion in the syngas CO2 poor flow. A constant efficiency of 60%
was used in the water and ammine mixture circulation pump
model.
The CO2 rich flow is regenerated in the stripper tower.
Before entering the stripper the CO2 rich flow is heated up by
the hot regenerated flow. Both absorber and stripper towers
are modeled with a RADFRAC unit. RADFRAC is a rigorous
model for simulating all types of multistage vapor-liquid
fractionation operations. Simulation model calculates re-
boiler duty so to have an exit ammine flow temperature of
about 380 K.
About 90% of CO2 is sequestrated; at a plant capacity of
1500 Nm3 /h this results in 750 kg/h of pure CO2 generated. A
two stages intercooled compressor (50% overall efficiency)
allows the pure CO2 flow to reach 17 bar and 295 K before
liquefaction in a refrigerating thermodynamic cycle. In the
refrigeration cycle, the R507 working fluid flow is
compressed at 13 bar and 340 K, condensed and finally
laminated before entering the evaporative section for CO2
liquefaction. Every detail of this cycle has been also included
in the model, thus allowing to compute the electrical power
consumption. In particular, the compression section has
been simulated using two compressors, in parallel configu-
ration, having an 83% isentropic efficiency. Table 8 summa-
rizes the input parameters to the CO2 absorption and
liquefaction section model.
4. The plant control strategy
A high degree of automation characterizes the plant. The
operator in fact only selects the desired plant capacity,while the control system automatically sets all the relevant
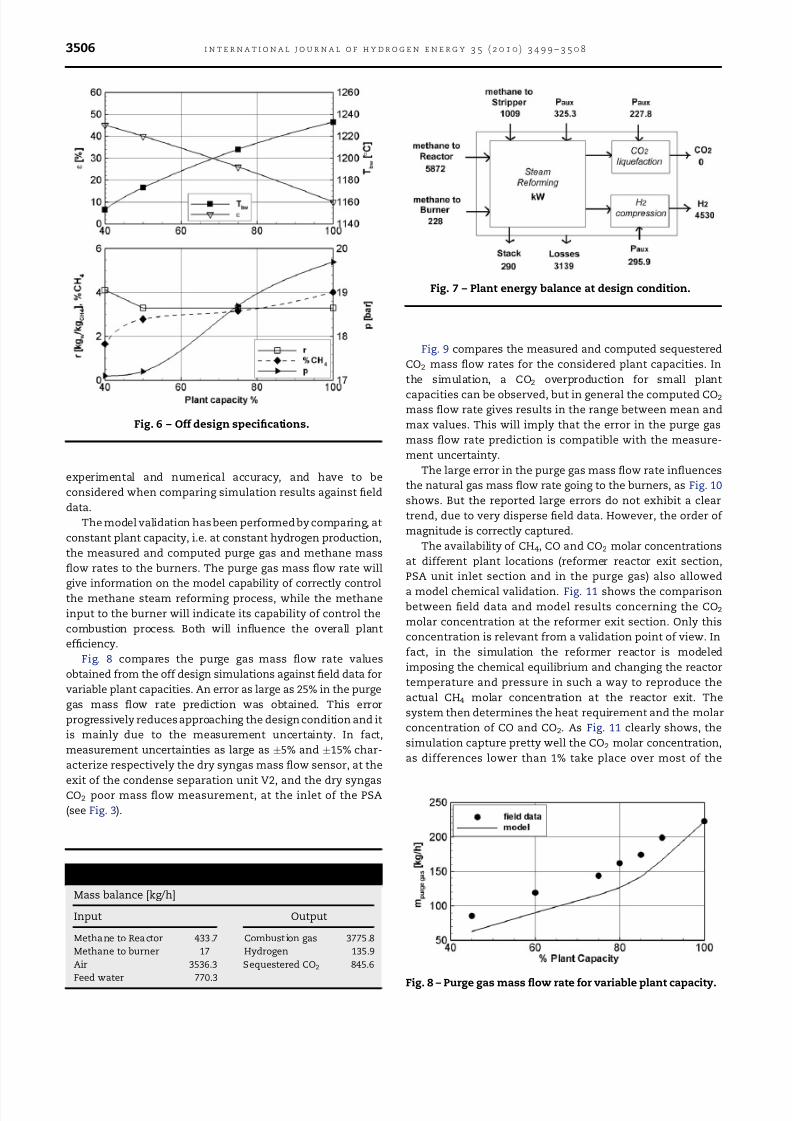
parameters. In particular the plant capacity is allowed to
vary within the range 30–100%. The plant capacity specified,
the control system modifies the steam over carbon ratio r
and the bridgewall temperature Tbw following the values
reported in Fig. 6. It has to be observed that r has to be
always maintained larger than 1.7 to avoid coke formation.
To control the bridgewall temperature, the system in turns
modifies the methane and combustion air mass flow rates,
knowing the required excess air 3 (Fig. 6).
The combustion computation is performed in an iterative
way: the model initially calculates the purge gas mass flow to
combustion line and sets the air mass flow according to theprescribed excess air assuming no natural gas to the burner.
The CC-R combustion gas exit temperature and the bridgewall
temperature are then computed and the latter is compared
with the prescribed value. In case a difference between
computed and prescribed values does exist, a methane mass
flow is added to the burner so to reach the correct bridgewall
temperature.
A modification in the plant capacity will also imply
changes in pressure and CH4 molar concentration at the exit
of reactor. Pressure and CH4 rate variations were then
provided to the model (Fig. 6), allowing to calculate the reactor
gas exit temperature and the reactor energy balance for vari-
able plant capacity.
Fig. 4 – Water section.
Table 6 – Water section input data.
Feed water temperature 288 K
E4 exit temperature 368 K
E3 exit temperature 488 K
Evaporation temperature 499 K
E2 exit
temperature (superheated steam)
570 K
i n t e r n a t i o n a l j o u r n a l o f h y d r o g e n e n e r g y 3 5 ( 2 0 1 0 ) 3 4 9 9 – 3 5 0 83504
8/12/2019 Italy Hydrogen Production Steam
http://slidepdf.com/reader/full/italy-hydrogen-production-steam 7/10
The laws of variation of all those parameters as a function
of plant capacity were derived fitting field data with poly-
nomial interpolation curves.
5. Model validation
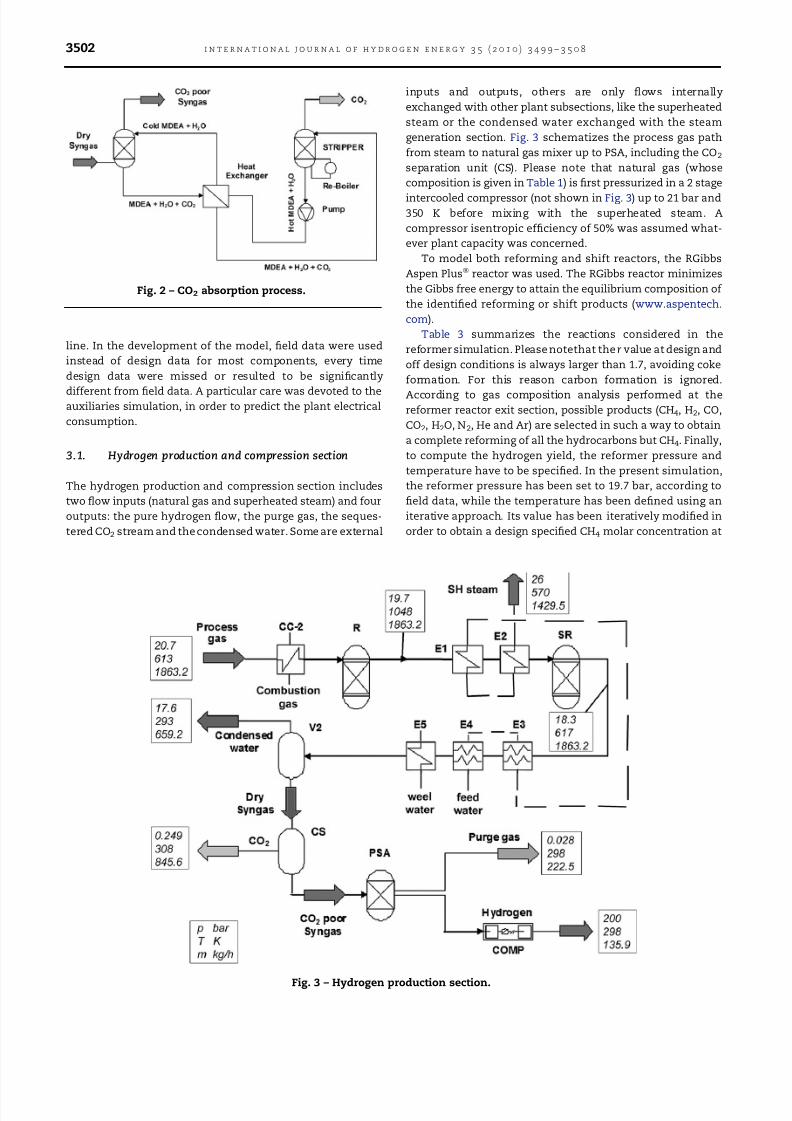
Figs. 3–5 report pressure, temperature and mass flow rate
values of most significant streams provided by the model at
design condition. Table 9 reports the overall mass balance of
the steam reforming plant at design condition. The mass
balance of re-boiler of the stripper tower in the CO2 seques-
tration process is not considered. All the simulation outputs
are in a reasonable agreement with field data. In particular,
one can observe that both reactor and shift reactor exit
temperature values are correctly computed (1048 K and 617 Krespectively), as well as the steam production (1429.5 kg/h).
With a methane input of 433.7 kg/h, an hydrogen production
of 135.9 kg/h is achieved as well as a CO2 production of
845.6 kg/h. The purge gas to the reactor (222.5 kg/h) is
combined with a small methane mass flow (17 kg/h), giving
rise to combustion gases exiting the stack at 570 K. The
659.2 kg/h condensed water flow coming from the water
separation unit is combined with feed water to restore the
required mass flow for steam production.
The overall energy balance at design condition is reported
in Fig. 7. Besides to reactor and burner, methane is also
provided to the re-boiler of the stripper tower (75.2 kg/h) to
regenerate the CO2 rich flow. Steam reforming section, CO2
sequestration and liquefaction section and H2 compression
section all contribute in a similar way to the auxiliaries power
consumption. The quite high loss level (about 3000 kW,
roughly corresponding to 40% of energy input) can be ascribed
to losses in energy conversion and heat transfer processes, as
well as in the heat rejection to the ambient through
compressor intercoolers, in the liquefaction cycle and in re-
boiler stack. Moreover, it has to be underlined that, even if the
energy value of CO2 is zero, its sequestration is very expen-
sive. The same stands for the energy related to the hydrogen
output: in theenergy balanceonlyits LHVis considered, but to
be safely stored it needs to be compressed and, again, this
requires an extra energy input.
Once the model has been set up in design condition, off
design runs were performed for validation purposes,
comparing the code results against experimental data. Field
data also including chemical composition of syngas in
different plant locations as well as electric auxiliaries
absorption were provided over a wide range of plant capac-
ities, from 45% up to 100%.
Before presenting the validation results, the reader has to
be awarded that field data here reported for comparison are
mean values, as they have been obtained averaging, at
constant plant capacity, the plant control panel data recorded
over a one month time period. Deviations as large as 5% in
some of the recorded parameters were observed. Moreover,
the model input data for the off design computations have
been also obtained by interpolating the corresponding aver-
aged field data. Finally, sensors precision is not always
adequate for simulation purposes, even if it is so from
a control point of view. All these aspects will influence both
Fig. 5 – Combustion gas line.
Table 7 – Combustion line input data.
3 10 %
CC-R exit temperature (Bridgewall Temperature) 1230 K
Ambient temperature 288 K
CC-4 air exit temperature 650 K
Table 8 – CO2 sequestration and liquefaction input data.
Absorber top stage pressure 16.5 bar
Nr of absorption stages 2
Stripper top stage pressure 0.2488 bar
Nr of stripper stages 2
Ammine flow exit temperature 380 K
Circulating pumps efficiency 60 %
CO2 compressor exit pressure 17 bar
CO2 compressor exit Temperature 295 K
CO2 compressor overall efficiency 50 %
Refrigeration cycle working fluid R507
Refrigeration cycle condensing pressure 13 bar
Refrigeration cycle compressor efficiency 83 %
i n t e r n a t i o n a l j o u r n a l o f h y d r o g e n e n e r g y 3 5 ( 2 0 1 0 ) 3 4 9 9 – 3 5 0 8 3505
8/12/2019 Italy Hydrogen Production Steam
http://slidepdf.com/reader/full/italy-hydrogen-production-steam 8/10
8/12/2019 Italy Hydrogen Production Steam
http://slidepdf.com/reader/full/italy-hydrogen-production-steam 9/10
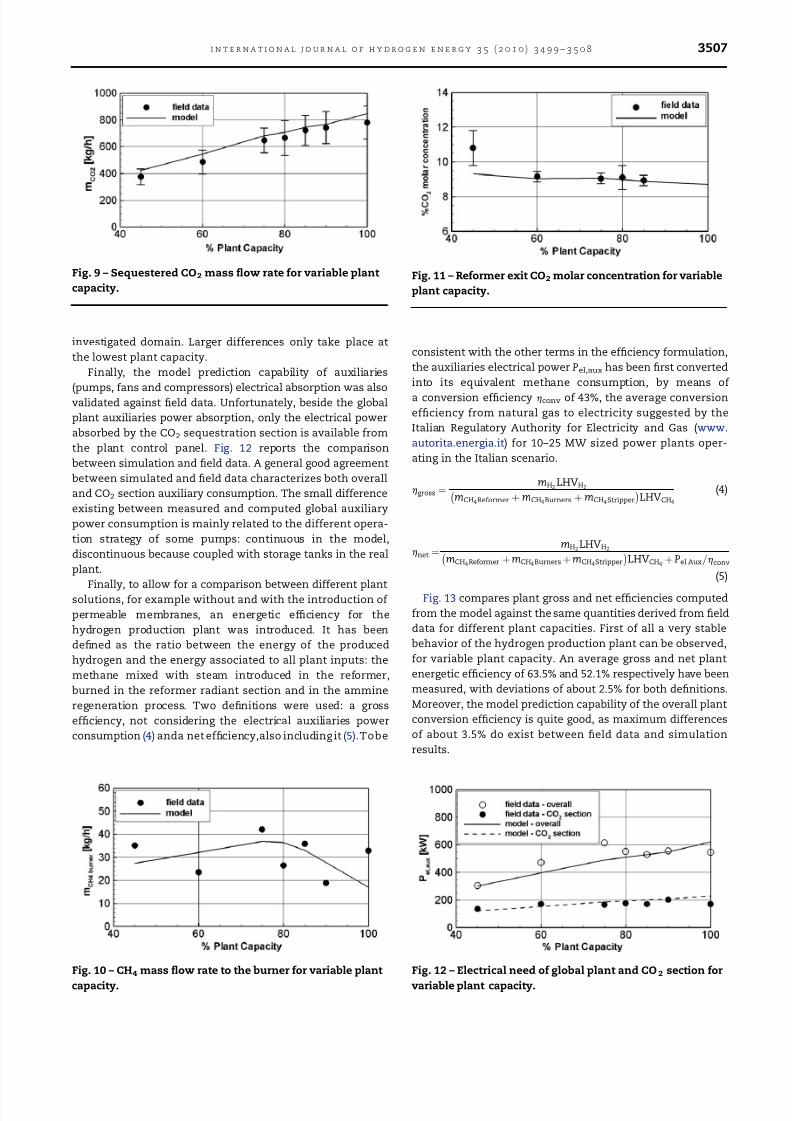
investigated domain. Larger differences only take place at
the lowest plant capacity.
Finally, the model prediction capability of auxiliaries
(pumps, fans and compressors) electrical absorption was alsovalidated against field data. Unfortunately, beside the global
plant auxiliaries power absorption, only the electrical power
absorbed by the CO2 sequestration section is available from
the plant control panel. Fig. 12 reports the comparison
between simulation and field data. A general good agreement
between simulated and field data characterizes both overall
and CO2 section auxiliary consumption. The small difference
existing between measured and computed global auxiliary
power consumption is mainly related to the different opera-
tion strategy of some pumps: continuous in the model,
discontinuous because coupled with storage tanks in the real
plant.
Finally, to allow for a comparison between different plantsolutions, for example without and with the introduction of
permeable membranes, an energetic efficiency for the
hydrogen production plant was introduced. It has been
defined as the ratio between the energy of the produced
hydrogen and the energy associated to all plant inputs: the
methane mixed with steam introduced in the reformer,
burned in the reformer radiant section and in the ammine
regeneration process. Two definitions were used: a gross
efficiency, not considering the electrical auxiliaries power
consumption (4) anda net efficiency,also including it (5).Tobe
consistent with the other terms in the efficiency formulation,
the auxiliaries electrical power Pel,aux has been first converted
into its equivalent methane consumption, by means of
a conversion efficiency hconv of 43%, the average conversion
efficiency from natural gas to electricity suggested by the
Italian Regulatory Authority for Electricity and Gas (www.
autorita.energia.it) for 10–25 MW sized power plants oper-
ating in the Italian scenario.
hgross ¼mH2
LHVH2mCH4Reformer þmCH4 Burners þmCH4 Stripper
LHVCH4
(4)
hnet ¼mH2
LHVH2mCH4 Reformer þmCH4 BurnersþmCH4Stripper
LHVCH4 þPel;Aux=hconv
(5)
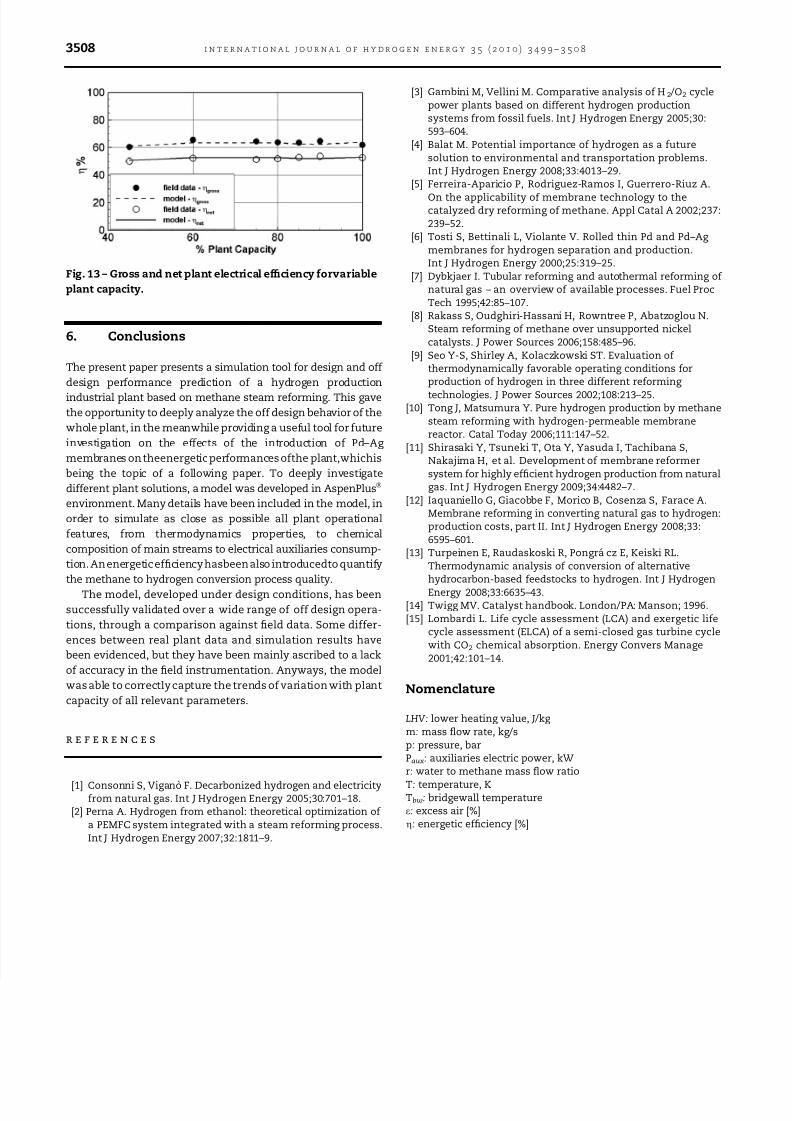
Fig. 13 compares plant gross and net efficiencies computed
from the model against the same quantities derived from field
data for different plant capacities. First of all a very stable
behavior of the hydrogen production plant can be observed,
for variable plant capacity. An average gross and net plant
energetic efficiency of 63.5% and 52.1% respectively have been
measured, with deviations of about 2.5% for both definitions.
Moreover, the model prediction capability of the overall plant
conversion efficiency is quite good, as maximum differences
of about 3.5% do exist between field data and simulation
results.
Fig. 10 – CH4 mass flow rate to the burner for variable plant
capacity.
Fig. 11 – Reformer exit CO2 molar concentration for variable
plant capacity.
Fig. 9 – Sequestered CO2 mass flow rate for variable plant
capacity.
Fig. 12 – Electrical need of global plant and CO2 section for
variable plant capacity.
i n t e r n a t i o n a l j o u r n a l o f h y d r o g e n e n e r g y 3 5 ( 2 0 1 0 ) 3 4 9 9 – 3 5 0 8 3507
8/12/2019 Italy Hydrogen Production Steam
http://slidepdf.com/reader/full/italy-hydrogen-production-steam 10/10
6. Conclusions
The present paper presents a simulation tool for design and off
design performance prediction of a hydrogen production
industrial plant based on methane steam reforming. This gavethe opportunity to deeply analyze the off design behavior of the
whole plant, in the meanwhile providing a useful tool for future
investigation on the effects of the introduction of Pd–Ag
membranes on theenergeticperformances ofthe plant,whichis
being the topic of a following paper. To deeply investigate
different plant solutions, a model was developed in AspenPlus
environment. Many details have been included in the model, in
order to simulate as close as possible all plant operational
features, from thermodynamics properties, to chemical
composition of main streams to electrical auxiliaries consump-
tion. An energeticefficiency hasbeen also introducedto quantify
the methane to hydrogen conversion process quality.
The model, developed under design conditions, has been
successfully validated over a wide range of off design opera-
tions, through a comparison against field data. Some differ-
ences between real plant data and simulation results have
been evidenced, but they have been mainly ascribed to a lack
of accuracy in the field instrumentation. Anyways, the model
was able to correctly capture the trends of variation with plant
capacity of all relevant parameters.
r e f e r e n c e s
[1] Consonni S, Vigano F. Decarbonized hydrogen and electricityfrom natural gas. Int J Hydrogen Energy 2005;30:701–18.
[2] Perna A. Hydrogen from ethanol: theoretical optimization of a PEMFC system integrated with a steam reforming process.Int J Hydrogen Energy 2007;32:1811–9.
[3] Gambini M, Vellini M. Comparative analysis of H2 /O2 cyclepower plants based on different hydrogen productionsystems from fossil fuels. Int J Hydrogen Energy 2005;30:593–604.
[4] Balat M. Potential importance of hydrogen as a futuresolution to environmental and transportation problems.Int J Hydrogen Energy 2008;33:4013–29.
[5] Ferreira-Aparicio P, Rodriguez-Ramos I, Guerrero-Riuz A.
On the applicability of membrane technology to thecatalyzed dry reforming of methane. Appl Catal A 2002;237:239–52.
[6] Tosti S, Bettinali L, Violante V. Rolled thin Pd and Pd–Ag membranes for hydrogen separation and production.Int J Hydrogen Energy 2000;25:319–25.
[7] Dybkjaer I. Tubular reforming and autothermal reforming of natural gas – an overview of available processes. Fuel ProcTech 1995;42:85–107.
[8] Rakass S, Oudghiri-Hassani H, Rowntree P, Abatzoglou N.Steam reforming of methane over unsupported nickelcatalysts. J Power Sources 2006;158:485–96.
[9] Seo Y-S, Shirley A, Kolaczkowski ST. Evaluation of thermodynamically favorable operating conditions forproduction of hydrogen in three different reforming
technologies. J Power Sources 2002;108:213–25.[10] Tong J, Matsumura Y. Pure hydrogen production by methane
steam reforming with hydrogen-permeable membranereactor. Catal Today 2006;111:147–52.
[11] Shirasaki Y, Tsuneki T, Ota Y, Yasuda I, Tachibana S,Nakajima H, et al. Development of membrane reformersystem for highly efficient hydrogen production from naturalgas. Int J Hydrogen Energy 2009;34:4482–7.
[12] Iaquaniello G, Giacobbe F, Morico B, Cosenza S, Farace A.Membrane reforming in converting natural gas to hydrogen:production costs, part II. Int J Hydrogen Energy 2008;33:6595–601.
[13] Turpeinen E, Raudaskoski R, Pongra cz E, Keiski RL.Thermodynamic analysis of conversion of alternativehydrocarbon-based feedstocks to hydrogen. Int J Hydrogen
Energy 2008;33:6635–43.[14] Twigg MV. Catalyst handbook. London/PA: Manson; 1996.[15] Lombardi L. Life cycle assessment (LCA) and exergetic life
cycle assessment (ELCA) of a semi-closed gas turbine cyclewith CO2 chemical absorption. Energy Convers Manage2001;42:101–14.
Nomenclature
LHV: lower heating value, J/kg m: mass flow rate, kg/sp: pressure, barPaux: auxiliaries electric power, kWr: water to methane mass flow ratio
T: temperature, KTbw: bridgewall temperature3: excess air [%]h: energetic efficiency [%]
Fig. 13 – Gross and net plant electrical efficiency forvariable
plant capacity.
i n t e r n a t i o n a l j o u r n a l o f h y d r o g e n e n e r g y 3 5 ( 2 0 1 0 ) 3 4 9 9 – 3 5 0 83508