Embed Size (px)
Citation preview
1
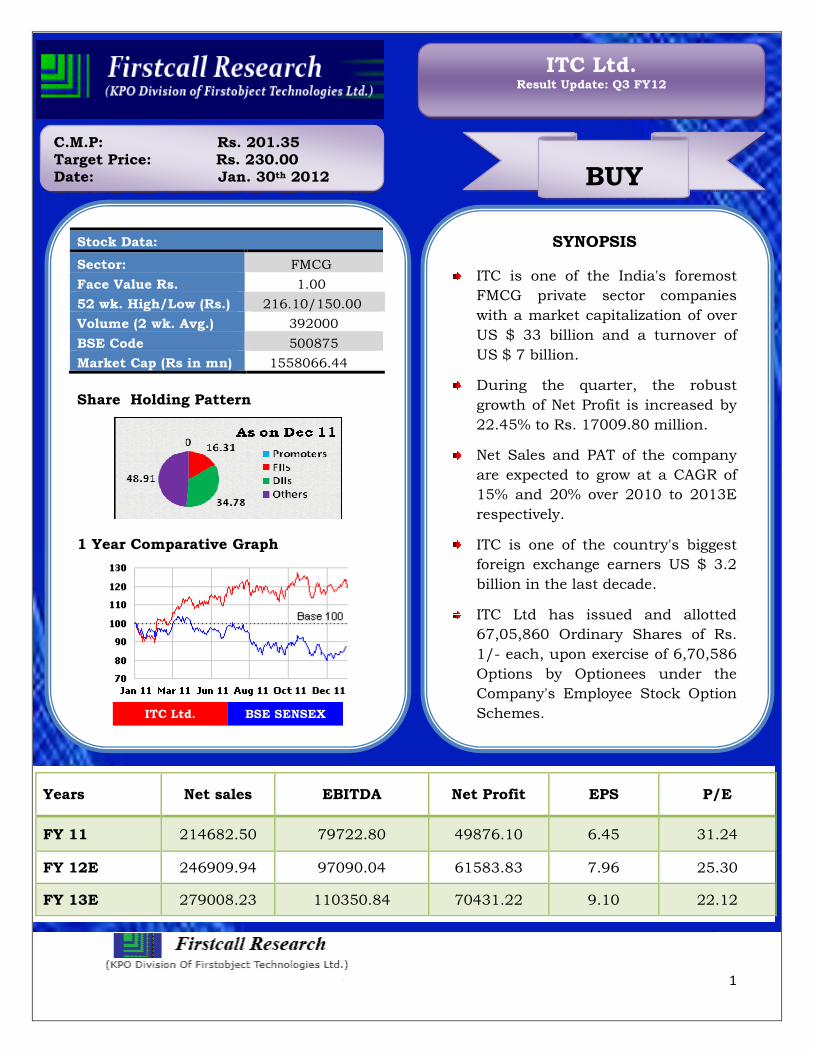
SYNOPSIS
ITC is one of the India's foremost
FMCG private sector companies
with a market capitalization of over
US $ 33 billion and a turnover of
US $ 7 billion.
During the quarter, the robust
growth of Net Profit is increased by
22.45% to Rs. 17009.80 million.
Net Sales and PAT of the company
are expected to grow at a CAGR of
15% and 20% over 2010 to 2013E
respectively.
ITC is one of the country's biggest
foreign exchange earners US $ 3.2
billion in the last decade.
ITC Ltd has issued and allotted
67,05,860 Ordinary Shares of Rs.
1/- each, upon exercise of 6,70,586
Options by Optionees under the
Company's Employee Stock Option
Schemes.
Years Net sales EBITDA Net Profit EPS P/E
FY 11 214682.50 79722.80 49876.10 6.45 31.24
FY 12E 246909.94 97090.04 61583.83 7.96 25.30
FY 13E 279008.23 110350.84 70431.22 9.10 22.12
Stock Data:
Sector: FMCG
Face Value Rs. 1.00
52 wk. High/Low (Rs.) 216.10/150.00
Volume (2 wk. Avg.) 392000
BSE Code 500875
Market Cap (Rs in mn) 1558066.44
Share Holding Pattern
1 Year Comparative Graph
ITC Ltd. BSE SENSEX
C.M.P: Rs. 201.35 Target Price: Rs. 230.00 Date: Jan. 30th 2012 BUY
ITC Ltd. Result Update: Q3 FY12
2
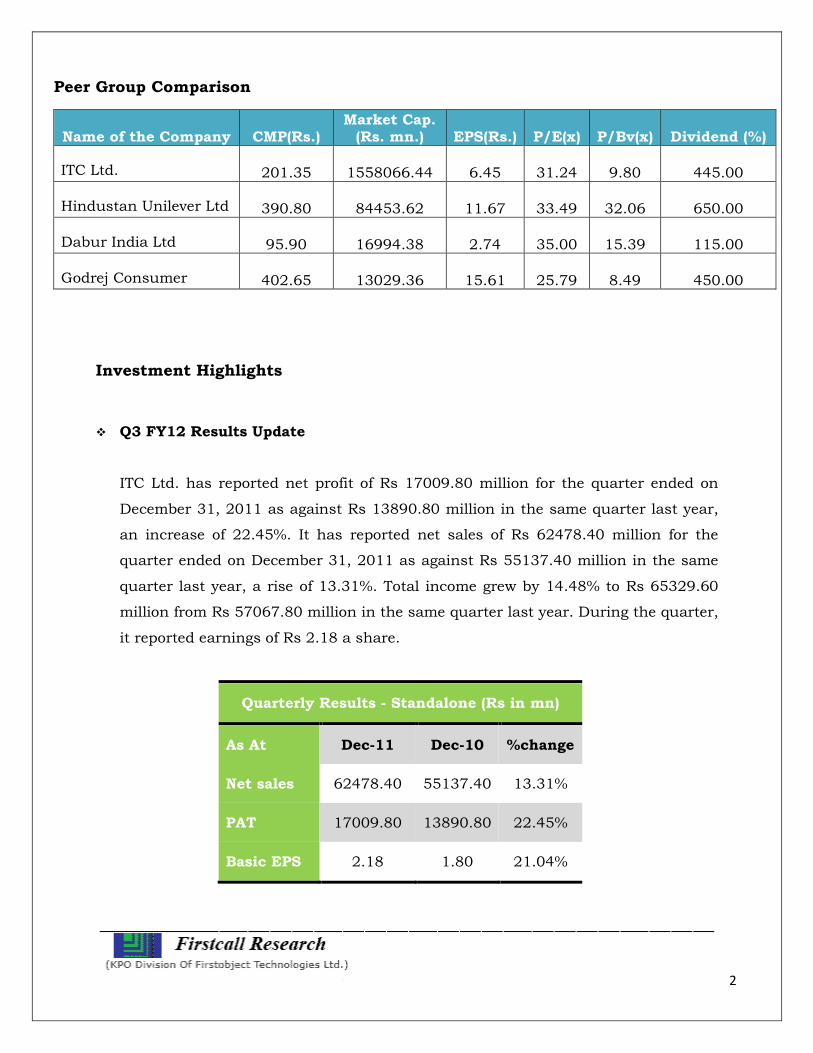
Peer Group Comparison
Name of the Company CMP(Rs.) Market Cap. (Rs. mn.) EPS(Rs.) P/E(x) P/Bv(x) Dividend (%)
ITC Ltd. 201.35 1558066.44 6.45 31.24 9.80 445.00
Hindustan Unilever Ltd 390.80 84453.62 11.67 33.49 32.06 650.00
Dabur India Ltd 95.90 16994.38 2.74 35.00 15.39 115.00
Godrej Consumer 402.65 13029.36 15.61 25.79 8.49 450.00
Investment Highlights
� Q3 FY12 Results Update
ITC Ltd. has reported net profit of Rs 17009.80 million for the quarter ended on
December 31, 2011 as against Rs 13890.80 million in the same quarter last year,
an increase of 22.45%. It has reported net sales of Rs 62478.40 million for the
quarter ended on December 31, 2011 as against Rs 55137.40 million in the same
quarter last year, a rise of 13.31%. Total income grew by 14.48% to Rs 65329.60
million from Rs 57067.80 million in the same quarter last year. During the quarter,
it reported earnings of Rs 2.18 a share.
Quarterly Results - Standalone (Rs in mn)
As At Dec-11 Dec-10 %change
Net sales 62478.40 55137.40 13.31%
PAT 17009.80 13890.80 22.45%
Basic EPS 2.18 1.80 21.04%
3
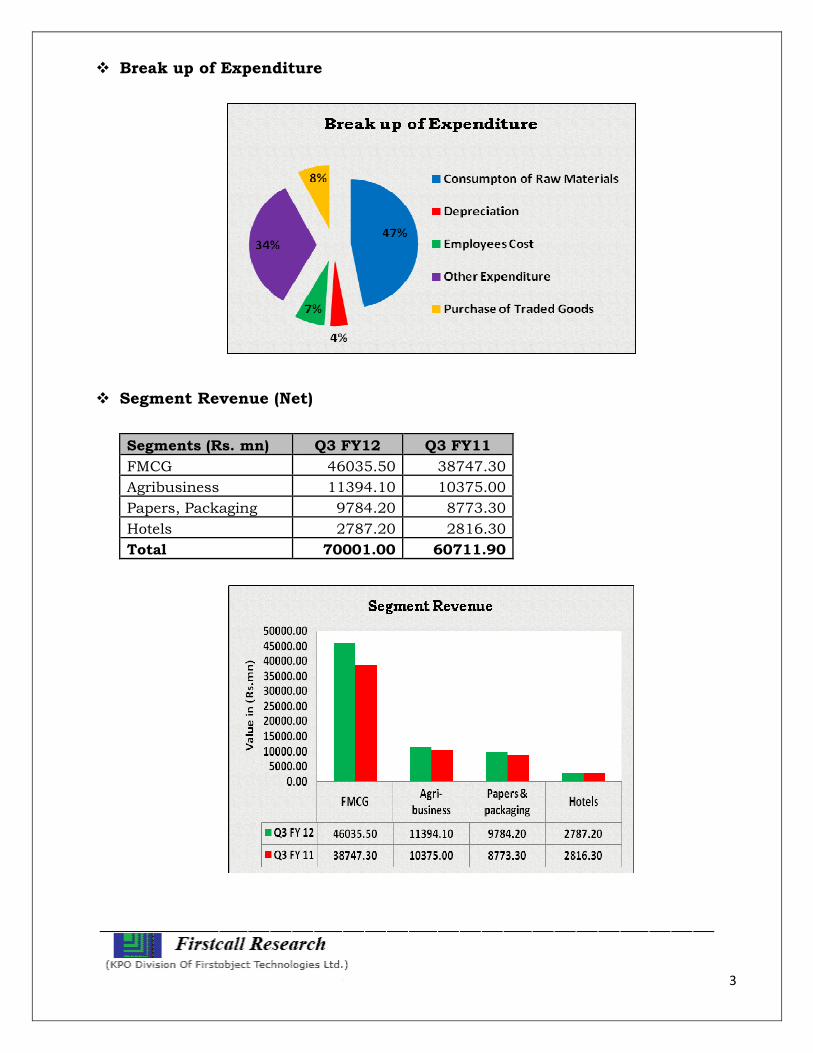
� Break up of Expenditure
� Segment Revenue (Net)
Segments (Rs. mn) Q3 FY12 Q3 FY11
FMCG 46035.50 38747.30
Agribusiness 11394.10 10375.00
Papers, Packaging 9784.20 8773.30
Hotels 2787.20 2816.30
Total 70001.00 60711.90
4
� Allotment of shares
ITC Ltd has issued and allotted 67,05,860 Ordinary Shares of Rs. 1/- each, upon
exercise of 6,70,586 Options by Optionees under the Company's Employee Stock
Option Schemes. Consequently, with effect from December 19, 2011, the issued
and Subscribed Share Capital of the Company stands increased to Rs.
779,61,59,710/- divided into 779,61,59,710 Ordinary Shares of Rs. 1/- each.
Company Profile
ITC Ltd. a public conglomerate company headquartered in Kolkata, India. Its turnover
is $7 billion and a market capitalization of over $33 Billion. It started off as the
Imperial Tobacco Company, and shares ancestry with Imperial Tobacco of the United
Kingdom, but it is now fully independent, and was rechristened to Indian Tobacco
Company in 1970 and then to I.T.C. Limited in 1974. ITC Limited completed “100
years” on 24 August 2010. ITC Ltd. has diversified presence in FMCG, Hotels,
Paperboards and Packaging, Agri Business and Information Technology. The Company
is currently focused on four business groups: FMCG, Hotels, Paperboards, Paper &
Packaging and Agri Business.
List of products and brands
In FMCG, ITC has a strong presence in:
� Cigarettes: W.D. & H.O. Wills, Gold Flake Kings, Gold Flake Premium, Navy
Cut, Classic, Benson & Hedges, Silk Cut, Capstan,
� Foods: Kitchens of India; Ashirvaad; Minto, Sunfeast; Candyman; Bingo;
Sunfeast Pasta
� Apparel: Wills Lifestyle and John Players brands
� Personal care: Fiama di Wills; Vivel; Essenza di Wills; Superia; Vivel di
Wills brands of products in perfumes, haircare and skincare
� Stationery: Classmate and Paperkraft brands
� Safety Matches and Agarbattis
5
Other Businesses include:
� Hotels
ITC's hotels have evolved into being India's second largest hotel chain with over
80 hotels throughout the country. ITC is also the exclusive franchisee
in India of two brands owned by Sheraton International Inc. - The Luxury
Collection & Sheraton which ITC uses in association with its own brands in the
luxury 5 Star segment. Brands in the hospitality sector owned and operated by
its subsidiaries include Fortune and WelcomeHeritage brands.
• Infotech India Ltd.
ITC's wholly owned Information Technology subsidiary, ITC Infotech India Ltd,
provides IT services and solutions to leading global customers. ITC Infotech has
carved a niche for itself by addressing customer challenges through innovative
IT solutions.
• ITC's Agri-Business
ITC's Agri-Business is one of India's largest exporters of agricultural products.
The Company's 'E-Choupal' initiative is enabling Indian agriculture significantly
enhance its competitiveness by empowering Indian farmers through the power
of the Internet.
Group Companies
Subsidiaries
� ITC Infotech
� Surya Nepal Pvt. Ltd.
� Landbase
� King Maker Marketing Inc., USA
� Technico Pty Ltd. Australia
� Russell Credit Ltd.
6
� Wimco Ltd.
� Srinivasa Resorts Ltd.
� Fortune Park Hotels Ltd.
� Bay Islands Hotels Ltd.
� Gold Flake Corporation Ltd.
Joint Ventures
� Maharaja Heritage Resorts Ltd.
� ITC Filtrona
Associate Companies
� Gujarat hotels Ltd
� International Travel House
Facilities
It employs over 26,000 people at more than 60 locations across India and is listed
on Forbes 2000. ITC Limited completed 100 years on 24 August 2010. In addition,
ITC's businesses have created sustainable livelihoods for more than 5 million people, a
majority of whom represent the poorest in rural India.
7
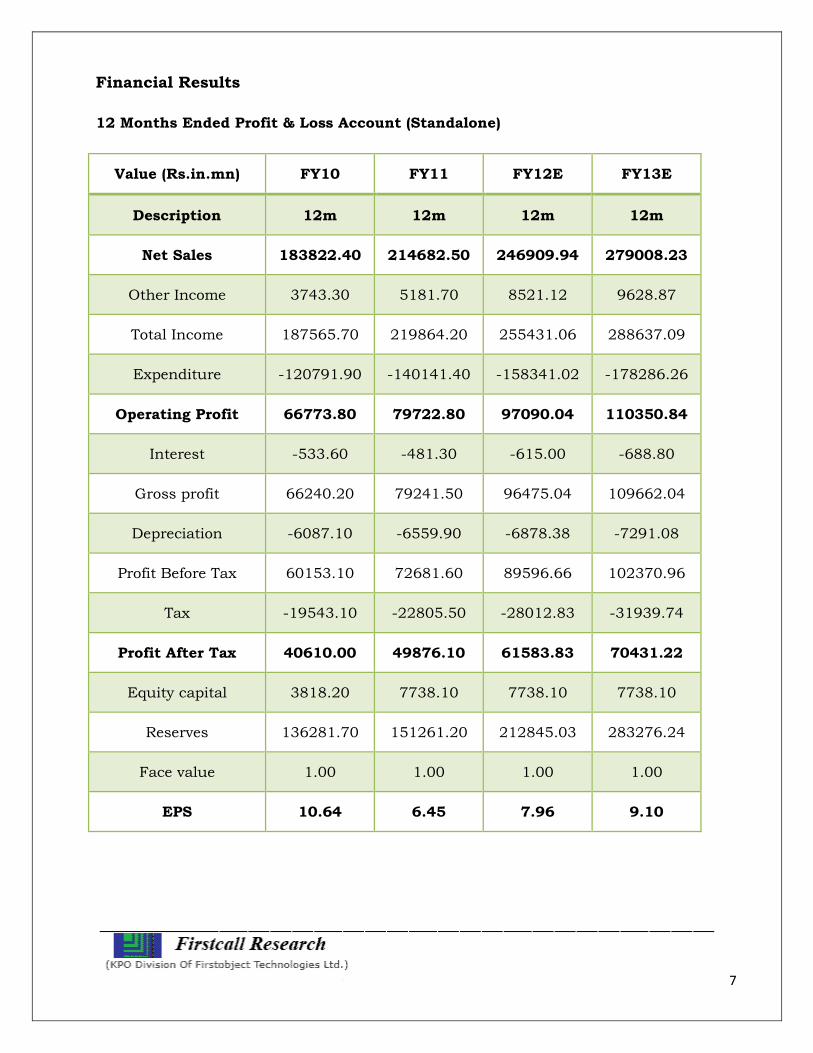
Financial Results
12 Months Ended Profit & Loss Account (Standalone)
Value (Rs.in.mn) FY10 FY11 FY12E FY13E
Description 12m 12m 12m 12m
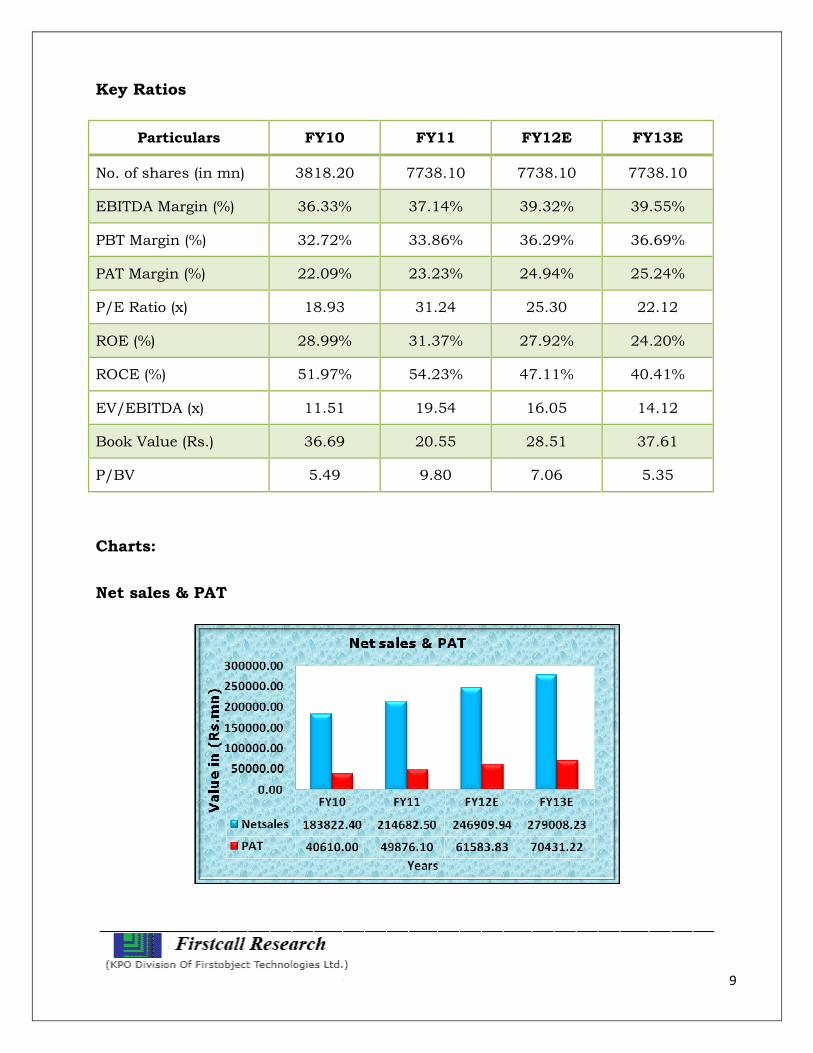
Net Sales 183822.40 214682.50 246909.94 279008.23
Other Income 3743.30 5181.70 8521.12 9628.87
Total Income 187565.70 219864.20 255431.06 288637.09
Expenditure -120791.90 -140141.40 -158341.02 -178286.26
Operating Profit 66773.80 79722.80 97090.04 110350.84
Interest -533.60 -481.30 -615.00 -688.80
Gross profit 66240.20 79241.50 96475.04 109662.04
Depreciation -6087.10 -6559.90 -6878.38 -7291.08
Profit Before Tax 60153.10 72681.60 89596.66 102370.96
Tax -19543.10 -22805.50 -28012.83 -31939.74
Profit After Tax 40610.00 49876.10 61583.83 70431.22
Equity capital 3818.20 7738.10 7738.10 7738.10
Reserves 136281.70 151261.20 212845.03 283276.24
Face value 1.00 1.00 1.00 1.00
EPS 10.64 6.45 7.96 9.10
8
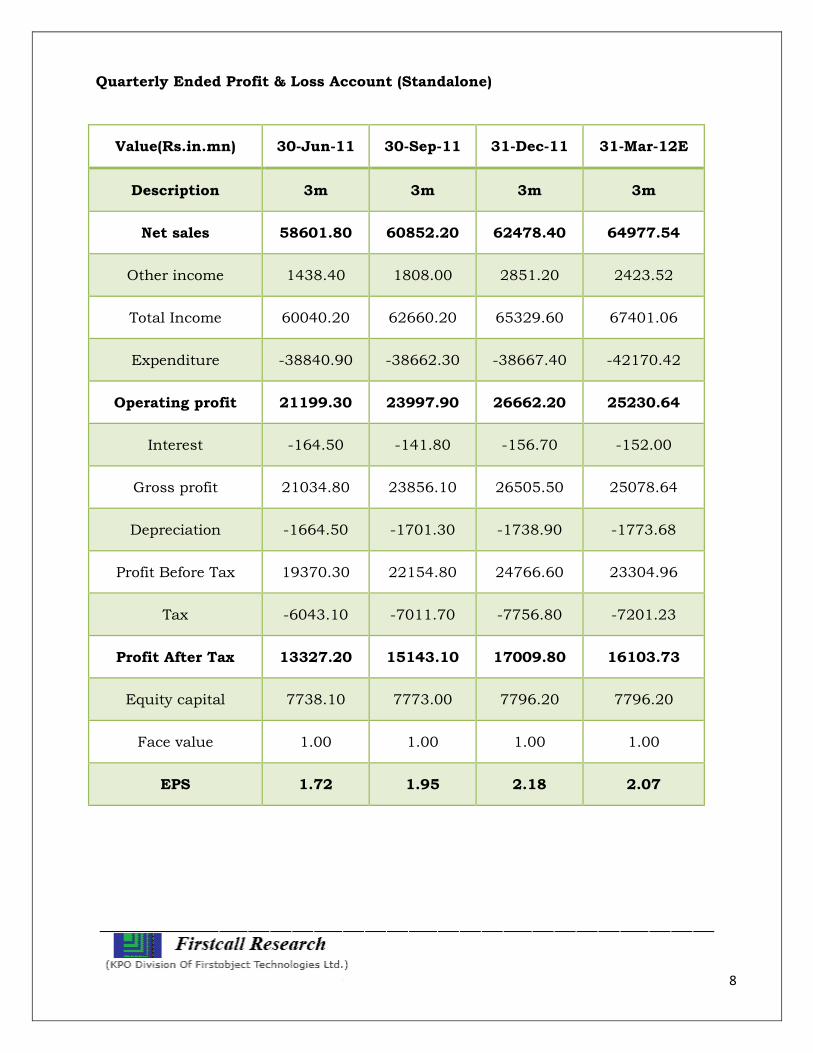
Quarterly Ended Profit & Loss Account (Standalone)
Value(Rs.in.mn) 30-Jun-11 30-Sep-11 31-Dec-11 31-Mar-12E
Description 3m 3m 3m 3m
Net sales 58601.80 60852.20 62478.40 64977.54
Other income 1438.40 1808.00 2851.20 2423.52
Total Income 60040.20 62660.20 65329.60 67401.06
Expenditure -38840.90 -38662.30 -38667.40 -42170.42
Operating profit 21199.30 23997.90 26662.20 25230.64
Interest -164.50 -141.80 -156.70 -152.00
Gross profit 21034.80 23856.10 26505.50 25078.64
Depreciation -1664.50 -1701.30 -1738.90 -1773.68
Profit Before Tax 19370.30 22154.80 24766.60 23304.96
Tax -6043.10 -7011.70 -7756.80 -7201.23
Profit After Tax 13327.20 15143.10 17009.80 16103.73
Equity capital 7738.10 7773.00 7796.20 7796.20
Face value 1.00 1.00 1.00 1.00
EPS 1.72 1.95 2.18 2.07
9
Key Ratios
Particulars FY10 FY11 FY12E FY13E
No. of shares (in mn) 3818.20 7738.10 7738.10 7738.10
EBITDA Margin (%) 36.33% 37.14% 39.32% 39.55%
PBT Margin (%) 32.72% 33.86% 36.29% 36.69%
PAT Margin (%) 22.09% 23.23% 24.94% 25.24%
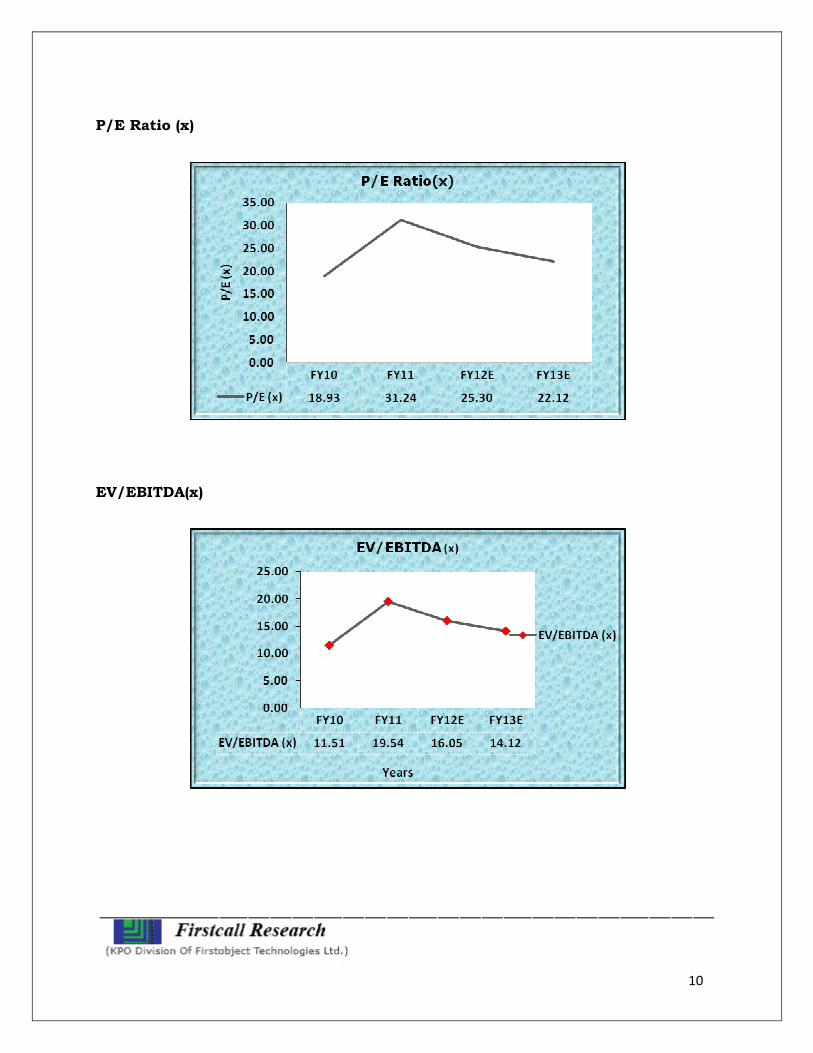
P/E Ratio (x) 18.93 31.24 25.30 22.12
ROE (%) 28.99% 31.37% 27.92% 24.20%
ROCE (%) 51.97% 54.23% 47.11% 40.41%
EV/EBITDA (x) 11.51 19.54 16.05 14.12
Book Value (Rs.) 36.69 20.55 28.51 37.61
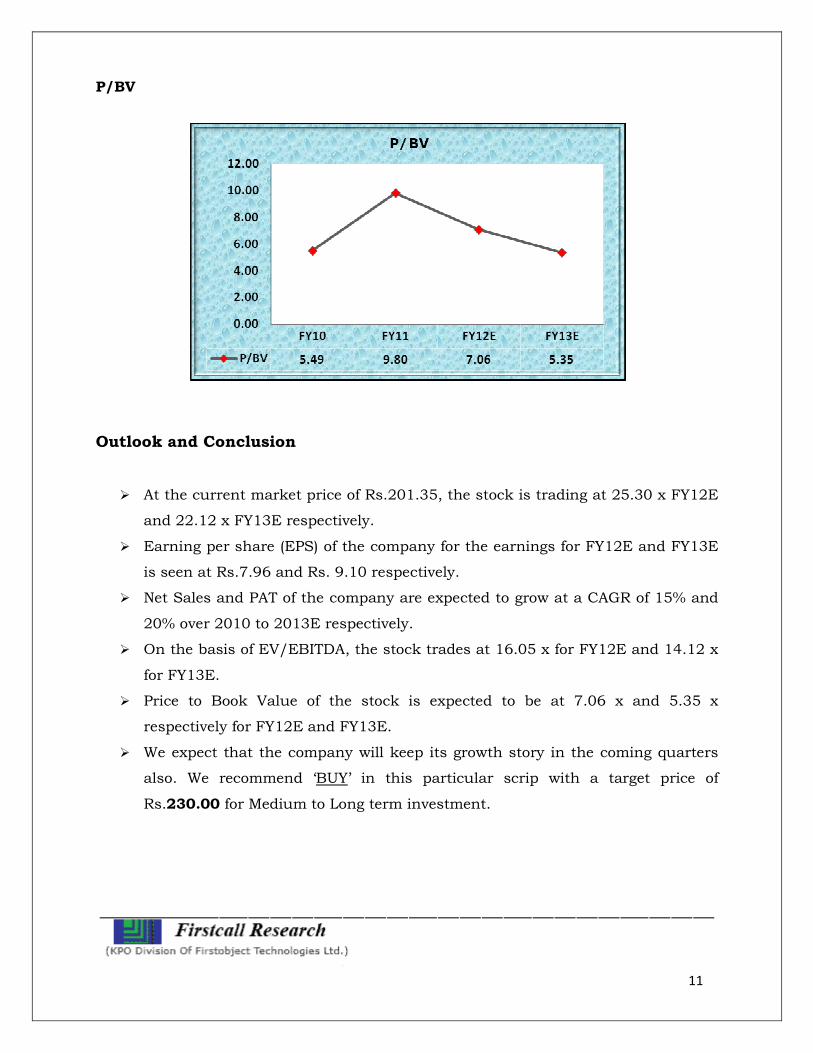
P/BV 5.49 9.80 7.06 5.35
Charts:
Net sales & PAT
10
P/E Ratio (x)
EV/EBITDA(x)
11
P/BV
Outlook and Conclusion
� At the current market price of Rs.201.35, the stock is trading at 25.30 x FY12E
and 22.12 x FY13E respectively.
� Earning per share (EPS) of the company for the earnings for FY12E and FY13E
is seen at Rs.7.96 and Rs. 9.10 respectively.
� Net Sales and PAT of the company are expected to grow at a CAGR of 15% and
20% over 2010 to 2013E respectively.
� On the basis of EV/EBITDA, the stock trades at 16.05 x for FY12E and 14.12 x
for FY13E.
� Price to Book Value of the stock is expected to be at 7.06 x and 5.35 x
respectively for FY12E and FY13E.
� We expect that the company will keep its growth story in the coming quarters
also. We recommend ‘BUY’ in this particular scrip with a target price of
Rs.230.00 for Medium to Long term investment.
12
Industry Overview
Fast Moving Consumer Goods (FMCG) goods are popularly named as consumer
packaged goods. Items in this category include all consumables (other than
groceries/pulses) people buy at regular intervals. The most common in the list are
toilet soaps, detergents, shampoos, toothpaste, shaving products, shoe polish,
packaged foodstuff, and household accessories and extends to certain electronic
goods. These items are meant for daily of frequent consumption and have a high
return.
A major portion of the monthly budget of each household is reserved for FMCG
products. The volume of money circulated in the economy against FMCG products is
very high, as the number of products the consumer use is very high. Competition in
the FMCG sector is very high resulting in high pressure on margins
FMCG companies maintain intense distribution network. Companies spend a large
portion of their budget on maintaining distribution networks. New entrants who wish
to bring their products in the national level need to invest huge sums of money on
promoting brands. Manufacturing can be outsourced. A recent phenomenon in the
sector was entry of multinationals and cheaper imports. Also the market is more
pressurized with presence of local players in rural areas and state brands
Fast moving consumer goods (FMCG) sector is scaling new heights due to the entry of
foreign brands and development of organized retailing in a big way. Indian packaged
food industry, which is currently estimated at around US$ 10 billion, is driving retail
sales to a major extent in India. FMCG firms have also started tapping net savvy
consumers to give a boost to their revenue. Companies, including Dabur, Himalaya
Herbal Healthcare, Neutrogena, Oriflame, Amul, Future Group, Aditya Birla Retail,
REI Agro and Carrefour are making efforts to expand their reach through internet.
A recent study has revealed that lesser developed eastern states such as Bihar, Orissa,
Chhattisgarh and Assam are leading rural sales in India. The analysis has
strengthened the fact that rural markets are driving consumption of FMCG products.
13
• US FMCG giant McCormick, that has recently formed a joint venture (JV) with
Indian basmati rice brand Kohinoor Foods, intends to tap Indian packaged food
industry and achieve sales of US$ 85 million in the first year of operations in
the country.
• FMCG firm GSK Consumer Healthcare (GSKCH) has made a debut into Indian
breakfast cereal market by launching oats cereal under its flagship brand
‘Horlicks’. The breakfast cereal market in India is currently dominated by
PepsiCo and Kellogg’s.
• Oral and dental hygiene products manufacturer Colgate Palmolive has decided
to invest Rs 200 crore (US$ 40 million) to establish a greenfield facility at an
upcoming industrial estate in Sanand which is being developed by state-run
Gujarat Industrial Development Corporation (GIDC).
__________ ____ _________________________ Disclaimer:
This document prepared by our research analysts does not constitute an offer or solicitation
for the purchase or sale of any financial instrument or as an official confirmation of any
transaction. The information contained herein is from publicly available data or other
sources believed to be reliable but do not represent that it is accurate or complete and it
should not be relied on as such. Firstcall India Equity Advisors Pvt. Ltd. or any of its
affiliates shall not be in any way responsible for any loss or damage that may arise to any
person from any inadvertent error in the information contained in this report. This document
is provide for assistance only and is not intended to be and must not alone be taken as the
basis for an investment decision.
14
Firstcall India Equity Research: Email – [email protected]
C.V.S.L.Kameswari Pharma
U. Janaki Rao Capital Goods
A. Rajesh Babu FMCG
H.Lavanya Oil & Gas
Ashish Kushwaha Diversified
Firstcall India also provides
Firstcall India Equity Advisors Pvt.Ltd focuses on, IPO’s, QIP’s, F.P.O’s, Takeover
Offers, Offer for Sale and Buy Back Offerings.
Corporate Finance Offerings include Foreign Currency Loan Syndications,
Placement of Equity / Debt with multilateral organizations, Short Term Funds
Management Debt & Equity, Working Capital Limits, Equity & Debt
Syndications and Structured Deals.
Corporate Advisory Offerings include Mergers & Acquisitions (domestic and
cross-border), divestitures, spin-offs, valuation of business, corporate
restructuring-Capital and Debt, Turnkey Corporate Revival – Planning &
Execution, Project Financing, Venture capital, Private Equity and Financial
Joint Ventures
Firstcall India also provides Financial Advisory services with respect to raising
of capital through FCCBs, GDRs, ADRs and listing of the same on International
Stock Exchanges namely AIMs, Luxembourg, Singapore Stock Exchanges and
other international stock exchanges.
For Further Details Contact:
3rd Floor,Sankalp,The Bureau,Dr.R.C.Marg,Chembur,Mumbai 400 071
Tel.: 022-2527 2510/2527 6077/25276089 Telefax: 022-25276089
E-mail: [email protected]
www.firstcallindiaequity.com