Embed Size (px)
Citation preview
CMP 336.70
Target Price 378.00
ISIN: INE154A01025
JUNE 6th
2014
ITC LIMITED
Result Update (PARENT BASIS): Q4 FY14
BUY
Index Details
Stock Data
Sector FMCG
BSE Code 500875
Face Value 1.00
52wk. High / Low (Rs.) 386.75/285.40
Volume (2wk. Avg.) 756000
Market Cap (Rs. in mn.) 2677842.44
Annual Estimated Results (A*: Actual / E*: Estimated)
YEARS FY14A FY15E FY16E
Net Sales 332386.00 365624.60 394874.57
EBITDA 135619.80 149431.96 161027.81
Net Profit 87852.10 97273.21 104925.66
EPS 11.05 12.23 13.19
P/E 30.48 27.53 25.52
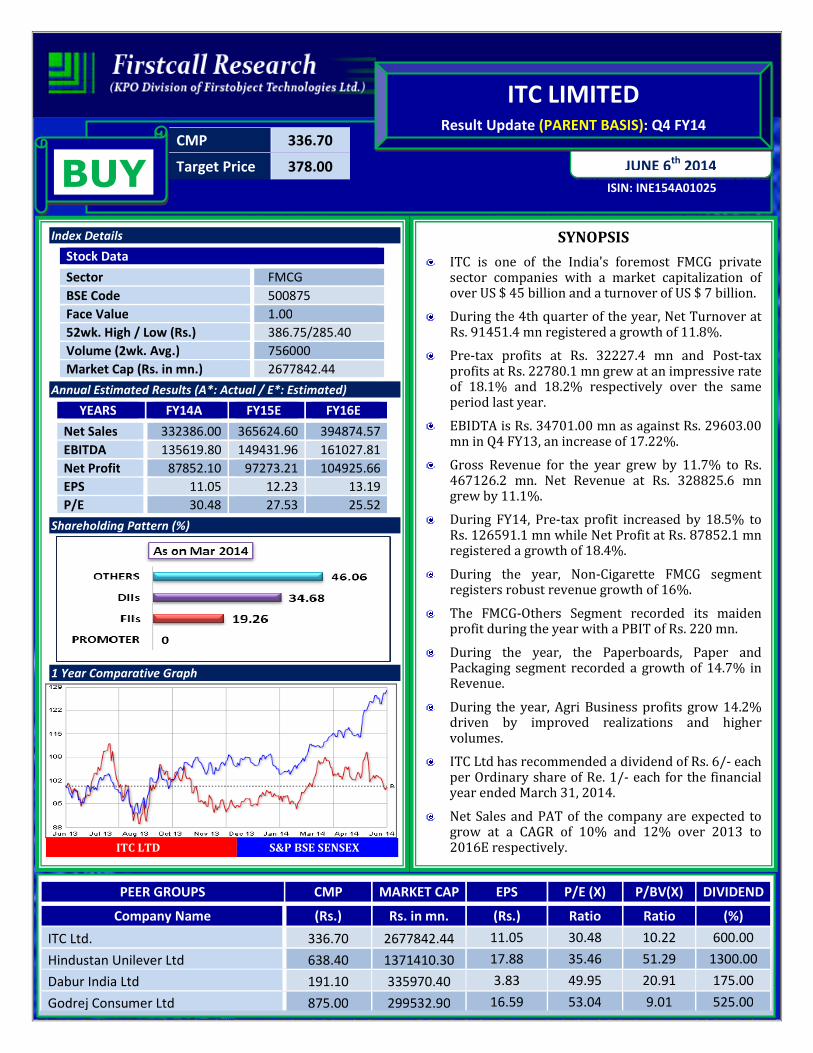
Shareholding Pattern (%)
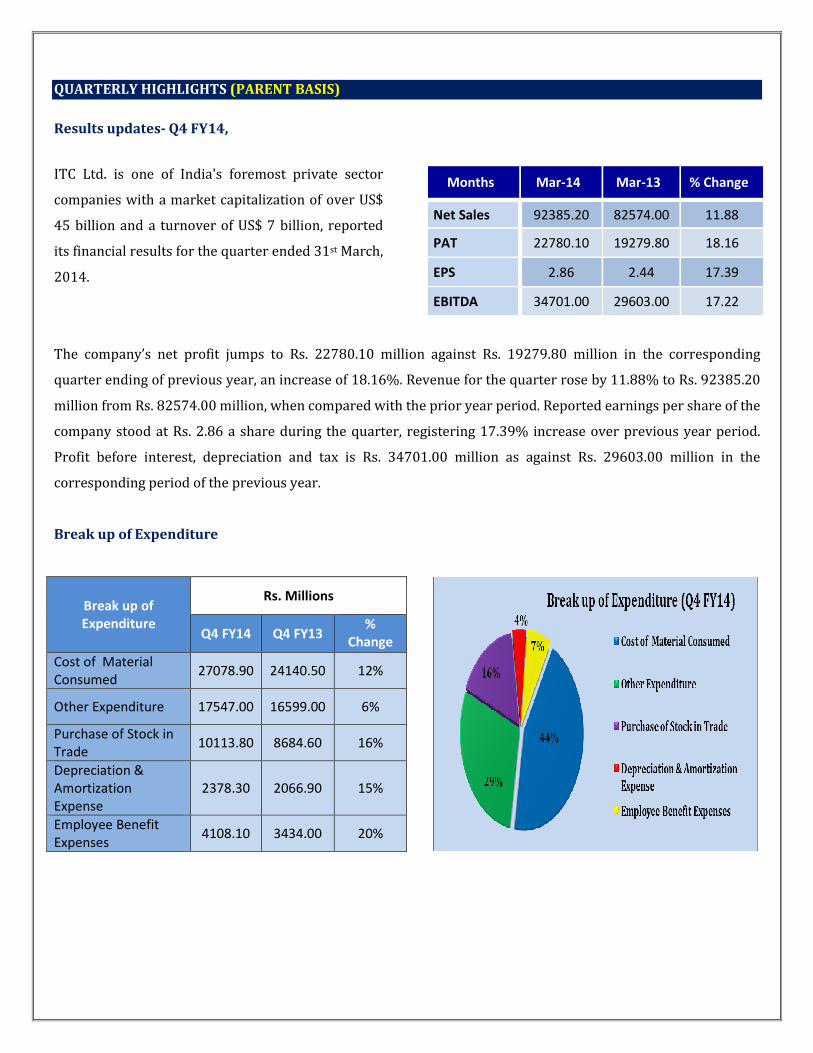
1 Year Comparative Graph
ITC LTD S&P BSE SENSEX
SYNOPSIS
ITC is one of the India's foremost FMCG private sector companies with a market capitalization of over US $ 45 billion and a turnover of US $ 7 billion.
During the 4th quarter of the year, Net Turnover at Rs. 91451.4 mn registered a growth of 11.8%.
Pre-tax profits at Rs. 32227.4 mn and Post-tax profits at Rs. 22780.1 mn grew at an impressive rate of 18.1% and 18.2% respectively over the same period last year.
EBIDTA is Rs. 34701.00 mn as against Rs. 29603.00 mn in Q4 FY13, an increase of 17.22%.
Gross Revenue for the year grew by 11.7% to Rs. 467126.2 mn. Net Revenue at Rs. 328825.6 mn grew by 11.1%.
During FY14, Pre-tax profit increased by 18.5% to Rs. 126591.1 mn while Net Profit at Rs. 87852.1 mn registered a growth of 18.4%.
During the year, Non-Cigarette FMCG segment registers robust revenue growth of 16%.
The FMCG-Others Segment recorded its maiden profit during the year with a PBIT of Rs. 220 mn.
During the year, the Paperboards, Paper and Packaging segment recorded a growth of 14.7% in Revenue.
During the year, Agri Business profits grow 14.2% driven by improved realizations and higher volumes.
ITC Ltd has recommended a dividend of Rs. 6/- each per Ordinary share of Re. 1/- each for the financial year ended March 31, 2014.
Net Sales and PAT of the company are expected to grow at a CAGR of 10% and 12% over 2013 to 2016E respectively.
PEER GROUPS CMP MARKET CAP EPS P/E (X) P/BV(X) DIVIDEND
Company Name (Rs.) Rs. in mn. (Rs.) Ratio Ratio (%)
ITC Ltd. 336.70 2677842.44 11.05 30.48 10.22 600.00
Hindustan Unilever Ltd 638.40 1371410.30 17.88 35.46 51.29 1300.00
Dabur India Ltd 191.10 335970.40 3.83 49.95 20.91 175.00
Godrej Consumer Ltd 875.00 299532.90 16.59 53.04 9.01 525.00

Recommendation & Analysis - ‘BUY’
ITC continued to deliver strong financial performance with healthy growth in revenues and high quality earnings.
During the 4th quarter of the year, Net Turnover at Rs. 91451.4 mn registered a growth of 11.8% driven by
robust performance in the Non-Cigarette FMCG, Paperboard, Paper & Packaging and Cigarettes segments. Pre-tax
profits at Rs. 32227.4 mn and Post-tax profits at Rs. 22780.1 mn grew at an impressive rate of 18.1% and 18.2%
respectively over the same period last year.
Gross Revenue for the year grew by 11.7% to Rs. 467126.2 mn. Net Revenue at Rs. 328825.6 mn grew by 11.1%
primarily driven by a 16.0% growth in the non-cigarette FMCG segment, 14.7% growth in Paperboards, Paper &
Packaging segment and 10.6% growth in the Cigarettes business. Pre-tax profit increased by 18.5% to Rs.
126591.1 mn while Net Profit at Rs. 87852.1 mn registered a growth of 18.4%. Earnings Per Share for the year
stood at Rs. 11.09 (previous year Rs. 9.45). Cash flows from Operations aggregated Rs. 107600 mn compared to
Rs. 95960 mn in the previous year.
During the year, Non-Cigarette FMCG segment registers robust revenue growth of 16%, despite a challenging
operating environment. The FMCG-Others Segment recorded its maiden profit during the year with a PBIT of Rs.
220 mn representing a positive swing of Rs. 1030 mn over FY13 driven by enhanced scale, operating leverage,
supply chain efficiencies and strategic cost management initiatives. Agri Business profits grow 14.2% driven by
improved realizations and higher volumes. Paperboards, Paper & Packaging Segment Revenues up 14.7% aided
by higher volumes and product mix enrichment. Profitability impacted by steep increase in wood, coal and
chemical costs. Over FY2013-16E, we expect the company to post a CAGR of 10% and 12% in its top-line and
bottom-line respectively. Hence, we recommend ‘BUY’ for ‘ITC LTD’ with a target price of Rs. 378.00.
QUARTERLY HIGHLIGHTS (PARENT BASIS)
Results updates- Q4 FY14,
ITC Ltd. is one of India's foremost private sector
companies with a market capitalization of over US$
45 billion and a turnover of US$ 7 billion, reported
its financial results for the quarter ended 31st March,
2014.
Months Mar-14 Mar-13 % Change
Net Sales 92385.20 82574.00 11.88
PAT 22780.10 19279.80 18.16
EPS 2.86 2.44 17.39
EBITDA 34701.00 29603.00 17.22
The company’s net profit jumps to Rs. 22780.10 million against Rs. 19279.80 million in the corresponding
quarter ending of previous year, an increase of 18.16%. Revenue for the quarter rose by 11.88% to Rs. 92385.20
million from Rs. 82574.00 million, when compared with the prior year period. Reported earnings per share of the
company stood at Rs. 2.86 a share during the quarter, registering 17.39% increase over previous year period.
Profit before interest, depreciation and tax is Rs. 34701.00 million as against Rs. 29603.00 million in the
corresponding period of the previous year.
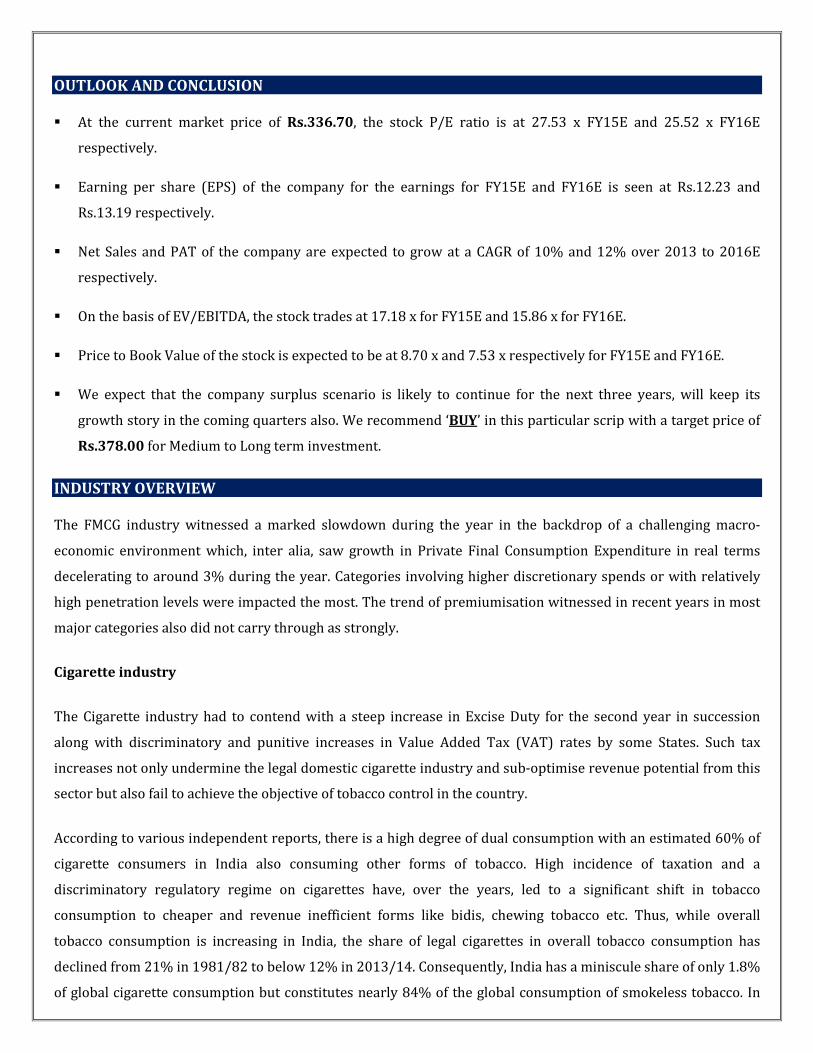
Break up of Expenditure
Break up of
Expenditure
Rs. Millions
Q4 FY14 Q4 FY13 %
Change
Cost of Material
Consumed 27078.90 24140.50 12%
Other Expenditure 17547.00 16599.00 6%
Purchase of Stock in
Trade 10113.80 8684.60 16%
Depreciation &
Amortization
Expense
2378.30 2066.90 15%
Employee Benefit
Expenses 4108.10 3434.00 20%

Segment Revenue
Latest Updates
• ITC Ltd has recommended a dividend of Rs. 6/- each per Ordinary share of Re. 1/- each for the financial year
ended March 31, 2014.
• During the quarter, ITC has issued and allotted 1,76,87,110 Ordinary Shares of Re. 1/- each e under the
Company’s Employee Stock Option Schemes. Consequently, the issued and paid-up Share Capital of the
Company as on 31st March, 2014 stands increased to Rs. 7,95,31,82,950/-.
• North East Nutrients Private Limited became a subsidiary of the Company with effect from 6th February,
2014, consequent upon acquisition of 76% of NENPL’s share capital.
COMPANY PROFILE
ITC is one of India's foremost private sector companies with a market capitalization of over US $ 45 billion and a
turnover of US $ 7 billion. ITC is rated among the World's Best Big Companies, Asia's 'Fab 50' and the World's
Most Reputable Companies by Forbes magazine, among India's Most Respected Companies by Business World
and among India's Most Valuable Companies by Business. ITC ranks among India's 10 Most Valuable (Company)
Brands'. ITC also ranks among Asia's 50 best performing companies.
ITC has a diversified presence in FMCG, Hotels, Paperboards & Specialty Papers, Packaging, Agri-Business, and
Information Technology. While ITC is an outstanding market leader in its traditional businesses of Cigarettes,
Hotels, Paperboards, Packaging and Agri-Exports, it is rapidly gaining market share even in its nascent
businesses of Packaged Foods & Confectionery, Branded Apparel, Personal Care and Stationery.

ITC's Agri-Business is one of India's largest exporters of agricultural products. The ITC group's contribution to
foreign exchange earnings over the last ten years amounted to nearly US$ 5.4 billion, of which agri exports
constituted 56%. The Company's 'e-Choupal' initiative is enabling Indian agriculture significantly enhance its
competitiveness by empowering Indian farmers through the power of the Internet. ITC's production facilities and
hotels have won numerous national and international awards for quality, productivity, safety and environment
management systems. ITC was the first company in India to voluntarily seek a corporate governance rating.
ITC's R&D Centre the first independent R&D centre in India to get ISO 9001 accreditation and certified with ISO
14001 for EMS by DNV. The R&D Centre is also certified for the standard ISO/IEC17025:2005, by National
Accreditation Board for Testing and Calibration Laboratories (NABL). This certification is awarded for "General
requirement for the competence of Testing & Calibration Laboratories".
Other Business Areas
• Hotels
ITC's hotels have evolved into being India's second largest hotel chain with over 90 hotels throughout the
country. ITC is also the exclusive franchisee in India of two brands owned by Sheraton International Inc. -
The Luxury Collection & Sheraton which ITC uses in association with its own brands in the luxury 5 Star
segment. Brands in the hospitality sector owned & operated by its subsidiaries include Fortune and
Welcome Heritage brands.
• Infotech India Ltd.
ITC's wholly owned Information Technology subsidiary, ITC Infotech India Ltd, provides IT services and
solutions to leading global customers. ITC Infotech has carved a niche for itself by addressing customer
challenges through innovative IT solutions.
• ITC's Agri-Business
ITC's Agri-Business is one of India's largest exporters of agricultural products. The Company's 'E-
Choupal' initiative is enabling Indian agriculture significantly enhance its competitiveness by
empowering Indian farmers through the power of the Internet.

FINANCIAL HIGHLIGHT (PARENT BASIS) (A*- Actual, E* -Estimations & Rs. In Millions)
Balance Sheet as at March 31, 2013 -2016E
ITC Ltd. FY13A FY14A FY15E FY16E
SOURCES OF FUNDS
Shareholder's Funds
Share Capital 7901.80 7953.20 7953.20 7953.20
Reserves and Surplus 214976.70 254667.00 299888.62 347870.80
1. Sub Total - Net worth 222878.50 262620.20 307841.82 355824.00
Non Current Liabilities
Long term borrowings 664.00 510.00 448.80 426.36
Deferred Tax Liabilities 12037.20 12969.60 13618.08 14162.80
Other Long term Liabilities 31.10 50.90 61.08 69.02
Long Term Provisions 1256.20 1100.00 990.00 1049.40
2. Sub Total - Non Current Liabilities 13988.50 14630.50 15117.96 15707.58
Current Liabilities
Short Term Borrowings 0.00 1.40 1.54 1.79
Trade Payables 16689.80 19875.90 22261.01 24041.89
Other Current Liabilities 35286.20 36318.80 37045.18 37786.08
Short Term Provisions 51331.30 58847.10 63554.87 66732.61
3. Sub Total - Current Liabilities 103307.30 115043.20 122862.59 128562.37
Total Liabilities (1+2+3) 340174.30 392293.90 445822.37 500093.95
APPLICATION OF FUNDS
Non-Current Assets
a) Fixed Assets 126971.30 143084.70 159711.61 176473.73
b) Non-current investments 20008.60 25121.70 29643.61 34090.15
c) Long Term loans and advances 17279.70 14800.20 13468.18 14276.27
1. Sub Total - Non Current Assets 164259.60 183006.60 202823.39 224840.15
Current Assets
Current Investment 50594.30 63112.60 74472.87 85643.80
Inventories 66002.00 73595.40 80954.94 87431.34
Trade receivables 11633.40 21653.60 29232.36 36832.77
Cash and Bank Balances 36150.00 32893.70 36183.07 39077.72
Short-terms loans & advances 5121.40 7835.10 9715.52 11464.32
Other current assets 6413.60 10196.90 12440.22 14803.86
2. Sub Total - Current Assets 175914.70 209287.30 242998.98 275253.80
Total Assets (1+2) 340174.30 392293.90 445822.37 500093.95

Annual Profit & Loss Statement for the period of 2013 to 2016E
Value (Rs.in.mn) FY13A FY14A FY15E FY16E
Description 12m 12m 12m 12m
Net Sales 299012.70 332386.00 365624.60 394874.57
Other Income 9387.00 11071.40 11957.11 12554.97
Total Income 308399.70 343457.40 377581.71 407429.54
Expenditure -192737.60 -207837.60 -228149.75 -246401.73
Operating Profit 115662.10 135619.80 149431.96 161027.81
Interest -864.70 -29.50 -172.94 -121.06
Gross profit 114797.40 135590.30 149259.02 160906.75
Depreciation -7955.60 -8999.20 -9899.12 -10691.05
Profit Before Tax 106841.80 126591.10 139359.90 150215.70
Tax -32657.90 -38739.00 -42086.69 -45290.03
Net Profit 74183.90 87852.10 97273.21 104925.66
Equity capital 7901.80 7953.20 7953.20 7953.20
Reserves 214449.20 254142.90 299888.62 347870.80
Face value 1.00 1.00 1.00 1.00
EPS 9.39 11.05 12.23 13.19
Quarterly Profit & Loss Statement for the period of 30th Sep, 2013 to 30th June, 2014E
Value (Rs.in.mn) 30-Sep-13 31-Dec-13 31-Mar-14 30-Jun-14E
Description 3m 3m 3m 3m
Net sales 78625.30 87268.50 92385.20 84994.38
Other income 2461.90 3910.60 2667.10 2533.75
Total Income 81087.20 91179.10 95052.30 87528.13
Expenditure -46866.90 -54425.50 -60351.30 -53070.49
Operating profit 34220.30 36753.60 34701.00 34457.64
Interest 326.70 -91.40 -95.30 -76.24
Gross profit 34547.00 36662.20 34605.70 34381.40
Depreciation -2208.70 -2259.20 -2378.30 -2449.65
Profit Before Tax 32338.30 34403.00 32227.40 31931.75
Tax -10033.00 -10549.60 -9447.30 -9771.11
Net Profit 22305.30 23853.40 22780.10 22160.63
Equity capital 7920.00 7935.50 7953.20 7953.20
Face value 1.00 1.00 1.00 1.00
EPS 2.82 3.01 2.86 2.79

Ratio Analysis
Particulars FY13A FY14A FY15E FY16E
EPS (Rs.) 9.39 11.05 12.23 13.19
EBITDA Margin (%) 38.68% 40.80% 40.87% 40.78%
PBT Margin (%) 35.73% 38.09% 38.12% 38.04%
PAT Margin (%) 24.81% 26.43% 26.60% 26.57%
P/E Ratio (x) 35.86 30.48 27.53 25.52
ROE (%) 33.36% 33.52% 31.60% 29.49%
ROCE (%) 55.43% 55.07% 51.68% 48.20%
EV/EBITDA (x) 22.26 19.04 17.18 15.86
Book Value (Rs.) 28.14 32.95 38.71 44.74
P/BV 11.97 10.22 8.70 7.53
Charts
OUTLOOK AND CONCLUSION
� At the current market price of Rs.336.70, the stock P/E ratio is at 27.53 x FY15E and 25.52 x FY16E
respectively.
� Earning per share (EPS) of the company for the earnings for FY15E and FY16E is seen at Rs.12.23 and
Rs.13.19 respectively.
� Net Sales and PAT of the company are expected to grow at a CAGR of 10% and 12% over 2013 to 2016E
respectively.
� On the basis of EV/EBITDA, the stock trades at 17.18 x for FY15E and 15.86 x for FY16E.
� Price to Book Value of the stock is expected to be at 8.70 x and 7.53 x respectively for FY15E and FY16E.
� We expect that the company surplus scenario is likely to continue for the next three years, will keep its
growth story in the coming quarters also. We recommend ‘BUY’ in this particular scrip with a target price of
Rs.378.00 for Medium to Long term investment.
INDUSTRY OVERVIEW
The FMCG industry witnessed a marked slowdown during the year in the backdrop of a challenging macro-
economic environment which, inter alia, saw growth in Private Final Consumption Expenditure in real terms
decelerating to around 3% during the year. Categories involving higher discretionary spends or with relatively
high penetration levels were impacted the most. The trend of premiumisation witnessed in recent years in most
major categories also did not carry through as strongly.
Cigarette industry
The Cigarette industry had to contend with a steep increase in Excise Duty for the second year in succession
along with discriminatory and punitive increases in Value Added Tax (VAT) rates by some States. Such tax
increases not only undermine the legal domestic cigarette industry and sub-optimise revenue potential from this
sector but also fail to achieve the objective of tobacco control in the country.
According to various independent reports, there is a high degree of dual consumption with an estimated 60% of
cigarette consumers in India also consuming other forms of tobacco. High incidence of taxation and a
discriminatory regulatory regime on cigarettes have, over the years, led to a significant shift in tobacco
consumption to cheaper and revenue inefficient forms like bidis, chewing tobacco etc. Thus, while overall
tobacco consumption is increasing in India, the share of legal cigarettes in overall tobacco consumption has
declined from 21% in 1981/82 to below 12% in 2013/14. Consequently, India has a miniscule share of only 1.8%
of global cigarette consumption but constitutes nearly 84% of the global consumption of smokeless tobacco. In

fact, India's annual per capita consumption of cigarettes is the lowest in the world. The requirement therefore is
an India-centric tax and policy framework for tobacco that cognises for the unique consumption pattern in the
country.
High taxes on domestic cigarettes have also led to an increasing demand for cheaper tax-evaded cigarettes. The
revenue loss to the Government on account of this trade is estimated at over Rs. 6,000 crores. The menace of
illegal trade is compounded by the imposition of high VAT rates by States. Despite a consensus amongst the
Empowered Committee of State Finance Ministers that all tobacco products would be taxed at Revenue Neutral
Rates applicable to general category of goods, there are 29 different tax rates currently applicable on cigarettes
Hotels
The hospitality sector continued to be adversely impacted by the weak economic environment prevailing in
major international source markets and in India on the one hand, and significant additions to room supplies in
key Indian cities on the other. Against the backdrop of such a challenging business environment, Segment
Revenues saw a modest increase of 5.5% during the year. While the Hotels Business maintained its leadership
position in the industry in terms of operating margins, Segment Results were impacted mainly on account of the
relatively weak pricing scenario and increase in operating costs in an inflationary environment.
Paperboards & Specialty Papers
The global paper market continued to witness a structural shift with emerging economies, particularly in Asia
such as China and India, driving the demand growth. Though India has 17% of the world’s population, it
consumes only about 2% of global paper production. Per capita consumption in India is very low at only 9 kgs
compared to a global average of 55 kgs, 65 kgs in China and 215 kgs in Japan.
The domestic paper and paperboard industry is currently estimated at 11.6 million tonnes per annum, out of
which paperboards is 2.2 million tonnes per annum which is expected to grow at around 8% per annum aided by
value-added paperboard at 12% per annum.
Conclusion
While the rural market certainly offers a big attraction to marketers, it would be naïve to think that any company
can enter the market without facing any problems and walk away with a sizable share. Distribution is the most
important variable in the marketing plans of most consumer goods manufacturers, because managing such a
massive sales and distribution network is in itself a huge task.
This sector will continue to see growth as it depends on an ever-increasing internal market for consumption, and
demand for these goods remains more or less constant, irrespective of recession or inflation. Hence this sector
will grow, though it may not be a smooth growth path, due to the present world-wide economic slowdown, rising

inflation and fall of the rupee. This sector will see good growth in the long run and hiring will continue to remain
robust.
Disclaimer:
This document prepared by our research analysts does not constitute an offer or solicitation for the purchase or sale
of any financial instrument or as an official confirmation of any transaction. The information contained herein is
from publicly available data or other sources believed to be reliable but do not represent that it is accurate or
complete and it should not be relied on as such. Firstcall India Equity Advisors Pvt. Ltd. or any of it’s affiliates shall
not be in any way responsible for any loss or damage that may arise to any person from any inadvertent error in the
information contained in this report. This document is provide for assistance only and is not intended to be and must
not alone be taken as the basis for an investment decision.

Firstcall India Equity Research: Email – [email protected]
C.V.S.L.Kameswari Pharma
U. Janaki Rao Capital Goods
B. Anil Kumar Auto, IT & FMCG
M. Vinayak Rao Diversified
C. Bhagya Lakshmi Diversified
B. Vasanthi Diversified
Firstcall India also provides
Firstcall India Equity Advisors Pvt.Ltd focuses on, IPO’s, QIP’s, F.P.O’s,Takeover
Offers, Offer for Sale and Buy Back Offerings.
Corporate Finance Offerings include Foreign Currency Loan Syndications,
Placement of Equity / Debt with multilateral organizations, Short Term Funds
Management Debt & Equity, Working Capital Limits, Equity & Debt
Syndications and Structured Deals.
Corporate Advisory Offerings include Mergers & Acquisitions(domestic and
cross-border), divestitures, spin-offs, valuation of business, corporate
restructuring-Capital and Debt, Turnkey Corporate Revival – Planning &
Execution, Project Financing, Venture capital, Private Equity and Financial
Joint Ventures
Firstcall India also provides Financial Advisory services with respect to raising
of capital through FCCBs, GDRs, ADRs and listing of the same on International
Stock Exchanges namely AIMs, Luxembourg, Singapore Stock Exchanges and
other international stock exchanges.
For Further Details Contact:
3rd Floor,Sankalp,The Bureau,Dr.R.C.Marg,Chembur,Mumbai 400 071
Tel. : 022-2527 2510/2527 6077/25276089 Telefax : 022-25276089
E-mail: [email protected]
www.firstcallindiaequity.com