Embed Size (px)
Citation preview

Clinical Quality and Safety Report 2015/16
Report to Trust Board
1 September 2016
Report Title Clinical Quality and Safety Annual Report
Report from Declan Flanagan, Tracy Luckett, Ian Tombleson
Prepared by Editor: Ian Tombleson
Peter Addison, Trust Clinical Audit lead Kaajal Chotai, Head of Compliance Andy Dwyer, Head of Clinical Governance Declan Flanagan, Medical Director Niaz Islam, Trust Clinical Patient Safety Lead Carole Kibble, Clinical Audit Facilitator Tracy Luckett, Director of Nursing and Allied Health Professions Sumithra Maheswara, Associate Chief Pharmacist Julie Nott, Head of Risk and Safety Remi Ogbe, Head of Information Governance Vanessa Sharman, Quality and Operations Manager, Moorfields Dubai Ian Tombleson, Director of Corporate Governance Catherine Wagland, Infection Control Matron Tim Withers, Patient Experience Manager
State impact on CQC domain
(if applicable)
All
State impact on corporate
priorities
Delivering the highest standards of patient experience, outcomes and safety across all our sites
List of attached appendices
(if applicable)
Brief Summary of Report
This report provides the Board with an overview of the clinical quality and safety activities and performance of the organisation during 2015/16. It has been considered by the Management Executive and Trust Management Board. The report is organised under the three Darzi headings of patient safety, patient experience and clinical effectiveness. Going forwards this report will be produced on a six monthly basis. There is an executive summary in section 1 which will be revised in the next report to draw out the main points more clearly. A brief presentation will highlight key focus areas. Moorfields continues to build on using quality and safety information to learn and improve quality within the organisation.
Action Required/Recommendation
For discussion and comment.
Item 8

Clinical Quality and Safety Performance Report 2015/6
Page 2 of 61
1. Executive Summary
This report covers many aspects of quality and safety activity at Moorfields during
2015/16. It is useful to read it alongside Moorfields’ Quality Account 2015/16 which
reports on a number of specific quality and safety objectives and sets out improvement
targets for 2016/17. Moorfields has been active in its efforts to ensure quality and safety
of care are constantly improved and an enormous amount of work continues.
The maturity of incident reporting has grown substantially over the past few years and
the number of incidents reported was at a benchmarked high for 2014/15. The challenge
continues to use the data and information to learn and improve services. In doing so,
this will also improves individual experiences for patients, carers and staff. The targeted
use of data and information, and systems developments including better use of
information technology (as referred to in this report) and the continued devolution of
local responsibility will all support this.
Outcomes for care remain good and we have started submitting cataract outcome data
electronically via OpenEyes to the Royal College National Cataract Audit. However
Moorfields has aspirations to set higher standards and increase the number and breadth
of its already broad suite of outcomes.
Our patients feedback that generally their experiences are good, although there are
number of areas that the trust is aware of that require improvement such as waiting
times, delays to appointments and communications.
Infection levels for many core serious infections remain at zero and endophthalmitis
levels and adenovirus remain better than benchmark performance levels.
The compliance assurance model has progressed well over the previous 18 months and
set in motion the CQC self-declaration process which contributed greatly to Moorfields
preparation for its CQC inspection in May 2016. In addition a number of other
mechanisms for testing quality and safety in the organisation, such as CQC walkabouts,
helped to inform the organisation about standards in services and in the front-line and
also supported preparation for CQC inspection.

Clinical Quality and Safety Performance Report 2015/6
Page 3 of 61
2. Patient Safety
2.1. Incidents, duty of candour and claims
i. Serious Incidents (SIs) including Never Events (NEs)
Moorfields aims to minimise the number of SIs occurring each year. In 2015/16 a total of 10 SIs were reported, 1 of which was a NE. This number is five less than in 2014/15 and one less than 2013/14. 10 SIs is the lowest in the five year period (the same as 2011/12). The Never Event was the reoccurrence of a further incorrect intraocular lens insertion. A summary of each of the 10 SIs is provided below: Q1 15/16
Unfiled clinical documentation (glaucoma office, City Road) A large quantity of unfiled clinical documentation (3717 items) was found in the glaucoma department’s office at City Road. These documents were stored in inappropriate locations and had not been correctly processed (filed). The documents found, which were dated between 2002 and 2015, consisted of a combination of referral letters, pathology results, un-actioned outcomes forms and correspondence from internal and external organisations.
Q2 15/16
Inappropriate access to a clinical system (City Road) A member of staff, who had authorised access to PAS, was found to have undertaken unauthorised searches of patient information.
Delay in sending an application for Eylea therapy (City Road) An application for Eylea therapy was created on OpenEyes, but it was not submitted until almost 3 months later. There was a delay in the patient receiving their first injection.

Clinical Quality and Safety Performance Report 2015/6
Page 4 of 61
Delay in detecting the extraocular spread of a lesion (City Road) A patient attended an outpatient appointment at the Bart’s ocular oncology clinic hosted at Moorfields City Road. An ultrasound report described the patient’s nasal choroidal lesion as “stable” and a 6-month follow-up appointment was requested. The patient did not attend (DNA) that appointment and a 4-month appointment was scheduled. Prior to the re-scheduled appointment the patient experienced worsening symptoms and review of the “stable” ultrasound revealed that it had been misreported and showed extraocular spread of the lesion. Q3 15/16
Delay in the diagnosis of endogenous endophthalmitis (City Road) A patient presented at A&E with a history of anterior uveitis. 4 days after initial presentation a diagnosis of presumed endogenous endophthalmitis was made.
Assessment of mental capacity (Whittington) A robust assessment of a patient’s mental capacity was not undertaken, despite a previous history of dementia having been recorded.
Primary care referral failure (City Road) A patient who was seen in a primary care clinic did not have a direct referral to the glaucoma service, which resulted in a delay in diagnosis and treatment.
NEVER EVENT insertion of the incorrect intraocular lens (IOL) (St Ann’s) A patient received the incorrect strength of IOLs. This was largely a consequence of a failure to explicitly identify that a toric (a special lens to correct astigmatism) IOL calculation sheet had been superseded by a new calculation. Q4 15/16
Delay in the diagnosis of acanthamoeba keratitis (City Road) Delay in diagnosing and treating acanthamoeba keratitis.
Corneal melting or delayed recovery with prolonged epitheliopathy following routine cataract surgery
At least 13 patients were identified as having suffered from corneal melting or having had a delayed recovery with prolonged epitheliopathy following routine cataract surgery. This is presumed to be as a consequence of the use of a combination of drops post-operatively. The investigation report is not yet complete, although all necessary action has been taken. ii. All incidents
The table below shows the number of incidents that have been reported in previous years and in each quarter of 2015/16. 6202 incidents were reported in the whole of 2015/16, which is slightly lower than the 6588 incidents reported in 2014/15. At the time of this report, in mid-August, in excess of 2200 incidents have been reported. If reporting continues at the same rate over the next 3 quarters, the annual number of reported incidents will exceed the highest ever annual reporting total of 6592.

Clinical Quality and Safety Performance Report 2015/6
Page 5 of 61
Indicators 12/13 13/14 14/15
15/16
YTD
Q1 Q2 Q3 Q4
Patient
Safety
Incident
(PSI)
1204 3443 6186 1262 1293 1309 1499 5355
Non-PSI 288 326 400 103 127 136 102 468
Incidents in
the web-
holding file1
0 0 6 13 26 87 264 390
Total
incidents 1492 3769 6592 1378 1446 1532 1865 6221
Serious
incidents
(SIs)
12 9 10 1 3 3 2 9
Never
events
(NEs)
2 2 6 0 0 1 0 1
The total number of incidents reported per quarter, including those in the web-holding file, is shown graphically below:
1 A completed incident form is submitted to the web-holding file (WHF) in the first instance. It remains in
the WHF until such time that the investigation is complete and the manager closes the incident. At the point at which it is merged into the ‘live’ file, the Risk & Safety department performs a data quality check. Incidents in the WHF have not been submitted to the National Reporting and Learning Service (NRLS) unless an SI/NE. The data in the table is correct as on 11
th August 2016

Clinical Quality and Safety Performance Report 2015/6
Page 6 of 61
On 11th August 2016, the date on which the incident data was extracted, there were 398 incidents in the WHF that were incidents with an incident date of between 1st April 2015 and 31st March 2016. The directorates to which the incidents were assigned are shown in the chart below, along with the number of incidents per quarter that remain open.
Information of note is as below:
Clinical directorates, as expected, have the highest number of incidents in the WHF, because they are the highest reporters of incidents. However, the North Directorate (including the East, West and Bedford) has only 2 incidents in the WHF relating to 2015/16 which demonstrates very good management of the incident process;
Incid
en
ts r
ep
ort
ed
pe
r q
uart
er
Nu
mb
er
of
incid
en
ts in
th
e W
HF

Clinical Quality and Safety Performance Report 2015/6
Page 7 of 61
Approximately 90% of the surgical services incidents that remain open, across the whole 12 months, are health record related and the Risk & Safety department has recently provided assistance with the closure of some of those;
The Moorfields South open incidents show a much broader spectrum of incident type compared with Surgical Services. This directorate also received assistance from the Risk & Safety department with the closure of incidents;
Approximately 65% of the Outpatient & Diagnostic Services incidents relate to health records;
The Risk & Safety department closed approximately 600 incidents (12% of the total number reported) that occurred between 1st April 2015 and 31st March 2016. The incident process should be locally owned therefore directorates are strongly encouraged local closure with minimal support from the Risk & Safety department.
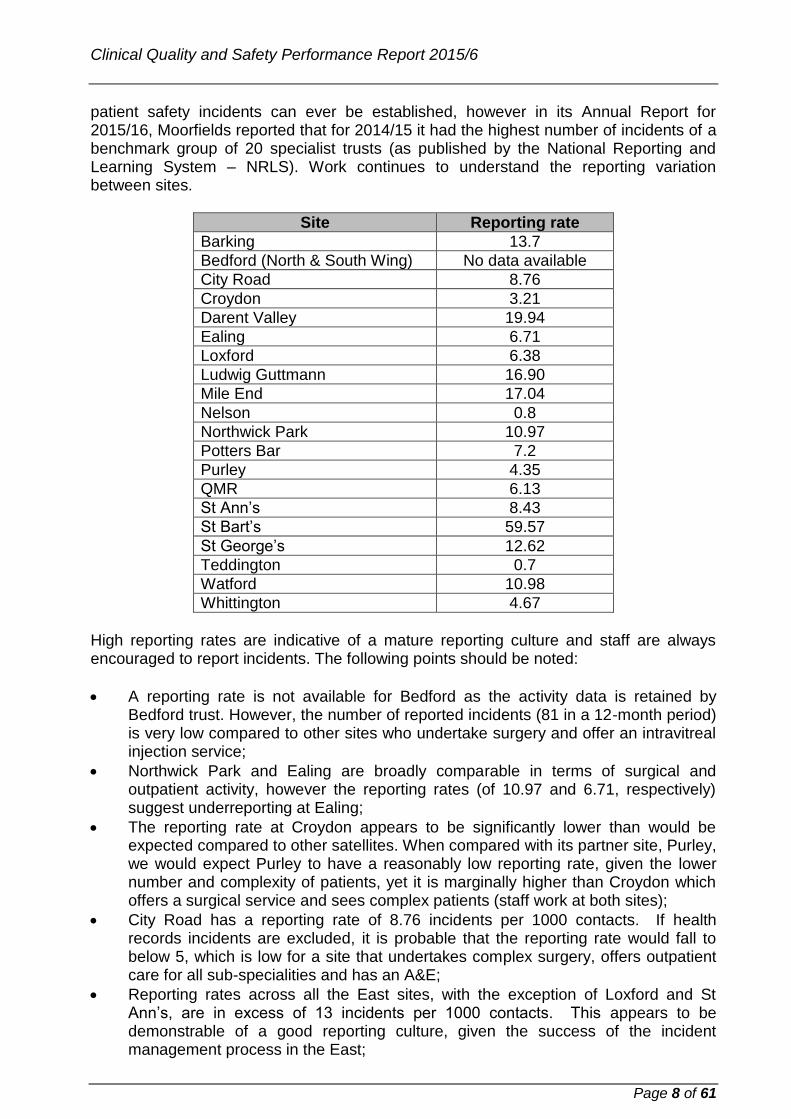
Incident reporting by site, for the 12 month period of 2015/16 is shown in the chart below. Only incidents in the ‘live’ file are included within the chart (i.e. 398 incidents in the WHF have been excluded):
2015/16 incident reporting rates (per 1000 contacts) for each site are set out in the table below. Where a reporting rate is zero this has not been included. In terms of a benchmark, the NRLS has stated that it is very unlikely a ‘correct’ level of reporting of
Clinical Quality and Safety Performance Report 2015/6
Page 8 of 61
patient safety incidents can ever be established, however in its Annual Report for 2015/16, Moorfields reported that for 2014/15 it had the highest number of incidents of a benchmark group of 20 specialist trusts (as published by the National Reporting and Learning System – NRLS). Work continues to understand the reporting variation between sites.
Site Reporting rate
Barking 13.7
Bedford (North & South Wing) No data available
City Road 8.76
Croydon 3.21
Darent Valley 19.94
Ealing 6.71
Loxford 6.38
Ludwig Guttmann 16.90
Mile End 17.04
Nelson 0.8
Northwick Park 10.97
Potters Bar 7.2
Purley 4.35
QMR 6.13
St Ann’s 8.43
St Bart’s 59.57
St George’s 12.62
Teddington 0.7
Watford 10.98
Whittington 4.67
High reporting rates are indicative of a mature reporting culture and staff are always encouraged to report incidents. The following points should be noted:
A reporting rate is not available for Bedford as the activity data is retained by Bedford trust. However, the number of reported incidents (81 in a 12-month period) is very low compared to other sites who undertake surgery and offer an intravitreal injection service;
Northwick Park and Ealing are broadly comparable in terms of surgical and outpatient activity, however the reporting rates (of 10.97 and 6.71, respectively) suggest underreporting at Ealing;
The reporting rate at Croydon appears to be significantly lower than would be expected compared to other satellites. When compared with its partner site, Purley, we would expect Purley to have a reasonably low reporting rate, given the lower number and complexity of patients, yet it is marginally higher than Croydon which offers a surgical service and sees complex patients (staff work at both sites);
City Road has a reporting rate of 8.76 incidents per 1000 contacts. If health records incidents are excluded, it is probable that the reporting rate would fall to below 5, which is low for a site that undertakes complex surgery, offers outpatient care for all sub-specialities and has an A&E;
Reporting rates across all the East sites, with the exception of Loxford and St Ann’s, are in excess of 13 incidents per 1000 contacts. This appears to be demonstrable of a good reporting culture, given the success of the incident management process in the East;

Clinical Quality and Safety Performance Report 2015/6
Page 9 of 61
The difference in reporting rates for Mile End and Potters Bar is of note; it is expected that Potters Bar should be higher.
Review of the 5823 incidents in the live file gives the following headlines:
A number of reported incidents highlight weaknesses in processes associated with the booking and management of outpatient and surgical appointments. This was previously highlighted in the Q4 2014/15 & Q1 2015/16 report. Some of the more frequently reported incidents are described below: o Appointments booked in the wrong clinic. These incidents were most
prevalent at City Road and St George’s and applied across the majority of specialties;
o Appointments booked at the wrong interval. The number of incidents reported accounted for approximately 25% of the number of appointments booked in the wrong clinic;
o No appointment booked. 96/122 incidents were reported in relation to City Road activity. Approximately 25% of the incidents originated in A&E;
o Overbooked outpatient clinic. Again this is most prevalent at St George’s and City Road, with 21/45 and 20/45 incidents being reported, respectively;
o Patient attended cancelled appointment. 50% of the 29 reported incidents occurred at Mile End and 12 of the 14 related to the glaucoma service.
Issues with referrals are also a feature of the 2015/16 data. Again, this was previously highlighted in the Q4 2014/15 & Q1 2015/16 report. It is clear that use of the ‘referral’ cause codes is not consistent, with incidents sometimes being wrongly classified as a misfiled referral letter when the letter has not been filed in a health record and has actually been misplaced in a bundle of papers. Two of the more frequently reported incidents are described below: o 59 of the 80 incidents classified as ‘referral – failure’ were logged in relation to
activity at City Road and covered all sub-specialties. The majority of the incidents are a consequence of the paper-based referral system;
o 77 incidents were recorded under the category ‘referral letter – misfiled’ and 61 of these were recorded under City Road. As already mentioned, incidents such as referral letters being ‘buried’ under other paperwork and letters not being received in the booking centre until a number of months later, are included, as are urgent referrals being missed, because they have been put aside for scrutiny by the wrong service.
Resuscitation incidents, including unplanned transfers, account for approximately 5% of the incidents in the live file. Two examples include: o There were 100 ‘resus – unplanned transfer (2222 call)’ incidents recorded
(i.e. a patient has been transferred to another hospital because of a medical emergency);
o 14 incidents were recorded as ‘resus – unplanned transfer (from other Trust) because a patient has been inappropriately transferred from another hospital to a Moorfields site. 11/14 patients arrived, unexpectedly, in A&E at City Road. A number of the referrers have been contacted by the medical director, or a senior colleague, to discuss the risks associated with the transfers;

Clinical Quality and Safety Performance Report 2015/6
Page 10 of 61
o 105 incidents were recorded as ‘resus – unplanned transfer (walk-in). 87% of these incidents were recorded at City Road, with 80% relating to A&E. These 105 patients are patients who have attended Moorfields for an appointment, or who have walked in from the street because they feel unwell, and who have been transferred to another hospital because more specialist investigation is required (e.g. a patient attended A&E with sudden onset of diplopia and dilated right pupil. He was diagnosed as having a 3rd cranial nerve palsy and was transferred by blue light ambulance to a general A&E for further investigation and treatment);
Medication incidents, recorded as both drug errors (i.e. those that are reported locally by clinicians when an error has been detected) and pharmacy interventions (i.e. those that are reported when a pharmacist intervenes and prevents the incorrect dose from being dispensed, for example) are discussed further in the ‘medicines management’ section of this report;
193 medical device incidents are included in the live file for the 12-month period:
o 81 device errors were reported across 13 different sites. 44% of the incidents occurred at City Road across a number of services;
o In 26 cases the preferred device was reported as not being available. Again these incidents were reported by a number of services across a number of different sites;
o In 35 cases a user error was reported. These incidents include cases where a piece of equipment has been damaged (e.g. because it has been left switched on) or broken (e.g. because it has been dropped);
59 patient falls were reported; in 25 of these cases a patient either slipped or tripped whilst they were on the same level (i.e. on the floor and not walking up or down stairs). There were 16 faints or collapses reported as well as a number of falls from a small height.
101 incidents were reported because staff were concerned regarding the level of staffing in a ward/department. 46 of the incidents were reported at Darent Valley;
Health records incidents continue to account for a large proportion of the incidents reported, with approximately 42% of the incidents in the live file being health record related in addition to over 60% of the incidents in the WHF. More detailed analysis is required to fully understand the status in relation to previous data;
The Trust continues to develop and enhance mechanisms through which it learns from incidents and, importantly, near misses. The following is a non-exhaustive list of some of the more embedded mechanisms, along with identification of where further improvements could be made:
o Aggregate incident, complaints and claims data report: this report is produced 6-monthly by the Head of Risk & Safety. In addition to considering 3 data sets together, it also seeks to highlight where aggregate review of the data indicates particular themes, trends or risk areas. The primary limitation of this report is the delay in its production, given the interrelation with other reports (e.g. the quarterly compliments and complaints report, the NHSLA claims

Clinical Quality and Safety Performance Report 2015/6
Page 11 of 61
scorecards). Also the desire to wait until the NRLS 6-monthly incident submission deadline has passed, as it means that more incidents will be in the ‘live’ file and therefore available for more detailed interrogation;
o Weekly incident meeting (SI panel): a number of incidents (and complaints and claims) are selected for review by a multi-disciplinary panel at a weekly meeting. This selection may be made for a number of reasons but may be because an incident has the potential to be an SI, because it is likely to have the potential for widespread learning, or because of the potential for it to develop into a complaint or a claim. The role and performance of this panel will be the subject of a formal review to be completed by the Head of Risk & Safety during Q3 2016/17;
o Clinical governance half days: in addition to the service/site specific incidents that are considered at each meeting, a number of incidents are selected by the quality team for review at some/all of the sessions. The requirement for review may have been identified in an SI action plan, for example, or there may be an instruction from the Medical Director;
o Service business/training meetings: as above; o Ward/department meetings: local discussion is an effective way to learn from
incidents and this should be further encouraged and promoted; o Feedback to individuals: managers are required to provide feedback to staff
following incidents and one mechanism for doing so, in addition to verbally, is via the e-reporting system. Staff do not get feedback via the system until incidents are closed and this is one of the reasons that managers should strive to investigate and close incidents within the 4 week period specified within the incident reporting policy. As already mentioned more improvement is required. Encouraging the continuing change in culture required to achieve this will remain a key focus of the Risk & Safety team for 2016/17.
ii Duty of Candour (DOC) The aim of the DOC is to be transparent with patients in a clear and timely way when things go wrong. The e-reporting system incorporates functionality to record information for the different stages of the DOC requirements. Specifically it permits the reporter to record the following information as part of the incident report:
That the relevant person has been contacted (by whom, when and the explanation given): o Was an apology given? o Was all information shared? o Was advice given on action? o Was support given?
Whether a written explanation was given, and if no why not?
Whether a copy of a copy of the investigation report was sent, and if not why not? The DOC functionality is automatically enabled, and becomes a mandatory field, when the reporter records that the incident has resulted in moderate or above harm and allocates a cause that is mapped to the NRLS, i.e. a patient safety incident. It is not anticipated that a written response should be sent to a patient following a recognised complication of surgery, or a procedure (e.g. dropped nucleus, endophthalmitis), however patients should receive a verbal apology, information regarding the event and details of the proposed action to be taken.

Clinical Quality and Safety Performance Report 2015/6
Page 12 of 61
Compliance for 2015/16 with DOC requirements is shown below. The data has been divided into 2 sections to differentiate between SIs and other incidents. Data in relation to complications has not been included on this occasion as further work is required to both understand and validate the data. Prolonged psychological harm and death have been excluded from the report as neither has occurred during the reporting period.
Incidents (excluding SIs & NEs)
Initial "being open" disclosure* Moderate Major
Total number of patient safety incidents (excluding complications) reported during the reporting period
12 2
Stage
1a Number of conversations informing family/carer that a patient safety incident has occurred within 10 working days of the incident being reported to local risk management systems
11 1
1b % of "being open" conversation taken place in time 92% 50%
1c Number of conversations informing family/carer that a patient safety incident has occurred after 10 working days of the incident being reported to local risk management systems
0 1
1d Duty of candour status to be verified 1 0
1e % of "being open" conversation taken place in total 92% 100%

Clinical Quality and Safety Performance Report 2015/6
Page 13 of 61
SIs/NEs (declared during 2015/16 – the incident date may be pre-April 2015)
Initial "being open" disclosure* Moderate Major
Total number of patient safety incidents (excluding complications) reported during the reporting period
11 10
Stage
1a Number of conversations informing family/carer that a patient safety incident has occurred within 10 working days of the incident being reported to local risk management systems
3 2
1b % of "being open" conversation taken place in time 27% 20%
1c Number of conversations informing family/carer that a patient safety incident has occurred after 10 working days of the incident being reported to local risk management systems
8 7
1d Duty of candour status to be verified 0 1
1e % of "being open" conversation taken place in total 100% 90%
The Trust continues to strive to fulfil the DOC requirements. The requirements are not
yet fully embedded and further work to achieve full compliance and more importantly a
complete ‘culture of candour’ is required. Mechanisms for improvement are being
considered by the Head of Clinical Governance and the Head of Risk & Safety. This is
in addition to the supporting functionality within the e-reporting system, which has
already been implemented.
iii. Claims and Litigation The NHSLA was notified of claims relating to Moorfields as detailed below:
Claim type Number of new claims advised
2013/14
Number of new claims advised
2014/15
Number of new claims advised
2015/16
CNST (clinical negligence)
7 12 11
Personal injury (Liability to Third Parties Scheme – LTPS)
4 1 4
Total 11 13 15
An overview of the claims for 2015/16 is provided below, along with identification of
whether or not an associated incident was recorded.

Clinical Quality and Safety Performance Report 2015/6
Page 14 of 61
Reference Claim Reported
as an incident
Status (as at 16th May 2016)
Q1 15/16 CNST1
Patient attended hospital for regular botulinum toxin injections for treatment of facial palsy - alleged that the dosage of botox was excessive and caused eyelid palsy
No Closed – nil damages (closed)
Q1 15/16 LTPS1
Alleged that a porter pushing a wheelchair collided with the claimant, who sustained injury
Yes Letter of response – admission (open)
Q1 15/16 LTPS2
Claimant tripped over files left on the floor Yes Damages agreed (out of court) (open)
Q2 15/16 CNST2
Alleged failure to correctly diagnose and treat eye condition resulting in retinal detachment and loss of vision
No Letter of response – admission (open)
Q2 15/16 CNST3
Cataract surgery performed on with poor visual outcome
No Letter of claim received (open)
Q2 15/16 CNST4
Alleged failure to arrange follow up appointments for corneal clinic led to worsening of kerataconus and significant loss of vision
No Letter of response – repudiated (open)
Q3 15/16 LTPS3
Alleged slip on a wet floor Yes Closed – nil damages (closed)
Q4 15/16 CNST5
The patient was given a botox injection into the left lateral and inferior rectus (left eye). the patient presented to A&E with a perforated globe
Yes Closed – nil damages (closed)
Q4 15/16 CNST6
It is alleged that the ophthalmic treatment received by the claimant was negligent (delayed vitrectomy and injection of the tissue plasminogen activator) resulting in reduced vision
No Letter of claim received (open)
Q4 15/16 CNST7
Negligent period of delay in diagnosing glaucoma caused impairment of vision
Yes Letter of response – admission (open)
Q4 15/16 CNST8
Alleged negligence from delayed diagnosis of choroidal neovascularisation resulting in loss of central vision in right eye
No Letter of response – repudiated (open)
Q4 15/16 CNST9
Alleged that patient has been left with visual deterioration and left sided weakness as a result of inadequate treatment and lack of follow up appointments
No Letter before action and defence solicitor instructed (incident)
Q4 15/16 CNST10
Alleged that the referral for ophthalmic treatment was not treated urgently and the patient lost the opportunity to receive timely diagnosis and treatment
No Letter of claim received (open)
Q4 15/16 CNST11
Negligently performed surgery to left eye caused loss of vision in left eye
Yes Letter before action - no defence solicitor (incident)
Q4 15/16 LTPS4
Alleged trip on a step Yes Portal – exit (open)
Although claims do not necessarily indicate poor practice or negligence, the analysis of claims for learning and improvement remains an area in which improvement can be made and a meeting with the trust legal team is planned to consider how better to do

Clinical Quality and Safety Performance Report 2015/6
Page 15 of 61
this. A detailed analysis of both CNST and LTPS claims, as informed by both NHSLA claims scorecards, was included within an aggregate data report covering the period 1st October 2014 to 30th September 2015.
iv. Alerts
Indicators 12/13 13/14 14/15
15/16
YTD
Q1 Q2 Q3 Q4
Number of alerts
received2 92 182 129 15 35 32 15 97
Acknowledged
within deadline 90 149 113 8 34 27 9 78
(80%)
Number of alerts
closed within
specified timescale
84 166 113 10 33 29 14 86
(89%)
Number of alerts
issued for which
action required
10 19 14 5 2 4 1 12
(12%)
Number of alerts not
signed off (no
breach)
7 2 5 0 1 0 0 1
(1%)
Number of alerts
that breached the
deadline
8 16 16 5 1 3 1 10
(10%)
In previous reports it has been identified that there have been breaches of compliance with the ‘deadline for action’ for a number of alerts. It remains the case that alerts breach because of administrative oversight, or a failure in management response, although there has been an improvement in the last year compared with the previous 2 years. 80% of the 97 alerts received were acknowledged within the deadline. This performance is poorer than 2014/15, when 88% of alerts were acknowledged on time. New mechanisms will be introduced to escalate alerts that might breach to senior managers. Monitoring of this will continue to take place via the relevant risk management committee (e.g. risk & safety, clinical governance, medical devices).
2 Only alerts for which a response is required have been included (i.e. drug alerts, MHRA Dear Doctor
Letters and CMO messaging alerts have been excluded)

Clinical Quality and Safety Performance Report 2015/6
Page 16 of 61
2.3 Infection Control
¹Excludes Bedford cases and Ozurdex implant injections
*CPE (a group of antibiotic resistant bacteria that can cause serious infections) screening began in
October 2014 following ratification of policy. The trust reports suspected (s) cases based on a history of
admission to hospitals abroad within the preceding 12 months with no notification of CPE carriage and
confirmed (c) cases where a patient reports medical notification.
2.3.1 Endophthalmitis surveillance rates
Endophthalmitis surveillance detects patients diagnosed and treated for endophthalmitis
within six weeks of surgery or intraocular procedure.
Indicators 2014/15 Target
Q1
2015/16
Q2 Q3
Q4
YTD
2015/16
C.diff infection 0 0 0 0 0 0 0
MRSA bacteraemia 0 0 0 0 0 0 0
E.Coli bacteraemia 0 0 0 0 0 0 0
MSSA bacteraemia 0 0 0 0 0 0 0
MRSA Screening 100% 100% 100% 100% 100% 100% 100%
Endophthalmitis post cataract1 0.2 0.2 0.2 0.0 0.23 0.20 0.15
Endophthalmitis post intravitreal
Injection1
0.2 0.5 0.17 0.47 0.32 0.42 0.35
Adenovirus possible hospital
acquired 1.3% NA 1.9% 0.9% 0.0% 0.5% 0.82%
CPE screening* 14s
1c NA 9s 4s 5s
5s
1c
23s
1c
Benchmarked
endophthalmitis (post
cataract surgery and
intravitreal injections)
1 x Phaco and IOL at the Whittington Hospital
2 x IV Eylea at St George’s Hospital
1 x Phaco and IOL at City Road
1 x IV Eylea at CR
1 x IV Lucentis at CR
1 x IV Eylea at NWP
1 x IV Lucentis at NWP
1 x IV Eylea at Croydon
Exception reported
cases (outside the six
week timeframe or
Bedford cases)
1 x IV Lucentis at Bedford North
1 x IV Eylea at Bedford North
1 x Phaco and IOL at Bedford South
Non-benchmark
endophthalmitis (all
other cases that fall
within the surveillance
definition)
3 x Bleb related Endo
1 x Injection of gas at St Ann’s
1 x vitrectomy at City Road

Clinical Quality and Safety Performance Report 2015/6
Page 17 of 61
0.00
2.00
4.00
Ap
r-…
Jun
-…
Au
g-…
Oct
-…
De
c-…
Feb
-…
Ap
r-…
Jun
-…
Au
g-…
Oct
-…
De
c-…
Feb
-…
Ap
r-…
Jun
-…
Au
g-…
Oct
-…
De
c-…
Feb
-…
Ap
r-…
Jun
-…
Au
g-…
Oct
-…
De
c-…
Feb
-…
Site Specific - Cataract Endophthalmitis - 6m avg
Threshold City Road Croydon Darent Valley
Ealing Mile End Potters Bar St Georges
Queen Marys St Anns Northwick Park
The total number of endophthalmitis reported (including exception cases) for 2015/16 is 17, this is one
more than last year 2014/15 which was 16.
The above graphs demonstrate that for both cataract and intravitreal procedures no site
within the Trust has breached the expected benchmark, to a statistically significant
degree within, the last 6 months.
2.3.2 Compliance
*Review of audit data identified Q1 slit lamp audit was accounted for in Q4 of 2014/15, therefore only one audit of slit
lamps was undertaken in 2015/16 however there was significant improvement from 70% in 2014/15 .
Indicators 2014/15 Target Q1
Q2 Q3 Q4
YTD
2015/16
Hand hygiene compliance 98% 95% 97% 98% 98% 97.5% 97.4%
Cleanliness inspections 98% 95% 98% 97% 98% 98.5% 98%
Slit lamp audit 84 % 90% * 93% 93%
Policy and Practice compliance 87% 90% 93% 92% 94% 93%

Clinical Quality and Safety Performance Report 2015/6
Page 18 of 61
2.3.3 HSE Sharps Inspection campaign
An inspection by the HSE was undertaken at Moorfields City Road on the 27th May
2015 that resulted in the trust being issued with an Improvement Notice for failing to
implement HSE Regulations. Areas to be addressed included a revision of trust policy
for Sharps Management, trust wide comprehensive risk assessments on the use of
sharps devices and revision of staff training to incorporate the HSE Regulations and
training on safer devices. It was acknowledged that the infection control nurses had
already implemented some safer sharps devices in to the trust and incorporated audit
findings and training measures to raise awareness of practices with staff.
Actions taken by the infection control nurses in response to the improvement notice
have included; developing a new and informative policy on sharps prevention for staff as
well as updating the Sharps Management policy, revising trust training content, including
the new online training packages, resourcing safer devices for clinical leads and
completing phase 2 of the safer devices project for the trust.
2.3.4 Site and service safety
In 2015/16 the trust continued to progress and develop a range of quality and safety
walkabouts (as detailed below) and review processes ensuring that all sites and services
had received a review. This has proved very useful in obtaining feedback from the
organisation about performance with quality standards and has also helped drive quality
improvement.
i) CQC Style Walkabouts
Senior managers, Board members and executive staff accompany quality team staff on
unannounced visits to allow two-way communication between patients and front-line
staff and those at the most senior levels of the trust and to examine fundamental quality
standards.
Following the success of the previous CQC style visits in 2014 the Head of Clinical
Governance developed the process further and in 2015/16 organised visits to Moorfields
at Bedford (North and South sites) and City Road (wards and clinics).
At Bedford, five senior members of Moorfields and two representatives from Islington
and Bedfordshire Clinical Commissioning Groups (CCGs) assisted. Initial feedback was
provided to the Bedford team followed by a full report and grading in the style of CQC.
The Bedford team developed an action plan to address the issues identified in the
feedback which is monitored by the directorate. No major issues of concern were
identified and all involved, from the visiting team to the staff and patients questioned,
enjoyed and appreciated the visit. Themes of space, policy awareness, IT issues,
administrative support and the use of Friends and Family Test cards were identified.
At City Road, seven senior staff from Moorfields including a non-executive director
(NED) and an NED from Islington CCG visited Sedgwick and Mackellar wards, oncology,

Clinical Quality and Safety Performance Report 2015/6
Page 19 of 61
and contact lens and external disease clinics. 13 patients, 2 carers, 17 staff and 4
environment questionnaires were completed. Initial feedback was again given to the
staff on the day and at departmental meetings that followed. No major issues were
identified and due to other trust priorities a full report is yet to be written.
ii) Quality & Safety data reviews The quality team met with site/service leads to discuss and take action about quality and
safety data. Eight quality and safety data reviews took place in 2015/16 with the
clinical/service leads from the Paediatric, and Strabismus Services and the sites of
Bedford, St George’s, Croydon, St Ann’s, Ealing, and Northwick Park and Potters Bar.
Numerous actions were generated from the meetings, many of which have since been
completed.
iii) Mini CQC Style walkabouts
These are small scale versions of the CQC Style walkabouts undertaken by the Quality
and Safety team. In view of the trust developing a programme of smaller peer review
style walkabouts (see below), the Head of Clinical Governance developed a smaller
(mini) walkabout with a limited number of questions for staff and the environment.
Patient questions were not used further to the continued positive feedback that the trust
receives from patients and carers. Mini CQC walkabouts were trialled in Accident and
Emergency at City Road and in private patient areas. Staff were asked to also
demonstrate their knowledge by showing the visiting team how to access and find
information.
Date Walkabout type Area visited
1st May 2015 Quality & Safety data review Paediatrics
15th May 2015 CQC Style Walkabout Bedford
15th May 2015 Quality & Safety data review Bedford
18th May 2015 CQC Style Walkabout Dubai
29th May 2015 Quality & Safety data review St George’s
1st June 2015 Quality & Safety data review Strabismus
2nd June 2015 Quality & Safety data review Croydon
1st July 2015 Quality & Safety data review St Ann’s
10th July 2015 Quality & Safety data review Ealing
18th September 2015
CQC Style Walkabout City Road (clinics and wards)
2nd October 2015 Quality & Safety data review Northwick Park and Potters Bar
11th December 2015 Mini CQC Style Walkabout A&E City Road
11th January 2016 Mini CQC Style Walkabout Private Patients

Clinical Quality and Safety Performance Report 2015/6
Page 20 of 61
iv) Executive Mini Walkabouts Program
A programme of executive led peer reviews using modified questionnaires from the mini
CQC style walkabouts was developed to gather data and expose the executive team to
front-line issues. The programme (see table below) was developed in 5 phases.
Although it was due to be completed during the period 22nd February 2016 to 29th April
2016, the majority of the walkabouts took place in April 2016. These walkabouts were
highly effective in supporting preparation for CQC inspection at front-line level and also
for providing escalations/assurance to Management Executive, TMB and Board. The
summary of outcomes will therefore be discussed in the annual report for 2016-17.
Phase Area to visited Exec Lead
1 City Road - Theatres and Pre-assessment Ian Tombleson
3 City Road – RDCEC Sally Storey
1 City Road – A&E John Quinn
5 City Road – Pharmacy and optometry John Quinn
3 City Road – Mackellar and Sedgwick wards
(plus vitreo retinal emergencies)
Jo Moss
4 City Road - Electro-Diagnostic Department
and Medical photography
Steven Davies
4 City Road - Eye Bank, Ocular Prosthetics
and Orthoptics
Ian Tombleson
2 City Road – Lower ground floor clinics Declan Flanagan
2 City Road –Ground floor clinics Tracy Luckett
5 City Road – Medical records Declan Flanagan
- City Road – Private facilities (inc.
Cumberlege, Arthur Steele, John Saunders
areas)
Bespoke team – not scheduled
1 St George’s John Quinn
3 Croydon Sally Storey
1 Barts Ian Tombleson
2 Northwick Park Tracy Luckett
3 St Ann’s Jo Moss
4 Mile End Steven Davies
2 Bedford Declan Flanagan
4 Darent Valley Ian Tombleson
5 Potters Bar John Quinn
5 Ealing Declan Flanagan
v) Use of global trigger tools (mGTT)
The global trigger tool is a way of searching for adverse events by auditing a small
sample of patient notes regularly. 12 mGTT proposals were registered during 2015-16
and 15 reports were received and reviewed at the Clinical Audit and Assessment
Committee (CAAC). Many projects are currently active and completed reports will follow
over the next months.

Clinical Quality and Safety Performance Report 2015/6
Page 21 of 61
Using the mGTT audit template and guide, nearly all 15 mGTT reports approved
identified some level of risk to the patient, mostly varying from category A risk (capacity
to cause error) to category D risk (error reached patient requiring additional visits,
monitoring or treatment). Actions from risks included reminders and extra education for
staff groups, and the review and development of procedural documents and changes to
processes and pathways.
Where issues are identified as having the potential to cause harm to patients, reviewers
are asked to complete incident reports to help triangulate data. Although the grading of
risk to patients is a little subjective, it allows the auditors and their services to reflect on
what makes good practice and encourages the drive to achieve this.
Site/service Annual Target
2015-16
Proposals Reports Site/service
Target
Proposals
Reports
A&E 2 1 Bedford 2 2
Adnexal 2 1 1 City Road 2 6 6
Anaesthetics Croydon 2 2 1
Cataract 2 Dubai 1
Corneal / External 2 Ealing 2 1
General Ophthalmology/primary care
2 3 3 Harlow 1
Glaucoma 2 1 1 Loxford 1 1 1
Medical Retina 2 1 3 Mile End 2
Neuro, Strabs, Paeds (NSP)
2 4 4 NWP 2 2 2
Optometry Potters Bar 2
Orthoptics 1 St Ann’s 2 1
Trust-wide (inc. Nursing)
1 St Georges 2 1
Vitreo Retinal 2 Stratford 1
Upney Lane 1 1
2.4. Information governance (IG)
During 2015/16, there were 111 IG related incidents, with one reported to the Information Commissioner’s Office (ICO) via the HSCIC Information Governance Toolkit (IGT). The incident related to a member of staff accessing information inappropriately, which led to their dismissal. A number of incidents involved disclosures made in error, where clinical correspondence was sent to the wrong patient. Other incidents involved paper-based information left in public areas in the Trust. At the end of March 2016, the Trust met the IG training compliance level. Although the level achieved was 94% (out of a target of 95%) this was agreed as sufficient to achieve level 2 of toolkit requirement 112, due to a few anomalies in the learning and development system (Insight), where staff had completed their training, but with their records not reflecting this immediately and the system catching up shortly after. The IG team continues to offer face-to-face role-specific IG training sessions across the trust

Clinical Quality and Safety Performance Report 2015/6
Page 22 of 61
including medical inductions, volunteers, catering and governors and will continue to offer training at clinical governance half day sessions. In 2015/16 the team commenced a detailed review of the IGT evidence base to ensure its robustness. This enabled the Trust to submit a score of 75% in March 2016, which was a satisfactory submission. In February 2016, the trust moved to compliance with the cabinet office’s mandate to lockdown USB ports to mitigate data loss. Staff are now restricted from copying trust information on to non-trust supplied encrypted USB memory sticks and other removable storage devices. The trust received 402 Freedom of Information Act requests in 2015/16. Requests came from a wide variety of sources, including, journalists, solicitors, charities, students, limited companies, universities and, recruitment agencies. Requests were wide-ranging in terms of content and complexity, many of these requests required information from several different departments/services within the Trust. This year’s junior doctors’ dispute attracted a high number of requests. During this period, the IG team undertook spot checks across all sites. The main area of concern was the amount of patient information accessible in reception areas. When drawn to their attention, this was addressed swiftly by service managers. The trust has also seen the introduction of trolley covers for health records in clinics and during transit. Accessible information standard: The Accessible Information Standard directs and defines a specific, consistent approach to identifying, recording, flagging, sharing and meeting the information and communication needs of patients, service users, carers and parents, where those needs relate to disability, impairment or sensory loss. By 1 April 2016 all organisations that provide NHS or publicly funded adult social care must identify and record information and communication needs with service users, ‘At the first interaction or registration with their service as part of on-going routine interaction with the service by existing service users’. It is of particular relevance to support the needs of individuals who are blind, deaf, deaf/blind and/or who have a learning disability, although it will support anyone with information or communication needs relating to a disability, impairment or sensory loss, for example people who have aphasia, autism or a mental health condition which affects their ability to communicate. Information Governance forms part of the project implementation team with the remit to ensure compliance with information management legislation, which collecting, using and sharing this information.
2.5. Medication safety
There were 521 medication related incidents reported in FY2014/15 and 734 in FY2015/16 and the graph below shows the causes.

Clinical Quality and Safety Performance Report 2015/6
Page 23 of 61
The actual impacts of incidents are shown below.
Overall there was an increase in incidents reported for each category in 2015/16. This is likely to be due to the positive impact of various Medicine Safety News bulletins and email reminders to all staff, reminding them to complete incident forms. During 2015/16, incidents in the category of ‘incorrect patient’ dropped significantly across the months, particularly in the final quarter. An OpenEyes prescribing module update was integral to this change. There are occasions where patient records are not being closed before creating a new prescription event for the next patient. This causes

Clinical Quality and Safety Performance Report 2015/6
Page 24 of 61
significant issues for a number of groups and departments especially the pharmacy department, as the department was often presented with a prescription for the wrong patient as a result. The OpenEyes prescribing module was updated to ensure that if a second prescription event is created for the same patient, on the same day, by the same firm, a warning pop-up will be shown when the event screen opens. The majority of ‘near miss’ incidents were identified in pharmacy at the screening process therefore preventing the prescription being handed out to the patient. The ‘no harm category’ incidents were related to stock control or adverse drug reactions. The latter was also the cause for the majority of moderate and major incidents. The presenting nature of the adverse reaction and outcome for the adverse reactions were responsible for the incident grading. Legislative changes to prescription writing requirements for temazepam In July 2015, legislation changes occurred which removed the previous exemptions applicable to prescriptions for temazepam, a schedule 3 Controlled Drug. Temazepam prescriptions must now follow the same prescription requirements as for all other Schedule 2 & 3 Controlled Drugs, this would mean for the prescriber to ensure prescriptions for temazepam contain the: dose, form, strength (where appropriate) and total quantity of the preparation in both words and figures. High strength, fixed combination and biosimilar insulin products: minimising the risk of medication error The Medication safety group raised awareness that several high strength insulin products are now on the market bringing with them a risk of medication error. These products were developed for patients with large daily insulin requirements to reduce the number and volume of injections. Several preparations are in strengths higher than the standard 100units/ml. It was felt the Trust may see some patients who are on these products especially when admitted to one of our in-patient wards e.g. Duke Elder or Observation Ward. Corneal melts The incident reports described cases in which patients have suffered severe corneal melting following the combined use of two eye drops after routine cataract surgery and as a result an SI occurred (see page 4 of this report). The MHRA and relevant drug manufacturers were informed. Incident numbers The majority of the reported incidents during this reporting period were ‘near miss’ where the pharmacists intervened at the prescription screening process. However there were also major and moderate incidents reported. The graph below shows all medication incident categories for the full year ending 2015/16.

Clinical Quality and Safety Performance Report 2015/6
Page 25 of 61
Medicines Alerts There were thirteen drug alerts via the central alerting system over this period, two of which involved a medicine brand used at Moorfields. All actions were completed within the time frame. Medication safety Thermometer summary Following on from the previous year, we have used the NHS medication safety thermometer tool over the past year to measure medication errors and harm from errors which can identify the level of harm free care we provide in relation to medicines on a monthly basis. Below are the records from the medication dashboard for Moorfields, showing the level of harm free care we provide relating to the reconciliation of medicines, allergy status, and high risk medicines e.g. warfarin and insulin. There were no medication omissions or critical medicine omissions during the data collection periods, and this has not changed from our position last year. The Trust maintained 100% of patient with reconciliation started within 24 hours. The allergy status recording has improved significantly over the reporting period.

Clinical Quality and Safety Performance Report 2015/6
Page 26 of 61
Medications Dashboard (Data source: NHS Quality Observatory, NHS QUEST 2013)
Proportion of patients with reconciliation started within 24 hours
Proportion of patients with medicine allergy status documented
Medicines security audit
In March 2016, a trust-wide audit on the safe storage and secure handling of medicines was conducted. The data from that audit was fully verified with section leads and clinical area managers in April 2016. Sixty-seven standards within thirteen categories were audited. The standards and resultant audit tool were developed from the East and South East England Specialist Pharmacy Services audit tool and 2012 MEH audit tool, (local policies and the Duthie report March 2005).

Clinical Quality and Safety Performance Report 2015/6
Page 27 of 61
1. Access to information, including policies 2. Supplies and ordering of pharmaceuticals 3. Storage and security arrangements of controlled drugs (CDs) 4. Storage and security arrangements where medicines cupboards are located 5. Refrigerators & freezers 6. Flammables 7. Cytotoxic medicines 8. Keys 9. Waste medicine arrangements 10. Security of FP10 & Moorfields prescriptions 11. Patient’s Own Drugs (PODs) 12. Gas Cylinders 13. Supply of Medicines by Nurse The following are the grades for compliance used in the medicine security audits: 85% or above = GREEN = Good compliance 84% to 56% = AMBER = Improvement on certain standards required 55% or below = RED = immediate, wide scale action require * Ratings set and agreed by the pharmacy department The 2015 audit was an interim audit where selected standards were audited by the pharmacy. The 2016 audit is a full audit with all standards in all sections being audited. Furthermore, the 2016 audit includes all areas of City Road including Private Patients. The compliance on medicines security in audits over time are:
2012 Audit: 83% 2013/2014 Audit: 86% 2015 Interim Audit: 93% 2016 Audit: 92%
2016: Out of the 83 areas within the Trust, 84% (n=70) of all sites recorded an average compliance of 85% or more. 2015: Out of the 64 areas within the Trust, 88% (n=56) of all sites recorded an average compliance of 85% or more. 2013/14: Out of the 65 areas within the Trust, 62% (n=40) of all sites recorded an average compliance of 85% or more. 2012: Out of the 49 areas within the Trust, 73% (n=36) of all sites recorded an average compliance of 85% or more. The Trust achieved a GREEN RAG rating of average overall compliance in the 2016 audit of 92%. (Please note in July 2016: A post audit publication review has occurred; the pharmacy department has reviewed the level of risk for each area and has produced an addendum summary of the key risks that have been identified in the audit. Key risks are those that require special attention and prompt resolution if feasible. For example: On Observation Ward, the CD cupboard was replaced by a steel constructed cupboard which meets standards set out in the CD policy). Medicines management and clinical audits Audits that were conducted during this report period include:

Clinical Quality and Safety Performance Report 2015/6
Page 28 of 61
Repeat Prescribing of Ocular Lubricants in A&E Patients are instructed to visit their GP in order to continue using lubricating eye drops or ointment once the supply made by the hospital has finished, however a number of patients visit A&E to see a doctor for a repeat prescription. Attending to patients with dry eye syndrome who have come to A&E solely for the purpose of obtaining a repeat prescription for lubricants wastes valuable resources that could be used on patients with more urgent cases. Such issues can be addressed by advising patients about how they can obtain a repeat prescription, for example, from their GP or through the use of the new A&E prescriptions. This retrospective audit assessed the current numbers of patients attending A&E solely for lubricant repeat dispensing over 2 weeks. Results: The mean number of prescriptions with lubricants in A&E was 58 each day over the 12 day period. On average, 8% of lubricants are being repeated on A&E prescriptions rather than being requested by their GP. It was noted that due to factors, such as product availability, patients may seek A&E services for a repeat.
Comparison of Average Waiting Times & Average Patient Numbers of October 2014 vs June 2015 at the Dispensary Outpatient Pharmacy
According to the standard operating procedures, the waiting time advised to patients is up to 20 minutes. The QMATIC system records the actions of the prescription; taking in, calling the patient to collect the prescription and records the average waiting time. Waiting times are important for the patient’s experience at the hospital as a whole, as well as the patient-pharmacist relationship. The changes in average waiting time were observed in June 2015 and compared to the average patient waiting times in October 2014. Results: On weekdays, 88% of patients were waiting 20 minutes or less in June, 65% in October and 100% fulfilled this waiting time criteria on Saturdays. 100% of prescriptions were recorded on the QMATIC system.
Surveillance of antimicrobial prescribing towards new guidelines in high usage areas (Accident & Emergency)
A&E were identified as accounting for the greatest proportion of prescriptions with antimicrobials. In November 2015, the updated MEH Antimicrobial Guidelines were published. A regular audit was required as part of antimicrobial stewardship programme as recommended by NICE Guidelines [NG15]: Antimicrobial stewardship: systems and processes for effective antimicrobial medicine use. This NICE guideline covers the effective use of antimicrobials (including antibiotics) in children, young people and adults. It aims to change prescribing practice to help slow the emergence of antimicrobial resistance and ensure that antimicrobials remain an effective treatment for infection. This audit was identified as a priority by the Infection Control Committee. A prospective audit was conducted over a one week period to determine whether the antimicrobials being prescribed in A&E were in accordance to the updated Trust’s Antimicrobial Guidelines. Results: A total of 100 prescriptions were collected; 75 ophthalmic formulations and 25 oral formulations. 58% of prescriptions did not have the indication stated and prescribers often stated they had insufficient time to complete this section. Treatment for conditions e.g. chalazia and keratitis were poorly compliant with the guidelines. It was felt that further investigations were necessary to identify the reasons why the antimicrobials prescribed were outside of the guideline’s recommendations.

Clinical Quality and Safety Performance Report 2015/6
Page 29 of 61
An audit of the quality of Humira® Homecare Service at MEH This service had previously not been audited, therefore this audit investigated the quality of the homecare service provided to Humira® patients and the rationale behind the prescribing process for Humira® at MEH. Also whether the Homecare Service addressed any issues identified with plausible solutions. The quality of service was measured using Key Performance Indicators outlined in MEH’s Homecare Service Policy, as well as data provided by the homecare service provider covering the period April 2015 – August 2015. Results: A total of 17 deliveries were made between April – August 2015. Three deliveries were considered failed, one being the fault of the homecare service provider, with 2 being at the fault of the patient. 1 complaint was made. 6 prescriptions had been received without a purchase order. 88% of patients were initiated on Humira® therapy after attempts of using first line agents to manage their conditions, such as oral corticosteroids, mycophenolate mofetil, methotrexate, and infliximab infusions. The remaining were immediately initiated on Humira® due to this being already being prescribed as part of medication history. Only 50% of records contained clear documentation of the rationale behind initiating Humira® therapy. Issues that were resolved include: a patient who experienced difficulties in obtaining repeat prescriptions. It was felt that this was due to lag time in communication between the GP, MEH and homecare service provider. Another patient experienced injection site reactions and swelling after administration by their allocated homecare nurse – the service provider was contacted about this, who promptly rectified this issue by changing nurse administering injections.
Medication Safety Group The Medication Safety Group met in June 2015, September 2015 and March 2016. This is a multidisciplinary group that supports the management of operational and risk issues associated with the use of medicines and related policies within the Trust. The following were some of the key agenda items for this group over the period:
NICE- Medicines Optimisation assessment.
Discussion and feedback on medication safety incidents & the quality report
Discussion and feedback on Medicines Reconciliation Policy
Discussion and feedback Use of patient’s own drugs policy
Risk Assessment of Cytotoxic Medicines in Theatre – Risk Assessment Report
Safe Use of Insulin Training
Medication safety audit findings
2.5. Safeguarding adults and children
Reporting about safeguarding can be found in the respective annual reports.
3. Clinical effectiveness
3.1. Policies, Guidelines, Protocols, Standard Operating Procedures
102 documents were approved in 2015/16 via the required process. Policy accessibility
has been improved through a variety of methods which are explained elsewhere in this
report.

Clinical Quality and Safety Performance Report 2015/6
Page 30 of 61
3.2. National Confidential Enquiry (NCE)
The Trust is 100% compliant with relevant existing NCE guidelines. During 2015/16
Moorfields participated in 2 confidential enquiries (only a few were relevant to
ophthalmology) covering relevant health services that Moorfields provides. These
included the NCE into ‘sepsis’ (for which the trust is fully compliant following
implementation of protocols for the recognition and treatment of both adults and
paediatric patients), and continues to collect and assess data for the ‘provision of mental
health in acute hospitals study’.
3.3 National Institute for Health and Care Excellence (NICE)
The following NICE guidance has been considered and accepted as relevant to
Moorfields with the table and chart below show the guideline and compliance status.
No. Title Date published
Service Implementation Status
NG7 Maintaining a healthy weight and preventing excess weight gain among adults and children
01/03/2015 Nursing Fully compliant with aspects to Moorfields
NG5 Medicines optimisation: the safe and effective use of medicines to enable the best possible outcomes
01/03/2015 Pharmacy Partially compliant – actions within timescale
QS86 Falls in older people: assessment after a fall and preventing further falls
01/03/2015 Nursing Fully compliant
NG10 Violence and aggression: short-term management in mental health, health and community settings
01/05/2015 Safeguarding/ Security
Partially compliant – actions within timescale
IPG519 Insertion of a epiretinal prosthesis for retinitis pigmentosa
01/06/2015 Vitreo Retinal Fully compliant
QS89 Pressure ulcers 01/06/2015 Nursing Fully compliant
NG13 Workplace policy and management practices to improve the health and wellbeing of employees
01/06/2015 Human Resources
Fully compliant
QS92 Smoking: harm reduction 01/07/2015 Nursing Partially compliant – actions within timescale
QS94 Obesity: prevention and lifestyle weight management in children and young people
01/07/2015 Matron Paediatrics
Fully compliant with aspects to Moorfields
QS97 Drug allergy: diagnosis and management
01/07/2015 Pharmacy Fully compliant
NG15 Antimicrobial stewardship: systems and processes for effective antimicrobial
01/08/2015 Pharmacy Partially compliant – actions within
Clinical Quality and Safety Performance Report 2015/6
Page 31 of 61
medicine use timescale
NG16 Dementia, disability and frailty in later life - mid-life approaches to delay or prevent onset
01/10/2015 Safeguarding Adults
Fully Compliant with aspects to Moorfields
IPG534 Implantation of a corneal graft-keratoprosthesis for severe corneal opacity in wet blinding eyes
01/11/2015 Cataracts Fully Compliant
NG32 Older people: independence and mental wellbeing
01/12/2015 Safeguarding/ Nursing
Fully Compliant with aspects to Moorfields
TA369 Ciclosporin for treating dry eye disease that has not improved despite treating with artificial tears
01/12/2015 Cataracts Fully Compliant
NG29 Intravenous fluid therapy in children and young people in hospital
01/12/2015 Theatres Fully compliant with aspects to Moorfields
NG28 Type 2 diabetes in adults: management
01/12/2015 Diabetes Fully compliant
NG27 Transition between inpatient hospital settings and community or care home settings for adults with social care needs
01/12/2015 Nursing Fully Compliant
QS107 Preventing unintentional injury among children and young people under 15
01/01/2016 Safeguarding Children
Fully Compliant with aspects to Moorfields
NG43 Transition from children's to adults services for young people using health and social care services
01/02/2016 Paediatrics Fully Compliant with aspects to Moorfields
QS113 Healthcare-associated infections
01/02/2016 Infection Control
Awaiting feedback

Clinical Quality and Safety Performance Report 2015/6
Page 32 of 61
The Trust is now able to analyse NICE guidelines to a greater degree of accuracy and
has noted that MEH is 90% compliant. Compliance % is measured as a sum of all NICE
guidelines relevant to the Trust since 2013 where a response has been provided by the
lead. The following NICE guidelines are currently only ‘partially compliant’ and further
work is required to achieve ‘full compliance’ for aspects relating to Moorfields.
• QS92 Smoking cessation (although deadline not till Dec 16)
• NG10 Violence and Aggression
• NG5 Medicines Optimisation
• NG15 Antimicrobial Stewardship
• MPG2 Patient Group Directives
QS92 Smoking Cessation: harm reduction
The Matron has invited ‘stop smoking Islington’ to the information hub at City Road to
enable leaflets, advice and information to be displayed for patients, carers and staff.
Plans are still progressing for smoking cessation assessments for patients in clinic and
day surgery wards. The Trust is also participating in the National Smoking Cessations
Audit.
NG10 Violence and Aggression
The trust has identified the need for a training programme for staff in A&E/urgent care
with plans to roll out during 2016. The trust is also awaiting resolution of a SLA
agreement for psychiatric support / joint working agreement with Camden and Islington
Mental Health Foundation Trust, and use of a mental health triage tool.
NG15 Antimicrobial stewardship
Discussions are still taking place for the establishment of a full-time antimicrobial post
and better links to a microbiologist. A formal antimicrobial stewardship programme being
developed by the new antimicrobial pharmacist.

Clinical Quality and Safety Performance Report 2015/6
Page 33 of 61
MPG2 Patient Group Directives (PGDs)
The trust has just commenced a non-medical supply of medicines committee to review
PGDs. The committee will develop to incorporate all necessary aspects to meet the
requirements of the NICE guidelines including a training programme, audit programme
and appeals process.
Responses are being chased for:
Healthcare-associated infections.
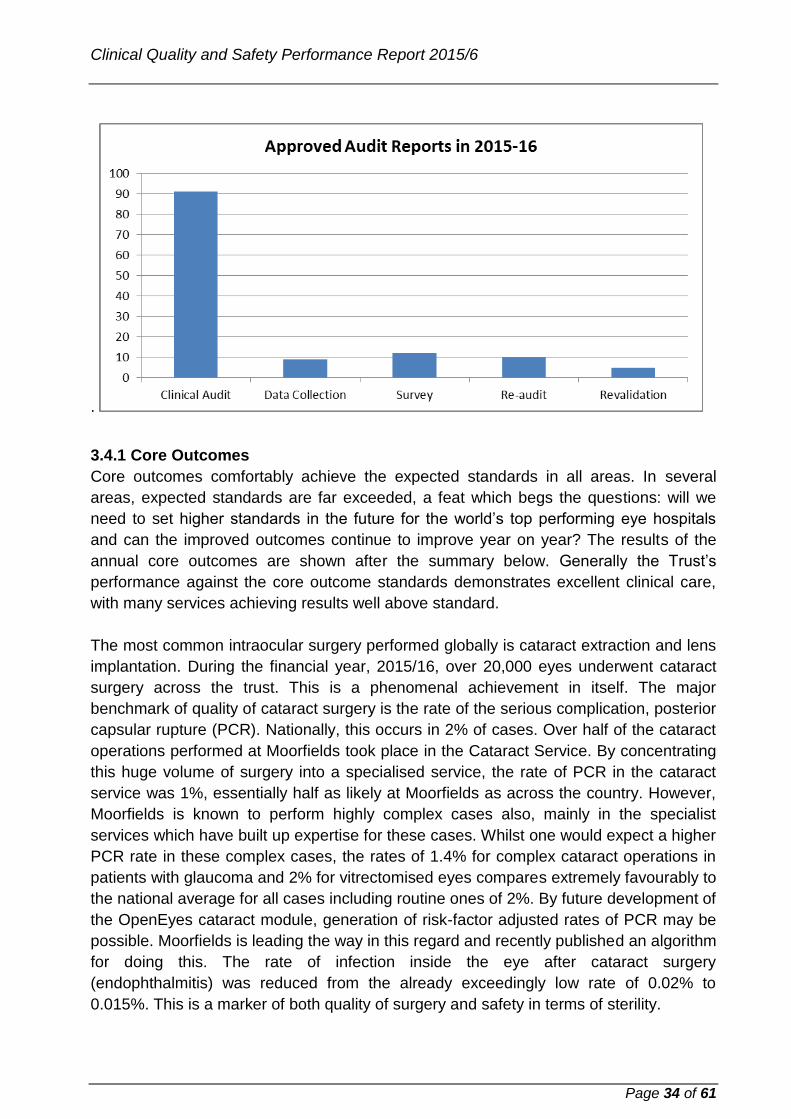
3.4. Clinical audit and outcomes
All clinical audit proposals continue were discussed at the two-weekly Clinical Audit and
Assessment Committee (CAAC), to review, support and guide those staff planning to
undertake an audit. During 2015/16, 207 proposals for clinical audit activity were
approved at CAAC. This compares to 195 proposals approved in 2014-15.
Reasons for Clinical Audit Proposals in 2015-16
Reason for audit 2015-16
Complaints, claims and litigation 3
Core Outcome audit 23
Clinical Interest 5
GMC 0
Incidents 7
Local Guidelines 20
Nationally Derived Audits 22
New Research 15
New Service 3
NICE 12
National Service Framework (NSF) 2
Patient Feedback 6
Patient Safety First 1
PROM 0
QIPP 1
Royal College of Ophthalmologists (RCO) 9
Royal Colleges Other (Anaesthetics, Physicians) 4
Royal College of Ophthalmologists mGTT (RCOmGTT) 12
Re-audit 8
Revalidation 20
Service Evaluation 25
Survey 9
Total 207
The CAAC also received and reviewed 128 clinical audit reports (more than double the
62 reports approved in 2014-15). In 2016/17, the team will look to optimise the CAAC
processes further.
Clinical Quality and Safety Performance Report 2015/6
Page 34 of 61
.
3.4.1 Core Outcomes
Core outcomes comfortably achieve the expected standards in all areas. In several
areas, expected standards are far exceeded, a feat which begs the questions: will we
need to set higher standards in the future for the world’s top performing eye hospitals
and can the improved outcomes continue to improve year on year? The results of the
annual core outcomes are shown after the summary below. Generally the Trust’s
performance against the core outcome standards demonstrates excellent clinical care,
with many services achieving results well above standard.
The most common intraocular surgery performed globally is cataract extraction and lens
implantation. During the financial year, 2015/16, over 20,000 eyes underwent cataract
surgery across the trust. This is a phenomenal achievement in itself. The major
benchmark of quality of cataract surgery is the rate of the serious complication, posterior
capsular rupture (PCR). Nationally, this occurs in 2% of cases. Over half of the cataract
operations performed at Moorfields took place in the Cataract Service. By concentrating
this huge volume of surgery into a specialised service, the rate of PCR in the cataract
service was 1%, essentially half as likely at Moorfields as across the country. However,
Moorfields is known to perform highly complex cases also, mainly in the specialist
services which have built up expertise for these cases. Whilst one would expect a higher
PCR rate in these complex cases, the rates of 1.4% for complex cataract operations in
patients with glaucoma and 2% for vitrectomised eyes compares extremely favourably to
the national average for all cases including routine ones of 2%. By future development of
the OpenEyes cataract module, generation of risk-factor adjusted rates of PCR may be
possible. Moorfields is leading the way in this regard and recently published an algorithm
for doing this. The rate of infection inside the eye after cataract surgery
(endophthalmitis) was reduced from the already exceedingly low rate of 0.02% to
0.015%. This is a marker of both quality of surgery and safety in terms of sterility.
Clinical Quality and Safety Performance Report 2015/6
Page 35 of 61
As with cataract, whilst clinical effectiveness has been maintained at extremely high
levels, the rate of endophthalmitis following the most commonly performed intraocular
procedure, intravitreal injection, has stayed significantly less than gold standard. During
this period there has been a switch from doctors to predominantly nurses performing this
procedure. Also there has been the cessation of post-operative antibiotic drops, long
thought to be ineffective but never before tested in real-life on such a large scale as the
now 25,000 and rising numbers of intravitreal anti-VEGF injections at Moorfields can
demonstrate. The proof of the effectiveness of both these changes is the maintenance
of the low rate of endophthalmitis over the 12 months (April 2015 to March 2016). After
piloting and publishing the training of nurses to perform intravitreal injections, now being
replicated elsewhere, Moorfields has demonstrated the high level of safety. Likewise,
more and more units will follow Moorfields in stopping the use of post-operative
antibiotics, knowing that this was a safe change to make over such a huge number of
injections.
The target of ‘never’ events never happening has almost been achieved in 2015/16.
Although it is still to be demonstrated that this can be sustained. This has largely been
achieved by strict implementation of rigorous standard operating protocols in theatres
and thorough documentation in a customised section in the casenotes. Thorough clinical
governance education including regular individual Service meetings as well as an annual
trust-wide Clinical Governance half-day have made every individual in the trust aware of
how to reduce the risk of ‘never’ events.
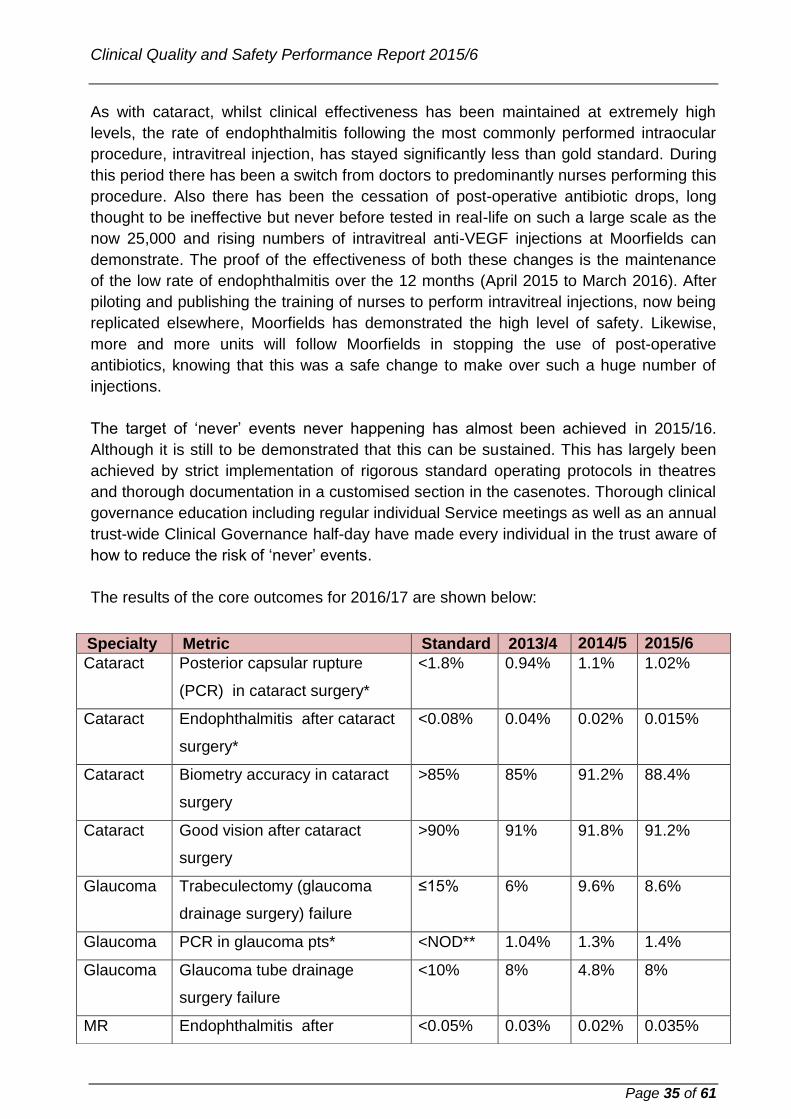
The results of the core outcomes for 2016/17 are shown below:
Specialty Metric Standard 2013/4 2014/5 2015/6
Cataract Posterior capsular rupture
(PCR) in cataract surgery*
<1.8% 0.94% 1.1% 1.02%
Cataract Endophthalmitis after cataract
surgery*
<0.08% 0.04% 0.02% 0.015%
Cataract Biometry accuracy in cataract
surgery
>85% 85% 91.2% 88.4%
Cataract Good vision after cataract
surgery
>90% 91% 91.8% 91.2%
Glaucoma Trabeculectomy (glaucoma
drainage surgery) failure
≤15% 6% 9.6% 8.6%
Glaucoma PCR in glaucoma pts* <NOD** 1.04% 1.3% 1.4%
Glaucoma Glaucoma tube drainage
surgery failure
<10% 8% 4.8% 8%
MR Endophthalmitis after <0.05% 0.03% 0.02% 0.035%

Clinical Quality and Safety Performance Report 2015/6
Page 36 of 61
intravitreal anti-VEGF
injections*
MR Visual improvement after
injections for macular
degeneration
>20% 20.7% 26.9% 22%
MR Visual stability after injections
for macular degeneration
>80% 90.2% 96.2% 96.4%
MR Time from referral to
assessment of proliferative
diabetic retinopathy*
80% 51.5% 87% 86%
VR Success of primary retinal
detachment surgery
>75% 88.3% 83% 88%
VR Success of macular hole
surgery
>80% 80.6% 95% 94%
VR PCR in cataract surgery in
vitrectomised eyes
<NOD 1.6% 3.3% 2.0%
NSP Serious complications
strabismus surgery*
<2.2% 0.3% 0.23% 0.23%
NSP Premature baby eye (ROP)
screening compliance*
99% 100% 100% 99%
Ext Dis DSAEK corneal graft failure
rate
≤12% 8.9% 9% low
21%high
1.6% low
risk
18% high
risk
9%
overall***
Ext Dis PK corneal graft failure rate UKTS 8.5% 11% Auditing***
Ext Dis DALK corneal graft failure rate UKTS 6.7% 5% Auditing***
Refractive Accuracy LASIK (laser for
refractive error) in short sight*
>85% 88.7% 93.7% 94.4%
Refractive Loss of vision after LASIK* <1% 0% 0% 0.83%
Refractive Good vision without lenses
after LASIK*
≥80% 87.0% 96.1% 89.5%
Adnexal Ptosis surgery failure* <15% 5.00% 0% 5%

Clinical Quality and Safety Performance Report 2015/6
Page 37 of 61
*Indicators marked with an asterisk are based on a whole year’s data for all relevant
cases. All other indicators are based on a sample of cases collected over at least a three
month period during 2015/16.
**NOD = Royal College of Ophthalmologists’ national ophthalmic dataset.
***UKTS = UK national transplant service. UKTS provides the external disease service
with corneal graft failure rates after data is submitted by Moorfields to them. The 12-
month graft failure rates to March 2016 for DALK and PK are not yet available. These
will be listed in next year’s core outcomes table.
4. Patient experience
4.1 NHS England Friends and Family Test (FFT)
The most comprehensive measure of patient satisfaction at Moorfields, overseen by the
PEC, is the NHS England Friends and Family Test (FFT), which is now run at 52
departments and clinics across the trust. Patients are asked: ‘How likely are you to
recommend our service to your friends and family if they needed similar care or
treatment?’ and are asked to select from a five point scale from ‘Extremely Likely’ to
‘Extremely unlikely’. The test has the dual purpose of allowing the trust a quantitative
measure of performance, but it also asks them to comment on what would have improved
their care. The majority complete the test by filling in a card, but there is also an online
version on the trust’s website (however, only around 10-15 patients use this route). It is
scored by comparing the percentage of those who would recommend the trust (i.e.
Extremely likely and Likely) against the percentage of those who would not (i.e. Unlikely
or extremely unlikely). The trust, working with our commissioners, has set a benchmark
of 90% of patients recommending the trust.
(Fig.1: FFT results 2015/16 - green: would recommend / red: would not recommend).
Trust total A&E (inc Paeds) Outpatients Day Care
Respondents 99,104 19,031 60,445 19,628
% of patients 14.5% 18.7% 11.1% 55.0%
Score 96.4% 1.3% 92.7% 1.6% 96.7% 1.4% 99.0% 0.4%
Trust /Commissioner response KPI’s are: >15% outpatients >20% A&E >30% day Care
During 2015/16 the FFT test was completed by 99,104 patients (just over 10,000 more
than the previous year) and the percentage of patients who would, or who would not;
recommend the trust has remained within one or two percentage points of the previous
Adnexal Entropion surgery success* >95% 97.50% 96.2% 100%
Adnexal Ectropion surgery success* >80% 100% 95.2% 93.3%
Serious incidents and never events
Incident Wrong patient* 0 0 0 0
Incident Wrong side* 0 0 0 0
Incident Wrong IOL* 0 2 3 1

Clinical Quality and Safety Performance Report 2015/6
Page 38 of 61
year’s score, in the mid to high 90% range. The scores are not only satisfyingly high, but
compare favourably with the other 155 NHS England trusts in that outpatients were in the
top scoring 25% throughout the year and day care within the top 3%.
4.1.1 FFT Patient Comments
Comments left by patients are overwhelmingly positive with around 1630 citing
individual staff as giving exceptional care. Adjectives such as good, friendly, helpful,
professional, excellent recur repeatedly throughout the comments. Typical examples
from across the trust are:
“My husband visited Mackeller ward for cataract surgery. It was the second time we have been
to this ward in 2 years and I have to say on behalf of my husband that all the staff are very
friendly and kept us at ease. They do not neglect you and leave you waiting for ages and keep
checking on him. The lady who serves the tea is very lovely and is always smiling and happy as
are the nursing staff. Well done Mackeller ward!!”
“As a first rate teaching hospital I have great confidence in the treatment given. I have been
attending for many years and have always had excellent attention.” Clinic 2
“All staff at the Moorfields Bedford outreach were professional, ethical, compliant, polite and
charming.Nothing was too much trouble for any staff member; all staff explained in detail their
proposed actions and gave the clear impression of caring for the patient.”
A quarterly analysis of the FFT comments show that for the 1% - 2% of patients who
would not recommend the trust, waiting times and delays in A&E, clinic and day care
wards remain an issue, with 55% of those scoring neither, unlikely or extremely unlikely,
citing this as the reason.
Similarly, when the monthly FFT comments from all respondents are considered, waiting
times and delays whilst in clinic or in for surgery are also raised as an issue, mostly by
those who would recommend the trust and have other positive things to say about their
experience. For example, in March 2016, of the 8,947patients who completed the test,
6,370 left a comment and of these, 939 (14.6%) comments related negatively to delays
and waiting. This is consistent with other months and will be a useful measure of patient
perception going forward as trust-wide action is taken to address this issue within the
transformation project. It is worth noting that of the 6,730, 409 (6%) commented on how
quickly they were seen.
Of the suggestions left as to what would have improved their visit (excluding waiting
times), very few remarked on the appointment itself, the clinical or nursing care or the
treatment received. Most are related to the experience of waiting and are again,
consistent month on month. The availability of refreshments, something to occupy
patients whilst waiting (TV, radio, newspapers etc.) and communication, especially in
terms of being told estimated waiting times and being called clearly are the three main
themes. The environment (too hot or cold depending on the season), seating (availability
or quality), car parking and poor staff attitude make up the majority of other comments.
All comments are shared with the directorate management teams and the Patient
Experience Committee oversees action plans drawn up to address some of the issues

Clinical Quality and Safety Performance Report 2015/6
Page 39 of 61
raised. Whereas issues such as waiting times, car parking and entertainment suitable for
everyone’s taste are more intractable, informing patient of waiting times, where
refreshments are available and explaining they can leave the clinic to get them, calling
names clearly and staff attitude are primarily to do with staff behaviours and approaches
to improving these are more easy to control. Again this can be used as a measure
(albeit a broad one) of patient perceptions of changes made (e.g. via the Moorfields
Way) as they embed within the trust.
4.2 Other sources of feedback.
Other sources of feedback include:
4.2.1 CQC Patient surveys (Picker Surveys) During 2015/16 there were no CQC patient
surveys (normally undertaken on behalf of the trust by Picker Institute), however the
CQC National Children’s Inpatient and Day Case survey which was sampled in 2014
was reported and published on the CQC website in June 2015. 37% of the 305 parents,
young persons and children sampled responded. The results scores each question
response out of ten, but also reports the results by comparison with 137 other trusts. i.e.
Moorfields result is better, about the same or worse when compared with most other
trusts. This grading, along with the numerical score, is what appears on the CQC
website.
Overall the results were very positive, and for 27 of the 48 questions the trust scored
better than the majority of other trusts, 21 the same as the majority of trusts, none worse
than the majority of trusts and only three out of the 48 questions scored below 8.0. Five
of the questions where the highest scoring of the other 137 trusts are:
They felt their child was safe on the hospital ward PC 10.0
Their child did not stay on an adult ward APC 10.0
The people looking after them listened to them CYP 9.6
New members of staff treating the child introduced themselves PC 9.5
They had a good overall experience of care in the hospital CYP 9.4
For the 16 questions that could be compared to the previous survey run in 2010, all but
one showed an improvement of more than 10%. As with previous CQC surveys an
action plan was developed and progress against it is monitored by the Patient
Experience Committee.
4.2.2 PALS & Complaints: PALS enquiries and complaints are a rich source of identifying
patients’ everyday frustrations and though these are resolved at the time, a summary of
the concerns and outcomes are circulated to trust management teams on a weekly
basis. These are discussed in more detail below.
4.2.3 Social Media: Comments and suggestions from sites such as Facebook, Twitter,
NHS Choices, and patient opinion etc. are circulated on a weekly basis. When not

Clinical Quality and Safety Performance Report 2015/6
Page 40 of 61
praising the trust, these comments tend to raise specific issues around how their
attendances at Moorfields have been managed.
4.2.4 Focus groups: there were several focus groups run during 2015/16. These
included one run for 30 patients and carers attending the 2015 AGM (as well as
patients contacted by telephone) about what they felt the public could contribute to the
running of the trust, the barriers to involvement and what they would require (training,
support, expenses such as transport or child care, etc.). This helped form the basis for
a trust Patient Engagement strategy that will implemented in 2016/17. Another focus
group was held as part of the part of the preparation of Moorfields Quality Account,
reviewing the report and helping to identify key priorities for the trust. A further focus
group was held to look at the patient perspective of the MR Service at Bedford and
what improvements might be made, e.g. better information, lighting in waiting areas,
information about new treatments.
4.2.5 Audit: A number of audits were run during 2015/16 which looked at the patient
experience. These included:
Dignity in Care which asked about the nursing care provided in day care units;
Complaint handling (from the complainant perspective) asking about the
handling of patient’s complaints;
Patient experience in Moorfields’ operating theatres, an aspect of the patient
pathway, not covered elsewhere and which was overwhelmingly positive;
Moorfields Adnexal Oncology Service which asked about the practical and
emotional support provided by the Adnexal oncology service to patients and
their carers;
Patient experience in the nurse led retinal injection service asked if patients are
happy with the nurse led service.
4.3 Responses to patient feedback
For each of the activities above, comprehensive action plans have been created to
address specific and local issues and are overseen by the Patient Experience
committee. For those issues that are more organisational such as staff behaviours,
communication or waiting times, a more coordinated trust-wide response is required
and there are various projects and action plans taking place. Project leads and action
plan authors have been invited to the PEC to discuss progress. These projects
include:
4.3.1 The Moorfields Way. Throughout 2015/16 the Moorfields Way moved from
gathering information and ideas to developing a framework of commitments and
values, to communicating its ideas to staff and patients through meetings, clinical
governance sessions, and online promotion and information, to the introduction of its
more practical aspects. Other points include:

Clinical Quality and Safety Performance Report 2015/6
Page 41 of 61
The introduction of an appraisal system based around the tenets of the
Moorfields Way was introduced and undertaken by many staff prior to the
CQC visit in May.
Recruitment interviewers can use a bank of questions designed to identify
the desired qualities of a candidate that are reflective of the Moorfields Way
and based around the commitments of excellence, inclusivity, caring and
organisation.
Supervisor and front line staff training, again focused around the Moorfields
Way, was commenced to support staff in promoting the Moorfields Way
behaviours in their staff.
4.3.2 Telecommunication Project. The NetCall telecommunication project continued
throughout 2015/16 allowing for detailed monitoring of the number and speed at which
telephone calls are responded to, as well allowing managers to listen in and judge the
quality of interactions between staff and callers. Though the results around the
number of calls answered and the speed with which they are answered is mixed, this
is against a background of increasing call volumes over the year and difficulty with
staff coverage in some areas. The question of whether to establish an appointment
booking centre (to receive all appointment enquiries) and whether to roll the function
out to other areas of the trust will be decided in 2016/17.
4.3.3 Uveitis service transformation projects. Following a visit of members of the
uveitis service in Boston, a transformation project has been established, informed by
the idea that there is a wide range of patients that have Uveitis ranging from simple
front of the eye disease to systemic causes, which can affect other parts of the body.
Identifying the complexity of patient’s conditions and streaming them into specific
manned clinics (i.e. senior consultant clinics for the most complex cases, whilst stable
patients are seen by an optometrist or specialist nurse). Transformation in this
context is about meeting the needs of patients within each category. A measure of
success will be how many patients in each category are seen, patient satisfaction with
treatment and monitoring how quickly patient’s conditions transition from a very active
and serious presentation of their disease, to the condition becoming stably managed.
The project also includes reviewing pathways within clinics and the referral processes
for investigations. Appropriate staff (nurses, optometrists and specialist pharmacists) will
need to be identified and trained, however it is hoped that the project will shift from the
planning stage to implementation in 2016/17.
4.3.4 Transport Committee. The transport committee meets on a three monthly basis
and reports to the patient experience committee. It consists of nurses managers,
estates, PALS and representatives of ‘Patient Services’, the trusts main transport
provider. Each complaint, incident and PALS enquiry is discussed and ways of
preventing a re-occurrence identified. This has resulted in a dramatic fall in the
number of both PALS enquires and complaints over that past two years. One example
of a change made, in response to the number of patients claiming that their transport

Clinical Quality and Safety Performance Report 2015/6
Page 42 of 61
had not arrived, was an A5 card posted through the letter box if there is no response
from the driver knocking or calling, saying they called and including the Moorfieds
transport helpdesk number to re-organise pick-up.
4.3.5 Visual Awareness training. Though the role of the Patient Experience Committee
is primarily one of oversight and advice, it does identify areas where patient
experience might be enhanced and asks that work be undertaken to meet that need.
One example is the provision of visual awareness training, beyond what is provided at
induction. The learning and development department produced a DVD, involving
patients and staff, to convey the perspective of visually impaired patients. This was
produced and viewing it is now part of all staff’s mandatory compliance. The need for
further face to face training for specific groups of staff is still being assessed.
4.4 Complaints
Complaints received by quarters Q1 to Q4 2015/16.
Complaints received by type
Q1 2015/16 Q2 2015/16 Q3 2015/16 Q4 2015/16
45
(40 complainants)
54
(47 complainants)
49
(47 complainants)
49
(45 complainants)
Percentage of patients seen
who went on to complain
0.02%
167,127 patients
0.03%
167,410 patients
0.02%
(166,672 patients
0.02%
168,056 patients
Complainants per 10,000
patient contacts 2.6 3.2 2.9 2.9
Complaints received by type quarters Q1 to Q4 2015/16:
The average number of complaints received each month throughout the year was
16, with only a slight variation for each quarter. From Q1 2015/16 the number of
complaints, as opposed to the number of complainants, has been reported in
order to get a clearer picture of the issues concerning patients and their carers.
The number of complainants has equally remained around the same for each
quarter.

Clinical Quality and Safety Performance Report 2015/6
Page 43 of 61
Aside from the odd monthly anomaly, the number of categories of complaint
remained unchanged throughout the year except for a small downward trend with
appointment issues, and a spike in customer care and transport issues in Q3 and
Q4 respectively.
4.4.1 Clinical complaints
As with previous years, clinical complaints continue to be the most common cause
of complaints. Many of these are very specific in nature and appear to rest on the
level of understanding by the patient of their condition and treatment plan,
especially when they are undergoing long-term care, and may not have any
information about decisions or treatment choices other than a GP letter and
conversation during clinic. The majority of written responses to such concerns
tend to clarify their care pathway and explain why decisions were made, and
recognise and apologise for processes and clinical errors that occurred. Perhaps
the relatively few referrals to the PHSO or re-opened complaints might suggest
this is enough to give the majority reassurance. However, anticipating, in the
clinical setting, where a patient might go on to complain is not always obvious.
The majority of the 93 clinical complaints received during the year were where the
patient had issues with the care they received or questioned the treatment given.
These cover a wide spectrum and are very specific in nature. Most of these were
from patients who felt that the treatment or care they had undergone had not been
effective, had resulted in unexpected outcomes, that the wrong treatment choices
had been made or who felt that their treatment had led to unnecessary
complications or outcomes. Others questioned their discharge from service,
failures in diagnosis, prescription decisions, and access to treatments they felt
they should have been given. All clinical complaints are individual to the person
concerned and in several cases the trust was found to be at fault, this was
acknowledged,
All clinical complaints are reviewed by the Medical Director and in reviewing the
directorate, site, service or individuals involved, there does not appear to be any
themes or areas of poor practice identifiable.
4.4.2 Non-clinical complaints
With regard to non-clinical complaints, those regarding appointment issues has
increased from the previous year as have those about communication problems,
but as noted above, this is partly due to the reporting change and they have
stayed relatively consistent for each quarter of the year (i.e. they are not
increasing over the year). They centre on errors in booking, cancelled or delayed
appointments or their availability. There were also two complaints regarding
missing medical records. In terms of communication complaints, these were as a
results of problems with GP and appointment letters, failure to get through to or be

Clinical Quality and Safety Performance Report 2015/6
Page 44 of 61
contacted by Moorfields staff and not having a request for email honoured. There
were also concerns about communication during their consultation.
Staff attitude, though fewer than previous years, remains relatively high (27)
considering most are unnecessary. Mostly it is around offhand or rude behaviour
from staff, predominantly medical and reception staff, although nurses, optometry
staff and estates were also mentioned.
Waiting times (for surgical and outpatient appointments as well as in clinic),
transport (two of which were delays due to traffic) and ‘Other’, e.g. finance
requests or challenges to treatment costs and two optometry dispensing errors.
Again, aside from long recognised systemic difficulties such as clinic waiting times,
appointment issues and communication, no themes stand out as being linked to
site, service or directorate.
4.4.3 Response to complaints
Several of the issues raised by complaints (and PALS concerns) are born of
systemic problems across the trust that require a trust-wide response in tackling.
Waiting times and delays in clinics and day care, communication, staff behaviours
are being responded to by programmes such as the Moorfields Way, a
telecommunications project to simplify communication for our patients, the
creation of a Transformation Board to coordinate all improvement work and the
Accessible Information Standard work. All these will hopefully address several of
the underlying issues that currently cause patients to complain. Changes made
as a direct response to specific complaints are however undertaken, some
examples are included below:
In response to a patient attending, but not being seen at the walk-in service
at Moorfields St George’s and being referred elsewhere (of which there was
no evidence), a log has been established to record the details of all patients
who visit out of hours and the outcome of their visit.
Following a patient missing an appointment when the letter arrived too late
(possibly following a change to the sending of letters by second class post,
an agreement has now been reached that letters to be sent out by first-
class post will be batched and approved by the Facilities Manager in
advance.
Following the complaint of a patient who felt that his hearing needs were not
addressed, fixed hearing loops are being introduced to clinics and a review
is being undertaken to ensure that signs are in place informing patients that
hearing loops are available and accessible for patients who require them.
In light of a patient who had difficulty contacting the St George’s clinic
regarding an appointment, the email address of the service will now be
included on all appointment letters.
Following a patient who had surgery cancelled due to the appropriate scan
not being undertaken, MEH North has revised the procedure for referring

Clinical Quality and Safety Performance Report 2015/6
Page 45 of 61
patients to ultrasound at City Road to ensure that there is a more robust
process in place.
In response to a patient who has a difficult journey and whose GP refused
transport following the complainant’s transfer of care to Moorfields from
another trust, the Facilities Manager contacted the patients GP and
advocated on his behalf requesting that transport should be provided.
4.5 PALS enquiries and concerns
2450 PALS enquiries in were received in 2015/16. An increase of 668 on the
previous year and can be accounted for to some extent by the promotion of the
service across the trust and on the trust’s website and possibly to increased
patient activity. There was a notable increase in the number of appointment and
communication enquiries throughout the year, due possibly to the higher profile of
the PALS and higher overall activity, but equally it suggests that patients may not
be clear whom to contact directly when they are trying to resolve issues around
appointments, reports or letters, or other issues regarding their care and treatment.
Over the coming year, PALS concerns, and to some extent, enquiries, will act as a
measure of the success of the Moorfields Way and other patient improvement
activities across the trust.
PALS Information and enquiries 2012/13 to 2015/16 by number and percentage

Clinical Quality and Safety Performance Report 2015/6
Page 46 of 61
PALS Concerns and informal complaints 2015/16 by number and percentage
21
17
22
19
94
94
50
66
12
16
22
22
38
45
38
43
8
50
70
56
60
13
15
11
9
21
16
17
26
36
27
35
20
21
15
22
26
27
11
20
0% 10% 20% 30% 40% 50% 60% 70% 80% 90% 100%
Q1 2015/16
Q2 2015/16
Q3 2015/16
Q4 2015/16
Administration Appointment issues Cancelled ApptsClinical Issues Cashiers CommunicationOptometry Transport Staff Attitude
5. Compliance with healthcare regulators
Quality and Safety Assurance Model: In 2015/16, a major focus was preparing for
CQC inspection (see below). In addition, the team continued to support and facilitate the
assurance and oversight activity of the quality and safety committee (QSC) via the
compliance assurance framework (CAF) to identify areas requiring targeted remedial
and supportive action. The CAF comprises of three elements (illustrated below):

Clinical Quality and Safety Performance Report 2015/6
Page 47 of 61
The ‘Worry List’
The worry list is subjective front-line and other intelligence gathered by the compliance
team. The information is grouped into a number of broad headings so that a higher level
thematic analysis can be undertaken.
Up to September 2015, the compliance team had conducted around 100 confidential
meetings with a variety of staff, resulting in nearly 800 comments and/or concerns,
covering a broad range of topics. The comments were analysed and acted upon on a
priority basis as required and fed through the CAF.
Compliance declarations
The declaration is a (clinical and non-clinical) service specific regulatory compliance self-
assessment and compliance declaration. These requirements were incorporated into the
design of a CQC self-assessment tool which was launched in June 2015. The tool
required each staff group (administrative and clerical staff, allied health professionals,
nurses and doctors) at a service and site level, to review their services by answering 161
questions based on 27 broad themes. These themes are mapped to the CQC’s key lines
of enquiry, which assess whether services are safe, effective, caring, responsive and
well led. Additional versions of the tool were developed for surgical services across the
trust, and for non-clinical (corporate) areas. The self-assessment process was
supported with workshops, one to ones, presentations, and online support tools.
The compliance declaration and self-assessment processes and tools will be reviewed
in 2016/17.
Supporting evidence base
Services across the organisation were asked to support their self-assessments with
evidence. In some cases, this was inconsistent and highlighted issues with the
availability of evidence. There is much work ongoing within the organisation to improve

Clinical Quality and Safety Performance Report 2015/6
Page 48 of 61
the quality and availability of information, which is also essential for the CAF to function
optimally. The CAF will be further developed during 2016/17 by, potentially procuring a
compliance assurance management IT system to assist the capture of compliance
requirements, the logging of supporting evidence, and the self-assessment process. The
information will be processed and used in a variety of ways, including strategic views of
quality assurance across the organisation, and enabling ownership and management of
quality at a local level. After each element of the model is triangulated, the outcomes are
presented in priority order at each meeting of QSC.
5.1 CQC readiness
The team’s priority activity for the first two quarters of 2015/16 was the development and
implementation of the Trust-wide CQC readiness self-assessment process (see above),
and the resulting improvement action planning.
Self-assessments were analysed via a bespoke Qlikview dashboard, which enabled
management teams to review the results from all areas to enable analyses of their own
services’ findings, as well as a facility to benchmark themselves against other services.
Central quality and safety leads were also assigned to individual directorates for
dedicated support.
At the end of November 2015, the majority of self-assessments had been completed,
and by January 2016, the number of self-assessments received totalled 212. Action
planning and improvement then took place. An action plan template and supplementary
guidance was developed with action plans and improvements owned and driven locally.
Built into this was a process of escalation enabling actions to be raised at directorate
and corporate level as necessary. An executive-led board was established to ensure
that actions were monitored and managed.
Moorfields’ CQC inspection was announced on 21st December 2015. A project
governance structure comprising of a CEO led project board and executive led work
streams was implemented from January 2016.
The first CQC data collection phase (PIR - Provider Information Requests) commenced
on the 22nd December 2015 and was submitted on 12th January 2016. PIR2 was
requested mid-February 2016 and was delivered by mid-March 2016 in line with the
CQC's deadline. PIR2 was a much more detailed request compared with PIR1, and a
pre-emptive process and working group were established to collate the vast sets of data
required.
Much was learnt from the first data submission in terms of how we manage data and
information, how we hold this and how readily accessible it is. Data quality issues were
also identified, and as a result streamlined processes and additional resourcing were put
in place to support PIR2.

Clinical Quality and Safety Performance Report 2015/6
Page 49 of 61
The following table summarises the CQC inspection related activity during 2015-16.
Education and Communication: from March 2015 onwards
Major communication launch
COMPLETE Production and dissemination of staff handbook
On-going communication
Self-Assessment & Improvement Action Planning
Self-assessment mapped to CQC domains and KLoEs
COMPLETE
Self-assessment process June – December 2015
Information, guidance and support provided
Results published in dashboard
Improvement action planning October onwards
Pre-Planning
Project management structure designed
COMPLETE Project board established
Moorfields’ An Eye for Quality initiative launched November 2015
Programme of mini CQC inspections and walkabouts
The Inspection is Announced
Inspection is announced in December 2015
COMPLETE
PIR1 (January 2016)
Project management structure implemented (comprising 5 work-
streams: Operational Readiness; Engagement and Communications;
Data and Information; Onsite Inspection Readiness; and Policies and
Governance)
On-going communication (including a programme of service
presentations)
PIR2 (March 2016)
Improvement activity in lead-up to inspection; Re-enforcement of
existing good practice whilst addressing weaker areas
7-week countdown commenced (21 March 2016)
The inspection processes and management, any known outcomes and lessons learned
will be included in the report for Q1/2 2016/17.
Policies: The compliance team is responsible for the governance of the Trust’s policies.
A significant review of trust policies and their status (in date, expired, under review, etc.)
was undertaken during the reporting period: in April 2015, 46% of policies were in date,
and over the course of the next 12 months, this figure was improved to 69% (and by the
inspection, 100% of the Trust’s policies were in date). This improvement was achieved
by enhancing our existing policy management processes, robust engagement with the
trust’s policy authors, and a review of the Trust wide document for the development and
management of policy and procedural documents (policy on policies).

Clinical Quality and Safety Performance Report 2015/6
Page 50 of 61
In March 2016, the review of the ‘policy on policies’ commenced (the reviewed version
was published in May 2016). The policy was updated to include clear lines of approval
and ratification setting out clearly the paths for policy review. The policy was further
supplemented by an infographic providing a step by step policy management illustration.
The policies page on the intranet was also redesigned, making finding policy documents
simpler and faster.
As well as overseeing the day to day management of policies, the compliance team has
developed summaries (one or two pages outlines) of the Trust’s key policies. By
February 2016, 16 policy summaries had been produced and published.
Policy infographics (shown above) were developed in conjunction with policy summaries.
These are single page graphical representations of key policies, illustrating the main
points in an accessible format. Infographics are available to download and also in a
printed (A5-sized) version. The first six infographics were launched at Clinical
Governance half-day on 11th November 2015. By the end of March 2016, 11 policy
infographics were available from the policies page (with a further five in preparation).
An Eye for Quality: Also launched on 11th November was the An Eye for
Quality initiative. With a great deal of activity underway in relation to the CQC inspection
preparation, the purpose of this initiative was to embed quality within the organisation
and communicate the message that “quality is for life, not just for the inspection.”

Clinical Quality and Safety Performance Report 2015/6
Page 51 of 61
6. Conclusions
This report covers many aspects of quality and safety activity at Moorfields during
2015/16. It is useful to read it alongside Moorfields’ Quality Account 2015/16 which
reports on a number of specific quality and safety objectives and sets out improvement
targets for 2016/17. Moorfields has been active in its efforts to ensure quality and safety
of care are constantly improved and an enormous amount of work continues.
The maturity of incident reporting has grown substantially over the past few years and
the number of incidents reported was at a benchmarked high for 2014/15. The challenge
continues to use the data and information to learn and improve services. In doing so,
this will also improves individual experiences for patients, carers and staff. The targeted
use of data and information, and systems developments including better use of
information technology (as referred to in this report) and the continued devolution of
local responsibility will all support this.
Outcomes for care remain good and we have started submitting cataract outcome data
electronically via OpenEyes to the Royal College National Cataract Audit. However
Moorfields has aspirations to set higher standards and increase the number and breadth
of its already broad suite of outcomes.
Our patients feedback that generally their experiences are good, although there are
number of areas that the trust is aware of that require improvement such as waiting
times, delays to appointments and communications.
Infection levels for many core serious infections remain at zero and endophthalmitis
levels and adenovirus remain better than benchmark performance levels.
The compliance assurance model has progressed well over the previous 18 months and
set in motion the CQC self-declaration process which contributed greatly to Moorfields
preparation for its CQC inspection in May 2016. In addition a number of other
mechanisms for testing quality and safety in the organisation, such as CQC walkabouts,
helped to inform the organisation about standards in services and in the front-line and
also supported preparation for CQC inspection.

Clinical Quality and Safety Performance Report 2015/6
Page 52 of 61
Clinical Quality and Safety Performance Report for
Moorfields Dubai (MEHD) 2015/6
1. PATIENT SAFETY
1.1 Incident Reporting
Incident reporting at Moorfields Dubai is a paper-based reporting system. When an incident occurs, each
staff member should report it immediately (within 24 hours) to their line manager and together
complete an Incident Report form. The line manager will inform the Quality Manager. Once the Incident
Report is completed with actions, this should be handed to the Quality Manager for analysis of incidents
and to provide an update on progress and challenges faced during the reporting period. The actions must
be communicated to the relevant staff involved.
We are currently looking at changing to an online IR platform based on WHO guidelines, similar to that
used by Moorfields UK.
Summary of Incidents;
Indicators
2015/16
Q1 Q2 Q3 Q4 YTD
Patient Safety Incident (PSI) 14 13 15 16 58
All other incidents 9 3 5 9 53
Total incidents 23 16 20 25 111
Sentinel Events 0 0 0 0 0
There have been no Sentinel Events (very serious incidents) reported this year. There have been 111 incidents reported this year. A number of notable incidents have been summarised below.

Clinical Quality and Safety Performance Report 2015/6
Page 53 of 61
Quarter 1 There have been a number of patient safety incidents this quarter, including 2 relating to similar issues.
There was an incident in OPD where a patient had a panic attack after cycloplegia drop instillation. There
was no harm or injury to the patient but they became quite distressed. After the event, on questioning
the patient admitted to suffering from panic attacks and was currently under a high level of anxiety. It is
important to note this was not an adverse drug reaction. The actions from this incident are to ensure the
OPD clinical team explain the impact of the drops to patients. An information leaflet has been produced
for patients and is offered to every patient who has drops. This has been discussed during Clinical
Governance Day (June 2015) and actions will be managed by Senior Nurse and OPD Manager.
The second event involved a patient who fainted during a theatre procedure. The patient had a minor
bruising injury as a result of this incident. No first aid or treatment was required. There are a number of
outpatient procedures, including laser that have been moved to theatre for safety and space reasons.
The impact of having these routine, outpatient procedures in theatre is that they may cause an increase
in anxiety for patients. Therefore an action from this incident is for the doctor or assisting nurse to check
with the patient if they are prone to dizzy spells, fainting or panic attacks when explaining the procedure.
On this particular occasion, the doctor was alone with the patient. This impacted on the ability to call for
help and take care of the patient. A further action decided by the theatre manager is to always have an
assistant with the doctor during any sort of procedure in theatre.
A ‘near miss’ patient safety incident occurred involving children playing with clinical equipment in a staff
only area. No harm or injury occurred and the equipment was undamaged. The action from this incident
is to ensure the clinical room doors are closed and children cannot wander off unsupervised. This was
communicated to the clinical team via email and is monitored by the H&S team.
There was a documentation incident involving missing clinician documents that was due to confusion
and lack of communication between departments. It is important that all staff, including managers work
together as a team and communicate effectively. If a member of the team is unavailable, it is important
that information is discussed with another senior member of the team and the unavailable staff kept
informed via email correspondence.
4 clinical incidents that have occurred this quarter; a dropped nucleus during complicated cataract
surgery, missing piece of gauze during theatre procedure, minor infection identified in outer rim of

Clinical Quality and Safety Performance Report 2015/6
Page 54 of 61
corneal grafts and delayed response to anaesthesia. These are reviewed by the clinician involved,
medical lead in Dubai and Medical Director in London. Further involvement and advice is often required
from the service director in London. These incidents are also discussed during the doctors meetings to
ensure the incidents are discussed on a peer level and actions are communicated.
There were 9 incidents of equipment failure this quarter. This is unlikely to be an increase in this type of
incident, simply an increased awareness in reporting. This will be monitored by the Commercial Officer in
line with equipment supplier contracts.
Quarter 2 There was an incident in theatre where a patient fainted during laser procedure. There was no serious
harm caused to the patient. When carrying out procedures going forward, the Doctor must have support
from nurse, clinical assistant, etc. This incident was discussed with the Theatre Manager and doctors. All
are to confirm with patients before procedure if they are prone to fainting, dizzy spells etc. Theatre
Manager is to add question to pre-operative questionnaire.
There was an incident in the paediatric department involving the dispensing of medication to a patient
by a nurse. Drops were issued to a patient’s mother for an appointment the following week. The patient
did not attend but returned one month later by which point the drops had expired. The patient did not
use the drops as the expiry date was noticed by the patient’s mother. All medication must be dispensed
by a doctor or a pharmacist.
Another incident occurred in the paediatric department relating to medication. A paediatric patient was
dilated with tropicamide instead of cyclopentolate. Tropicamide should not be given to paediatric
patients as it can cause respiratory issues. No harm was caused to this patient although they were
observed closely by paediatric ophthalmologist and parents advised to monitor child.
A patient attended for a surgical procedure with their own medication. This cannot be permitted at
MEHD. All dispensing of medication must be in line with MoH and DHCC guidelines to verify the control,
temperature and source of the medication.
There was an incident on OPD regarding patient identification. It is suspected that two different patients
attended a GCAA appointment with regards to colour vision testing. All patients must be asked for two
patient identifiers for every step of the appointment, including administration. GCAA patients will now
be asked to show their photographic identification at each stage of the journey in addition to the two
patient identifiers.
Quarter 3 There have been a number of medication/pharmacy related incidents this quarter.
One of the incidents involved a patient using out of date eye drops. A patient was issued with eye drops
from the OPD clinic, which was to be used prior to an appointment. The appointment was rescheduled
and when the patient returned for their appointment a month later the drops had expired. The patient
noted the expiry and did not use the drops however we had not alerted the patient to this important
detail. When reviewing the records, it was noted that the drops were issued from OPD clinic without any
documentation of this on the patient’s medical record and without doctor approval.

Clinical Quality and Safety Performance Report 2015/6
Page 55 of 61
A similar type of incident occurred later on that month where communication about use of medication
prior to an appointment was not followed by patient/not clear by staff. In this particular incident, eye
drops were issued for one member of the family, however two individuals actually used the eye drops.
No harm was done to the patient, however a further appointment was required for this second patient
to check the baseline findings. Again there was no documentation in either patient’s medical record
regarding instruction for eye drop usage.
There were also a number of incomplete or incorrect prescriptions noted this quarter. It is important
that all prescriptions are written in the same format and include the necessary information for the
patient, MEHD standards and DHCC standards/e-prescription. Our pharmacists can prescribe clarification
and support on this matter if required.
All staff are reminded that only doctors can prescribe and issue medication. If medication needs to be
prescribed for follow up appointments or outpatient treatment, this again must be authorised by a
doctor and clearly documented on the record.
There have also been a number of incidents regarding reactions to anaesthesia in the theatre
department. Currently at MEHD, we have a number of part-time anaesthetists working with our doctors.
These anaesthetists are very experienced and qualified (Moorfields UK were involved in recruitment
process) but need to be supported by MEHD. It is important to ensure we work together as a team and
when any type of reaction occurs, no matter how minor and without harm to the patient, it is reported in
the correct channels, i.e. to the theatre manager, medical director, quality manager and incident
reporting. A complete review of these cases was carried out by the newly appointed medical director
who was happy with our MEHD processes.
There was one incident of patient identification/documentation error. Two patients with similar names
were confused on arrival but identified during initial assessment process. There was further confusion
due to the VIP process. It is mandatory that all staff, clinical and non-clinical use 2 patient identifiers to
check any individual at all stages of the patient journey at MEHD.
There were 4 incidents of equipment failure this quarter. The equipment maintenance is being looked
after by the Clinical Assistants, Commercial Officer, Senior Nurse and Quality & Operations Manager. If
there is any clinical equipment that is not working, do please contact the Clinical Assistants first.
Quarter 4 There have been 5 incidents in the theatre with the IOL injector. This occurred during a number of the
consultants’ surgeries and does not relate to one specific individual. This has been discussed with the
Theatre Manager and the Medical Director and there is an action plan to change suppliers. The Medical
Director will be closely monitoring Phaco surgeries. No harm caused to any of the patients.
There were 2 incidents of incorrect Post op instructions given to patients. No harm caused to the
patients. This was discussed with the Theatre Manager and Medical Director and the cause was found to
be a lack of training. All staff have now been reviewed and trained by the Theatre Manager.
There was an incident regarding clinical documentation for a corporate client (GCAA). The GCAA
document does not have page numbers or patient identifier and therefore is easily confused. However,

Clinical Quality and Safety Performance Report 2015/6
Page 56 of 61
this was conveyed to the GCAA for possible amendments. All documentation from MEHD will be
reviewed and signed off by Aviation lead.
A patient approached a doctor requesting that changes be made to a medical record in order to gain insurance approval. Patient medical record cannot be amended retrospectively. We can support our patients by providing further supporting documents or correcting inaccurate diagnosis/records.
1.2 Infection Control
C. Difficile and E. Coli screening is not applicable at MEHD as the patients are out-patients/day case
surgeries only.
* No cases of previous MRSA were identified. The theatre manager is ensuring that all patients are asked
of their MRSA history in the surgical pre-assessment appointment.
Hand Hygiene and Medical Equipment Audits are significantly under target but have both improved in
the last quarter. There have been changes to the Infection Control team during the year, including a
period of time without a Senior Nurse and the lead infection control nurse relocating to the AD facility. It
is also worth noting, there has also not been a Medical Director appointed during the majority of this
time (appointed November 2015).
There are positive results for the Cleanliness Audit and Sharps Audit (CPQ requirement), which have
generally been consistently strong.
The infection control measures will be monitored closely by the newly appointed Senior Nurse who will
provide support and training experience from Moorfields London. The Senior Nurse will also have the
support from the new Medical Director.
Indicators Target Q1 14/15 Q2 Q3 Q4 YTD
MRSA Screening 100% N/A* N/A* N/A* N/A* N/A*
%Endophthalmitis post cataract 0.08% 0% 0% 0% 0% 0%
%Endophthalmitis post
AMD/DR 0.05% 0% 0% 0% 0% 0%
Adenovirus possible hospital
acquired NA 0 0 0 0 0
Indicators Target Q1 Q2 Q3 Q4 YTD
Hand hygiene compliance 95% 70% 80% 77% 85% 78%
Cleanliness inspections 95% 95% 78.3% 98.42% 98.3% 93%
Medical Equipment audit 90% 80% 78.3% 72% 78.3% 77%
Sharps Audit N/A 97.1% 91.1% 93.1% 94%

Clinical Quality and Safety Performance Report 2015/6
Page 57 of 61
2. CLINICAL EFFECTIVENESS
2.1 Guidelines and Policies
Title Department SOP, Protocol,
Policy, Clinical Guidelines
New/ Update
Incident Reporting Policy MEHD Policy Update
Crash Cart Management Policy OPD Clinical Policy Update
All policies were reviewed and updated in line with 2 year ratification dates but also in line for CPQ
assessment. There were 2 significant policy changes shown above.
An updated version of the Incident Reporting Policy was amended and made available to staff in Q1. This
involves a change to the method of reviewing incidents in line with assessing reactive risks in the
business. There is no change to the reporting process.
The Health and Safety team and pharmacist noted some discrepancies in the crash cart management
(Q4). This has been amended in policy and communicated to the relevant, affected staff.
2.2 Serious Incidents and Never Events
Speciality Metric 2015/2016
Incident Wrong patient 0%
Incident Wrong side 0%
Incident Wrong IOL 0%
Incident Unplanned 2nd surgery < 30days 0.07%
2.3 Clinical outcome measures
MEHD continues to work towards a full set of indicators similar to those produced by Moorfields UK.
3. PATIENT EXPERIENCE
3.1 Patient’s Satisfaction Survey
Patient experience is captured using an ipad survey. There are 3 ipads located in MEHD; OPD, Paediatrics and Reception. In Q1 the theatre survey was moved to the paediatric department due to volume of patients and the view to capture more feedback. In Q3, the feedback IT contract was reviewed to improve the survey technology, more ipads/survey locations were added in the hospital thus allowing patients easier access to leave feedback. The electronic feedback survey was temporarily unavailable in Q3 and Q4 the ipad. Paper based forms were available in English and Arabic for patients to complete instead of the electronic version.
The results were reviewed weekly at the Performance Improvement Committee meetings and shared with
all staff on a monthly basis.

Clinical Quality and Safety Performance Report 2015/6
Page 58 of 61
Overall there were low reporting numbers, around 4% of patients completed the electronic or paper
feedback form. We are aiming for a minimum of 15% response rate as per MEH standards. All staff were
informed of the low figures and advised to encourage patients to complete feedback survey in monthly
email. One incentive was involving the translators in the process in order to gather more patient feedback.
There has been a noted improvement since this initiative has started, however it has not had a direct
impact on the above figures due to collecting data for doctor’s appraisals. This has significantly risen (more
than double) with the new patient feedback software.
Question 14: Would you recommend this Hospital to a family member/friend? Answer: 87% Yes Consistently excellent results from this measure, all above 85%. In addition, over target for MEH Benchmarking/Average of 79%, however must be noted the minimum response rate is still not met. Over the period there were complaints recorded on the feedback survey. Complaints by type;
Quarter 1
The main patient complaints are waiting times (10), communication (4) and staff attitude (3). All
comments are followed up to understand the feedback and ensure we can implement the right actions
for improvement.
The complaint of patient waiting times covers a range of issues. The new OPD manager (appointed last
quarter) is working on gaining clarification on waiting time complaints to better evaluate the service. The
clinical assistant role has been a great support with waiting times before, during and after appointments
with communicating waiting times, pathway process and ensuring investigations and documentation is
complete to aid check out procedure. There is a plan to recruit a new clinical assistant for additional
support to the OPD clinics. This should be during Q2. These roles will be managed by the Senior Nurse
and OPD Manager, with support from the Operations Manager when required.
Quarter 2
The main patient complaints are waiting times (7) and clinic appearance (2). All comments are followed
up to understand the feedback and ensure we can implement the right actions for improvement. This is
discussed on a weekly basis in PPC meetings.
There have also been a number of positive comments with staff members named for their care towards the patient. All patient feedback is communicated to staff via a monthly email and displayed in the staff room:

Clinical Quality and Safety Performance Report 2015/6
Page 59 of 61
“The facility is extremely friendly and the environment is very welcoming for the patient. I completely respect xxxx as he is an outstanding expert and very caring doctor.” “The staff is also very nice and accommodating” “xxxx was really excellent, explained the details well”
“xxxx has been a great form of support both medically and emotionally. I wish to express my gratitude to the doctor and the hospital staff for their continued help and assistance throughout the treatment” “As I have made several visits to the hospital, I would like to draw your attention to the nurse named xxxx. She has an exceptional kind and patient personality. She noticed how my eyes watered whilst taking the eye tests so instructed me to briefly blink momentarily I between the scans etc. She was the only one to have done this and made the experience less uncomfortable. She also explained about the procedures fully with excellent instructions. xxxx gives a very personal service and is well informed with a very caring and nurturing manner. Many thanks for the best experience in Moorfields to date xxxx is an absolute asset to Moorfields Hospital.” 3.2 Patient’s Complaints Register
Last year a complaints register was introduced to replace the complaints/error books in OPD and
Theatre. This also provides a record for the administrative department to use. This allows patient
complaints to be recorded, monitored and analysed. This has been modified to simplify and improve
staff usage. It is important this is used for recording patient comments and complaints as the service
cannot be improved if we do not know or understand our patient needs.
Any verbal complaints, feedback or suggestions are noted by the OPD Manager and Administrative Supervisor and monitored at the PPC meeting on a weekly basis. Complaints by type;
Quarter 1
41 patient complaints have been reported over the last 3 months; 35 about waiting times in OPD, 10
poor communication (some patients had multiple concerns). The OPD Manager has been working on
analyzing the ‘waiting time’ complaint and has categorized by doctor, allied health or general. There has
also been work into reviewing ‘what is an acceptable waiting time’ for a patient and what is realistic for
MEHD with our clinical pathway process. If these two times do not match, we will continue to have
complaints so it is highlighted the importance of communication to our patients about our specific
service.

Clinical Quality and Safety Performance Report 2015/6
Page 60 of 61
It is key that all departments use this complaints/comments log to capture this important information.
This quarter it has only been used by the OPD Manager. The administrative team leaders have been
asked to record their findings so the complete patient experience can be reviewed.
Quarter 2
37 patient complaints have been reported over the last 3 months; 28 on waiting times in OPD, 4
comments on poor communication with regards to explaining clinical pathway when booking
appointment (no optometrist visit mentioned or explained) and 4 clinic management concerns all
regarding patients not attending at their appointment time but expecting to be seen.
The OPD Manager has been working on analyzing the ‘waiting time’ complaint and has categorized by
doctor, allied health or general. The majority of waiting time comments refer to doctor or optometrist. It
has been discussed by both PPC and SMM to change the clinical process to increase support for the
doctors by allocating each clinician a nurse. The nurse will take responsibility for managing a particular
doctors clinic flow. This will allow the OPD manager more time to efficiently manage the OPD
department. The clinical assistants will be available to further support this process. There are some
restrictions with nursing staff numbers (training areas required and identified) and clinic layout with
respect to investigations. This is being managed by the PPC who will continue to work on putting this
idea into practice.
It is key that all departments use this complaints/comments log to capture this important information.
This quarter it has only been used by the OPD Manager. The administrative team leaders have been
asked to record their findings so the complete patient experience can be reviewed.
Quarter 3
The main patient complaints are waiting times (52) and communication (5).
The complaints are now recorded in detail, thus allowing a clearer understanding of our patients’
complaints and concerns. In turn, allowing changes and improvements to be made from our patient’s
individual feedback.
In terms of waiting times, it is important to understand what the specific complaint is, i.e. wait for doctor
or optometrist, in order to review that particular aspect of the patient journey. This quarter we had a
large number of complaints regarding waiting times for optometrist and doctor. The process and
pathway for optometrist bookings and service provide was reviewed by the lead Optometrist,
Operations Director and Medical Director. A change to the booking system for optometrists has been
implemented. This shall be reviewed closely to ensure service improvement.
Communication is always linked to waiting times. It is important to continually remember to provide
patients with clear and honest waiting times once in the clinic. This is being managed by the OPD
Manager who is supported by the nursing and clinical assistant team. In Q4, the OPD clinics will be
modified to change the pathway of patient visits by allocating each doctor with a nurse. The nurse will
assist the doctor by managing the list together. This will hopefully improve communication and waiting
times. These changes will be regular monitored by the PPC to ensure an improvement to patient care is
seen.
There have also been a small number of comments regarding information about appointments provided
before the patient arrives to MEHD, i.e. when booking appointment on telephone. It is important these

Clinical Quality and Safety Performance Report 2015/6
Page 61 of 61
comments are feedback to the administration team to improve booking process by incorporating
patient’s suggestions into our processes. There is a limit to how much information can be given to a
patient on the telephone or in a SMS confirmation/reminder message. To support the administration
team, regular training is carried out and the website has recently been updated which details the
pathway to ensure patients have access to written information about our hospital and appointment
processes.
Quarter 4
The main patient complaints are waiting times for doctor (8) and optometrist (9).
Complaints are now recorded in detail, thus allowing a clearer understanding of our patients’ complaints
and concerns. In turn, allowing changes and improvements to be made from our patient’s individual
feedback.
In terms of waiting times, it is important to understand what the specific complaint is, i.e. wait for doctor
or optometrist, in order to review that particular aspect of the patient journey. This quarter we again had
a large number of complaints regarding waiting times for optometrist and doctor. The process and
pathway for optometrist bookings was changed this quarter. This does not appear to have improved the
process with respect to patient complaints. It has made the booking system easier for the administration
team and allowed patients increased access and flexibility for appointments. This has been discussed
with the optometrist team and PPC. This will be monitored closely next quarter and further changes to
be made if no improvement.
Summary
The main complaints are waiting times and communication. Waiting times appear to have improved as
there is a lower number of complaints recorded during the 4th quarter.