Embed Size (px)
Citation preview
Chapter 2
Service Strategy
Chapter 2
Service Strategy
©2007 copyright of Zenetex unless otherwise stated.
2-1
Chapter Objectives
This chapter will enable you to: Account for the main goals and objectives of Service StrategyDefine and explain Utility & Warranty, Resources & Capabilities, Service Portfolio, Service Catalog, Business Case and RiskExplain how Resources and Capabilities create value in the form of goods and servicesState the objectives and basic concepts for the Demand Management and FinancialState the objectives and basic concepts for the Demand Management, and Financial Management processes
©2007 copyright of Zenetex unless otherwise stated.
2-2
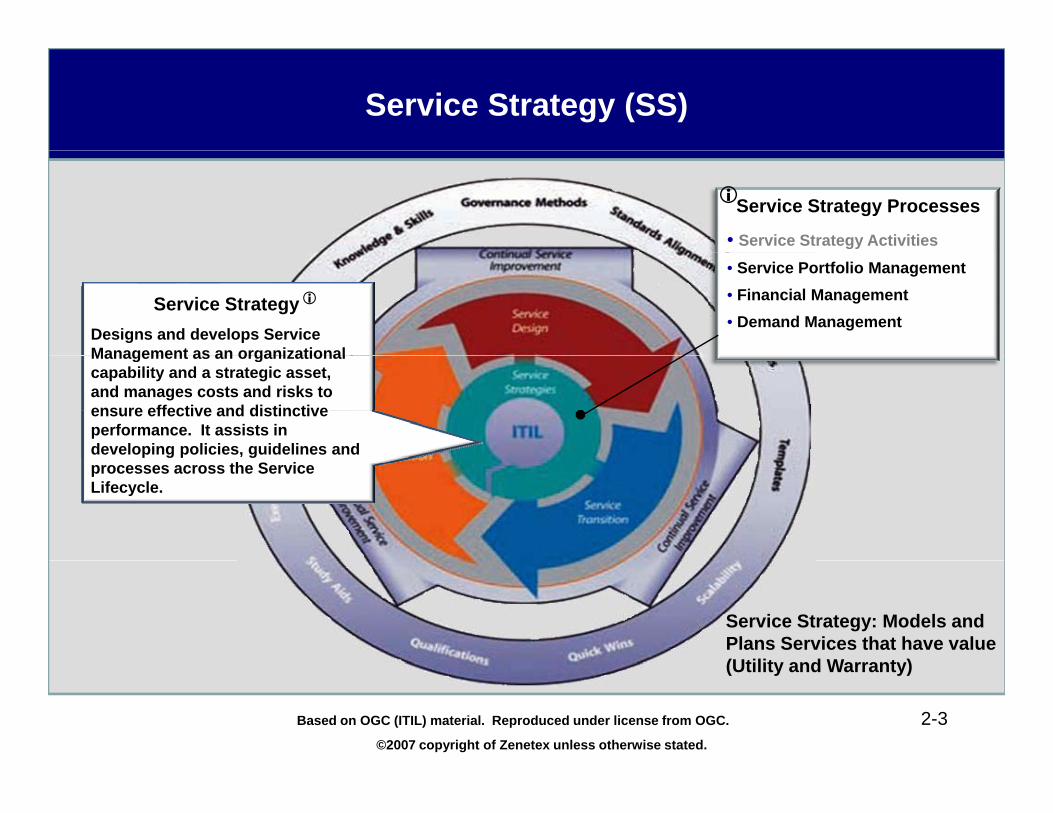
Service Strategy (SS)
Service Strategy Processes
• Service Strategy Activities• Service Portfolio Management• Financial Management• Demand Management
Service StrategyDesigns and develops Service Management as an organizationalManagement as an organizational capability and a strategic asset, and manages costs and risks to ensure effective and distinctive performance. It assists in developing policies, guidelines and processes across the Service Lifecycle.
Service Strategy: Models and Plans Services that have value (Utility and Warranty)
©2007 copyright of Zenetex unless otherwise stated.
2-3
(Utility and Warranty)
Based on OGC (ITIL) material. Reproduced under license from OGC.
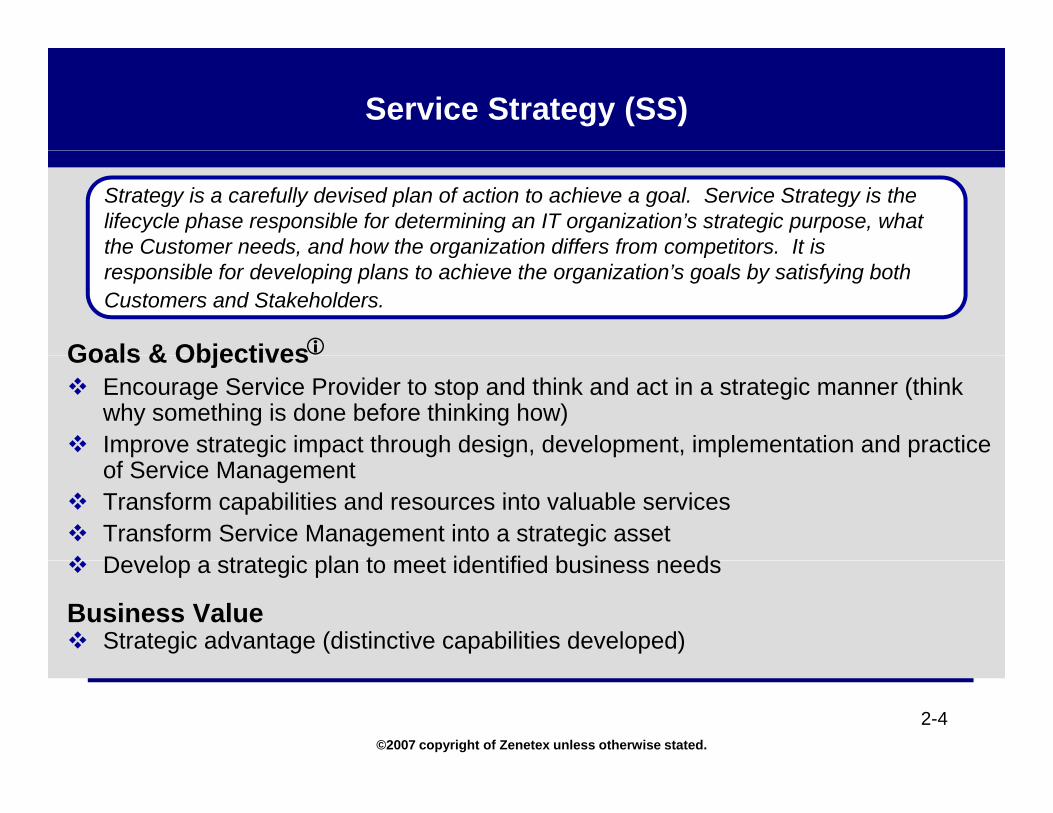
Service Strategy (SS)
Strategy is a carefully devised plan of action to achieve a goal. Service Strategy is the lifecycle phase responsible for determining an IT organization’s strategic purpose, what the Customer needs, and how the organization differs from competitors. It is
Goals & Objectives
the Customer needs, and how the organization differs from competitors. It is responsible for developing plans to achieve the organization’s goals by satisfying both Customers and Stakeholders.
Goals & Objectives Encourage Service Provider to stop and think and act in a strategic manner (think why something is done before thinking how)Improve strategic impact through design, development, implementation and practice of Service Management Transform capabilities and resources into valuable services Transform Service Management into a strategic assetDevelop a strategic plan to meet identified business needsDevelop a strategic plan to meet identified business needs
Business ValueStrategic advantage (distinctive capabilities developed)
©2007 copyright of Zenetex unless otherwise stated.
2-4
Service Strategy Questions
Service Strategy answers the following questions:What services should we offer and to whom?How can financial management provide visibility and control over value-creation?How do we:
T l t l f C t ?• Truly create value for our Customers?• Differentiate ourselves from competing alternatives? • Create value for our Stakeholders?• Make a case for strategic investment?Make a case for strategic investment?• Define service quality?• Choose between different paths for improving service quality?• Efficiently allocate resources across a portfolio of services?y p• Resolve conflicting demands for shared resources?
Strategy begins with the Customer’s desired outcomes.
©2007 copyright of Zenetex unless otherwise stated.
2-5

Service Strategy Model
St t tiMeasurement and evaluation
Determine perspectiveAnalyze
external
Strategy generation,evaluation and selectionStrategic assessment
Vision
Form a position
Establish objectives
external factors
Service Strategy
Continual Service
ImprovementPolicies
• Service Portfolio
Craft a plan
Adopt
objectives
Analyze internal factors
Plans
• Service Design requirements
• Service Transition requirements
S i O tiAdopt patterns of
action
factors
Actions
Measurement and evaluation
• Service Operation requirements
©2007 copyright of Zenetex unless otherwise stated.
2-6© Crown copyright 2007 Reproduced under license from OGC
The Value Proposition of Services (1 of 4)
Types of AssetsService Assets (create value)Customer Assets (receive service value)
Services create value for organizations and Customers by:Increasing the performance potential of Customer assets (increase value)Reducing risks of performance variations in Customer assetsImproving the design, transition and operation of services
Considerations for Creating OutcomesCustomer Business ObjectivesIT Objectives Process Metrics
©2007 copyright of Zenetex unless otherwise stated.
2-7
The Value Proposition of Services (2 of 4)
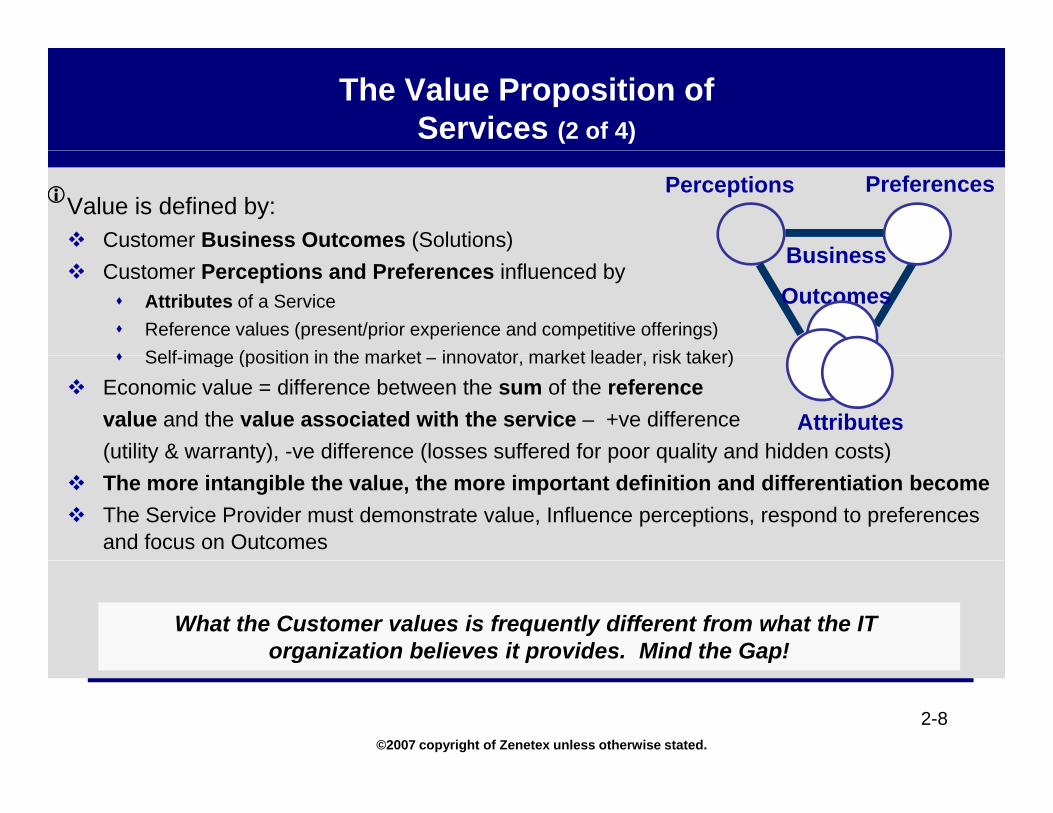
Value is defined by:Customer Business Outcomes (Solutions)
PreferencesPerceptions
BusinessCustomer Perceptions and Preferences influenced by
Attributes of a ServiceReference values (present/prior experience and competitive offerings)Self image (position in the market innovator market leader risk taker)
Business
Outcomes
Self-image (position in the market – innovator, market leader, risk taker)
Economic value = difference between the sum of the reference value and the value associated with the service – +ve difference (utility & warranty), -ve difference (losses suffered for poor quality and hidden costs)
Attributes(utility & warranty), ve difference (losses suffered for poor quality and hidden costs)The more intangible the value, the more important definition and differentiation becomeThe Service Provider must demonstrate value, Influence perceptions, respond to preferences and focus on Outcomes
What the Customer values is frequently different from what the IT organization believes it provides. Mind the Gap!
©2007 copyright of Zenetex unless otherwise stated.
2-8
g
The Value Proposition of Services (3 of 4)
Marketing Mindset is required to determineWhat outcomes matter?How are they ranked in terms of customer perceptions and preferences?Focus on the Customer’s perspective and fulfillment of outcomes
What is our business?Who is our customer?What does our customer value?Who depends on our services?Wh th l bl t th ?Why are they valuable to them?
Differentiation is important (adds value)Communication services instead of routers and switchesCollaboration services instead of just email and voice mail servicesCollaboration services instead of just email and voice mail services
©2007 copyright of Zenetex unless otherwise stated.
2-9
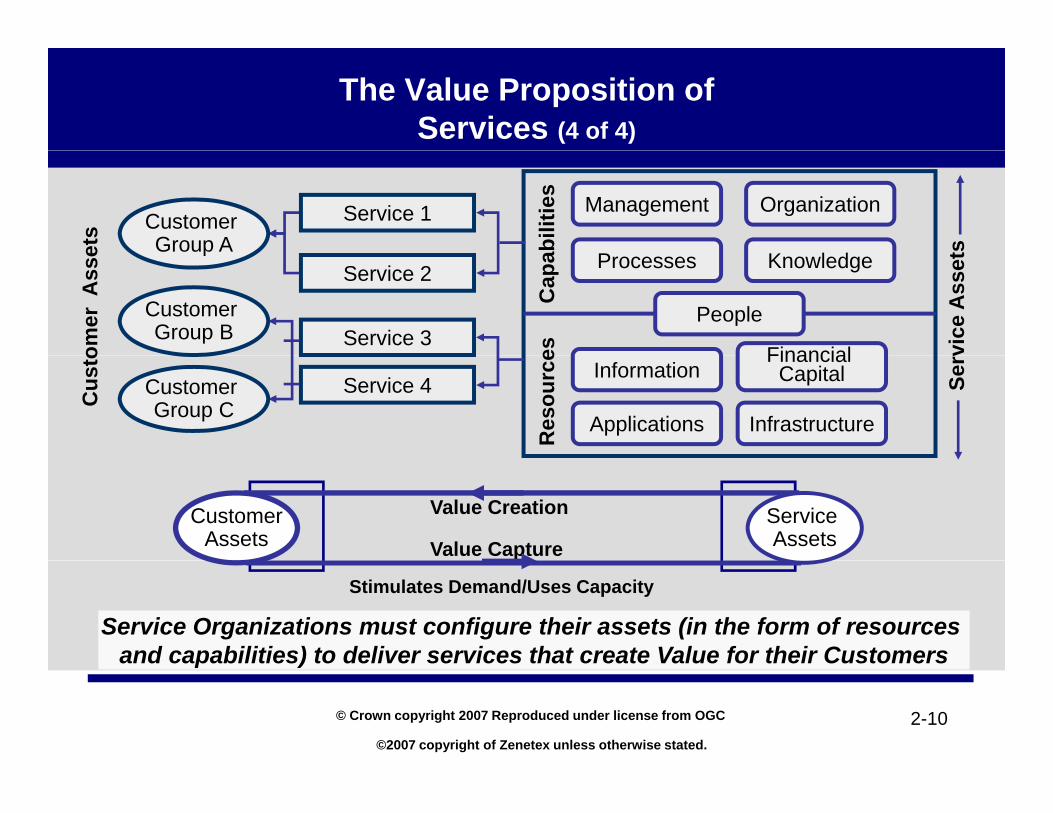
The Value Proposition of Services (4 of 4)
Customer Group A
Service 1 Management
P K l d
Organization
abili
ties
tsets p
Customer Group B
Service 2
Service 3
Processes Knowledge
FinancialesC
apa
People
vice
Ass
et
omer
Ass
e
Customer Group C
Service 4Information
Applications Infrastructure
Financial Capital
Res
ourc
e
Serv
Cus
to
Customer Assets
Service Assets
Value Creation
Value Capture
Service Organizations must configure their assets (in the form of resources and capabilities) to deliver services that create Value for their Customers
Stimulates Demand/Uses Capacity
©2007 copyright of Zenetex unless otherwise stated.
2-10
and capabilities) to deliver services that create Value for their Customers
© Crown copyright 2007 Reproduced under license from OGC
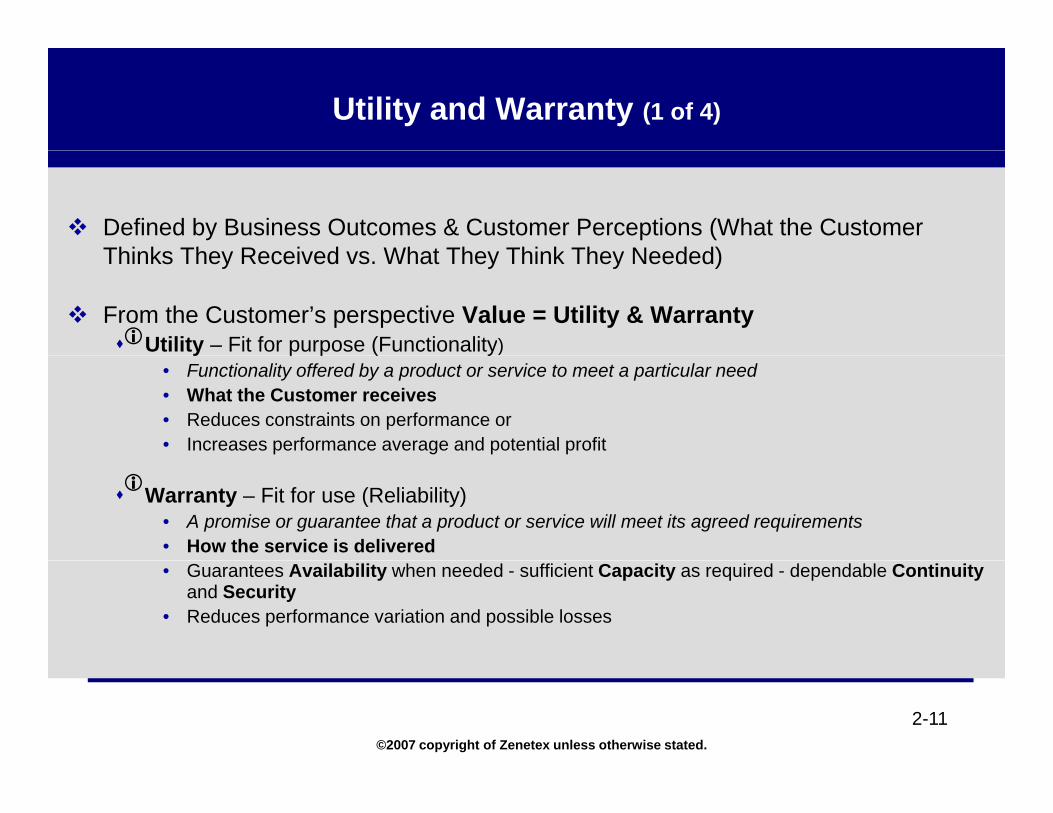
Utility and Warranty (1 of 4)
Defined by Business Outcomes & Customer Perceptions (What the Customer Thinks They Received vs What They Think They Needed)Thinks They Received vs. What They Think They Needed)
From the Customer’s perspective Value = Utility & WarrantyUtility – Fit for purpose (Functionality)y p p ( y
• Functionality offered by a product or service to meet a particular need• What the Customer receives• Reduces constraints on performance or• Increases performance average and potential profit
Warranty – Fit for use (Reliability)• A promise or guarantee that a product or service will meet its agreed requirements• How the service is delivered• Guarantees Availability when needed - sufficient Capacity as required - dependable Continuity
and Security• Reduces performance variation and possible losses
©2007 copyright of Zenetex unless otherwise stated.
2-11
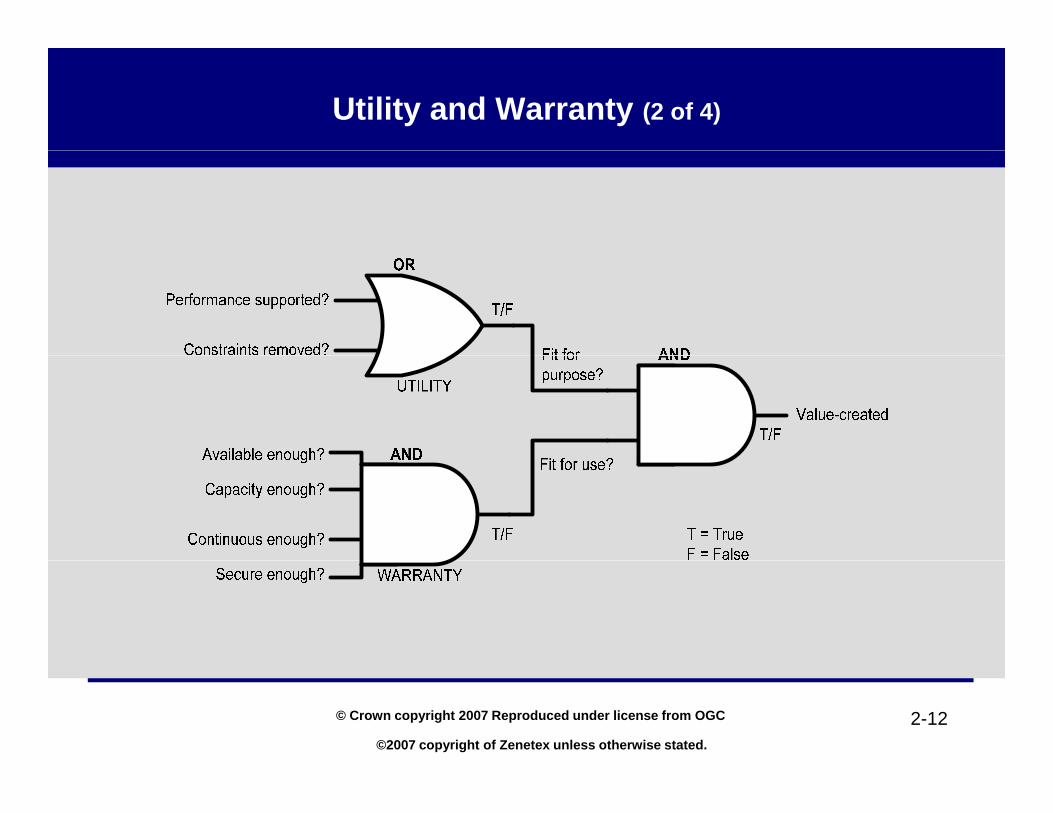
Utility and Warranty (2 of 4)
©2007 copyright of Zenetex unless otherwise stated.
2-12© Crown copyright 2007 Reproduced under license from OGC
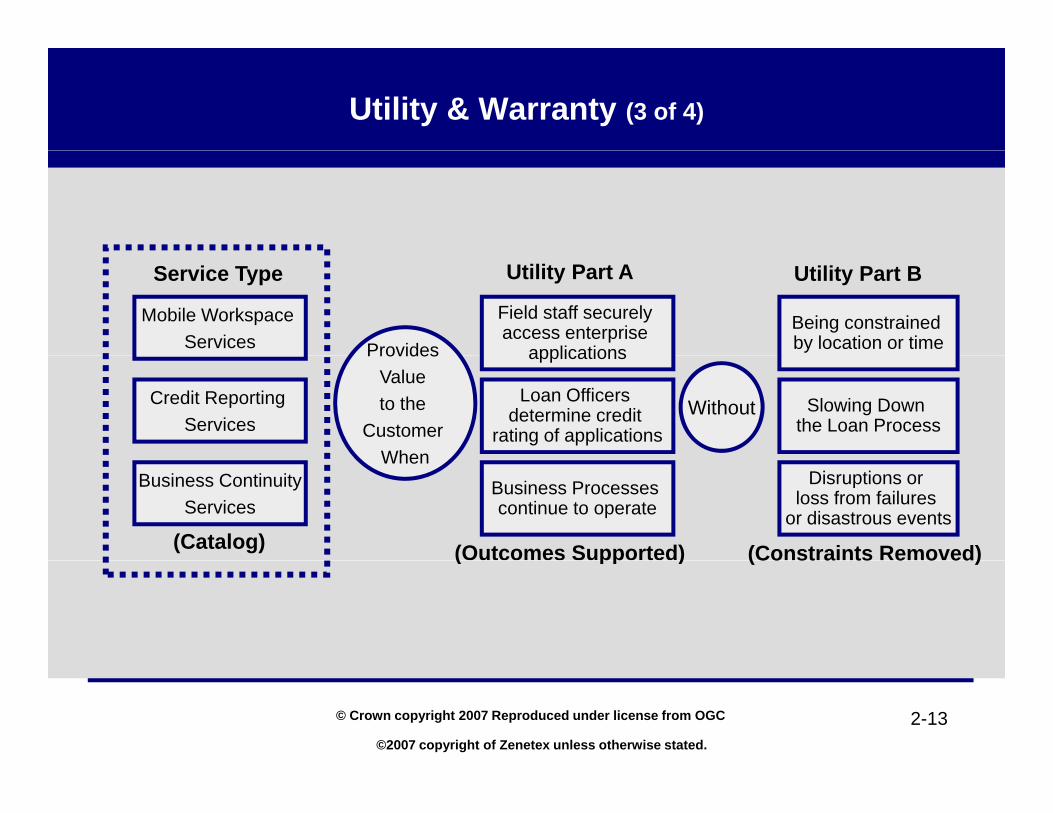
Utility & Warranty (3 of 4)
Mobile Workspace Services
Service Type
Field staff securely access enterprise
applicationsBeing constrained by location or timeProvides
Utility Part A Utility Part B
Credit Reporting Services
applications
Loan Officers determine credit
rating of applicationsSlowing Down
the Loan Process
Provides Value to the
Customer When
Without
Business ContinuityServices
(Catalog)
Business Processes continue to operate
Disruptions or loss from failures
or disastrous events
When
(Outcomes Supported) (Constraints Removed)( pp ) (Co st a ts e o ed)
©2007 copyright of Zenetex unless otherwise stated.
2-13© Crown copyright 2007 Reproduced under license from OGC
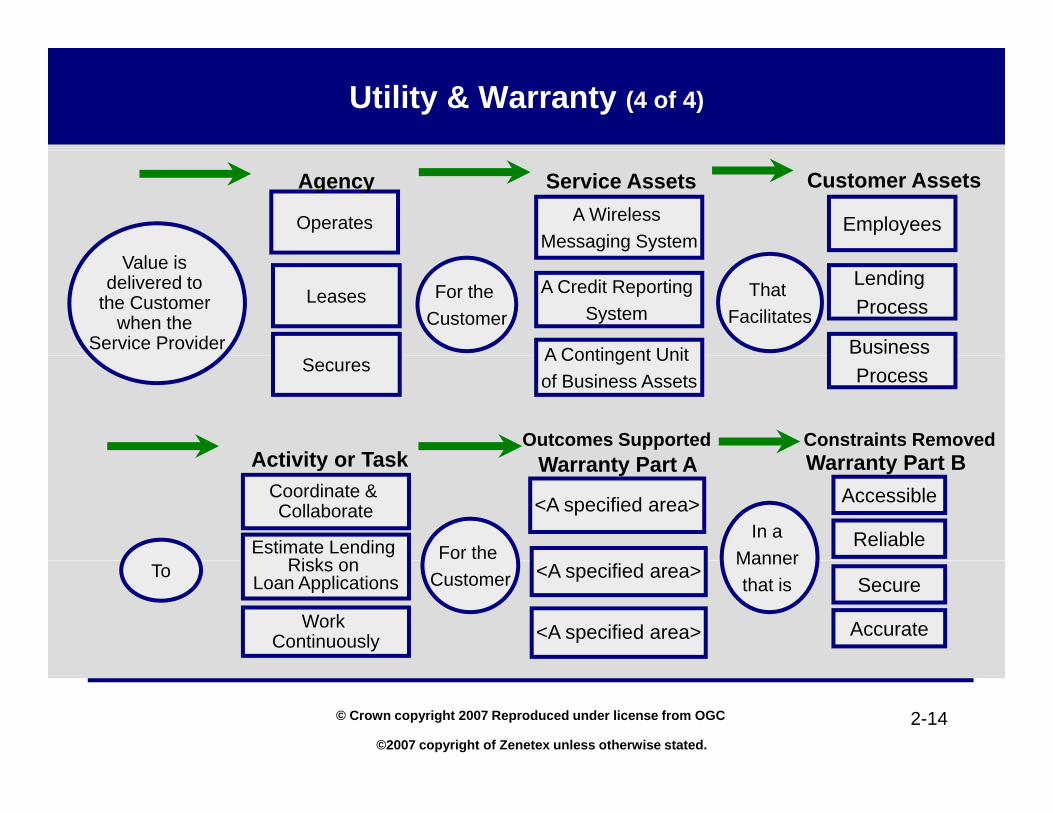
Utility & Warranty (4 of 4)
Operates A Wireless Messaging System
Employees
Agency Service Assets Customer Assets
Value is delivered to
the Customer when the
Service Provider
Leases For the Customer
A Credit Reporting System
A Contingent Unit
That Facilitates
Lending Process
Business Secures A Contingent Unit
of Business Assets Process
Activity or Task W t P t A W t P t BOutcomes Supported Constraints Removed
Coordinate & Collaborate
Estimate Lending Ri k For the
<A specified area>In a
Manner
Accessible
Reliable
Activity or Task Warranty Part A Warranty Part B
To Risks on Loan Applications
Work Continuously
Customer <A specified area>
<A specified area>
Manner that is Secure
Accurate
©2007 copyright of Zenetex unless otherwise stated.
2-14© Crown copyright 2007 Reproduced under license from OGC
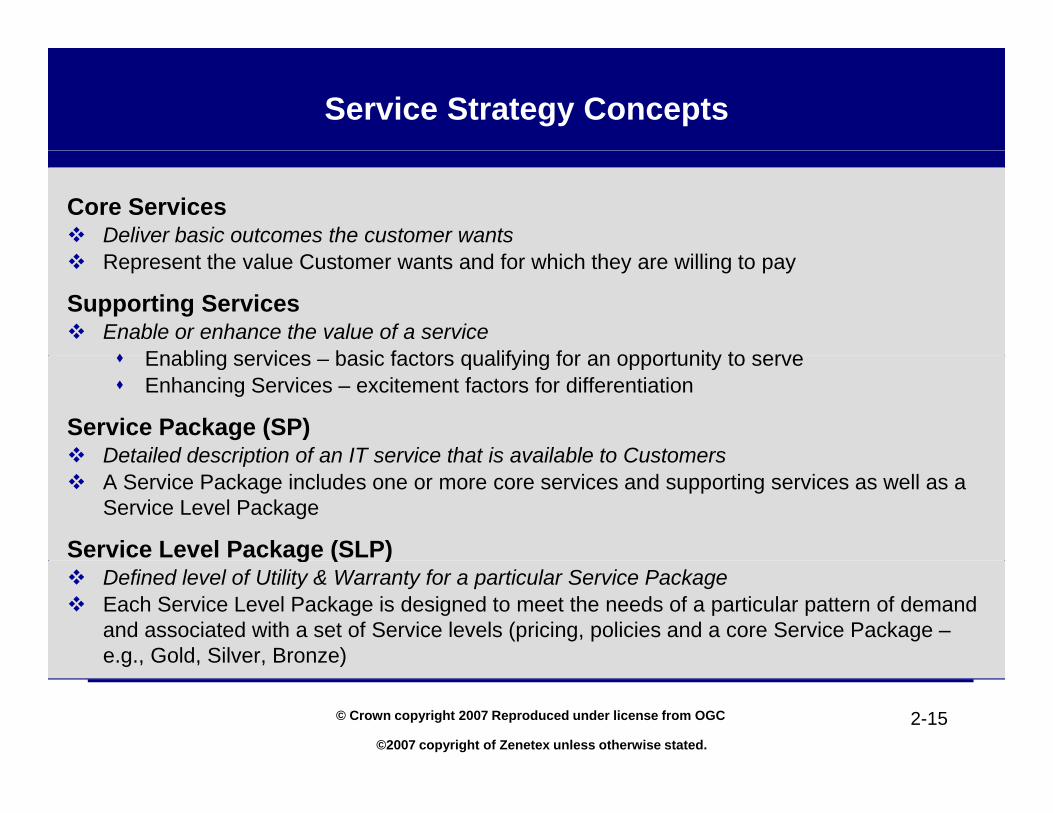
Service Strategy Concepts
Core ServicesDeliver basic outcomes the customer wants Represent the value Customer wants and for which they are willing to pay
Supporting ServicesEnable or enhance the value of a service
Enabling services basic factors qualifying for an opportunity to serveEnabling services – basic factors qualifying for an opportunity to serveEnhancing Services – excitement factors for differentiation
Service Package (SP)Detailed description of an IT service that is available to CustomersDetailed description of an IT service that is available to CustomersA Service Package includes one or more core services and supporting services as well as a Service Level Package
Service Level Package (SLP)g ( )Defined level of Utility & Warranty for a particular Service Package Each Service Level Package is designed to meet the needs of a particular pattern of demand and associated with a set of Service levels (pricing, policies and a core Service Package –e.g., Gold, Silver, Bronze)
©2007 copyright of Zenetex unless otherwise stated.
2-15
g , , , )
© Crown copyright 2007 Reproduced under license from OGC
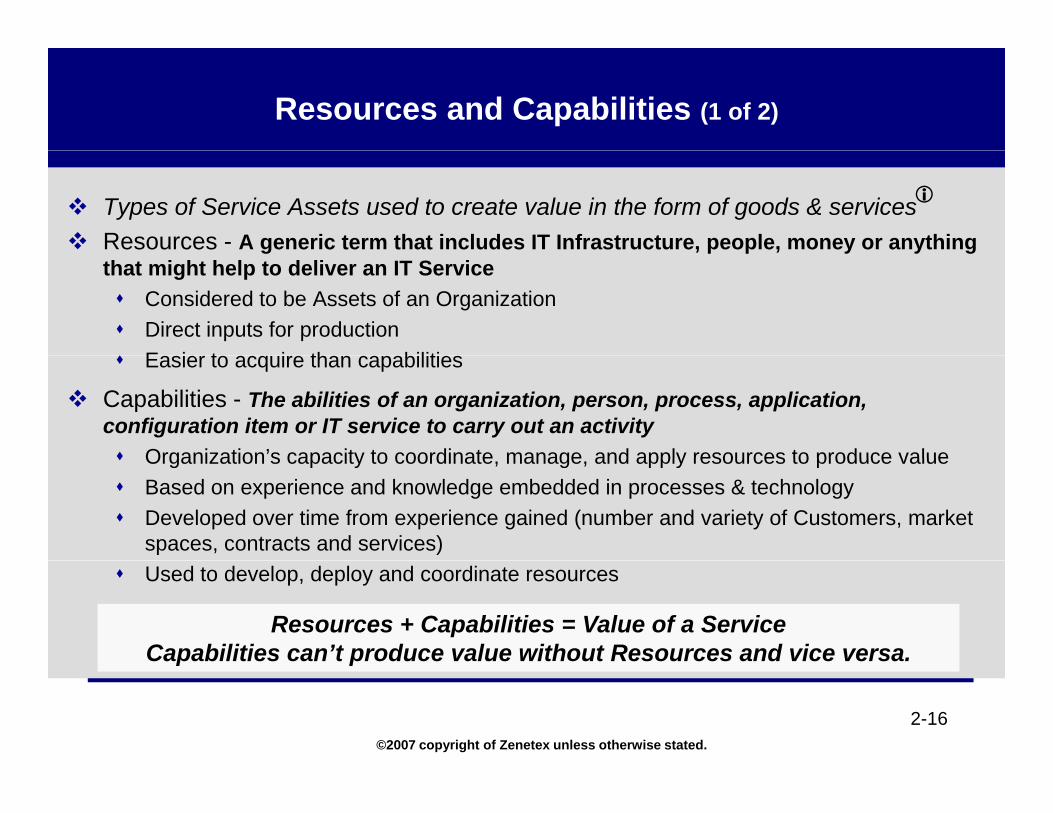
Resources and Capabilities (1 of 2)
Types of Service Assets used to create value in the form of goods & servicesResources - A generic term that includes IT Infrastructure, people, money or anything g p p y y gthat might help to deliver an IT Service
Considered to be Assets of an OrganizationDirect inputs for productionE i t i th bilitiEasier to acquire than capabilities
Capabilities - The abilities of an organization, person, process, application, configuration item or IT service to carry out an activity
Organization’s capacity to coordinate manage and apply resources to produce valueOrganization s capacity to coordinate, manage, and apply resources to produce valueBased on experience and knowledge embedded in processes & technologyDeveloped over time from experience gained (number and variety of Customers, market spaces, contracts and services)Used to develop, deploy and coordinate resources
Resources + Capabilities = Value of a ServiceCapabilities can’t produce value without Resources and vice versa.
©2007 copyright of Zenetex unless otherwise stated.
2-16
p p
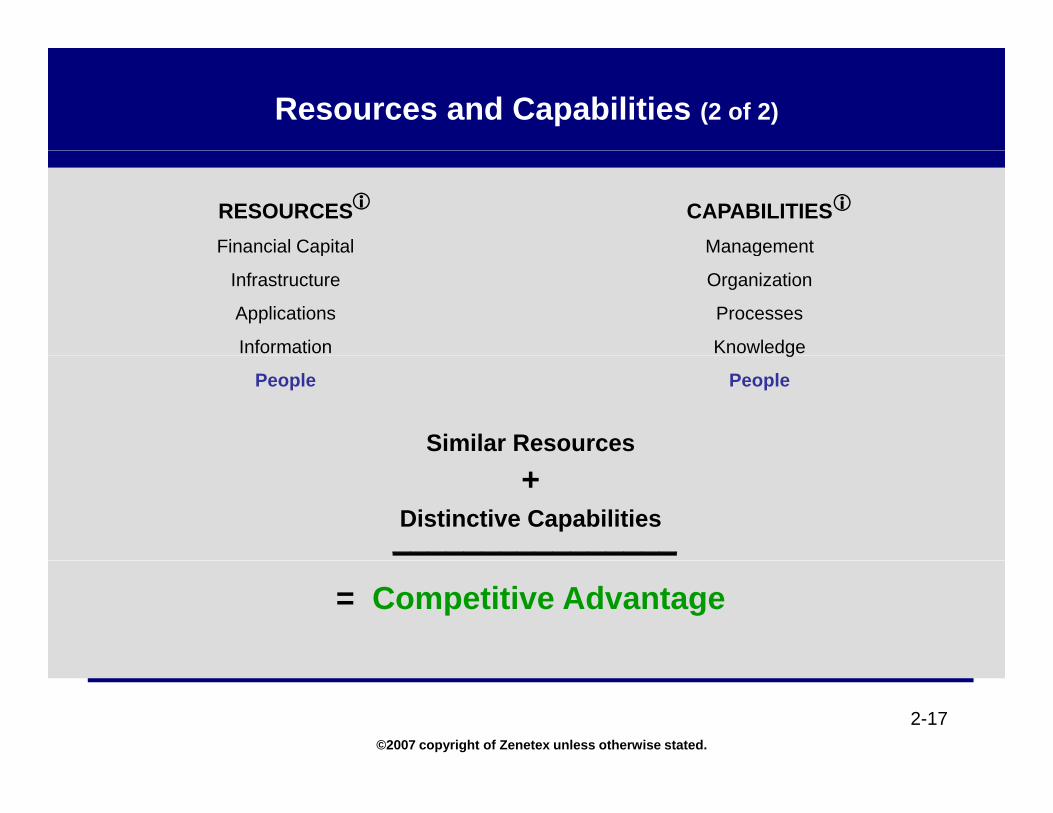
Resources and Capabilities (2 of 2)
RESOURCES CAPABILITIESFinancial Capital Managementp g
Infrastructure Organization
Applications Processes
Information Knowledge
Similar Resources
g
People People
Distinctive Capabilities+
________________
= Competitive Advantage
©2007 copyright of Zenetex unless otherwise stated.
2-17
Service Portfolio (1 of 4)
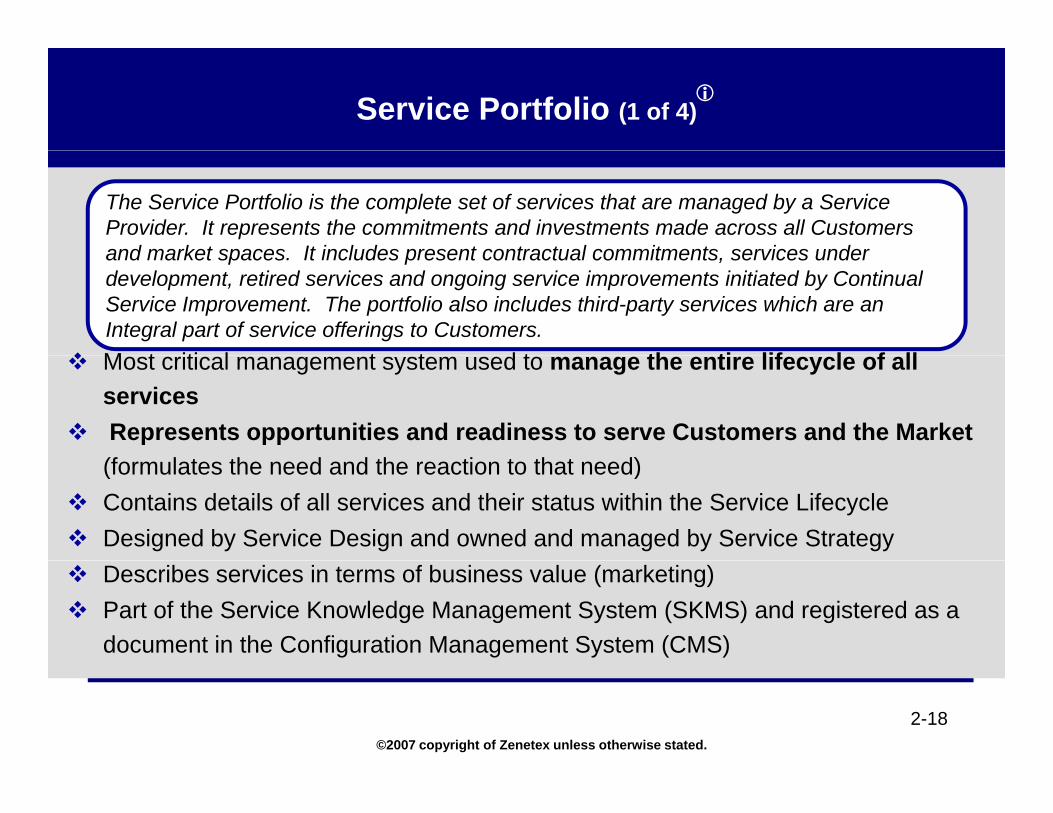
The Service Portfolio is the complete set of services that are managed by a Service Provider. It represents the commitments and investments made across all Customers and market spaces It includes present contractual commitments services under
M t iti l t t d t th ti lif l f ll
and market spaces. It includes present contractual commitments, services underdevelopment, retired services and ongoing service improvements initiated by Continual Service Improvement. The portfolio also includes third-party services which are an Integral part of service offerings to Customers.Most critical management system used to manage the entire lifecycle of all servicesRepresents opportunities and readiness to serve Customers and the Market(f l t th d d th ti t th t d)(formulates the need and the reaction to that need)Contains details of all services and their status within the Service Lifecycle Designed by Service Design and owned and managed by Service StrategyDescribes services in terms of business value (marketing)Part of the Service Knowledge Management System (SKMS) and registered as a document in the Configuration Management System (CMS)
©2007 copyright of Zenetex unless otherwise stated.
2-18
Service Portfolio (2 of 4)
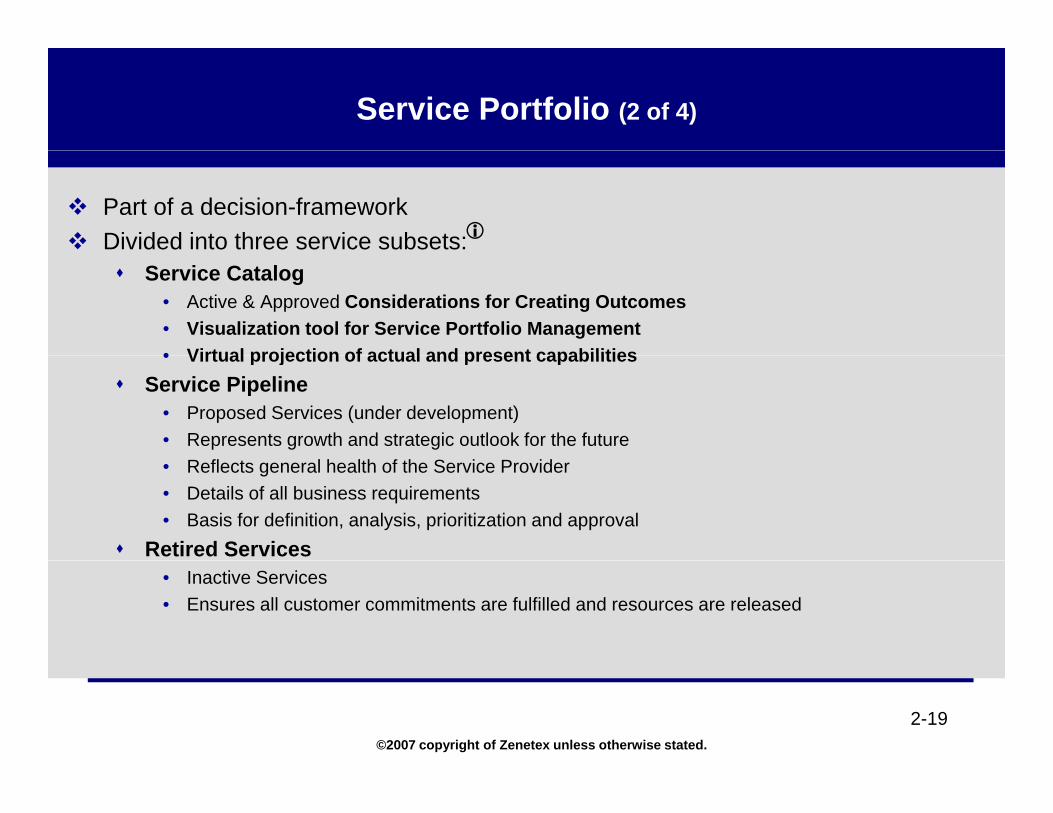
Part of a decision-frameworkDivided into three service subsets:
Service Catalog• Active & Approved Considerations for Creating Outcomes• Visualization tool for Service Portfolio Management• Virtual projection of actual and present capabilities• Virtual projection of actual and present capabilities
Service Pipeline• Proposed Services (under development)• Represents growth and strategic outlook for the future• Reflects general health of the Service Provider • Details of all business requirements • Basis for definition, analysis, prioritization and approval
Retired Services• Inactive Services • Ensures all customer commitments are fulfilled and resources are released
©2007 copyright of Zenetex unless otherwise stated.
2-19
Service Portfolio (3 of 4)
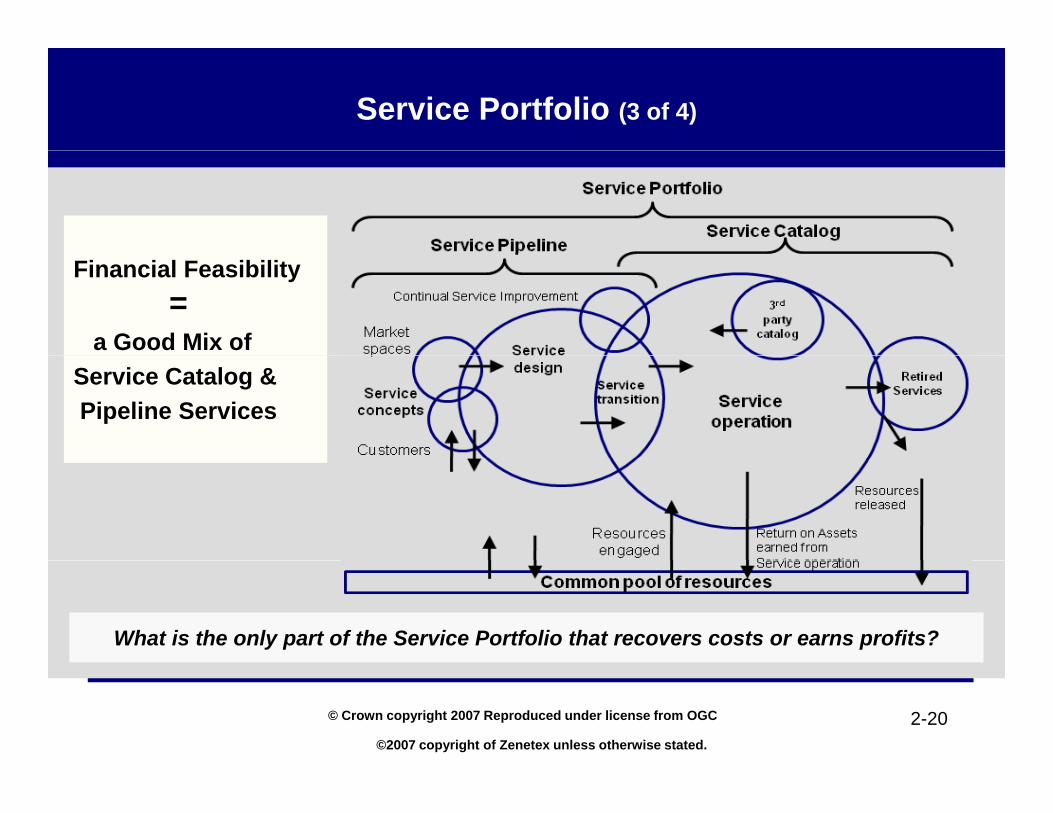
Financial Feasibility=
a Good Mix of Service Catalog & Pipeline Services
What is the only part of the Service Portfolio that recovers costs or earns profits?
©2007 copyright of Zenetex unless otherwise stated.
2-20© Crown copyright 2007 Reproduced under license from OGC
Service Portfolio (4 of 4)
Clarifies or helps to clarify the following strategic questions:Why should a customer buy these services?y yWhy should they buy these services from you?What are the pricing or chargeback models?What are my strengths and weaknesses, priorities and risk?y g , pHow should my resources and capabilities be allocated?
©2007 copyright of Zenetex unless otherwise stated.
2-21
Value of the Service Portfolio
Most effective way of managing all aspects of services throughout their lifecycleUses appropriate management tools to support all processespp p g pp pHelps prioritize investments and improve the allocation of resourcesArticulates business needs and Service Provider’s response to themMain source of information on the requirements and servicesProvides a means for comparing service competitiveness
©2007 copyright of Zenetex unless otherwise stated.
2-22
Service Catalog (1 of 4)
Database or structured document with detailed information about all live IT services including those under development and those transitioning.
Subset of the Service Portfolio that includes Active and Approved Services(Active & Current Capabilities) D fi it i f h t i f ll d S i P tf li M t dDefines criteria for what services fall under Service Portfolio Management and objectives of each serviceClustered into Lines of Service (LOS) based on common patterns of business activity (PBA) they can supportactivity (PBA) they can supportCommunicates and defines policies, guidelines & accountabilityService order and demand channeling mechanism - acquisition portal for Customers (pricing, service-level commitments & terms of services provided)(p g, p )Important tool for Service Strategy to visualize Service Portfolio Management decisions
©2007 copyright of Zenetex unless otherwise stated.
2-23
Service Catalog (2 of 4)
Expression of the Service Provider’s operational capability within the context of a Customer or Market SpaceMay be multiple Service Catalogs chartered from the Service Portfolio
Divided into two parts:Business Service Catalog (Customer View)
• Maps Services to business units & business processes they rely on• Facilitates development or more proactive & preemptive Service Level Management
processprocessTechnical Service Catalog (Service Provider View)
• Maps Services to those services, shared services, components & CIs required to support them
• Facilitates development of SLAs, OLAs & 3rd party Contracts– Identifies technology and responsible support groups
©2007 copyright of Zenetex unless otherwise stated.
2-24
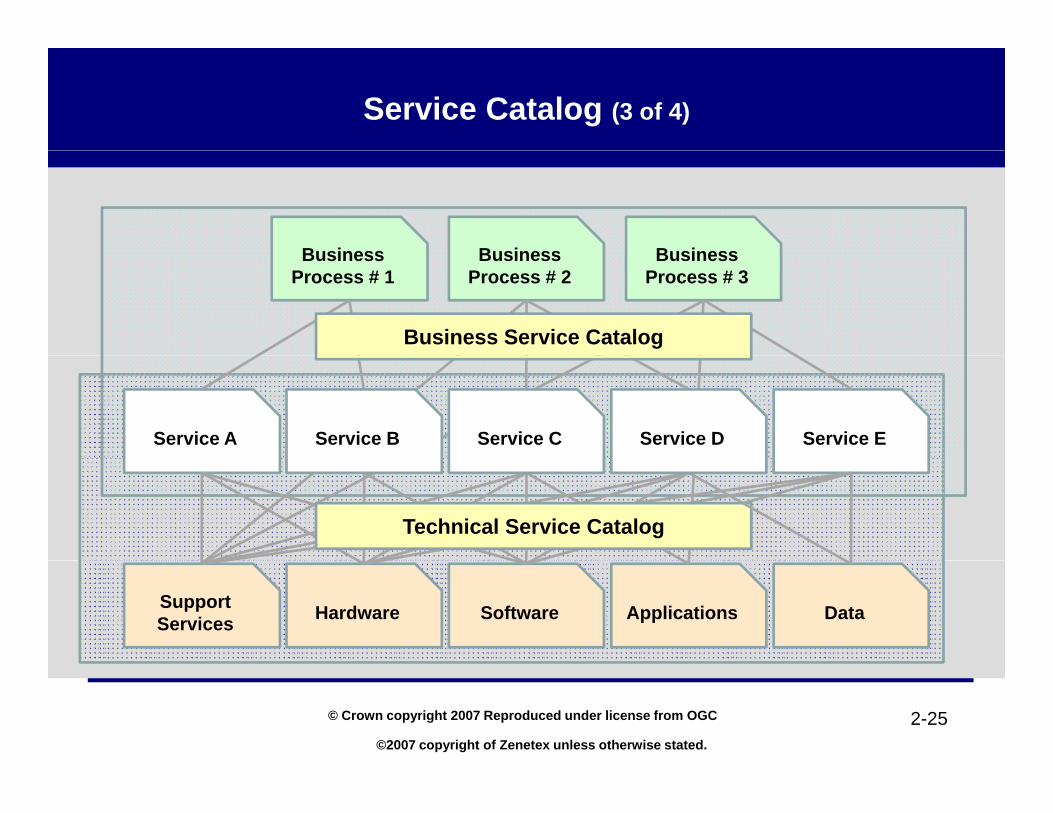
Service Catalog (3 of 4)
BusinessBusinessBusiness Business Process # 3
Business Process # 2
Business Process # 1
Business Service Catalog
Service EService A Service B Service C Service D
Technical Service Catalog
DataApplicationsSoftwareHardwareSupport Services
©2007 copyright of Zenetex unless otherwise stated.
2-25© Crown copyright 2007 Reproduced under license from OGC
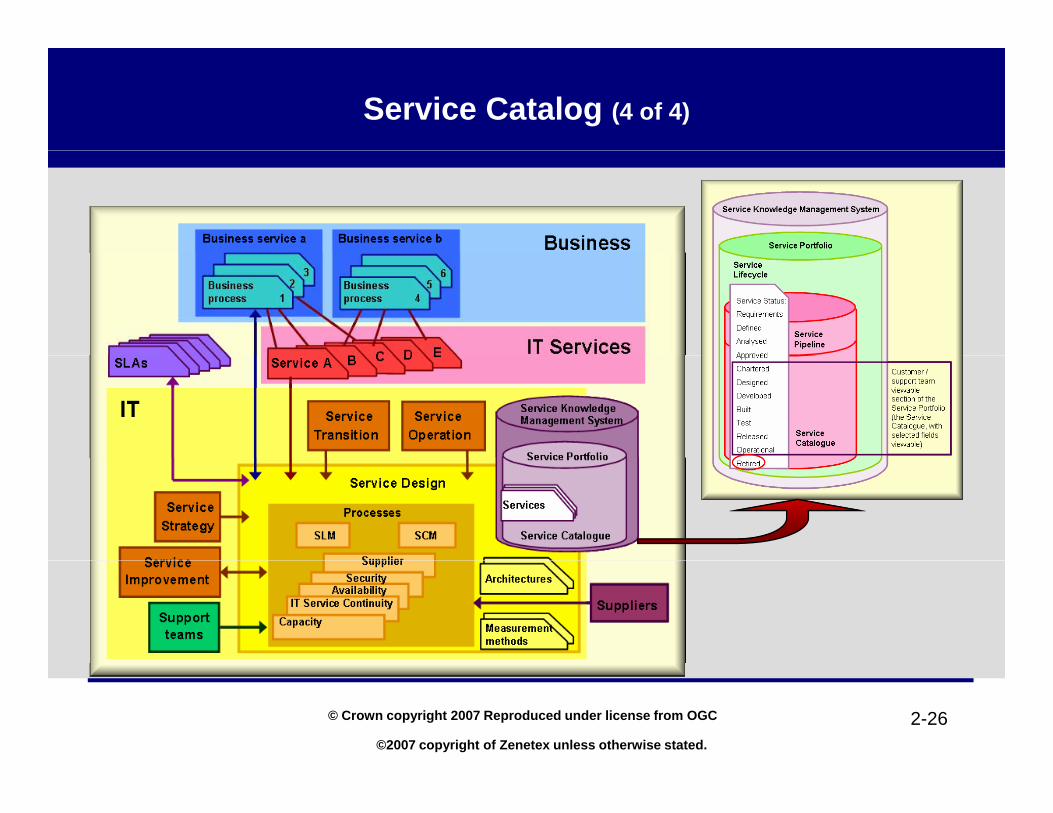
Service Catalog (4 of 4)
©2007 copyright of Zenetex unless otherwise stated.
2-26© Crown copyright 2007 Reproduced under license from OGC
Business Case
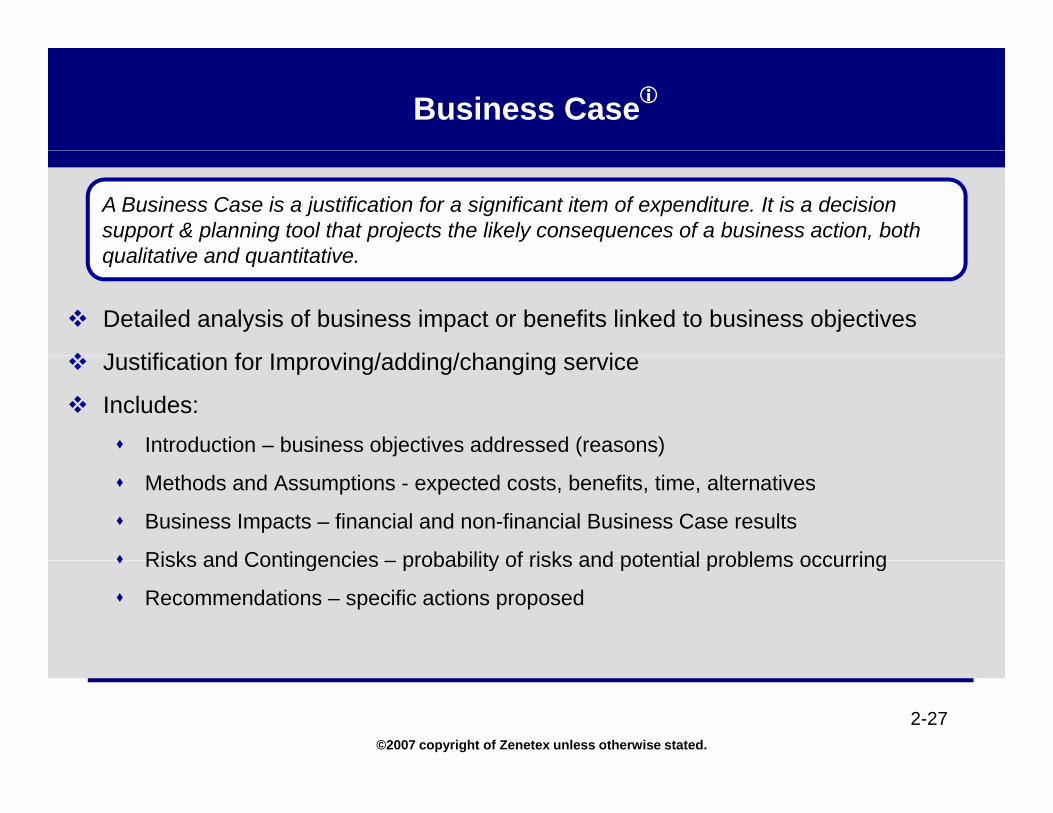
A Business Case is a justification for a significant item of expenditure. It is a decision support & planning tool that projects the likely consequences of a business action, both qualitative and quantitative
Detailed analysis of business impact or benefits linked to business objectives
J tifi ti f I i / ddi / h i i
qualitative and quantitative.
Justification for Improving/adding/changing service
Includes:Introduction – business objectives addressed (reasons)
Methods and Assumptions - expected costs, benefits, time, alternatives
Business Impacts – financial and non-financial Business Case results
Risks and Contingencies – probability of risks and potential problems occurringRisks and Contingencies – probability of risks and potential problems occurring
Recommendations – specific actions proposed
©2007 copyright of Zenetex unless otherwise stated.
2-27
Return on Investment (1 of 2)
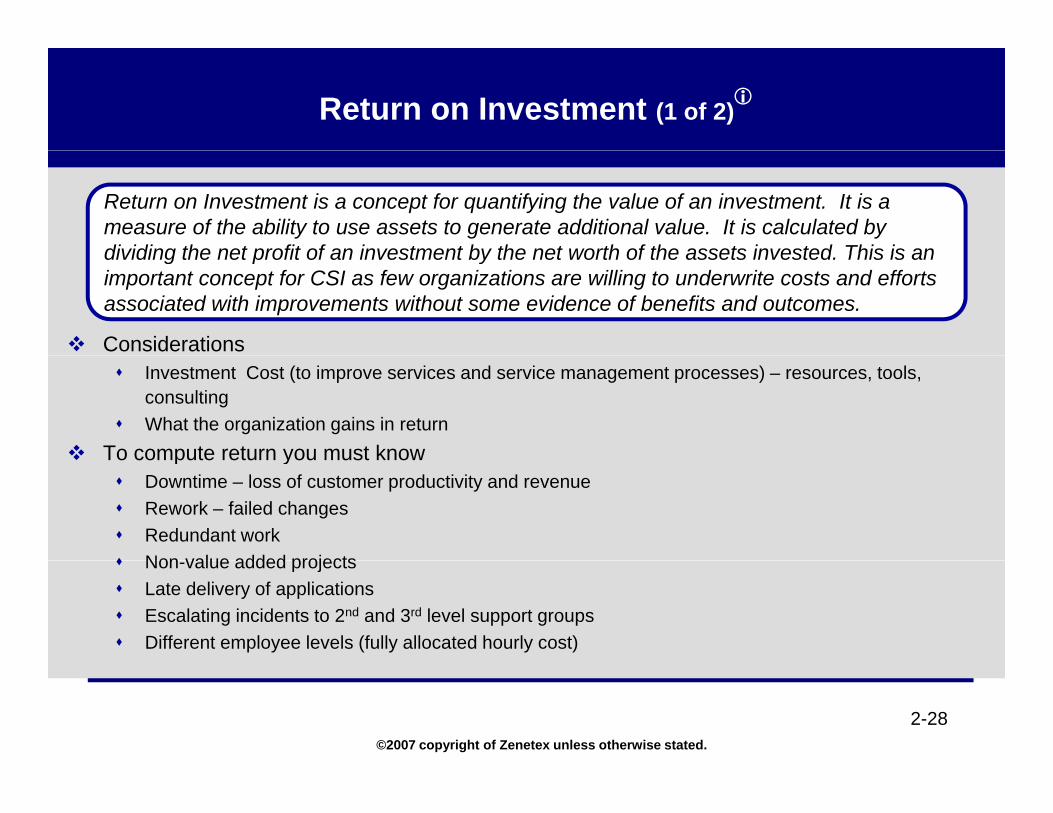
Return on Investment is a concept for quantifying the value of an investment. It is a measure of the ability to use assets to generate additional value. It is calculated by dividing the net profit of an investment by the net worth of the assets invested This is an
Considerations
dividing the net profit of an investment by the net worth of the assets invested. This is an important concept for CSI as few organizations are willing to underwrite costs and efforts associated with improvements without some evidence of benefits and outcomes.
Investment Cost (to improve services and service management processes) – resources, tools, consultingWhat the organization gains in return
To compute return you must knowTo compute return you must know Downtime – loss of customer productivity and revenueRework – failed changesRedundant workNon value added projectsNon-value added projectsLate delivery of applicationsEscalating incidents to 2nd and 3rd level support groupsDifferent employee levels (fully allocated hourly cost)
©2007 copyright of Zenetex unless otherwise stated.
2-28
Return on Investment (2 of 2)
Availability is a good measure of cost of lost productivity, cost of not being able to create a transaction and true cost of downtime
Different approachesDifferent approaches• Impact by minutes lost (duration x customers impacted)• Impact by business transaction (# business transactions that couldn’t be completed
during downtime)• True cost of agreed downtime (Component Failure Impact Analysis (CFIA) – 3 users
impacted (calculate non-productivity)
©2007 copyright of Zenetex unless otherwise stated.
2-29
Risk Management
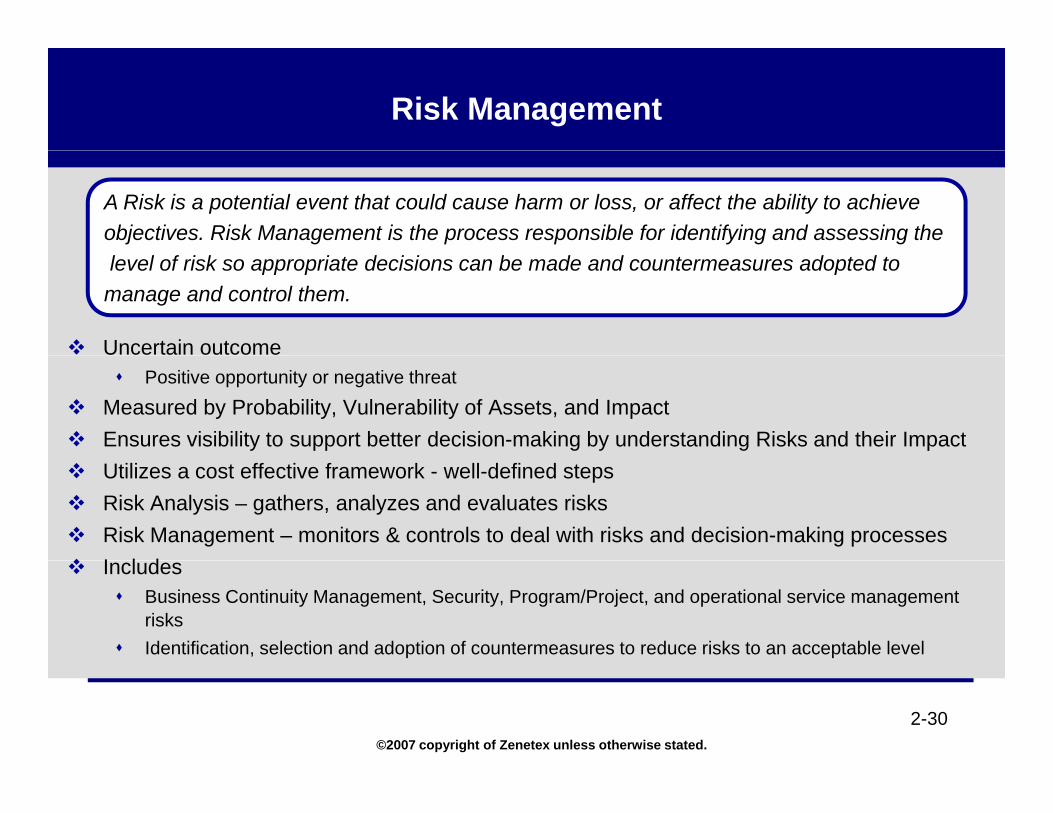
A Risk is a potential event that could cause harm or loss, or affect the ability to achieve objectives. Risk Management is the process responsible for identifying and assessing the
Uncertain outcome
level of risk so appropriate decisions can be made and countermeasures adopted to manage and control them.
Positive opportunity or negative threat
Measured by Probability, Vulnerability of Assets, and ImpactEnsures visibility to support better decision-making by understanding Risks and their ImpactUtilizes a cost effective framework - well-defined stepsRisk Analysis – gathers, analyzes and evaluates risksRisk Management – monitors & controls to deal with risks and decision-making processesI l dIncludes
Business Continuity Management, Security, Program/Project, and operational service management risksIdentification, selection and adoption of countermeasures to reduce risks to an acceptable level
©2007 copyright of Zenetex unless otherwise stated.
2-30
Risk Management Benefits
Improves Performance by contributing toIncreased certainty and fewer surprisesy pBetter service deliveryMore effective change managementMore efficient use of resourcesBetter management through improved decision-makingReduced waste and fraud & better value for moneyInnovationManagement of contingency & maintenance activities
©2007 copyright of Zenetex unless otherwise stated.
2-31
Service Provider Types
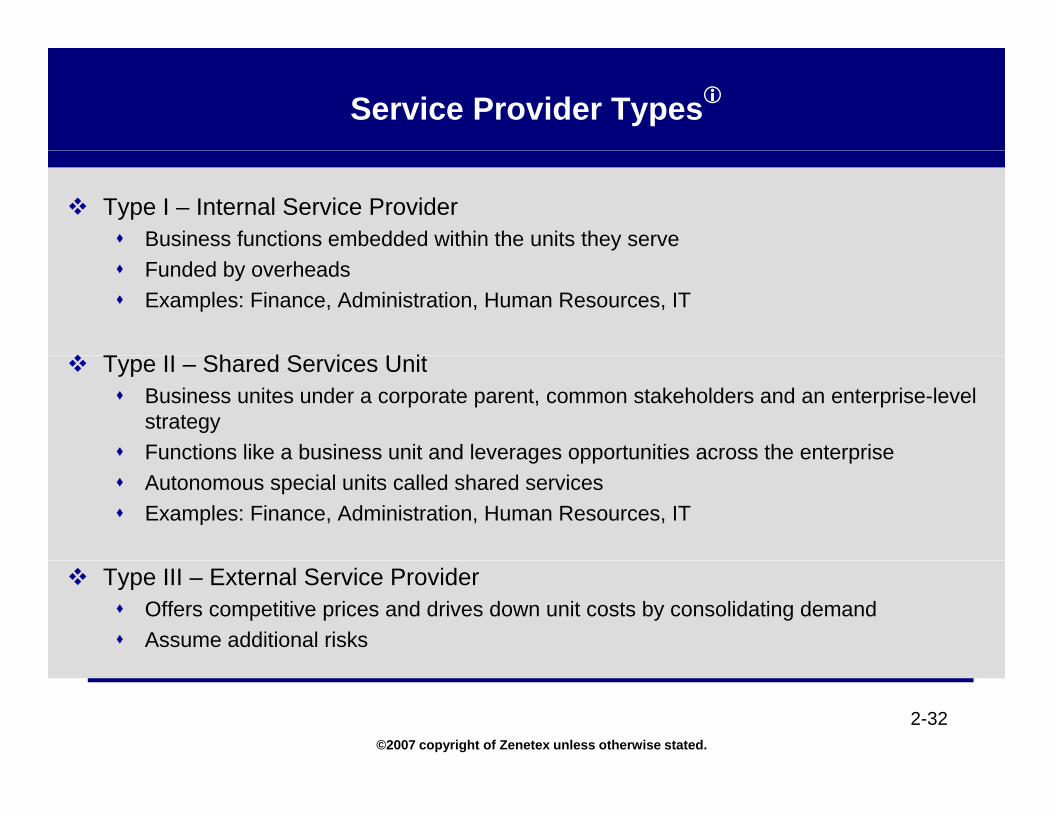
Type I – Internal Service ProviderBusiness functions embedded within the units they serveFunded by overheads Examples: Finance, Administration, Human Resources, IT
T II Sh d S i U itType II – Shared Services UnitBusiness unites under a corporate parent, common stakeholders and an enterprise-level strategyFunctions like a business unit and leverages opportunities across the enterpriseFunctions like a business unit and leverages opportunities across the enterpriseAutonomous special units called shared servicesExamples: Finance, Administration, Human Resources, IT
Type III – External Service ProviderOffers competitive prices and drives down unit costs by consolidating demandAssume additional risks
©2007 copyright of Zenetex unless otherwise stated.
2-32
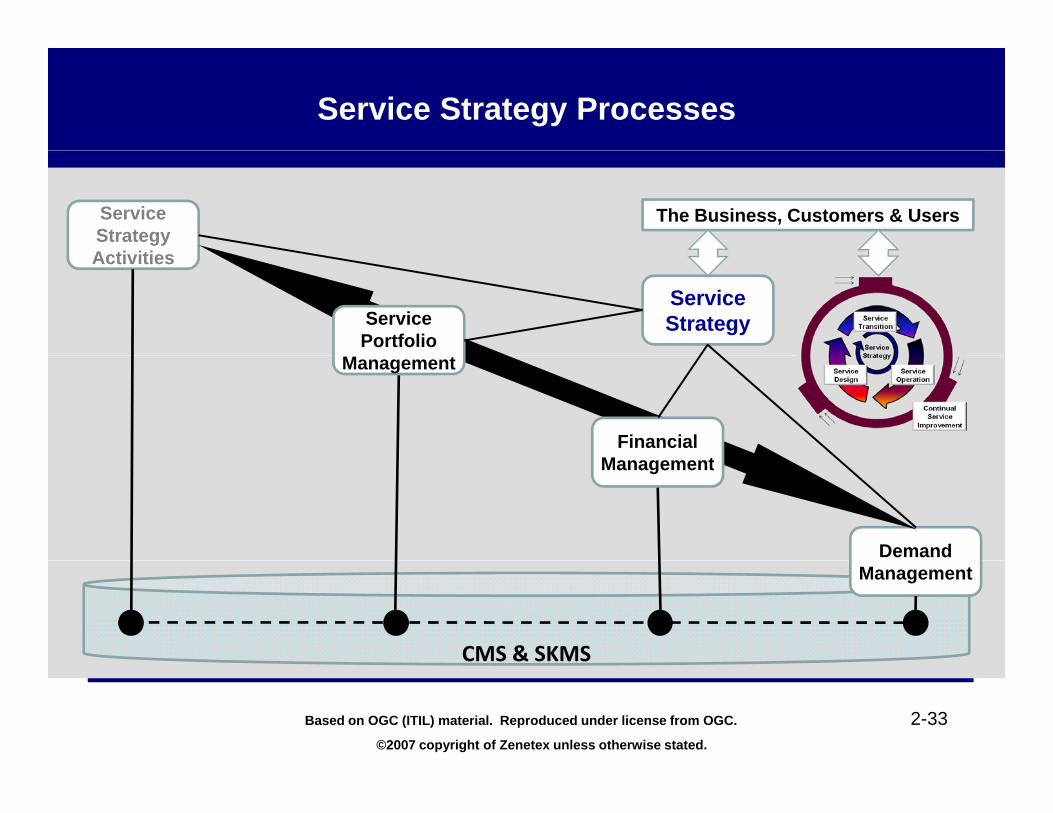
Service Strategy Processes
Service Strategy A ti iti
The Business, Customers & Users
Activities
Service StrategyService
Portfolio Management
Financial M t
Demand
Management
CMS & SKMS
Management
©2007 copyright of Zenetex unless otherwise stated.
2-33Based on OGC (ITIL) material. Reproduced under license from OGC.
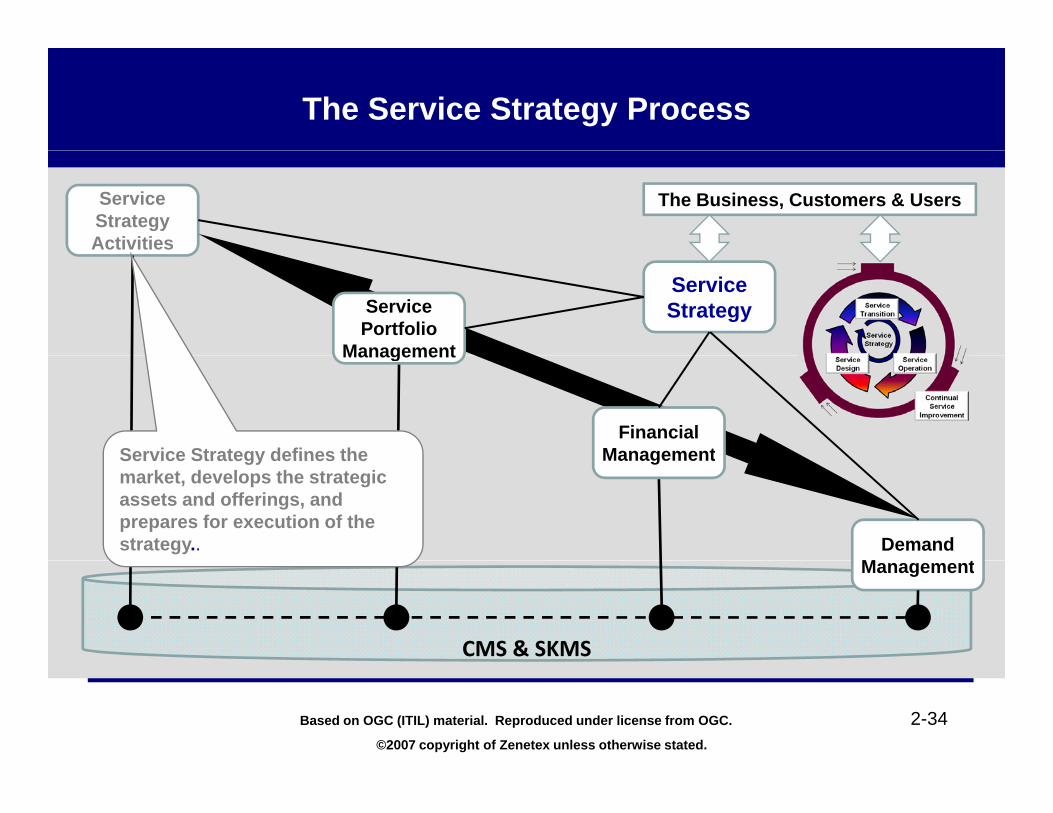
The Service Strategy Process
Service Strategy Activities
The Business, Customers & Users
Service StrategyService
Portfolio ManagementManagement
Financial ManagementService Strategy defines the
Demand M t
ManagementService Strategy defines the market, develops the strategic assets and offerings, and prepares for execution of the strategy..
CMS & SKMS
Management
©2007 copyright of Zenetex unless otherwise stated.
2-34Based on OGC (ITIL) material. Reproduced under license from OGC.
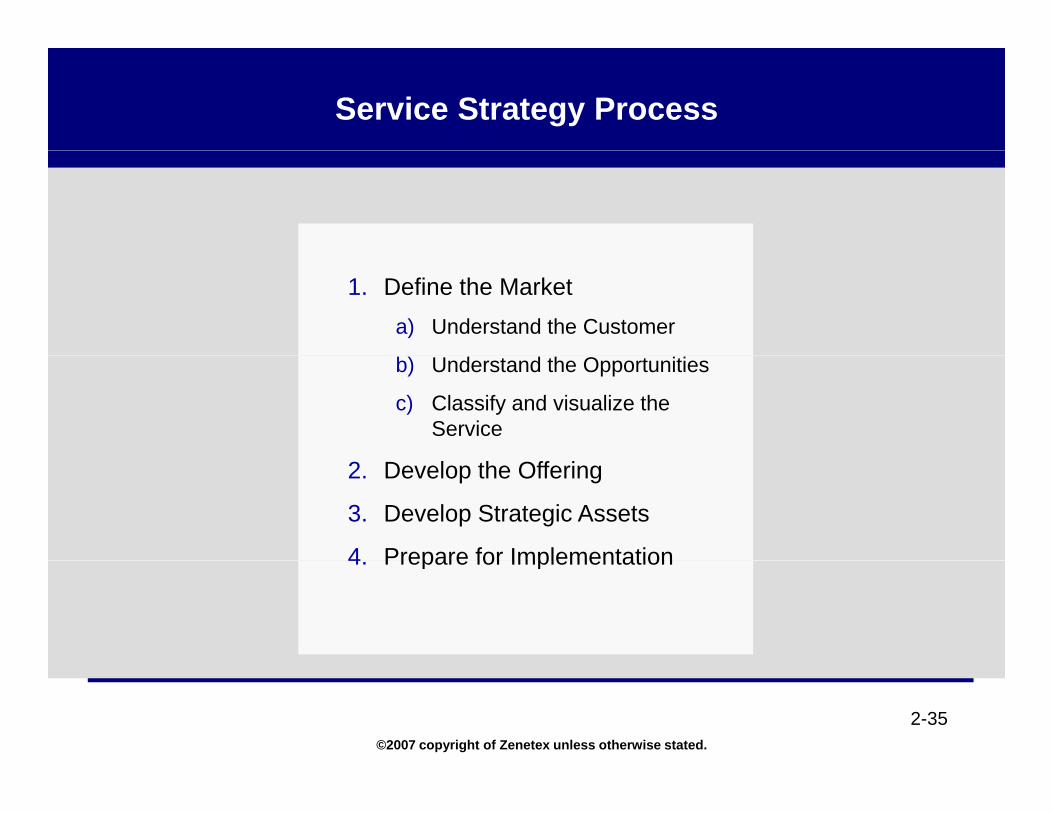
Service Strategy Process
1. Define the Marketa) Understand the Customer
b) Understand the Opportunities
c) Classify and visualize the Service
2. Develop the Offering
3. Develop Strategic Assets
4 Prepare for Implementation4. Prepare for Implementation
©2007 copyright of Zenetex unless otherwise stated.
2-35
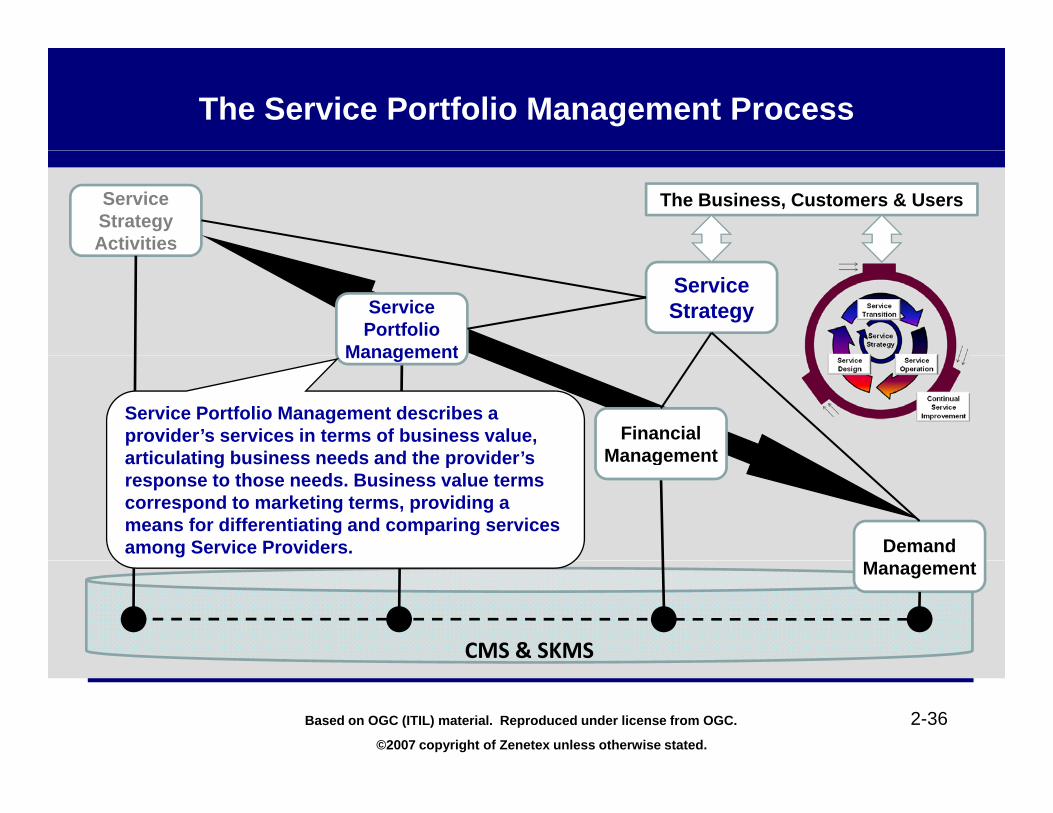
The Service Portfolio Management Process
Service Strategy Activities
The Business, Customers & Users
Service StrategyService
Portfolio ManagementManagement
Financial Management
Service Portfolio Management describes a provider’s services in terms of business value, articulating business needs and the provider’s
Demand
Managementarticulating business needs and the provider s response to those needs. Business value terms correspond to marketing terms, providing a means for differentiating and comparing services among Service Providers.
CMS & SKMS
Management
©2007 copyright of Zenetex unless otherwise stated.
2-36Based on OGC (ITIL) material. Reproduced under license from OGC.
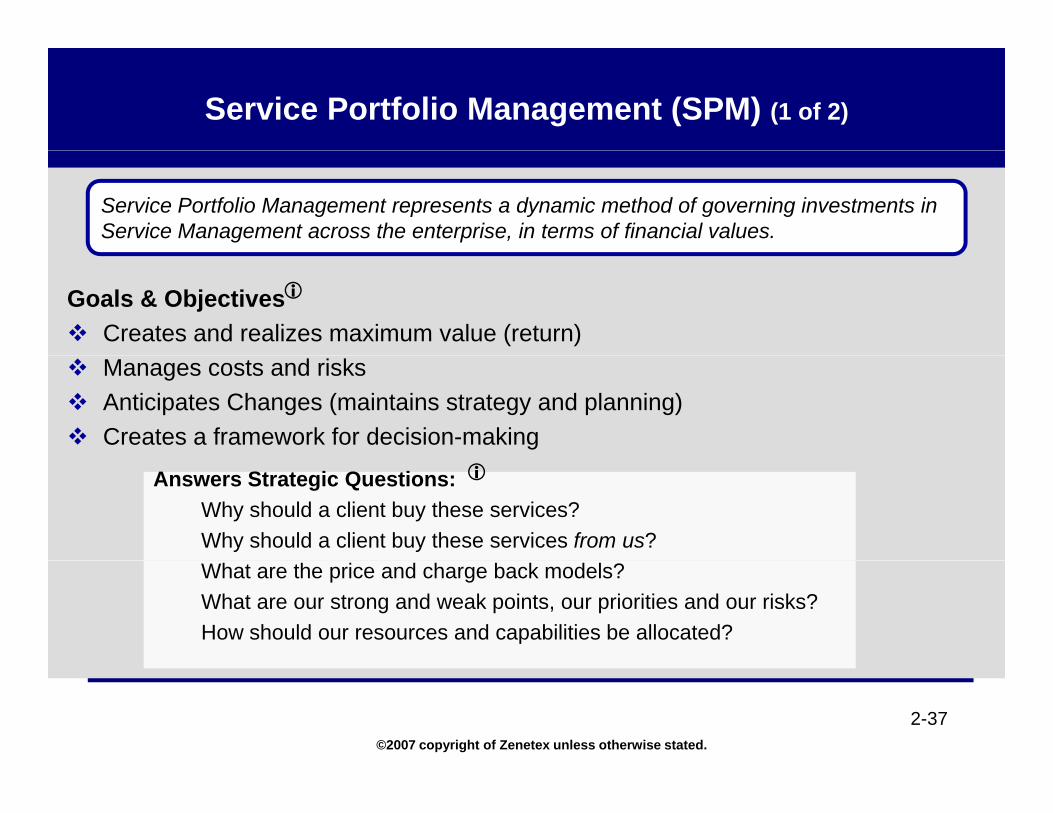
Service Portfolio Management (SPM) (1 of 2)
Service Portfolio Management represents a dynamic method of governing investments in Service Management across the enterprise, in terms of financial values.
Goals & ObjectivesCreates and realizes maximum value (return)Manages costs and risksAnticipates Changes (maintains strategy and planning)Creates a framework for decision-making
Answers Strategic Questions:Why should a client buy these services?Why should a client buy these services from us?What are the price and charge back models?What are our strong and weak points, our priorities and our risks?How should our resources and capabilities be allocated?
©2007 copyright of Zenetex unless otherwise stated.
2-37
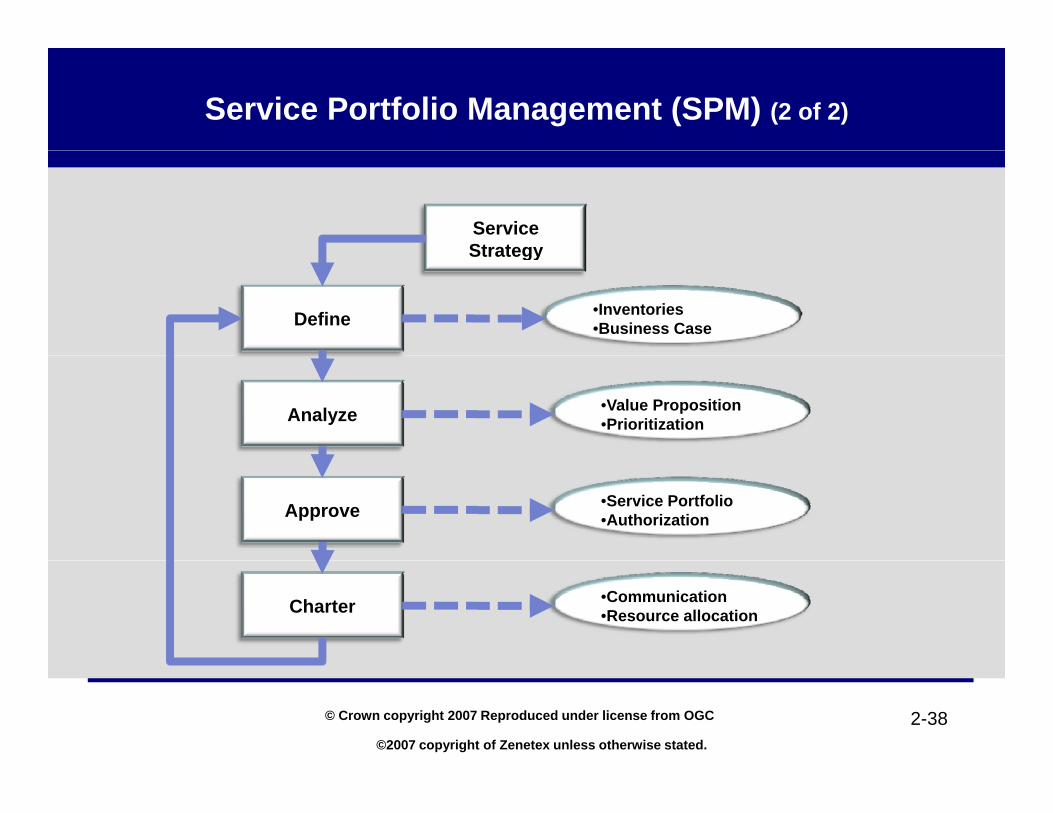
Service Portfolio Management (SPM) (2 of 2)
ServiceStrategyStrategy
Define •Inventories•Business Case
Analyze •Value Proposition•Prioritization
Approve •Service Portfolio•Authorization
Charter •Communication•Resource allocation
©2007 copyright of Zenetex unless otherwise stated.
2-38© Crown copyright 2007 Reproduced under license from OGC
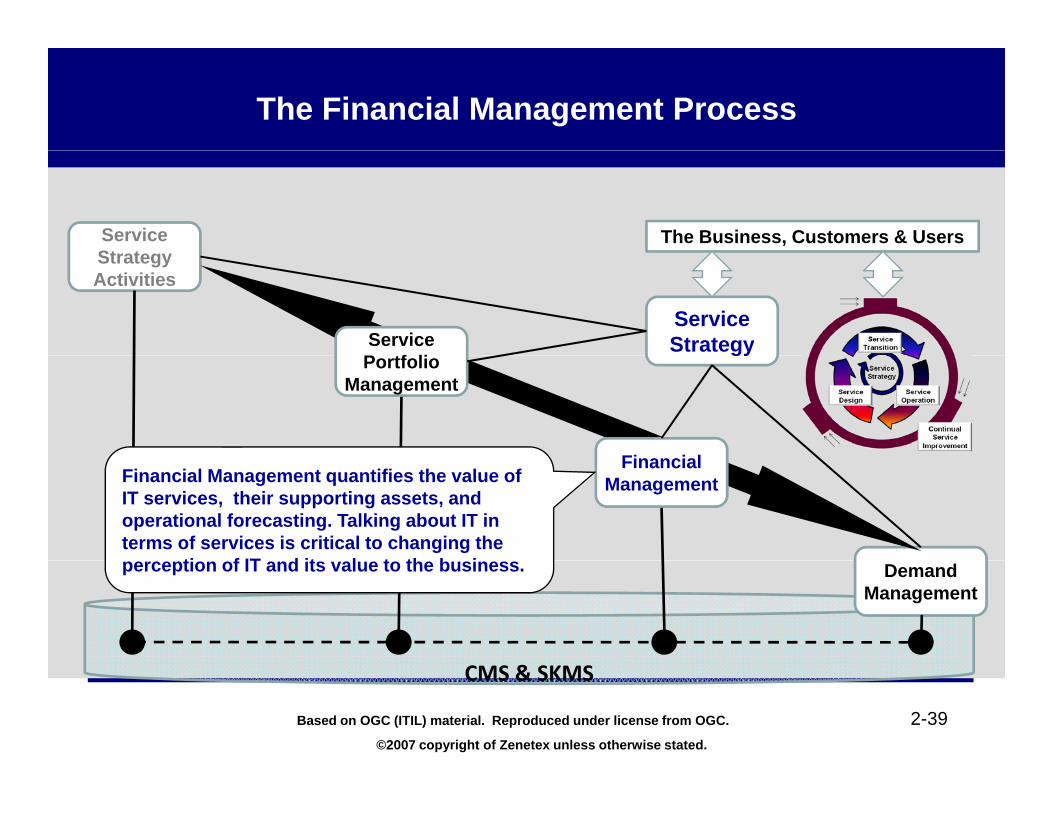
The Financial Management Process
Service St t
The Business, Customers & UsersStrategy Activities
Service StrategyService
P tf ligy
Portfolio Management
Fi i lFinancial ManagementFinancial Management quantifies the value of
IT services, their supporting assets, and operational forecasting. Talking about IT in terms of services is critical to changing the
ti f IT d it l t th b i Demand Management
perception of IT and its value to the business.
©2007 copyright of Zenetex unless otherwise stated.
2-39
CMS & SKMS
Based on OGC (ITIL) material. Reproduced under license from OGC.
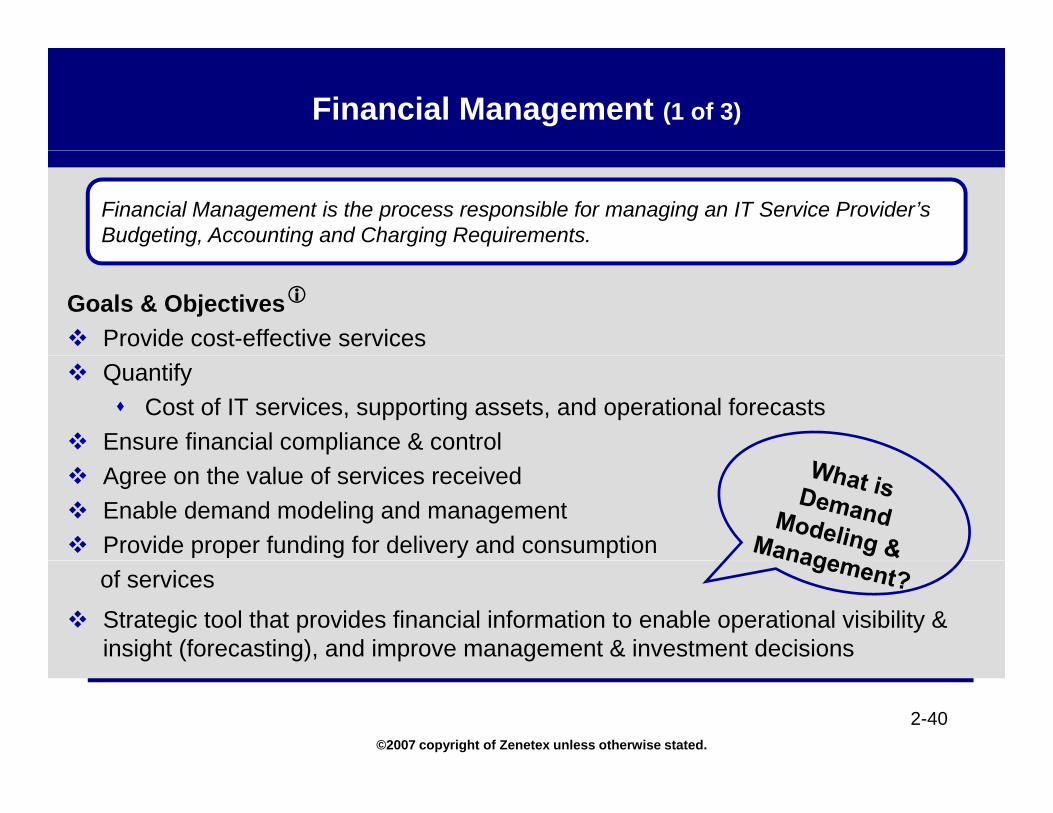
Financial Management (1 of 3)
Financial Management is the process responsible for managing an IT Service Provider’s Budgeting, Accounting and Charging Requirements.
Goals & ObjectivesProvide cost-effective servicesQuantify
Cost of IT services, supporting assets, and operational forecastsEnsure financial compliance & controlAgree on the value of services receivedEnable demand modeling and managementProvide proper funding for delivery and consumption of services
Strategic tool that provides financial information to enable operational visibility & insight (forecasting), and improve management & investment decisions
©2007 copyright of Zenetex unless otherwise stated.
2-40
Financial Management (2 of 3)
Interacts with many parts of the enterprise to generate and obtain financial information (Operations, Support units, PMOs, Application development , Infrastructure, Change Management, Business units, Users)Financial data is owned by finance and accounting and generated and used by other areasC ll t i f ti f h d i t i ti d di i tiCollects information from everywhere and assists in generating and disseminating information to feed critical decision-making
©2007 copyright of Zenetex unless otherwise stated.
2-41
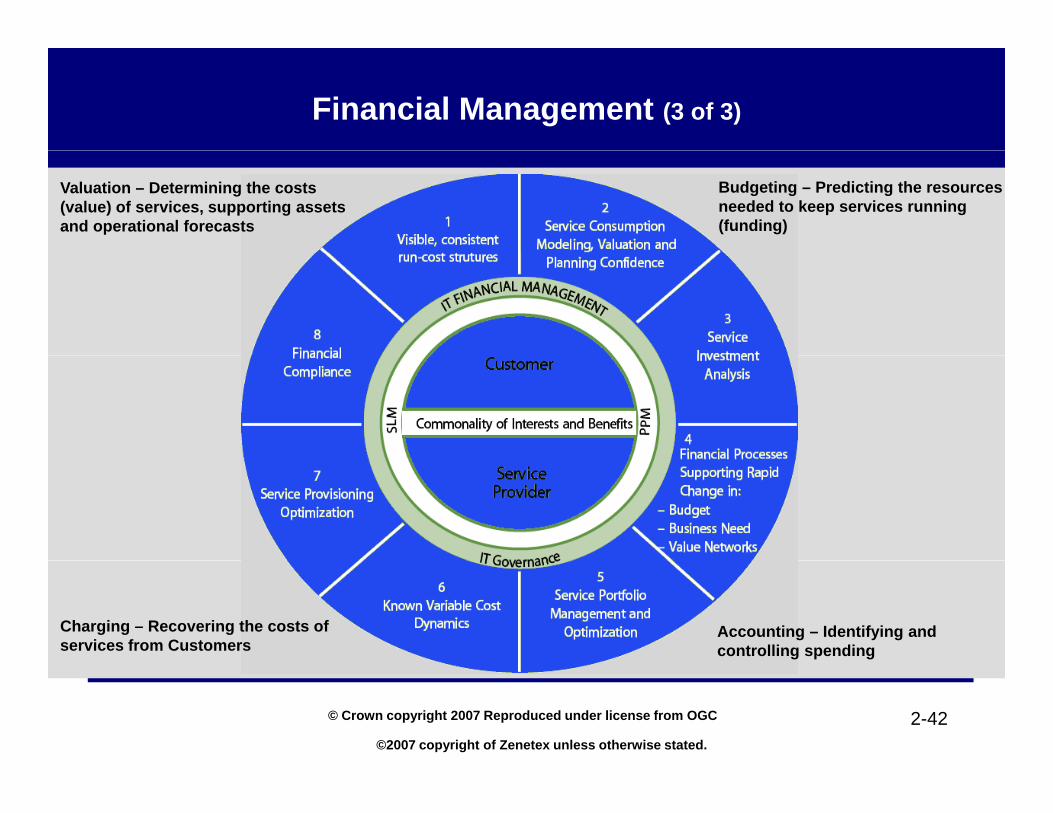
Financial Management (3 of 3)
Valuation – Determining the costs (value) of services, supporting assets and operational forecasts
Budgeting – Predicting the resources needed to keep services running (funding)
Accounting – Identifying and controlling spending
Charging – Recovering the costs of services from Customers
©2007 copyright of Zenetex unless otherwise stated.
2-42© Crown copyright 2007 Reproduced under license from OGC
The Demand Management Process
Service Strategy Activities
The Business, Customers & Users
Service StrategyService
Portfolio Managementg
Financial Management
Demand M t
Management
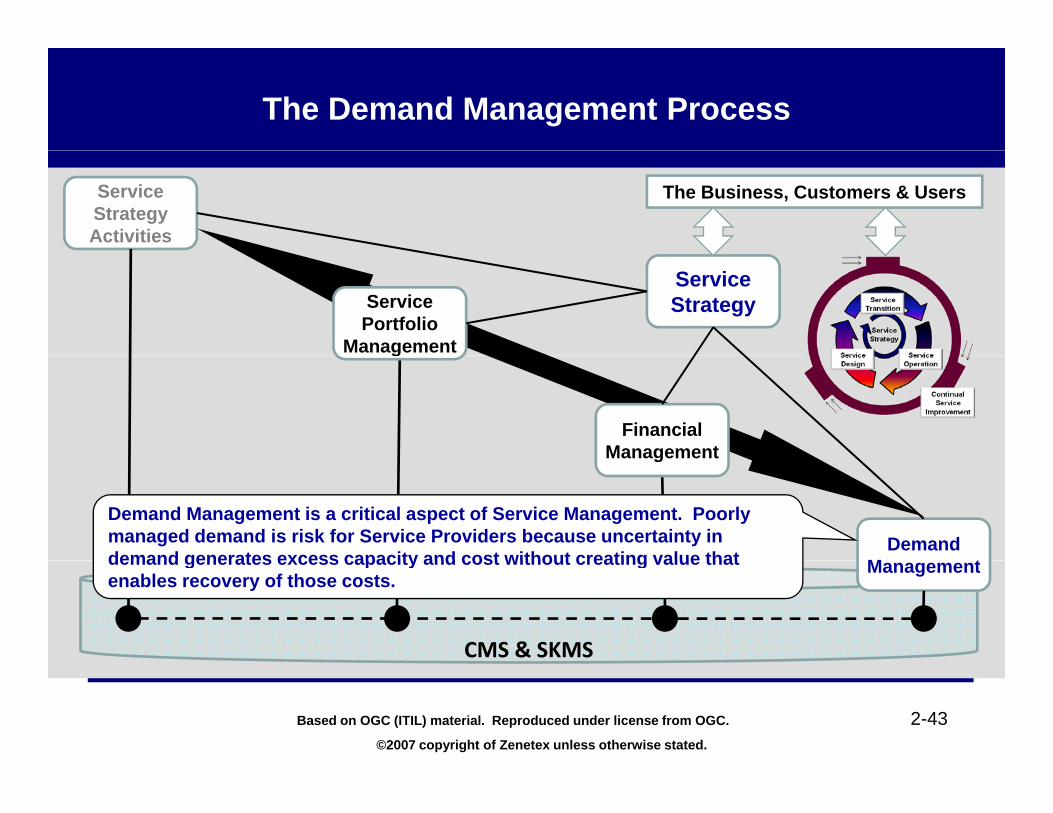
Demand Management is a critical aspect of Service Management. Poorly managed demand is risk for Service Providers because uncertainty in demand generates excess capacity and cost without creating value that
CMS & SKMS
Managementdemand generates excess capacity and cost without creating value that enables recovery of those costs.
©2007 copyright of Zenetex unless otherwise stated.
2-43Based on OGC (ITIL) material. Reproduced under license from OGC.
Demand Management (DM)
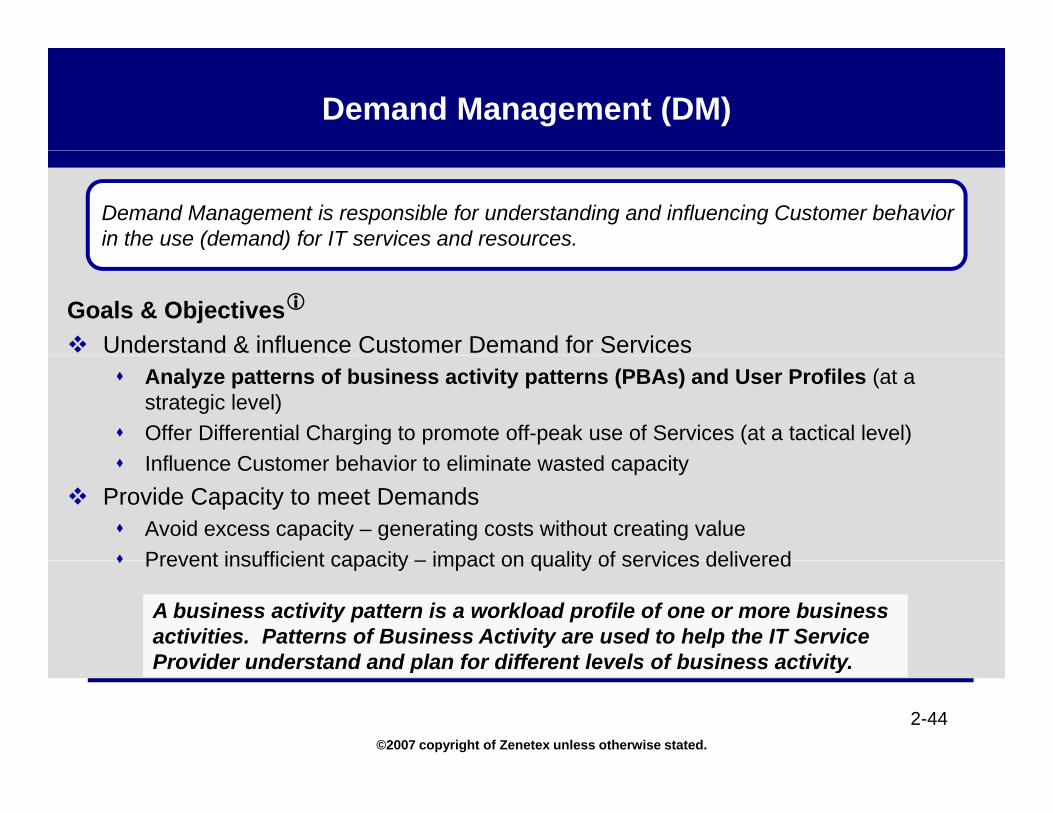
Demand Management is responsible for understanding and influencing Customer behavior in the use (demand) for IT services and resources.
Goals & ObjectivesUnderstand & influence Customer Demand for Services
Analyze patterns of business activity patterns (PBAs) and User Profiles (at a strategic level)Offer Differential Charging to promote off-peak use of Services (at a tactical level)I fl C t b h i t li i t t d itInfluence Customer behavior to eliminate wasted capacity
Provide Capacity to meet DemandsAvoid excess capacity – generating costs without creating valuePrevent insufficient capacity – impact on quality of services deliveredPrevent insufficient capacity – impact on quality of services delivered
A business activity pattern is a workload profile of one or more business activities. Patterns of Business Activity are used to help the IT Service Provider understand and plan for different levels of business activity
©2007 copyright of Zenetex unless otherwise stated.
2-44
Provider understand and plan for different levels of business activity.
The Role of Demand Management
Monitor overall demand and capacity to maintain service quality and reduce the risk of unavailabilityMonitor & manage capacity potential of individual resourcesIdentify, analyze & respond to changing Patterns of Business Activity (PBA) to align supply and demandDevelop and manage incentive/penalty schemesReduce excess capacity to manage costs and create valueParticipate in development of Service Level Agreements (SLAs)
©2007 copyright of Zenetex unless otherwise stated.
2-45© Crown copyright 2007 Reproduced under license from OGC
Challenges in Managing Demand for Services (1 of 2)
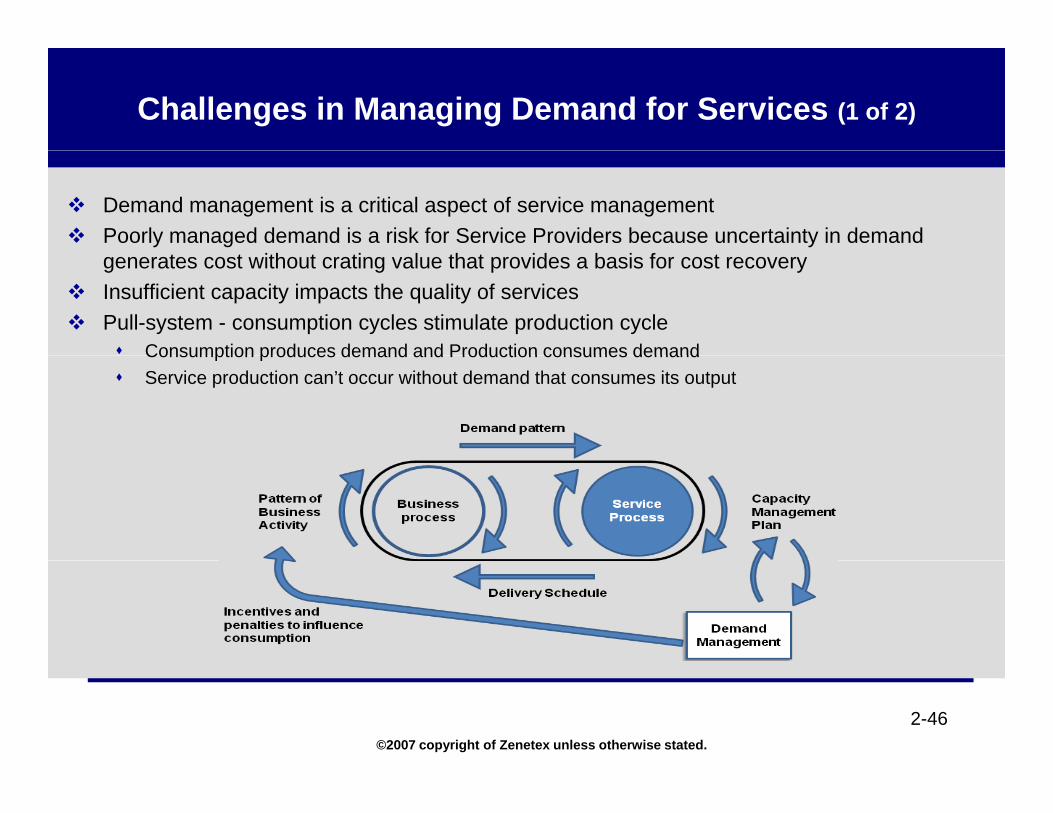
Demand management is a critical aspect of service managementPoorly managed demand is a risk for Service Providers because uncertainty in demand
fgenerates cost without crating value that provides a basis for cost recoveryInsufficient capacity impacts the quality of servicesPull-system - consumption cycles stimulate production cycle
Consumption produces demand and Production consumes demandConsumption produces demand and Production consumes demandService production can’t occur without demand that consumes its output
©2007 copyright of Zenetex unless otherwise stated.
2-46
Challenges in Managing Demand for Services (2 of 2)
Productive capacity of resources available to a service is adjusted according to demand forecasts and patternsSLAs, forecasting, planning and tight coordination with the customer can reduce uncertainty in demand (can’t eliminate it)Techniques to influence demand
Pricing incentives - Off Peak Pricing (differential charging)Differentiated service levels – patterns of demand
©2007 copyright of Zenetex unless otherwise stated.
2-47
Patterns of Business Activity (PBAs)
Generated by Customer Assets (people, processes, applications)Business Activity influences patterns of demand for services y pIdentify, analyze and predict demand for services and service assets (Business & Technical Service Catalogs) to provide sufficient capacityIncludes interactions with customers, suppliers, partners and other stakeholdersGenerate revenue, income and costsAccount for a large portion of business outcomesIdentified, cataloged, profiled, codified (coded with a unique identifier) and shared across processesBusiness Activity Profiles - One or more attributes describe
Frequency, volume, location, durationA i t d ith i t it i d l t t l f d lAssociated with requirements – security, privacy and latency or tolerance for delaysChange over time – business changes/improvements, people, organizational, application and infrastructureUnder change control
©2007 copyright of Zenetex unless otherwise stated.
g
2-48

PBA Profile
PBA No. 45F Activities Activity Levels
Hi 3 2 1 Lo N/A
Frequency of remote interaction with customers X
Frequency of on-site interaction with customers X
Archive or handle customer information X
Generate confidential information X
Provide technical support (frequency) X
Seek technical assistance X
Network bandwidth requirements XNetwork bandwidth requirements X
Data storage requirements (volume) X
Tolerance for delay in service response X
Seasonal variations in activity X
Print documents and images X
Process transactions with wireless mobile device X
Access work systems during domestic travel X
Access work systems during overseas travel X
©2007 copyright of Zenetex unless otherwise stated.
Access work systems during overseas travel
2-49
User Profiles (UPs) (1 of 2)
Associated with one or more PBAsBased on roles and responsibilities of people and functions with operations for p p p pprocesses and applicationsAssociated with one or more PBAsUnder Change ControlRepresents persistent and correlated patternsUsed to communicate demandMatching patterns using PBA and UP ensures a systematic approach to understanding and managing customer demand with services, service levels, and service assetsImproves value for Customers & Providers – eliminates waste and poor performanceperformanceCommunicates information on roles, responsibilities, interactions, schedules, work environments and social context of related users.
©2007 copyright of Zenetex unless otherwise stated.
2-50

User Profiles (UPs) (2 of 2)
User Profile PBA Code
Applicable Patterns of Business Activity (PBAs)
Senior Executive (UP1) Moderate domestic and overseas travel; highly sensitive information; zero latency on service requests; high need for technical assistance; need to be highly available to the business.
45F4A35D
Highly Mobile Executive Extensive domestic and overseas travel; sensitive information; low latency on service requests; 45A(UP2) moderate need for technical assistance; high customer contact; need to be highly available to
customers.35D2A
Office-Based Staff (UP3) Office-based administrative staff; love domestic travel; medium latency on service requests; low need for technical assistance; full-featured desktop needs; moderate customer contact; high
22A14B; p ; ; g
volume of paperwork; need to be highly productive during work hours.14B3A
Payment Processing System (UP4)
Business system; high volume; transaction-based; high security needs; low latency on service requests; low seasonal variation; mailing of documents by postal service; automatic customer
12FSystem (UP4) requests; low seasonal variation; mailing of documents by postal service; automatic customer
notification; under regulatory compliance; need to be highly secure and transparent (audit control).
©2007 copyright of Zenetex unless otherwise stated.
2-51
Benefits of Analyzing PBAs
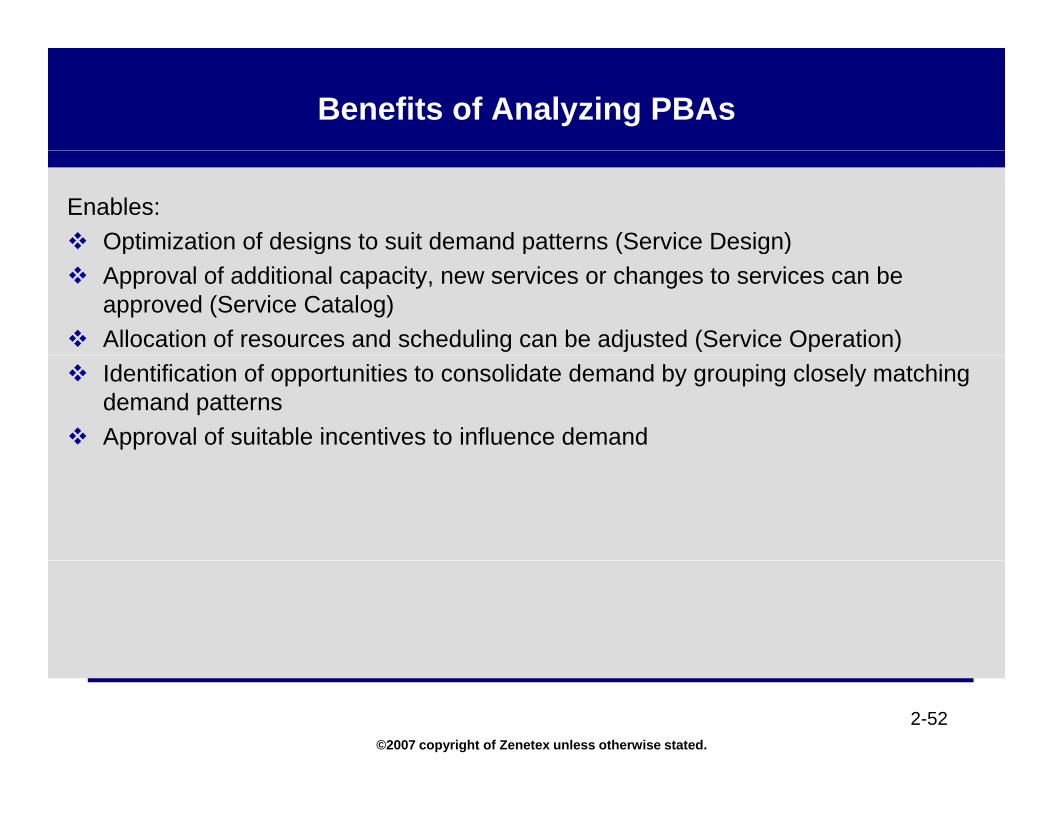
Enables:Optimization of designs to suit demand patterns (Service Design)p g p ( g )Approval of additional capacity, new services or changes to services can be approved (Service Catalog) Allocation of resources and scheduling can be adjusted (Service Operation) Identification of opportunities to consolidate demand by grouping closely matching demand patternsApproval of suitable incentives to influence demand
©2007 copyright of Zenetex unless otherwise stated.
2-52

Service Strategy Processes
Service Strategy A ti iti
The Business, Customers & Users
Activities
Service StrategyService
Portfolio Management
Financial M t
Demand
Management
CMS & SKMS
Management
©2007 copyright of Zenetex unless otherwise stated.
2-53Based on OGC (ITIL) material. Reproduced under license from OGC.
Sample QuestionsSample Questions
©2007 copyright of Zenetex unless otherwise stated.
2-54
Sample Question 2 - 1
When analyzing an outcome for Value Creation for Customers, what attributes of the service should be considered?
A. IT Objectives, Metrics, Customer OutcomeB. Desired Outcome, Supplier Metrics, IT ObjectivesC People Products TechnologyC. People, Products, Technology
©2007 copyright of Zenetex unless otherwise stated.
2-55
Sample Question 2 - 2
Which of the following identifies two Service Portfolio components within the Service Lifecycle?
A. Service Pipeline and Service CatalogB. Service Knowledge Management System and Service CatalogC Service Knowledge Management System and Requirements PortfolioC. Service Knowledge Management System and Requirements PortfolioD. Requirements Portfolio and Configuration Management System
©2007 copyright of Zenetex unless otherwise stated.
2-56
Sample Question 2 - 3
Which of the following questions is NOT answered by Service Portfolio Management?
A. How should our resources and capabilities be allocated?B. What opportunities are there in the market?C Why should a Customer buy these services?C. Why should a Customer buy these services?D. What are the pricing or chargeback models?
©2007 copyright of Zenetex unless otherwise stated.
2-57
Sample Question 2 - 4
“Warranty of a service” means which of the following?A. The service is fit for purposeA. The service is fit for purposeB. There will be no failures in applications and Infrastructure associated with
the serviceC All service related problems are fixed free of charge for a certain period ofC. All service-related problems are fixed free of charge for a certain period of
timeD. Customers are assured of certain levels of availability, capacity, continuity
and securityand security
©2007 copyright of Zenetex unless otherwise stated.
2-58
Sample Question 2 - 5
Which of the following statements is CORRECT about patterns of demand generated by the Customer’s business?
A. They are driven by patterns of business activityB. It is impossible to predict how they behaveC It is impossible to influence demand patternsC. It is impossible to influence demand patternsD. They are driven by the delivery schedule generated by Capacity
Management
©2007 copyright of Zenetex unless otherwise stated.
2-59
Sample Question 2 - 6
A Service Catalog should contain which of the following?A. The version information of all softwareA. The version information of all softwareB. The organizational structure of the companyC. Asset informationD. Details of all operational services
©2007 copyright of Zenetex unless otherwise stated.
2-60
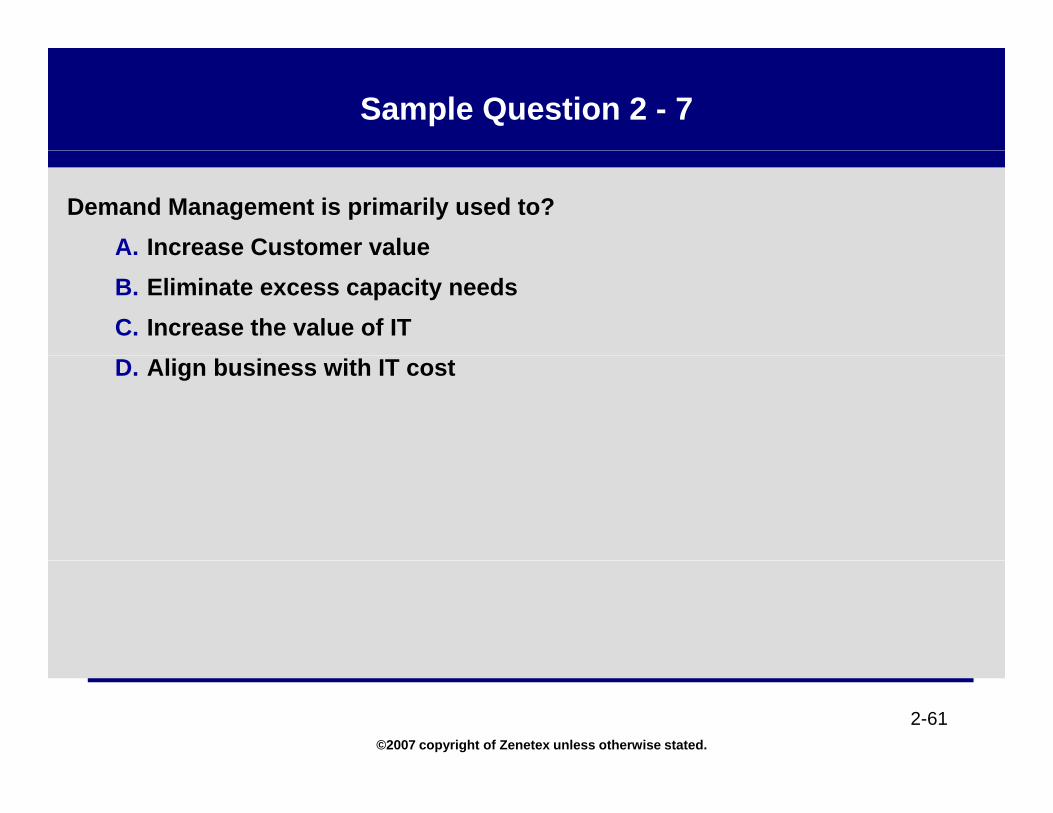
Sample Question 2 - 7
Demand Management is primarily used to?A. Increase Customer valueA. Increase Customer valueB. Eliminate excess capacity needsC. Increase the value of ITD. Align business with IT cost
©2007 copyright of Zenetex unless otherwise stated.
2-61
Chapter 2 ExercisesChapter 2 Exercises
©2007 copyright of Zenetex unless otherwise stated.
2-62
Exercise 2 - 1
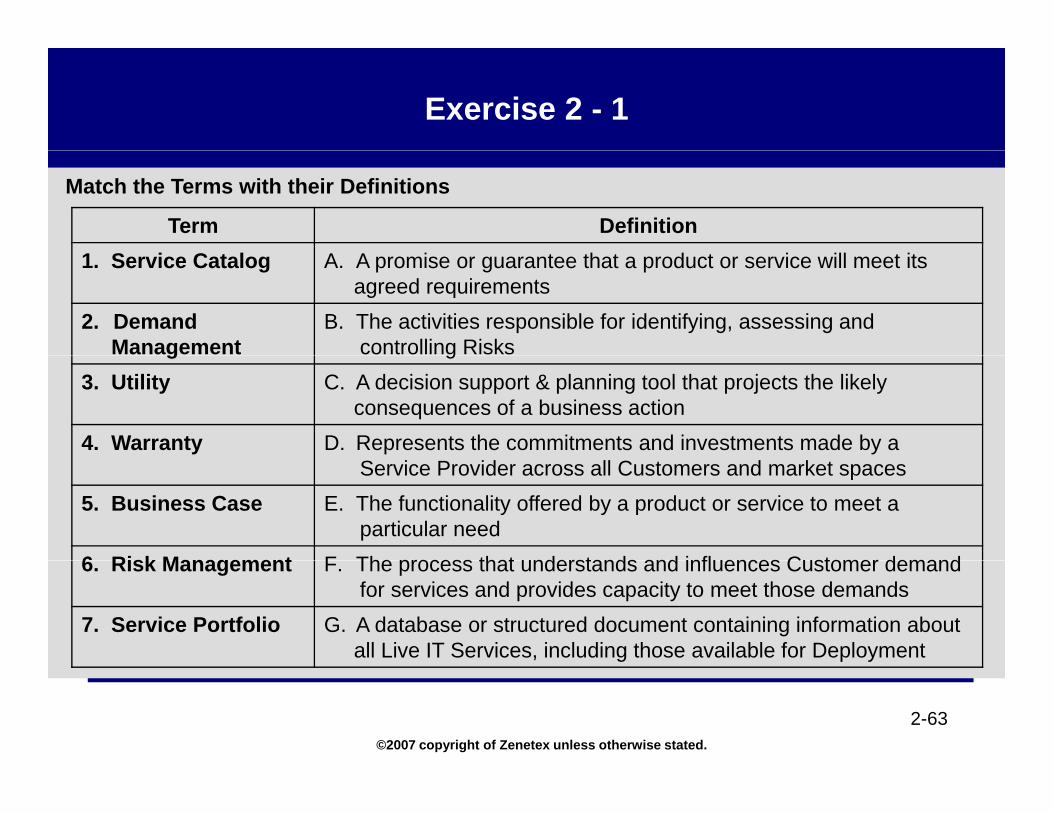
Match the Terms with their Definitions
Term Definition1 S i C l A A i h d i ill i1. Service Catalog A. A promise or guarantee that a product or service will meet its
agreed requirements 2. Demand
ManagementB. The activities responsible for identifying, assessing and
controlling Risksg g3. Utility C. A decision support & planning tool that projects the likely
consequences of a business action4. Warranty D. Represents the commitments and investments made by a
Service Provider across all Customers and market spaces5. Business Case E. The functionality offered by a product or service to meet a
particular need 6 Risk Management F The process that understands and influences Customer demand6. Risk Management F. The process that understands and influences Customer demand
for services and provides capacity to meet those demands 7. Service Portfolio G. A database or structured document containing information about
all Live IT Services, including those available for Deployment
©2007 copyright of Zenetex unless otherwise stated.
2-63
Exercise 2 - 2
Capabilities Resources
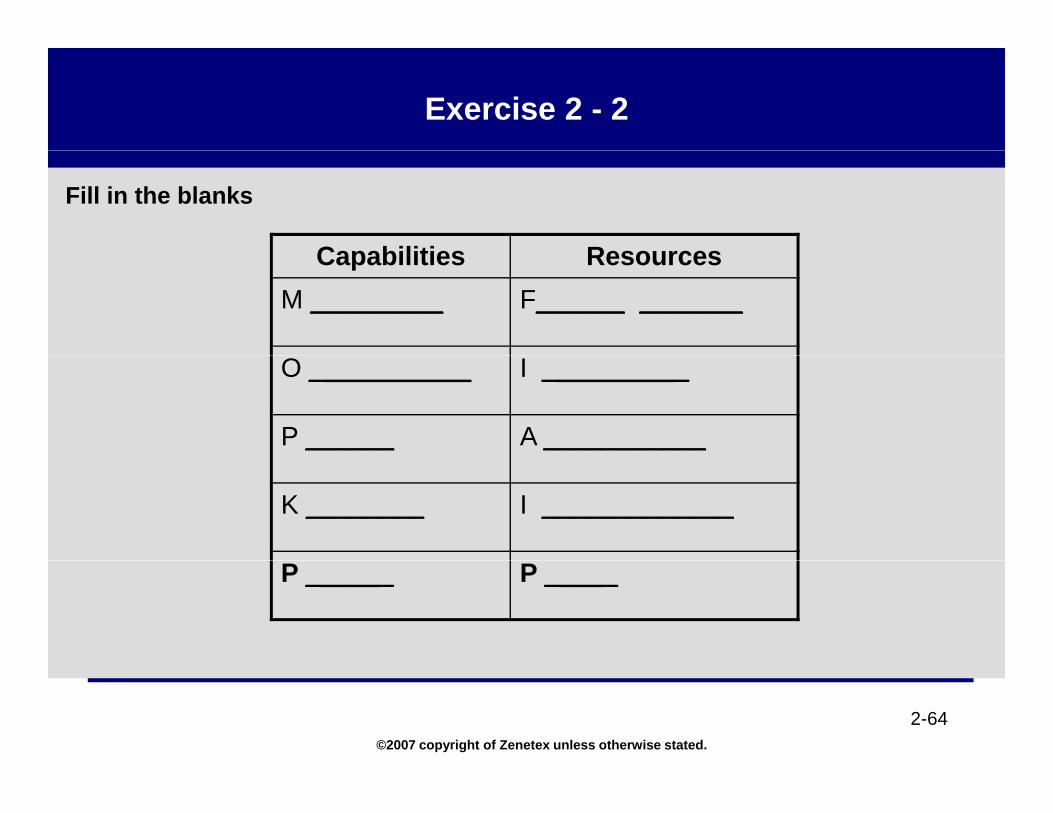
Fill in the blanks
Capabilities ResourcesM _________ F______ _______
O ___________ I __________
P ______ A ___________
K ________ I _____________
P ______ P _____
©2007 copyright of Zenetex unless otherwise stated.
2-64

Exercise 2 - 3
Match Service Strategy Processes with their Definitions
Service Strategy Process DefinitionService Strategy Process Definition
1. Service Strategy Activities A. Represents a dynamic method to govern investments in Service Management across the enterprise in terms of financial valuesenterprise, in terms of financial values
2. Service Portfolio Management B. Understands and influences Customer demand for services and provides the capacity to meet these demandsthese demands
3. Financial Management C. Understands the Customer, defines the market, and develops offerings and strategic assets
4. Demand Management D. Quantifies the value of IT Services, supporting assets, and operational forecasts in financial terms
©2007 copyright of Zenetex unless otherwise stated.
2-65
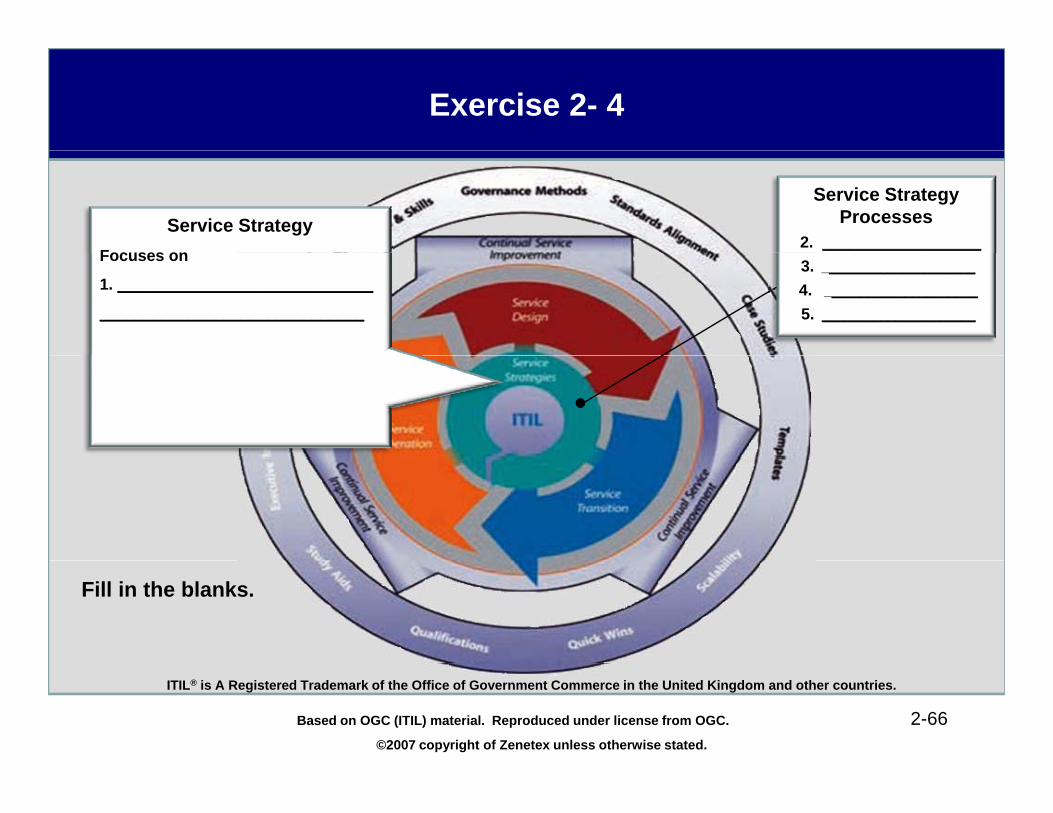
Exercise 2- 4
Service StrategyFocuses on
Service Strategy Processes
2. __________________Focuses on
1. _____________________________
______________________________
3. _____________________
4. _____________________
5. _____________________
Fill in the blanks.
©2007 copyright of Zenetex unless otherwise stated.
2-66Based on OGC (ITIL) material. Reproduced under license from OGC.
ITIL® is A Registered Trademark of the Office of Government Commerce in the United Kingdom and other countries.