Embed Size (px)
Citation preview

iTRAQ Tips and Tricks ASMS User Meeting 05/23/10
1
iTRAQ Tips and Tricks
● Darryl Pappin
– Cold Spring Harbor Laboratory
● Patrick Emery
– Matrix Science Ltd.
Good morning . Unfortunately Darryl Pappin is unable to attend the Matrix Science workshop and the ASMS meeting so I will be presenting this talk on iTRAQ tips and Tricks.
1

iTRAQ Tips and Tricks ASMS User Meeting 05/23/10
2
General Points
● iTRAQ suffers to some extent from compression of ratios in complex samples (although the trends of up- or down-regulation are correct [1])
● This compression effect is reduced for less complex mixtures (e.g. protein complexes).
● Due mainly to influences from overlapping precursors (background) when chromatographic separation is limiting.
● [1] Saw Yen Ow et al. (2009) J. Proteome Res. 8, 5347-5355
The isobaric tags for relative and absolute quantification or iTRAQ method is a popular quantitation method based on the labelling of peptides with a compound that produces isobaric fragments, or reporter ions, under MS/MS conditions. It has been used in a wide variety of studies and has been shown to provide good quantitation over two orders of magnitude.
A recent paper by Saw Yen Ow et al showed how iTRAQ suffers to some extent from the compression of the quantitation ratios to a ratio of 1 when used with complex samples. This leads to an under-estimation of the ratios, although the general trends of up or down regulation are correct.
This compression effect is less pronounced in more simple mixtures; when analysing protein complexes for example.
The compression is mainly due to the influence from overlapping precursors, which provide a background level of reporter ion signals, when the chromatographic separation is the limiting factor. Likewise, the multiple charge states from electrospray instruments can also add to this problem as precursors of different masses with different charge states get compressed down into a smaller m/z region.
There are some papers coming out that describe ways to correct for background (for example the recent paper from Kathryn Lilley’s group http://www.mcponline.org/content/early/2010/04/10/mcp.M900628-MCP200.long ), but in Darryl’s group they prefer to minimize the problem in data collection and primary (first pass) processing.
2
iTRAQ Tips and Tricks ASMS User Meeting 05/23/10
3
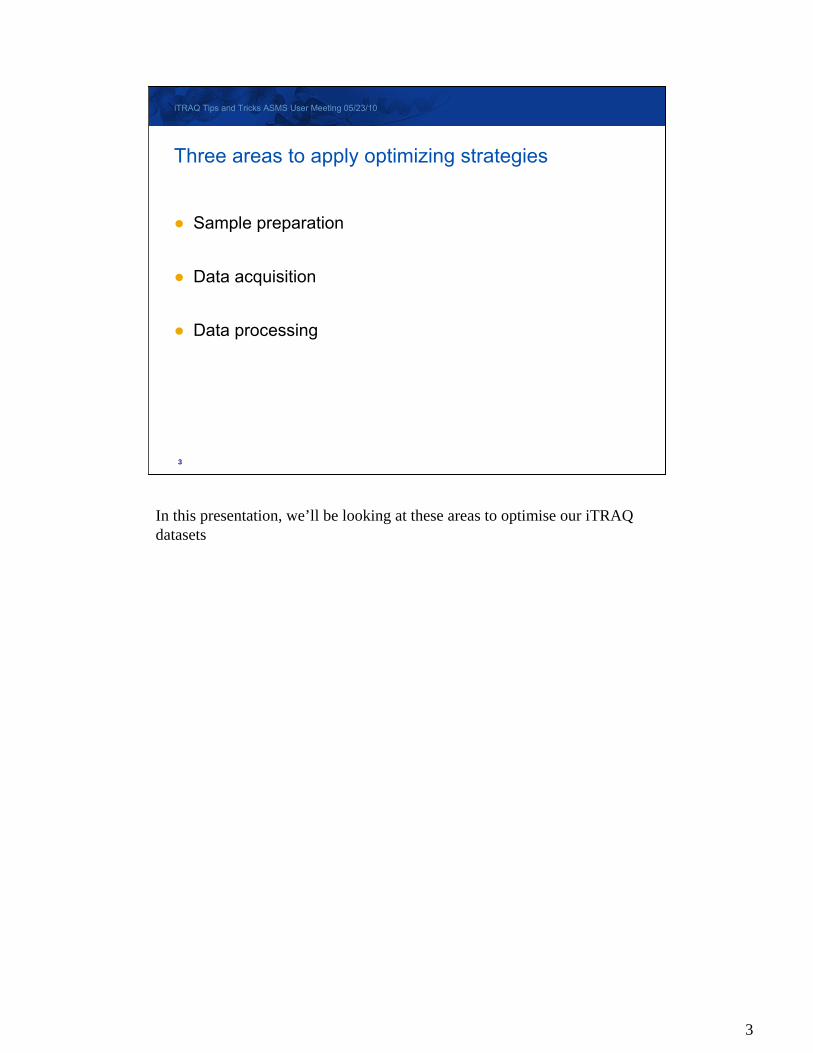
Three areas to apply optimizing strategies
● Sample preparation
● Data acquisition
● Data processing
In this presentation, we’ll be looking at these areas to optimise our iTRAQ datasets
3
iTRAQ Tips and Tricks ASMS User Meeting 05/23/10
4
Sample Preparation Tips I
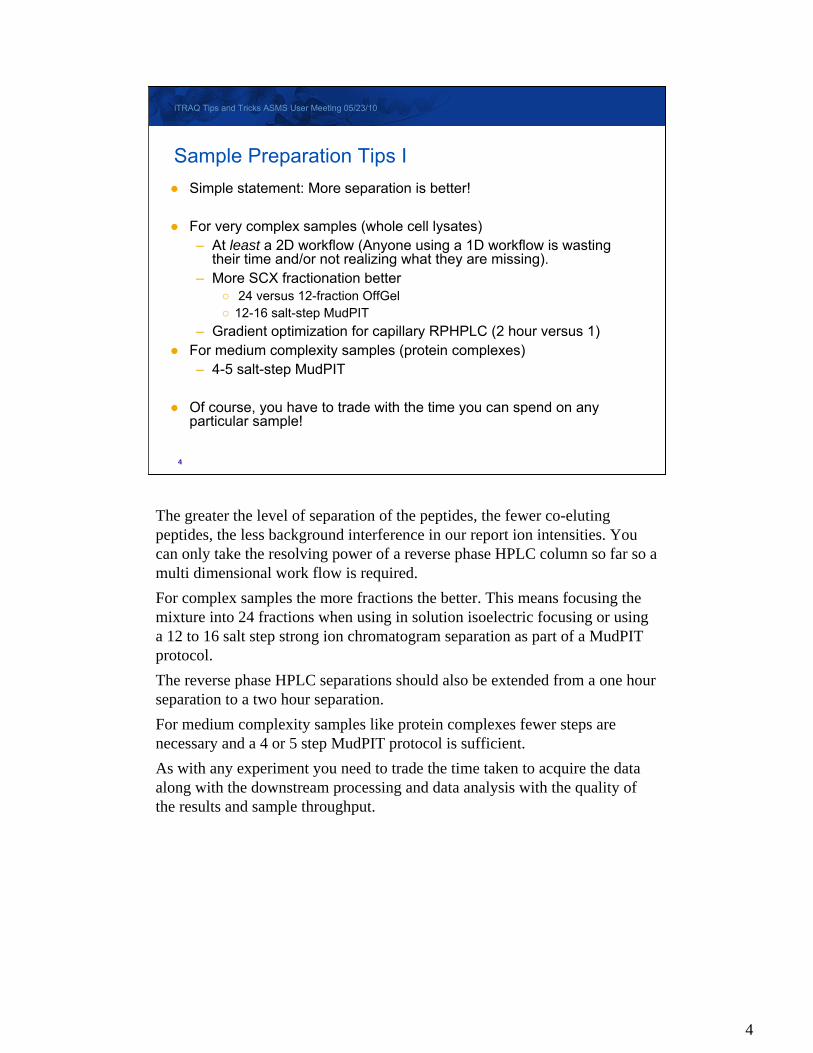
● Simple statement: More separation is better!
● For very complex samples (whole cell lysates)– At least a 2D workflow (Anyone using a 1D workflow is wasting
their time and/or not realizing what they are missing).– More SCX fractionation better
○ 24 versus 12-fraction OffGel○ 12-16 salt-step MudPIT
– Gradient optimization for capillary RPHPLC (2 hour versus 1)● For medium complexity samples (protein complexes)
– 4-5 salt-step MudPIT
● Of course, you have to trade with the time you can spend on any particular sample!
The greater the level of separation of the peptides, the fewer co-eluting peptides, the less background interference in our report ion intensities. You can only take the resolving power of a reverse phase HPLC column so far so a multi dimensional work flow is required.
For complex samples the more fractions the better. This means focusing the mixture into 24 fractions when using in solution isoelectric focusing or using a 12 to 16 salt step strong ion chromatogram separation as part of a MudPIT protocol.
The reverse phase HPLC separations should also be extended from a one hour separation to a two hour separation.
For medium complexity samples like protein complexes fewer steps are necessary and a 4 or 5 step MudPIT protocol is sufficient.
As with any experiment you need to trade the time taken to acquire the data along with the downstream processing and data analysis with the quality of the results and sample throughput.
4
iTRAQ Tips and Tricks ASMS User Meeting 05/23/10
5
Sample preparation Tips II
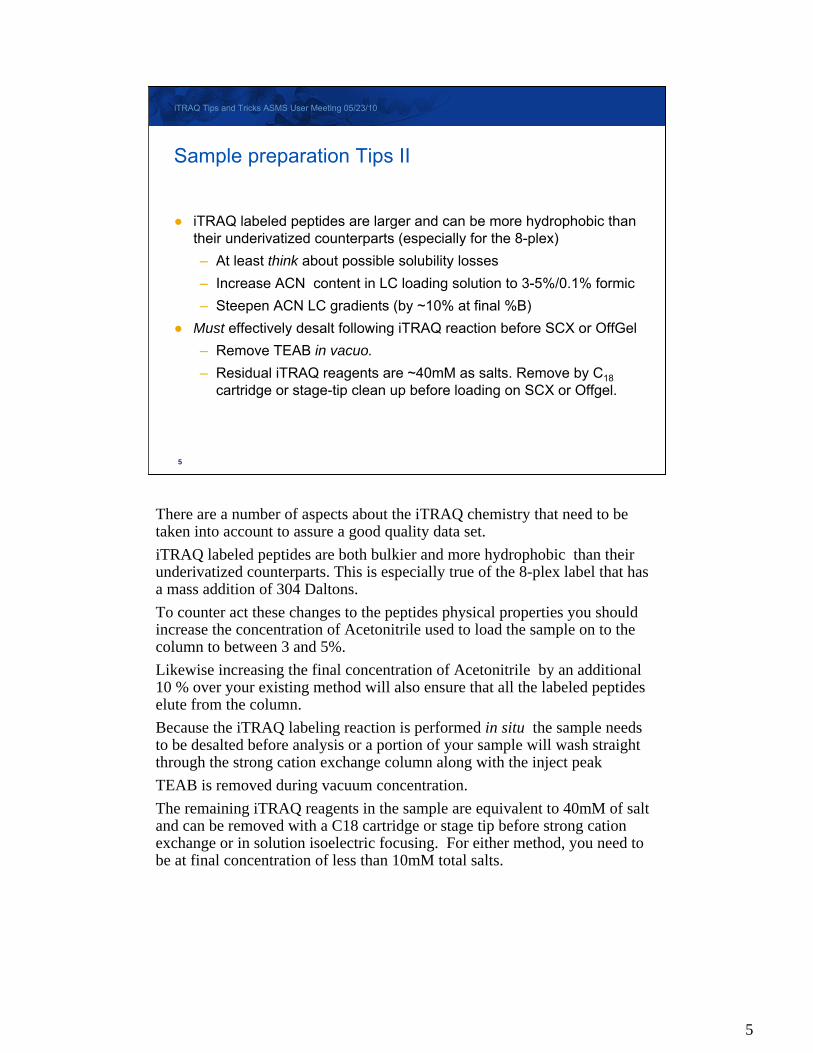
● iTRAQ labeled peptides are larger and can be more hydrophobic than their underivatized counterparts (especially for the 8-plex)
– At least think about possible solubility losses
– Increase ACN content in LC loading solution to 3-5%/0.1% formic
– Steepen ACN LC gradients (by ~10% at final %B)
● Must effectively desalt following iTRAQ reaction before SCX or OffGel
– Remove TEAB in vacuo.
– Residual iTRAQ reagents are ~40mM as salts. Remove by C18
cartridge or stage-tip clean up before loading on SCX or Offgel.
There are a number of aspects about the iTRAQ chemistry that need to be taken into account to assure a good quality data set.
iTRAQ labeled peptides are both bulkier and more hydrophobic than their underivatized counterparts. This is especially true of the 8-plex label that has a mass addition of 304 Daltons.
To counter act these changes to the peptides physical properties you should increase the concentration of Acetonitrile used to load the sample on to the column to between 3 and 5%.
Likewise increasing the final concentration of Acetonitrile by an additional 10 % over your existing method will also ensure that all the labeled peptides elute from the column.
Because the iTRAQ labeling reaction is performed in situ the sample needs to be desalted before analysis or a portion of your sample will wash straight through the strong cation exchange column along with the inject peak
TEAB is removed during vacuum concentration.
The remaining iTRAQ reagents in the sample are equivalent to 40mM of salt and can be removed with a C18 cartridge or stage tip before strong cation exchange or in solution isoelectric focusing. For either method, you need to be at final concentration of less than 10mM total salts.
5

iTRAQ Tips and Tricks ASMS User Meeting 05/23/10
6
Data Acquistion
● Increase collision energy to enhance iTRAQ reporter intensity– Generally an increase of ~10% collision energy to give equivalent fragmentation
efficiency to the underivatized peptide.
● OrbiTrap combined CID/HCD acquisition better that PQD for iTRAQ (in our hands)– Global SDs ~25% for Orbi CID/HCD, ~50% for PQD.– But maybe only 4 MS/MS scans per survey scan as a consequence
● Tighter precursor selection for MS/MS to minimize precursor overlap– Find best precursor tolerance that does not cost too much sensitivity
○ Agilent 6520 QTOF: 4 Da (charge-state dependent, so 2+ peptide uses 2Da)○ Sciex QTOF: Unit mass resolution○ Orbi/LTQ: 1.2 Da isolation
Just as the iTRAQ labels effect the peptide separation so they effect the peptides fragmentation under MS/MS conditions.
Increase the collision energy by approximately 10% to enhance iTRAQ reporter ion intensities and generate spectra with equivalent fragmentation to the underivatized peptide
The low m/z fragments are not normally detected under standard resonance excitation collision induced dissociation (CID) conditions commonly used in ion traps or ion trap hybrid instruments like the orbitrap. As this covers the reporter ion region of the iTRAQ label you need to use protocols that can generate the low m/z fragments. This can be done by combining CID with higher-energy C-trap dissociation (HCD) or using Pulsed Q Collision Induced Dissociation ( PQD). In Darryl Pappin’s laboratory CID combined with HCD produced a more accurate measurement of the iTRAQ reporter ions resulting in a lower global Standard Deviation when compared to PQD, so there is much less scatter in the data allowing for tighter statistics, allowing you to measure small fold changes with greater confidence. However the increased acquisition time need to acquire the combined CID/HCD means that less peptides are analyzed between each survey scan.
The data acquisition methods need to be tuned to minimize precursor overlap in complex samples. There is a limit to how far the precursor selection window for MS/MS can be tightened before compromising the instruments sensitivity. Here are some suggested windows for different commonly used instruments.
6

7
iTRAQ Tips and Tricks ASMS User Meeting 05/23/10
7
Peak picking
●Reporter ions are not peptides!
●Cannot use conventional de-isotoping
– If using mascot.dll, get 1.6b23 or later
– If using Mascot Distiller, get 2.2.0 or later
– Unless your peak picking software has support for a “reporter ion window”, turn off de-isotoping
For iTRAQ data, you have to be very careful with peak detection. Reporter ions do not have natural isotope distributions, so anything that assumes this will not be reliable. Whatever peak picking software you use, you’ll probably need to experiment with the settings. For wiff files, the latest version of mascot.dll has a window around the reporter ion region where it does not perform de-isotoping. You can download this from the Analyst help page on our web site.

iTRAQ Tips and Tricks ASMS User Meeting 05/23/10
8
Negative peptide ratios
• Caused by missing reporter ion peak
• Isotope purity correction then ‘corrects’ to negative
• Not used in the protein ratio
• Flags up that there is a problem with peak detection
Something else you may see are negative iTRAQ ratios. These are caused by a missing reporter ion peak which then gets corrected to a negative value by the applied isotope purity correction. As with 0 and infinite ratio values, negative values are never used to calculate the protein ratio. It would be very easy to hide them on the report, but we choose to show them because it flags up that there was a problem with peak detection for a particular spectrum. If you see just a few on the report then they’re probably simply weak spectra. If you have many peptides with negative ratios then its flagging up a real problem with your dataset.
8

iTRAQ Tips and Tricks ASMS User Meeting 05/23/10
9
Data Processing I
● Selecting thresholds for ratio calculations– Use better quality peptides for ratio calculations (p<0.05)
● Normalization– Summed intensities are the best match to what the MS is actually
doing (summing intensities)– Median better for coping with outliers
● Apply Intensity weighting (most important!)– Again, most natural match to what the MS is collecting– More intense spectra contribute more to the final ratio– Background contributions from weaker spectra are minimized
First, only use reliable peptide matches to calculate your protein ratios. It may be tempting to look at some of the lower quality matches where there are decent reporter ions present, but if the peptide sequence match itself isn’t reliable, you cannot reliably assign those reporter ions to that protein in the first place.
If it is appropriate to normalise your data, then using the summed intensities method is the best match for how the mass spec is actually collecting data, though you may find that the median method will cope better with outliers.
Related to this, when calculating the protein ratio use the ‘Weighted’ method as this is again the best match for what the MS is collecting. It is also the most reliable method if you are limited (as you will normally be) by counting statistics. More intense spectra will contribute more to the final ratio, so a less intense peptide won’t skew your results.
9

iTRAQ Tips and Tricks ASMS User Meeting 05/23/10
10
Data Processing II
● Outlier rejection– Careful! Only apply to proteins with multiple (>5) peptide hits
● Global stats– Very useful for quick assessment of significance. Our preferred
method!
● Isotope overlap correction– Low priority correction (~3% contribution max). Can ignore for 8-
plex (~1% contribution max)
● Interfering peaks– Again, low priority correction– Generally sequence specific (rare). Effects get averaged out with
by other peptides or removed with outlier rejection
Be careful when applying outlier rejection – if you only have a few peptides matching your protein of interest, then actually defining an outlier becomes tricky in the first place.
Use something like Excel to calculate your global statistics for the peptide ratios, distributions etc so you can really see what your dataset looks like. In Darryl’s lab, they like to use global distribution of peptide ratios and then use this to assess significant changes. For example, if your ratio has a global standard deviation of 25%, centred at 1 then a ratio of 1.5 is 2 Standard deviations, e.g. At the 95% significance threshold and of potential interest.
Mascot includes isotope correction in the iTRAQ method. It does make a contribution to the final ratios, but it isn’t of critical importance over the whole dataset especially for 8-plex. Likewise with interfering peaks, unless you have a very strange dataset you’ll find the effects get averaged out by the other peptides, or removed by outlier removal.
10

iTRAQ Tips and Tricks ASMS User Meeting 05/23/10
11
Protein ratio calculation
1. Average
– geometric average of the peptide ratios
2. Median
– median peptide ratio
3. Weighted
There are three methods for calculating the protein ratio value in Mascot.
On the drop down list on the format controls, the first is called ‘Average’ and is the geometric average of the peptide ratios.
The second is ‘Median’ where the median peptide ratio is selected to represent the protein ratio. If there are an even number of peptide ratios, the geometric mean of the median pair is used.
The third is ‘Weighted’ which is the intensity weighted average ratio. For each component, the intensity values of the set of peptides are summed and the protein ratios calculated from the summed values. This gives a weighted average, which will be the best measure if the accuracy is limited by counting statistics.
11

iTRAQ Tips and Tricks ASMS User Meeting 05/23/10
12
114 115 116 117
LNNYVETAK 76.88 145.91 150.18 265.19
GDYILEVNAK 13.44 24.46 78.88 134.10
LENQPLEQGAK 26.78 105.48 107.37 178.44
AASGDLIIIDLGSTLTNFK 2.88 5.10 21.34 31.96
GDADFVDAIHTSTFAMGTPIR 21.48 23.94 20.70 43.89
Summed intensity of channel
Summed intensity of 114 channel
Ratio to 114
N
199.41
114.68
1.74
4
378.47
141.46
2.68
5
653.59
141.46
4.62
5
Weighted protein ratio calculation
Weighted protein ratios are calculated using the summed intensities for each channel from each peptide that matches the protein, after outlier removal. This means that more intense spectra contribute more to the final protein ratio. In this table, we have the individual channel intensities for the five peptides that match a parent protein.The first step is outlier removal (if you’ve got it selected). This is done on the individual peptide ratios. In this case the 115/114 ratio for the third peptide is removed because it has a ratio of 3.9 – far higher than the ratios for the other peptides. So to calculate the 115/114 ratio, these peptide intensity values will be used. If we look at the contribution from each peptide to each channel, shown in the stacked bar chart, we can see that by using the intensity values the most intense peaks are contributing far more to our total intensity value, and thus to the final ratio calculation. This gives us a ratio of 1.74 and an N of 4.No outliers to remove for 116/114, so all 5 peptide intensity values will be used, giving us a ratio of 2.68 and an N of 5.Likewise, there are no outliers to remove for 117/114, so again we use all five peptide intensity values giving us a ratio of 4.62 and an N of 5.
12

iTRAQ Tips and Tricks ASMS User Meeting 05/23/10
13
Unique peptides only• Introduced in Mascot 2.3
– Many people asked for it
• Only peptides found in a single protein hit used in the calculation
• A protein hit can contain several proteins (same and subsets)
• Simplifies the report
– Tends to prevent homologues in lower hit ranks from being quantified
• Use with care
– ‘Uniqueness’ can be a factor of the database, peptide assignment and report filtering, not the sample
– Outlier removal may do what you need
In Mascot 2.3 we introduced the option to carry out the protein ratio calculation based on peptides unique to the specific protein hit (a protein hit may contain multiple proteins of course) – that is, if the same peptide is found in another protein hit in the report it will not be used to calculate the protein ratio. At first sight this may seem to be an attractive option – if two homologous proteins are present in very different amounts, including peptides common to both will skew the results. However, use this option with care –whether a peptide is unique is not an absolute – it is a function of the database, the way peptides are assigned to protein hits and the way the report is filtered. For example, a peptide is clearly far more likely to be ‘unique’ if you did a search against a small database or with a narrow taxonomy filter. The issue of peptide assignment was discussed in the previous presentation about the new protein family report, and again depending on how you group and filter your results you may get differing ‘unique’ allocations.
In many cases, discarding shared peptides will discard useful measurements. If the shared peptide really is skewing the results then using outlier removal may be sufficient to work around the problem.
13

iTRAQ Tips and Tricks ASMS User Meeting 05/23/10
14
In the following examples, I’ve generated a custom report in Mascot Integra to export protein and peptide ratio values into Excel but remember that the standard Mascot export script allows you to include protein and peptide quantitation values in both the XML and CSV export formats, enabling you to easily get the data into either a relational database, your own analysis application or Microsoft Excel.
14

iTRAQ Tips and Tricks ASMS User Meeting 05/23/10
15
No.
pep
tides
Ratio value0.1 0.7-0.73 3.5
Lets take a look at some peptide ratio distributions for the ratios from a large iTRAQ 4-plex dataset. Here I’ve used the Mascot Integra report to calculate the peptide ratio values for all the peptides which pass the quality threshold, distributed the calculated ratios into 100 equal sized bins and then plotted the distribution in Excel. This is a very nice, narrow and symmetric distribution with a small standard deviation – not quite textbook but not far off. However, it is centred at 0.7 not 1, so perhaps this dataset should have been normalised.
15

iTRAQ Tips and Tricks ASMS User Meeting 05/23/10
16
No.
pep
tides
Ratio value
0.1 3.50.95-0.98
116/114 peptide distribution – ok, that isn’t so good, as there is a definite skew to the left of the mode value. but still the kind of distribution you’ll often get and can work with. In this case the dataset comes from a merged search of replicates which, in an ideal world, would have all had exactly the same distribution and you’d keep a nice tight distribution. However, looking at this you’d suspect that there were some differences and the has had an effect and broadened our distribution, increasing the global standard deviation.
16

iTRAQ Tips and Tricks ASMS User Meeting 05/23/10
17
Whole Lysate Cell-cycle Proteomics
● Following HeLa S3 cells through one cell division
– Whole cell lysate, cells arrested at four time-points through the cycle
– 4-plex iTRAQ reagents
– 14-fraction SCX for 1st dimension
– 15cm x 75um C18 (5m packing)
– LC MALDI workflow (ABI 4800)
– Peak list generated with Mascot Distiller
– Search and quantitation with Mascot 2.3
And now for an example of a good dataset from Daryl Pappin’s lab where everything has come together...
17

iTRAQ Tips and Tricks ASMS User Meeting 05/23/10
18
G1early 2 hr
Time course labeling of cell cycle arrest
G1late 4 hr S/G2 Prometaphase
Trypsin Digestion
Label with iTRAQ™Reagents114 115 116 117
MIX
LC MS/MS Analysis on 4800 TOF/TOF™ Analyzer
Cell Cycle Arrest and Labeling Workflow (HeLa S3)
SCX
1 hr, RT,Single addition
Single 2D LC analysis for combined samples (4-plex)
Quick overview of the arrest and labeling workflow.

iTRAQ Tips and Tricks ASMS User Meeting 05/23/10
19
Summary Statistics from Search with Mascot 2.3
-3266 proteins quantified
-Peptides p<0.05
-FDR 1.6%
Search Summary (Quantitation Tab).

iTRAQ Tips and Tricks ASMS User Meeting 05/23/10
20
Looking for the usual suspects!
Matched peptides to Cyclin B1 are show here in Integra, with one peptide highlighted to show the fragment-ion match, and…(next slide)
iTRAQ Tips and Tricks ASMS User Meeting 05/23/10
21
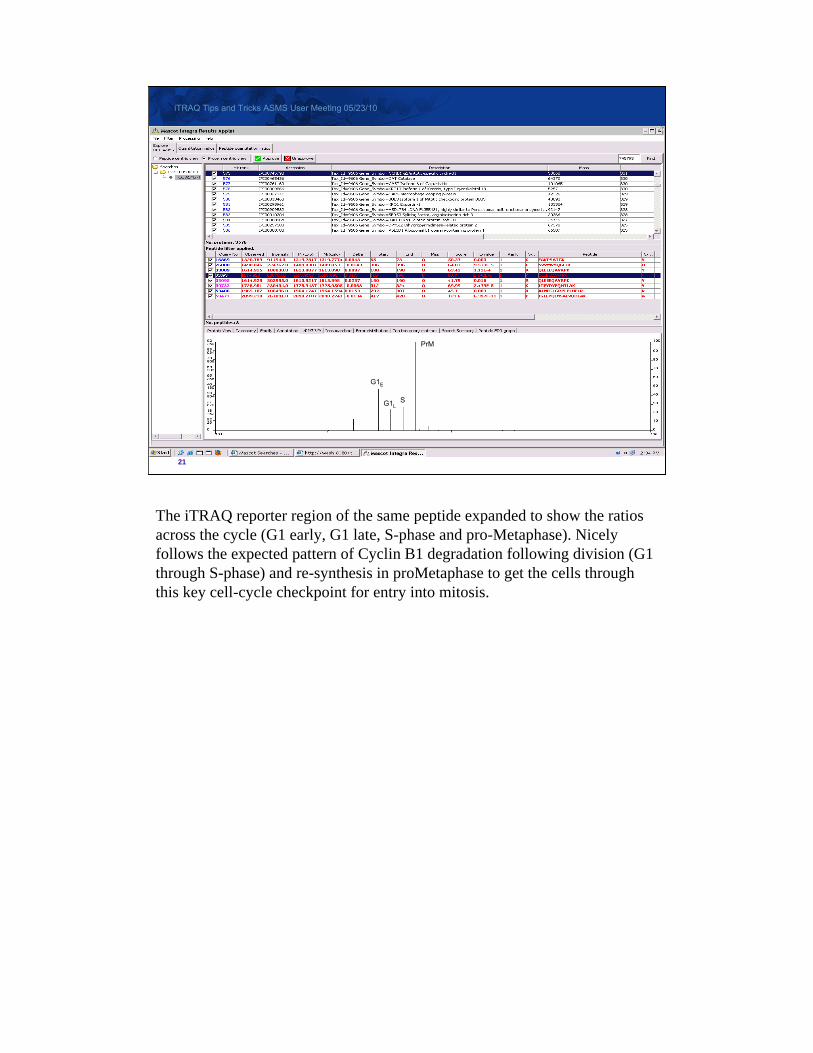
G1E
G1LS
PrM
The iTRAQ reporter region of the same peptide expanded to show the ratios across the cycle (G1 early, G1 late, S-phase and pro-Metaphase). Nicely follows the expected pattern of Cyclin B1 degradation following division (G1 through S-phase) and re-synthesis in proMetaphase to get the cells through this key cell-cycle checkpoint for entry into mitosis.

iTRAQ Tips and Tricks ASMS User Meeting 05/23/10
22
Cyclin B1 peptides p<0.05
Integra view of the iTRAQ ratios of the peptides that map to Cyclin B1. Note the spread at the last time point (117/114), which is typical of real data, but the beauty of intensity weighting is that the lower ratios come from weaker spectra and contribute less to the final calculated ratios.

iTRAQ Tips and Tricks ASMS User Meeting 05/23/10
23
Clustering the data
• K-means clustering
– Fast, supervised, heuristic algorithm
– Implemented in the Mascot Integra Results Applet
• Group proteins/peptides based on ratio profiles
– Much easier to spot groups of proteins with similar behaviour
When it comes to trying to look at the actual protein and peptide ratios and spot trends, groups and outliers then clustering together proteins or peptides based on their quantitation profiles is a very powerful way to do this. If you’re after the mathmatically perfect solution, then clustering algorithms can be very slow as the problem is a pretty complex one to solve. However, often a good approximation is good enough, as is the case with sequence alignment using BLAST. One fast clustering algorithm is the K-means clustering algorithm. This is a fast clustering method. It is supervised – that is to say that you have to tell the algorithm how many clusters to generate. It is also, like BLAST, a heuristic algorithm. That is, it gives a good approximation but not a mathematically perfect answer. The Mascot Integra Results Applet includes K-means clustering for both protein and peptide quantitation ratios –but it is a common algorithm and there are many programing libraries out there to do this.
23

iTRAQ Tips and Tricks ASMS User Meeting 05/23/10
24
Protein level cluster (Cycin B1)
To do the clustering, we simply have to click on the ‘Cluster’ button and tell the system how many clusters to generate. Even for a large dataset like this, the results will come back very quickly. Here we’re using the clustering to see what clusters with Cyclin B. This is where to start looking for proteins that may behave in the same way through the cell cycle

25
iTRAQ Tips and Tricks ASMS User Meeting 05/23/10
25
Protein Profile Similarity Screening- Kirchner, M. et al. (2010) Bioinformatics 26(1), 76-83
A more detailed analysis of the cell cycle data using a peptide-level analysis workflow developed by Kirchner et al. produced 65 distinct clusters

26
iTRAQ Tips and Tricks ASMS User Meeting 05/23/10
26
Cytoskeleton Cluster:• lamin• filamin• plectin
Ki‐67 Cluster
Myosin IX Cluster
Metabolic EnzymeCluster:• pyruvate kinase 3
Clusters of Interest!
Metabolic enzymes (cluster 62) showing pretty constant across the cell cycle (good candidates for internal normalization)
Ki-67 (cluster 27) is often used as a protein marker for proliferation (and to determine the growth fraction of a cell population). Often correlated with the clinical progression of cancer (prostate, breast), so any other proteins that correlate are of interest.
27
iTRAQ Tips and Tricks ASMS User Meeting 05/23/10
27
Fraction of pep
tides derived
from known APC‐substrates
Cluster Number
Cluster 64
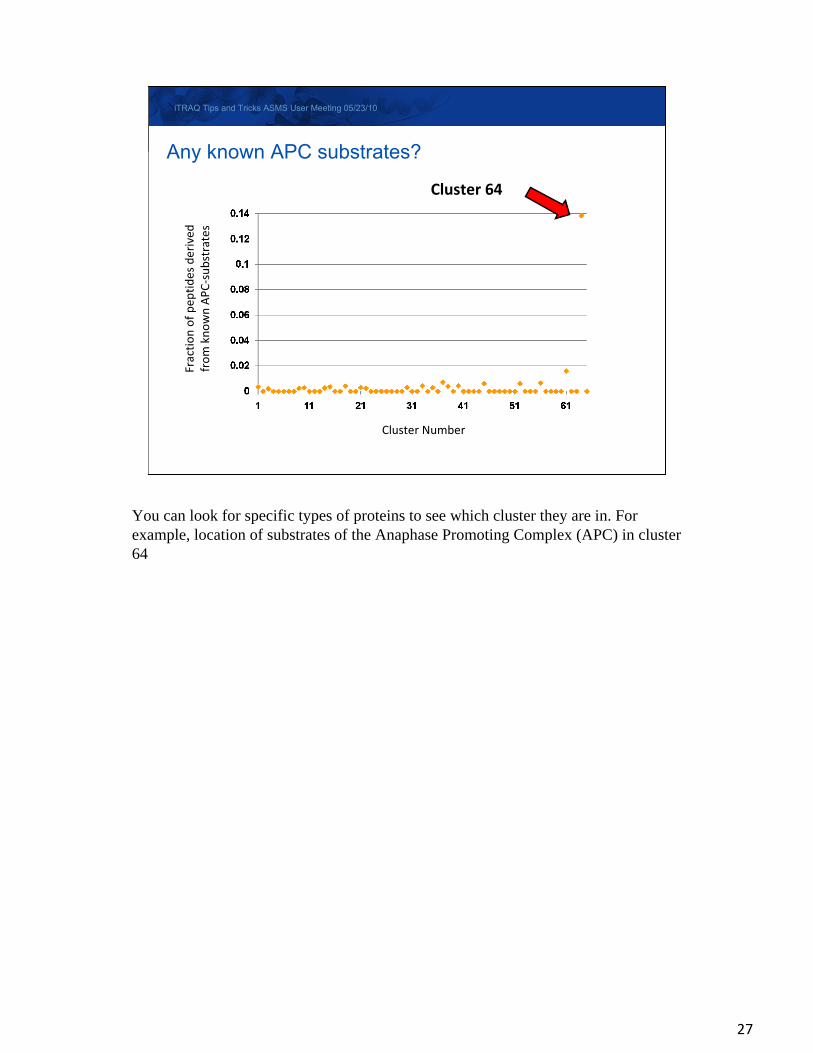
Any known APC substrates?
You can look for specific types of proteins to see which cluster they are in. For example, location of substrates of the Anaphase Promoting Complex (APC) in cluster 64

28
iTRAQ Tips and Tricks ASMS User Meeting 05/23/10
28
Bottom line: Cluster 64 is a cluster of interest!
Cluster 64 comprises 123 peptides from 91 proteins
Two years further biochemical analysis…
3 new APC substrates!
Cluster 64: Where the Cyclins are….
Cluster 64 is also where the peptides from Cyclin B are found (Red). Two years additional work by Judith and Hanno Steen (Children’s Hospital, Boston) resulted in the identification of 3 new APC substrates! And this from just one cluster….
There will be a pdf containing some optimised instrument settings and protocols that Darryl and his group have put together available for download from the Matrix Science website shortly after ASMS.

iTRAQ Tips and Tricks ASMS User Meeting 05/23/10
29
Acknowledgements
● CSHL Proteomics Laboratory
– Cristian Ruse
– Cexion Fu
– Samantha Peacock
● Children’s Hospital, Boston
– Judith & Hanno Steen
– Ken Parker
29