Embed Size (px)
Citation preview

i
ITS IDEA Program CommitteeITS IDEA Program CommitteeITS IDEA Program CommitteeITS IDEA Program CommitteeITS IDEA Program Committee
Roy AllenAssociation of American Railroads
Clifford BragdonDowling College
Daniel BrandCharles River Associates, Inc.
A. Ray ChamberlainParsons Brinckerhoff
John GermanCity of San Antonio
Edwin HauserKimley-Horn Associates
Michael KushnerNextBus Information Systems, Inc.
Marshall LihNational Science Foundation
George ParkerAssn. of International Automobile Manufacturers
Ray PethtelVirginia Tech
Noah RifkinVeridian Engineering, Transportation Group
Charles WallaceUniversity of Florida
Carol A. ZimmermanBattelle
Liaison Members
Fenton CareyRSPA
John CollinsITS America
Christine M. JohnsonUS DOT
Dennis C. JudyckiFHWA
Walter KulykFTA
Robert McCownFRA
Raymond P. OwingsNHTSA
Jeffrey F. PaniatiITS Joint Program Office
Raymond E. StarsmanITS America
Michael F. TrentacosteFHWA
DOT Staff
Pamela Crenshaw
FHWA Staff
Robert FerlisDavid Gibson
FRA Staff
Lang NguyenSteve Sill
ITS America Staff
Steve Keppler
NHTSA Staff
Duane Perrin
IDEA Program Staff
Robert E. Skinner, Jr., Executive DirectorNeil Hawks, Director, Special Programs DivisionKeith Gates, ITS-IDEA Program OfficerInam Jawed, NCHRP-IDEA Program OfficerHarvey Berlin, Transit-IDEA Program OfficerCharles Taylor, HSR-IDEA Program OfficerRichard Cunard, Division A LiaisonDebbie Irvin, Project Assistant
Mailing Address:2101 Constitution Avenue, N.W.Washington, D.C. 20418
Office Location:GR 2132001 Wisconsin Avenue, N.W.Washington, D.C. 20007202-334-3568

ii
The publication of this report does not necessarily indicate approval or endorsement of thefindings, technical opinions, conclusions, or recommendations, either inferred or specificallyexpressed therein, by the National Academies, the U.S. Department of Transportation, or theAmerican Association of State Highway and Transportation Officials.

iii
Innovations Deserving Exploratory Analysis Program
Final Report for IDEA Project ITS-61
IRIS: Intelligent Ranging withInfrared Sensors
Principal Investigators: I. Kanellakopoulos and O. M. StafsuddResearchers: P. Nelson, A. Nelsen, R. Grundy-Valenzuela, Y. Tan, N. Cohen, and J. Zhao
UCLA Electrical Engineering Department
Transportation Research BoardNational Research Council
2000
iv
ContentsContentsContentsContentsContents
Executive Summary
1. General Description
1.1. Introduction1.2. Operating principle1.3. Advantages and limitations1.4. Potential uses
2. Prototype Sensor Hardware
2.1. Mask emulator2.2. Laser illuminator
3. Prototype Sensor Software
3.1. Driver and image acquisition modules3.2. Object detection module3.3. Ranging module
4. Experimental Results
4.1. Static and moving tests using a wheeled cart4.2. Tests using moving vehicles
5. Conclusions
6. Dissemination and Publicity

1
Executive SummaryExecutive SummaryExecutive SummaryExecutive SummaryExecutive Summary
The objective of this ITS-IDEA project was the development of a new technology for rangingsensors called IRIS. This technology has the potential to produce a new generation of sensorswith significantly lower cost and substantially increased accuracy and reliability than any ofthe technologies available today. Such sensors would be useful in almost every aspect ofIntelligent Transportation Systems that requires knowledge of the position of the host vehiclerelative to the vehicles around it and with respect to the roadway itself. This specific projectfocused on the simplest version of this sensor, called IRIS-1, which computes the distancerelative to the preceding vehicle. The main accomplishment was the construction of a workingprototype of the IRIS-1 sensor that was used to successfully perform a wide array of static anddynamic in-vehicle experiments.
The hardware part of the prototype includes
■ a low-power eye-safe infrared laser illuminator,
■ a custom-built CCD receiver camera based on the Texas Instruments TC 245 chip,
■ a mask emulator for the expose-shift-expose process built by our team at UCLA using aRonchi grating and an optical setup for the emulation,
■ a fairly narrow bandpass filter centered at the frequency of the infrared laser illuminator,and
■ a laptop computer that interfaces through its parallel port with both the illuminator and thereceiver.
The software for our prototype was developed entirely by our team at UCLA; it runs on a laptopcomputer and consists of four basic modules:
■ a driver module that activates the illuminator and the receiver in the synchronous fashionnecessary for the expose-shift-expose process,
■ an image acquisition module that transfers the image data from the CCD chip to the laptop,
■ an object detection module that detects all reflective surfaces in the image and computestheir position and size, and
■ a ranging module that computes the relative distance to the preceding vehicle, assumingthat the two brightest reflections in the image are the two taillights of that vehicle.
We used this prototype to conduct static experiments in our laboratory, as well as dynamicexperiments with two vehicles in motion. In the static experiments, we ran our camera inhigh-resolution mode. This resulted in an update frequency of 1/3 Hz (one update every 3 s),and errors of ±1% for distances from 5 ft to 60 ft. For the dynamic experiments, we ran thecamera in low-resolution mode, in which we read clusters of 6 pixels as a single one. Thisallowed us to increase the refresh rate by a factor of 6 to 2 Hz (one update every 0.5 s), but theerrors also increased to ±2% for distances from about 6 ft to about 50 ft. To the best of ourknowledge, these errors are lower than those achieved by any other ranging technology currentlyavailable. Furthermore, our experiments clearly indicated that these errors were mostly due

2
to the imperfections of our experimental setup, and would be significantly reduced in a com-mercially produced version of our sensor system.
These results prove that the IRIS technology works, and that it provides a clear path to a newgeneration of cheaper and better ranging sensors. A great deal of additional research anddevelopment are needed to realize the full potential of this idea, and now we know that thiseffort is fully justified and should be vigorously pursued.

3
1. General Description1. General Description1. General Description1. General Description1. General Description
1.1. Introduction
Intelligent Transportation Systems (ITS) technology is progressing at an ever-increasing rate,with exciting developments on all fronts—from driver information and assistance systems thatenhance safety and comfort, to Automated Highway Systems (AHS) aimed at increasing trafficthroughput, further enhancing safety, and reducing emissions. One of the main points ofcontention in the ITS community is the level of vehicle-to-vehicle and vehicle-to-roadwaycooperation that can be assumed. In that respect, systems currently in various stages of researchand development can be classified into three categories:
■ Autonomous systems depend only on information obtained by the sensors located on thevehicle itself, usually relative distance and velocity to stationary objects and moving vehicles.
They are therefore implementable in the immediate future, and in fact have started to appearas commercial products (collision warning, adaptive cruise control).■ Cooperative systems add information transmitted by neighboring vehicles, usually accel-eration and steering inputs. Hence, they can perform more demanding tasks than autonomoussystems, such as coordinated driving in a group, but their time to commercialization islikely to be longer.
■ Automated highway systems add information obtained from the roadway infrastructure,such as messages regarding traffic conditions and road geometry, and lateral informationfrom magnetic nails or reflective guardrails installed on the highway. Such systems canperform even more demanding tasks, like fully automated driving in a platoon, but mustface many more obstacles (standardization, liability issues, public acceptance) on their wayto implementation.
Commercial vehicles, in particular, will reap significant benefits from all stages of automation.Collision warning systems increase safety and reduce accidents, while adaptive cruise controlenhances driver comfort and reduces fuel consumption and emissions. Fleet operators canfurther reduce their costs using cooperative scenarios like the electronic towbar, in which onemanually driven vehicle is followed by two or three driverless automated vehicles. Finally, inautomated highway systems, fully automated vehicles will be able to carry freight and passengerswith significantly enhanced safety, increased fuel efficiency, and much more predictable traveltimes.
A critical automation component in any of these scenarios, especially for commercial vehicles,is the ranging sensor. Existing sensor technologies can only provide the reliability required forthese applications by increasing the cost to levels beyond those acceptable to their potentialcustomers. The TRB-IDEA project ITS-61, entitled IRIS: Intelligent Ranging with InfraredSensors, which has now been successfully completed, addressed this issue by providing thenecessary “proof of concept” for a new sensor technology, whose main advantages are its lowcost, its high reliability, and its usefulness in all stages of ITS deployment.

4
1.2. Operating Principle
The IRIS system is composed of a low-power infrared diode laser illuminator, similar to thosefound in commercial compact disc players, with a relatively wide beam that is pulsed on/off,and a receiver consisting of a charged-coupled device (CCD) image sensor, similar to thoseused in inexpensive surveillance cameras, behind a narrow bandpass filter.
As shown in Figure 1, the system records two images of the preceding vehicle in rapid succession:the first one with the illuminating laser turned off, and the second one with the laser on. Dueto the micrometer wavelength of the illuminator, almost all surfaces of the preceding vehicleand the surrounding objects scatter the incident laser beam and reflect only a negligible fraction
Figure 1
IRIS operating principle: the original scene is reduced to a three-spot pattern, which is clearly
distinguishable above the clutter.
Scene with reduced exposure and laser onDifference between images with laser on and off
Ambient scene with regular exposure Scene with reduced exposure and laser off

5
back to the receiver to be recorded on the second (laser on) image. There are, however, somesurfaces that reflect most of the incident laser beam back to its source: These are the passivereflective patches molded into the taillights of all modern vehicles, as well the reflective paintused in the license plates of many states, which act as efficient retroreflectors in the illuminator’swavelength. Subtraction of the first (laser off) image from the second (laser on) one yields aclear sharp image of these reflective surfaces against a flat background.
It is particularly important to note that, even in this simple example, the clutter is essentiallynonexistent. This is due to the combined effect of
■ the narrow bandpass filter, which significantly reduces the contribution of broadband sourcessuch as the sun or artificial lights without affecting the laser returns, and
■ the image subtraction process, which eliminates virtually all returns except those producedby laser illumination.
With the modulated illuminator and synchronous detection of the IRIS system, the retro-reflectors and license plate are the dominant features in the subtracted image. The IRIS com-putational requirements are thus significantly lower than those of a conventional approach,which would use two-dimensional image processing techniques to extract the position of thevehicle from the cluttered scene of the original image. The distance to the preceding vehicle isthen easily computed from the resulting clear pattern via standard triangulation schemes.
1.3. Advantages and Limitations
The IRIS sensor technology features several key properties, which can be viewed as significantadvantages over existing technologies:
■ As seen above, the signal-to-noise ratio is very high; this guarantees high reliability.
■ The low cost of the components (a laser illuminator similar to those used in CD players anda CCD chip similar to those used in inexpensive surveillance cameras), combined with thesimplicity of the concept, results in a much lower total system cost than any of the currentlyavailable technologies.
■ Because every vehicle on the road has reflective taillights and many have reflective licenseplates, there is no need for installation of additional infrastructure.
■ Due to the ability of the retroreflectors in taillights to reflect incident radiation from a widerange of angles back to its source, the IRIS sensor can see vehicles at angles up to 40 degreeson either side; its total field of view is, therefore, on the order of 80 degrees, which is widerthan existing sensors.
■ There is no need for on-line pointing or focusing; this eliminates any moving parts, henceincreasing the robustness of the system while decreasing its cost.

6
■ Ambient light conditions are irrelevant to the sensing process.
■ Mechanical vibrations generated by the engine or the road do not affect the sensing process;hence, no active vibration cancellation is required.
Thanks to these features, the IRIS sensors have immediate applications in autonomous rangingfor collision warning and adaptive cruise control systems currently under development byseveral automobile manufacturers, as well as the potential for significant long-term impact inAHS deployment, through their use for autonomous and cooperative ranging and even forvehicle-to-vehicle communication. In order to appreciate the full potential of the IRIS system,it is important to understand what its capabilities and limitations are.
Lateral and longitudinal ranging. When IRIS is locked on a vehicle, it monitors the apparentposition of its taillights and license plate on the CCD chip. This provides enough informationto measure the relative longitudinal distance, lateral deviation, and yaw angle between theleading and the following vehicle. However, in order to compute these quantities, the IRISsensor needs to know a baseline lateral distance, such as the distance between the taillights ofthe preceding vehicle. This is due to the fact that IRIS uses triangulation schemes, so thelength of at least one of the sides of the triangle needs to be known. This is not a problem in anexperimental setup, where the distance between the taillights and license plate of the precedingvehicle will be exactly known. However, in a general highway environment, the IRIS configu-ration described thus far cannot yield accurate absolute measurements, since the distancebetween taillights varies from one vehicle to the next.
This problem can be eliminated through a straightforward modification of the sensor configu-ration: instead of using one CCD receiver, one can use two that are mounted at a known lateraldistance from each other on the host vehicle. To distinguish between these two configura-tions, we will denote them as IRIS-1 and IRIS-2 depending on whether one or two receiversare used. The IRIS-2 sensor uses the distance between its receivers as the baseline, and thenmeasures the apparent positions of the same object (such as left or right taillight) on each of itstwo receivers to implement its triangulation scheme. Thus, IRIS-2 can compute absolute dis-tance at the additional cost of a second receiver and a more elaborate vehicle installationprocedure. Although IRIS-1 cannot measure absolute distance, it can easily lock onto a vehiclein front and track changes in the distance with high reliability, since these changes are mea-sured as changes in the apparent separation of the taillights on the single CCD receiver.
To place the above discussion in a more precise framework, let us first consider the IRIS-1sensor: it calculates the lateral and longitudinal distances as well as the yaw of the precedingvehicle through a straightforward computational scheme. The only data necessary for thisscheme to be carried out are: the focal length of the sensor (f), the taillight separation of thepreceding vehicle (d) (assuming that the license plate is positioned exactly in the middle ofthat distance), and the location of the recorded reflections of these surfaces on the CCD image(u
l, u
c, u
r). The system setup is described in Figure 2.

7
Figure 2
Geometry for extracting lateral and longitudinal information from IRIS-1.
From the CCD recorded information we define the following line functions:
L yuf
x
L yuf
x
L yuf
x
ll
cc
rr
:
:
:
=
=
= −
These lines intersect with the leading vehicles’ taillights and license plates at the points (xl, y
l),
(xr, y
r), and (x
c, y
c) respectively. Applying this information as described in Figure 2 we arrive
at the following equations:

8
d x x y y
xx x
yy y
yuf
x
yuf
x
yuf
x
x xy y
l x x
w y
l r l r
cl r
cl r
ll
l
cc
c
rr
r
l c
l c
l r
= −( ) + −( )= +
= +
=
=
= −
= −−
= ( )=
−
2 2
12
2
θ tan
min ,
cc
This set of six equations can be solved to acquire the relative yaw θ, the relative lateral devia-tion w, and the relative longitudinal distance l between the leading and the following vehicle.However, the IRIS-1 scheme clearly needs prior information about the taillight/license-plategeometry of the preceding vehicle, while the use of two CCD sensors installed on the front ofthe following vehicle eliminates that need. In fact, as we will see below, the IRIS-2 configura-tion eliminates the need for a reflective license plate altogether and simplifies the geometriccomputations.
In the IRIS-2 configuration, the algorithm for calculating the distance and yaw of the precedingvehicle can be developed using the similarly straightforward geometric method depicted inFigure 3. We define the coordinate with the origin (0,0) at the point S
2, which corresponds to
the focal point of the right CCD sensor. Lll denotes the line from the left reflective taillight on
the back of the preceding vehicle to the focal point of the left CCD sensor installed on thefollowing vehicle. The other three lines L
lr, L
rl, and L
rr, have the same geometric meaning as L
ll.
Now it is straightforward to obtain the analytic expressions of these lines:
L y duf
x
L y duf
x
L yuf
x
L yuf
x
llll
lrlr
rlrl
rrrr
:
:
:
: .
− = −
− = −
=
= −
The intersection point L of L1l and L
2l, which stands for the position of the left taillight of the
preceding vehicle, is computed as
xf d
u u
yd u
u u
rlr rr
rrr
lr rr
= ⋅−
= ⋅−
.

9
Figure 3
Geometry for extracting lateral and longitudinal information from IRIS-2.
Similarly, the intersecting point R of L1r
and L2r
, the position of right taillight of the precedingvehicle, is
xf d
u u
yu d
u u
lll rl
lrl
ll rl
= ⋅+
= ⋅+
.
From these equations, the longitudinal and lateral distances l and w and the yaw θ are com-puted as
l x x f
wy y
x xy y
r l
l r
l r
l r
= ( ) −
= +
= −−
−
min ,
.
tan .
2
1θ

10
From the above procedure for computing the longitudinal and lateral distance and the yaw ofthe preceding vehicle, we see that IRIS-2 does not require knowledge of the distance betweenthe two taillights of that vehicle, while that knowledge is required in the IRIS-1 configuration.Thus, a vehicle equipped with the IRIS-2 sensor can accurately obtain all the necessary infor-mation for longitudinal and lateral control for any type of preceding vehicle, as long as thatvehicle has some retroreflective surface as required by law. This means that the IRIS-2 sensorcan be used to detect and track not only cars and trucks, but also motorcycles and even carswith one broken taillight.
Close following. An important issue is the ability of IRIS to track vehicles at very small distances.To achieve this, it must be able to see both taillights of the preceding vehicle; even with its80-degree field of view, it may lose one of the taillights at distances smaller than 2m (6ft).However, if two receivers are used, as in the IRIS-2 configuration, then the orientation of oneof them can be appropriately adjusted to guarantee tracking at distances as low as 0.6m (2ft).
Reflective surfaces. Due to its operating principle of image subtraction, IRIS cannot detectany objects that do not have reflective surfaces. On the other hand, it can very easily andreliably detect any reflective object, such as vehicle taillights, street signs, overhead signs, andeven reflective lane markers.
Adverse weather. Like any other sensor operating in visible or near-visible wavelengths, IRISis not able to operate reliably in very heavy rain, fog, or snow. However, because it relies onthe subtraction of two images and not on time-of-flight measurements, the operating weatherthreshold of IRIS is significantly higher than that of other infrared or vision-based sensors.
Multiple targets. Because each vehicle in the wide field of view of an IRIS sensor appears as aseparate triangular pattern, it is very easy to track multiple targets without being confused bytheir separate returns. To achieve this, however, a fast and reliable cluster classification algo-rithm is required, which can identify the triangular patterns so they can be tracked.
Lane entry and departure. Due to the high reliability of its measurements and the robustnessof its operating principle, the IRIS sensor is virtually immune to false returns. Hence, whenanother vehicle enters the lane in front or when the vehicle that was being tracked leaves thatlane, the IRIS sensor immediately knows about it due to its ability to track lateral motionwithin its wide field of view.
1.4. Potential Uses
Using the above list of advantages and disadvantages, it is straightforward to conclude thatIRIS will be useful in the following ITS applications:
Collision warning and avoidance. Clearly, when IRIS is used as a stand-alone sensor forcollision warning, it can only warn the driver about impending collisions with other vehicleswhose reflective surfaces are clearly visible. It will not be able to detect nonreflective obstaclessuch as pedestrians, trees, and highway barriers. However, its most important advantage overradar-based systems (which can detect nonreflective objects and can operate under more adverseweather conditions) is that, unlike IRIS, radar suffers from shadow returns that can set off

11
frequent false alarms and prompt the driver to turn off or ignore the system. To avoid that,such systems usually set a high return threshold above which an alarm will be triggered.Consequently, they often misjudge low-level returns from small or low-profile vehicles andmotorcycles as false, and do not activate their alarm until these targets are much too close foreffective action to be taken.
The IRIS sensor can significantly mitigate this problem when used as a very-low-cost add-onto such systems. By combining the radar returns with the virtually foolproof detection of IRIS,such a system would eliminate the threshold problem for vehicles and other objects withreflective surfaces in most weather conditions, and it would still be able to recognize nonreflectiveobjects and operate in severe weather, albeit in somewhat degraded mode.
Adaptive cruise control. Since IRIS-1 can only measure changes in the distance from an arbitrarypreceding vehicle, it can be used as a stand-alone ranging sensor for adaptive cruise controlsystems that use a driver-initialized spacing policy. In other words, the driver is responsiblefor first achieving the desired spacing and then activating the system; this way, IRIS-1 can beused to maintain that selected distance, even though it does not know its exact value.
It is well known that constant spacing results in less than ideal performance for adaptive cruisecontrol, and that time-dependent spacing yields better response. This spacing policy, usuallycalled time headway, expresses the desired spacing from the preceding vehicle in seconds andcompares it to the current spacing, which is computed as the absolute distance divided by thecurrent speed of the host vehicle. To implement this spacing policy, the controller needs toknow the current speed of its own host vehicle (always available) as well as the absolute dis-tance to the vehicle in front, which the IRIS-1 sensor cannot provide.
Nevertheless, the above principle of driver initialization applies to time headway as well. Inparticular, it can be shown that the time headway can be computed up to an unknown con-stant from the apparent separation of the taillights and the speed of the host vehicle. Once thedriver achieves the desired headway and activates the system, it is possible to maintain thisheadway by controlling the apparent separation in response to changes in the vehicle speed;the unknown constant is not required for this process.
On the other hand, driver initialization is not as user-friendly as the ability to “dial up” adesired distance or headway. Consider, for example, the case where the preceding vehicleleaves the lane and a new vehicle must be tracked: in an IRIS-1 system, the driver has to repeatthe initialization procedure each time. Clearly, it would be preferable to use an IRIS-2 system,which can close in on the new target without any additional input from the driver. Further-more, IRIS-2 can be used to implement mixed spacing policies, which combine constant spacingwith an added time headway.
It is worth noting that the capabilities of IRIS-1 can be augmented to obtain accurate absolutedistance measurements and eliminate the need for driver initialization:
1. Fixed reflective patterns: One can require that all vehicles to be tracked are equipped withthree reflective patches (like small bumper stickers) in a fixed-distance pattern. This low-cost solution is easily implementable in fleet settings (truck fleet operators, railroad cars),and it offers the additional benefit of being able to distinguish fleet vehicles from othervehicles on the road through the use of a distinctive reflective pattern.

12
2. Additional sensors: If the vehicle already has another sensor installed (microwave radar,laser radar, vision) which has the capability of measuring absolute distance, then IRIS-1may be used as a very low-cost add-on for enhancing reliability and improving performance.
Vehicle following/electronic towbar. In the second stage of vehicle automation, when auto-mated steering is added to automated throttle and brake operation, the control objective becomesmore ambitious: Instead of merely alerting the driver to the presence of a vehicle in front ormaintaining a desired spacing from it, one is now interested in actually following this vehiclethrough turns. Since IRIS can easily measure the lateral motion of the preceding vehicle, itcan be used as a stand-alone sensor for automated steering. However, in that case the driverhas to be certain that the vehicle in front can be trusted to follow the desired path. Therefore,this use of IRIS is very well suited for an electronic towbar scenario, where a commercial truckfleet operator forms an electronic train of several trucks, with the first one driven manually bya human driver and the others following in fully automated driverless mode. In a generalhighway setting, however, it may be preferable to use a system that follows the vehicle in frontonly as long as that vehicle remains in the current lane. A lane detection capability is thenneeded; this is discussed in the next paragraph.
Lane departure warning and road curvature prediction. The ability to measure the positionof the vehicle in the current lane, as well as the curvature of the lane and the road ahead, iscritical for applications such as lane departure warning and avoidance. Again, since IRIS canonly detect reflective surfaces, it cannot be used as a stand-alone sensor for such an applicationin a general road setting. However, most roads and nearly all highways have some reflectivesurfaces to aid drivers in predicting road curvature at night. These surfaces include reflectivepaint for lane marking and roadside posts in Europe, and even roadside and overhead signs.Since IRIS can detect not only the presence but also the shape and the relative velocity of suchsurfaces, it can be used as a sensor for road curvature. This potential is further enhanced bythe ability of IRIS to reliably monitor the movement of several vehicles in its wide field of view,even of vehicles that are several hundred meters away; after all, tracking the motion of preced-ing vehicles is commonly used by human drivers as an aid for predicting road curvature.
As is evident from the above list, IRIS-2 has significant potential as a low-cost stand-alonesensor. As for IRIS-1, its most important use may prove to be as a very low-cost add-on to becombined with another sensor such as radar or machine vision. Such combinations will resultin enhanced reliability and a larger region of operation, and will be usable in a wide range ofITS applications.

13
2. Prototype Sensor Hardware2. Prototype Sensor Hardware2. Prototype Sensor Hardware2. Prototype Sensor Hardware2. Prototype Sensor Hardware
The main accomplishment of this project was the construction of a working prototype of theIRIS-1 sensor. Figure 4 shows this prototype mounted on a wheeled cart; it consists of
■ a CCD image sensor, a commercial infrared laser illuminator mounted on a two-axis tiltmount so that the beam direction can be adjusted to coincide with the field of view of theimage sensor, a relay lens that sits between the front camera lens and the mask emulator(see below), and a bandpass optical filter that was placed on the front camera lens in orderto filter out all the incoming light except that which has the same wavelength as the infraredilluminator;
■ a black plastic shroud that encloses the entire optical setup, in order to partially shield thelight from the sides and to ensure that the operation of the system is eye-safe, by preventinganyone from placing their eye directly on the output of the laser; and
■ a 120-MHz Pentium laptop PC that controls the hardware, interfaces with the CCD camerato acquire the image data, and processes this data to identify the taillights and determinethe current state of the target vehicle.
This prototype was first used in static and dynamic experiments indoors and outdoors, with
the sensor mounted on the wheeled cart shown in Figure 4, which was being pushed manually.For the final project demonstration, this sensor was removed from the cart, mounted inside avehicle, and operated to compute the relative distance to another moving vehicle in real time.2.1. Mask Emulator
The IRIS sensor concept is based on a masked CCD array that allows the acquisition of twoimages in rapid succession. In production devices, the desired mask can be implementedduring device processing directly on the CCD chip. Such a process can be easily implementedusing existing technology, since it involves only a subset of the steps required for the manufac-turing of color CCD chips. However, it would require the modification of existing productionlines, and therefore the cost of producing just a few prototypes would be prohibitively high. Tocircumvent this problem, we built a prototype image sensor in which the masking is realizedusing a two-step optical system. The scene is first imaged onto a mask, and then the maskedimage is re-imaged onto a standard commercial CCD array built by Pixel in Oakland, California.
Our CCD array is the TC 245 made by Texas Instruments. The active area of this chip has 242rows of 756 pixels. Each pixel is 19.7 µm high and 8.5 µm wide. This is an image-transferdevice in which the active area is shifted rapidly into a storage region before read-out. Wechose this chip as the basis of the prototype IRIS sensor for the following reasons:
1. The large number of pixels in the horizontal direction (756) allows high resolution of thehorizontal positions of the target vehicle retroreflectors, as is required for accurate rangedetermination.

14
2. The ability to transfer the image rapidly into a storage area before read-out allows imageswith bright regions to be acquired at short exposure times without excessive smearing, evenwithout the use of an external shutter: Since the pixels continue to accumulate charge aslong as they are exposed to incident light, if the image is read while still being exposed, thebrightest regions of the scene can leave an increasingly bright vertical track across therecorded image. In an image-transfer chip the image is rapidly shifted into a masked storagearea and then read out, so that the time the image is exposed during the read-out process isminimized.
3. A variety of interface options exist for this chip, since it is widely used in both commercialand home-built imaging systems. Thus, computer interface electronics are readily availableand several examples of source code can be used as patterns for the custom control softwarerequired for our application.
The optical elements in the prototype imager include
■ a bandpass filter (10 nm bandwidth centered at 800 nm),
■ an imaging lens (f = 6 mm, 1:1.2),
Figure 4
Working prototype of IRIS-1 sensor.

15
■ the mask (a 300 line-per-inch Ronchi ruling), and
■ a relay lens (f = 50 mm, d = 25 mm).
These elements are mounted in a structure based on ThorLabs components to provide therigidity required in an automotive environment.
The sensor setup is shown schematically in Figure 5. The combination of the Ronchi rulingand relay lens results in the masking of pairs of rows on the CCD array, rather than single rows(the best solution available with off-the-shelf components). The loss of vertical resolutionresulting from this masking pattern is not critical, since it is primarily the horizontal resolu-tion that is used to compute the range. The choice of relay magnification was determined bythe availability of suitable commercial components (lenses and Ronchi ruling). The resultingmasking scheme is shown in Figure 6.
Figure 6:
Schematic showing the original mask configuration of our CCD chip and the effective masking scheme
achieved by the setup of Figure 5.
Figure 5:
The optical setup of our sensor prototype.

16
The focus of the relay lens and the alignment of the Ronchi ruling lines with the rows of theCCD array are crucial to the proper function of the image sensor. We emphasize again that thisis the portion of the prototype that performs the masking function, and it will not be requiredwhen a pre-fabricated masked CCD array chip is available. The mechanical tolerances for thisportion of the image sensor are extremely tight. The lines of the Ronchi ruling must be imagedat the correct magnification, they must be translated vertically to match the 19.7-µm-highpixels, and the rotation of the lines relative to the rows of CCD pixels must be correct to a fewµm over a lateral distance of about 6.4 mm. We mounted the Ronchi grating on a two-axis tiltmount to accomplish this alignment. One axis of rotation allows the lines of the grating to betilted with respect to the pixel rows. The other rotation axis tilts the grating with respect to theoptical axis, thus allowing precise shifts of the vertical registration of the grating with respectto the pixel rows. This mechanism has been constructed and the grating has been aligned withthe CCD array. In order to filter out the lights from some strong light sources, an optical band-pass filter is incorporated in the image sensor prototype. The transmission of this filter as afunction of wavelength is shown in Figure 7.
2.2. Laser Illuminator
The IRIS illuminator utilizes a commercial laser diode at a wavelength of approximately 800nm, which is matched to the transmission of the optical bandpass filter in the image sensor.The total output power of the laser is 0.5 W. This power is emitted into a highly asymmetricalbeam, which appears as a stripe in the far field. (The half-angles of the horizontal and verticaldirections are approximately 40 degrees and 5 degrees respectively.) The illuminator uses twolenses to produce an output beam that illuminates a field of view matched to the field of view
Figure 7:
The transmission characteristic curve of our bandpass filter.

17
of the image sensor. A diagram of the illuminator optics is shown in Figure 8. A cylindricallens is used to compress the beam divergence in the horizontal direction so that the verticaldivergence is about one-third that in the horizontal direction, rather than one-eighth. Then anegative lens is used to uniformly increase the divergence of the entire beam pattern. Thisoptical assembly is mounted on a two-axis tilt mount so that the beam direction can be adjustedto coincide with the field of view of the image sensor.
A commercial laser diode driver package supplies power to the laser. The driver electronicsinclude a control line that allows the laptop computer to turn the illuminator on and off.
Figure 8:
The illuminator setup of our experimental prototype.

18
3. Prototype Sensor Software3. Prototype Sensor Software3. Prototype Sensor Software3. Prototype Sensor Software3. Prototype Sensor Software
3.1. Driver and Image Acquisition Modules
In order to read and process the images that are produced within the CCD array, a productionversion of the IRIS sensor would use an integrated microprocessor connected to the CCD chipin a small package. For the purpose of development, however, we also needed to be able to viewand record these images. Thus, in our prototype system we connected the array interfaceelectronics to a parallel port of a laptop computer and used a software module to control theilluminator and receiver through this connection. Since the way we use the CCD camera isunique, it was necessary to write our own software to provide this control function. The firstversion of this program was a DOS application and was used only long enough to get the signalsequencing correct. At that point it became apparent that a Windows application would beable to display images with less programming effort, more quickly, and with the ability to bemore easily manipulated. Therefore, the DOS application code was ported to a 16-bit Windowsapplication called Win245. The “245” refers to the Texas Instruments TC 245 chip used in theimage sensor.
The Win245 program is a 16-bit Windows application with a graphical user interface that cannot only communicate with a CCD camera attached to the LPT1 parallel port, but can alsodisplay and manipulate the images produced by the camera. The program takes care of all thetiming and sequencing of the control signals that must be sent to the camera in order to acquireimages. Typically, the program takes one picture at a time, but it can take several images insequence if desired. For each sequence of images, the user can specify the exposure time,whether or not the illuminator should be used, whether or not the expose-shift-expose proce-dure should be used, and whether or not the images should be subtracted automatically.
The program refers to the use of the expose-shift-expose procedure as “using the grating.” Inthis mode, each image is created by first emptying all the exposed pixels of the CCD cameraand then allowing them to gather light for the specified exposure time. The pixels are thenshifted down by a user-specified number of rows (this number is equal to 2 in our currentexperimental setup) and then exposed a second time. With the grating in place, this modeallows one image to be taken first and then stored temporarily in the rows shielded fromexposure by the grating while another image is taken in quick succession. If the user specifiesthat the illuminator is to be used as well, the first image will be taken with the illuminator onwhile the second image will have the illuminator off. If image subtraction is used, the secondimage will be subtracted from the first before proceeding. Only this subtraction result is stored.If subtraction is not used, then both images are stored.
When the expose-shift-expose procedure is not used, the pixels are simply emptied and exposedfor the specified exposure time. In this mode, use of the illuminator just entails turning theilluminator on and off from one image of a sequence to the next. The first image always has theilluminator on. Image subtraction in this mode means that two exposures are taken for eachimage of the sequence, with the first image being completely read from the camera before thesecond is taken. The second image is then read and subtracted from the first.

19
Once an image sequence has been completely generated, the program displays each image asa separate window on the screen. Each of these image windows comes complete with its ownscroll bars and cross hairs that follow the mouse so that real-time horizontal and vertical crosssections can be viewed in the horizontal and vertical cross section display boxes. The horizontalcross section display is just below the image display while the vertical cross section display isjust to the right of the image display. Examples of such images are shown later on in Figures 13and 15.
The user has several options available for working with these resulting image sequences. Animage calculator is available that can add, subtract, multiply, or divide two images on a pixel-by-pixel basis, or a single image can have one of these operations performed on it using eachpixel and a user-provided constant as the arguments. This allows the user to perform, forinstance, an image subtraction after the images have been taken. Each image can be individuallyzoomed in once, providing a 5x horizontal and 2.5x vertical magnification. Images can also be“viewed as text” in which the visual representation of the image is replaced by rows and columnsof numbers that represent the intensity seen by each individual pixel of the camera.
There are two options available for saving image sequences. The first is the “Save As” optionthat saves all images currently displayed in a binary format. The second is the “Save As Text”option that saves all images currently displayed in a text format that can be read by most wordprocessing or spreadsheet programs. In both cases, the program stores each image in its ownfile whose name is created using the first five letters of the user-provided file name and threenumbers starting with 000. For example, if the provided file name is “picture” and there arefive images currently displayed, then the first image will be saved as “pictu000.245” and thefifth as “pictu004.245.” The program is only capable of opening the binary formatted files, soeverything should always be saved in at least this format. When a file is selected for opening,the program will search the directory for every file with the same first five letters and open allof them in order. This makes keeping image sequences together much easier.
As we mentioned above, our CCD camera has 242 rows of 756 pixels. The bottom 121 rows arecovered by the protective metallic mask of Figure 6, so that leaves the top 121 rows as theactive area where the CCD image is recorded, for a total of 121 × 756 = 91,476 active pixels.When the CCD image is transferred to the laptop computer, each of these pixels is read out inseries, after first passing through a 12-bit analog-to-digital (A/D) converter. This results in atotal of 91,476 × 12 = 1,097,712 bits for each downloaded image. With the additional commu-nication overhead, the total number of bits that have to be transferred through the parallelport of the laptop for each image is about 1.2 million. Since the transmission speed of theparallel port is approximately 400 kb/sec, we see that it takes 3 sec to download each image.Therefore, with the camera running in full resolution mode, the refresh rate of our prototype is1/3 Hz. To increase the rate, we used a technique called “binning” to reduce the number ofpixels that had to be read from the camera. Due to the physical properties of CCD cameras, itis possible to merge the contents of one pixel with those of another during the readout process.This merging of pixels is called “binning” and allows the resolution and dynamic range of thecamera to be reduced in order to increase the readout speed. For the IRIS-1 prototype, everythree horizontal pixels along with every two vertical pixels were binned, resulting in a six-foldreduction in resolution and an approximate six-fold increase in update rate. This increasedthe update rate from 1/3 Hz for the full-resolution mode to 2 Hz for the low-resolution binnedmode, which was used for our in-vehicle moving experiments.
20
Furthermore, the image acquisition module included a subroutine that computes the histo-gram of the pixel intensities during the image transfer from the CCD camera to the laptop.This histogram was then passed along with the image to the object detection module, where itwas used to determine the threshold value for noise filtering; this process is described in detailin the next section.
3.2. Object Detection Module
The driver module operates the CCD camera to record two successive images closely spaced intime, the first one with the laser on and the second one with the laser off, and store them bothin the bottom part of the chip where they are protected from further exposure to light by themetallic mask. Then, the image acquisition module transfers these two images to the com-puter memory, subtracts the second one from the first one, and creates a histogram of the pixelintensities of the resulting subtracted image. This data is then passed to the object detectionmodule, which processes the image data to detect all recorded objects with strong returns anddetermine their center positions. The three main steps in this are: (i) suppressing the noise,(ii) distinguishing between separate targets, and (iii) determining the center location andintensity of each target.
Noise Suppression. When a return becomes too bright, a phenomenon called “blooming”occurs in the CCD sensor array, which can be described as follows: The individual pixels actlike charge-holding cups. The charge (number of electrons) in each “cup” is proportional tohow bright the return is at that pixel. When the return at a CCD pixel gets too bright, thecharge fills to the top and, just like a cup, overflows into neighboring “cups.” Such overflowsmay occur in only one of the images (laser on or laser off). In these cases, subtraction of thefirst (laser off) image from the second (laser on) image cannot eliminate the overflow. Thiseffect accounts for noise in the resulting subtracted image. The suppression of such noise isimperative to the performance of the object recognition algorithm that follows. Since theoverflows are in general weaker than real returns from retroreflective surfaces, they can beeasily suppressed by thresholding.
For our first experiments, we selected a threshold manually, by looking at each image to deter-mine where to place the threshold. However, for realistic in-vehicle experiments all processinghas to be done in real time without human intervention. This means that the threshold valuefor each image must be determined automatically by the software as well. This selection wasperformed via a well-known image processing technique that uses the histogram of the distri-bution of gray levels in the image; this histogram is created by the image acquisition moduleduring the image transfer process. Because background noise (return from surfaces other thanthe retroreflectors) is much lower in intensity than the return from the taillights, the histo-gram will generally have two major hills. One starts from the beginning of the histogram (at avery low gray level); the next starts where the intensity of the taillights lies. An example of thetype of histograms we obtain is shown in Figure 9. The threshold should therefore be setaround the point where the second hill starts. Effective thresholds can be determined instan-taneously with real-time-updated histograms, provided an efficient algorithm can be devel-oped for locating the beginning of the second hill.

21
Figure 9
Typical histogram before smoothing.
The algorithm we developed looks for one large drop followed by a large rise to determine thethreshold. Even though the hills we are looking for are much larger compared to other bumpsin the histogram, we cannot assume a continuous drop or rise where the hills occur. In fact,almost all histograms exhibit jagged rises and drops like the ones seen above. To eliminate thisproblem, the histogram is first passed through a low-pass-filter. The scheme used here re-places the pixel count at a particular gray level with the average pixel count of several neigh-boring gray levels. The resultant histogram is almost free of inconsistent drops or rises. Afterthis filtering process, the histogram of Figure 9 is much smoother, as seen in Figure 10.
Figure 10:
The histogram of Figure 9 after smoothing.

22
Smooth histograms allow us to count the number of drops and rises to determine where thethreshold lies. The following is a detailed algorithm description, where navg is the number ofpixel counts to average over, ndrop is the number drop_count has to reach to declare a largedrop found, and nrise is the number rise_count has to reach to declare a large rise found. Aflowchart of the algorithm is given in Figure 11.
hist1[i] = (Σ(n = i to i+navg) hist[n]) / 10
der[i] = hist1[i] - hist1[i - 1]
der[i]>0?
YES
der[i-1]>0?
der[i-1]<0?
rise_count=nrise?
drop_flag=1?
rise_count ++
NO
YES
drop_count ++ NO
YES
YES
rise_flag = 1threshold = i
YES
NO
end
resetrise_count
NO
NO
resetdrop_count
drop_count=ndrop?
drop_flag = 1
YES
NO
Figure 11
Flowchart of threshold algorithm.

23
1. Replace current pixel count by the average of the current and the next navg pixel counts.2. Subtract the previous pixel count from the current one (calculate a discrete derivative).3. If the current and the previous derivatives are both less than zero (dropping), then incre-
ment drop_count.4. If the current derivative is dropping, and the previous derivative was rising, then reset
rise_count to zero.5. When ndrop drops are reached, declare a large drop found.6. If the current and previous derivatives are both greater than zero (rising), increment
rise_count only if a drop has been found.7. When nrise rises are found, declare a large rise found, and the threshold to be the current
gray level.8. Calculate the next histogram value by subtracting off the pixel count from the lowest gray
level being averaged, and adding one pixel count beyond the highest gray level added lasttime, then dividing by navg again.
9. Repeat steps 2 – 8 until a rise is found or the end of histogram has been reached.
Pattern Separation. The problem of determining the center points of all objects present inthe image has two parts: (a) recognizing individual objects, and (b) finding their respectivecenter positions. Since other objects such as license plates, road signs, and taillights fromother cars are also sufficient retroreflectors at the illuminator’s wavelength, even the mostbasic model of just one car may have three distinct objects after thresholding.
Utilizing some functions in Matlab, an iterative algorithm was developed to separate all disjointobjects in a given thresholded image. The find function in Matlab scans a given matrix onecolumn at a time, returning the positions and values of the non-zero elements. [row, col, vlu]= find(A) returns, for all nonzero elements in matrix A, the row numbers in vector row, columnnumbers in vector col, and values in vector vlu. This function provides, with reasonableprocessing, all the necessary information for finding the center positions of all disjoint nonzeroregions in an image.
An object is defined as one with no complete vertical or horizontal breaks. The first step is torecognize which information in row, col, and vlu belong to one object. Since there is anunknown number of disjoint objects in the image, an iterative algorithm was selected. Thefollowing is a detailed algorithm description. Figure 12 shows the flowchart of the patternseparation algorithm.
1. Given an image, find the first completely zero row and/or column (called breaks from now on).2. Cut the given image vertically and horizontally (into four pieces) if both vertical and hori-
zontal breaks exist. If only horizontal (vertical) break exists, cut horizontally (vertically).If no breaks (neither horizontal nor vertical) are found, declare the given image to be oneobject.
3. Find the positions (srow, scol) and values (svlu) of the non-zero pixels in the resultant sub-image(s). Add row and column offsets to srow and scol, respectively (row and columnoffsets for the first iteration are zero).

24
find the first completely zerorow or column
completely zero row?
cut horizontally
YES
completely zero column?
completely zero column?
NO
cut vertically
cut vertically
YES
YES
find information of sub-imagesand store in psu , psv, and vlu
Lookat the
currentsub-
imageagain
NO
Last sub-image?
NONO
Look at the next sub-image
YES
Calculate center positionsfrom psu , psv, and vlu
end
find information of sub-imagesand store in psu , psv, and vlu
Figure 12
Flowchart of pattern separation algorithm.
4. Put srow, scol, and svlu into the final information matrices row, col, and vlu. Row, col, andvlu are defined as matrices, where the corresponding columns in the matrices contain theinformation of the non-zero pixels in one sub-image. Here,
L = number of columns in row (col, or vlu);row = [row(:, 1:i-1) srow row(:, i+1:L)];col = [col(:, 1:i-1) scol col(:, i+1:L)]; andvlu = [vlu(:, 1:i-1) svlu vlu(:, i+1:L)].
Effectively, we replace the information of the i-th sub-image with the information of its sub-images.
5. If the previous sub-image is already one object, then look at sub-image i+1; if not, look at thefirst resultant sub-image (sub-image i).
6. Determine the row and column offsets of the current sub-image (with respect to the originalimage), repeat steps 1 – 5 for the current sub-image.

25
7. Repeat steps 1 – 6 until all sub-images contain just one object (i.e., until each column ofrow, col, and vlu only contain information for one object).
This algorithm was designed to take into consideration that the shape of the taillights can varyfrom one vehicle to another, and that the apparent size of the taillights on the CCD image canchange significantly with the distance between the host vehicle and the preceding vehicle.Since the algorithm only finds pixels that are not disjoint with respect to one another, it makesno assumption about the shape and size of the objects present in the given image; this makesit more robust with respect to such variations. However, if a small break (vertical or horizontal)is present in an object, the algorithm would recognize this object as two (or more) separateobjects. The solution to this problem is to increase the number of completely zero rows (orcolumns) that can occur before declaring a break at that point.
After the row, column, and intensity information of the thresholded image is organized intomatrices, the centers of the objects can then be found by performing a weighted average. Forevery column of the matrix row, and the corresponding column in col and vlu, the following isperformed:
1. Every row and column number is weighted by the pixel intensity at that position.2. The weighted row (and column) numbers are summed together.3. The pixel intensities are also summed together.4. The weighted row (and column) sum is divided by the intensity sum to obtain the final
calculated center position.
The return from the taillights is usually brightest at the center of the taillights, then tapers offquickly. Using a weighted average to calculate center points thus presents significant advan-tages. Since the return is brightest at the centers, the center positions are weighted moreheavily, making the calculation more accurate. Weighted average also makes no assumptionon the size and shape of the objects.
For the IRIS-1 prototype implementation, the object detection algorithm described above wasported to our laptop computer and integrated with the other software modules. Its output,which was fed into the ranging module, consisted in the center positions and total pixel inten-sities of each detected object. As we will see, this is all the information that the rangingmodule needs in order to compute the distance from the preceding vehicle.
3.3. Ranging module
The main purpose of our prototype was to compute and continuously update the relative distanceof the host vehicle from the target vehicle. In a complete product, this computed distancewould be fed to another module that would issue a warning to the driver (in a collision warningsystem) or would activate the throttle or brake (in an adaptive cruise control system). For thepurpose of our demonstration, however, this computed distance was displayed prominently onthe screen of the laptop computer. The process of displaying the subtracted image and thecomputed distance is much more computationally intensive than the distance computationalgorithm itself, but this was necessary for debugging and demonstration. The ranging module

26
can operate equally well in both the high-resolution-low-frequency and the low-resolution-high-frequency modes, which were described above. Since the image data transfer from theCCD to the memory of the laptop through the parallel port is by far the most time-consumingstep in the entire process, the update rate is determined almost entirely by the resolution inwhich the camera operates; the time required for the range computation and display is negligiblein comparison.
As mentioned above, the input to the ranging module consists in the center position and totalpixel intensity of each detected object. All the retroreflective surfaces within the viewingrange of the IRIS sensor show up as objects, including the taillights and license plate of thepreceding vehicle and of the vehicles in neighboring lanes, traffic signs, lane markers, etc. Forthe purpose of this project, however, we wanted to test the ability of the sensor to track thevehicle in front, whose taillights always produce the two brightest returns on the CCD image.Therefore, our ranging module selected the two objects with the highest total pixel intensities(brightness of return), and assumed that they were the taillights of the vehicle in front. Then,using the simple trigonometric relations depicted in Figure 2, it computed the distance to thepreceding vehicle using the known distance between the two taillights, which was 1.1 m.
A critical aspect of the ranging software module is the calibration of the triangulation parameters,which for this project include the focal length and the measurement bias. This calibration wasperformed off-line, using several images of the target vehicle at known distances away. Thenwe performed a least-squares fit to compute the best values for these two parameters. Ofcourse, in a commercial product this calibration procedure will have to be automated.

27
4. Experimental Results4. Experimental Results4. Experimental Results4. Experimental Results4. Experimental Results
4.1. Static and moving tests using a wheeled cart
For the first suite of moving tests, we mounted the IRIS prototype system on the wheeled cartshown in Figure 4 and took measurements outdoors by pushing the cart at various speedswhile viewing the rear of an automobile. The images used an exposure time of 100 ms, that is,the CCD array pixels were cleared and exposed for 100 ms. The resulting pixel charges werethen shifted down two rows and exposed for a second 100 ms period (the shift time of 100 µsis negligible compared to the exposure time). After the second exposure, the image chargeswere shifted to the storage portion of the chip, read out, and the subtracted image produced bythe Win245 software.
Figure 13 shows the screen display of the Win245 program for a subtracted image taken while
the cart was approximately 6.5 m behind the car and moving toward it at 3.2 m/s. A plot of theintensity vs. pixel position is shown in Figure 14 for the portion of this image containing thevehicle. Clearly, this experiment represents one of the worst possible scenarios, and we arenot even sure that this could ever happen in an actual car; keep in mind that this cart is rollingon hard wheels without any suspension, and it is being pushed by a human who is running at3.2 m/s. This mode of operation introduces a large amount of vertical vibration, whose effectis further compounded by the fairly long exposure time we had to use due to the limitations ofour present setup. This causes the ambient scene in the two successive images to be quitedifferent, thus resulting in imperfect cancellation of ambient noise after the image subtractionprocess. In a car driving down a highway with a regular suspension, an IRIS system usingabout one-quarter of the exposure time would never have to deal with anything this radical.Still, we see that the retroreflectors in the taillight covers are clearly identifiable above theconsiderable noise. The license plate is also visible, although its reflectivity is obviously lowerthan that of the retroreflectors, and its image is buried in the ambient noise. We used this dataset as a benchmark for our ranging algorithms, to see whether our filtering techniques candetect the presence of the license plate and pick out its position from the noise.Our conjecture that the poor (yet still usable) quality of the data in Figures 13 and 14 wascaused by the fast motion of the cart, is supported by the data shown in Figures 15 and 16,which resulted from a similar test of the cart-mounted IRIS system when the cart was beingpushed at the slower speed of 2.2 m/s. Note that the subtraction is much more effective in thisimage, due to the significantly smaller vertical vibration of the cart, which made the represen-tation of the ambient scene in the two successive images much more similar, thus allowing it tobe canceled out by the subtraction. The resulting signal-to-noise ratio of the reflective parts ofthe image vs. the non-reflective ones is very large, and we believe that this data set is muchmore typical of what we can expect in a real highway environment. Once again, the licenseplate is much less prominent than the taillights, although now it is very clearly identifiable.We believe that this difference is due to the fact that the reflectivity of the paint in the licenseplate is much lower at the infrared illuminator wavelength than that of the taillights. Both datasets clearly demonstrate that the image subtraction is effective even when the IRIS system ison a vibrating moving platform.

28
Figure 14
The intensity plot produced with the cart moving at 3.2 m/s.
Figure 13
The Win245 image produced with the cart moving at 3.2 m/s.

29
Figure 16
The intensity plot produced with the cart moving at 2.2 m/s.
Figure 15
The Win245 image produced with the cart moving at 2.2 m/s.

30
To further test our conjecture, we performed an array of static tests in a laboratory environ-ment, running the camera in the high-resolution (242 × 756) mode. The target was placed atdistances varying from 5 ft to 60 ft, and the error of the computed range was consistently below1%. This strengthened our confidence in the validity of our methodology, and naturally led tothe next suite of tests, which were performed using two moving vehicles.
4.2. Tests using moving vehicles
On September 21, 1998, a demonstration was conducted on the UCLA campus in order toshowcase the ranging capabilities of our prototype IRIS-1 sensor to the members of our Over-view Technical Committee. The members of the committee were:
■ Robert Diller, Vice President for Research of Interactive Voice Systems Inc.,
■ Dr. Barry Dunbridge, Director for Electronics Technology in the Center for Automotive Tech-nology of TRW Automotive, and
■ Rudolf Lorenz, Director of the Vehicle Systems Technology Center of Daimler-Benz Re-search and Technology North America.
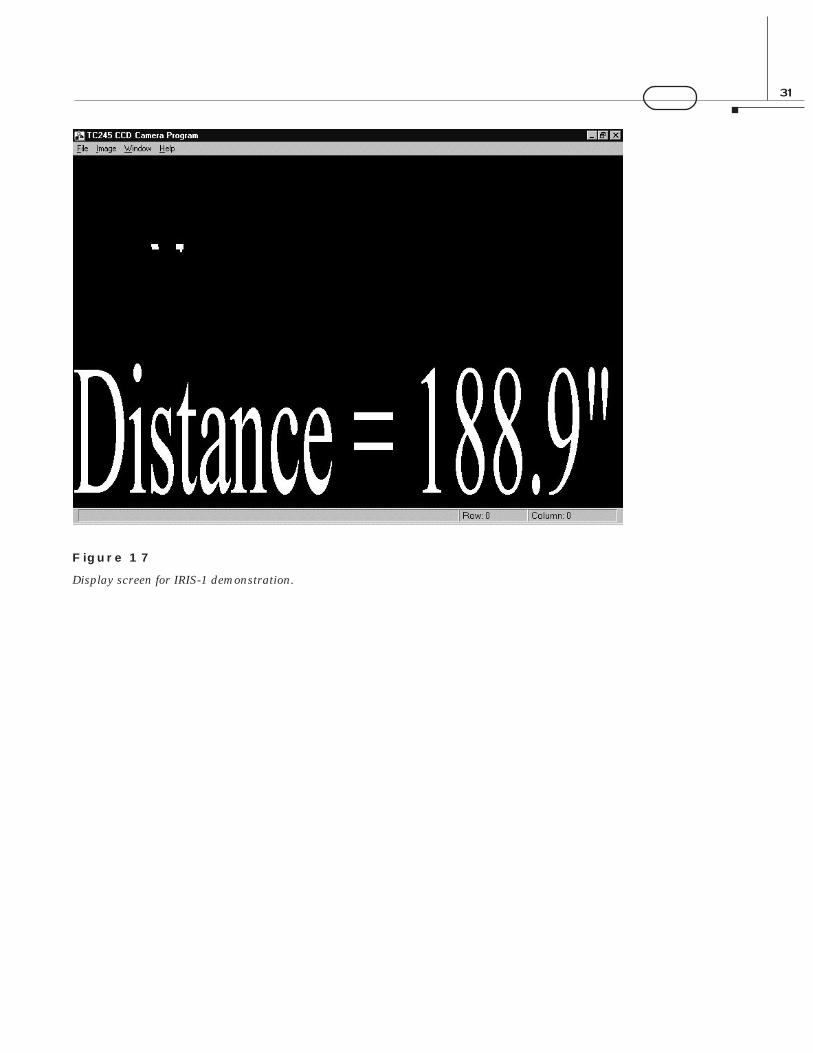
Due to the size of the prototype shown in Figure 4, it was impossible to mount it on the frontside of any vehicle. Therefore, the whole setup was taken off the wheeled cart and placed inthe rear cargo area of a Ford Explorer, whose cargo door was left open with the sensor pointingbackwards. The prototype was powered from the electrical system of the car using a 12VDC-to-110VAC power inverter. The target vehicle was a Ford Escort, which was driven behind theExplorer and facing in the opposite direction, in order for the IRIS sensor to be able to track itstaillight assembly. The suite of experiments included ranging with both vehicles stationary,with the Explorer stationary while the Escort was driven in reverse (closing in) and forward(moving away), with the Escort stationary while the Explorer was driven in reverse (closing in)and forward (moving away), and finally with both vehicles moving at the same time, at speedsup to 10 mph. The exposure time was set to 30 ms, and the camera was operated in the low-resolution (121 × 252) mode, which increased the update frequency to 2 Hz. At this frequency,the IRIS-1 prototype was able to accurately and reliably track the target vehicle at relativespeeds of up to 10mph, with errors that remained smaller than 2% for distances ranging fromabout 6 ft to about 50 ft. The acquired CCD image and the corresponding computed range (ininches) were continuously displayed on the screen of the laptop computer, as depicted inFigure 17.
31
Figure 17
Display screen for IRIS-1 demonstration.

32
5. Conclusions5. Conclusions5. Conclusions5. Conclusions5. Conclusions
The ITS-61 project accomplished its main goal, which was to prove the feasibility of the IRISconcept. In fact, the performance of the prototype IRIS sensor performance exceeded ourexpectations even in a realistic in-vehicle environment. Of course, this success was only thebeginning. Now that we know that the IRIS technology works, we are planning to pursue abroad array of research directions in order to realize the full potential of IRIS. Using someadditional funding from TRW and Daimler-Benz, we are already working on resolving some ofthe problems we encountered during this project and implementing some of the many possibleenhancements and extensions. This research is beyond the scope of the current project, but itwill leverage its accomplishments, increase its payoff, and make this technology of even greatervalue to the ITS community. These optional tasks include:
■ Installation of a new IR bandpass filter with improved rejection of out-of-band light, so thatwe can reduce our exposure times and the resolution of the camera, and operate the IRIShost vehicle at highway speeds.
■ Fabrication of the on-chip masking scheme of Figure 5. One of the main sources of noiseand sensitivity to vibrations in the current IRIS prototype is the way that the maskingscheme has been aligned with the CCD chip. We can eliminate these problems by fabricat-ing the alternate-row mask of Figure 5 and mounting it directly on the CCD chip. Ourefforts to convince chip manufacturers such as Texas Instruments to collaborate with us inthis direction have not been fruitful thus far. Therefore, we now trying to do this ourselvesin the Nanofabrication facility at UCLA, where all the necessary equipment is already inplace. Using specialized handling equipment under a microscope, we will remove the coverof the CCD, attach and align the mask, and replace the cover. To avoid problems of mis-alignment, we will use a special adhesive that hardens only when exposed to ultravioletlight. This way, we will perform the alignment under red lights, and when everything hasbeen set to meet our specifications, we will flood the device with ultraviolet light. Thison-chip masking scheme will make our prototype much smaller than it currently is, and itwill allow us to significantly reduce the sensor’s sensitivity to vibrations, as well as therequired exposure times.
■ Implementation of the IRIS-2 configuration in hardware, and modification of the rangingalgorithms to utilize the geometry of Figure 3. This will endow the IRIS sensor with stereo-scopic vision and it will eliminate the need for any a priori knowledge about the target, suchas the distance between the taillights.
■ Integration of the IRIS sensor with a low-cost radar sensor. The combination of two differentsensor technologies with complementary capabilities will allow us to produce a new generationof highly reliable sensor systems capable of operating under nearly all weather conditionsand without any infrastructure requirements.
We are also in the process of filing patents for this technology, and we continue to pursuepossible collaborations with industrial partners for its commercialization.

33
6. Dissemination and Publicity6. Dissemination and Publicity6. Dissemination and Publicity6. Dissemination and Publicity6. Dissemination and Publicity
In order to disseminate our results and attract attention to this project, we have taken thefollowing steps:
1. We prepared and presented a poster at the TRB booth of the NAHSC Exposition Hall duringDemo 97 held in San Diego, California, on August 7-10.
2. We have developed a Website (http://ansl.ee.ucla.edu/iris) for the project that contains on-line information and publications.
3. We presented seminars on this technology at
■ the ITS Enabling Technologies Symposium organized by the John L. Volpe NationalTransportation Systems Center of the U.S. Department of Transportation in Cambridge,Massachusetts, on September 16, 1997,
■ the Center for Autonomous Systems of the Royal Institute of Technology in Stockholm,Sweden, on January 30, 1998,
■ industry meetings held at UCLA in February and April 1998, which has resulted in initialcontacts with Fuji Corporation, and
■ Rockwell International in El Segundo, California, in August 1998.
4. We have written a paper entitled “Intelligent Sensors and Control for Commercial VehicleAutomation,” which was presented at the IFAC Workshop on Advances in Automotive Control,held in Mohican State Park, Ohio, February 27–March 1, 1998; the paper also appeared inthe Proceedings of the Workshop.
5. Our project has recently received attention from the media; it was featured in the coverstory (The Cutting Edge) of the Business section of the Los Angeles Times on January 12,1998; the cover page of that article is shown in Figure 18.

34
Figure 18
The front page of the Los Angeles Times article featuring our IRIS sensor.