Embed Size (px)
Citation preview
ISSN 2042-2695
CEP Discussion Paper No 1521
December 2017
It’s Time to Learn: Understanding the Differences in
Returns to Instruction Time
Andrés Barrios Fernandez
Giulia Bovini
Abstract As hours per day are inherently a limited resource, increasing daily instruction time reduces the amount of time
pupils can dedicate to other activities outside school. We study how the effect of longer school days on
achievement varies across students and schools. We exploit a large-scale reform of school schedules that
substantially increased daily instruction time in Chilean primary schools. We show that the average effect of one
additional year of exposure to the longer school day on reading and on mathematics test scores at the end of
grade 4 masks substantial heterogeneity. Students from disadvantaged backgrounds benefit more from longer
schedules, indicating that returns to time spent at school are larger the scarcer the learning opportunities
available at home. Added instruction time yields higher gains in charter than in public schools, suggesting that
more autonomy on administrative and pedagogical decisions may increase the effectiveness of other school
inputs.
Keywords: instruction time, education reform, heterogeneous effects, charter schools
JEL: I28; I24; I20
This paper was produced as part of the Centre’s Education and Skills Programme. The Centre for Economic
Performance is financed by the Economic and Social Research Council.
We thank Steve Pischke, Sandra McNally, Steve Machin, Esteban Aucejo, Guy Michaels, Alan Manning,
Henrik Kleven and Camille Landais for many useful comments. We also thank the comments received from
many participants at the conferences in which this paper has been presented, including the LEER Workshop on
Education Economics 2017, the International Workshop on Applied Economics of Education 2017, and the
Annual Conference of the European Association of Labor Economists 2017. We are grateful to the Chilean
Ministry of Education and to the Chilean Education Quality Agency for giving us access to the administrative
data we use in this project. We also thank the Centro de Microdatos of the Universidad de Chile, and the
DESUC of the Universidad Católica de Chile for giving us access to different survey data. Finally, we are
grateful for the useful comments made by the researchers of the Centro de Estudios Publicos and of the
Research Center of the Chilean Ministry of Education. The views expressed herein are those of the authors and
do not necessarily reflect the views of the Centre for Economic Performance or the London School of
Economics.
Andrés Barrios Fernandez., London School of Economics and Centre for Economic Performance,
London School of Economics. Giulia Bovini, London School of Economics and Centre for Economic
Performance, London School of Economics.
Published by
Centre for Economic Performance
London School of Economics and Political Science
Houghton Street
London WC2A 2AE
All rights reserved. No part of this publication may be reproduced, stored in a retrieval system or transmitted in
any form or by any means without the prior permission in writing of the publisher nor be issued to the public or
circulated in any form other than that in which it is published.
Requests for permission to reproduce any article or part of the Working Paper should be sent to the editor at the
above address.
A. Barrios Fernandez and G. Bovini, submitted 2017.
1 Introduction
Instruction time is among the school inputs that are more recurrently discussed in public
debate, as many countries are considering or have devoted conspicuous funds to increase the
amount of time that pupils spend at school. For instance, in response to a disappointing per-
formance in PISA tests, since 2003 Germany has begun phasing in all-day schooling and the
percentage of pupils attending all-day primary schools has risen from 7.9% in 2005 to 24.2%
in 2013 (OECD, 2016a). Several Latin-American countries have recently transitioned from
two-shift schemes, where some grades are taught in the morning and some in the afternoon,
to one-shift schemes that feature a longer school day (see Section 2).1 Assessing the effect of
added instruction hours on achievement in such heterogeneous settings is a complex exercise.
First, as hours per day are inherently a limited resource, increasing instruction hours reduces
the amount of time students can devote to other activities. Therefore, the returns hinge upon
both the absolute quality of time use at school and its relative quality with respect to time
use outside school, which varies across students and schools. On the one hand, indeed, for a
given student the benefits of increasing instruction time can vary across schools, depending
on how effectively they make use of the additional time. On the other hand, the benefits can
vary across pupils attending the same school, depending on the learning opportunities and the
broader environment that they have access to outside school, which may be very heteroge-
neous across households from different socio-economic backgrounds. Furthermore, the effects
on the distribution of achievement can also be different based on whether the additional time
is devoted to explaining the same teaching material at a slower pace or to expanding it by
introducing new topics.
Second, an additional aspect to take into consideration when increasing instruction time is
that, depending on the size of the change, it may require a substantial re-organization of school
schedules and the overall daily routine: schools and pupils may have to adjust to very different
start and end times of the school day and re-arrange their activities accordingly. This may
entail initial adaptation costs.
The aim of the paper is to study how schools’ and students’ circumstances shape the academic
returns to instruction time in a unified setting. It also provides some suggestive evidence about
re-organization issues associated with large scale increases of instruction hours. It therefore1As other examples, President Obama in 2009 and Chancellor Osborne in 2016 advocated for longer school
days in the US and UK respectively. In the US, the National Center on Time Learning (NCTL) has continuedadvocating in favor of longer school days.
2
speaks to the renewed interest in understanding whether instruction time has heterogeneous
effects and what the drivers of such heterogeneity are (Hanushek, 2015). Despite the relevance
of these questions, the empirical evidence remains relatively limited, as most previous work has
focused on the estimation of average effects.
In order to achieve this we take advantage of unique features of the Chilean educational sys-
tem, and we exploit a large-scale country-level reform of daily schedules in primary schools.
In 1997 the Chilean government implemented the Full School Day (FSD henceforth) reform,
which increased daily instruction time in all publicly subsidized schools (i.e. public and charter
schools) whilst leaving the term length and the national curriculum unchanged. The increment
was sizable, ranging from 45 to 120 minutes per day depending on the grade and translating
into a 26.7% increase of total yearly instruction time in grades 1 to 4. Schools could decide
when to adopt the longer school day and how to allocate the additional time across subjects.
We provide some evidence that a sizable fraction was devoted to core subjects.
We leverage within-school, cohort-to-cohort variation in years of exposure to the FSD by the
end of grade 4, when pupils take a standardized test, and we assess the effect of additional in-
struction time on reading and mathematics scores. As the availability of longer schedules may
affect the composition of pupils’ intake, making adjacent cohorts not comparable, we restrict
our attention to cohorts of incumbent students, i.e. students who start primary education in
schools that had not adopted the FSD yet and may unexpectedly become exposed to it at
different stages of their education. We further deal with potentially endogenous mobility across
schools by either focusing on students who never transfer between grade 1 and 4 or by instru-
menting actual exposure with the exposure a student would accumulate if remaining in the
school where she initially enrolled.
Linear specifications show that an additional year of exposure to the FSD raises reading scores
by 0.017-0.020σ. The effect on mathematics score is smaller (0.003-0.006σ) and non significant.
Fully non-parametric specifications highlight that the gains from longer schedules increase more
than linearly with years of exposure, suggesting that more instruction time in earlier grades also
boosts achievement in later grades. Average effects mask substantial heterogeneity by students’
and schools’ characteristics.
Additional instruction time and longer school days benefit pupils from disadvantaged back-
grounds to a greater extent. For example, the effect of an additional year of exposure on
reading scores for students who live in poor households is between five to six times larger
3
(0.022-0.024σ) than the effect for more affluent peers (0.004σ). This is consistent with the idea
that returns to spending more time at school are larger the scarcer the learning resources and
opportunities available at home. We document that the frequency of homework assignments is
lower when classroom instruction time increases, therefore partly entailing a replacement be-
tween self-study at home with supervised study at school. This may especially benefit students
with limited support outside school.
Whilst both publicly subsidized by the student voucher system, public and charter schools dif-
fer in the degree of autonomy they enjoy: charter schools have more autonomy over staff and
budgetary decisions and they have more freedom in designing the course offer and the course
content. We compare the effect of longer schedules in public schools and in charter schools
that do not charge fees. They serve students from similar backgrounds and have similar re-
sources. We document that the benefit is much larger in charter schools and is not driven by
observable differences in pupils’ and teachers’ characteristics. We suggest that a higher degree
of autonomy may allow charter schools to better and faster adapt the curriculum to reap the
learning opportunities that longer schedules offer. This also highlights that important comple-
mentarities between school inputs may exist: large school input expansion programs may need
well-functioning school institutions to fully reap the benefits.
The large increase of instruction time requires the transition from a two-shift scheme, where
some grades are taught in the morning and some in the afternoon, to a one-shift scheme, where
all students attend school from the morning to mid-afternoon. This entails a substantial change
in the times of the school day and in the overall daily routine, which is more radical for pupils
previously attending the afternoon shift. We show that, although imprecisely estimated, the
benefit from longer schedules is greater for students previously attending the morning shift.
This finding highlights that adaptation costs may exist when sizable changes to school sched-
ules are made.
The remainder of the paper is organized as follows. Section 2 reviews the related literature;
Section 3 describes the Chilean education system and the FSD reform; Section 4 sets out the
identification strategy; Section 5 describes the data and the sample; Section 6 discusses the
main findings; Section 7 presents several robustness checks; Section 8 concludes.
4
2 Related literature
Interest in providing sound empirical estimates of the relationship between instruction time
and achievement in quasi-experimental settings has recently rekindled.2 A number of papers
study the effect of the number of school days prior to standardized tests on performance.
Marcotte (2007); Marcotte and Hemelt (2008); Hansen (2011) and Goodman (2014) rely on
changes induced by unplanned school closures due to extreme weather conditions, whereas
Agüero and Beleche (2013) and Aucejo and Romano (2016) exploit changes in term dates and/or
test dates. These studies document positive effects. While they leverage small variations in
the number of school days, we focus on substantial and permanent changes to the length and
organization of the school day. Varying the length rather than the number of school days may
have different consequences on students’ achievement. For example, while the former entails a
re-organization of daily routines, the latter does not.
Starting from Lavy (2015), recent studies use cross-country PISA data and exploit within-pupil
variation in subject-specific instruction time to shed light on the effect of instruction time and,
similarly to our study, on the drivers of its productivity. Lavy (2015) finds that a one-hour
increase of weekly subject-specific instruction time raises scores by 0.06σ and that schools’ and
students’ circumstances matter: the effect is larger for schools that enjoy more autonomy and
for pupils from disadvantaged backgrounds. Rivkin and Schiman (2015) further highlight that
productivity of instruction time depends positively on the quality of the classroom environment,
as captured by student disruption and student-teacher interactions. Cattaneo et al. (2017)
focus their attention on Switzerland and document that students in more demanding school-
tracks enjoy greater benefits. Also in this case, the source of variation leveraged in these
studies is different from ours. Different allocations of weekly instruction time across subjects
do not necessarily entail a change in the length of the school day. Students do not have to
re-arrange their daily routine or reduce the time for activities carried out outside schools, nor
do schools need to operate for more hours. Moreover, we explore several schools’ and students’
determinants of instruction time heterogeneity in a unified setting.
A number of papers leverage reform-induced variation in instruction time. Pischke (2007)
and Parinduri (2014) exploit the existence of exceptionally short or long school years due to2The early studies focus on term length and report modestly positive to insignificant effects. These studies
rely either on variation in term length between U.S states (Rizzuto and Wachtel, 1980; Card and Krueger, 1992;Betts and Johnson, 1998) and within US states over time (Grogger, 1996; Eide and Showalter, 1998) or oncross-country differences (Lee and Barro, 2001; Wößmann, 2003).
5
country-level reforms of school calendars that leave the curriculum unchanged.3 Similarly to
us, Lavy (2012) and Huebener et al. (2017) study reforms that increase daily instruction time
in Israel and Germany, respectively. They both find a positive effect on achievement. The
former documents no differential benefits for pupils from low socio-economic status, whereas
the latter documents a larger gain for high performing students. Similarly to Chile, several
Latin American countries have switched from a two-shift to a one-shift scheme, substantially
lengthening the school day. Their effects have been evaluated in a series of recent reports,
i.e. Cerdan-Infantes and Vermeersch (2007) on Uruguay, Almeida et al. (2016) on Brazil and
Hincapie (2016) on Colombia. Results in achievement and for students who benefit most are
mixed, suggesting that how the reform is implemented and how additional instruction time is
used play important roles in shaping returns.
Two papers study the effect of the FSD reform in Chile on achievement. Bellei (2009) focuses on
performance at grade 10 over the period 2000-2003, adopting a difference-in-difference approach.
Berthelon et al. (2016) explore the effect on early literacy skills at grade 2. Based on one year of
observations (2012), they instrument exposure to the FSD with the local availability of schools
offering longer schedules. Both papers find positive and significant effects on performance in
reading and mathematics. However, they do not exploit all the unique features offered by the
Chilean educational system to thoroughly study which schools’ and students’ circumstances
shape heterogeneous returns to instruction time, and why they do so, which is the aim of our
paper. Furthermore, we focus on a different grade (grade 4), we also study cumulative effects
and we propose a different identification strategy that attenuates concerns related to endogenous
student sorting. We collect and combine previously unexploited data from multiple sources,
which allows us to rule out the confounding effects of concurring infrastructure investment or
changes in schools’ leadership. We can also provide some evidence on how the longer school
day affects the use of time at school and outside it, as well as studying heterogeneous effects
from the shift (morning or afternoon) previously attended.3The former studies the short 1966-67 German school year and documents an increase in repetition rates
in primary school as well as a reduction in enrolment to higher secondary school tracks, without long-lastingeffects on earnings and employment. The latter studies the long 1978-1979 Indonesian school year and reportsa reduction in repetition rates and improved educational attainment, with positive effects also on wages andthe probability of working in the formal sector.
6
3 Institutional setting
3.1 The Chilean school system
The Chilean school system features two education cycles: primary education (grades 1-8)
and secondary education (grades 9-12). Standardized tests called SIMCE assess pupils’ knowl-
edge and skills in various core subjects at the end of grades 2, 4, 8 and 10. The testing frequency
varies across grades. It is highest at grade 4, with tests taking place every year since 2005.4 We
use pupil-level scores in the reading and mathematics sections of the SIMCE test administered
at the end of grade 4 as our measures of achievement.
Education is provided by three types of schools: public schools, charter schools and private
schools. Public schools are free and are funded through student vouchers.5 Charter schools
are private, but they are publicly subsidized through the voucher system as well. Since 1994
charter schools can also charge tuition fees, but the size of the voucher decreases as tuition
fees increase. Private schools are funded only through tuition fees and are usually substantially
more expensive than charter schools.
The FSD reform applies to public and charter schools, which serve around 90% of the students
attending regular programs in the school system.6 Despite both being publicly subsidized, they
are different in how they are managed and regulated. Public schools are either managed by
the Municipal Department of Education (DAEM) or by private non-profit corporations.7 The
working conditions are regulated by a labor code specific for education professions.8 Charter
schools are private organizations and, accordingly, the working conditions of teachers are reg-
ulated by the private sector labor code.9 Different regulations translate into charter schools
having greater autonomy and flexibility in the management of the teaching staff, in terms of re-
cruiting, dismissal and compensation policies. Importantly, they also enjoy more responsibility
and freedom over the design of the curriculum. In Appendix A.1 we discuss in more detail the
main regulatory differences between public and charter schools. We provide further evidence
when exploring the differential effect of the FSD by type of school in Section 6.4Fourth graders were also tested in 1999 and 2002.5The voucher system was introduced in 1981, when a major reform of the educational system took place.
Following this reform, the administration of public schools was also decentralized from the Ministry of Educationto Municipalities.
6This excludes education for adults, education for students with specific disabilities and other types of specialprograms.
7While the director of the DAEM is usually a teacher appointed by the Municipality, corporations are ledby a board of directors who do not need to be teachers and whose president is the major of the Municipality.
8This is called “Estatuto de los Profesionales de la Educación”.9This is called “Código del trabajo”.
7
3.2 The FSD reform
In 1997 the Chilean government decided to increase daily instruction time in all publicly
subsidized schools (i.e. public schools and charter schools) and across primary and secondary
education, whilst leaving the term length and the national curriculum unchanged.10 The aim
of the policy was to improve the quality of education and reduce inequality in learning out-
comes. The increment in instruction time was sizable. It ranged from 45 to 120 minutes per
day depending on the grade. In grades 1 to 4, it translated into a 26.7% increase of total yearly
instruction time. As a result, Chilean primary schools feature the longest school day among
OECD countries, when considering total compulsory instruction time (OECD, 2016b).
Schools could choose when to implement the FSD.11 The deadline was initially set to 2002.
However, it was later extended and differentiated by type of school and students: 2007 for all
public schools and for charter schools catering for disadvantaged pupils, 2010 for the rest of the
charter schools. Yet, by 2013 there were still schools operating under the old scheme. Figure 1
illustrates the pattern of adoption of the FSD between 1997 and 2013 for primary schools. For
every year, it shows the number of schools operating under the FSD, as well as the share of
public and charter schools. They display similar patterns of adoption, although a larger share
of public schools had implemented the FSD by 2013.12
By the time the reform was announced many schools were operating a two-shift scheme: some
grades were taught in the morning and some in the afternoon. The increased instruction time
and the longer school day required a change to a one-shift scheme, where all pupils attend
school from the morning to mid-afternoon. Table 1 illustrates the daily school schedules with
and without the FSD, inclusive of time devoted to breaks. Without the FSD pupils spend at
least 4.88 hours per day at school. The typical morning shift runs from 8.00 to 12.55, while the
typical afternoon shift runs from 14.00 to 18.55. Under the FSD students spend at least 7.08
hours per day at school. If the school adopts the FSD from Monday to Friday, the typical school
day starts at 08.00 and ends at 15.05. If the school adopts the FSD on 4 days and the shorter
school day on the remaining one, the typical longer school day starts at 8.00 and ends at 15.45.13
10Increasing daily instruction time is not mandatory in grades 1 and 2.11Schools could also adopt the FSD for different grades at different times, but they were mandated to ensure
that pupils who started attending the longer school day in a given grade would then also be exposed in allfollowing grades.
12By 2013 around 20% of primary schools were still operating without the FSD.13The minimum hours of daily instruction are prescribed by the law. Schools can freely choose the time at
which the school day starts. The daily schedules in Table 1 are built assuming that the longer school day andthe morning shift start at 8.00, while the afternoon shift starts at 14.00. These are the most common choices.
8
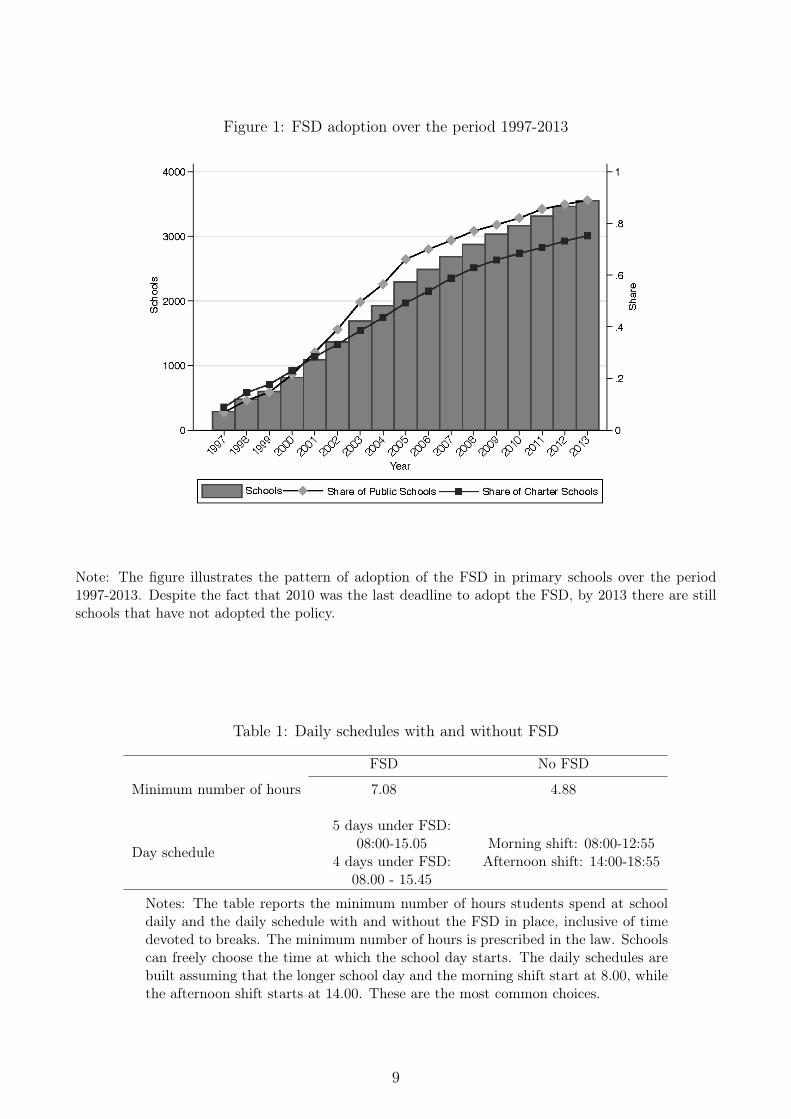
Figure 1: FSD adoption over the period 1997-2013
Note: The figure illustrates the pattern of adoption of the FSD in primary schools over the period1997-2013. Despite the fact that 2010 was the last deadline to adopt the FSD, by 2013 there are stillschools that have not adopted the policy.
Table 1: Daily schedules with and without FSD
FSD No FSD
Minimum number of hours 7.08 4.88
Day schedule
5 days under FSD:08:00-15.05
4 days under FSD:08.00 - 15.45
Morning shift: 08:00-12:55Afternoon shift: 14:00-18:55
Notes: The table reports the minimum number of hours students spend at schooldaily and the daily schedule with and without the FSD in place, inclusive of timedevoted to breaks. The minimum number of hours is prescribed in the law. Schoolscan freely choose the time at which the school day starts. The daily schedules arebuilt assuming that the longer school day and the morning shift start at 8.00, whilethe afternoon shift starts at 14.00. These are the most common choices.
9
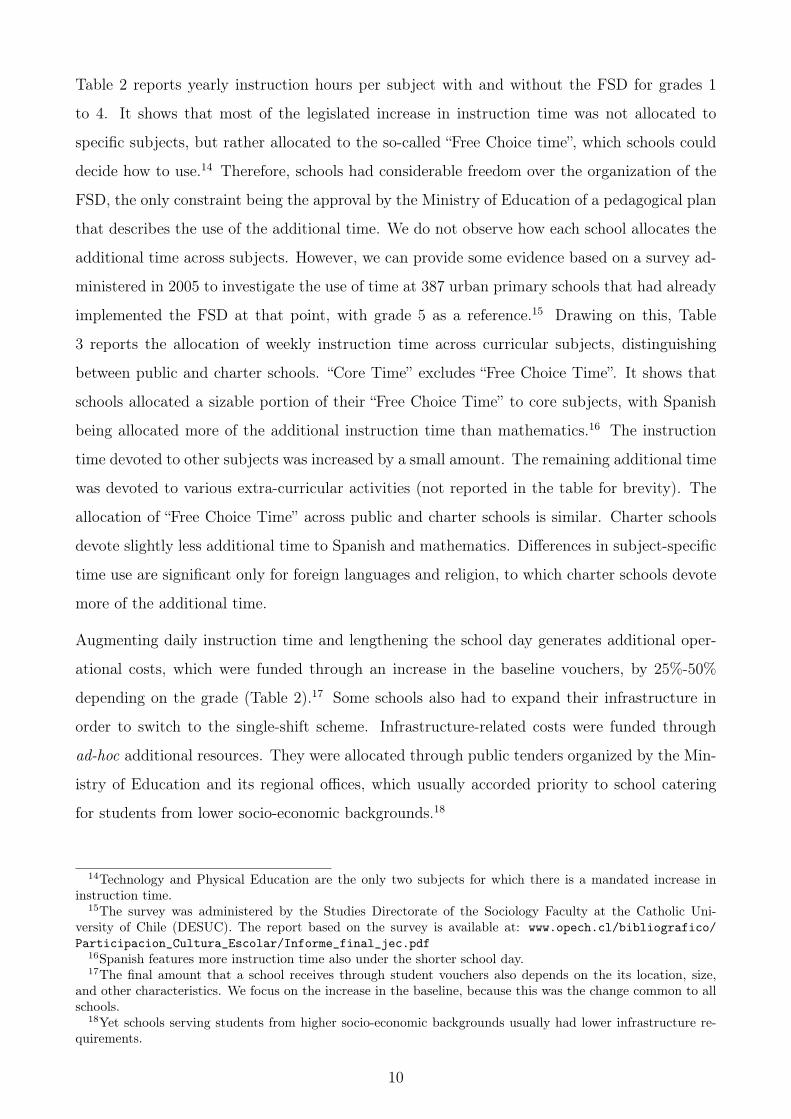
Table 2 reports yearly instruction hours per subject with and without the FSD for grades 1
to 4. It shows that most of the legislated increase in instruction time was not allocated to
specific subjects, but rather allocated to the so-called “Free Choice time”, which schools could
decide how to use.14 Therefore, schools had considerable freedom over the organization of the
FSD, the only constraint being the approval by the Ministry of Education of a pedagogical plan
that describes the use of the additional time. We do not observe how each school allocates the
additional time across subjects. However, we can provide some evidence based on a survey ad-
ministered in 2005 to investigate the use of time at 387 urban primary schools that had already
implemented the FSD at that point, with grade 5 as a reference.15 Drawing on this, Table
3 reports the allocation of weekly instruction time across curricular subjects, distinguishing
between public and charter schools. “Core Time” excludes “Free Choice Time”. It shows that
schools allocated a sizable portion of their “Free Choice Time” to core subjects, with Spanish
being allocated more of the additional instruction time than mathematics.16 The instruction
time devoted to other subjects was increased by a small amount. The remaining additional time
was devoted to various extra-curricular activities (not reported in the table for brevity). The
allocation of “Free Choice Time” across public and charter schools is similar. Charter schools
devote slightly less additional time to Spanish and mathematics. Differences in subject-specific
time use are significant only for foreign languages and religion, to which charter schools devote
more of the additional time.
Augmenting daily instruction time and lengthening the school day generates additional oper-
ational costs, which were funded through an increase in the baseline vouchers, by 25%-50%
depending on the grade (Table 2).17 Some schools also had to expand their infrastructure in
order to switch to the single-shift scheme. Infrastructure-related costs were funded through
ad-hoc additional resources. They were allocated through public tenders organized by the Min-
istry of Education and its regional offices, which usually accorded priority to school catering
for students from lower socio-economic backgrounds.18
14Technology and Physical Education are the only two subjects for which there is a mandated increase ininstruction time.
15The survey was administered by the Studies Directorate of the Sociology Faculty at the Catholic Uni-versity of Chile (DESUC). The report based on the survey is available at: www.opech.cl/bibliografico/Participacion_Cultura_Escolar/Informe_final_jec.pdf
16Spanish features more instruction time also under the shorter school day.17The final amount that a school receives through student vouchers also depends on the its location, size,
and other characteristics. We focus on the increase in the baseline, because this was the change common to allschools.
18Yet schools serving students from higher socio-economic backgrounds usually had lower infrastructure re-quirements.
10
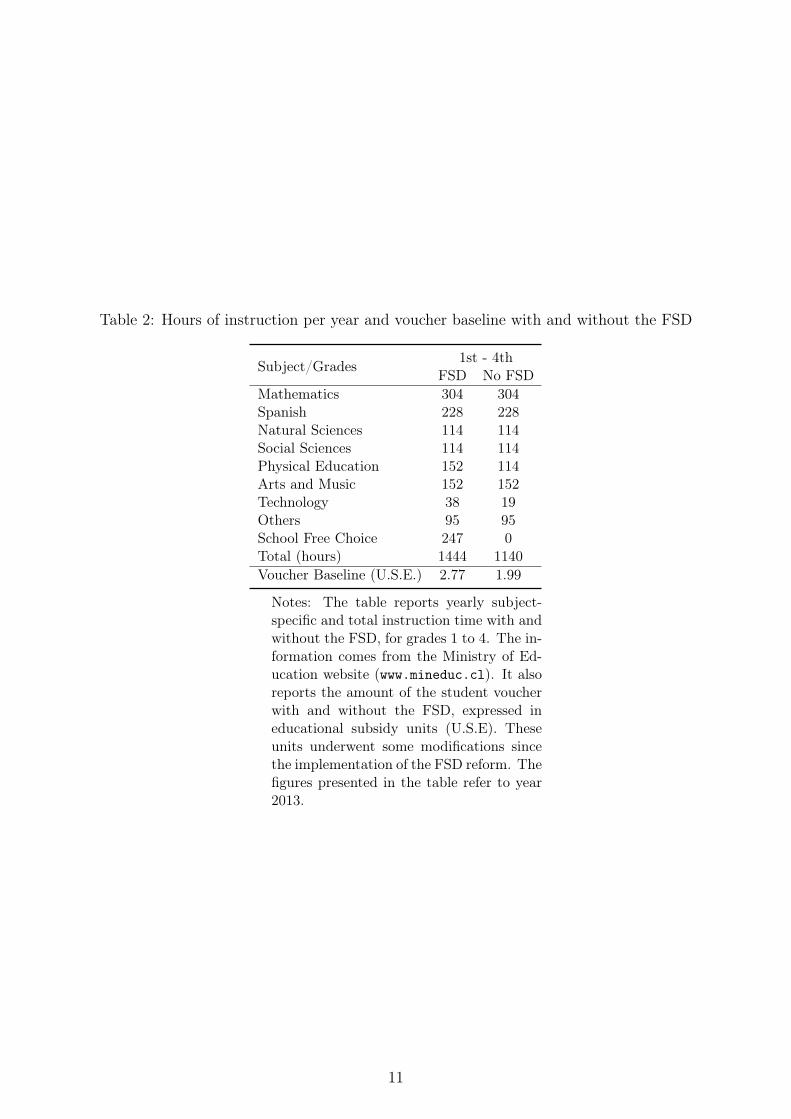
Table 2: Hours of instruction per year and voucher baseline with and without the FSD
Subject/Grades 1st - 4thFSD No FSD
Mathematics 304 304Spanish 228 228Natural Sciences 114 114Social Sciences 114 114Physical Education 152 114Arts and Music 152 152Technology 38 19Others 95 95School Free Choice 247 0Total (hours) 1444 1140Voucher Baseline (U.S.E.) 2.77 1.99
Notes: The table reports yearly subject-specific and total instruction time with andwithout the FSD, for grades 1 to 4. The in-formation comes from the Ministry of Ed-ucation website (www.mineduc.cl). It alsoreports the amount of the student voucherwith and without the FSD, expressed ineducational subsidy units (U.S.E). Theseunits underwent some modifications sincethe implementation of the FSD reform. Thefigures presented in the table refer to year2013.
11
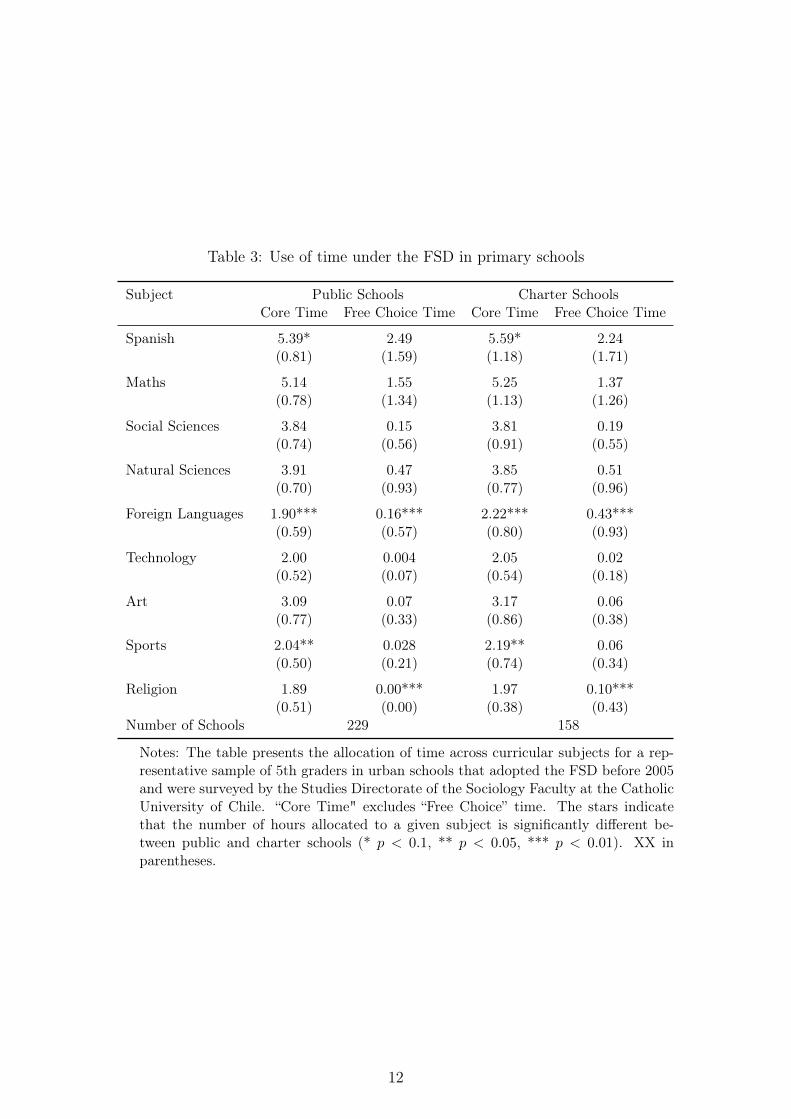
Table 3: Use of time under the FSD in primary schools
Subject Public Schools Charter SchoolsCore Time Free Choice Time Core Time Free Choice Time
Spanish 5.39* 2.49 5.59* 2.24(0.81) (1.59) (1.18) (1.71)
Maths 5.14 1.55 5.25 1.37(0.78) (1.34) (1.13) (1.26)
Social Sciences 3.84 0.15 3.81 0.19(0.74) (0.56) (0.91) (0.55)
Natural Sciences 3.91 0.47 3.85 0.51(0.70) (0.93) (0.77) (0.96)
Foreign Languages 1.90*** 0.16*** 2.22*** 0.43***(0.59) (0.57) (0.80) (0.93)
Technology 2.00 0.004 2.05 0.02(0.52) (0.07) (0.54) (0.18)
Art 3.09 0.07 3.17 0.06(0.77) (0.33) (0.86) (0.38)
Sports 2.04** 0.028 2.19** 0.06(0.50) (0.21) (0.74) (0.34)
Religion 1.89 0.00*** 1.97 0.10***(0.51) (0.00) (0.38) (0.43)
Number of Schools 229 158
Notes: The table presents the allocation of time across curricular subjects for a rep-resentative sample of 5th graders in urban schools that adopted the FSD before 2005and were surveyed by the Studies Directorate of the Sociology Faculty at the CatholicUniversity of Chile. “Core Time" excludes “Free Choice” time. The stars indicatethat the number of hours allocated to a given subject is significantly different be-tween public and charter schools (* p < 0.1, ** p < 0.05, *** p < 0.01). XX inparentheses.
12
4 Empirical strategy
In order to study whether increased instruction time and a longer school day affect achieve-
ment, we exploit the fact that we observe multiple cohorts of fourth graders taking a standard-
ized test at the end of the school year. Specifically, we leverage within-school, cohort-to-cohort
variation in years of exposure to the FSD by the end of grade 4. Depending on the year in which
a school adopts the FSD, adjacent cohorts of pupils vary in the number of years of exposure
before they are tested.
The identifying variation provides unbiased estimates of the causal effect of the FSD on learning
outcomes as long as there is no cohort-to-cohort changes in unobservable characteristics that
correlate both with achievement and years of exposure to increased instruction time. Given the
staggered adoption of the FSD across schools, the main concern is that parents would factor
the availability of the longer school day into their preferences about the school in which to
enrol their children. This could affect the composition of pupil intake, possibly along dimen-
sions that our rich set of controls (which, notably, include parental education and household
income) cannot account for. According to parent surveys administered alongside the test, the
FSD features among the main three drivers of school preferences for only 10% of households.19
Proximity to home (50%), teacher quality (40%) and the level of tuition fees (35%) are the
most relevant criteria.20
Nonetheless, we address this concern by restricting our analysis to incumbent pupils. This
means that we only consider pupils who enroll in first grade in a given school prior to the
adoption of the FSD. As an example, if a school adopts the longer school day in 2007, we
discard students who start primary education in that school in 2007 or later. Cohorts who
enrolled before 2007, on the other hand, made their decision before the implementation of the
longer school day and possibly became exposed to it at some point in their school career. The
variation in the treatment that comes only from legacy enrollment cohorts has been exploited
in recent work by Abdulkadiroğlu et al. (2016) and Eyles et al. (2017), who analyze the effect of
charter takeovers in the US and academy conversions in England, respectively. This restriction
attenuates identification issues related to unobserved changes in pupil intake; the less parents
can anticipate the exact year in which a school will increase instruction time and lengthen the19The question about drivers of parental preferences is present in the parent survey administered in 2002. For
reasons that we describe in Section 5, we do not use this wave of the test when evaluating the impact of theFSD on student performance.
20The presence of a relative attending the same school, the school’s academic performance and ethical valuesfollow in the ranking, each of them being cited by around 30% of parents.
13
school day, the more convincing the strategy will be.
Cohort-to-cohort compositional changes that correlate with exposure to increased instruction
time may still exist because of pupil mobility across schools. The provision of longer schedules
may influence the decision to transfer a student from one school to another. Transfers in the
Chilean school system are not negligible: in our master sample (described in Section 5) 23%
of students change schools between grades 1 and 4. The existence of transferring students also
potentially generates variation in the treatment not only across cohorts in a given school, but
also within them. As we can follow pupils along their school career up to grade 4, we can
compute actual years of exposure at the time of the test for students who move across schools.
Moreover, in our preferred regression specifications we either: i) restrict the sample to pupils
who never transfer between grade 1 and 4; or ii) instrument actual exposure to the FSD with
the exposure a student would accumulate had she never transferred from the school where she
attended first grade.
The baseline regression specification reads:
Yist = α + βFSDist + γXist + δZst + ηs + θt + εist (1)
Yist is the test score of student i attending school s when she takes the standardized test at the
end of school year t. FSDist measures actual years of exposure to the FSD by year t. Xist is
a vector of student characteristics as of year t, which include: gender, age, parental education,
monthly household income, the number of books available at home, as well as the availability
of a PC and a connection to the Internet at home.21 Zst is a vector of time-varying school
characteristics as of year t, which consists of: the share of female pupils, the average monthly
household income, the share of students whose most educated parent received at least some
higher education, the share of students with more than 10 books at home, as well as the share
of students who have a PC or an Internet connection at home. Since 2008, pupils from dis-
advantaged backgrounds have been granted additional subsidies (SEP) on top of the vouchers.
We therefore also include the share of students who benefit from SEP subsidies. Further school-
level controls are: average class size, the share of female teachers, average teacher experience21 Monthly household income is a categorical variable featuring 13 classes. The first class is less than 100.000
CLP and the last class is more than 1.800.000 CLP. The width of the class is 100.000 CLP up to 600.000 CLPand 200.000 CLP after that. We make such a variable continuous by attributing the midpoint of the intervalto each close category, and 4/3 of the lower bound to the last open category. Parental education is captured bya set of dummies that take value equal to 1 if the highest educational attainment of the most educated parentis: no education, some primary education, some secondary education, some vocational higher education, someacademic higher education, respectively. The number of books at home is a categorical variable and featuresthe following categories: 0-10, 11-50, 51-100, and more than 100.
14
and the share of teachers holding an education degree.22 ηs is a set of school fixed effects that
account for time-invariant heterogeneity across schools, so that we leverage only within-school,
cohort-to-cohort variation; θt is a set of year fixed effects that control for common unobservable
year-specific shocks.
In our IV specification we instrument FSDist with FSDis1t, i.e the exposure a pupil would
accumulate had she never transferred from the school where she attended first grade. When we
explore heterogeneity by school and student circumstances, we augment the regression specifica-
tion in (1) by interacting every right-hand side variable with a dummy capturing heterogeneity
along the dimension of interest (for example, a dummy Ds that takes value 1 if the school
is public, or a dummy Di that takes value 1 if the most educated parent of the pupil does
not have some higher education). This is equivalent to running the regression separately for
each group of schools or pupils, but has the advantage that it is straightforward to assess the
statistical significance of the differential effects captured by the interaction term FSDist ×Ds
or FSDist ×Di.23
A second concern is that the timing of adoption may depend on past performance. For example,
if schools switch to the longer school days after they observe a cohort of pupils faring particu-
larly poorly at the test, our estimates may also capture mean-reversion effects. In general, one
could worry about the confounding effect of rising or falling underlying school-specific trends in
test scores. We show in Section 5 that there are no visible trends in reading and mathematics
scores in the years preceding the switch. Another concern is that other events may take place
at the school around the time of FSD adoption, which may affect learning outcomes in the
following years as well. We discuss and address these further issues in Section 7, where we
show that we obtain very similar findings when restricting our attention to schools that do
not receive public funds for expanding infrastructure when lengthening the school day and to
schools that do not change the school principal around the time of FSD adoption.
5 Data and Sample
We link several administrative and survey datasets on account of unique school, student
and teacher identifiers.
Data on achievement at grade 4 come from a nationwide standardized test (SIMCE test) de-22We also estimate an alternative specification where we replace school-level time-varying controls with school-
specific linear time trends. Estimates are very similar and are available upon request.23In our IV specification, we instrument the interaction term FSDist ×Dj with FSDis1t ×Dj .
15

signed by the Education Quality Agency at the end of the school year. The test was adminis-
tered for the first time in 1999 and in 2002, and then with a yearly frequency from 2005 onward.
We restrict our attention to the 2005-2013 waves of the test. The reason is that the cohort who
reached 4th grade in 2005 is the first for which we can track their entire school career, which is
necessary both to correctly identify incumbent students (i.e. students who enroll in first grade
in a school that had not adopted the FSD yet) and to compute actual exposure to the FSD
for students who move across schools between grades 1 and 4. We use pupil-level test scores in
the reading and mathematics sessions of the test as our measure of achievement. Alongside the
test, students and their guardians, as well as teachers, are surveyed about several dimensions of
their life inside and outside school. Based on questions that are consistent across all waves of
the parent survey, we recover a rich set of information about pupils’ backgrounds that we use
as controls in regression specification (1). Based on teacher surveys, we provide evidence on
the frequency of homework assignments without and with the FSD. Since 2008, students from
disadvantaged backgrounds are granted additional subsidies (SEP) on top of the vouchers. We
obtain the list of beneficiaries from the Ministry of Education. The Education Census Database
records information about teachers and school principals working in the school system over the
period 2003-2013. We draw information about teachers’ gender, education and experience, as
well as about principal turnover.
The Ministry of Education maintains the register of pupils enrolled in the school system, over
the period 2002-2013. Besides gender and date of birth, for every school year it records infor-
mation about the school that the student attends and their end-of-year status (i.e. promotion
or retention). It also provides the register of educational establishments, from which we recover
the location and the administrative status of the school (i.e. public, charter or private), as well
as the level of enrollment and tuition fees. A companion dataset records the year of adoption
of the FSD at the school-grade level over the period 1997-2013. Based on these sources, we
reconstruct the school career of every student from grade 1 to 4 and we compute the actual
years of exposure to the FSD by the end of grade 4.
The Ministry of Education also maintains a dataset that records the shift (morning or after-
noon) that students attend in schools operating double shifts, from 2004 onward. Based on this
source, we recover information about the shift attended in the year before the school adopts
the FSD.24 Finally, we compile from primary sources the list of schools that received additional24Because the dataset records information from 2004 onward, we do not observe the previous shift arrange-
ments prevailing in schools that adopt the longer school day across all grades in 2002 or 2003. We thereforeexclude these schools when we perform the heterogeneity analysis by the shift previously attended. For schools
16
funds to expand their infrastructure when lengthening the school day: we consulted the re-
leases of the Official Journal (Diario Oficial) published by the Interior Ministry over the period
1997-2004 and searched for the outcomes of all public tenders through which ad-hoc resources
for infrastructure were assigned.25 Based on this, we create a dataset that records, for every
school, the year in which resources were disbursed and the amount received, if any.
We impose a set of restrictions to create the master sample for our analysis. First, we discard
private schools, because the FSD reform only applies to public and charter schools. Private
schools cater for roughly 10% of students across the different educational stages. Second, we
drop schools located in rural areas, because they are also targeted by other specific interven-
tions that we do not fully observe and that may confound our estimates.26 Moreover, many
of these schools were already operating a full day scheme before the FSD reform.27 Schools in
rural areas account for roughly 10% of enrollment.
Our master sample consists of 430,026 fourth graders who take the standardized test between
2005 and 2013 and who started first grade in schools that had not yet adopted the FSD.28
As our treatment is the the length of exposure (in years) to the FSD by grade 4, we discard
students who repeat a grade at least once between grade 1 and 4.29 Because the first cohort of
fourth graders in the sample (i.e. the one that takes the test in 2005) started primary education
in 2002, it follows that all schools in our sample had not adopted the FSD by 2002. Given that
first switches to the single-shift occurred in 1997, our sample of schools consists of mid to late
adopters.
Figure 2 provides the first piece of evidence on the evolution of test scores around the time of
FSD adoption. It plots average raw reading and mathematics test scores - net of school and
that start adopting the policy only across a subset of grades in 2002 and 2003, we attribute to students attendingthe other unreformed grades in 2003 and 2003 the same shift that later same-grade cohorts attend in 2004.
25The last tender took place in 2004.26In 1992 the government developed a program aimed at improving the quality of education in rural areas
(i.e. “Programa de Mejoramiento de la Calidad y Equidad de la Educación Rural”). It consisted of a wideset of interventions, including: providing rural schools with sufficient resources; adjusting the curriculum toacknowledge the local culture and traditions; training teachers to improve their teaching practices. Moreover,since 1996 the learning of native languages has been included in the curricula of rural schools that caterfor indigenous populations and since 2003 teachers in rural schools located in remote areas and serving veryvulnerable pupils have received bonuses. The law that introduces the SEP subsidy for poor children prescribesadditional funding if they attend schools in remote areas.
27See De Andraca and Gaiardo (1987) and Leyton (2013).28This figure refers to the number of students for which we do not have missing covariates.29In Table A4 in Appendix A.3 we study if the adoption of the FSD is associated with a change in the
probability of repeating a grade. We do not find statistical evidence supporting this hypothesis. We alsodocument a positive association with the GPA, which is consistent with the finding that a longer exposure tothe FSD has a positive impact on standardized test scores. On the other hand, no positive association withattendance rates emerges.
17
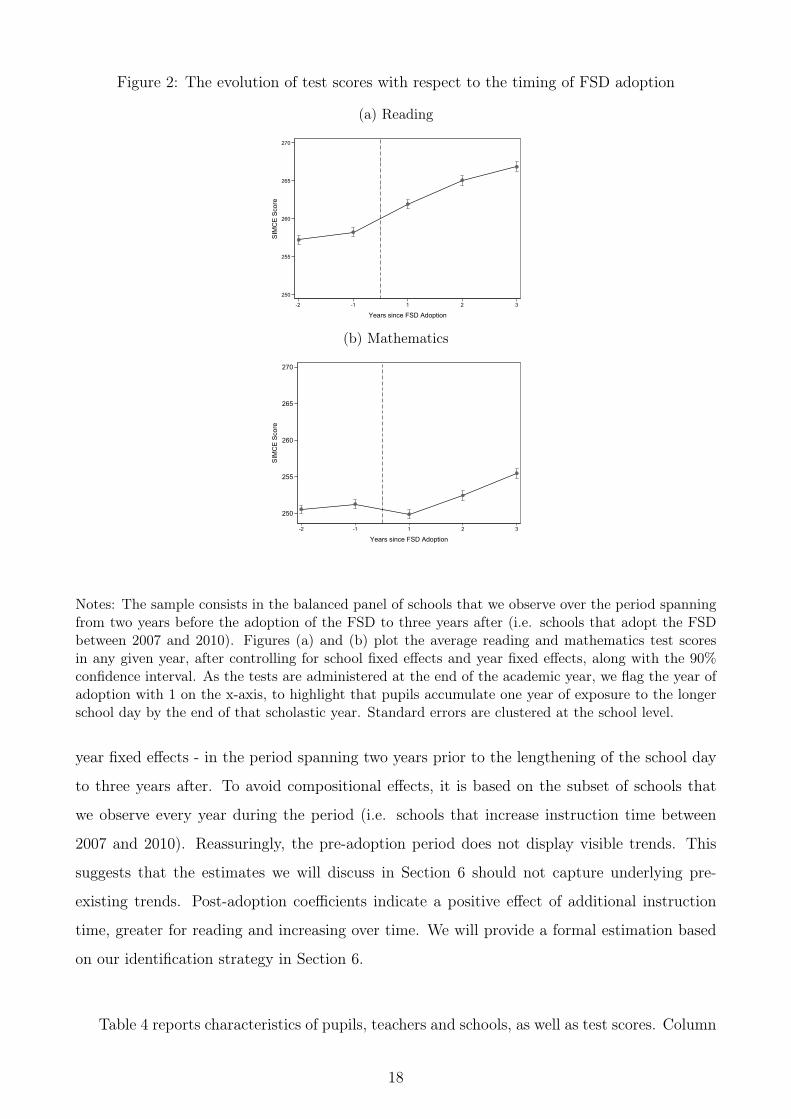
Figure 2: The evolution of test scores with respect to the timing of FSD adoption
(a) Reading
250
255
260
265
270
SIM
CE
Sco
re
-2 -1 1 2 3
Years since FSD Adoption
(b) Mathematics
250
255
260
265
270
SIM
CE
Sco
re
-2 -1 1 2 3
Years since FSD Adoption
Notes: The sample consists in the balanced panel of schools that we observe over the period spanningfrom two years before the adoption of the FSD to three years after (i.e. schools that adopt the FSDbetween 2007 and 2010). Figures (a) and (b) plot the average reading and mathematics test scoresin any given year, after controlling for school fixed effects and year fixed effects, along with the 90%confidence interval. As the tests are administered at the end of the academic year, we flag the year ofadoption with 1 on the x-axis, to highlight that pupils accumulate one year of exposure to the longerschool day by the end of that scholastic year. Standard errors are clustered at the school level.
year fixed effects - in the period spanning two years prior to the lengthening of the school day
to three years after. To avoid compositional effects, it is based on the subset of schools that
we observe every year during the period (i.e. schools that increase instruction time between
2007 and 2010). Reassuringly, the pre-adoption period does not display visible trends. This
suggests that the estimates we will discuss in Section 6 should not capture underlying pre-
existing trends. Post-adoption coefficients indicate a positive effect of additional instruction
time, greater for reading and increasing over time. We will provide a formal estimation based
on our identification strategy in Section 6.
Table 4 reports characteristics of pupils, teachers and schools, as well as test scores. Column
18

[1] pools all schools together, whereas columns [2] to [4] split the sample according to the type
of school (public or charter), further distinguishing between charter schools that charge fees
and charter schools who do not. It shows that public schools and charter schools that do not
charge fees cater for students from similar backgrounds. Charter schools that charge fees serve
significantly more affluent pupils, who live in households where the monthly income is 70%
higher. They are almost three times as likely to have at least one parent with some academic
higher education and roughly two times as likely to have more than 100 books at home. The
average class size is slightly larger in fee-charging charter schools and the proportion of students
attending the afternoon shift is higher in charter schools. Teachers are disproportionately
females and virtually all of them hold an education degree. Public school teachers have far
more experience, as they are older. Test scores are standardized by subject and year to have
mean 0 and standard deviation 1. They are lowest in public schools and highest in fee-charging
charter schools.
19
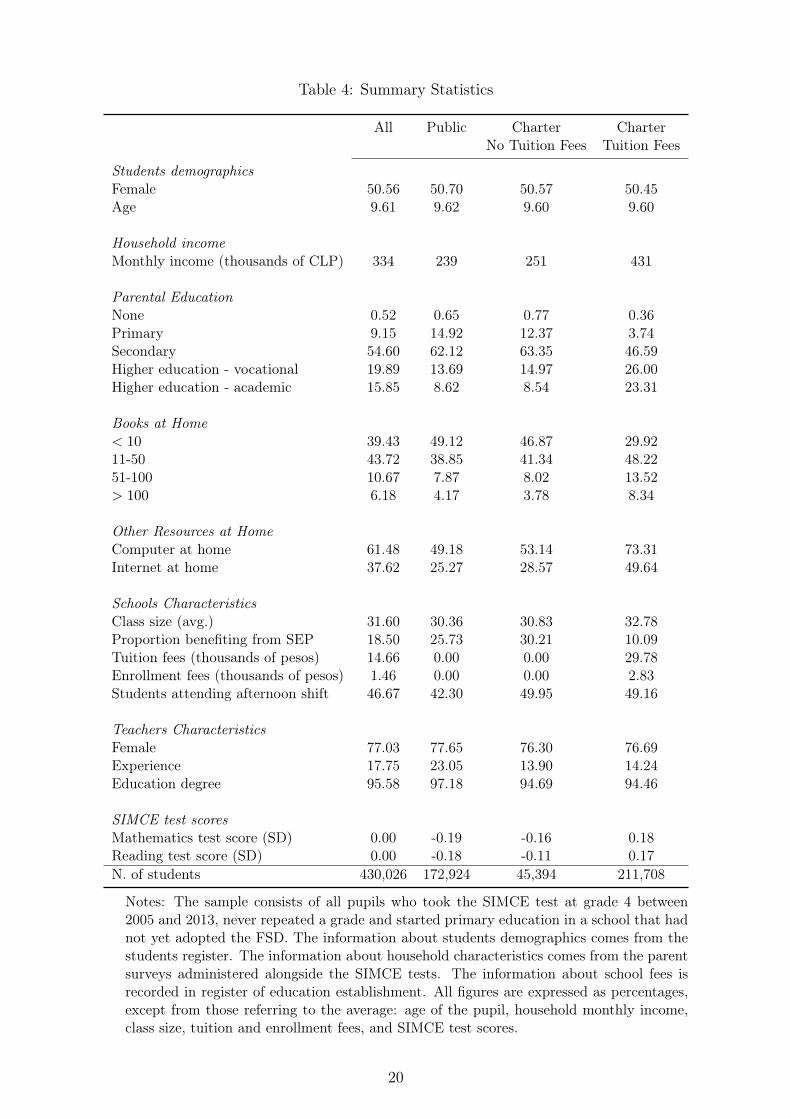
Table 4: Summary Statistics
All Public Charter CharterNo Tuition Fees Tuition Fees
Students demographicsFemale 50.56 50.70 50.57 50.45Age 9.61 9.62 9.60 9.60
Household incomeMonthly income (thousands of CLP) 334 239 251 431
Parental EducationNone 0.52 0.65 0.77 0.36Primary 9.15 14.92 12.37 3.74Secondary 54.60 62.12 63.35 46.59Higher education - vocational 19.89 13.69 14.97 26.00Higher education - academic 15.85 8.62 8.54 23.31
Books at Home< 10 39.43 49.12 46.87 29.9211-50 43.72 38.85 41.34 48.2251-100 10.67 7.87 8.02 13.52> 100 6.18 4.17 3.78 8.34
Other Resources at HomeComputer at home 61.48 49.18 53.14 73.31Internet at home 37.62 25.27 28.57 49.64
Schools CharacteristicsClass size (avg.) 31.60 30.36 30.83 32.78Proportion benefiting from SEP 18.50 25.73 30.21 10.09Tuition fees (thousands of pesos) 14.66 0.00 0.00 29.78Enrollment fees (thousands of pesos) 1.46 0.00 0.00 2.83Students attending afternoon shift 46.67 42.30 49.95 49.16
Teachers CharacteristicsFemale 77.03 77.65 76.30 76.69Experience 17.75 23.05 13.90 14.24Education degree 95.58 97.18 94.69 94.46
SIMCE test scoresMathematics test score (SD) 0.00 -0.19 -0.16 0.18Reading test score (SD) 0.00 -0.18 -0.11 0.17N. of students 430,026 172,924 45,394 211,708
Notes: The sample consists of all pupils who took the SIMCE test at grade 4 between2005 and 2013, never repeated a grade and started primary education in a school that hadnot yet adopted the FSD. The information about students demographics comes from thestudents register. The information about household characteristics comes from the parentsurveys administered alongside the SIMCE tests. The information about school fees isrecorded in register of education establishment. All figures are expressed as percentages,except from those referring to the average: age of the pupil, household monthly income,class size, tuition and enrollment fees, and SIMCE test scores.
20
6 Results
6.1 The effect of the FSD on achievement
Table 5 reports coefficients from regression specification (1). Estimates in columns [1] and
[4] are based on all students in the master sample (FE1), whereas estimates in columns [2] and
[5] come from the subset of pupils in the master sample who do not transfer between grades 1
and 4 (FE2). Estimates in columns [3] and [6] are based on all students in the master sample
and true exposure to the FSD is instrumented with the exposure a student would accumulate
had she never transferred from the school where she attended first grade (IV). In the top panel
we impose a linear specification of the treatment, whereas in the bottom panel we allow for a
fully flexible, non-parametric specification by using a complete set of dummies.30
The table shows that increased instruction time and a longer school day have a positive and
modest effect on achievement, which is stronger with regards to reading. The impact on reading
is very stable across specifications and always significant at the 1% level: an additional year
of exposure to the FSD by grade 4 raises test scores by 0.017-0.020σ. On the other hand, the
impact on mathematics varies across specifications. In particular, it drops and loses statistical
significance in our preferred specifications, when we restrict the sample to students who never
transfer or adopt an instrumental variable approach: an additional year of exposure to the FSD
improves performance by only 0.003-0.006σ and the effect is not statistically different from 0.31
Non-linearities emerge from our preferred specifications in the bottom panel of Table 5. Since we
exploit variation in exposure to the FSD among incumbent students only, maximum exposure
by grade 4 in our sample is equal to 3 years. The impact of the third year of exposure is
far greater than the impact of the first and second years of exposure: while 2 years under
the FSD raise reading test scores by 0.026-0.029σ, 3 years of exposure boost them by 0.094-
0.104σ. This pattern also holds true for mathematics. The first and (only in column [6]) second
year of exposure appear detrimental to learning, although the coefficients are small and never
significant. The third year of exposure has instead a positive effect, in the range 0.043-0.051σ30In the IV estimate of the fully flexible non - parametric specification we instrument the set of dummies{FSDk
ist}k=3k=0 with the set of dummies {FSDk
is1t}k=3k=0. FSDk
ist is a dummy that takes value 1 if the pupil hasbeen exposed to the FSD for k years by the time of the test; FSDk
is1tis a dummy that takes value 1 if the pupil
had been exposed to the FSD for k years by the time of the test, had she remained in the first-grade school.31The first stage coefficient of the IV specification is 0.804 and is highly statistically significant. As discussed
before, the magnitude of the coefficient highlights the non-negligible share of pupils who change school betweengrade 1 and 4. First stage coefficients of other specifications are not reported for brevity, but are available uponrequest.
21
and statistically significant at the 10% level in column [5].
The stronger impact of the FSD on reading may depend on the fact that a larger fraction of
additional instruction time is devoted to Spanish than to mathematics (Table 3), both in public
and charter schools. The pattern of coefficients in the non parametric specification shows that
the effect of longer schedules accumulates and compounds over time. This is consistent with
added instruction time in earlier grades having a positive effect on achievement in later grades.
The passage from a two-shift to a one-shift time scheme implied quite a radical re-organization
of the school day. The pattern of coefficients may therefore also be explained by the presence
of adaptation and learning costs that fade away over time - both for pupils and teachers - and
that could have had a more negative effect on mathematics performance.
22
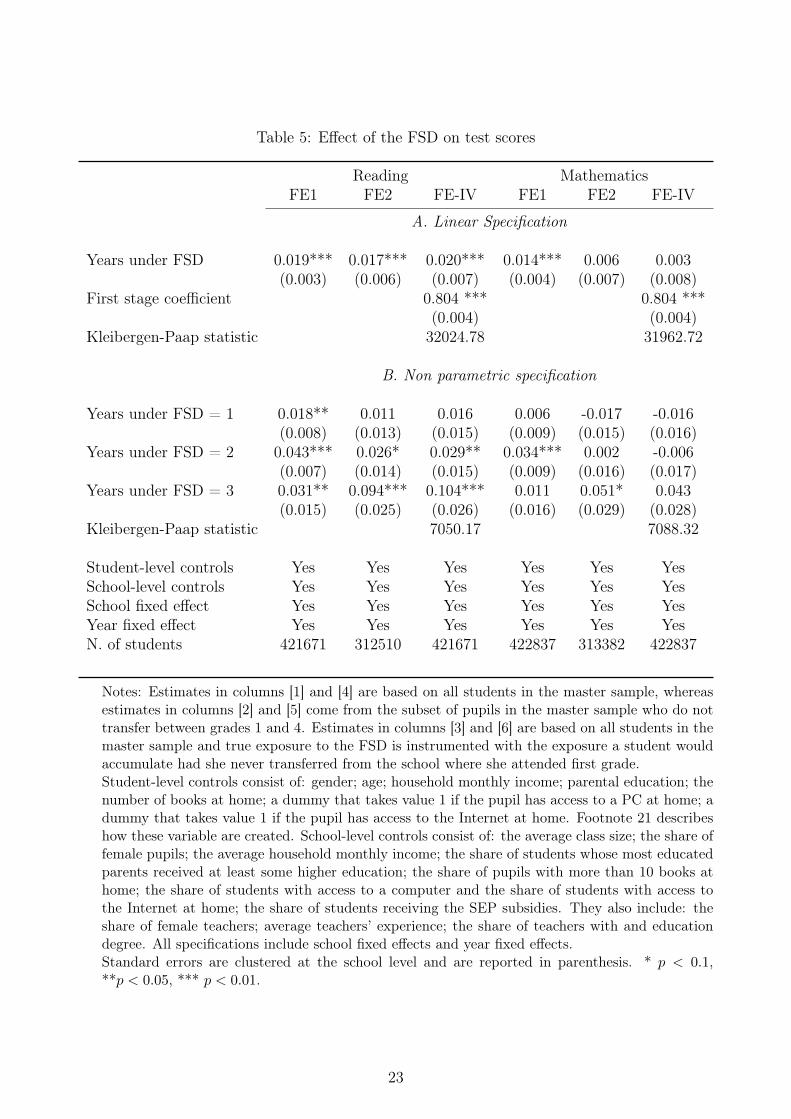
Table 5: Effect of the FSD on test scores
Reading MathematicsFE1 FE2 FE-IV FE1 FE2 FE-IV
A. Linear Specification
Years under FSD 0.019*** 0.017*** 0.020*** 0.014*** 0.006 0.003(0.003) (0.006) (0.007) (0.004) (0.007) (0.008)
First stage coefficient 0.804 *** 0.804 ***(0.004) (0.004)
Kleibergen-Paap statistic 32024.78 31962.72
B. Non parametric specification
Years under FSD = 1 0.018** 0.011 0.016 0.006 -0.017 -0.016(0.008) (0.013) (0.015) (0.009) (0.015) (0.016)
Years under FSD = 2 0.043*** 0.026* 0.029** 0.034*** 0.002 -0.006(0.007) (0.014) (0.015) (0.009) (0.016) (0.017)
Years under FSD = 3 0.031** 0.094*** 0.104*** 0.011 0.051* 0.043(0.015) (0.025) (0.026) (0.016) (0.029) (0.028)
Kleibergen-Paap statistic 7050.17 7088.32
Student-level controls Yes Yes Yes Yes Yes YesSchool-level controls Yes Yes Yes Yes Yes YesSchool fixed effect Yes Yes Yes Yes Yes YesYear fixed effect Yes Yes Yes Yes Yes YesN. of students 421671 312510 421671 422837 313382 422837
Notes: Estimates in columns [1] and [4] are based on all students in the master sample, whereasestimates in columns [2] and [5] come from the subset of pupils in the master sample who do nottransfer between grades 1 and 4. Estimates in columns [3] and [6] are based on all students in themaster sample and true exposure to the FSD is instrumented with the exposure a student wouldaccumulate had she never transferred from the school where she attended first grade.Student-level controls consist of: gender; age; household monthly income; parental education; thenumber of books at home; a dummy that takes value 1 if the pupil has access to a PC at home; adummy that takes value 1 if the pupil has access to the Internet at home. Footnote 21 describeshow these variable are created. School-level controls consist of: the average class size; the share offemale pupils; the average household monthly income; the share of students whose most educatedparents received at least some higher education; the share of pupils with more than 10 books athome; the share of students with access to a computer and the share of students with access tothe Internet at home; the share of students receiving the SEP subsidies. They also include: theshare of female teachers; average teachers’ experience; the share of teachers with and educationdegree. All specifications include school fixed effects and year fixed effects.Standard errors are clustered at the school level and are reported in parenthesis. * p < 0.1,**p < 0.05, *** p < 0.01.
23
6.2 Heterogeneous effects
As hours per day are an inherently limited resource, increasing the amount of time pupils
spend at school reduces the amount of time they can devote to other activities outside school.
The return to longer school schedules therefore depends on the absolute quality of time use at
school and its relative quality with respect to time use outside school. Since this can vary both
across students and schools, we study heterogeneous effects of the FSD by student background,
school autonomy and previous organization of the school day. For brevity, we only report
estimates coming from our two preferred specifications, FE2 and FE-IV.
6.2.1 Heterogeneity by student background
We explore whether returns to longer school schedules vary depending on the characteristics
of the environment students are exposed to when not in school. We focus our analysis on the
role of household resources, as reflected by household income and parental education. Panel A
of Table 6 shows that the FSD has a far greater effect on students who live in poorer households
(i.e. households with a monthly income below 400,000 CLP). This holds true both for reading
and mathematics, although the coefficient of the interaction is significant at the 10% level
only for the former. An additional year under the FSD boosts reading scores of less affluent
pupils by 0.022-0.024σ, which is between five and six times bigger than the improvement that
more affluent peers obtain (0.004σ and not significant). Although imprecisely estimated, it also
seems that the small overall impact on mathematics scores masks a slightly negative effect for
wealthier students and a positive effect for others. Panel B of Table 6 shows a very similar
picture when studying differential effects by parental education: additional instruction time
benefits more pupils whose most educated parent does not have some higher education. The
differential effect is always positive and is significant at the 10% level in columns [1] and [4].
Our findings support the idea that the return to an extra-hour of instruction time and, more
broadly, to longer school days does not depend only on the absolute quality of time use during
that extra-hour. It also depends on its relative quality, i.e. on how students would make use
of that time and on the inputs they would be exposed to were they not at school. The sign
of the interaction terms in Table 6 suggests that pupils from disadvantaged backgrounds have
fewer and/or worse learning opportunities and resources available at home and in the broader
environment that surrounds them, thus benefiting to a larger extent from spending more time
learning at school.
Children in primary school may seek the help of their parents when doing homework. Table
24

7 draws information from teacher surveys administered alongside the test. It shows that the
longer school day is associated with a reduction in the frequency of homework assignments,
both in public schools and charter schools. For example, the percentage of teachers assigning
homework after every mathematics class is roughly 19% in schools where the FSD is not in
place, while it drops to 13.51% in public schools and to 9.57% in charter schools that feature
longer schedules. If the productivity of homework is greater for pupils who live in more affluent
households, because they receive more support from their families, the partial replacement
of self-study with teacher-led and supervised instruction may be one of the mechanisms that
explains why the returns to the FSD are larger for pupils with fewer resources at home.
At an older age students from disadvantaged backgrounds may also be more at risk of engaging
in behavior, when out of school, that is detrimental both to learning and to their overall current
and future well-being. Berthelon and Kruger (2011) document that the FSD reduces the rate of
teenage motherhood as well as youth crime, with the effect concentrated among poorer families.
This suggests that additional instruction time and a longer school day may continue to benefit
the learning of underprivileged pupils more as they grow older.
Overall, these findings highlight that the amount of time spent at school may play an important
role in providing a level playing field and in reducing inequality in learning opportunities and
outcomes. As pupils from different backgrounds are exposed to the same school inputs for a
larger fraction of the day, the role of household inputs - whose quality varies greatly - may
become less important. This is likely to be especially true if longer schedules allow the partial
replacement of self-study at home with supervised study at school.
Our findings are in line with Lavy (2015). When studying the distributional effect of a reform
that increased weekly instruction hours by two hours in Germany, Huebener et al. (2017)
document that it widens the gap between high- and low-performing pupils. In the German
setting, the increase in instruction time was accompanied by an expansion of the national
curriculum, while this is not the case in the setting we study. This suggests that the use of
additional instruction time - whether it is used to cover new learning material or to explain the
same material at a slower pace - plays an important role in explaining these different findings.
25
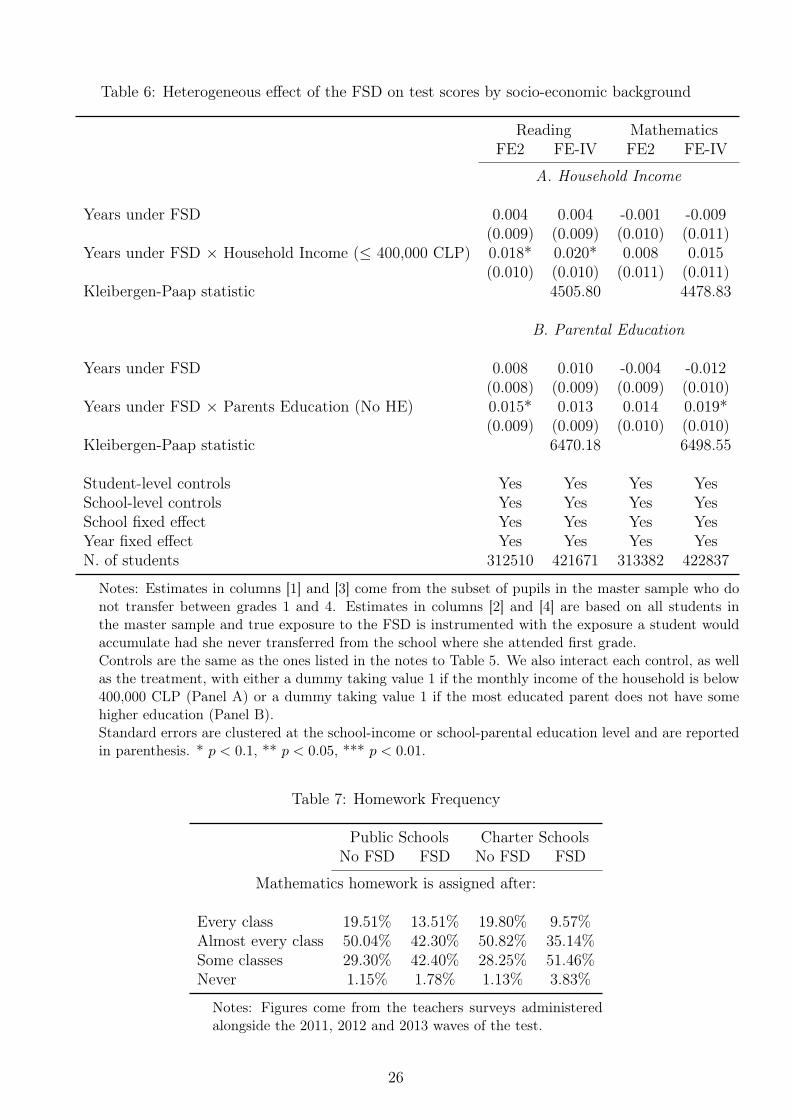
Table 6: Heterogeneous effect of the FSD on test scores by socio-economic background
Reading MathematicsFE2 FE-IV FE2 FE-IV
A. Household Income
Years under FSD 0.004 0.004 -0.001 -0.009(0.009) (0.009) (0.010) (0.011)
Years under FSD × Household Income (≤ 400,000 CLP) 0.018* 0.020* 0.008 0.015(0.010) (0.010) (0.011) (0.011)
Kleibergen-Paap statistic 4505.80 4478.83
B. Parental Education
Years under FSD 0.008 0.010 -0.004 -0.012(0.008) (0.009) (0.009) (0.010)
Years under FSD × Parents Education (No HE) 0.015* 0.013 0.014 0.019*(0.009) (0.009) (0.010) (0.010)
Kleibergen-Paap statistic 6470.18 6498.55
Student-level controls Yes Yes Yes YesSchool-level controls Yes Yes Yes YesSchool fixed effect Yes Yes Yes YesYear fixed effect Yes Yes Yes YesN. of students 312510 421671 313382 422837
Notes: Estimates in columns [1] and [3] come from the subset of pupils in the master sample who donot transfer between grades 1 and 4. Estimates in columns [2] and [4] are based on all students inthe master sample and true exposure to the FSD is instrumented with the exposure a student wouldaccumulate had she never transferred from the school where she attended first grade.Controls are the same as the ones listed in the notes to Table 5. We also interact each control, as wellas the treatment, with either a dummy taking value 1 if the monthly income of the household is below400,000 CLP (Panel A) or a dummy taking value 1 if the most educated parent does not have somehigher education (Panel B).Standard errors are clustered at the school-income or school-parental education level and are reportedin parenthesis. * p < 0.1, ** p < 0.05, *** p < 0.01.
Table 7: Homework Frequency
Public Schools Charter SchoolsNo FSD FSD No FSD FSD
Mathematics homework is assigned after:
Every class 19.51% 13.51% 19.80% 9.57%Almost every class 50.04% 42.30% 50.82% 35.14%Some classes 29.30% 42.40% 28.25% 51.46%Never 1.15% 1.78% 1.13% 3.83%
Notes: Figures come from the teachers surveys administeredalongside the 2011, 2012 and 2013 waves of the test.
26
6.2.2 Heterogeneity by school autonomy
The absolute quality of time use is likely to be the primary driver of additional instruc-
tion time’s effectiveness. It is therefore important to also study the contribution of school
circumstances in shaping returns to longer schedules. The Chilean school system provides an
attractive setting to study the role of school autonomy: as explained in Section 3, whilst being
both publicly subsidized, charter schools enjoy more autonomy than public schools over the
management of school resources and the design of the curricula. We study whether the FSD
has a differential effect in public and charter schools. We exclude charter schools that charge
tuition fees from the analysis. Table 4 shows that fee-charging charter schools cater for more
affluent pupils, whereas public schools and charter schools that do not charge tuition fees serve
pupils from similarly more disadvantaged backgrounds. As we aim to uncover the role of school
autonomy, we do not want to capture differences related to students’ characteristics and the
amount of funds available.
Table 8 shows that returns to additional instruction time are bigger in charter schools. The
differential effect is large in size compared to the main effect for both subjects, but is significant
at the 1% level only for reading test scores: depending on the specification, an additional year
of exposure to the FSD raises reading scores by 0.055-0.066σ in charter schools and by 0.018σ
only in public schools. Although imprecisely estimated, the effect on mathematics test scores
is roughly one and a half times larger in charter schools as well.
Despite the fact that public schools and charter schools that do not charge fees serve students
from similar backgrounds, we further check that the differential effect shown in Table 8 does not
stem from differences in pupils’ observable characteristics. Table 9 reports estimates from spec-
ifications that feature, beyond the interaction between years of exposure to the FSD and school
type, the interactions between years of exposure to the FSD and: i) a dummy that takes value
1 if the pupil lives in a household with a monthly income below 400,000 CLP; ii) a dummy that
takes value 1 if the most educated parent does not have any higher education. The inclusion of
these interactions does not reduce the differential effect by school type, which remains identical
in size and significance. Table A2 in the Appendix shows that the heterogeneous effect also
does not reflect differences in teacher characteristics (teachers are substantially younger and less
experienced in charter schools) or differences in the previous organization of the FSD (charter
schools cater for slightly more pupils in the afternoon shift under the double-shift scheme).32
32We add to the set of controls underlying estimates reported in Table A2 the interaction between years ofexposure to the FSD and: average teacher experience; the share of teachers who hold an education degree; theshare of pupils attending the afternoon shift the year before the adoption of the FSD.
27
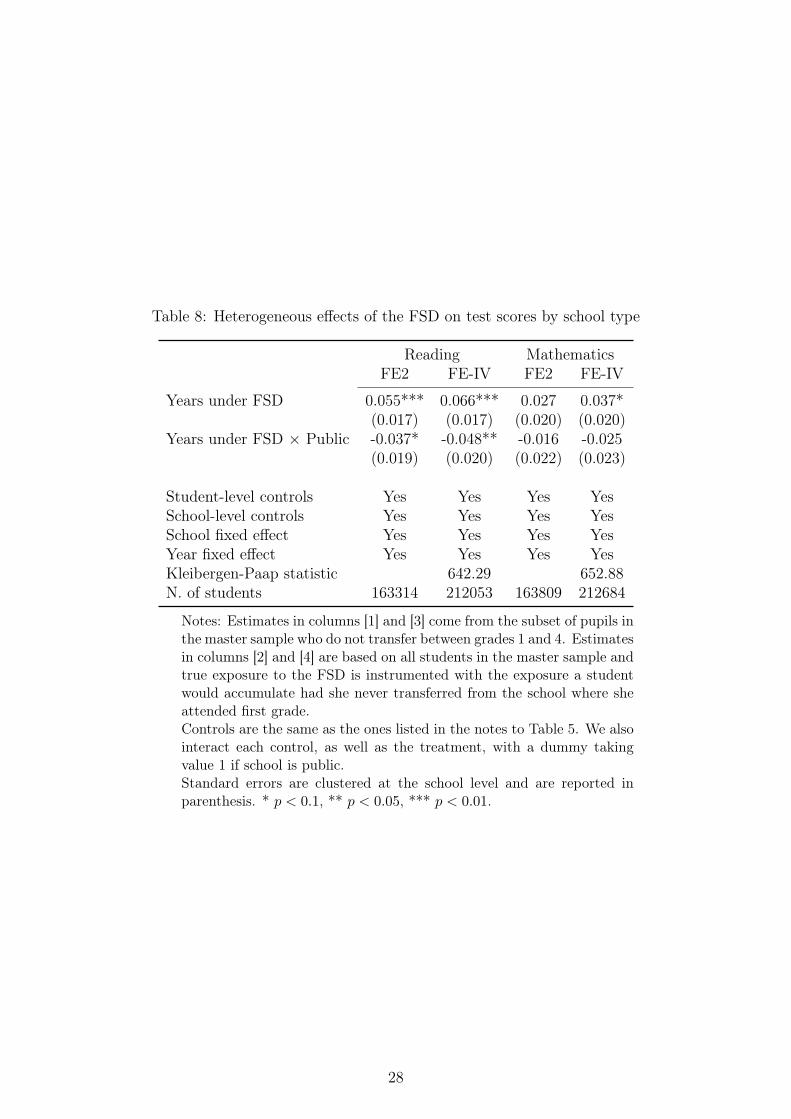
Table 8: Heterogeneous effects of the FSD on test scores by school type
Reading MathematicsFE2 FE-IV FE2 FE-IV
Years under FSD 0.055*** 0.066*** 0.027 0.037*(0.017) (0.017) (0.020) (0.020)
Years under FSD × Public -0.037* -0.048** -0.016 -0.025(0.019) (0.020) (0.022) (0.023)
Student-level controls Yes Yes Yes YesSchool-level controls Yes Yes Yes YesSchool fixed effect Yes Yes Yes YesYear fixed effect Yes Yes Yes YesKleibergen-Paap statistic 642.29 652.88N. of students 163314 212053 163809 212684
Notes: Estimates in columns [1] and [3] come from the subset of pupils inthe master sample who do not transfer between grades 1 and 4. Estimatesin columns [2] and [4] are based on all students in the master sample andtrue exposure to the FSD is instrumented with the exposure a studentwould accumulate had she never transferred from the school where sheattended first grade.Controls are the same as the ones listed in the notes to Table 5. We alsointeract each control, as well as the treatment, with a dummy takingvalue 1 if school is public.Standard errors are clustered at the school level and are reported inparenthesis. * p < 0.1, ** p < 0.05, *** p < 0.01.
28
Table 9: Heterogeneous effects of the FSD on test scores by school type, controlling for students’socio-economic background
Reading MathematicsFE1 FE-IV FE1 FE-IV
Years under FSD 0.050*** 0.063*** 0.020 0.032(0.019) (0.020) (0.022) (0.023)
Years under FSD × Public -0.037* -0.048** -0.016 -0.025(0.019) (0.020) (0.022) (0.023)(0.007) (0.008) (0.008) (0.008)
Student-level controls Yes Yes Yes YesSchool-level controls Yes Yes Yes YesSchool fixed effect Yes Yes Yes YesYear fixed effect Yes Yes Yes YesKleibergen-Paap statistic 318.42 323.81N. of students 163314 212053 163809 212684
Notes: Estimates in columns [1] and [3] come from the subset ofpupils in the master sample who do not transfer between grades 1and 4. Estimates in columns [2] and [4] are based on all studentsin the master sample and true exposure to the FSD is instrumentedwith the exposure a student would accumulate had she never trans-ferred from the school where she attended first grade.Controls are the same as the ones listed in the notes to Table 5. Wealso interact each control, as well as the treatment, with a dummytaking value 1 if school is public.Furthermore, we include the interaction between years of exposureto the FSD and: i) a dummy that takes value 1 if the pupil livesin a household where the household monthly income is ≤ 400,000CLP; ii) a dummy that takes value 1 if the most educated parentdoes not have some higher education.Standard errors are clustered at the school level and are reportedin parenthesis. We also include the interactions between years ofexposure to the FSD and: i) a dummy that takes value 1 if thepupil lives in a household with monthly income below 400,000; ii)a dummy that takes value 1 if the most educated parent does nothave higher education.Standard errors are clustered at the school level and are reported inparenthesis. * p < 0.1, ** p < 0.05, *** p < 0.01.
29
Our results show that returns to longer school days are larger in charter schools and that this
is not driven by differences in observable students’ and teachers’ characteristics. The main
difference between public and charter schools consists of the degree of autonomy they enjoy.
Table 10 reports answers to school principal surveys administered alongside the 2006, 2009 and
2012 waves of PISA tests, which ask about the tasks over which head-teachers have a consid-
erable responsibility. The sample consists of all principals of public and charter schools that
offer primary education.33 It emerges that principals in charter schools do indeed have greater
autonomy in designing the curricula, as more often they can decide the course offer and the
course content. Moreover, they are more likely to be responsible for the budget formulation
and allocation. They are also in charge of taking personnel decisions, in terms of recruitment,
promotions and dismissals. We therefore speculate that our findings are likely to be driven by
school autonomy: as charter schools have more freedom in tailoring the curriculum, they may
be more able and quick to adjust the school day to reap the benefits from longer schedules.
Since the allocation of additional instruction time across subjects is similar in public and char-
ter schools (Table 3), the heterogeneous effect is likely to reflect differences in subject-specific
content.
Our findings are consistent with those of Lavy (2015), who also documents that additional
instruction time yields larger benefits in schools that feature more autonomy and accountability.
They are also in line with the growing literature showing that granting autonomy to schools
improves pupils’ performance.34 Charter schools in the US typically have a longer school
day than public schools. Dobbie and Fryer Jr (2013) find that a 25% (or more) increase of
instruction time raises achievement in mathematics (reading) by 0.059σ (0.015σ), making it
one of the most successful features of charter schools. In a different setting, our results indicate
that these schools may perform better not only because students log longer school days, but also
because autonomy allows them to use the additional time in an effective way.35 Our findings33PISA tests are administered to pupils aged 15. We therefore restrict our attention to secondary schools
that also offer primary education, which explains the very small sample size.34Several papers focus on newly founded or converted charter schools in US. Studies on high-performing
oversubscribed charter schools exploit the fact that admission depends on a lottery and document a positiveeffect both on school performance (Abdulkadiroğlu et al., 2011; Dobbie et al., 2011; Dobbie and Fryer Jr,2013) and medium-term non-academic outcomes (Dobbie and Fryer Jr, 2015), larger in urban schools and fordisadvantaged students (Angrist et al., 2013). Abdulkadiroğlu et al. (2016) analyze school takeovers and adoptan identification strategy similar to ours. They also report positive effects on achievement. The recent workof Eyles and Machin (2015) and Eyles et al. (2017) analyze the consequences of converting English communityschools into academies - autonomous, state-funded education establishments not subject to local authoritycontrol. They also uncover a positive impact on performance.
35Bellei (2009) and Berthelon et al. (2016) find that the effect of the FSD on achievement is larger in publicschools. They both include rural schools in the analysis, which are mostly public and typically cater for very
30
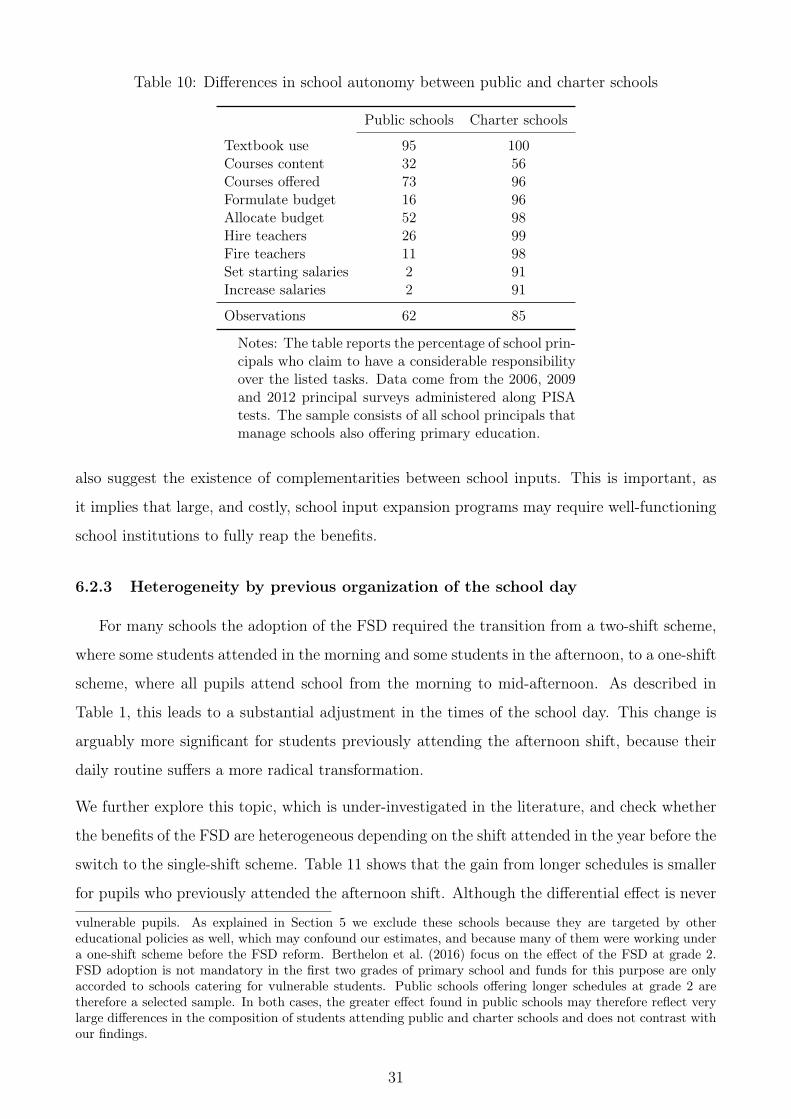
Table 10: Differences in school autonomy between public and charter schools
Public schools Charter schools
Textbook use 95 100Courses content 32 56Courses offered 73 96Formulate budget 16 96Allocate budget 52 98Hire teachers 26 99Fire teachers 11 98Set starting salaries 2 91Increase salaries 2 91
Observations 62 85
Notes: The table reports the percentage of school prin-cipals who claim to have a considerable responsibilityover the listed tasks. Data come from the 2006, 2009and 2012 principal surveys administered along PISAtests. The sample consists of all school principals thatmanage schools also offering primary education.
also suggest the existence of complementarities between school inputs. This is important, as
it implies that large, and costly, school input expansion programs may require well-functioning
school institutions to fully reap the benefits.
6.2.3 Heterogeneity by previous organization of the school day
For many schools the adoption of the FSD required the transition from a two-shift scheme,
where some students attended in the morning and some students in the afternoon, to a one-shift
scheme, where all pupils attend school from the morning to mid-afternoon. As described in
Table 1, this leads to a substantial adjustment in the times of the school day. This change is
arguably more significant for students previously attending the afternoon shift, because their
daily routine suffers a more radical transformation.
We further explore this topic, which is under-investigated in the literature, and check whether
the benefits of the FSD are heterogeneous depending on the shift attended in the year before the
switch to the single-shift scheme. Table 11 shows that the gain from longer schedules is smaller
for pupils who previously attended the afternoon shift. Although the differential effect is never
vulnerable pupils. As explained in Section 5 we exclude these schools because they are targeted by othereducational policies as well, which may confound our estimates, and because many of them were working undera one-shift scheme before the FSD reform. Berthelon et al. (2016) focus on the effect of the FSD at grade 2.FSD adoption is not mandatory in the first two grades of primary school and funds for this purpose are onlyaccorded to schools catering for vulnerable students. Public schools offering longer schedules at grade 2 aretherefore a selected sample. In both cases, the greater effect found in public schools may therefore reflect verylarge differences in the composition of students attending public and charter schools and does not contrast withour findings.
31
Table 11: Heterogeneous effects of the FSD on test scores by previous shift
Reading MathematicsFE2 FE-IV FE2 FE-IV
Years under FSD 0.027** 0.033** 0.024 0.023(0.013) (0.013) (0.016) (0.015)
Years under FSD × Afternoon Shift -0.007 -0.017 -0.015 -0.023(0.016) (0.016) (0.019) (0.018)
Student-level controls Yes Yes Yes YesSchool-level controls Yes Yes Yes YesSchool fixed effect Yes Yes Yes YesYear fixed effect Yes Yes Yes YesKleibergen-Paap statistic 3482.38 3484.74N. of students 269505 342220 270253 343158
Notes: Estimates in columns [1] and [3] come from the subset of pupils inthe master sample who do not transfer between grades 1 and 4. Estimates incolumns [2] and [4] are based on all students in the master sample and trueexposure to the FSD is instrumented with the exposure a student wouldaccumulate had she never transferred from the school where she attendedfirst grade.Controls are the same as the ones listed in the notes to Table 5. We alsointeract each control, as well as the treatment, with a dummy taking value1 if the pupil attended the afternoon shift in the year before the adoptionof the FSD.Standard errors are clustered at the school-shift level and are reported inparenthesis. * p < 0.1, ** p < 0.05, *** p < 0.01.
significant at the 10% level, it is large in size compared to the main effect.36 In the FE-IV
specification, for example, an additional year of exposure improves reading test scores of pupils
attending the morning shift by 0.033σ, almost twice as much as the gain for pupils attending
the afternoon shift (0.016σ). The differential effect is larger on mathematics test scores: the
FSD has a null impact on the latter, while it has a positive but imprecisely estimated effect
(0.023σ) on the former. This is consistent with the pattern of coefficient in Table 5, which also
suggests that adaptation costs may have a greater effect on mathematics.37
Overall, our findings provide suggestive evidence that substantial changes to the organization
and length of the school day may be associated with initial adaptation costs, which likely fade
away as pupils, as well as teachers, get used to the new schedules. Short-term benefits may
therefore be smaller than longer-term ones. According to a growing strand of literature, there
are time-of-day effects on productivity. Pope (2016) and Lusher and Yasenov (2016) document36The large standard errors also stem from a smaller sample size. As explained in Section 5, due to data
constraints we could not assign a shift to pupils in schools that adopted the FSD in all grades in 2002 or 2003.37To address the concern that these results may be driven by differences in the characteristics of students
attending the morning and afternoon shifts we present in Appendix A.3 (Table A3) a specification in which,in addition to the interaction between FSD and the shifts, we interact the FSD with parental education andhousehold income. The results are robust to the inclusion of these additional interactions.
32
that morning classes have a more positive impact on performance than afternoon classes. This
could also partly explain the smaller benefits enjoyed by students previously attending afternoon
shifts: not only because they arguably face a more radical change of their daily routine, but
also because they may have been slightly less prepared than pupils previously attending the
morning shift.
6.3 A cost-benefit analysis
To gauge the cost effectiveness of the policy, we weight average improvements on the tests
against operational costs associated with the provision of an additional year of exposure to the
FSD.38 According to the cost-effectiveness index that we describe in Appendix A.2, providing
an additional year of exposure to the FSD is as costly as contracting an additional teacher
every 51 students.39 Under a certain set of assumptions (detailed in Appendix A.2 as well),
this would allow reducing average class size from 31 to 19. Borrowing estimates of returns to
smaller class size in grade 4 from Angrist and Lavy (1999) and assuming that effects are linear,
reading scores would have risen by 0.12σ and mathematics scores by 0.04σ.40 By comparison,
the effect of the FSD on achievement appears modest.41
Yet, our estimates highlight that it takes time to adapt to a radical change in the times of the
school day and that benefits increase more than linearly with exposure. Hence, the learning
gains may become larger as students grow older. Moreover, the documented heterogeneity by
student characteristics shows that longer schedules may help to reduce achievement gaps by
background, while the bigger impact of additional instruction time in charter schools suggests
that giving more autonomy to schools may boost the benefits. Finally, this cost-benefit analysis
does not take into account the effect that the longer school day may also have on non-academic
outcomes and on mothers’ working choices. As mentioned above, Berthelon and Kruger (2011)
document a reduction of teenage pregnancy rates and youth crime as a result of this intervention.
Berthelon et al. (2015) also find a positive effect on mothers’ participation and attachment to38Operational costs are measured by the increase in the vouchers received by schools that implement the
FSD (see Table 2). We neglect one-time costs related to infrastructure funding. Benefits are captured by thecoefficients in the linear specification (Panel A, Table 5).
39These figures assume away general equilibrium effects on teachers wages.40The reference to the work of Angrist and Lavy (1999) is motivated by the fact that average class size in
Chilean schools (31) is very close to the average class size in Israeli schools (29) and larger than the averageclass size in the US and most European countries. The numbers used here correspond to the 2sls estimatesfor grade 4 transformed to standard deviation units following the procedure they propose for comparing theirresults with other works.
41In the case of mathematics this comparison should be taken with caution. In Angrist and Lavy (1999) thiseffect is not significant; in addition the sign of the coefficient varies across alternative specifications.
33
the labor force.
7 Robustness checks
In this section we discuss the concern that other events may happen in a school around the
time of the adoption of the FSD and affect learning outcomes in the following years. If these
changes to the broader school environment also have a positive effect on performance, we would
overestimate the benefit of additional instruction time.
Some schools had to expand their infrastructure prior to switching to a single-shift scheme. One
therefore could worry that our estimates also capture the effect of infrastructure investment.
Funds disbursed for this purpose covered costs related to replicating the existing infrastructure
on a larger scale, not to improving it. Nonetheless, to address this issue, we replicate our
analysis on the sample of schools that did not receive public funds for expanding infrastructure
and thus are unlikely to have made substantial changes to their facilities prior to lengthening
the school day. Panel A of Table 12 reports estimates that are similar to those coming from
the full sample of schools. Added instructional time and the longer school day have a positive
effect on reading scores (0.015-0.024σ). The impact on mathematics scores is not significant as
in the full sample.
Schools had to submit a pedagogical plan for the Ministry of Education regional offices’ approval
prior to adopting the FSD. This might raise the concern that the decision to draft such plan
is contemporaneous to other improvements in the school environment, like the appointment of
a more motivated and engaged school principal. As a check, we also replicate our analysis on
the sub-sample of schools that do not change school principals in a 2-year time window around
the year of adoption of the FSD. Panel B of Table 12 reports the estimates from this exercise.
Also in this case, coefficients are similar to those coming from the full sample. The effect on
reading scores is in the range 0.014-0.020σ. The effect on mathematics scores is not significant
as in the full sample and is smaller in size.
Finally, we also present estimates based on an alternative identification strategy. Chilean
primary schools do not have defined catchment areas and parents can in principle enroll their
pupils wherever they prefer. Yet, as discussed in Section 4, proximity to home is the main driver
of parental preferences. 88% of 4th graders attend a school located in the same municipality
where they live. Because of this, we also estimate an over-identified regression specification
34
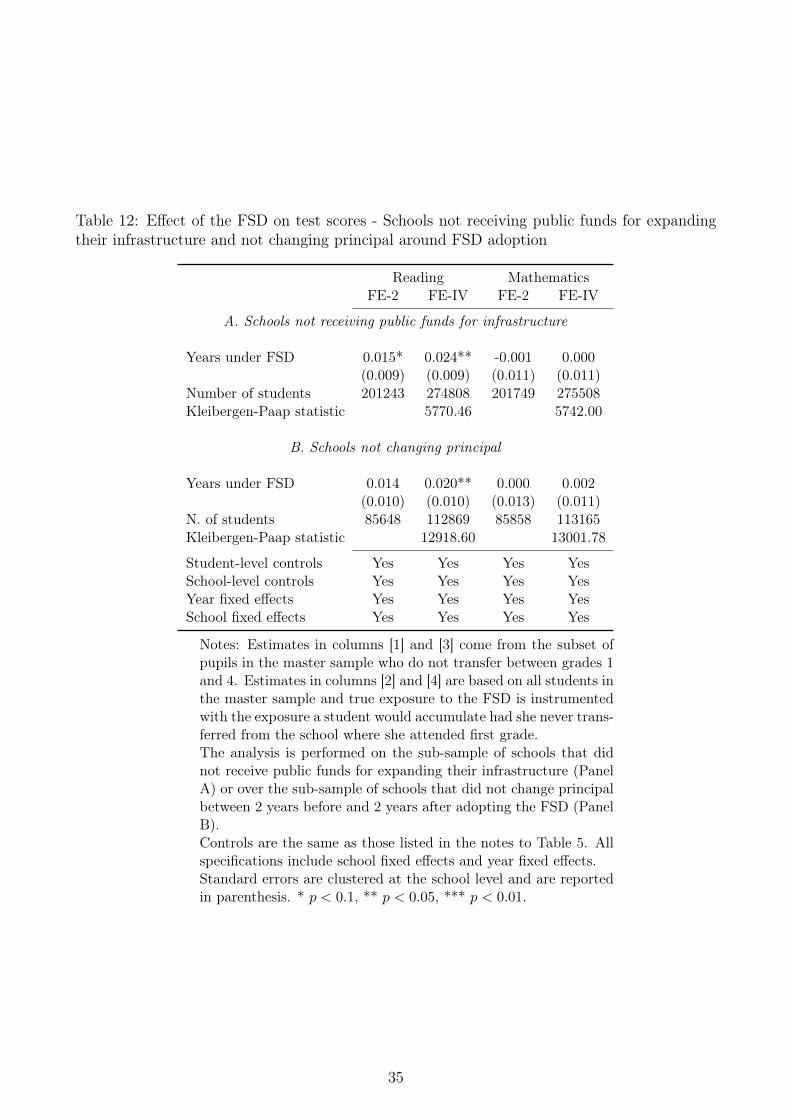
Table 12: Effect of the FSD on test scores - Schools not receiving public funds for expandingtheir infrastructure and not changing principal around FSD adoption
Reading MathematicsFE-2 FE-IV FE-2 FE-IV
A. Schools not receiving public funds for infrastructure
Years under FSD 0.015* 0.024** -0.001 0.000(0.009) (0.009) (0.011) (0.011)
Number of students 201243 274808 201749 275508Kleibergen-Paap statistic 5770.46 5742.00
B. Schools not changing principal
Years under FSD 0.014 0.020** 0.000 0.002(0.010) (0.010) (0.013) (0.011)
N. of students 85648 112869 85858 113165Kleibergen-Paap statistic 12918.60 13001.78
Student-level controls Yes Yes Yes YesSchool-level controls Yes Yes Yes YesYear fixed effects Yes Yes Yes YesSchool fixed effects Yes Yes Yes Yes
Notes: Estimates in columns [1] and [3] come from the subset ofpupils in the master sample who do not transfer between grades 1and 4. Estimates in columns [2] and [4] are based on all students inthe master sample and true exposure to the FSD is instrumentedwith the exposure a student would accumulate had she never trans-ferred from the school where she attended first grade.The analysis is performed on the sub-sample of schools that didnot receive public funds for expanding their infrastructure (PanelA) or over the sub-sample of schools that did not change principalbetween 2 years before and 2 years after adopting the FSD (PanelB).Controls are the same as those listed in the notes to Table 5. Allspecifications include school fixed effects and year fixed effects.Standard errors are clustered at the school level and are reportedin parenthesis. * p < 0.1, ** p < 0.05, *** p < 0.01.
35
Table 13: Effect of the FSD on test score - Municipality-level IV
Reading Mathematics
Years under FSD 0.025** 0.030**(0.012) (0.014)
Student-level controls Yes YesSchool-level controls Yes YesYear fixed effects Yes YesSchool fixed effects Yes YesNumber of Students 1074169 1077354Kleibergen-Paap statistic 283.66 283.32
Notes: All specifications include school fixed effectsand year fixed effects. School- and student-levelcontrols are the same as those listed in the notesto Table 5. Instruments for individual exposure toFSD consist in the average exposure to the FSDand the share of students attending schools withFSD in the municipality where the student lives.Standard errors are clustered at the school level andare reported in parenthesis. * p < 0.1, ** p < 0.05,*** p < 0.01.
that instruments student-level exposure to the FSD with the share of fourth graders attending
schools that offer the FSD and the average number of years under the FSD by grade 4 in the
municipality where the student lives. The instruments capture the local availability of longer
schedules. They are likely to be correlated with the treatment, since the decision on whether to
enroll the pupil in schools offering the FSD depends on the local offer. As long as the exclusion
restriction is satisfied (i.e. as long as the intensity of FSD diffusion at the municipality level
affects individual scores only through its effect on individual-level exposure to the FSD), they
are valid instruments. We estimate this specification on all cohorts of pupils (i.e. not only
on incumbent pupils) and we also use the 1999 and 2002 waves of the test. Table 13 reports
coefficients that are similar, and if anything larger, than those coming from our main strategy.
8 Conclusions
As hours per day are an inherently limited resource, increasing daily instruction time reduces
the amount of time pupils dedicate to other activities outside school. The returns to longer
school days therefore hinge upon the absolute quality of time use at school and its relative
quality with respect to time use outside school, which vary across students and schools. We
study how the effect of increased instruction time and longer schedules on achievement varies
depending on students’ and schools’ circumstances. We exploit a large-scale reform that sub-
36
stantially increases daily instruction time in Chilean primary schools, requiring the transition
from half-day to full-day instruction (FSD). Our findings highlight that the average effect of
an additional year of exposure to the FSD on reading (0.017-0.020σ) and mathematics (0.003-
0.006σ) scores in a test taken at the end of grade 4 masks substantial heterogeneity depending
on students’ and schools’ circumstances.
Returns to longer school schedules are bigger for pupils from disadvantaged backgrounds, as
captured by parental education and household income. For example, the benefit associated
with an additional year of exposure to the FSD is between five and six times larger for pupils
living in poorer households (0.022-0.024σ) than for pupils living in more affluent ones (0.004σ).
This suggests that returns to spending more time at school are larger for students who have
fewer learning resources and opportunities available at home. We further document that longer
school days are associated with a lower frequency of homework assignments. The partial re-
placement of self-study at home with supervised study at school is likely to be an important
driver of our findings, as it should benefit more pupils with less support at home.
Public schools and charter schools that do not charge tuition fees serve students from similar
backgrounds and have similar resources. Charter schools have more autonomy over staff and
budgetary decisions, as well as over the design of the course offer and content. We show that
the benefits from longer schedules are larger in charter schools and are not explained by ob-
servable differences in students’ and teachers’ characteristics. We therefore suggest that school
autonomy plays an important role in shaping the effectiveness of other school inputs, giving
rise to interesting complementarities. Autonomy is likely to enable charter schools to adapt the
curriculum to reap the benefits from longer schedules quicker and better than public schools.
A topic for future research is the reasons why school institutions and school inputs appear to
be complements to the education production function and on whether some specific features of
school management/governance matter more than others.
The transition from a two-shift scheme, where some grades are taught in the morning and some
in the afternoon, to a one shift-scheme, where all students attend school from the morning to
mid-afternoon, entails a substantial re-organization of times of the school day. Our analysis
indicates that initial adaptation costs may exist. First, we note that benefits from longer sched-
ules increase more than linearly with exposure. Second, we show that, although the differential
effect is not precisely estimated, gains are smaller for pupils previously attending the afternoon
shift, who face a more radical change of their daily routine. We are among the first to discuss
and test for the existence of adaptation costs when there are significants changes to the length
37

of the school day.
When presenting these findings we thoroughly discuss how they relate to the existing relevant
literature. We also show that they are robust to a battery of robustness checks and an alter-
native identification strategy.
The amount of daily instruction time displays substantial heterogeneity across OECD countries
(OECD, 2016b). Our work indicates that the optimal level may be different across countries, as
returns to an additional hour of instruction vary depending on the characteristics of the school
system and on learning resources available to students outside school. Our work also suggests
that effects might take time to build up given the initial re-organization costs.
38
References
Atila Abdulkadiroğlu, Joshua D Angrist, Susan M Dynarski, Thomas J Kane, and Parag A
Pathak. Accountability and flexibility in public schools: Evidence from Boston’s charters
and pilots. The Quarterly Journal of Economics, 126(2):699–748, 2011.
Atila Abdulkadiroğlu, Joshua D Angrist, Peter D Hull, and Parag A Pathak. Charters without
lotteries: Testing takeovers in New Orleans and Boston. The American Economic Review,
106(7):1878–1920, 2016.
Jorge M Agüero and Trinidad Beleche. Test-mex: Estimating the effects of school year length
on student performance in Mexico. Journal of Development Economics, 103:353–361, 2013.
Rita Almeida, Antonio Bresolin, Bruna Pugialli Da Silva Borges, Karen Mendes, and Naercio A
Menezes-Filho. Assessing the impacts of Mais Educacao on educational outcomes: evidence
between 2007 and 2011. World Bank Policy Research Working Paper 7644, 2016.
Joshua D Angrist and Victor Lavy. Using Maimonides’ rule to estimate the effect of class size
on scholastic achievement. The Quarterly Journal of Economics, 114(2):533–575, 1999.
Joshua D Angrist, Parag A Pathak, and Christopher R Walters. Explaining charter school
effectiveness. American Economic Journal: Applied Economics, 5(4):1–27, 2013.
Esteban M Aucejo and Teresa Foy Romano. Assessing the effect of school days and absences
on test score performance. Economics of Education Review, 55:70–87, 2016.
Cristián Bellei. Does lengthening the school day increase students’ academic achievement?
Results from a natural experiment in Chile. Economics of Education Review, 28(5):629–640,
2009.
Matias Berthelon, Diana Kruger, and Melanie Oyarzún. The effects of longer school days on
mothers’ labor force participation. IZA DP n. 9212, 2015.
Matias Berthelon, Diana I Kruger, and Veronica Vienne. Longer school schedules and early
reading skills: Effects from a full-day school reform in Chile. IZA DP n. 10282, 2016.
Matias E Berthelon and Diana I Kruger. Risky behavior among youth: Incapacitation effects
of school on adolescent motherhood and crime in Chile. Journal of public economics, 95(1):
41–53, 2011.
39
Julian R Betts and Eric Johnson. A test of diminishing returns to school spending.
mimeographed, University of California San Diego, 1998.
David Card and Alan B Krueger. Does school quality matter? Returns to education and the
characteristics of public schools in the United States. Journal of Political Economy, 100(1):
1–40, 1992.
Maria A Cattaneo, Chantal Oggenfuss, and Stefan CWolter. The more, the better? The impact
of instructional time on student performance. Education Economics, pages 1–13, 2017.
Pedro Cerdan-Infantes and Christel Vermeersch. More time is better: An evaluation of the full
time school program in Uruguay. World Bank Policy Research Working Paper 4167, 2007.
A De Andraca and M. Gaiardo. Estructura y funcionamento de escuelas en las zonas rurales.
1987.
Will Dobbie and Roland G Fryer Jr. Getting beneath the veil of effective schools: Evidence
from New York City. American Economic Journal: Applied Economics, 5(4):28–60, 2013.
Will Dobbie and Roland G Fryer Jr. The medium-term impacts of high-achieving charter
schools. Journal of Political Economy, 123(5):985–1037, 2015.
Will Dobbie, Roland G Fryer, and G Fryer Jr. Are high-quality schools enough to increase
achievement among the poor? Evidence from the Harlem Children’s Zone. American Eco-
nomic Journal: Applied Economics, 3(3):158–187, 2011.
Eric Eide and Mark H Showalter. The effect of school quality on student performance: A
quantile regression approach. Economics letters, 58(3):345–350, 1998.
Andrew Eyles and Stephen J Machin. The introduction of academy schools to England educa-
tion. CEP Discussion Paper No 1368, 2015.
Andrew Eyles, Stephen Machin, and Sandra McNally. Unexpected school reform: Academisa-
tion of primary schools in England. Journal of Public Economics, 2017.
Joshua Goodman. Flaking out: Student absences and snow days as disruptions of instructional
time. Technical report, National Bureau of Economic Research, 2014.
Jeff Grogger. Does school quality explain the recent black/white wage trend? Journal of Labor
Economics, pages 231–253, 1996.
40
Benjamin Hansen. School year length and student performance: Quasi-experimental evidence.
Available at SSRN 2269846, 2011.
Eric A. Hanushek. Time in education: Introduction. The Economic Journal, 125(588):F394–
F396, 2015.
Diana Hincapie. Do longer school days improve student achievement? Evidence from Colombia.
IDB Working Paper n. 679, 2016.
Mathias Huebener, Susanne Kuger, and Jan Marcus. Increased instruction hours and the
widening gap in student performance. Labour Economics, 2017.
Victor Lavy. Expanding school resources and increasing time on task: Effects of a policy exper-
iment in Israel on student academic achievement and behavior. Technical report, National
Bureau of Economic Research, 2012.
Victor Lavy. Do differences in schools’ instruction time explain international achievement gaps?
Evidence from developed and developing countries. The Economic Journal, 125(588):F397–
F424, 2015.
Jong-Wha Lee and Robert J Barro. Schooling quality in a cross–section of countries. Economica,
68(272):465–488, 2001.
T. Leyton. Las políticas de educación rurale en Chile: Cambio y continuidad. 2013.
Lester Lusher and Vasil Yasenov. Double-shift schooling and student success: Quasi-
experimental evidence from Europe. Economics Letters, 139:36–39, 2016.
Dave E Marcotte. Schooling and test scores: A mother-natural experiment. Economics of
Education Review, 26(5):629–640, 2007.
Dave E Marcotte and Steven W Hemelt. Unscheduled school closings and student performance.
Education, 3(3):316–338, 2008.
OECD. Dare to share: Germany’s experience promoting equal partnership in families. 2016a.
OECD. How is learning time organised in primary and secondary education? 2016b.
Rasyad A Parinduri. Do children spend too much time in schools? Evidence from a longer
school year in Indonesia. Economics of Education Review, 41:89–104, 2014.
41
Jörn-Steffen Pischke. The impact of length of the school year on student performance and
earnings: Evidence from the German short school years. The Economic Journal, 117(523):
1216–1242, 2007.
Nolan G Pope. How the time of day affects productivity: Evidence from school schedules.
Review of Economics and Statistics, 98(1):1–11, 2016.
Steven G Rivkin and Jeffrey C Schiman. Instruction time, classroom quality, and academic
achievement. The Economic Journal, 125(588):F425–F448, 2015.
Ronald Rizzuto and Paul Wachtel. Further evidence on the returns to school quality. Journal
of Human Resources, pages 240–254, 1980.
Ludger Wößmann. Schooling resources, educational institutions and student performance: The
international evidence. Oxford bulletin of economics and statistics, 65(2):117–170, 2003.
42
A Appendix
A.1 Public and charter schools
Public and charter schools are subject to different regulations. This translates into charter
schools enjoying more autonomy and flexibility over budgetary and personnel decisions.
Public schools are either managed by the Municipal Department of Education (DAEM) or
by private non-profit education corporations. While the director of the DAEM is a teacher,
corporations are led by a board of directors who do not need to be teachers and whose president
is the major of the Municipality. Under both management schemes decisions related to the
allocation of resources and to hiring/firing school staff are taken at the Municipality level and
school principals are not necessarily involved. Charter schools are instead private organizations
and all relevant decisions are taken by the school authorities.
The working conditions of the employees of public schools are regulated by the “Estatuto de
los Profesionales de la Educación”. The relevant regulation for charter schools is the “Código
del Trabajo”, the labor code that applies to all firms in Chile. Appointments of public school
teachers are decided by a commission that is formed by the Major, the director of the DAEM
or the education corporations, as well as one randomly selected teacher from the schools in the
municipality. Priority is given to spouses of teachers already working in the municipality.
The salary of public school teachers is fixed according to a national scale that takes into
account experience, training, specific difficult situations (such as teaching in rural, remote
or deprived areas) and responsibilities. Firing is subject to many restrictions. It is possible
only if one of the following conditions are met: i) school enrolment decreases; ii) the national
curriculum undergoes changes that justify the decision; iii) schools’ merges; iv) protracted poor
performance (see below). Teachers having tenured positions enjoy a greater job security.42 In
any case, firings have to be justified in the Annual Plan of Educational Development that needs
the approval of the Provincial Office of the Ministry of Education. Charter schools are instead
free to set their own recruitment and dismissal criteria. Wages and the other working conditions
are subject to the same regulations that apply to private firms.
There are also differences in the evaluation of teachers. The “Estatuto de los Profesionales de
la Educación” originally set some criteria for assessing teachers performance, but they were
never implemented properly due to teachers’ unions opposition. In 2003 a new evaluation42The “Estatuto de los Profesionales de la Educación” contemplates two type of contracts,“titular” and “con-
tratado”. The first type of contract affords a greater job security, as it offers a tenured position.
43
system was agreed. Nevertheless it is quite lax and in practice very few teachers receive poor
evaluations. In principle, teachers could be fired if they fare unsatisfactorily in two or three
consecutive evaluations. School principals are not accountable based on the school performance
and they can be fired only in case of a grave fault, while poor evaluations can result in assigning
them to smaller schools. Charter schools can instead set their own evaluation systems and the
consequences in case of poor performance.
A.2 An index of cost-effectiveness of the FSD
We construct a simple cost-effectiveness index that captures the average benefit of an ad-
ditional year of exposure to the FSD by grade 4 for every 100USD invested per student. The
index is built in the following way. We first compute the average difference in the voucher
received by schools with and without the FSD over the period 2002-2013 and we convert it in
2015 USD. We assume the operational costs of the FSD are captured by this difference and
we neglect infrastructure-related expenses. We compute the present value of the operational
costs of catering for a student under the FSD until grade 4, using the social discount rate
defined by the Chilean government for evaluating its investment projects (i.e. 6%). The index
is then built as the ratio between the estimated benefits of full exposure to the FSD by grade
4 and the present value operational costs (divided by 100). Table A1 shows that for every
$100 invested on the FSD, students improve their performance by 0.15%σ in mathematics and
by 0.97%σ in reading. The third and fourth rows of the same table display the present value
of the operational costs of full exposure to the FSD by grade 4 and the present value of the
cost of contracting an additional teacher over 4 years, respectively.43 The comparison shows
that providing full exposure to the FSD is as costly as contracting an additional teacher over
the same period for around every 51 students. Under certain assumptions, implementing the
FSD would then be as costly as significantly reducing average class size, from around 31 to 19
students. Specifically, the assumptions are: i) there is one teacher per class;44 ii) contracting
new teachers does not produce general equilibrium effects on teachers wage and quality; iii)
the existing infrastructure has enough capacity to accommodate smaller classes, so that there
are no additional infrastructure-related costs.
43In order to compute the cost of contracting an additional teacher, we refer to the average wages reportedin the Teachers Longitudinal Survey implemented by the Centro de Microdatos of Universidad de Chile.
44This assumption is reasonable for grade 4, whereas at later grades there are different teachers specializedin different subjects.
44
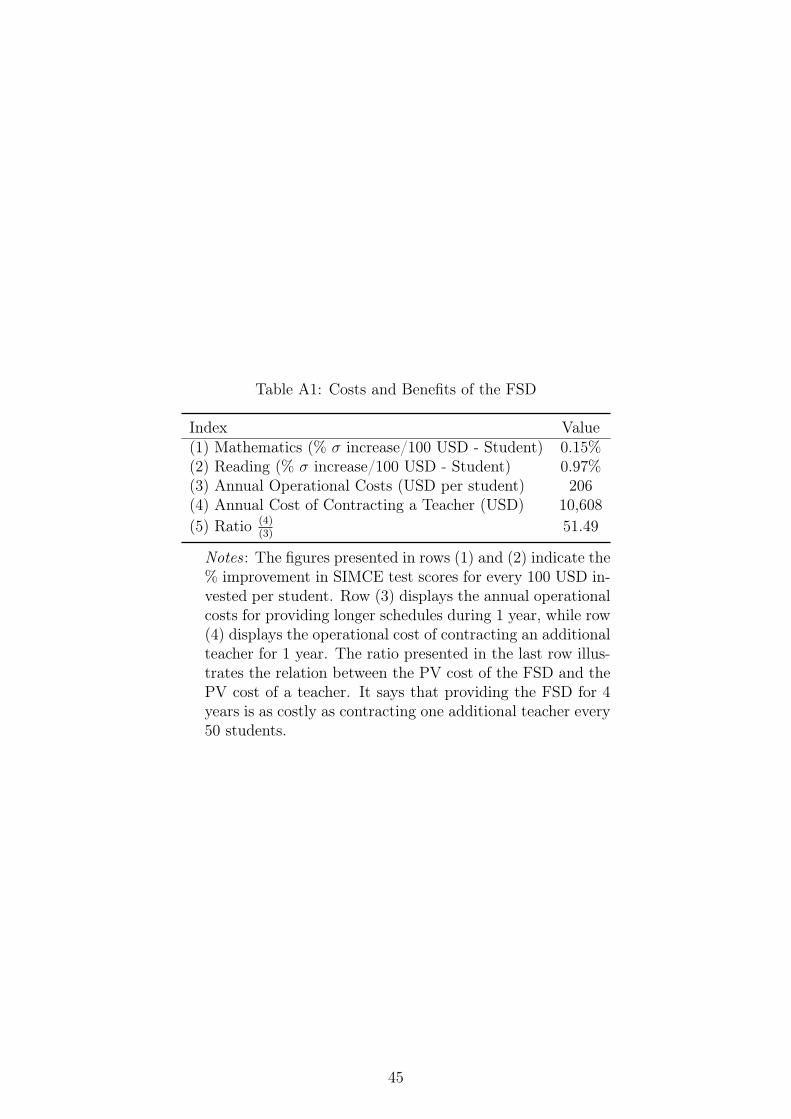
Table A1: Costs and Benefits of the FSD
Index Value(1) Mathematics (% σ increase/100 USD - Student) 0.15%(2) Reading (% σ increase/100 USD - Student) 0.97%(3) Annual Operational Costs (USD per student) 206(4) Annual Cost of Contracting a Teacher (USD) 10,608(5) Ratio (4)
(3)51.49
Notes : The figures presented in rows (1) and (2) indicate the% improvement in SIMCE test scores for every 100 USD in-vested per student. Row (3) displays the annual operationalcosts for providing longer schedules during 1 year, while row(4) displays the operational cost of contracting an additionalteacher for 1 year. The ratio presented in the last row illus-trates the relation between the PV cost of the FSD and thePV cost of a teacher. It says that providing the FSD for 4years is as costly as contracting one additional teacher every50 students.
45
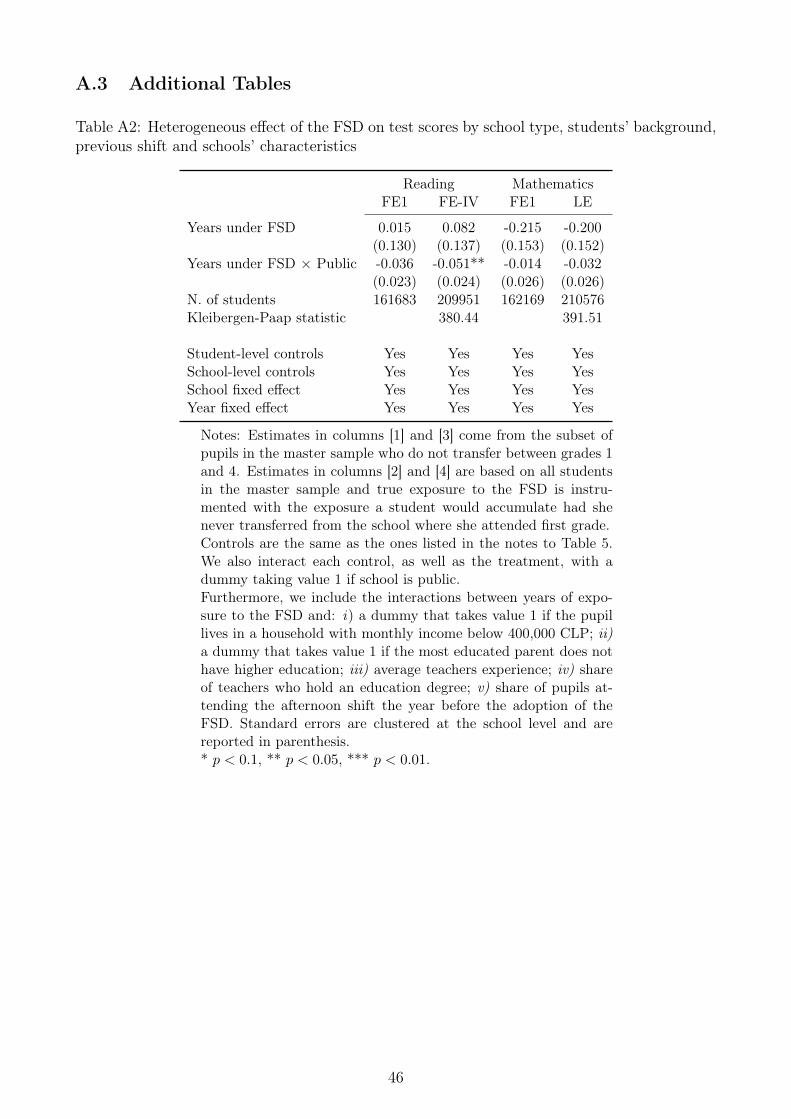
A.3 Additional Tables
Table A2: Heterogeneous effect of the FSD on test scores by school type, students’ background,previous shift and schools’ characteristics
Reading MathematicsFE1 FE-IV FE1 LE
Years under FSD 0.015 0.082 -0.215 -0.200(0.130) (0.137) (0.153) (0.152)
Years under FSD × Public -0.036 -0.051** -0.014 -0.032(0.023) (0.024) (0.026) (0.026)
N. of students 161683 209951 162169 210576Kleibergen-Paap statistic 380.44 391.51
Student-level controls Yes Yes Yes YesSchool-level controls Yes Yes Yes YesSchool fixed effect Yes Yes Yes YesYear fixed effect Yes Yes Yes Yes
Notes: Estimates in columns [1] and [3] come from the subset ofpupils in the master sample who do not transfer between grades 1and 4. Estimates in columns [2] and [4] are based on all studentsin the master sample and true exposure to the FSD is instru-mented with the exposure a student would accumulate had shenever transferred from the school where she attended first grade.Controls are the same as the ones listed in the notes to Table 5.We also interact each control, as well as the treatment, with adummy taking value 1 if school is public.Furthermore, we include the interactions between years of expo-sure to the FSD and: i) a dummy that takes value 1 if the pupillives in a household with monthly income below 400,000 CLP; ii)a dummy that takes value 1 if the most educated parent does nothave higher education; iii) average teachers experience; iv) shareof teachers who hold an education degree; v) share of pupils at-tending the afternoon shift the year before the adoption of theFSD. Standard errors are clustered at the school level and arereported in parenthesis.* p < 0.1, ** p < 0.05, *** p < 0.01.
46
Table A3: Heterogeneous effect of the FSD on test scores by previous shift attended andstudents’ characteristics
Reading MathematicsFE2 FE-IV FE2 FE-IV
Years under FSD 0.024* 0.032** 0.025 0.025(0.013) (0.014) (0.016) (0.016)
Years under FSD × Afternoon Shift -0.007 -0.018 -0.015 -0.023(0.016) (0.016) (0.019) (0.018)
Student-level controls Yes Yes Yes YesSchool-level controls Yes Yes Yes YesSchool fixed effect Yes Yes Yes YesYear fixed effect Yes Yes Yes YesKleibergen-Paap statistic 2295.63 2298.22N. of students 269505 342220 270253 343158
Notes: Estimates in columns [1] and [3] come from the subset of pupils inthe master sample who do not transfer between grades 1 and 4. Estimates incolumns [2] and [4] are based on all students in the master sample and trueexposure to the FSD is instrumented with the exposure a student wouldaccumulate had she never transferred from the school where she attendedfirst grade.Controls are the same as the ones listed in the notes to Table 5. We alsointeract each control, as well as the treatment, with a dummy taking value1 if the pupil attended the afternoon shift in the year before the adoptionof the FSD.Furthermore, we include interactions between years of exposure under theFSD and: a dummy that takes value 1 if the pupil lives in a household withmonthly income below 400,000 CLP; ii) a dummy that takes value 1 if themost educated parent does not have higher education.Standard errors are clustered at the school-shift level and are reported inparenthesis. * p < 0.1, ** p < 0.05, *** p < 0.01.
47
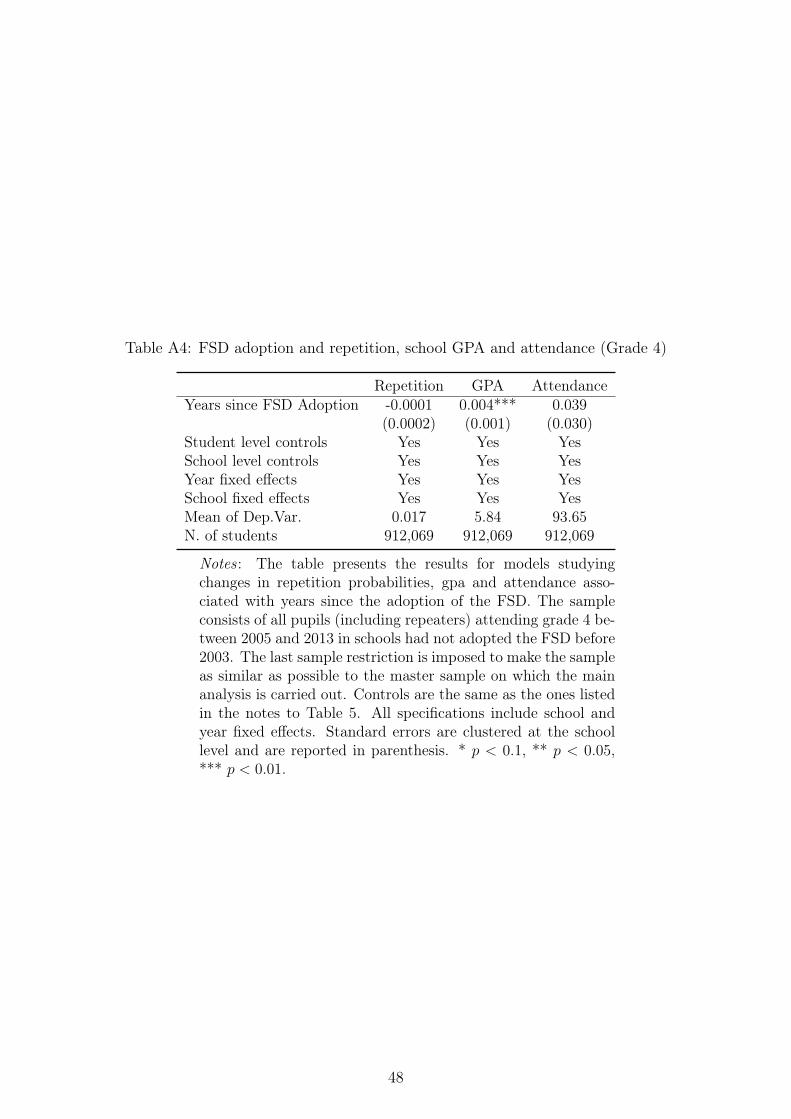
Table A4: FSD adoption and repetition, school GPA and attendance (Grade 4)
Repetition GPA AttendanceYears since FSD Adoption -0.0001 0.004*** 0.039
(0.0002) (0.001) (0.030)Student level controls Yes Yes YesSchool level controls Yes Yes YesYear fixed effects Yes Yes YesSchool fixed effects Yes Yes YesMean of Dep.Var. 0.017 5.84 93.65N. of students 912,069 912,069 912,069
Notes : The table presents the results for models studyingchanges in repetition probabilities, gpa and attendance asso-ciated with years since the adoption of the FSD. The sampleconsists of all pupils (including repeaters) attending grade 4 be-tween 2005 and 2013 in schools had not adopted the FSD before2003. The last sample restriction is imposed to make the sampleas similar as possible to the master sample on which the mainanalysis is carried out. Controls are the same as the ones listedin the notes to Table 5. All specifications include school andyear fixed effects. Standard errors are clustered at the schoollevel and are reported in parenthesis. * p < 0.1, ** p < 0.05,*** p < 0.01.
48

CENTRE FOR ECONOMIC PERFORMANCE Recent Discussion Papers
1520 Sara Calligaris Massimo Del Gatto Fadi Hassan Gianmarco I.P. Ottaviano Fabiano Schivardi
The Productivity Puzzle and Misallocation: An Italian Perspective
1519 Alex Bell Raj Chetty Xavier Jaravel Neviana Petkova John Van Reenen
Who Becomes an Inventor in America? The Importance of Exposure to Innovation
1518 Randolph Bruno Nauro Campos Saul Estrin Meng Tian
Economic Integration, Foreign Investment and International Trade: The Effects of Membership of the European Union
1517 Fabrice Defever José-Daniel Reyes Alejandro Riaño Miguel Eduardo Sánchez-Martín
Special Economic Zones and WTO Compliance: Evidence from the Dominican Republic
1516 Philippe Aghion Ufuk Akcigit Matthieu Lequien Stefanie Stantcheva
Tax Simplicity and Heterogeneous Learning
1515 Fabrice Defever Christian Fischer Jens Suedekum
Supplier Search and Re-Matching in Global Sourcing: Theory and Evidence from China
1514 Philippe Aghion Antonin Bergeaud Timo Boppart Peter J. Klenow Huiyu Li
Missing Growth from Creative Destruction
1513 Stephen J. Redding David E. Weinstein
Aggregating from Micro to Macro Patterns of Trade

1512 Andrew E. Clark Tom Lee
Early-Life Correlates of Later-Life Well-Being: Evidence from the Wisconsin Longitudinal Study
1511 Clément Bosquet Pierre-Philippe Combes Cecilia García-Peñalosa
Gender and Promotions: Evidence from Academic Economists in France
1510 Andrea Ariu Holger Breinlich Gregory Corcos Giordano Mion
The Interconnections between Services and Goods Trade at the Firm-Level
1509 Johannes Boehm Swati Dhingra John Morrow
Product Diversification in Indian Manufacturing
1508 Hanwei Huang Jiandong Ju Vivian Z. Yue
Structural Adjustments and International Trade: Theory and Evidence from China
1507 Laura Alfaro Pol Antràs Davin Chor Paolo Conconi
Internalizing Global Value Chains: A Firm-Level Analysis
1506 Alessandro Iaria Carlo Schwarz Fabian Waldinger
Frontier Knowledge and Scientific Production: Evidence from the Collapse of International Science
1505 Fabrice Defever Alejandro Riaño
Twin Peaks
1504 Gene M. Grossman Elhanan Helpman Ezra Oberfield Thomas Sampson
The Productivity Slowdown and the Declining Labor Share: A Neoclassical Exploration
The Centre for Economic Performance Publications Unit Tel: +44 (0)20 7955 7673 Email [email protected] Website: http://cep.lse.ac.uk Twitter: @CEP_LSE