Embed Size (px)
Citation preview
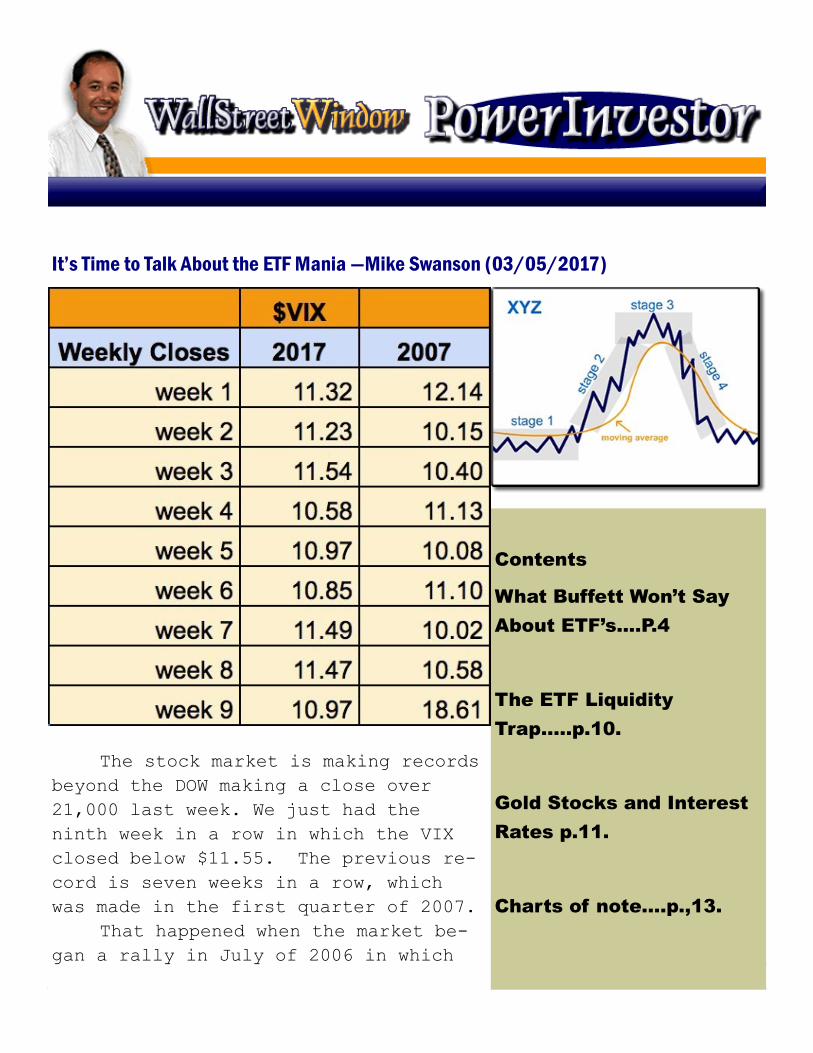
It’s Time to Talk About the ETF Mania —Mike Swanson (03/05/2017)
The stock market is making records
beyond the DOW making a close over
21,000 last week. We just had the
ninth week in a row in which the VIX
closed below $11.55. The previous re-
cord is seven weeks in a row, which
was made in the first quarter of 2007.
That happened when the market be-
gan a rally in July of 2006 in which
Contents
What Buffett Won’t Say
About ETF’s....P.4
The ETF Liquidity
Trap…..p.10.
Gold Stocks and Interest
Rates p.11.
Charts of note….p.,13.

2
it went straight up with zero volatility, much as it has been
doing now the past few months. You can see that move on the
above chart. That rally ended suddenly though in March of 2007
in a correction that came out of nowhere and caused the VIX to
spike up to 20.
The VIX is important, because it measures the implied vola-
tility that people are paying in the options market. It isn’t
a measure of REAL volatility, but what people think future
volatility is going to be. So low VIX readings mean people
have no worry about sudden stock market drops and high readings
come when they become very worried about them, with the latter
tending to happen on important stock market bottoms and at the
end of corrections.

3
So the fact that the VIX is so low now and has been staying
low means that people have zero worry in the world of a correc-
tion or a pullback. But at some point there will be one. The
thing is I cannot predict when it is going to come and don’t
think anyone can do so. Therefore I feel very happy to raise
cash now and be ready to take positions later as I mentioned
last week. I have no care in the world now if the market goes
up a little higher “without me” so to speak.
I have been here before and can see this current market
rally ending out of nowhere just like what happened in March of
2007. Now the market did go higher after that correction in
March of 2007, but the rally that ended that March actually
marked the end of that stage two bull market cycle, because af-
ter that correction the internals in the market actually disin-
tegrated. Although the market averages made new highs in July
and then in November, most stocks actually lagged poorly during
those moves, which set the stage for a full blown stage four
bear market and the crash of 2008.
That type of transition from a stage two bull market and
into a stage four bear market is typical and is likely to hap-
pen again. The internals are strong now so we are not yet see-
ing this, but once this current rally ends we could easily see
the internals diverge away from the market to warn of a coming
bear market cycle.
In fact I believe that this is very likely and is something
I will talk more about next week. That is looking out into the
future. Right now everyone is mesmerized by the current rally.
Some want to buy things now to chase. Others are wondering
when it will end. And most are
fully invested already dreaming of
more gains to come.
As I mentioned last week many
people believe we are now in a new
paradigm in the markets. We have
seen the stock market go up now
without any pullback of more than
4
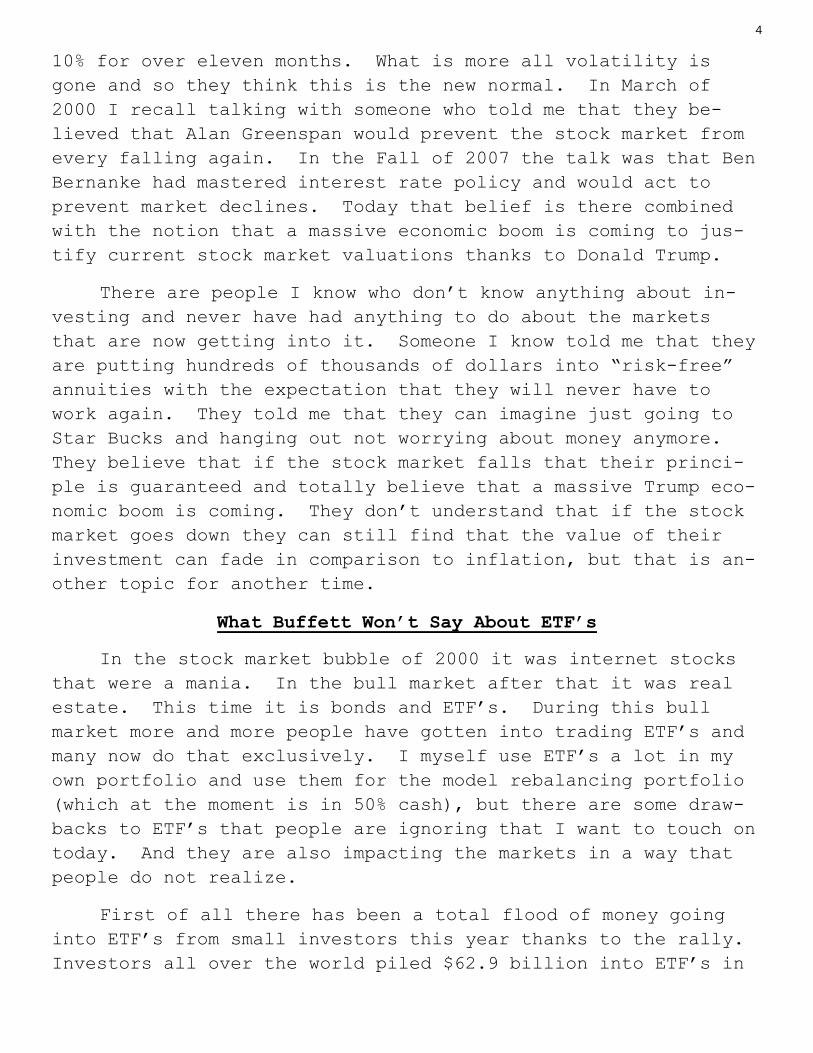
10% for over eleven months. What is more all volatility is
gone and so they think this is the new normal. In March of
2000 I recall talking with someone who told me that they be-
lieved that Alan Greenspan would prevent the stock market from
every falling again. In the Fall of 2007 the talk was that Ben
Bernanke had mastered interest rate policy and would act to
prevent market declines. Today that belief is there combined
with the notion that a massive economic boom is coming to jus-
tify current stock market valuations thanks to Donald Trump.
There are people I know who don’t know anything about in-
vesting and never have had anything to do about the markets
that are now getting into it. Someone I know told me that they
are putting hundreds of thousands of dollars into “risk-free”
annuities with the expectation that they will never have to
work again. They told me that they can imagine just going to
Star Bucks and hanging out not worrying about money anymore.
They believe that if the stock market falls that their princi-
ple is guaranteed and totally believe that a massive Trump eco-
nomic boom is coming. They don’t understand that if the stock
market goes down they can still find that the value of their
investment can fade in comparison to inflation, but that is an-
other topic for another time.
What Buffett Won’t Say About ETF’s
In the stock market bubble of 2000 it was internet stocks
that were a mania. In the bull market after that it was real
estate. This time it is bonds and ETF’s. During this bull
market more and more people have gotten into trading ETF’s and
many now do that exclusively. I myself use ETF’s a lot in my
own portfolio and use them for the model rebalancing portfolio
(which at the moment is in 50% cash), but there are some draw-
backs to ETF’s that people are ignoring that I want to touch on
today. And they are also impacting the markets in a way that
people do not realize.
First of all there has been a total flood of money going
into ETF’s from small investors this year thanks to the rally.
Investors all over the world piled $62.9 billion into ETF’s in
5
February, bringing the total up to $124 billion inflows year to
date by the end of February. US ETF’s got $44 billion from in-
flows in February.
Last week something very interesting happened. Now the day
after Trump’s speech to Congress the DOW rallied 300 points to
close above 21,000 for the first time.
According to a Wall Street Journal story, on that Wednesday
$8.2 billion dollars worth of SPY ETF, which tracks the S&P
500, shares were purchased. It was the 9th biggest inflow in
the history of the ETF. The ETF has a total market cap of
$232.23 billion so that Wednesday buy meant a 3.5% total money
flow into that ETF on that single day. At the same time the
S&P 500 went up 1.37% on that Wednesday. So much of the buying
that came into the stock market on that day was thanks to
ETF’s.
Now the Wall Street Journal was able to determine that the
bulk of that money came from small individual investors by
tracking the amount of options and futures volume that corre-
lated with it on that day. There are professionals and money
managers who will do more than buy an ETF when they make momen-
tum purchases and they just weren’t as active as one would ex-
pect that day.
At the same time ETF’s that have been linked to Donald
Trump policies have exploded in value since the election. Re-
call I bought XLF, VIS, and IYT after Trump won. The XLF ETF
is the banking ETF and it has attracted $7.9 billion in new in-
vestor money since the election. The fund closed Friday with a
market cap of $25 billion. So this is massive buying in this
fund since the election.
These funds have been popular for years of course, but now
they are becoming a mania. You may have seen news stories in
the past few weeks in which Warren Buffett has been quoted as
advocating that people throw their money into ETF’s as wonder-
ful low cost “passive investments.” His argument is that if
you get an investment advisor he is going to smash you with 1%

6
fees and most of them don’t beat the market. As for hedge
funds this year only 35% of them are beating the market so far
year to date. Buffett attacked hedge funds and professional
money managers in his annual letter this year to again argue
that people need to put their money into ETF’s.
This Buffett theme got echoed everywhere in the online fi-
nancial media. However, what is not stated is that when the
market goes straight up like it has been doing it is pretty
difficult for any money manager to beat the performance of the
index by picking out the best stocks in it. With thousands of
other money managers trying to do the same thing who is to have
an edge and who isn’t? The real benefit of hedge funds is when
the stock market goes sideways or down. It is then that stock
picking or money management matters. What is not said in the
Buffett articles is that Warren Buffett is benefitting himself
when people buy these ETF’s, because Berkshire Hathaway makes
up over 10% of the XLF ETF and is one of the top holdings in
the S&P 500 ETF. So anyone who buys these ETF’s is buying War-
ren Buffett shares whether they know it or not!
ETF’s are easy to buy and sell. That is what makes them so
attractive to people and why I use them for the model rebalanc-
ing portfolio. However, they have two big drawbacks people are
not noticing at all.
First of all ETF’s charge management fees even if they are
“cheap” fees they still exist. The XLF ETF is charging 0.14%,
which is one of the cheaper expense fees for ETF’s in general.
It is also paying a 1.62% dividend. However, if you were look-
ing to invest in bank stocks for years on out that 0.14% will
be charged every year. If you bought the stocks you would just
pay a fee in terms of commissions ONCE and not every year.
What is more most of these ETF’s are not as diversified as peo-
ple think they are, with many of them putting 30% of the assets
into only three stocks.
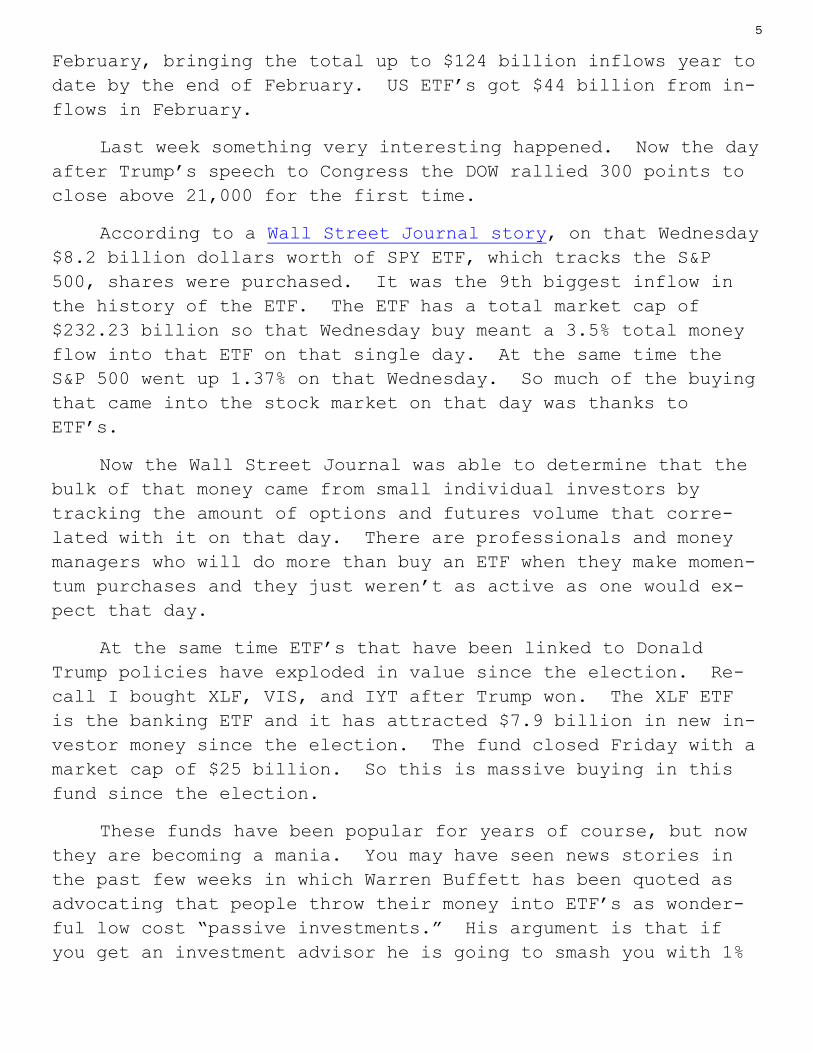
To give you an example take a look at the XLF ETF. While
Berkshire is its top holding with 10.83% of its asset in it, it
has 10.78% of the money in JP Morgan and 8.7% in Wells Fargo.
7
Take a look at the above chart and you can see how a few stocks
heavily weight the ETF. Maybe you would be better off just
buying the top five or ten stocks in the ETF instead of the ETF
itself and escape the ETF management fees.
You also would end up getting more dividend payments from
owning the stocks instead of the ETF too. For instance while
XLF pays a 1.62% dividend JPM pays a dividend of 2.08% and WFC
pays 2.59%. Some of the banks pay less than the XLF does in
dividends so instead of buying XLF one could simply buy a dozen
or so bank stocks that pay higher dividends. So the idea that
these funds are “cheap” that Buffett is pushing on people is
not really true. They are not “cheap” compared to buying
stocks.
I started to think about this a few weeks ago when I was
reading the new Edward Thorp book A Man For All Markets that
had a section talking about this. He was a pioneer in quanti-
tative investing and famous for inventing the counting cards
blackjack system.
He has run thousands of mathematical studies when it comes
to investing. One thing he found is that if you simply pluck
out 30 random stocks form the S&P 500 you’ll end up matching
it’s performance. This is why the DOW-30 tends to match the
performance of the S&P 500.

8
One thing I am taking from this is not to rely so much on
ETF’s myself when it comes to my own investing. Don’t get me
wrong I’m still going to use them. There are times when there
is not really an alternative, such as the GLD or CEF ETF’s or
with hedging against the stock market in an IRA and it is
really easy to use various ETF’s to analyze what various sec-
tors of the market are doing or to construct a simple sector
based model portfolio, but in the future I am likely to buy
more individual stocks in my accounts for core positions in-
stead of ETF’s.
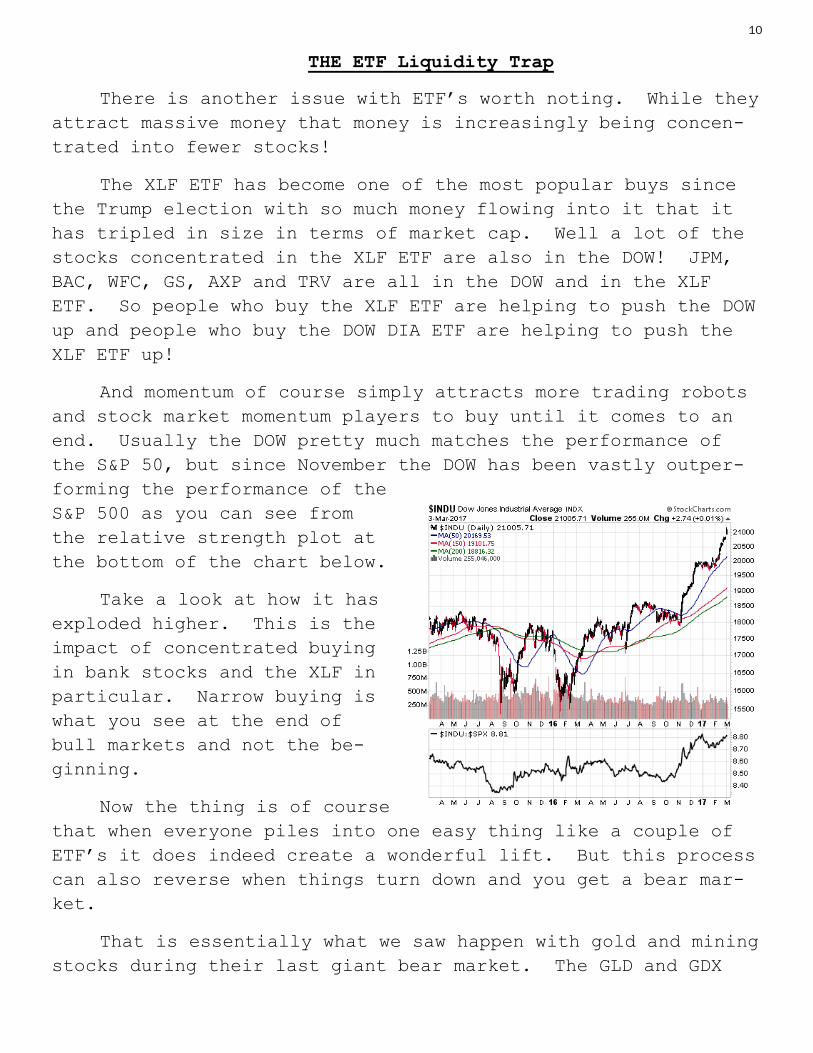
The gold mining sector is an example. Take a look at how
the GDX ETF is weighted above. Much of it is in the top five
stocks. The GDX pays a 0.24% dividend and has an annual ex-
pense of 0.52%. Well most of the big cap gold and silver
stocks pay larger dividends than 0.24%, with a few of them pay-
ing 1% or higher like FNV.
Now if you want to trade in and out of a sector an ETF like
GDX makes more sense. But if you are buying with the idea of
holding for a long-time then individual stocks makes more
sense.
Now Thorpe noted that there is one big drawback to buying
individual stocks as opposed to ETF’s and that is you might
9
watch them and get scared when one of them drops and sell it.
In the end his idea is you buy 30 stocks or what not to match
the performance of the market averages. If you do that then
you just make changes every once in awhile and do not need to
buy and sell based on short-term price moves on individual
stocks. Think about the DOW. In any given year there will be
a few DOW stocks that lag and do bad and some that do good. In
the end it is the effect of all of the stocks blended together
that matters. If you buy 15-20 stocks that are all in the same
sector they are simply going to tend to match the performance
of the sector or ETF anyway, even if one or two of them perform
badly. These “bad” stocks are still in the ETF’s!
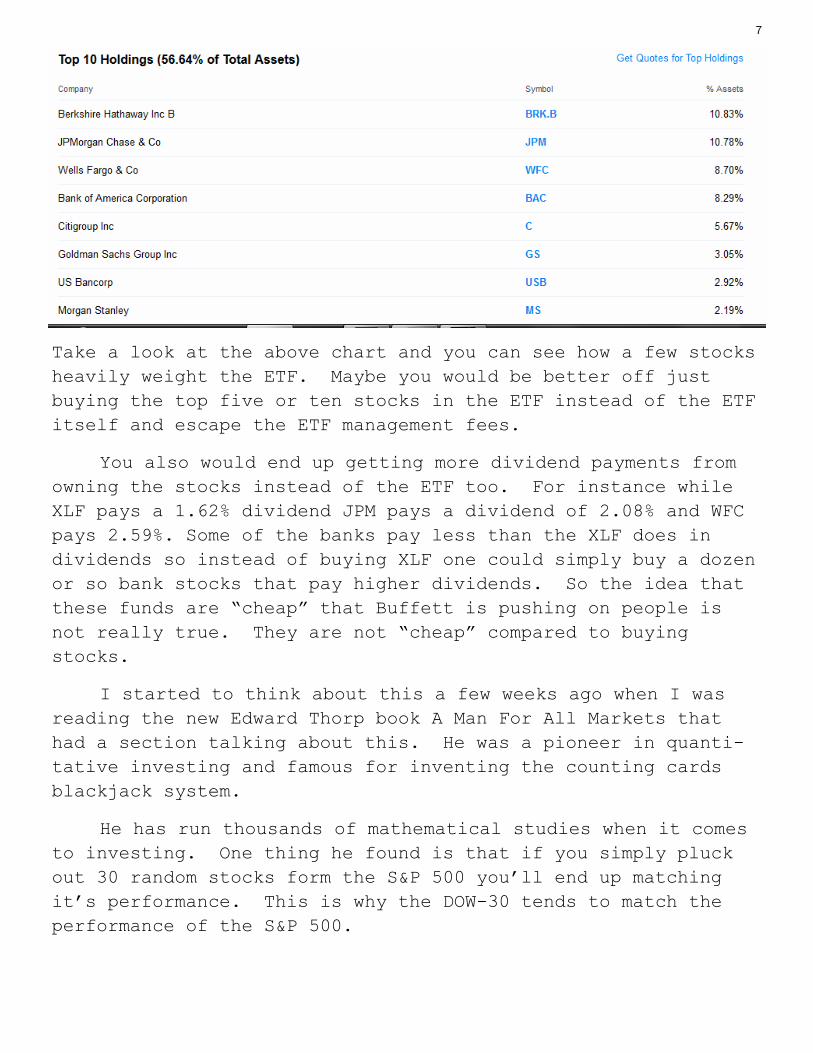
Some ETF’s really charge high fees and are simply not di-
versified at all. For instance take a look at the JETS ETF for
airlines and it’s list of holdings above. Notice how 40% of
the money is put into four stocks! The ETF is charging a 0.60%
management fee for that. What is the point of buying it when
it is so concentrated in a few stocks?
Of course no one is asking questions like this or thinking
about this when we are really in a “passive investing” ETF ma-
nia now sanctioned by Warren Buffett of all people.
10
THE ETF Liquidity Trap
There is another issue with ETF’s worth noting. While they
attract massive money that money is increasingly being concen-
trated into fewer stocks!
The XLF ETF has become one of the most popular buys since
the Trump election with so much money flowing into it that it
has tripled in size in terms of market cap. Well a lot of the
stocks concentrated in the XLF ETF are also in the DOW! JPM,
BAC, WFC, GS, AXP and TRV are all in the DOW and in the XLF
ETF. So people who buy the XLF ETF are helping to push the DOW
up and people who buy the DOW DIA ETF are helping to push the
XLF ETF up!
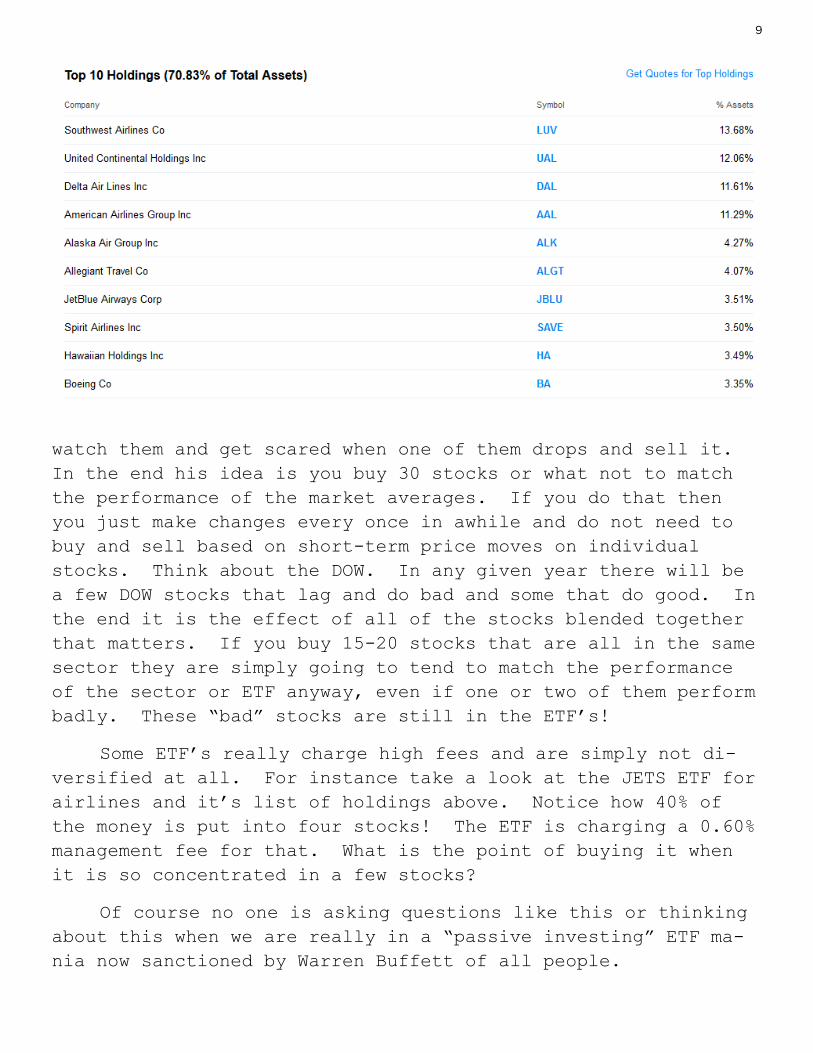
And momentum of course simply attracts more trading robots
and stock market momentum players to buy until it comes to an
end. Usually the DOW pretty much matches the performance of
the S&P 50, but since November the DOW has been vastly outper-
forming the performance of the
S&P 500 as you can see from
the relative strength plot at
the bottom of the chart below.
Take a look at how it has
exploded higher. This is the
impact of concentrated buying
in bank stocks and the XLF in
particular. Narrow buying is
what you see at the end of
bull markets and not the be-
ginning.
Now the thing is of course
that when everyone piles into one easy thing like a couple of
ETF’s it does indeed create a wonderful lift. But this process
can also reverse when things turn down and you get a bear mar-
ket.
That is essentially what we saw happen with gold and mining
stocks during their last giant bear market. The GLD and GDX
11
ETF’s attracted massive buying on their way up from 2009 till
2011. That also meant that there wasn’t a whole lot of liquid-
ity on the way down. But at the end of that bear market the
small cap and junior mining stocks not in GDX or GDXJ did not
continue to get smashed even though the ETF’s went lower.
So we got record inflows now into ETF’s from individual in-
vestors. In the end one day this will lead to record outflows.
There are a lot of people buying now with no real game plan at
all or even an idea of what is in the ETF’s they are buying or
how they work.
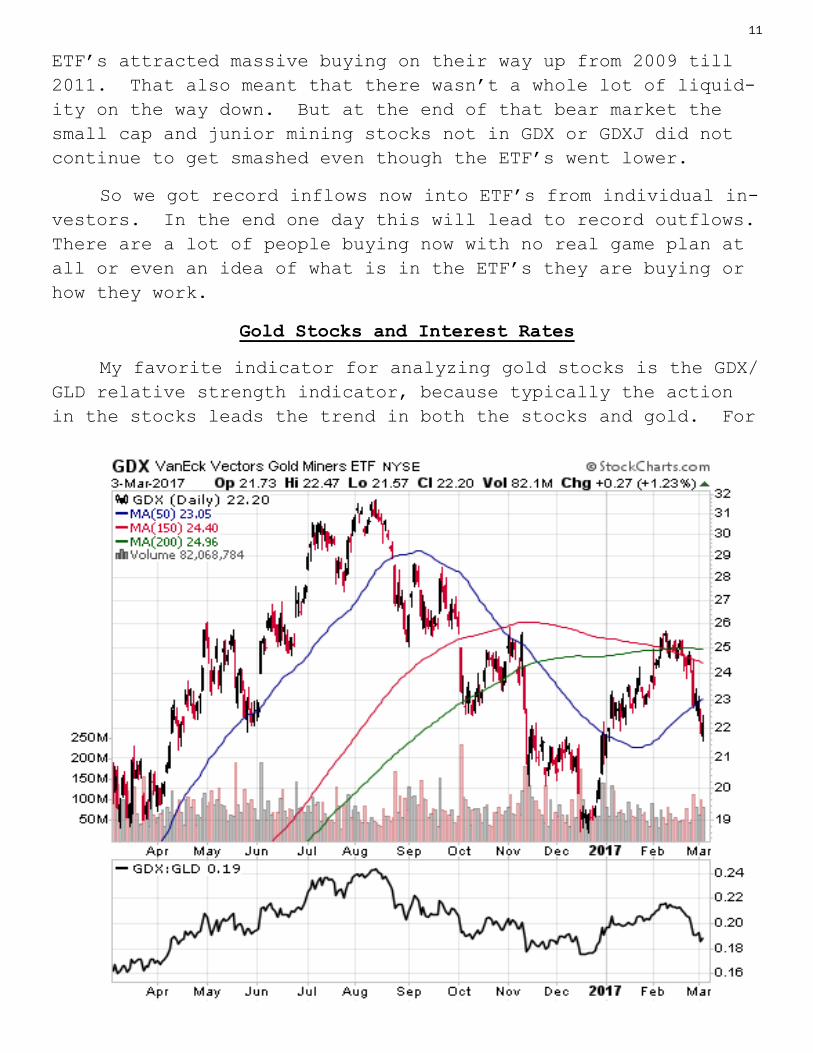
Gold Stocks and Interest Rates
My favorite indicator for analyzing gold stocks is the GDX/
GLD relative strength indicator, because typically the action
in the stocks leads the trend in both the stocks and gold. For
12
about a month now that indicator has actually been trending
down. It’s a leading indicator so this didn’t matter a few
weeks ago, but the gold stocks took a hit one day last week and
dipped down afterwards. Gold though barely has pulled back
from its recent highs. I take this action to suggest that both
are now set up to dip or at least go sideways more and consoli-
date before they will breakout again. It really is going to
take gold going above $1,300 an ounce before the masses get in-
terested in it again. Above $1,200 and investors like to buy
it and below $1,200 they get scared of it, which is actually
when they should buy it.
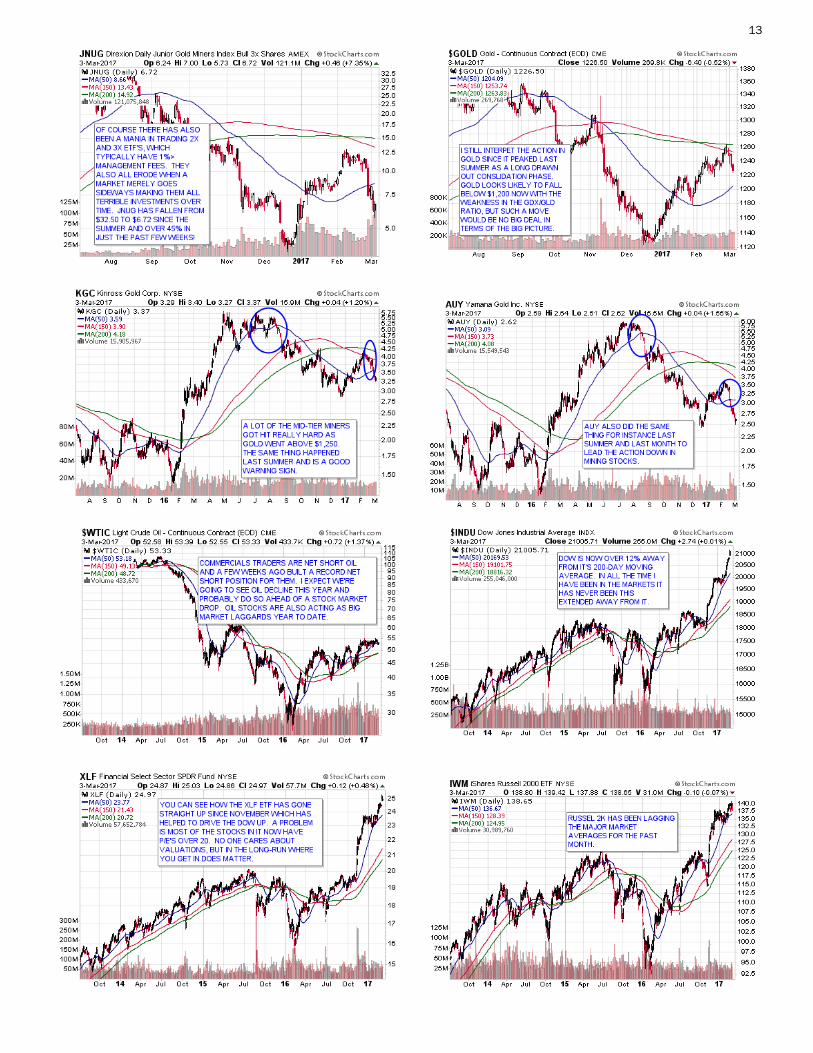
With the stock market going higher the odds of the Fed hik-
ing rates at its next meeting March have risen to 80%. They
were below 50% at the end of January. They seem almost certain
to do it. It is possible that the metals and mining stocks are
simply dipping ahead of the March Fed meeting, but I also fear
that they are falling ahead of what will be a stock market cor-
rection this Spring or Summer. Oil also looks to me to be
toppy and in a position to fall hard this year, with commer-
cials recently piling on to build themselves a record short po-
sition in the oil futures market. I also got out of my DBA ag-
riculture ETF the other week and it also dropped down last
week, when typically it tends to go up from now till July.
Stock market bulls see this action and can convince themselves
it means that an economic boom is coming with interest rates
set to rise. But long-term interest rates have not gone up
with the short-term rates in the past week, which suggests oth-
erwise.
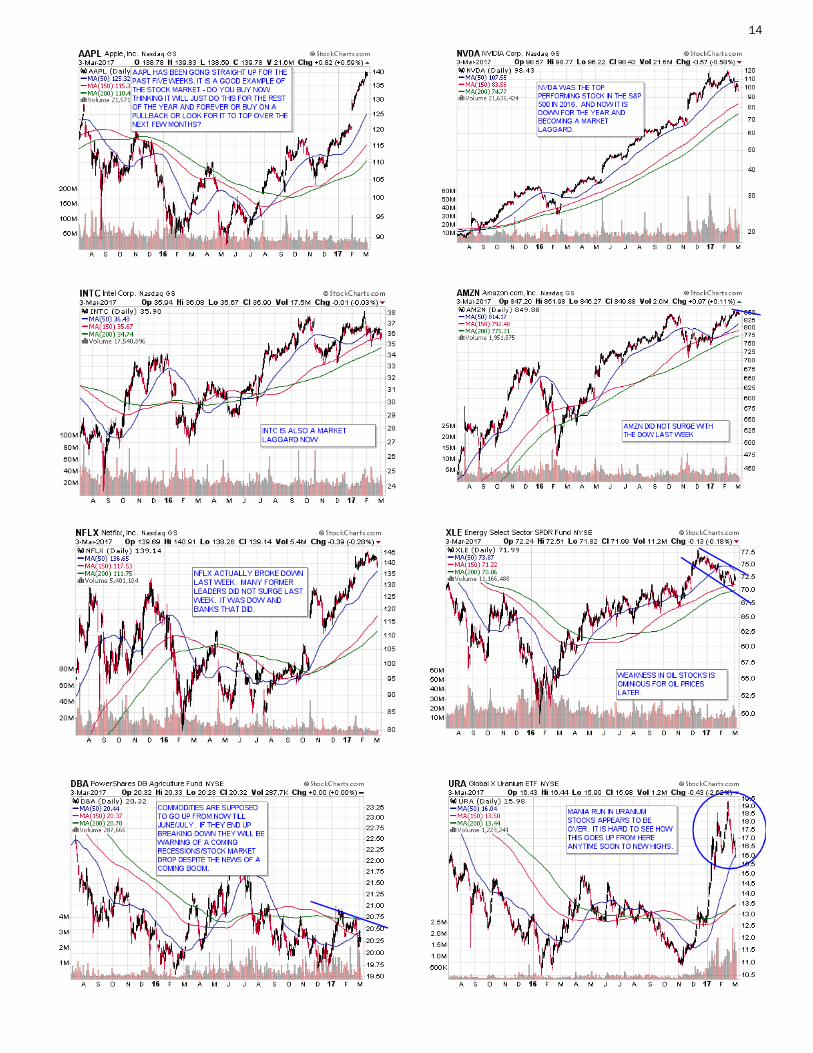
I believe we are likely to see the stock market correct
hard this Spring or Summer to bring an upside reversal in gold
and mining stocks. IF the market drops people will stop talk-
ing about higher interest rates. With the market now more
overbought than it has ever been before a correction is simply
a matter of time. Last Wednesday the DOW closed 12.4% away
from it’s 200-day moving average. It is time to be cautious
before trading or chasing despite the mania and bullish talk
everywhere. Here are some charts of note:
13
14

15
MODEL REBALANCING ETF PORTFOLIO ALLOCATION
The goal of this portfolio is to have five have core positions with no
more than 20% invested in each one that together provide an investment al-
location with a low intra-portfolio matrix. This makes it so that when
one ETF goes down another can go up overtime. Traditionally people do
this with using US stocks and Treasury bonds, but in the long-run a mix of
more diversified assets can generate superior investment returns and if
one day stocks and T-bills go down together then it will be a necessity.
To make the strategy work one must also rebalance the positions to main-
tain the fixed allocation percentages. Rebalancing also boosts returns
overtime and lowers the overall volatility of the account. To make this
work monthly or weekly rebalancing is best.
For more on how this strategy works read my January monthly newsletter
from 2015.
http://wallstreetwindow.com/wswmonthly/wswmonthly01012015.pdf
Also see module 7 of my “Bear Market Power Pack” for several videos and
academic papers about this market strategy:
http://www.wallstreetwindow.com/powerinvestor/?page_id=1346
Right now my recommended mix of ETF’s is the following:
50% - CASH
20% - HDGE: Bear ETF that is short a basket of stocks.
20% - CEF: Central Fund of Canada owns gold and silver bullion.
10% - GDX: Gold Stocks ETF.
This ETF allocation creates a correlation ratio of 0.35 A 50% in TLT and
50% in SPY currently generates a correlation of 0.29.
You can use your own ETF’s or funds to play with correlations by going to
this website:
http://www.investspy.com/
A correlation of 1.00 would mean that everything in a portfolio is trading
together. I have core positions in my trading and investment accounts
roughly invested like this model portfolio is with the bulk of my money.

16 Disclaimer
WallStreetWindow.com is owned by Timingwallstreet, Inc of which Michael
Swanson is President and sole shareholder. Both Swanson and employees and
associates of Timingwallstreet, Inc. may have a stock trading position in securi-
ties which are mentioned on any of the websites or commentaries published by
TimingWallStreet or any of its services and may sell or close such positions at
any moment and without warning. Under no circumstances should the informa-
tion received from TimingWallStreet represent a recommendation to buy, sell,
or hold any security. TimingWallStreet contains the opinions of Swanson and
and other financial writers and commentators. Neither Swanson, nor Timing-
Wallstreet, Inc. provide individual investment advice and will not advise you
personally concerning the nature, potential, value, or of any particular stock or
investment strategy. To the extent that any of the information contained on any
TimingWallStreet publications may be deemed investment advice, such infor-
mation is impersonal and not tailored to the investment and stock trading
needs of any specific person. Past results of TimingWallStreet, Michael Swan-
son or other financial authors are not necessarily indicative of future perform-
ance. TimingWallStreet does not represent the accuracy nor does it warranty
the accuracy, completeness or timeliness of the statements published on its
web sites, its email alerts, podcats, or other media.
The information provided should therefore be used as a basis for continued, in-
dependent research into a security referenced on TimingWallStreet so that the
reader forms his or her own opinion regarding any investment in a security pub-
lished on any TimingWallStreet of media outlets or services. The reader there-
fore agrees that he or she alone bears complete responsibility for their own
stock trading, investment research and decisions. We are not and do not repre-
sent ourselves to be a registered investment adviser or advisory firm or com-
pany. You should consult a qualified financial advisor or stock broker before
making any investment decision and to help you evaluate any information you
may receive from TimingWallstreet.
Consequently, the reader understands and agrees that by using any of Timing-
WallStreet services, either directly or indirectly, TimingWallStreet, Inc. shall not
be liable to anyone for any loss, injury or damage resulting from the use of or
information attained from TimingWallStreet.