Embed Size (px)
Citation preview

ITTC – Recommended
Guidelines
7.5-02
-07-03.9 Page 1 of 17
Model Tests for Current Turbines Effective Date
2014
Revision
00
Updated / Edited by Approved
Specialist Committee on Testing of Marine
Renewable Devices of the 27th ITTC
27th ITTC 2014
Date: 04/2014 Date: 09/2014
Table of contents
1. PURPOSE OF GUIDELINES .............. 2
2. DEFINITIONS, PARAMETERS &
METHODOLOGY ................................ 2
2.1 Device Development Stage ................ 3
2.2 Types of Devices ................................. 3
2.2.1 Horizontal Axis Turbines ............. 4
2.2.2 Cross-flow Turbines ..................... 5
2.2.3 Ducted Devices ............................. 5
2.2.4 Oscillatory Devices ...................... 5
2.3 Facilities .............................................. 6
2.4 Model Design and Scaling ................. 7
2.4.1 Scale Ratio .................................... 7
2.4.2 Similarity & Physics ..................... 7
2.5 Environmental Parameters ............... 8
2.5.1 Current Testing ............................. 9
2.5.2 Tidal Testing ................................. 9
2.5.3 Other environmental factors ......... 9
2.6 Test Case Parameters ........................ 9
2.6.1 Proof of Concept Testing ............. 9
2.6.2 Energy Capture Performance Tests
.................................................... 10
2.6.3 Survivability ............................... 10
2.6.4 Unsteady Inflow and Loading .... 11
2.6.5 Arrays and clusters ..................... 11
3. DESCRIPTION OF TEST
PROCEDURE ...................................... 11
3.1 Model Manufacture and Installation
........................................................... 11
3.2 Power Take-Off Modelling ............. 12
3.2.1 Electric power generation ........... 13
3.2.2 Resistance Loading .................... 13
3.2.3 Speed / Torque Control .............. 13
3.3 Unsteady Inflow and Loading ........ 14
3.3.1 Generation of Unsteady Velocity
.................................................... 14
3.3.2 Scaling ........................................ 14
3.3.3 Control Strategy for Unsteady
Tests ........................................... 15
3.4 Extrapolation to Full Scale ............. 15
3.5 Presentation of Results .................... 15
3.6 Uncertainty Analysis ....................... 16
4. REFERENCES .................................... 16

ITTC – Recommended
Guidelines
7.5-02
-07-03.9 Page 2 of 17
Model Tests for Current Turbines Effective Date
2014
Revision
00
Model Tests for Current Turbines
1. PURPOSE OF GUIDELINES
The purpose of this document is to offer
guidance to research organisations on designing
and performing model tests of current turbine
devices at small, intermediate, and field-scale in
a reproducible environment at a hydrodynamic
test facility suitable for testing such devices.
This guideline addresses testing of devices in-
tended to extract energy from both tidal currents,
which typically involve bi-directional flow, and
ocean currents, which typically involve uni-di-
rectional flow. Key issues addressed are:
Definition of the stages of a device test
program – Technology Readiness Level
(TRL) definition
Summary of testing requirements / chal-
lenges for device type (ocean v tidal cur-
rent, rotating v non-rotating, shallow v
deep deployment, rigid mounting v flexi-
ble mooring) and device development
stage;
Coupling between model scale, choice of
facility, device type, and experiment stage.
Identification of common error sources as-
sociated with small to field-scale testing
with guidelines on impact on test success,
interpretation of test results and how to
quantify and report measurement error.
2. DEFINITIONS, PARAMETERS &
METHODOLOGY
The goals of testing can range from concept
assessment to performance verification or de-
vice survival testing. The tests can be carried out
at distinct scales, in generic or specific flow en-
vironments, and with varying degrees of com-
plexity represented in the system. Potential en-
vironmental impact could be evaluated through
planned small-scale testing with adequate scale-
up prediction of performance or operation; for
example, full-scale device noise prediction, cav-
itation performance or scouring impact based on
small-scale evaluation. Particular types of ex-
periments are addressed separately: concept
testing, performance verification testing, and
survival testing. Since each of the goals of these
tests are distinct, e.g. power capture, unsteady
loading (including dynamic stall) or fatigue,
they require varying levels of similitude (envi-
ronment and geometric), accuracy, reproducibil-
ity, and instrumentation. In addition, specific
treatment of each major component of a device
can also be tested separately, or more devices
can be tested to simulate device-to-device inter-
actions in an array.
The major components of a test specification
are:
Mission definition – purpose/goals;
Definition of the types of tests needed to
satisfy test purpose /goals;
Test model design – similitude criteria,
model scale, construction and function;
Measurement requirements – data type,
acquisition requirements, temporal and
spatial resolution and accuracy;
Selection of the test facility; and
Data processing and documentation.

ITTC – Recommended
Guidelines
7.5-02
-07-03.9 Page 3 of 17
Current Turbine
Model Test Experiments
Effective Date
2014
Revision
00
2.1 Device Development Stage
The stages of development of current tur-
bines are commonly described in the marine re-
newable industry in terms of Technology Read-
iness Levels (TRLs). These provide a consistent
process enabling identification of a devices
stage of development and identification of suit-
able test procedures for evaluating device per-
formance at a defined stage of development.
This information can then be used to provide an
unbiased assessment of a device for invest-
ment/development purposes independent of de-
vice type or scale.
In the case of the renewable energy industry,
the following stages of Technology Readiness
Levels (TRLs) are commonly considered (e.g.
Mankins (1995)). TRL 1-3 correspond to re-
search stages up to and including proof of con-
cept, TRL 4-5 correspond to component, sub-
system and system validation in laboratories
and/or simulated operational environments and
TRL 6-9 correspond to prototype demonstration
in operational environment through to system
proving via successful deployment.
The main objectives of tests in concept val-
idation stages (TRL 1-3) are to validate the de-
vice concept, to validate preliminary numerical
models used to predict energy output, to inves-
tigate device variables and physical properties
that affect the performance or energy capture,
and to optimize the device for power production
using small scale models. The scale range in this
stage is typically between 1:25 and 1:50 consid-
ering, for example, devices having a character-
istic dimension at full scale of about 10-15 me-
ters.
The main objectives of tests in the validation
stage (TRL 4-5) are to validate the device design,
to validate advanced numerical models of the
device, to develop Power Take-Off (PTO) con-
trol strategies for improved power production,
and to verify the mooring and anchor system us-
ing medium scale models. If known, the envi-
ronmental conditions at a specific site should be
used. The scale range in this stage is normally
between 1:10 and 1:25, however smaller scale
models may be used to investigate survivability
in extreme waves.
Tests in the system validation stage (TRL 6-
7), and the prototype and demonstration stage
(TRL 8-9) are typically carried out at large or
full scale through field test sites at sea or in in-
land waters.
2.2 Types of Devices
Ocean / tidal current based renewable energy
devices convert the energy of the moving water
into electrical energy through a transformation
of the water momentum into a mechanical mo-
tion, typically rotational or oscillatory. The pri-
mary difference between ocean and tidal current
devices is the variation in directionality of the
moving water used in energy extraction - Ocean
applications involve a near unidirectional flow
of water while tidal applications involve bi-di-
rectional flow. In rivers both phenomena are
possible.
Flow directionality is an important consider-
ation in the design of a turbine device. Some
turbine devices are designed to operate with rea-
sonably symmetric loading and efficiency in
tidal applications involving flow reversal
whereas other designs require a unidirectional
flow and thus must be aligned with the flow. The
most common type of current turbine devices
employs a rotational conversion, similar to that
used in modern wind turbine systems, and en-
compasses a variety of design variants including
fixed and floating devices with single or multi-
ple turbines. For this type of device, a typical
classification is based on the direction of the ro-
tor axis with respect to the main direction of the
ITTC – Recommended
Guidelines
7.5-02
-07-03.9 Page 4 of 17
Current Turbine
Model Test Experiments
Effective Date
2014
Revision
00
flow. A different class of devices converts oscil-
latory motion into energy. Device technology is
evolving rapidly as developers gain experience
with large-scale field testing.
2.2.1 Horizontal Axis Turbines
Horizontal axis current turbine devices typi-
cally utilise multi-bladed turbine concepts simi-
lar in design to modern wind turbines. Horizon-
tal axis devices consist of one or more rotors
usually connected to a power-take-off (PTO)
pod in an axial drive configuration. The turbine
/ PTO assembly is mounted to a tower or wing
type structure in either an upstream (turbine up-
stream of tower) or downstream (turbine down-
stream of tower) configuration. These devices
can be rigidly mounted to the seabed floor, fixed
to a floating barge / platform, or can be free-
floating mid-water through a cable moored at-
tachment. The type of mount (upstream v
downstream configuration, and rigid v free-
floating mooring) can be an important factor to
consider in mid-scale model testing as these fac-
tors can impact device performance, device
loading and blockage corrections. Variations
currently under development include contra-ro-
tating turbines designed to minimise global axial
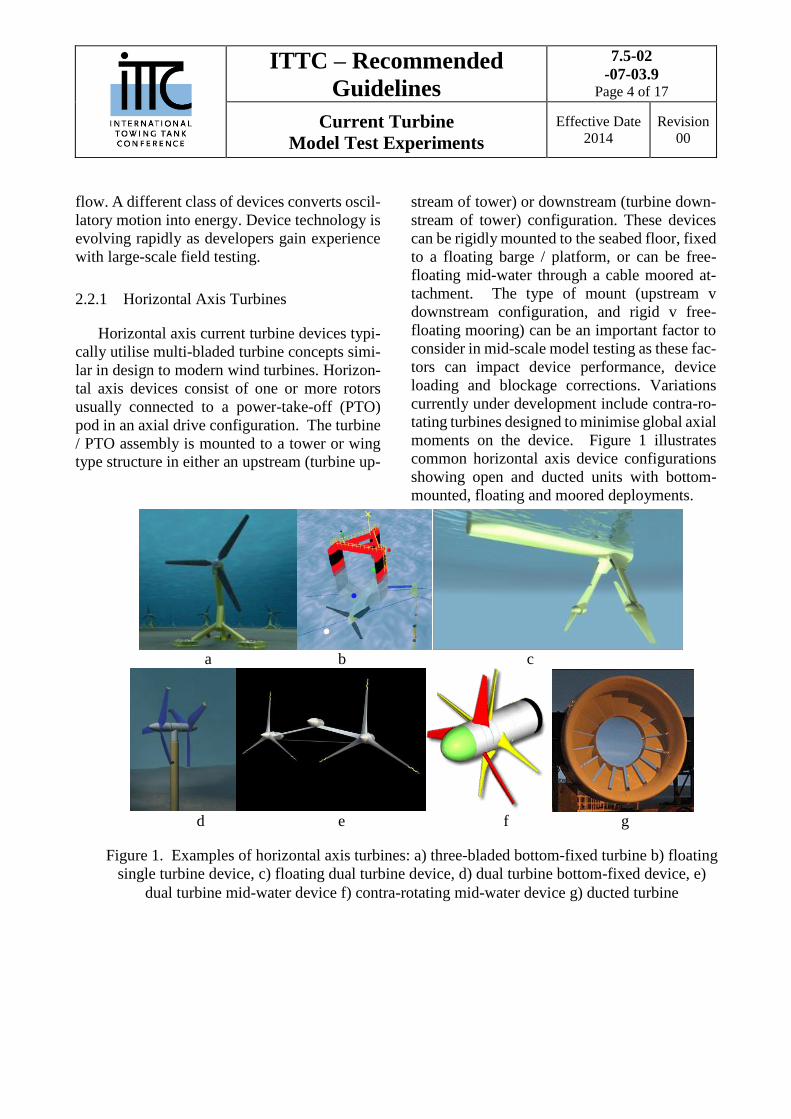
moments on the device. Figure 1 illustrates
common horizontal axis device configurations
showing open and ducted units with bottom-
mounted, floating and moored deployments.
a b c
d e f g
Figure 1. Examples of horizontal axis turbines: a) three-bladed bottom-fixed turbine b) floating
single turbine device, c) floating dual turbine device, d) dual turbine bottom-fixed device, e)
dual turbine mid-water device f) contra-rotating mid-water device g) ducted turbine
ITTC – Recommended
Guidelines
7.5-02
-07-03.9 Page 5 of 17
Model Tests for Current Turbines Effective Date
2014
Revision
00
2.2.2 Cross-flow Turbines
Cross-flow current turbines are character-
ized by an orientation chosen so that the flow
direction is perpendicular to the axis of rotation
of the device. They are often similar in design to
the Darrieus wind turbine concept, although
Savonius and Gorlov turbines are also utilized.
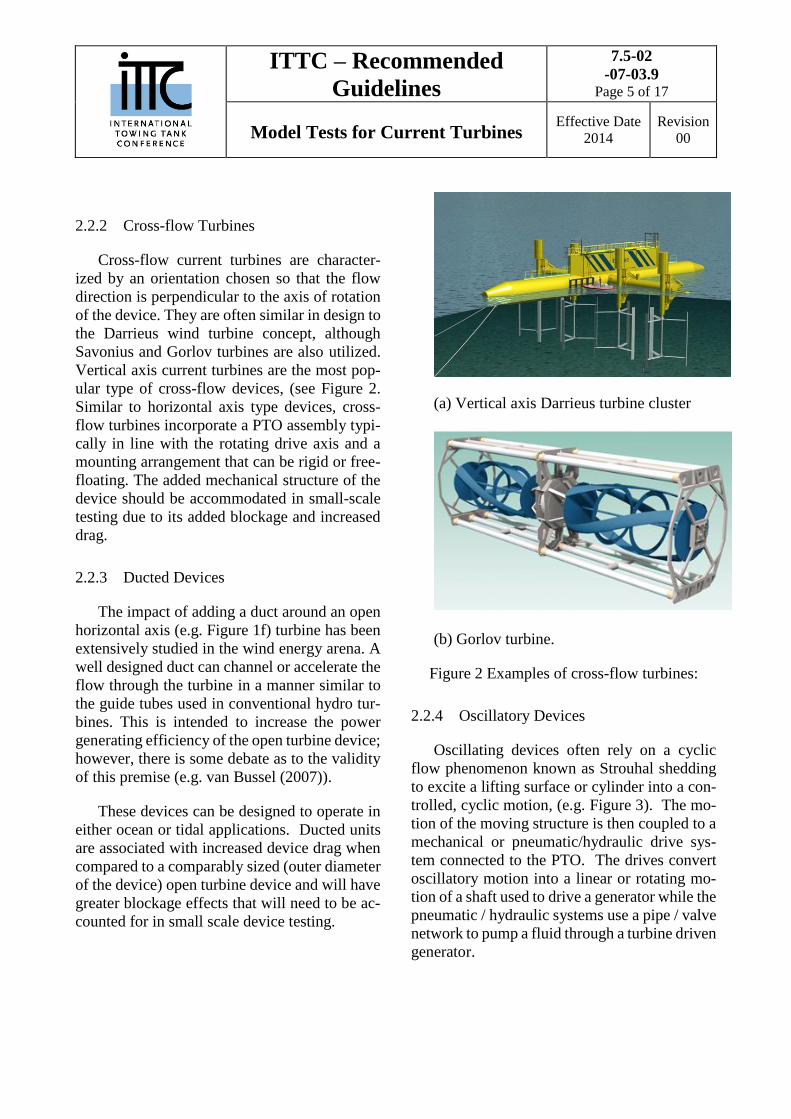
Vertical axis current turbines are the most pop-
ular type of cross-flow devices, (see Figure 2.
Similar to horizontal axis type devices, cross-
flow turbines incorporate a PTO assembly typi-
cally in line with the rotating drive axis and a
mounting arrangement that can be rigid or free-
floating. The added mechanical structure of the
device should be accommodated in small-scale
testing due to its added blockage and increased
drag.
2.2.3 Ducted Devices
The impact of adding a duct around an open
horizontal axis (e.g. Figure 1f) turbine has been
extensively studied in the wind energy arena. A
well designed duct can channel or accelerate the
flow through the turbine in a manner similar to
the guide tubes used in conventional hydro tur-
bines. This is intended to increase the power
generating efficiency of the open turbine device;
however, there is some debate as to the validity
of this premise (e.g. van Bussel (2007)).
These devices can be designed to operate in
either ocean or tidal applications. Ducted units
are associated with increased device drag when
compared to a comparably sized (outer diameter
of the device) open turbine device and will have
greater blockage effects that will need to be ac-
counted for in small scale device testing.
(a) Vertical axis Darrieus turbine cluster
(b) Gorlov turbine.
Figure 2 Examples of cross-flow turbines:
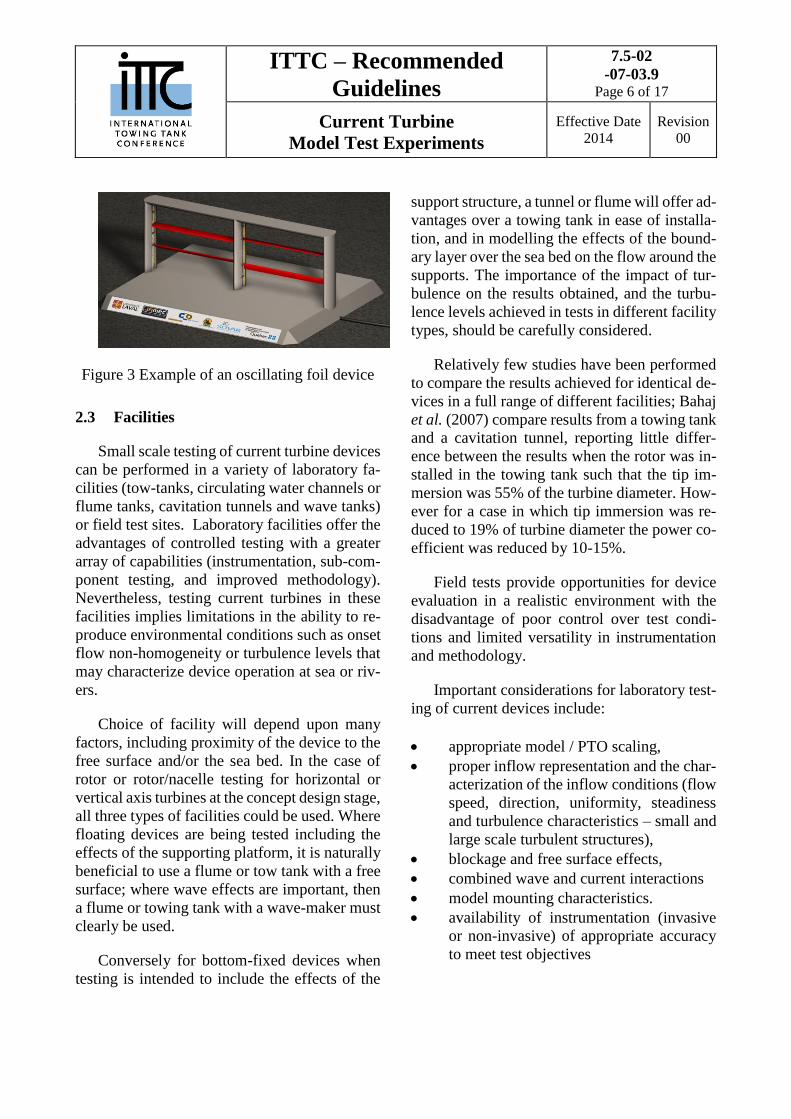
2.2.4 Oscillatory Devices
Oscillating devices often rely on a cyclic
flow phenomenon known as Strouhal shedding
to excite a lifting surface or cylinder into a con-
trolled, cyclic motion, (e.g. Figure 3). The mo-
tion of the moving structure is then coupled to a
mechanical or pneumatic/hydraulic drive sys-
tem connected to the PTO. The drives convert
oscillatory motion into a linear or rotating mo-
tion of a shaft used to drive a generator while the
pneumatic / hydraulic systems use a pipe / valve
network to pump a fluid through a turbine driven
generator.
ITTC – Recommended
Guidelines
7.5-02
-07-03.9 Page 6 of 17
Current Turbine
Model Test Experiments
Effective Date
2014
Revision
00
Figure 3 Example of an oscillating foil device
2.3 Facilities
Small scale testing of current turbine devices
can be performed in a variety of laboratory fa-
cilities (tow-tanks, circulating water channels or
flume tanks, cavitation tunnels and wave tanks)
or field test sites. Laboratory facilities offer the
advantages of controlled testing with a greater
array of capabilities (instrumentation, sub-com-
ponent testing, and improved methodology).
Nevertheless, testing current turbines in these
facilities implies limitations in the ability to re-
produce environmental conditions such as onset
flow non-homogeneity or turbulence levels that
may characterize device operation at sea or riv-
ers.
Choice of facility will depend upon many
factors, including proximity of the device to the
free surface and/or the sea bed. In the case of
rotor or rotor/nacelle testing for horizontal or
vertical axis turbines at the concept design stage,
all three types of facilities could be used. Where
floating devices are being tested including the
effects of the supporting platform, it is naturally
beneficial to use a flume or tow tank with a free
surface; where wave effects are important, then
a flume or towing tank with a wave-maker must
clearly be used.
Conversely for bottom-fixed devices when
testing is intended to include the effects of the
support structure, a tunnel or flume will offer ad-
vantages over a towing tank in ease of installa-
tion, and in modelling the effects of the bound-
ary layer over the sea bed on the flow around the
supports. The importance of the impact of tur-
bulence on the results obtained, and the turbu-
lence levels achieved in tests in different facility
types, should be carefully considered.
Relatively few studies have been performed
to compare the results achieved for identical de-
vices in a full range of different facilities; Bahaj
et al. (2007) compare results from a towing tank
and a cavitation tunnel, reporting little differ-
ence between the results when the rotor was in-
stalled in the towing tank such that the tip im-
mersion was 55% of the turbine diameter. How-
ever for a case in which tip immersion was re-
duced to 19% of turbine diameter the power co-
efficient was reduced by 10-15%.
Field tests provide opportunities for device
evaluation in a realistic environment with the
disadvantage of poor control over test condi-
tions and limited versatility in instrumentation
and methodology.
Important considerations for laboratory test-
ing of current devices include:
appropriate model / PTO scaling,
proper inflow representation and the char-
acterization of the inflow conditions (flow
speed, direction, uniformity, steadiness
and turbulence characteristics – small and
large scale turbulent structures),
blockage and free surface effects,
combined wave and current interactions
model mounting characteristics.
availability of instrumentation (invasive
or non-invasive) of appropriate accuracy
to meet test objectives

ITTC – Recommended
Guidelines
7.5-02
-07-03.9 Page 7 of 17
Current Turbine
Model Test Experiments
Effective Date
2014
Revision
00
2.4 Model Design and Scaling
2.4.1 Scale Ratio
The choice of scale ratio influences model
manufacture, instrumentation and equipment
and choice of facility.
Manufacturability The test model, including
model components and PTO must represent the
full-scale device to a level of geometric and
functional accuracy appropriate to the TRL of
the tests. For tests at TRL 1-3 it may be appro-
priate to model only the rotor of a turbine, whilst
higher TRL tests would also require an accurate
model of the nacelle and tower. Consideration
should be given to hydrodynamic performance,
including issues such as surface finish, bound-
ary layer transition, and model stiffness, to en-
sure that the hydrodynamic and hydro-elastic
behaviour is representative. For small-scale
models achieving adequate geometric accuracy
and stiffness can be challenging (see Muthanna
et. al. (2013)).
Instrumentation: The chosen model scale
must provide adequate space for the required in-
strumentation, and model dimensions must be
compatible with the capacity of maximum loads
of measuring devices (torque-meters, dyna-
mometers) and provide adequate space for other
equipment (slip-rings, motors etc.). Instrumen-
tation must have a level of accuracy to allow
model performance to be quantified appropriate
to the TRL of the test.
Blockage: The facility must be capable of
producing appropriately-scaled flow environ-
ment at the chosen scale. Particular attention
should be paid to blockage, tip immersion in
flume and towing tanks, and proximity to walls.
Where devices are tested in towing tanks, re-
flections can occur due to the interaction with
side walls and the bottom, while flow confine-
ment effects may lead to different behaviour of
the model with respect to equivalent operating
conditions in an unbounded environment. Well
established techniques exist to evaluate effects
of blockage for marine vehicles and structures,
and hence to correct the measured data. Correc-
tions are typically based on the ratio between the
cross section of the model and the cross section
of the basin. This ratio should be reduced as far
as possible in order to minimize blockage ef-
fects, and in the case of energy conversion de-
vices, to minimize the effect on device perfor-
mance.
Another consequence of the confined envi-
ronment is the increased need of a sufficient
time interval between successive tests to re-es-
tablish still water conditions. The problem may
be particularly important when tests are per-
formed in wave conditions.
Whelan et al. (2009a) present blockage and
free-surface corrections for horizontal axis de-
vices and propose an approach to correct results
in the presence of blockage in conjunction with
a free surface. Ross (2010) describes a study on
wind tunnel blockage corrections applied to ver-
tical axis devices. Special consideration should
be given if non-axial flow conditions, common
in current turbines, are to be considered (see Ba-
haj et.al. (2007)).
2.4.2 Similarity & Physics
The correct implementation of small scale
testing of a current turbine device beyond proof
of concept requires a fundamental understand-
ing of the underlying physics governing opera-
tion of the device and the appropriate similarity
principles used in model scaling. The choice of
governing similarity parameters can be depend-
ent on device type and location. Key similarity
parameters used in governing the operation and
scaling of devices should include:
ITTC – Recommended
Guidelines
7.5-02
-07-03.9 Page 8 of 17
Current Turbine
Model Test Experiments
Effective Date
2014
Revision
00
Reynolds number (Re): The performance of
foils used in current devices can be strongly de-
pendent on Re scaling. The testing of a hydro-
foil based device at too low a chord based Reyn-
olds number often results in reduced efficiency
of the device with lower measured power cap-
ture. It is recommended, that where possible,
higher TRL tests be performed at chord based
Reynolds number above a critical value of
500,000. This critical value can be dependent
on blade design and testing could be performed
at lower values. Where testing is carried out at
lower Reynolds number, it is desirable to
demonstrate asymptotic behaviour of results
with Reynolds number by varying Reynolds
number whilst holding tip speed ratio constant.
The drag of an oscillating cylinder in a cross
flow is controlled by the flow separation point
and downstream wake characteristics both gov-
erned by Reynolds scaling. While it is often not
possible to reproduce full-scale Reynolds num-
ber, care must be taken to ensure that the flow
regime is adequately represented.
Froude number (Fr): This should be con-
sidered when evaluating the performance of
shallow depth, floating, or mid-water turbine de-
vices in a wave-current environment
Strouhal number (St): The Strouhal number
is used to parameterize unsteady flows in which
periodical phenomena can be identified with a
representative frequency, such as oscillating
foil-type current energy device.
Cavitation number (): Cavitation inception,
breakdown and collapse on a surface may have
an impact on device performance, radiated noise
and surface damage. Appropriate small scale
testing should incorporate cavitation modeling
when full scale operation may be susceptible to
cavitation. The correct scaling of cavitating flow
phenomena at small scale requires tests to be
performed in depressurized conditions that can
be established in dedicated facilities.
Tip-Speed ratio (): The tip speed ratio is de-
fined as
R U
where is angular velocity, R is the turbine
radius and U is the flow velocity. Tip-speed ra-
tio is an important kinematic parameter in scal-
ing rotating turbo-machines such as pumps tur-
bines and propellers. The inverse of tip-speed
ratio is proportional to the corresponding kine-
matic parameter (advance ratio) used for screw
propellers. The scaled performance of rotating
turbo-machines is strongly dependent on match-
ing the full-scale tip-speed ratio while maintain-
ing appropriate Reynolds number magnitudes.
Other parameters: In unsteady flow, the
Current Number () and the reduced frequency
(k) are also important. These are discussed in
more detail in section 3.3.2.
2.5 Environmental Parameters
The nature of discrepancies between lab and
real-world environment depends on the facility
type whether flume tank, tow tank or water tun-
nel. Limitations with creating the particular en-
vironment should be specified. The key charac-
teristics to scale in a device test depend on the
purpose of the test. For example, performance
testing may require Reynolds number scaling,
whereas for studies of wake flow dynamics or
free-surface effects studies Froude scaling may
be important particularly in installations close to
the free surface.
It should be noted that accurate characteriza-
tion of the full-scale environment is often not
available, especially during concept design stud-
ies, when field sites will often not have been li-
censed. Even in cases where site measurements
ITTC – Recommended
Guidelines
7.5-02
-07-03.9 Page 9 of 17
Current Turbine
Model Test Experiments
Effective Date
2014
Revision
00
have been made, it is unlikely that data will exist
for all locations within an array. The local ba-
thymetry will inevitably affect the flow environ-
ment around individual devices in a manner
which may not be possible to model.
2.5.1 Current Testing
Mean flow and turbulence characteristics
should be quantified on both the inflow and out-
flow boundaries. The impact of device pitch and
yaw on device performance may have to be as-
sessed depending on deployment site flow char-
acteristics. Evaluation of surface wave impact
on performance and mooring may be necessary
depending on deployment site and depth. Bot-
tom mounted devices may require proximal
flow field mapping in the vicinity of the device
mount along the facility floor. Cavitation sus-
ceptibility testing may be necessary depending
on device design and deployment site depth con-
siderations.
2.5.2 Tidal Testing
Tidal device testing can involve similar en-
vironmental testing concerns as those defined
above for current testing. Reverse flow opera-
tion, typical in tidal applications, should be as-
sessed relative to performance and device load-
ing. In the case of tests aimed at analysing model
motions to align the whole device or parts of it
to reverting current direction, special attention
should be devoted to achieve a correct scaling of
all relevant similarity parameters including the
effects of transient motions.
2.5.3 Other environmental factors
Device noise evaluation may be necessary if
permitting agencies require full-scale noise pre-
dictions relative to marine animal impact. Local
and far-field bed floor erosion tests can be per-
formed in specialized facilities and may be nec-
essary in river and some tidal deployment envi-
ronments. The impact of device energy extrac-
tion on the local macroscopic environmental
flow characteristics may have to be modelled to
properly assess environmental impact such as
reduced tidal penetration into a bay or redirected
river flow characteristics.
2.6 Test Case Parameters
2.6.1 Proof of Concept Testing
Test programs aimed at devices in the TRL
1-3 stage of development may encompass small-
scale experiments or analyses focused on under-
standing an operational concept. These activities
can often be accomplished in small-scale labor-
atory environments at reasonable cost and time.
Accurate characterization of power capture and
other detailed, quantitative results may not be a
focus at this program stage and qualitative oper-
ational characteristics may be the desired out-
come to provide confirmation of the feasibility
of a concept idea.
Concept design testing requires the least
level of accuracy in both the representation of
the environment and of the model itself; it may
be used to verify overall or relative trends seen
in numerical modelling, but it is generally not
intended to verify the accuracy of numerical
modelling efforts. Concept testing will often be
used to evaluate multiple distinct designs based
on key metrics (i.e. relative stability, relative
power performance, etc.). A deployment envi-
ronment does not have to be identified to run
these tests as generic environments will suffice.
Moreover, scaled models designed for concept
testing may represent only key components of
the whole device, e.g. a simplified mock-up of
the rotor without components like platforms,
mooring devices, etc.

ITTC – Recommended
Guidelines
7.5-02
-07-03.9 Page 10 of 17
Current Turbine
Model Test Experiments
Effective Date
2014
Revision
00
Proof of concept testing often involves small
scale (less than 1:25) model testing aimed at ex-
ploring whether a device design responds to a
hydrokinetic load in a fashion broadly expected
- for example, whether a new rotor design ro-
tates under hydrodynamic loading with a shaft
resistance applied to simulate a power take-off.
These tests should be conducted using good ex-
perimental practices. All relevant test parame-
ters should be characterized, such as model ge-
ometry and scale, flow characteristics, model
performance (shaft rpm, foil oscillating fre-
quency or shaft torque for example). Measure-
ment uncertainties should be estimated follow-
ing ITTC guidelines (see section 3.6)
2.6.2 Energy Capture Performance Tests
Energy capture performance tests for hori-
zontal axis turbines are similar to open water
marine propeller tests except that power is ex-
tracted instead of added to the flow. Determina-
tion of device performance over a range of test
conditions is the main focus. The general ap-
proach set out in the ITTC Recommended Pro-
cedure 7.5-03-02.1 Propulsor Open Water Test
should be followed. Model scale can vary from
small to near full scale depending on the device
design.
Inflow characteristics, such as flow speed
and direction, turbulence levels, turbulence
structure (small scale vs large scale), spatial uni-
formity (mean flow spatial gradients) and flow
unsteadiness must be properly modelled and
quantified. If an additional goal of the test is the
validation of numerical codes for performance
prediction, measurement of outflow characteris-
tics may also be required. The model geometry
must be accurately represented; power take-off
modelling must represent the design tool mod-
elling of power take-off function and must pro-
vide adequate loading and accurate representa-
tion of scaled performance as this can strongly
impact overall device function (see section 3.2).
All key model performance parameters must be
measured, such as model motion (rotational
speed or flapping frequency and amplitude),
shaft torque, component vibration and defor-
mation under load, and model loading (drag, lift
or moments).
Data normalization and presentation should
follow the general principles of ITTC Recom-
mended Procedure 7.5-03-02.1 Propulsor Open
Water Test. However some exceptions will re-
sult from differences in conventional practice
between turbine and propeller testing. Results
for turbines are typically presented in terms of
power coefficient PC and thrust coefficient TC
plotted against tip-speed ratio :
3
2
1
2
1
2
P
T
PC
U A
TC
U A
where P is the power, T is the thrust, U is the
flow velocity and A is the swept area of the tur-
bine. For ducted turbines, the swept area is typ-
ically defined as the area of the duct.
The impact of non-axial flow on both energy
capture performance and device loading will be
significant for some devices in some locations
and in these cases the test plan should reflect this.
Bahaj et al. (2007) report a 30% reduction in
power coefficient for a yaw angle of 30 degrees.
2.6.3 Survivability
Survival testing is an extremely important
test when designing a product for the ocean. Ex-
treme conditions produce very large motions
and forces and there are limited numerical codes
capable of accurately estimating a device re-
sponse to the extreme conditions. Hence, the
ITTC – Recommended
Guidelines
7.5-02
-07-03.9 Page 11 of 17
Current Turbine
Model Test Experiments
Effective Date
2014
Revision
00
most viable way of obtaining loads (mooring
and structural), measuring motions, and verify-
ing designs in extreme conditions is through
testing. Typical topics of interest are:
Fatigue
Life cycle
Unsteady loads
Extreme Event – over-load testing
Tow out and Installation
Testing in extreme conditions can challenge
the capabilities of facilities. It is important to ob-
tain statistically relevant data that can be used to
ensure a design will in fact escape a catastrophic
failure (see ITTC Recommended Procedure 7.5-
02-07-02.3 Experiments on Rarely Occurring
Events). Where there are particular structural
loads of concern, then the model should be con-
structed to allow accurate measurement of these
loads in both the turbine and support structure.
Where off-axis flows are relevant, transverse as
well as longitudinal loads should be measured.
Tests should cover cases in which the device is
shut-down in addition to operational tests.
For floating structures, accurate scaling of
the mooring system can become extremely im-
portant. Often the mooring system is nonlinear
in its response to the large motions expected to
be seen; this nonlinearity needs to be captured in
the design. ITTC Recommended Procedure 7.5-
02-07-03.1 Floating Offshore Platform Experi-
ments and where appropriate 7.5-02-07-03.4
Hybrid Mooring Systems should be followed.
2.6.4 Unsteady Inflow and Loading
Current devices in realistic environments
may undergo unsteady inflow conditions for a
variety of reasons. These include the effect of
turbulence in the current (in some cases exacer-
bated by upstream bathymetry), the impact of
waves, and for floating and/or mid-water de-
vices, the impact of device motions. In many
cases, the main impact of unsteady inflow is re-
lated to the increase in the blade loading rather
than the reduction in power capture (Milne et.al.
(2013)). Several issues of experiment design for
tests in unsteady condition may require different
practices from those adopted in steady condi-
tions. These are discussed further in section 3.3.
2.6.5 Arrays and clusters
A distinction may be drawn between an ar-
ray and a cluster: a “cluster” consists of several
units of the same device mounted/appended to a
single framework, e.g., a floating platform for a
vertical axis devices such as shown in Figure 2
(a), whilst an “array” consists of many identical
devices deployed in confined areas where fluid-
dynamic device/device interactions are expected.
For an array with many devices installed, the
interaction of the devices can be determined
through tests involving a limited number of sys-
tems. Typically, the number of devices to be
used in a small scale array test would be depend-
ent on the device type and the intended array ge-
ometry at full-scale deployment. The important
parameters and characteristics of an array test
are impact of upstream devices on downstream
performance and loading both steady and un-
steady. Due to the cost and scale constraints, the
behaviour of arrays involving a large number of
devices may be evaluated by numerical model-
ling.
3. DESCRIPTION OF TEST PROCE-
DURE
3.1 Model Manufacture and Installation
Model manufacture should be performed
such that the scaled model function or scaled
component static and dynamic response is not
ITTC – Recommended
Guidelines
7.5-02
-07-03.9 Page 12 of 17
Current Turbine
Model Test Experiments
Effective Date
2014
Revision
00
compromised or different from that expected at
full-scale operation. Materials should be se-
lected to ensure that the scaled sub-component
deflection, deformation or response is scaled to
or less than anticipated in the full-scale system.
The scaled blade deformation under load should
be comparable to or less than that anticipated at
full scale operation.
The installation of small-scale testing of
moored devices or free-floating devices should
be clearly documented as installation could im-
pact device performance or loading. In general,
the model should be designed and manufactured
to geometric scaling principals when possible.
Model preparation and installation should fol-
low ITTC Recommended Procedures 7.5-01-
02-02 Propeller Model Accuracy and 7.5-03-
02.1 Propulsor Open Water Test).
The model should be carefully aligned with
the flow direction and moving components
properly aligned with one another to reduce fric-
tion, undesired loading or vibration due to mis-
alignment. Bearings and seals should be
properly sized and selected to reduce overall
friction in the PTO model. Run-in or burn-in
tests should be conducted at the beginning of
any test program to allow bearings and seals the
opportunity to align and seat ensuring minimal
resistance to operation. Model function and in-
strumentation should be pre- and post-calibrated
following ITTC Recommended Procedures 7.6-
01-01 Control of Inspection, Measuring and
Test Equipment for general guidance, 7.6-02-09
Calibration of Load Cells for sample guidance
on load cells, 7.5-02-03-01.1 Propulsion/Bol-
lard Pull Test and 7.5-02-03-02.1 Open Water
Test for installation and calibration for propul-
sion and propeller open water tests.
Full scale deployment site characterization is
a critical component to model testing. Model
installation in the test facility should consider
the appropriate modelling of the flow kinemat-
ics on small scale model performance. Flow
field characterization and modelling should con-
sider: turbulence generation, steady vs. unsteady
flow and wave characteristics. Small scale
model installation must properly scale mooring
characteristics in floating devices and depth
from the surface characteristics as wave motion
can influence device performance through in-
duced device motion, structural loading and al-
teration of inflow kinematics. Measurement in-
strumentation should be carefully selected to
provide adequate frequency response, spatial
resolution and accuracy. Data acquisition sys-
tems should be specified to meet minimum sam-
pling frequency and filtering requirements with
adequate sampling resolution.
3.2 Power Take-Off Modelling
Ocean/tidal based renewable energy devices
are typically designed to operate over a specific
range of conditions, rpm or oscillation fre-
quency, for optimal power generation. The op-
timal conditions are usually maintained by load-
ing the device to hold rpm or oscillation to a de-
sired range through the Power Take-Off (PTO)
system, comprised of drive train, power genera-
tion and power electronics. Model-scale device
testing must include some form of PTO model-
ling. In tests of model current devices, the PTO
can be represented by direct electrical power
generation, by mechanical / hydraulic / pneu-
matic loading or by using a speed or torque con-
trol drive. In all cases, friction associated with
bearings and seals must be carefully assessed in
order to minimize the impact on the measured
power.
Model test set-ups developed for mid-level
TRL stages should include the possibility to test
both rotor operation at prescribed rotational
speed and/or torque and in free-running condi-
tions. The latter condition is in principle better
ITTC – Recommended
Guidelines
7.5-02
-07-03.9 Page 13 of 17
Current Turbine
Model Test Experiments
Effective Date
2014
Revision
00
descriptive of full scale device operation but re-
quires adequate model scaling and a careful de-
sign of the PTO system. Free-running tests in
unsteady conditions are particularly challenging,
since system dynamics must be modelled cor-
rectly.
3.2.1 Electric power generation
Either permanent magnet or inductance gen-
erators can be used in small scale model testing
using direct-drive or gear-box coupling. Full-
scale devices often have the power generator in-
stalled in the device nacelle. Space limitations in
small-scale model testing may require a revised
configuration where the generator is installed in
a downstream dynamometer or outside the facil-
ity. These adaptations, used to accommodate
space limitations, often involve additional com-
ponents like seals, bearings and gearbox config-
urations.
Experimental conditions based on this oper-
ating protocol are often referred to as “free-run-
ning” tests. These tests may be useful in princi-
ple to analyse specific operating conditions but
this requires careful design of the PTO sys-
tem. Key properties include system efficiency,
resistance to movement which can impact turn
on/off characteristics of the device and system
tares. For small-scale tests, model dynamics
and drive-train friction losses cannot normally
be scaled appropriately; thus small-scale free-
running tests can often give only a limited in-
sight into full-scale device performance.
Where a PTO for a horizontal or vertical axis
device is represented via direct power genera-
tion, the characterization of power require meas-
urement of the flow velocity, measured using
the approach normally adopted for the facility,
the rotational velocity of the rotor, typically
measured with a tachometer or encoder and the
electrical power generated. In this case the tip-
speed ratio is controlled only indirectly via the
flow velocity and the electrical load.
3.2.2 Resistance Loading
Resistance loading is usually accomplished
with a drag type device attached to the PTO
drive shaft. This can be mechanical, hydraulic
or magnetic in design. This type of system is
designed to control the rotation or oscillation
rate of the device and does not directly simulate
a power generation system. Typically, the power
generated by the device is converted into heat
within the PTO model or motion of a fluid
within a hydraulic / pneumatic system.
At very early TRL stages it is possible to cal-
ibrate the resistance loading against rotational
speed prior to the tests so that the only measure-
ments required during tests are flow velocity
and rotational speed. Particular attention should
be paid to repeatability of calibration in the con-
text of variations in temperature, humidity etc.;
guaranteeing repeatable behaviour of friction
devices in particular may be challenging. It
should also be noted that this approach will not
work for devices which require active interven-
tion for starting. It is preferable to measure shaft
torque so that power can be derived directly
from the product of torque and speed. This can
be accomplished using a fixed or rotating torque
transducer; use of a rotating device will usually
require a slip ring to transfer wiring from rotor
to stator.
3.2.3 Speed / Torque Control
As an alternative to the approaches de-
scribed above, a speed-controlled motor may be
used to drive the rotor at a prescribed rpm. In
this case the power is typically derived from de-
rived from measurements of shaft torque and ro-
tational speed. In this approach the tip-speed ra-
tio for the test is controlled directly through the
combination of specified rotational speed of the

ITTC – Recommended
Guidelines
7.5-02
-07-03.9 Page 14 of 17
Current Turbine
Model Test Experiments
Effective Date
2014
Revision
00
motor and the onset flow velocity. It is im-
portant to ensure that the motor and controller
have adequate torque to maintain steady speed
throughout the range of tip-speed ratios of inter-
est. As an alternative to controlling speed, a sim-
ilar approach may be utilized to control the
torque.
Similar control methodologies can be estab-
lished for oscillating devices where oscillation
frequency rather than rotation is controlled.
3.3 Unsteady Inflow and Loading
If device performance in unsteady flow is to
be assessed then several issues should be con-
sidered over and above those of importance in
steady tests.
3.3.1 Generation of Unsteady Velocity
The procedure used to generate the unstead-
iness in the inflow will depend upon the type of
unsteadiness expected, the level of characterisa-
tion available for the unsteady flow in the pro-
posed installation site, and the type of facility
being used. If the unsteadiness of interest largely
consists of relatively small-scale turbulent struc-
tures, then it may be possible to introduce turbu-
lence in a flume by introducing a grid or other
structure upstream of the device; similarly in a
towing tank test a grid may be attached to the
carriage forward of the device. This type of ap-
proach requires careful characterisation of the
turbulence introduced at model scale. To this
purpose, advanced velocimetry techniques such
as Laser-Doppler Velocimetry (LDV) should be
used, following guidelines given in the ITTC
Recommended Procedure 7.5-02-03-02.3 Nom-
inal Wake Measurements by LDV Model Scale
Experiments.
If the unsteadiness of interest is related to
wave motion, then the device may be tested in
waves in a wave-current tank (e.g. Gaurier et al.,
2013) or towed in waves (e.g. Barltrop et al.,
2006). Testing directly in waves naturally can
provide the correct distribution of unsteady ve-
locity over the rotor plane; however this ap-
proach presents particular challenges with scal-
ing. A further option is to introduce an unsteady
velocity by oscillating the device in the presence
of a mean flow, either using an oscillatory car-
riage in a flume tank (e.g. Whelan et.al. (2009b))
or by using an oscillatory sub-carriage mounted
on a towing carriage in a towing tank (e.g. Milne
et.al. (2011)). This approach results in an ideal-
ised unsteady flow which is uniform over the ro-
tor plane, but which may allow investigation of
the unsteady phenomena using a frequency-do-
main approach.
3.3.2 Scaling
The presence of unsteadiness, particularly
related to wave and/or device motion naturally
requires an approach based on Froude scaling.
The magnitude of the unsteadiness may be char-
acterised by the Current Number which can be
defined as:
u u
where u is the amplitude of the unsteady veloc-
ity and u is the mean velocity. Similarly the
frequency of the unsteadiness can be character-
ised by the reduced frequency (k) which can be
defined in this context as
k fc r
where f is the frequency, c is the local chord,
is the rotational speed and r is the radial location.
Milne et al. (2014) report tests at Current Num-
bers up to 0.25 and reduced frequencies at 75%
of the turbine radius up to 0.05, which are stated
to correspond approximately to 100% and 50%
respectively of values calculated from full-scale
site measurements.
ITTC – Recommended
Guidelines
7.5-02
-07-03.9 Page 15 of 17
Current Turbine
Model Test Experiments
Effective Date
2014
Revision
00
Achievement of full-scale Current number
combined with limitations on the achievable
magnitude of the unsteady velocity may lead to
reduced mean velocity, which can then result in
relatively low Reynolds number. This in turn
may lead to questions regarding the reliability of
the data acquired in unsteady flow. Particular
challenges may be faced where tests are con-
ducted in waves, since the requirement to
achieve the same scale on the rotor and the
waves in order to generate a realistic unsteady
velocity profile may lead to unrealistically low
Reynolds numbers.
3.3.3 Control Strategy for Unsteady Tests
In unsteady flow careful consideration
should be given to the turbine control strategy.
If the desire is to model accurately the behaviour
of the full scale system including the generator,
then the dynamic response of the generator to
the unsteady loads should be modelled correctly.
Conversely, if the intention of the tests is to
characterise the hydrodynamics of the rotor in
unsteady conditions then the more idealised so-
lution of using a speed-controlled motor may be
preferable to remove the effects related to angu-
lar acceleration and deceleration of the rotor.
This approach may offer a further advantage in
towing tank tests since the rotor may be acceler-
ated to the desired angular velocity prior to the
towing carriage starting, thus eliminating the
impact of transients related to rotor acceleration
on the time available for measurement.
3.4 Extrapolation to Full Scale
All results of model tests are presented as
prototype values. Model values are scaled to full
scale by applying the proper similitude laws.
Appropriate ITTC procedures as discussed in
sections 2.6 and 3.1 should be referred to for di-
mensional analysis relative to specific device
tests, which will vary with both device type and
test type. Key examples will include ITTC Rec-
ommended Procedure 7.5-02-03-02.1 Propulsor
Open Water Test, as well as 7.5-02-07-03.1
Floating Offshore Platform Experiments for
floating devices in waves.
As discussed earlier, there are many im-
portant factors in energy conversion tests that
are not addressed by standard scaling proce-
dures. Special considerations are needed to ad-
dress their effects. Computational Fluid Dynam-
ics models can be used to predict device perfor-
mance at full scale and to provide guidance
about extrapolation methods.
3.5 Presentation of Results
The following provides a recommended out-
line of a generic test procedure and report. An
actual test procedure may consist of a sub-set of
these elements, and may vary dependent on the
test purpose and device type.
a) Purpose of the Test
b) Facility Characterization
i) No-model baseline performance
ii) Facility dimensions and model size
capacity
iii) Operating ranges and test capabilities
c) Model & Installation i) Model Scale
ii) Model Complexity – simplified, system,
component.
iii) Model function/operation
iv) Model installation: Mooring, Foundation
and constraints
v) Model Measurements / calibration
d) Measurement Systems
i) Purpose of the measurements and re-
quired performance/accuracy.
ii) Instrumentation Type: Invasive vs
non-invasive; Imbedded vs free-field;
ITTC – Recommended
Guidelines
7.5-02
-07-03.9 Page 16 of 17
Current Turbine
Model Test Experiments
Effective Date
2014
Revision
00
Steady vs dynamic; Operational char-
acteristics and requirements
iii) Resolution – Spatial and temporal
iv) Calibration requirements
e) Types of Measurements
i) Model motion and deformation
ii) Flow field measurements
iii) PTO measurements
iv) Environmental measurements
f) Test Matrix
i) Test parameters and conditions –
Scaling parameters, operating condi-
tions
ii) Measurements Locations
iii) Recommended practices
iv) Design and off-design testing (includ-
ing specification of what is regarded
as off-design testing – e.g. is yaw re-
garded as off-design).
v) Steady v unsteady performance (un-
steady inflow – variable direction or
speed, plus non-uniform inflow).
vi) Self-starting / Shutdown conditions.
vii) Testing in waves for floating devices.
Wave field generated and how.
Model alignment to wave field.
viii) Component & Sub-component test-
ing: Component and system loading;
Sub-component function
ix) Test repeatability & required number
of repeat conditions for desired accu-
racy.
x) Installation & Recovery tests.
g) Data Acquisition
i) System performance – rates, resolu-
tion, number of channels, sequential
or simultaneous sampling, noise lev-
els/floors
h) Data Analysis
i) Data calibrations and corrections:
bias errors, blockage corrections, Ze-
roes or Tares.
ii) Normalizations – use of proper veloc-
ity, length and time scales. Use of
standardized parameters and relations
accepted by the appropriate testing
community.
iii) Statistical Analyses; Steady vs dy-
namic studies
iv) Uncertainty analyses
3.6 Uncertainty Analysis
Uncertainty analysis should be performed
following the approach presented in the ITTC
guidelines 7.5-02-02-02 Uncertainty Analysis,
Guidelines for Resistance Towing Tank Tests
and 7.5-02-03-02.2 Uncertainty Analysis Exam-
ple for Open Water Test, 7.5-01-03-01Uncer-
tainty Analysis, Instrument Calibration, and,
where relevant , 7.5-01-03-02 Uncertainty Anal-
ysis, Laser Doppler Velocimetry Calibration
and 7.5-01-03-03 Uncertainty Analysis Particle
Image Velocimetry.
4. REFERENCES
Bahaj, A.S., Batten, W. M.J. & McCann G.,
2007, “Experimental verifications of numer-
ical predictions for the hydrodynamic per-
formance of horizontal axis marine current
turbines” Renewable Energy, Vol. 32, pp.
2479-2490.
Barltrop, N., Varyani, K.S., Grant, A., Clelland,
D., & Xuan, P., 2006, “Wave-current inter-
actions in marine current turbines”, Proceed-
ings, Inst. Mech. Eng. Part M: J. Eng. Mar-
itime Environment Vol. 220, pp. 195–203.
van Bussel, G. J. W., 2007. ”The Science of
Making More Torque From Wind: Diffuser
ITTC – Recommended
Guidelines
7.5-02
-07-03.9 Page 17 of 17
Current Turbine
Model Test Experiments
Effective Date
2014
Revision
00
Experiments and Theory Revisited”, J. Phys.,
Conf. Ser. Vol. 75, 012010
Gaurier B., Davies P., Deuff A., & Germain G.,
2013, “Flume tank characterization of ma-
rine current turbine blade behaviour under
current and wave loading”, Renewable En-
ergy, Vol. 59, pp. 1-12.
Mankins, J.C., 1995, “Technology Readiness
Levels: A White Paper”, NASA Office of
Space Access and Technology.
Milne, I. A., Day, A. H. Sharma, R. N. Flay,
R.G.J. & Bickerton S., 2011, “Tidal Turbine
Blade Load Experiments for Oscillatory Mo-
tion”, Proceedings, 9th European Wave and
Tidal Energy Conference (EWTEC 2011),
Southampton England.
Milne, I. A. Day, A. H. Sharma, R. N. & Flay,
R. G. J., 2013, “Blade Loads on Tidal Tur-
bines in Planar Oscillatory Flow” Ocean En-
gineering, Vol. 60, pp. 163–174.
Milne, I. A. Day, A. H. Sharma, R. N. & Flay,
R. G. J., 2014, “Blade Loading on Tidal Tur-
bines for Uniform Unsteady Flow” Renewa-
ble Energy
Muthanna, C. Visscher, J. H., and Egeberg, T.
F., 2013, “An Experimental Investigation of
Scale Effects on Offshore Wind Turbine
Blades”, Proceedings, 32nd Int. Conf. on
Ocean, Offshore and Arctic Engineering
(OMAE 2013), June 9-14, Nantes, France
Ross, I.J., “Wind tunnel blockage corrections:
an application to vertical axis wind turbines”,
2010, MS Thesis, Aerospace Engineering,
Univ. of Dayton, Dayton, Ohio, US.
Whelan, J.I. Graham, J.M.R. & Peiro J., 2009a,
“A free-surface and blockage correction for
tidal turbines”, J. Fluid Mech., Vol 624,
pp 281-291
Whelan, J.I. Graham, J.M.R. & Peiro J., 2009b,
“Inertia Effects on Horizontal Axis Tidal-
Stream Turbines” Proceedings, 8th Euro-
pean Wave and Tidal Energy Conference
(EWTEC 2009), Uppsala, Sweden